Abstract
Rapid global urbanization and its progress have profoundly affected urban vegetation. The ecological quality of urban vegetation is a vital indicator of regional ecological stability and health. A comprehensive assessment of the coupling coordination and coercive relationship between urbanization and the vegetation ecological quality is essential for promoting sustainable regional green development. Using the rapidly urbanizing Guangdong–Hong Kong–Macao Greater Bay Area (GBA) urban agglomeration in China as an example, this study evaluates the vegetation quality condition and the level of urbanization and explores the dynamic relationship between vegetation ecological quality and urbanization processes. This study introduces the vegetation ecological quality index (VEQI) based on net primary productivity (NPP) and fractional vegetation cover (FVC), as well as the comprehensive urbanization index (CUI) derived from gross domestic production (GDP), population density, and nighttime lighting data. The coupling coordination and Tapio decoupling models are employed to assess the degree of coupling coordination and the decoupling relationship between the VEQI and CUI across different periods. The results showed that (1) from 2000 to 2020, the VEQI in the GBA showed a significant increase, accompanied by continuous urbanization, particularly evident with the high CUI values in central areas; (2) the coupling coordination degree (CCD) exhibits high values and significant change slopes in the central GBA, indicating dynamic interactions between urbanization and vegetation ecological quality; (3) the decoupling states between the VEQI and CUI are dominated by weak decoupling (WD), strong decoupling (SD), expansive negative decoupling (END), and expansive coupling (EC), suggesting improvements in the relationship between urbanization and vegetation ecological quality; (4) the coordinated development level of the VEQI and CUI in the study area shows improvement, and their decoupling relationship displays a positive trend. Nevertheless, it remains crucial to address the impact of urbanization pressure on vegetation ecological quality and to implement proactive measures in response. The results of this study provide theoretical support for mesoscale development planning, monitoring vegetation ecological conditions, and formulating environmental policies.
1. Introduction
Urbanization is a pivotal social and economic force shaping the world today [1]. It impacts the environment within cities and extends to the surrounding and distant regions. Over the past decades, rapid urbanization has raised many challenges, often called “urban diseases”, such as the urban heat island effect, land cover change, urban air pollution, biodiversity loss, and ecosystem degradation, which pose enormous threats to the sustainability and environmental health of cities [2,3,4]. Specifically, urbanization on a global scale drives changes in land cover, leading to widespread loss of vegetation cover and changes in vegetation greenness. Urban infrastructure, transportation networks, and industrial zones have replaced natural vegetation extensively, destroying or reducing original natural habitats and triggering numerous environmental challenges [5,6]. This has caused a considerable decline in vegetation coverage and reduced carbon sequestration capacity [7,8,9], directly impacting regional ecosystems’ stability, integrity, and biodiversity [10,11].
Vegetation is an indispensable component of the terrestrial ecosystem and plays a crucial role through its ecological processes, intricate structure, and biodiversity [12]. It protects soil, hydrological cycles, and the environment, and contributes to maintaining the terrestrial carbon balance and regulating the climate [12,13]. Vegetation quality is the foundation for maintaining terrestrial ecosystems’ stability [2] and a significant indicator for evaluating ecosystem balance and quality [14]. Therefore, it is crucial to monitor the status of and changes in vegetation quality when assessing the effects of urbanization on environmental quality [15,16]. With the rapid development and widespread application of remote sensing technology, techniques for studying vegetation characteristics have become more sophisticated. Remote sensing is commonly applied to monitor vegetation quality using single- or multi-index methods. For example, Wang et al. [17] indirectly assessed grassland ecological systems using vegetation indices. Wu et al. [18] and Li et al. [19] employed multi-index methods with MODIS data to analyze vegetation quality in Tibet and China, respectively. However, using remote sensing data with single-index models or constructing multi-indicator models for vegetation ecological quality assessment can be limited by the regional terrain, temporal factors, and scale differences, posing challenges for precise evaluation. This makes it necessary to explore more applicable models for constructing vegetation quality indices. Qian et al. [14,20] developed a comprehensive ecological quality index based on fractional vegetation cover (FVC) and net primary productivity (NPP), intending to quantitatively reflect vegetation productivity and coverage capacities per unit area. NPP is a crucial indicator for assessing vegetation growth states and plays a pivotal role in measuring both the functional and service values of terrestrial ecosystems and the capacity for carbon sequestration. The FVC, which represents the proportion of soil area covered by the vertical projection of vegetation canopy per unit area, is a critical indicator for assessing aboveground vegetation coverage and growth status [17,21]. The vegetation ecological quality assessment model developed by Qian et al. [20] integrates NPP and vegetation cover, effectively addressing discrepancies in vegetation quality monitoring results caused by reliance on single remote sensing indicators such as the NDVI and EVI. This model is applicable for nationwide vegetation ecological quality monitoring and evaluation [22,23,24].
Studies have shown that the spatiotemporal variability of vegetation dynamics is highly influenced by the complex interactions among vegetation, climatic variables, and human activities, particularly urbanization, which are the primary drivers of changes in NPP and FVC [2,25,26]. However, the impacts of rapid change in urban environments on vegetation are complex, encompassing positive and negative effects [2,27]. On the one hand, expanding residential and industrial areas during urbanization causes reduced vegetation cover and quality [9,28]. In contrast, increased atmospheric nitrogen deposition, fertilization practices, irrigation efforts, and policies to conserve green spaces during the urbanization process can positively affect vegetation [3,26]. Given these conflicting effects, extensive research has been conducted on the effects of urbanization on the ecological environment. For example, the environmental Kuznets curve hypothesis has been widely applied to investigate the correlation between economic growth and the ecological environment [29]. Most research on the relationship between urbanization and the environment now focuses on the equilibrium and impacts of urbanization on natural resources. Such studies frequently analyze the mechanisms of action [30,31] and dynamic evolutionary patterns [32]. They also consider perspectives such as conflicting interests [33] and human security [34] to explore the interconnected relationship between urbanization and the environment at different scales. The most employed methodologies include the coupling coordination degree model [35], the decoupling model [36], and the vector autoregression model [37]. The coupling coordination model can comprehensively evaluate the mutual influences and interactions among multiple systems or elements. Decoupling analysis models characterize the synchronous and inverse relationships in the temporal variations of two geographical factors, defining the coordinated change states between two independent factors [38]. These two models are widely applied to explore the relationship between urbanization and the ecological environment [39,40].
The Guangdong–Hong Kong–Macao Greater Bay Area (GBA) is a globally significant urban agglomeration with a dense population, extensive urbanization, and robust economic development. Since China’s economic reform and opening-up, the GBA has been experiencing rapid population growth and economic development. This development has, however, come at the expense of the local ecological environment, including vegetation structure and function, resulting in severe degradation and destruction [41,42,43]. Consequently, there has been a detrimental impact on ecosystem services and processes [44], with significant challenges posed for the GBA in terms of achieving terrestrial carbon neutrality and promoting ecological civilization. However, despite the pressures exerted on vegetation dynamics by urbanization in the GBA, research suggests that this process can also yield positive impacts on vegetation cover levels and carbon sequestration [43,45,46]. Hence, during the rapid development of the GBA, what exactly is the relationship between urbanization and vegetation ecological quality? This question deserves thorough scientific exploration. Given its intricate urban–natural–social–territorial dynamics and high-intensity anthropogenic disturbances, it is imperative to analyze the coordinated management and interaction between urbanization and the ecological system from the perspectives of coupling coordination and the decoupling effect, and to explore the complex interrelationships and evolutionary trajectories between these elements. Ultimately, this approach aims to ensure ecological security and foster sustainable development across the GBA. In this sense, the main objectives of this study are to (1) characterize the spatial distributions and dynamic changes in vegetation ecological quality and urbanization levels from 2000 to 2020; (2) evaluate the level of coupling coordination between vegetation ecological quality and urbanization, and (3) investigate the decoupled states and their dynamic evolution in vegetation ecological quality and urbanization over four periods from 2000–2005, 2006–2010, 2011–2015, and 2016–2020.
2. Materials and Methods
2.1. Study Area
The GBA, located between 21°25′ N to 24°30′ N and 111°12′ E to 115°35′ E, includes two special administrative regions, namely Hong Kong and Macao, along with nine cities; Guangzhou, Shenzhen, Zhuhai, Foshan, Dongguan, Zhongshan, Jiangmen, Zhaoqing, and Huizhou, covering a total area of 56,000 km2 (Figure 1). The climate is a southern subtropical monsoon climate, characterized by warm and humid conditions throughout the year, particularly hot and rainy summers with an average annual temperature of 21.4–22.5 °C, and an annual precipitation of 1500–2500 mm. Geographically, the region benefits from natural advantages, primarily the Pearl River Delta (PRD) with its flat terrain and dense river network, and the West River Plain, characterized by mountains, hills, and significant elevation changes. Mountainous areas, such as the Zhaoqing, Huizhou, and Conghua Districts of Guangzhou, are predominantly distributed on the northern edge of the GBA. By the end of 2020, the population of the GBA exceeded 86 million, with a regional gross domestic production (GDP) of approximately 11.5 trillion yuan. Although it covers less than 1% of China’s land area and houses only 5% of its population, the GBA contributes approximately 11% of its total economic output, establishing itself as one of China’s most open and economically vibrant regions. Over the past 30 years, the region has experienced rapid urbanization, further accelerated by internal evolution, resulting in a well-established urban scale and hierarchical system and a high level of regional integration and urban development [47]. However, this rapid urban development has come at a cost. The environmental elements, structures, and functions of urban ecosystems in the GBA have suffered severe degradation and destruction, significantly impacting the processes and functions of vegetated ecosystems [43,45].
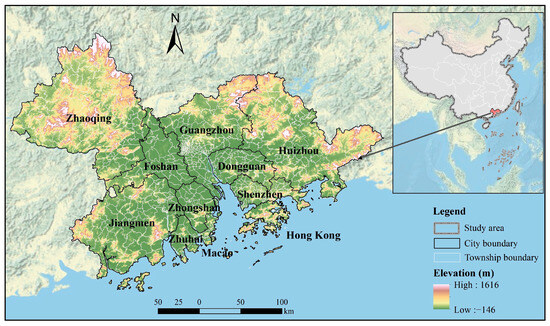
Figure 1.
Geographical location and the elevation of the GBA.
2.2. Available Data and Processing
- (1)
- NDVI dataset. A 16-day MODIS-NDVI (MOD13Q1) dataset from 2000 to 2020 was employed to calculate the FVC. The dataset was provided by the National Aeronautics and Space Administration (NASA, https://ladsweb.modaps.eosdis.nasa.gov/search/ (accessed on 1 December 2021)), with a spatial resolution of 250 m. Monthly NDVI values were derived from the 16-day data using the maximum-value compositing (MVC) method [48], which can effectively minimize cloud contamination, atmospheric impacts, and solar zenith angle effects [49];
- (2)
- Nighttime light (NTL) raster data. This dataset, spanning the years from 2000 to 2020, was derived from the Yangtze River Delta Science Data Center, the National Earth System Science Data Sharing Infrastructure, National Science and Technology Infrastructure of China (http://geodata.nnu.edu.cn/ (accessed on 1 December 2022)). This dataset, available at a spatial resolution of 500 m, has similar data quality and parameter attributes consistent with the NPP-VIIRS nighttime light data. Comparing the new 2012 nighttime light dataset with the NPP-VIIRS for the same year, the pixel-level accuracy (R2) was 0.87, and the root means square error (RMSE) was 2.96. The new nighttime dataset effectively addresses the compatibility issue between the DMSP-OLS and NPP-VIIRS nighttime light datasets, providing a new data source for research in urban studies and related fields. The dataset was resampled to a spatial resolution of 250 m to match the MODIS-NDVI data;
- (3)
- NPP dataset. The monthly NPP dataset used in this study spans 2000 to 2020 and was obtained from the literature [43]. This dataset was produced using the CASA (Carnegie–Ames–Stanford approach) model at a spatial resolution of 250 m. The accuracy of the simulated NPP was validated by field-observed biomass acquired from the Dinghushan and Heshan Forest Ecosystem State Field Observation and Research Station. Its reliability was validated against the field-observed NPP, with an MAE of 103.40 g C·m−2 and an RMSE of 122.22 g C·m−2;
- (4)
- Socioeconomic dataset. The annual population density and GDP data from 2000 to 2020 were obtained from the Resource and Environment Science and Data Center, Chinese Academy of Sciences (htps://www.resdc.cn/ (accessed on 1 December 2022)). Both datasets have a spatial resolution of 1000 m, with values of each raster based on the county-wide GDP and demographic data, incorporating geographical differentiation in natural elements. Both datasets were resampled to a spatial resolution of 250 m to match the MODIS-NDVI and NPP data;
- (5)
- Other data. DEM data with a 90 m resolution were obtained from the Geospatial Data Cloud (http://www.gscloud.cn/ (accessed on 1 February 2022)). Administrative district boundaries of prefecture-level cities and townships for 2018 in Arc/INFO coverage format were acquired from the Resource and Environmental Science Data Platform (https://www.resdc.cn/, (accessed on 1 February 2022)).
The detailed datasets used in the study are listed in Table 1.

Table 1.
Detailed description of the datasets.
2.3. Methods
2.3.1. Evaluation of Vegetation Ecological Quality
Based on Qian’s method [20], a comprehensive vegetation ecological quality index (VEQI) can be constructed by integrating the NPP and FVC. This index can comprehensively reflect both productivity per unit area and vegetation coverage, employing a weighted method that acknowledges the significance of both the NPP and FVC. The VEQI can be expressed as follows:
where Qi is the annual VEQI for a year i, ranging from 0 to 100 (a value of indicates 0% vegetation coverage and a NPP value of 0, whereas a value of 100 signifies 100% vegetation coverage and the highest NPP value); FVCi is the annual average vegetation coverage for a year i; f1 and f2 are the weighting coefficient for the annual average vegetation coverage and the annual NPP (both set at 0.5); NPPi represents the annual NPP for a year i, and NPPmax is the maximum annual NPP, reflecting the optimal local climatic conditions for vegetation growth. To better reveal the spatial heterogeneity of the VEQI across the GBA from 2000 to 2020, the VEQI values were categorized into five levels based on the classification methods proposed by Qian et al. [14]; Qi80 indicates a natural level, 60 Qi 80 indicates a good level, 50 Qi 60 indicates a medium good level, 40 Qi 50 indicates a medium bad level, 20 Qi 40 indicates a bad level, and Qi 20 indicates a very bad level.
The monthly FVC was calculated using the dimidiate pixel model based on the synthetic monthly NDVI. This model assumes that a pixel in remote sensing imagery consists of two parts, vegetation and soil, and the pixel information includes pure vegetation component information and pure soil component information. The FVC can be expressed as follows:
where FVC ij is the fraction of vegetation coverage in the jth month of the i year, ranging from 0 to 100%, and the annual FVC is reflected by the average FVC over 12 months; NDVIij denotes the NDVI in the jth month of the i year, and and are the NDVI values for pure vegetation pixels and soil pixels, which are set to 0.95 and 0.05, respectively.
2.3.2. Construction of Comprehensive Urbanization Index
Urbanization is a multifaceted process encompassing socioeconomic development and urban expansion. Based on previous studies [50], the complex urbanization process has been decomposed into three aspects: economic, population, and land urbanization. The population density (POP), GDP, and digital number (DN) of nighttime lights were chosen to represent economic urbanization, population urbanization, and land urbanization, respectively. The comprehensive urbanization index (CUI) model integrates these three dimensions to provide a comprehensive measure of urbanization levels in the GBA. It can be expressed as follows:
where UPI, UEI, and ULI denote the population urbanization index, economic urbanization index, and land urbanization index, respectively, and w1, w2, and w3 represent the weights of UPI, UEI, and ULI in CUI, respectively. The value of CUI ranges from 0 to 100, a high CUI value indicates more advanced urbanization and a low CUI value shows a less developed urbanization. To determine the weights of the three indicators on the CUI, the geographic detectors [51] were employed to explore the single-factor determinant power of POP, GDP, and DN to the average VEQI from 2000 to 2020. The determinant powers of these factors were 0.4993, 0.3079, and 0.6570, respectively. Subsequently, the calculated weights of w1, w2, and w3 are 0.3410, 0.2103, and 0.4488, respectively.
CUI = w1UPI + w2UEI + w3ULI,
Due to the different units and dimensions of population density, economic indicators, and DN, the range normalization method was adopted to standardize these datasets using the following equation:
where xij is the value of the jth indicator in i year, xj max and xj min are the maximum and minimum values of the jth indicator, respectively.
2.3.3. Trend Analysis
The Mann–Kendall (M–K) method was employed to calculate pixel-level VEQI and CUI trends as well as the magnitude of the changes in each element. The M–K test statistic S can be calculated as follows [52,53]:
where n is the number of data points, xi and xj are the data values in time series i and j (j > i), respectively, and sgn (xj − xi) is the sine function expressed as follows:
The variance and the standard normal test statistic ZS are calculated as follows:
where n is the number of data points, m is the number of tied groups, and ti is the number of ties of extent i. A tied group is a set of sample data with the same value. A negative Z value signifies an increasing trend and vice versa.
The Thiel–Sen median slope estimator for estimating the slope of the trend in a sample with N pairs of data can be calculated using the following equation:
where xk and xm are the data values at times k and m (k > m), respectively.
2.3.4. Coupling Coordination Model
The coupling coordination model can quantitatively assess the degree of coordination between urbanization systems and ecological environment systems, providing a clearer understanding of issues during the development process of the GBA. Based on the capacity coupling system model in physics, a coupling and coordination model was introduced in this study to evaluate the degree of coordination in the interactive coupling between urbanization and vegetation dynamics in the GBA at the township scale [54]. Firstly, the coupling model is expressed as follows:
where CD denotes the coupling degree between the VEQI and CUI. A higher value of CD indicates a more coordinated relationship between vegetation ecological quality and urban development.
Secondly, although the coupling degree assesses the interaction and influence between the two systems, it does not provide a comprehensive view of their overall development level. Therefore, the coupling coordination model was introduced to objectively reflect the level of coordinated development and better judge whether the development between variables is orderly or not. This model is expressed as follows:
where CCD is the coupling coordination degree, ranging from 0 to 1, a higher value indicates a higher level of coupled and coordinated development between VEQI and CUI; and are the weights assigned to the VEQI and CUI within the system, respectively. In this study, it was assumed that urban development and vegetation ecological quality are equally important to the sustainable development of urban ecosystems, therefore, and were set to 0.5. To facilitate the analysis of the coupling coordination characteristics of the CUI and VEQI, the CCD at the township level was categorized into three stages: low-level coupling coordination stage (CCD 0.4), medium-level coupling coordination stage (0.4 0.5), and the high-level coupling coordination stage (CCD 0.5).
2.3.5. Tapio Decoupling Model
The coupling coordination model can effectively characterize the coordinated relationship between the two systems but cannot thoroughly reveal the interactive coercive dynamics [55]. The Tapio decoupling model is a method commonly used to measure decoupling relationships between two systems [15]. It determines the decoupling relationship between the two systems by using elastic coefficients of change in different systems. In this study, the Tapio decoupling model was applied to analyze the relationship between the change ratios in the VEQI and CUI across different periods from 2000 to 2020 at the township scale. The change ratios of the VEQI and CUI values were calculated for each township, and the decoupling index (DI) of the 1414 townships was calculated using the following equation [38]:
where DIti represents the decoupling index between the VEQI and CUI; and are the change rates of the VEQI and CUI during the ti period, respectively; VEQIt2 and VEQIt1, CUIt2 and CUIt1 represent the VEQI and CUI at the end and beginning of period t, respectively.
The decoupling relationship can exhibit varying degrees of strength and direction, ranging from strong to weak and from positive to negative. Based on the positive and negative slopes of the VEQI and CUI, and the DI values from 2000 to 2020, referring to Tapio [38], the decoupling relationship between the VEQI and CUI can be categorized into three primary states: decoupling, coupling, and negative decoupling. Decoupling occurs when the growth of the VEQI is lower than that of the CUI, indicating a weakening dependence of the CUI on the VEQI. Coupling occurs when the VEQI and CUI show similar or consistent change rates over time, indicating that urbanization and vegetation quality are closely correlated and tend to change together. A negative decoupling state occurs when the VEQI grows more rapidly than the CUI, implying that vegetation quality improvements exceed the urbanization growth rate. For a more detailed analysis, 0, 0.8, and 1.2 were used as critical values to further categorize the three primary states into eight specific sub-states, as illustrated in Figure 2.
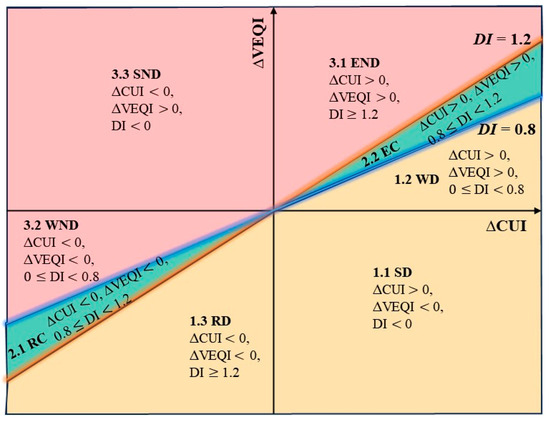
Figure 2.
Decoupling states of the Tapio decoupling indicator. SD, strong decoupling; WD, weak decoupling; RD, recessive decoupling; EC, expansive coupling; RC, recessive coupling; END, expansive negative decoupling; WND, weak negative decoupling; SND, strong negative decoupling. The orange line in the figure represents a DI value of 1.2, whereas the blue line indicates a DI value of 0.8; the wheat block represents decoupling state, the aquamarine block represents coupling state, and the pink block represents negative decoupling state.
In summary, this study firstly calculates the VEQI based on the NPP and FVC, then the extreme value standard method is used to normalize the GDP, population density, and DN, and the geographic detector is employed to determine the weight of each indicator, then calculate the CUI. Finally, the relationships between the VEQI and CUI are evaluated based on the coupling coordination model and the decoupling model. The formulas and models used in the study are summarized in Table 2.
Table 2.
Summarized description of evaluation indicators.
All analyses and processed are conducted using ArcGIS 10.2 (ESRI, Redlands, CA, USA), and MATLAB R2014a (The Mathworks, Inc., Natick, MA, USA).
3. Results
3.1. Spatial Patterns and Trend Analysis of the VEQI
3.1.1. Spatial Distribution Patterns of the VEQI
The spatial distribution of the VEQI evaluation levels for the years 2000, 2005, 2010, 2015, and 2020 is shown in Figure 3. The results indicated that the VEQI values are lower in central areas and higher in the surrounding regions. There is a significant upward trend in the VEQI from 2000 to 2020, with a mean annual VEQI of 46.56 over the 21 years, reflecting heterogeneous values influenced by varying levels of vegetation cover and human activity intensity. Among the 11 cities, Zhaoqing has the highest average VEQI of 53.50, followed by Huizhou and Jiangmen with 53.35 and 48.38, respectively. In contrast, Macao has the lowest VEQI value of 10.44, followed by Zhongshan and Zhuhai at 29.80 and 30.18, respectively. The average VEQI values for the other cities range from 30.33 to 43.91. Over the past 21 years, the mean VEQI was lowest in 2000 (42.07) and highest in 2020 (51.64). This impressive increase of 9.57% suggests a substantial improvement in vegetation ecological quality across the GBA.
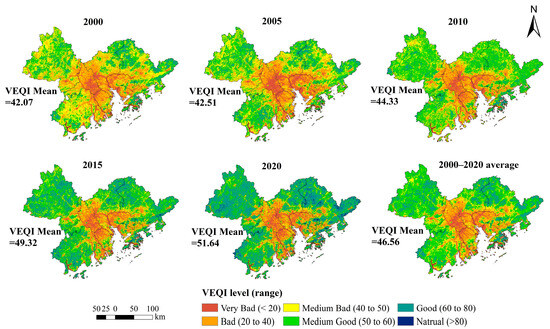
Figure 3.
Levels of vegetation ecological quality index (VEQI) in 2000, 2005, 2010, 2015, and 2020 and the average value for the period from 2000 to 2020.
Based on the statistical analysis of the six VEQI classifications (Figure 4), in 2000 pixels were categorized as “very bad”, “bad”, and “medium bad” dominant, comprising approximately 70% of the total pixels. In contrast, the combined proportion of pixels classified as “medium good” and “good” was only 29.40%. In addition, pixels classified as “natural” only accounted for 0.01% of the total. These findings indicate that the vegetation quality in most areas of the GBA was poor at the beginning of the study period. Compared to 2000, the VEQI levels in subsequent years showed significant improvements. For instance, by 2020 the proportion of areas classified as “bad” and “medium bad” had decreased significantly by 12.76% and 21.87%, respectively, while those classified as “medium good”, “good”, and “very good” increased by 1.43%, 31.17%, and 1.78%, respectively. These changes indicate a clear trend towards improved vegetation quality over the past 21 years.
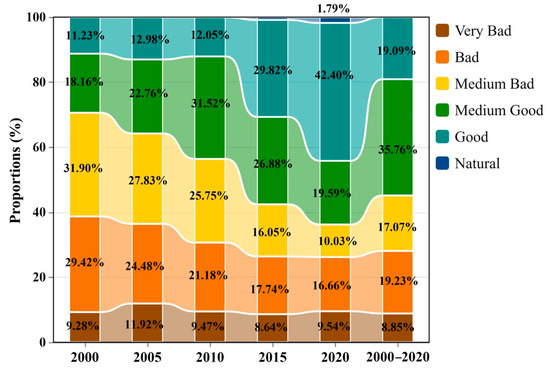
Figure 4.
Proportions of different levels of the VEQI (proportions less than 1% are not labeled in the figure).
3.1.2. Trend in the VEQI
Figure 5 illustrates the temporal trends of the annual VEQI values across the GBA at the pixel level. From 2000 to 2020, the VEQI exhibits an overall increase, with a mean slope of 0.45. Over 80% of the total pixels show an upward trend, whereas the pixels with a downward trend are primarily concentrated in the central areas such as western and southern Guangzhou, northern Zhongshan, and most of Foshan (Figure 5a), with change rates mainly ranging from −0.8 to −0.5. Each city of the 11 cities in the GBA demonstrates an increasing trend, with change rates ranging from 0.11 to 0.48. In particular, Jiangmen, Zhaoqing, Shenzhen, and Huizhou exhibit the most significant increases at 0.54, 0.53, 0.48, and 0.47, respectively. In contrast, Zhongshan, Macau, Zhuhai, and Dongguan show less pronounced increases, ranging from 0.11 to 0.24. Of the total pixels, approximately 40.85% and 12.88% show highly significant (p ≤ 0.01) and significant (0.01 < p ≤ 0.05) increases, respectively, and these areas are predominantly concentrated in the surrounding regions of the GBA (Figure 5b). The pixels with non-significant (p > 0.05, 26.93%) increases are mainly located in northern Zhaoqing, northern and eastern Huizhou, and southwestern Jiangmen. In contrast, only 3.81% and 2.21% of the pixels exhibit highly significant (p ≤ 0.01) and significant (0.01 < p ≤ 0.05) decreases, respectively, and these decreases are mainly located in the central parts of the GBA, particularly in southern Zhongshan, central Foshan, and western Guangzhou.
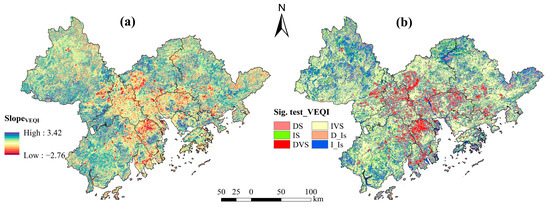
Figure 5.
The VEQI change trend from 2000 to 2020 (a) and slope significance levels (b) in the GBA. DS, decreased significantly (0.01 < p ≤ 0.05); IS, increased significantly (0.01 < p ≤ 0.05); DVS, decreased very significantly (p ≤ 0.01); IVS, increased very significantly (p ≤ 0.01); D_NS, decreased non-significantly (p > 0.05); I_NS, increased non-significantly (p > 0.05).
3.2. Spatial Pattern of the CUI and Its Changes
3.2.1. Spatial Distribution Patterns of the CUI
In most cities in China, a distinct spatial hierarchy of administrative divisions has developed under the influence of economic, demographic, and policy factors. To more accurately measure the levels and spatial disparities across these administrative boundaries, the spatiotemporal patterns of the CUI within the GBA at the township level were examined. Based on the model used to calculate the CUI, Figure 6 illustrates the spatial patterns of the CUI in the GBA across different years and the 21-year average. Spatially, the high values are concentrated in central areas such as central Guangzhou, eastern Foshan, northern Zhongshan, and most areas of Dongguan, Shenzhen, Hong Kong, and Macao, whereas low values are mainly observed in the surrounding areas such as Jiangmen, Huizhou, and Zhaoqing. Over the 21 years, the average CUI value was 8.41, the lowest CUI value (5.55) occurred in 2000, and the highest (11.20) occurred in 2020. During the period of rapid development, the CUI consistently increased. Specifically, seven cities exceed the 21-year average value of the GBA. Dongguan, Shenzhen, Macao, and Foshan showed the most significant increases, constituting the first gradient with growth rates of 8.52%, 8.30%, 8.21%, and 6.64%, respectively. In the second gradient, Guangzhou, Zhuhai, and Macao show increases ranging from 2.27 to 4.73. The third gradient exhibited smaller increases, ranging from 0.59 to 1.84, represented by Zhaoqing, Hong Kong, Jiangmen, and Huizhou.
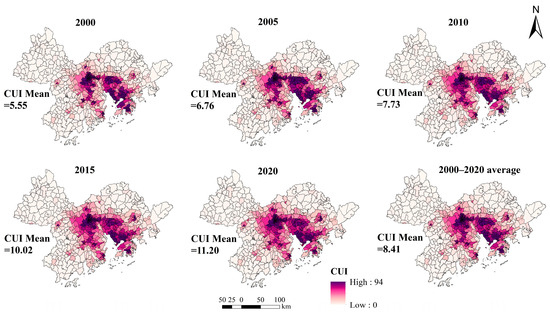
Figure 6.
Spatial comprehensive urbanization index (CUI) patterns on the township scale in the GBA in 2000, 2005, 2010, 2015, and 2020, along with the average value for 2000–2020.
3.2.2. Trend Analysis of the CUI
The trends and significance of the CUI at the township level in the GBA over the 21 years are illustrated in Figure 7. There is a noticeable increase in the CUI, with a mean slope of 0.29. More than 91% of the areas in the GBA exhibit an upward trend, with higher slope values predominantly concentrated in the central regions (Figure 7a). In contrast, townships exhibiting a decreasing trend are primarily found in parts of Zhaoqing, Jiangmen, and Dongguan, covering only 8.57% of the total area. Among the areas showing increasing trends, 9.06% and 80.99% exhibit significant (0.01 < p ≤ 0.05) and highly significant (p ≤ 0.01) increasing trends, respectively. These trends are widely distributed across the eastern, central, and southern regions of the GBA, whereas non-significant (p > 0.05, 6.79%) increases are concentrated in the northern, western, and some central parts of the GBA (Figure 7b).
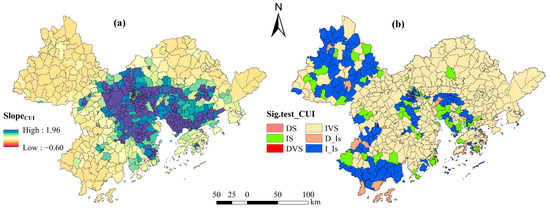
Figure 7.
The CUI change trends (a) and slope significance levels (b) from 2000 to 2020 on the township scale in the GBA. DS, decreased significantly (0.01 < p ≤ 0.05); IS, increased significantly (0.01 < p ≤ 0.05); DVS, decreased very significantly (p ≤ 0.01); IVS, increased very significantly (p ≤ 0.01); D_NS, decreased non-significantly (p > 0.05); I_NS, increased non-significantly (p > 0.05).
The proportion of areas showing a significant (0.01 < p ≤ 0.05) and highly significant (p ≤ 0.01) decrease is low, at 1.24% and 1.67%, respectively. In addition, areas with a non-significant (p > 0.05) decrease accounted for 5.65% of the total areas, scattered sporadically in Zhaoqing, northern and southern Jiangmen, and parts of Dongguan (Figure 7b). These findings indicate that the urbanization levels of the townships in the GBA have steadily increased during the 21 years, with most areas experiencing rapid CUI growth rates, albeit with significant spatial heterogeneity.
3.3. Interaction and Coercive Effects between the VEQI and CUI in the GBA
3.3.1. Spatiotemporal CCD Patterns and Their Changes
The CCD at the township scale was calculated according to Equations (8) and (9), and the results are shown in Figure 8. From 2000 to 2020, the CCD between the VEQI and CUI showed an upward trend, indicating a significant enhancement in the coupled and coordinated development of the vegetation ecological quality and urbanization in the GBA. Specifically, the CCD demonstrated a continued and stable increase of approximately 0.004 per year, rising from 0.26 in 2000 to 0.34 in 2020, accounting for an increase of more than 30%. The sustained CCD growth indicates that the vegetation ecological quality and urbanization in the GBA townships are advancing healthily and orderly. To better analyze the spatial variability and changes in the coupling coordination between the VEQI and CUI throughout the study period, referring to the classification methods provided by Liu et al. [9], the CCD values at the township scale were categorized into three stages: the low-level coupling coordination stage (CCD range: 00.4), medium-level coupling coordination stage (CCD range: 0.40.5), and the high-level coupling coordination stage (CCD 0.5). In 2000, townships characterized by low-level coupling coordination accounted for the largest proportion, and exceeded 84% of the total area. Townships with medium-level coupling coordination represented 11.94%, and those with high-level coupling coordination only accounted for 3.25% of the total, mainly concentrated in the old urban areas of central Guangzhou, central Shenzhen, and some parts of Hong Kong. By 2005, there was a slight decrease in the proportion of townships with low-level coupling coordination, accompanied by slight increases in areas exhibiting medium- and high-level coupling coordination. The areas with higher values were mainly concentrated around the original regions observed in 2000. By 2010, the proportion of townships with low-level coupling coordination had significantly decreased to 70.68%, with substantial increases observed in areas exhibiting medium- and high-level coupling coordination. The areas characterized by high-level coupling coordination had approximately doubled compared to 2005. In 2015, the proportion of townships with low-level coupling coordination had significantly decreased to 54.40%, alongside a slight increase in areas with medium-level coupling coordination. The proportion of areas with high-level coupling coordination reached 25.82%. By 2020, compared to the year 2000, the proportion of townships with low-level coupling coordination had decreased by 41.09%, whereas the proportions of those with medium- and high-level coupling coordination had increased by 1 and 7 times, respectively.
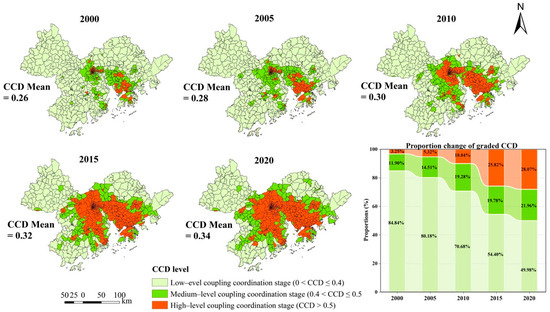
Figure 8.
The coupling coordination degree (CCD) and its proportion changes in the GBA from 2000 to 2020.
Figure 9 depicts the CCD change trends from 2000 to 2020. The CCD values between the VEQI and CUI across the GBA increased for more than 98% of the townships, with a slope of 0.004. The most pronounced increases were observed for the central cities of the GBA, such as Guangzhou, Shenzhen, Dongguan, Foshan, and Zhongshan, as well as in southwestern Huizhou and Zhuhai and eastern Jiangmen (Figure 9a). Only 1.2% of the townships showed decreasing CCD values, mainly concentrated on some tourist-oriented islands. Among the townships with increasing CCD values, 83.78% and 8.93% exhibited highly significant (p ≤ 0.01) and significant (0.01 < p ≤ 0.05) increases, respectively, whereas 6.14% demonstrated non-significant (p > 0.05) increases, scattered mainly across the northern, southern, and central parts of the GBA (Figure 9b). The decreasing CCD trends were all non-significant (p > 0.05).

Figure 9.
Trends (a) and slope significance tests (b) of the CCD from 2000 to 2020 on the township scale in the GBA. IS, increased significantly (0.01 < p ≤ 0.05); IVS, increased very significantly (p ≤ 0.01); D_NS, decreased non-significantly (p > 0.05); I_NS, increased non-significantly (p > 0.05).
3.3.2. Decoupling Effect and Its Changes
Figure 10 shows the comparison of the decoupling relationship between the VEQI and CUI in the four periods from 2000 to 2020 at the township scale; each scatter plot represents the decoupling relationship in a township, excluding any invalid data. Combining the meanings of different scatter points in Figure 2, the following trends in Figure 10 were observed: during the first stage (2000–2005), the scatter points are predominantly concentrated in the decoupling state, with SD and WD prevailing. During the second stage (2006–2010), there was a decrease in the decoupling state points, accompanied by an increase in negative decoupling (mostly SND) and coupling (primarily EC). By the third stage (2011–2015), the number of decoupling points, especially SD, significantly declined, converting towards negative decoupling states, particularly END, while the number of coupling states, especially EC, continued to rise. In the fourth stage (2016–2020), the relationship between the VEQI and CUI continued to be characterized by decoupled and negatively decoupled states, primarily SD and END, with a slight change in the number of EC states compared to those in the third stage. These findings indicate a gradual improvement in the decoupling relationship between the VEQI and CUI over time.
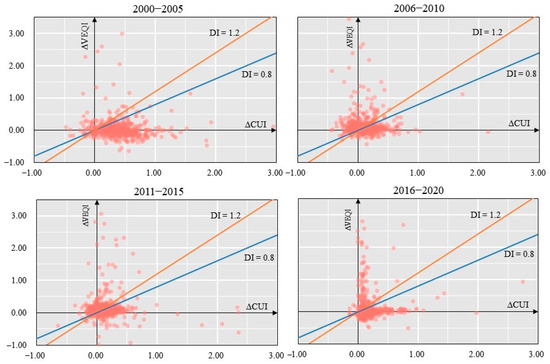
Figure 10.
Changes in the decoupling level between the VEQI and CUI at the township scale of the GBA in the different periods. DI: decoupling index; ∆VEQI: change rate of the vegetation ecological quality index; ∆CUI: change rate of comprehensive urbanization index. The meaning of the color of the lines in the figure is the same as in Figure 2.
For the spatial distribution and proportion statistics of decoupling states between the VEQI and CUI (Figure 11), it is evident that during the initial stage (2000–2005), approximately 55.29% of the townships exhibited a weak decoupling relationship between the VEQI and CUI. In these areas, the VEQI growth was less pronounced than the CUI. During this period, 30.01% of the townships exhibited SD, indicating a concerning trend where the VEQI decreases while the CUI increases, highlighting the detrimental impact of urbanization on vegetation dynamics. These townships were predominantly distributed in the central and eastern parts of the GBA. Meanwhile, approximately 9.09% of townships showed END, mainly in the southern part of the GBA. The VEQI growth was significantly more pronounced than the CUI growth, indicating improved vegetation quality. In addition, approximately 4.42% of the townships demonstrated EC, demonstrating an improvement in vegetation quality along with urbanization, with both indices showing closely matched growth rates, demonstrating a strong correlation between them.
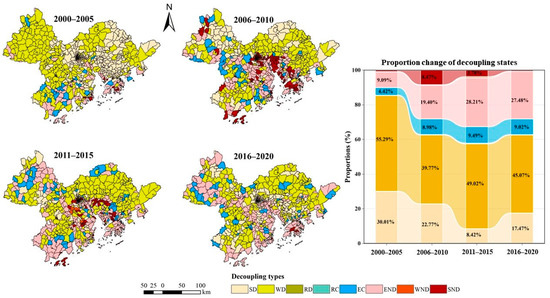
Figure 11.
Spatial distribution and proportion statistics of eight decoupling states at the township scale of the GBA in different periods (proportions less than 1% are not labeled in the figure). SD, strong decoupling; WD, weak decoupling; RD, recessive decoupling; EC, expansive coupling, RC, recessive coupling; END, expansive negative decoupling; WND, weak negative decoupling; SND, strong negative decoupling.
From 2006 to 2010, WD, SD, END, and EC were dominant among the eight decoupling states. Compared to the first stage, there was a significant decrease in WD and SD. However, there was an increase in END and EC, mainly in the central and southern parts of the GBA. This indicates a continued improvement in vegetation quality along with rapid urban development. In addition, there was an increase in the proportion of townships in the SND state, mainly in central Guangzhou, western Dongguan, Shenzhen, and parts of Hong Kong. This indicates an increased vegetation quality in areas where urban development has either progressed slowly or stagnated due to saturation. From 2011 to 2015, approximately half of the townships were in the WD state, indicating increases in the VEQI and CUI. However, the urbanization rates exceeded the improvement in vegetation quality, with a minimal impact of urban development on vegetation health. The proportion of townships in the SD state continued to decline, dropping to 8.42%, indicating reduced ecological damage with urbanization progression, and in most areas, vegetation quality improved continuously. In this stage, the END and EC states continued to become more dominant, reflecting the simultaneous improvements in the VEQI and CUI and highlighting the increasing role of urbanization in optimizing vegetation quality. From 2016 to 2020, the relationship between the VEQI and CUI was characterized by WD (45.07%) and END (28.21%). This highlights an increased emphasis on vegetation conservation alongside continuous urbanization, showing a positive influence of urban development on vegetation dynamics. Compared to the previous stage, the proportion of areas in the SD state increased but remained lower than that in the first and second stages.
4. Discussion
4.1. Spatial Differentiation and Improvement of Vegetation Ecological Quality in the GBA
The spatial distribution of the VEQI varied significantly across different years, reflecting a typical “core-periphery” dichotomy (Figure 3), which is consistent with previous studies on vegetation dynamics in the GBA [43,56]. In addition, although the overall ecological state of the GBA has improved (Figure 5), there is still a significant spatial heterogeneity in the VEQI trends due to varying economic development, population growth, urban expansion rates, and topographical factors. For instance, rapid development since the reform and opening-up led to substantial increases in construction activities in central urban areas such as Guangzhou, Zhongshan, Foshan, Dongguan, and Shenzhen [45]. Coupled with the population and economic growth, continuous human activities have significantly impacted the vegetation in these cities, resulting in reduced vegetation coverage and NPP [43,57], severely affecting vegetation ecological quality. In contrast, peripheral areas such as Huizhou, Zhaoqing, and Jiangmen have richer natural ecological foundations, such as mountains, forests, wetlands, and other natural landscapes. These areas have received more protection and attention during urbanization, showing robust ecological regulation and restoration capabilities. They mostly have “good” and “natural” VEQI levels (Figure 3), and a more considerable increasing trend (Figure 5b).
Based on the analysis of the average VEQI values of the GBA over the past 21 years, the overall vegetation quality improved continuously. A further examination of the transformation across different VEQI levels between 2000 and 2020 (Figure 12) revealed a consistent increase, particularly in the lower VEQI levels. Specifically, areas initially classified as “bad” improved to “medium bad”, “medium good”, and “good”, covering 27,550, 26,256, and 19,925 km2, respectively. Similarly, areas classified as “medium bad” improved to “medium good” and “good” areas, totaling 53,318 and 99,888 km2, respectively, with approximately 970 km2 experiencing a decline to lower VEQI levels. In addition, areas classified as “medium good” improved to “good” across 83,225 km2, with less than 160 km2 regressing to lower VEQI levels. Despite the adverse impacts of human activities on vegetation in certain areas, continuous positive initiatives, such as governmental policies promoting ecological civilization, vegetation protection, and ecological restoration, have significantly contributed to the gradual enhancement of vegetation quality in the GBA.
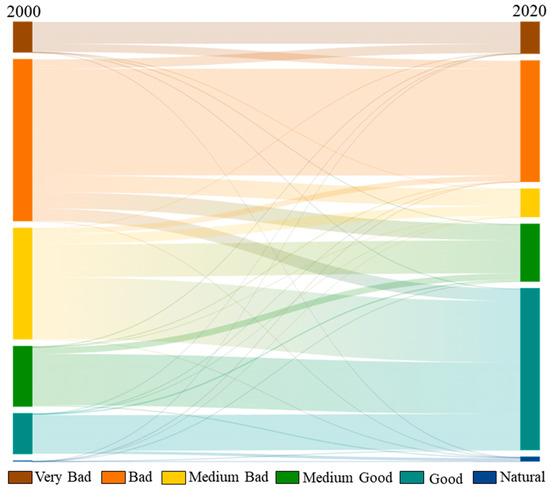
Figure 12.
Area conversion for different VEQI levels between 2000 and 2020 in the GBA.
Accordingly, in response to the increasing demand for greening, there is a trend of vegetation growth showing signs of recovery [58,59]. It is essential to acknowledge the substantial and impactful efforts in urban land management to protect green spaces and restore the ecological balance in the GBA. In 2000, China initiated its ecological civilization construction, leading to a heightened ecological awareness in the GBA. This initiative has led to considerable increases in vegetation cover and carbon fixation [43,57], contributing to continuous improvements in vegetation quality. In addition, the Reform and Development Plan Outline for the Pearl River Delta (2008–2020) emphasizes the advancement of urban landscape forests, public green spaces, and the surrounding green belts in the PRD. This initiative promotes integrated urban–rural greening, protects agricultural zones, develops agroforestry networks, and preserves other green open spaces, thus establishing a network of regional ecological corridors. These efforts have created favorable conditions for enhancing vegetation quality.
4.2. Urbanization Process of the GBA
As the pioneering area of China’s reform and opening-up policy, the GBA has experienced substantial expansion in recent decades, marked by rapid developments in its transportation and communication networks [47,60]. This study reveals a significant increase in the CUI across the GBA over the past 21 years, with over 80% of the region demonstrating a markedly upward trend; Guangzhou, Shenzhen, Dongguan, Zhongshan, and Foshan have experienced particularly substantial growth (Figure 6 and Figure 7). This expansion can be attributed to the favorable natural geographical conditions of these cities, characterized by abundant rainfall and low-lying terrain, which facilitate extensive urban development. In addition, these cities are prominent manufacturing centers within the GBA and across the southern China region, supported by well-developed service and manufacturing sectors that attract a significant influx of migrants [47]. In addition, implementing the “Guangzhou–Foshan Urban Integration Development Planning” has facilitated the creation of an economic circle encompassing Guangzhou, Foshan, and Zhaoqing. This initiative has integrated their urban transportation systems, enhanced their economic synergies, and rapidly improved urban spatial connectivity [61]. In addition, cities such as Shenzhen, Dongguan, and Zhuhai capitalize on their proximity to Hong Kong and Macao to absorb industries relocating from these areas. The initial development of labor-intensive industries and the subsequent growth in high-tech industries and financial services have attracted many migrant workers, further driving urban construction land expansion [47]. In contrast, peripheral cities such as Huizhou, Jiangmen, and Zhaoqing exhibit lower CUI values and slower growth trends. This can be attributed to their mountainous terrain, which, despite rich vegetation and ecological quality, poses challenges for infrastructure development. In addition, these cities are far from the provincial capitals of Hong Kong, Macao, and the Pearl River estuary. Hence, a portion of the workforce migrates to economically more developed neighboring cities, likely hampering urbanization.
As special administrative regions of China and central cities within the GBA, Hong Kong and Macao have experienced early urban development and attained advanced levels of urbanization. However, their urban expansion is constrained by their limited space, resulting in slower CUI growth. Hence, despite the substantial urban expansion across the GBA over the past 21 years, economic, demographic, and geographic disparities among its cities have led to varying rates of urban development. Therefore, effectively integrating the unique characteristics and spatial structures of each city is crucial for rational urban planning and development in the GBA. This approach should prioritize harmonizing with urban ecological environments and promoting sustainable development, as such efforts are essential for advancing ecological civilization in the region.
4.3. Relationship between the Vegetation Ecological Quality and Urbanization
4.3.1. Coupling Coordination
Intense urbanization often leads to a degraded environmental quality in the dynamic interaction between urbanization and the ecological environment. In contrast, deteriorating ecological conditions constrain sustainable urbanization [62]. With the rapid growth of the economy, population, and impervious surfaces, conflicts between urbanization and vegetation have become increasingly prominent [11,63]. This issue is particularly apparent in urban agglomerations. However, for the GBA, under a spatial pattern that simultaneously encourages construction and focuses on improving ecological quality in the GBA, whether developing the cities in the GBA and the vegetation ecological quality are in severe contradiction and conflict, or whether they are in harmonious development, is an issue worth exploring. This research showed that from 2000 to 2020, the interaction between the VEQI and CUI underwent significant changes and continual improvements across the GBA. Spatially, high-value CCD areas are mainly concentrated in the central GBA, whereas low-coordination areas are predominantly found in the peripheral areas. This spatial disparity corresponds with the uneven pace of economic development and urban expansion across the GBA. Central townships in the GBA exhibit vigorous economic activities, dense populations, and intensive land transformation efforts [43]. These areas also demonstrate improvements in vegetation ecological quality, contributing to a continuous rise in CCD values and indicating higher levels of coordinated coupling between the VEQI and CUI. In contrast, despite their abundant natural resources and high-quality ecological vegetation, the peripheral townships in the GBA lag in terms of economic development and urbanization. Hence, they exhibit lower CCD values and lower coupling coordination between the VEQI and CUI.
Although the research indicates higher levels of coupling coordination in the central GBA townships, it must be acknowledged that extensive human activities in this region have caused significant disruptions and damage to vegetation dynamics. Previous studies have also demonstrated that urbanization and land structure changes have led to a decline in vegetation cover and reduced the carbon sequestration capacity of vegetation in the central areas of the GBA [16,43,64]. In addition, rapid population growth, economic development, and extensive urbanization have gradually led to various urban ecological issues such as the heat island effect, air pollution, and degraded vegetation quality [41,65,66]. These environmental challenges can disrupt the inherent connections among elements of the urban ecosystem and alter the natural state and structure of the urban environment [67,68], posing a significant threat to the harmonization and sustainable development of urban and ecological environments in the region [45]. Therefore, against the background of the rapid development of the GBA, it is crucial to prioritize optimizing the rational allocation of limited land resources while simultaneously increasing vegetation coverage and enhancing carbon sequestration along with urbanization. These efforts are essential for achieving coordinated urban expansion and the sustainable development of vegetation quality in the GBA.
4.3.2. Decoupling Effect
To further analyze the complex dynamics, evolutionary path, and characteristics of the coercion interaction between vegetation ecological quality and urbanization in the GBA, this study employed the Tapio decoupling model to calculate the decoupling indices at 5-year intervals from 2000 to 2020. Based on the findings, within the typical “core–periphery” binary urban structure of the GBA, the decoupling relationship between the VEQI and CUI predominantly exhibited WD across four time periods (Figure 11). This decoupling pattern was mainly in peripheral urban areas. These regions demonstrated a low but gradually increasing urbanization rate (Figure 6 and Figure 7) while maintaining high vegetation ecological quality. They prioritized environmental conservation efforts alongside urban development, mitigating the impact of urbanization on vegetation coverage and carbon sequestration capacity.
For the proportional changes in the different decoupling states across the four periods, it was found that the proportion of SD decreased. In contrast, END and EC showed increasing trends (Figure 11). This indicates that urbanization in the GBA continues to advance and positively contributes to the development of vegetation ecological quality. The intensity of urbanization has effectively achieved a sustainable and harmonious balance with vegetation ecological quality in most areas. Previous studies have emphasized that favorable climatic conditions and appropriate human activities contribute to improved vegetation dynamics in the GBA [26,43], and vegetation dynamics demonstrate greater adaptability to socioeconomic development. Furthermore, well-managed human activities facilitate the coordinated improvement of vegetation dynamics and urbanization [39]. In addition, implementing the Pearl River Delta National Forest Urban Agglomeration Construction Plan (2016–2025) aims to establish an ecological security framework in the PRD. This initiative has created favorable conditions for better PRD vegetation ecological quality and coordination between socioeconomic development and environmental conditions. In addition, the Guangdong–Hong Kong–Macao Greater Bay Area Development Planning Outline mandates the establishment of ecological protection barriers and enhancement of the forest ecosystem protection around the PRD. These measures are expected to significantly improve the ecological environment quality of the GBA. The conflicts between urbanization driven by human activities, vegetation coverage, and the NPP are anticipated to be gradually mitigated. The strong decoupling effect between the VEQI and CUI is also expected to alleviate over time.
4.4. Recommendations and Limitations
4.4.1. Socioecological Recommendations
As one of China’s most open and dynamically developing regions, the GBA faces considerable challenges in balancing its urban growth with environmental conservation. The region actively pursues strategies for high-quality economic progress while prioritizing ecological integrity improvements. Strict enforcement of environmental protection measures has enhanced the area’s ecological quality over the past two decades. The results exhibit a general upward trend in the VEQI, CUI, and CCD throughout the 21-year study period in the GBA. However, challenges persist, especially in peripheral areas where coordination between urban growth and vegetation ecological quality remains discordant. In addition, the central region of the GBA continues to experience declining vegetation ecological quality due to rapid urbanization, posing ongoing threats. Based on the evolution pattern of the coupling coordination degree and the decoupling trend between the VEQI and CUI during the study period, the following suggestions are proposed based on the development characteristics of the GBA.
In regions with relatively high coupling coordination, mostly in decoupled states such as central Guangzhou, Foshan, Dongguan, and Shenzhen, the vegetation ecological quality lags behind despite high levels of urbanization, with urban development exerting significant pressure. Although socioeconomic growth is promoted, there is a need to prioritize ecological conservation and vegetation restoration, with an emphasis on ecological construction. In areas with high coupling coordination but mainly negative decoupling states, such as Hong Kong and Macao where urbanization rates are large and vegetation ecological quality is relatively good, maintaining vegetation ecological quality must be a priority alongside economic development efforts. Regions with lower coupling coordination, mainly decoupled states such as northeastern Guangzhou, northern Zhaoqing, western Jiangmen, and northern and eastern Huizhou, exhibit greater vegetation ecological quality but slower urbanization due to the distinct terrain features. These should serve as green protection barriers for the GBA, requiring strict adherence to ecological conservation redline policies to protect crucial ecological function areas and sensitive zones. Urbanization levels and vegetation ecological quality are lower in regions with relatively lower coupling coordination and decoupled or negative decoupling states, such as the central urban areas of peripheral cities in the GBA. Efforts should be focused on optimizing urban–rural structures, enhancing integrated urban–rural development, increasing urban green coverage, and strengthening vegetation protection efforts to achieve a win-win situation for vegetation ecological quality and socioeconomic development.
4.4.2. Limitations
This study employed the coupling coordination and the decoupled models to analyze the relationship between the VEQI and CUI in the GBA from 2000 to 2020. These approaches provide insights into the complex dynamics and conflicting interactions between urbanization and vegetation dynamics over 21 years. However, this study has several limitations. First, previous studies have demonstrated that vegetation ecological quality is mainly influenced by human activities and climate factors such as precipitation, temperature, solar radiation, and topography [25,69,70]. This study, however, primarily focuses on the relationship between urbanization and vegetation ecological quality, without further exploring the influences of climate variables on vegetation dynamics. Nevertheless, the coupling coordination and decoupling relationships between these factors and vegetation dynamics remain uncertain and require further analysis. Second, this study applied economic indicators, population density, and nighttime lighting data to determine the economic urbanization, population urbanization, and land urbanization of the GBA, respectively. Although these metrics are widely used and considered effective in assessing regional urbanization [71,72], urbanization is a complex phenomenon involving multiple factors, such as socioeconomic and spatial transformations. Indicators such as urban unemployment rates, per capita disposable income, and average wages also reflect the social dimensions of urbanization to a certain extent [73,74]. Therefore, future research should integrate these social urbanization factors into comprehensive urbanization models to provide a more accurate evaluation of the urbanization level. Third, this study employed the coupling coordination and decoupling models to measure the coordination and conflicts between urbanization and vegetation ecological quality. Although it effectively demonstrates the relationship and dynamic responses of vegetation ecosystems to urbanization, it does not reveal the nonlinear relationships and the mechanisms of coupling coordination and decoupling between vegetation ecological quality and various urbanization indicators across different stages of urban development.
5. Conclusions
Rapid urbanization promotes population, economic growth, and social development and puts great pressure on the ecological environment. In this study, the GBA, a world-class urban agglomeration, was used as the research focus to investigate the relationship between urbanization and vegetation ecological quality. The VEQI, based on vegetation NPP and FVC, was constructed, and the CUI was generated using the GDP, population density, and nighttime lighting data. By analyzing the spatiotemporal characteristics and dynamic changes of the VEQI and CUI in the GBA over 21 years and applying the coupling coordination and Tapio decoupling models, the coupling coordination and decoupling statuses between them were assessed. The findings are as follows:
- (1)
- From 2000 to 2020, the VEQI values of the GBA significantly increased, reflecting consistent enhancement of the vegetation ecological quality; however, a decline was observed in some central regions of the GBA during this period;
- (2)
- Over the 21 years, the CUI in all cities of the GBA demonstrated an increasing trend, indicating a continuous rise in urbanization levels across the GBA, especially in central areas of the GBA like Shenzhen, Dongguan, Foshan, and Macao, which were much higher than the average growth rate;
- (3)
- The CCD values between the VEQI and CUI in the GBA consistently improved from 2000 to 2020, and the relationship between urbanization and vegetation ecological quality has become more harmonious and tends toward coordination. However, in regions where the vegetation ecological quality is high but urbanization levels are low, or vice versa, where vegetation ecological quality is low but urbanization levels are high, the coupling coordination between the two is still not optimistic;
- (4)
- The decoupling status between the VEQI and CUI over the four study periods was characterized by WD, SD, END, and EC. A discernible trade-off state persists despite the improving relationship between urbanization and vegetation ecological quality. Vegetation ecological quality continues to be significantly impacted by urbanization pressures.
The study’s results reveal the evolving relationship between urbanization and the vegetation ecological quality throughout the GBA. The comprehensive analysis of this study and the detailed exploration of the spatiotemporal evolution of the coupling coordination and decoupling between urbanization and vegetation ecological quality provide a more refined understanding of complex dynamics. In addition, this research identified various decoupling patterns from the central to peripheral areas of the GBA. These insights contribute to a more comprehensive exposition of green, low-carbon urban development, fostering harmonious and sustainable ecological environments within the GBA and laying a foundation for more targeted and effective policy interventions.
Author Contributions
Y.W.: conceptualization, writing—original draft preparation and editing, and methodology; Z.L.: data collection, formal analysis, and validation; Z.W.: revision, editing, and funding acquisition. All authors have read and agreed to the published version of the manuscript.
Funding
This research was funded by the National Natural Science Foundation of China (Grant No.61806059, 42001214), the Guangdong Province Science and Technology Plan Project (Grant No. 2023A1515011995), and the High-Resolution Earth Observation System of Systems Major Special Project for Integrated Government Management Application and Scaleup Industrialization Demonstration Project (Grant No. 21YJAZH009).
Data Availability Statement
The MODIS images are available from the National Aeronautics and Space Administration (NASA, https://ladsweb.modaps.eosdis.nasa.gov/search/ (accessed on 1 December 2021)), the nighttime light (NTL) data are available from the Yangtze River Delta Science Data Center, the National Earth System Science Data Sharing Infrastructure, National Science and Technology Infrastructure of China (http://geodata.nnu.edu.cn/ (accessed on 1 December 2022)), the NPP data are obtained from the literature [43], the socioeconomic data are available from the Resource and Environment Science and Data Center, Chinese Academy of Sciences (https://www.resdc.cn/ (accessed on 1 December 2022)), the DEM data are available from the Geospatial Data Cloud (http://www.gscloud.cn/ (accessed on 1 February 2022)), and the administrative district boundaries of prefecture-level cities and townships are available from the Resource and Environmental Science Data Platform (https://www.resdc.cn/, (accessed on 1 February 2022)).
Conflicts of Interest
The authors declare no conflicts of interest.
References
- Xu, X.Q.; Zhou, Y.X.; Ning, Y.M. Urban Geography; Higher Education Press: Beijing, China, 1997; p. 43. [Google Scholar]
- Zhang, L.; Yang, L.; Zohner, C.M.; Crowther, T.W.; Li, M.C.; Shen, F.X.; Guo, M.; Qin, J.; Yao, L.; Zhou, C.H. Direct and Indirect Impacts of Urbanization on Vegetation Growth across the World’s Cities. Sci. Adv. 2022, 8, eabo0095. [Google Scholar] [CrossRef] [PubMed]
- Li, D.L.; Wu, S.Y.; Liang, Z.; Li, S.C. The Impacts of Urbanization and Climate Change on Urban Vegetation Dynamics in China. Urban For. Urban Green. 2020, 54, 126764. [Google Scholar] [CrossRef]
- Liu, J.G.; Diamond, J. China’s Environment in a Globalizing World. Nature 2005, 435, 1179–1186. [Google Scholar] [CrossRef] [PubMed]
- Zhong, Q.Y.; Ma, J.; Zhao, B.; Wang, X.X.; Zong, J.M.; Xiao, X.M. Assessing Spatial-Temporal Dynamics of Urban Expansion, Vegetation Greenness and Photosynthesis in Megacity Shanghai, China during 2000–2016. Remote Sens. Environ. 2019, 233, 111374. [Google Scholar] [CrossRef]
- Li, G.Y.; Chen, S.S.; Yan, Y.; Yu, C. Effects of Urbanization on Vegetation Degradation in the Yangtze River Delta of China: Assessment Based on SPOT-VGT NDVI. J. Urban Plan. Dev. 2015, 141, 05014026. [Google Scholar] [CrossRef]
- Li, H.W.; Ding, J.H.; Zhang, J.; Yang, Z.N.; Yang, B.; Zhu, Q.A.; Peng, C.H. Effects of Land Cover Changes on Net Primary Productivity in the Terrestrial Ecosystems of China from 2001 to 2012. Land 2020, 9, 480. [Google Scholar] [CrossRef]
- Teng, M.J.; Zeng, L.X.; Hu, W.J.; Wang, P.C.; Yan, Z.G.; He, W.; Zhang, Y.; Huang, Z.L.; Xiao, W.F. The Impacts of Climate Changes and Human Activities on Net Primary Productivity Vary across an Ecotone Zone in Northwest China. Sci. Total Environ. 2020, 714, 136691. [Google Scholar] [CrossRef] [PubMed]
- Liu, Y.X.; Wang, Y.L.; Peng, J.; Du, Y.Y.; Liu, X.; Li, S.S.; Zhang, D.H. Correlations between Urbanization and Vegetation Degradation across the World’s Metropolises Using DMSP/OLS Nighttime Light Data. Remote Sens. 2015, 7, 2067–2088. [Google Scholar] [CrossRef]
- Qi, X.Z.; Jia, J.H.; Liu, H.Y.; Lin, Z.S. Relative Importance of Climate Change and Human Activities for Vegetation Changes on China’s Silk Road Economic Belt over Multiple Timescales. Catena 2019, 180, 224–237. [Google Scholar] [CrossRef]
- Zhu, C.M.; Zhang, X.L.; Zhou, M.M.; He, S.; Gan, M.Y.; Yang, L.X.; Wang, K. Impacts of Urbanization and Landscape Pattern on Habitat Quality Using OLS and GWR Models in Hangzhou, China. Ecol. Indic. 2020, 117, 106654. [Google Scholar] [CrossRef]
- Li, X.Y.; Li, Y.; Chen, A.P.; Gao, M.D.; Slette, I.J.; Piao, S.L. The Impact of the 2009/2010 Drought on Vegetation Growth and Terrestrial Carbon Balance in Southwest China. Agric. For. Meteorol. 2019, 269–270, 239–248. [Google Scholar] [CrossRef]
- Tong, S.Q.; Zhang, J.Q.; Ha, S.; Lai, Q.; Ma, Q.Y. Dynamics of Fractional Vegetation Coverage and Its Relationship with Climate and Human Activities in Inner Mongolia, China. Remote Sens. 2016, 8, 776. [Google Scholar] [CrossRef]
- Qian, S.; Cui, X.J.; Jiang, Y.Q. Interpretation of QX/T 494-2019, Grade of Monitoring and Evaluating for Terrestrial Vegetation Meteorology and Ecological Quality. Stand. Sci. 2022, 7, 91–110. [Google Scholar] [CrossRef]
- Feng, D.R.; Yang, C.; Fu, M.C.; Wang, J.M.; Zhang, M.; Sun, Y.Y.; Bao, W.K. Do Anthropogenic Factors Affect the Improvement of Vegetation Cover in Resource-Based Region? J. Clean. Prod. 2020, 271, 122705. [Google Scholar] [CrossRef]
- Zhou, Y.X.; Guan, Y.W.; Cao, Z.; Wu, Z.F.; Yu, F.Y. Direct and Indirect Impacts of Urbanization on Vegetation Growth in Guangdong Province. Acta Ecol. Sin. 2024, 44, 1–11. [Google Scholar]
- Wang, Y.A.; Kong, X.B.; Guo, K.; Zhao, C.J.; Zhao, J.T. Spatiotemporal Change in Vegetation Cover in the Yellow River Basin between 2000 and 2022 and Driving Forces Analysis. Front. Ecol. Evol. 2023, 11, 1261210. [Google Scholar] [CrossRef]
- Wu, J.Y.; Zhao, X.S.; Xi, Y.; Liu, H.; Li, C. Comprehensive Evaluation of Ecological Quality and Its Temporal and Spatial Changes in Tibet from 2008 to 2016 Based on MODIS. J. Geog. 2019, 74, 1438–1449. [Google Scholar]
- Li, C.; Li, X.M. Temporal and Spatial Variation Characteristics of Vegetation Ecological Quality in China from 2000 to 2018. Resour. Environ. Yangtze River Basin 2021, 30, 2155–2165. [Google Scholar]
- Qian, S.; Yan, H.; Wu, M.X.; Cao, Y.; Xu, L.L. Dynamic Monitoring and Evaluation Model for Spatio-Temporal Change of Comprehensive Ecological Quality of Vegetation. Acta Ecol. Sin. 2020, 18, 6573–6583. [Google Scholar]
- She, J.; She, L.; Shen, A.H.; Shi, Y.; Zhao, N.; Zhang, F.H.; He, H.Y.; Wu, T.; Li, H.X.; Ma, Y.T.; et al. Spatiotemporal Changes and Driving Force Analysis of Vegetation Cover in the Urban Belt along the Yellow River in Ningxia. Environ. Sci. 2024, 45, 1–28. [Google Scholar]
- Mo, J.F.; Zhou, X.; Mo, W.; Chen, Y.L. Analysis of Vegetation Ecological Quality Change and Its Driving Forces in Guangxi from 2000 to 2020. Guihaia 2024, 44, 907–924. [Google Scholar]
- Ji, Y.H.; Zhou, G.S.; Wang, S.D.; Zhou, L.X.; Zhou, M.Z. Evolutionary Characteristics and Its Driving Forces Analysis of Vegetation Ecological Quality in Qinling Mountains Region from 2000 to 2019. Chin. J. Plant Ecol. 2021, 46, 617–625. [Google Scholar] [CrossRef]
- Cao, Y.; Sun, Y.L.; Chen, Z.X.; Yan, H.; Qian, S. Dynamic Changes of Vegetation Ecological Quality in the Yellow River Basin and Its Response to Extreme Climate during 2000–2020. Acta Ecol. Sin. 2022, 42, 4524–4535. [Google Scholar]
- Wu, Y.Y.; Wu, Z.F. NPP Variability Associated with Natural and Anthropogenic Factors in the Tropic of Cancer Transect, China. Remote Sens. 2023, 15, 1091. [Google Scholar] [CrossRef]
- Ge, W.Y.; Deng, L.Q.; Wang, F.; Han, J.Q. Quantifying the Contributions of Human Activities and Climate Change to Vegetation Net Primary Productivity Dynamics in China from 2001 to 2016. Sci. Total Environ. 2021, 773, 145648. [Google Scholar] [CrossRef] [PubMed]
- Huang, B.Y.; Li, Z.J.; Dong, C.C.; Zhu, Z.C.; Zeng, H. The Effects of Urbanization on Vegetation Conditions in Coastal Zone of China. Prog. Phys. Geogr. Earth Environ. 2021, 45, 564–579. [Google Scholar] [CrossRef]
- Li, J.; Wang, Z.; Lai, C. Severe Drought Events Inducing Large Decrease of Net Primary Productivity in Mainland China during 1982–2015. Sci. Total Environ. 2020, 703, 135541. [Google Scholar] [CrossRef] [PubMed]
- Caviglia-Harris, J.L.; Chambers, D.; Kahn, J.R. Taking the “U” out of Kuznets: A Comprehensive Analysis of the EKC and Environmental Degradation. Ecol. Econ. 2009, 68, 1149–1159. [Google Scholar] [CrossRef]
- Huang, J.C.; Fang, C.L. Analysis of Coupling Mechanism and Rules between Urbanization and Eco-Environment. Geogr. Res. 2003, 22, 211–220. [Google Scholar] [CrossRef]
- Wu, J.J.; Weber, B.A.; Partridge, M.D. Rural-Urban Interdependence: A Framework Integrating Regional, Urban, and Environmental Economic Insights. Am. J. Agric. Econ. 2017, 99, 464–480. [Google Scholar] [CrossRef]
- Scheef, L.; Manka, C.; Urbach, H. Population Explosion, Resource Extraction and Its Impact on the Urban Environment: A Case Study of Kolkata Metropolitan Area. Magn. Reson. 2013, 5, 557–566. [Google Scholar]
- Zhang, Y.; Yang, Q.S. Diagnostic Methods for the Coupling Relationship between Urbanization Eco-Environment from the Perspective of Well-Being. Econ. Geogr. 2014, 34, 166–170. [Google Scholar]
- Cocklin, C.; Keen, M. Urbanization in the Pacific: Environmental Change, Vulnerability and Human Security. Environ. Conserv. 2000, 27, 392–403. [Google Scholar] [CrossRef]
- Li, Y.F.; Li, Y.; Zhou, Y.; Shi, Y.L.; Zhu, X.D. Investigation of a Coupling Model of Coordination between Urbanization and the Environment. J. Environ. Manag. 2012, 98, 127–133. [Google Scholar] [CrossRef] [PubMed]
- Kalmykova, Y.; Rosado, L.; Patrício, J. Urban Economies Resource Productivity and Decoupling: Metabolism Trends of 1996–2011 in Sweden, Stockholm, and Gothenburg. Environ. Sci. Technol. 2015, 49, 8815–8823. [Google Scholar] [CrossRef] [PubMed]
- Li, H.X.; Xu, H.; Zhao, L.T.; Li, T.W.; Ge, C.Z. Empirical Research of Coupling Mechanism between Urbanization and Resources and the Environment in China. Ecol. Econ. 2016, 32, 31–33. [Google Scholar]
- Tapio, P. Towards a Theory of Decoupling: Degrees of Decoupling in the EU and the Case of Road Traffic in Finland between 1970 and 2001. Transp. Policy 2005, 12, 137–151. [Google Scholar] [CrossRef]
- Li, X.C.; Luo, Y.H.; Wu, J.S. Decoupling Relationship between Urbanization and Carbon Sequestration in the Pearl River Delta from 2000 to 2020. Remote Sens. 2022, 14, 526. [Google Scholar] [CrossRef]
- Zheng, Z.H.; Wu, Z.F.; Chen, Y.B.; Yang, Z.W.; Marinello, F. Exploration of Eco-Environment and Urbanization Changes in Coastal Zones: A Case Study in China over the Past 20 Years. Ecol. Indic. 2020, 119, 106847. [Google Scholar] [CrossRef]
- Deng, X.D.; Gao, F.; Liao, S.Y.; Liu, Y.; Chen, W.Y. Spatiotemporal Evolution Patterns of Urban Heat Island and Its Relationship with Urbanization in Guangdong-Hong Kong-Macao Greater Bay Area of China from 2000 to 2020. Ecol. Indic. 2023, 146, 109817. [Google Scholar] [CrossRef]
- Li, L.; Chan, P.W.; Deng, T.; Yang, H.L.; Luo, H.Y.; Xia, D.; He, Y.Q. Review of Advances in Urban Climate Study in the Guangdong-Hong Kong-Macau Greater Bay Area, China. Atmos. Res. 2021, 261, 105759. [Google Scholar] [CrossRef]
- Wu, Y.Y.; Luo, Z.H.; Wu, Z.F. The Different Impacts of Climate Variability and Human Activities on NPP in the Guangdong–Hong Kong–Macao Greater Bay Area. Remote Sens. 2022, 14, 2929. [Google Scholar] [CrossRef]
- Liu, W.; Zhan, J.Y.; Zhao, F.; Yan, H.M.; Zhang, F.; Wei, X.Q. Impacts of Urbanization-Induced Land-Use Changes on Ecosystem Services: A Case Study of the Pearl River Delta Metropolitan Region, China. Ecol. Indic. 2019, 98, 228–238. [Google Scholar] [CrossRef]
- Wang, X.G.; Yan, F.Q.; Su, F.Z. Impacts of Urbanization on the Ecosystem Services in the Guangdong-Hong Kong-Macao Greater Bay Area, China. Remote Sens. 2020, 12, 3269. [Google Scholar] [CrossRef]
- Zhao, J.C.; Zhang, S.H.; Yin, X.X.; Zhu, Y.P.; Duan, G.H. Changes in Vegetation Coverage and Its Influencing Factors across the Guangdong-Hong Kong-Macao Greater Bay Area. Sci. Surv. Map 2022, 47, 75–84. [Google Scholar]
- Deng, H.J.; Li, H.K. Characteristics of the Spatiotemporal Changes in Urban Agglomeration in the Guangdong-Hong Kong-Macao Greater Bay Area, China. J. Urban Plan. Dev. 2021, 147, 04021042. [Google Scholar] [CrossRef]
- Haq, M.A.; Baral, P.; Yaragal, S.; Rahaman, G. Assessment of Trends of Land Surface Vegetation Distribution, Snow Cover and Temperature over Entire Himachal Pradesh Using MODIS Datasets. Nat. Resour. Model. 2020, 33, e12262. [Google Scholar] [CrossRef]
- Huete, A.; Didan, K.; Miura, T.; Rodriguez, E.P.; Gao, X.; Ferreira, L.G. Overview of the Radiometric and Biophysical Performance of the MODIS Vegetation Indices. Remote Sens. Environ. 2002, 83, 195–213. [Google Scholar] [CrossRef]
- Li, H.L.; Peng, J.; Liu, Y.X.; Hu, Y.N. Urbanization Impact on Landscape Patterns in Beijing City, China: A Spatial Heterogeneity Perspective. Ecol. Indic. 2017, 82, 50–60. [Google Scholar] [CrossRef]
- Wang, J.F.; Zhang, T.L.; Fu, B.J. A Measure of Spatial Stratified Heterogeneity. Ecol. Indic. 2016, 67, 250–256. [Google Scholar] [CrossRef]
- Kendall, M.G. Rank Correlation Methods; Griffin: London, UK, 1975. [Google Scholar]
- Neeti, N.; Eastman, J.R. A Contextual Mann-Kendall Approach for the Assessment of Trend Significance in Image Time Series. Trans. GIS 2011, 15, 599–611. [Google Scholar] [CrossRef]
- Liu, Y.B.; Li, R.D.; Song, X.F. Analysis of Coupling Degrees of Urbanization and Ecological Environment in China. J. Nat. Resour. 2005, 20, 105–112. [Google Scholar]
- Yang, L.J.; Zhang, X.H.; Pan, J.H.; Yang, Y.C. Coupling Coordination and Interaction between Urbanization and Eco-Environment in Cheng-Yu Urban Agglomeration, China. Chin. J. Appl. Ecol. 2021, 32, 993–1004. [Google Scholar]
- Shen, M.T.; Tan, B.X.; Hou, R.X.; Huang, Y.F. A Dataset of Spatial-Temporal Changes of Vegetation Coverage with a Spatial Resolution of 30 m in the Pearl River Delta from 2000 to 2020. Chin. Sci. Data 2023, 8, 1–13. [Google Scholar]
- Hu, M.M.; Xia, B.C. A Significant Increase in the Normalized Difference Vegetation Index during the Rapid Economic Development in the Pearl River Delta of China. Land Degrad. Dev. 2019, 30, 359–370. [Google Scholar] [CrossRef]
- Chang, Y.Y.; Zhang, G.L.; Zhang, T.Z.; Xie, Z.; Wang, J.X. Vegetation Dynamics and Their Response to the Urbanization of the Beijing–Tianjin–Hebei Region, China. Sustainability 2020, 12, 8550. [Google Scholar] [CrossRef]
- Chen, S.Y.; Ji, L.Y.; Li, K.X.; Zhang, P.; Tang, H.R. The Spatio-Temporal Variation of Vegetation and Its Driving Factors during the Recent 20 Years in Beijing. Remote Sens. 2024, 16, 851. [Google Scholar] [CrossRef]
- Chen, M.F.; Liu, F.; Zhao, Y.L.; Yang, G. The Expansion and Gradient Evolution of Impervious Surface within the Guangdong-Hong Kong-Macao Greater Bay Area from 1987 to 2017. J. Geo-Inf. Sci. 2021, 23, 443–455. [Google Scholar] [CrossRef]
- Zhang, J.; Yu, L.; Li, X.C.; Zhang, C.C.; Shi, T.Z.; Wu, X.Y.; Yang, C.; Gao, W.X.; Li, Q.; Wu, G. Exploring Annual Urban Expansions in the Guangdong-Hong Kong-Macau Greater Bay Area: Spatiotemporal Features and Driving Factors in 1986–2017. Remote Sens. 2020, 12, 2615. [Google Scholar] [CrossRef]
- Wang, Z.B.; Liang, L.W.; Sun, Z.; Wang, X.M. Spatiotemporal Differentiation and the Factors Influencing Urbanization and Ecological Environment Synergistic Effects within the Beijing-Tianjin-Hebei Urban Agglomeration. J. Environ. Manag. 2019, 243, 227–239. [Google Scholar] [CrossRef]
- Dobbs, C.; Nitschke, C.; Kendal, D. Assessing the Drivers Shaping Global Patterns of Urban Vegetation Landscape Structure. Sci. Total Environ. 2017, 592, 171–177. [Google Scholar] [CrossRef] [PubMed]
- Wen, X.D.; Luo, Z.H.; Fu, L.G. Effects of Climate and Land Use Change on NPP in Guang Dong-Hong Kong-Macao Greater Bay Area. Guangzi Sci. 2021, 28, 290–300. [Google Scholar]
- Kalnay, E.; Cai, M. Impact of Urbanization and Land-Use Change on Climate. Nature 2003, 423, 528–531. [Google Scholar] [CrossRef] [PubMed]
- Wang, Y.T.; Liang, J.C.; Zheng, Z.F.; Li, Q.C.; Dou, Y.J. Characteristics of Spatial and Temporal Evolution and Investigation of Air Pollution in Guangdong-Hong Kong-Macao Greater Bay Area Based on Ground-Space Observation Data. Environ. Sci. 2020, 41, 2075–2086. [Google Scholar] [CrossRef]
- Xu, Q.; Yang, R.; Dong, Y.X.; Liu, Y.X.; Qiu, L.R. The Influence of Rapid Urbanization and Land Use Changes on Terrestrial Carbon Sources/Sinks in Guangzhou, China. Ecol. Indic. 2016, 70, 304–316. [Google Scholar] [CrossRef]
- Narducci, J.; Quintas-Soriano, C.; Castro, A.; Som-Castellano, R.; Brandt, J.S. Implications of Urban Growth and Farmland Loss for Ecosystem Services in the Western United States. Land Use Policy 2019, 86, 1–11. [Google Scholar] [CrossRef]
- Wang, D.D.; Qin, W.; Jia, G.D.; Shan, Z.J.; Hao, M. Assessing the Effects of Climate Variability and Vegetation Conversion on Variations of Net Primary Productivity in the Mountainous Area of North China. For. Ecol. Manag. 2022, 506, 119957. [Google Scholar] [CrossRef]
- Qu, S.; Wang, L.C.; Lin, A.W.; Yu, D.Q.; Yuan, M.X.; Li, C.A. Distinguishing the Impacts of Climate Change and Anthropogenic Factors on Vegetation Dynamics in the Yangtze River Basin, China. Ecol. Indic. 2020, 108, 105724. [Google Scholar] [CrossRef]
- Chen, T.Q.; Feng, Z.; Zhao, H.F.; Wu, K.N. Identification of Ecosystem Service Bundles and Driving Factors in Beijing and Its Surrounding Areas. Sci. Total Environ. 2020, 711, 134687. [Google Scholar] [CrossRef]
- Wang, S.; Adhikari, K.; Zhuang, Q.L.; Gu, H.L.; Jin, X.X. Impacts of Urbanization on Soil Organic Carbon Stocks in the Northeast Coastal Agricultural Areas of China. Sci. Total Environ. 2020, 721, 137814. [Google Scholar] [CrossRef]
- Li, G.D.; Sun, S.A.; Fang, C.L. The Varying Driving Forces of Urban Expansion in China: Insights from a Spatial-Temporal Analysis. Landsc. Urban Plan. 2018, 174, 63–77. [Google Scholar] [CrossRef]
- Fang, C.L.; Li, G.D.; Wang, S.J. Changing and Differentiated Urban Landscape in China: Spatiotemporal Patterns and Driving Forces. Environ. Sci. Technol. 2016, 50, 2217–2227. [Google Scholar] [CrossRef] [PubMed]
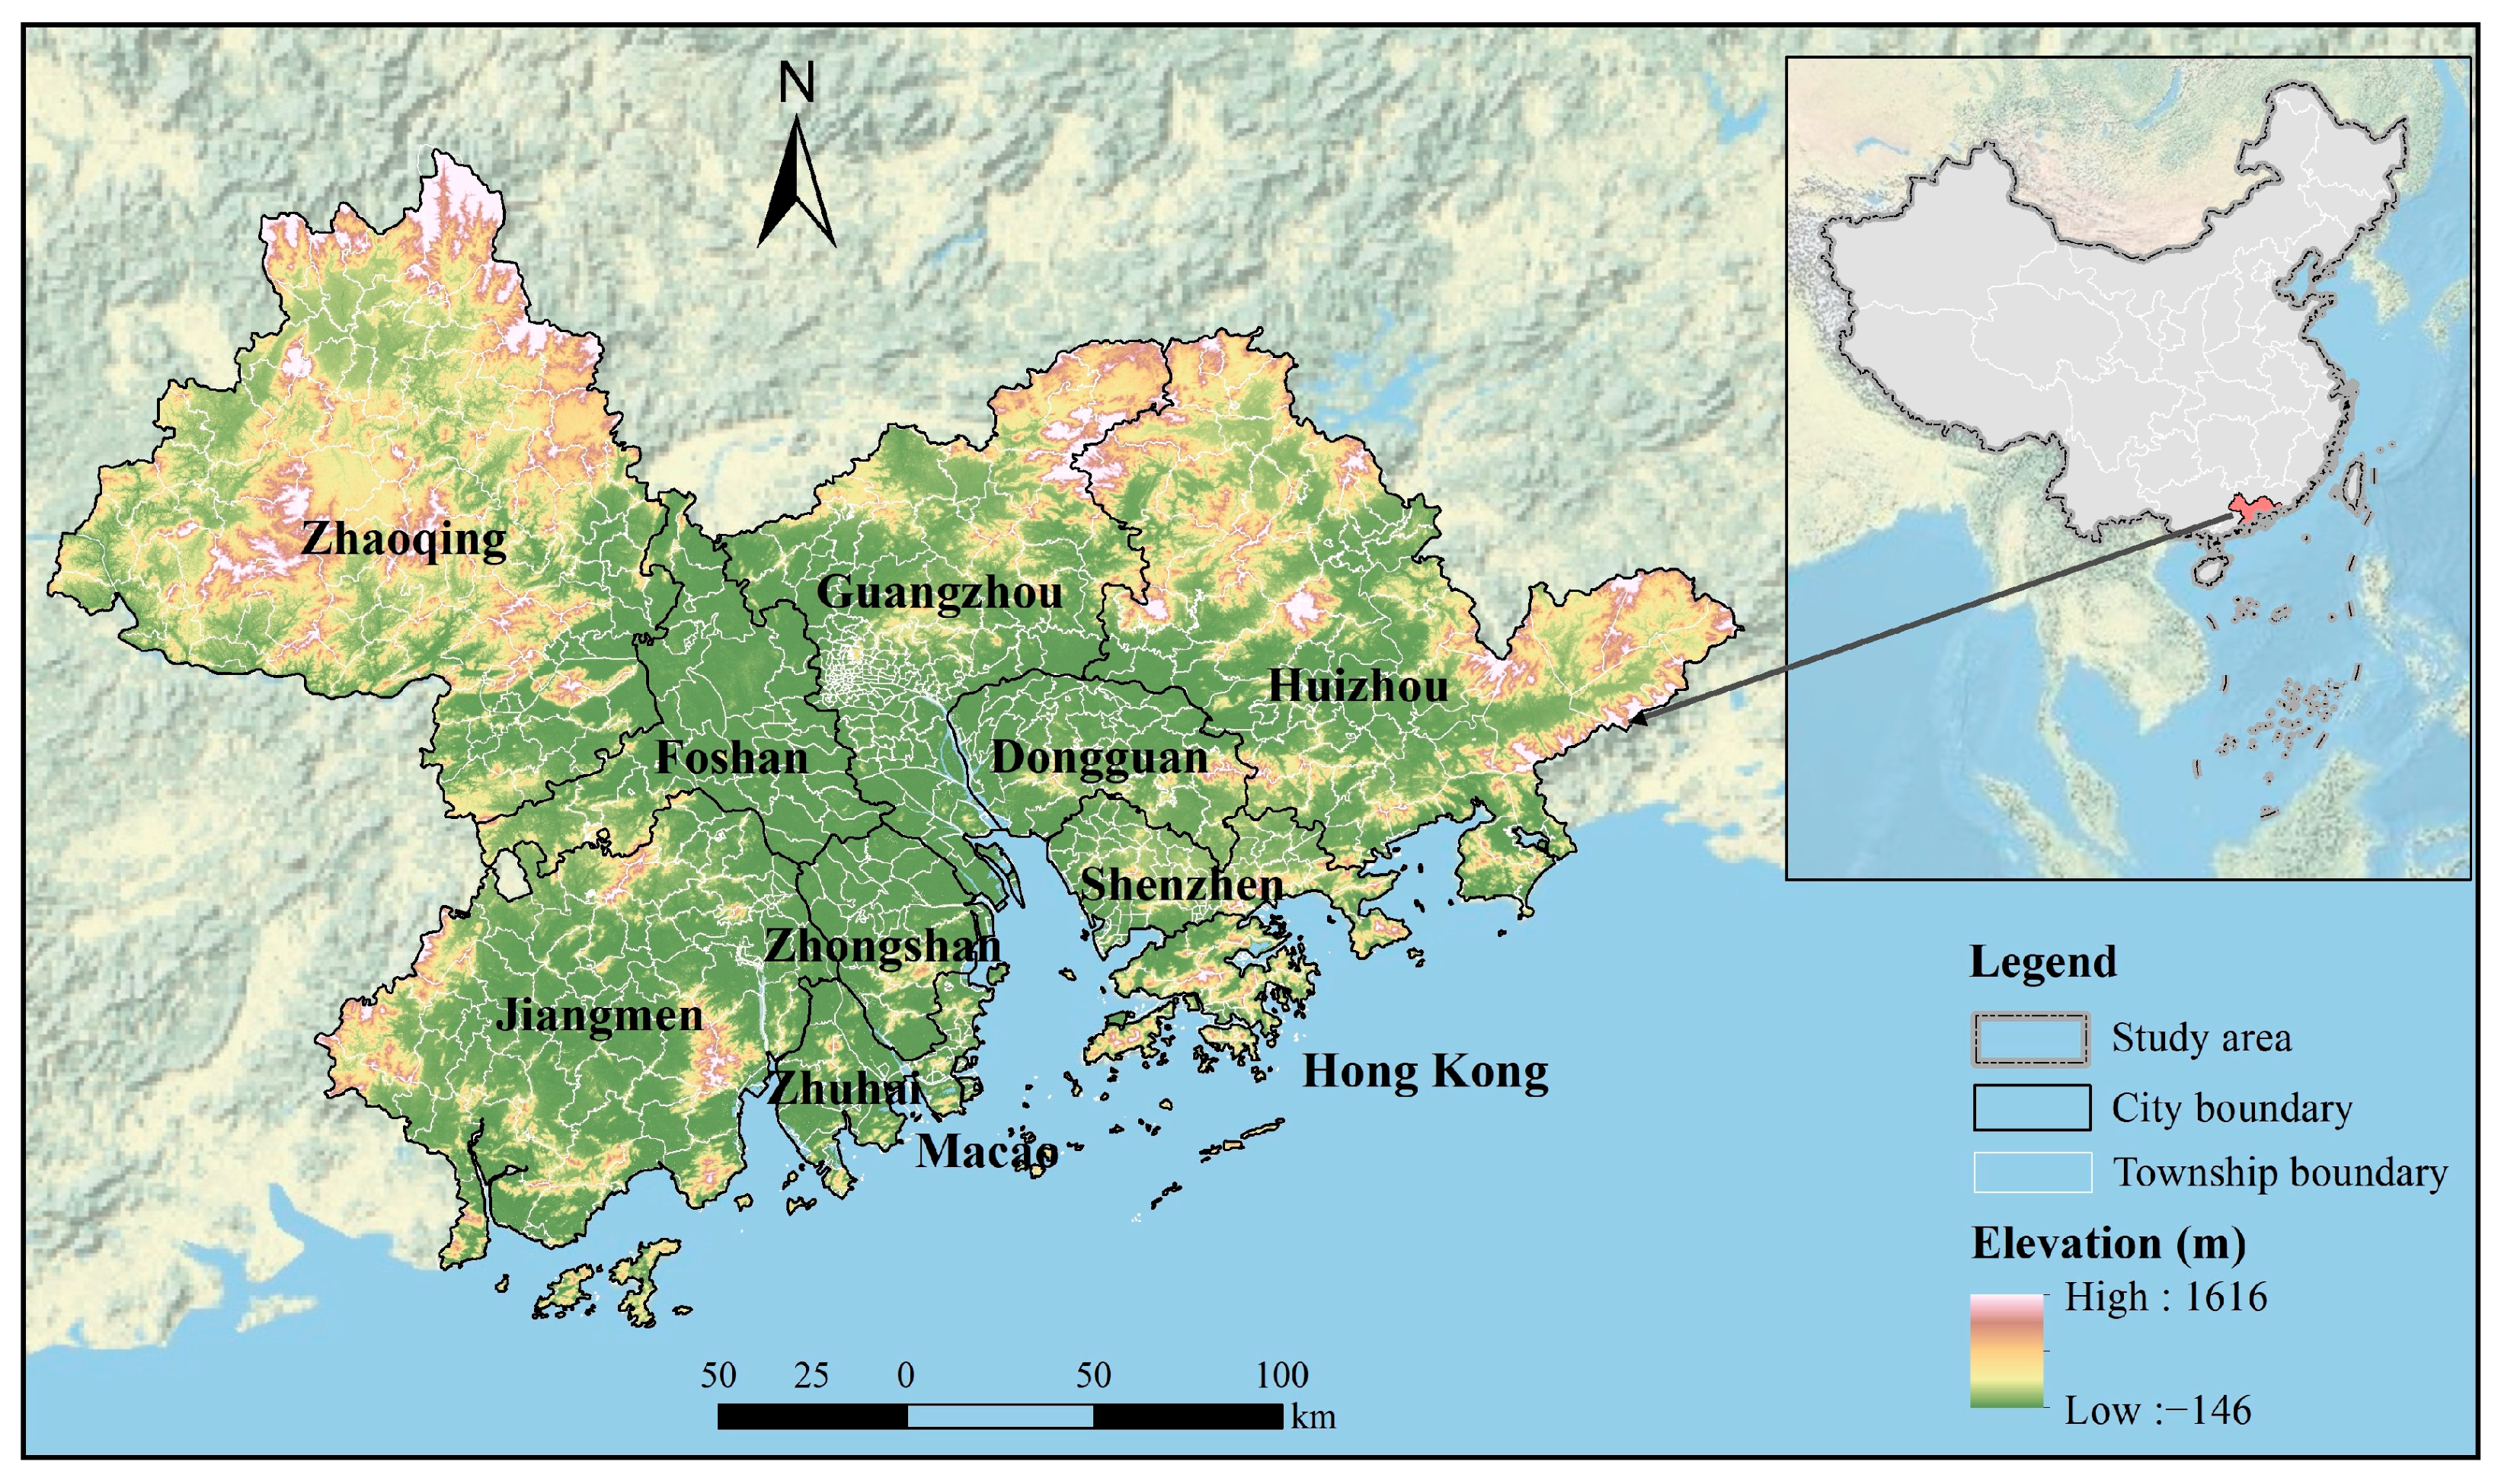
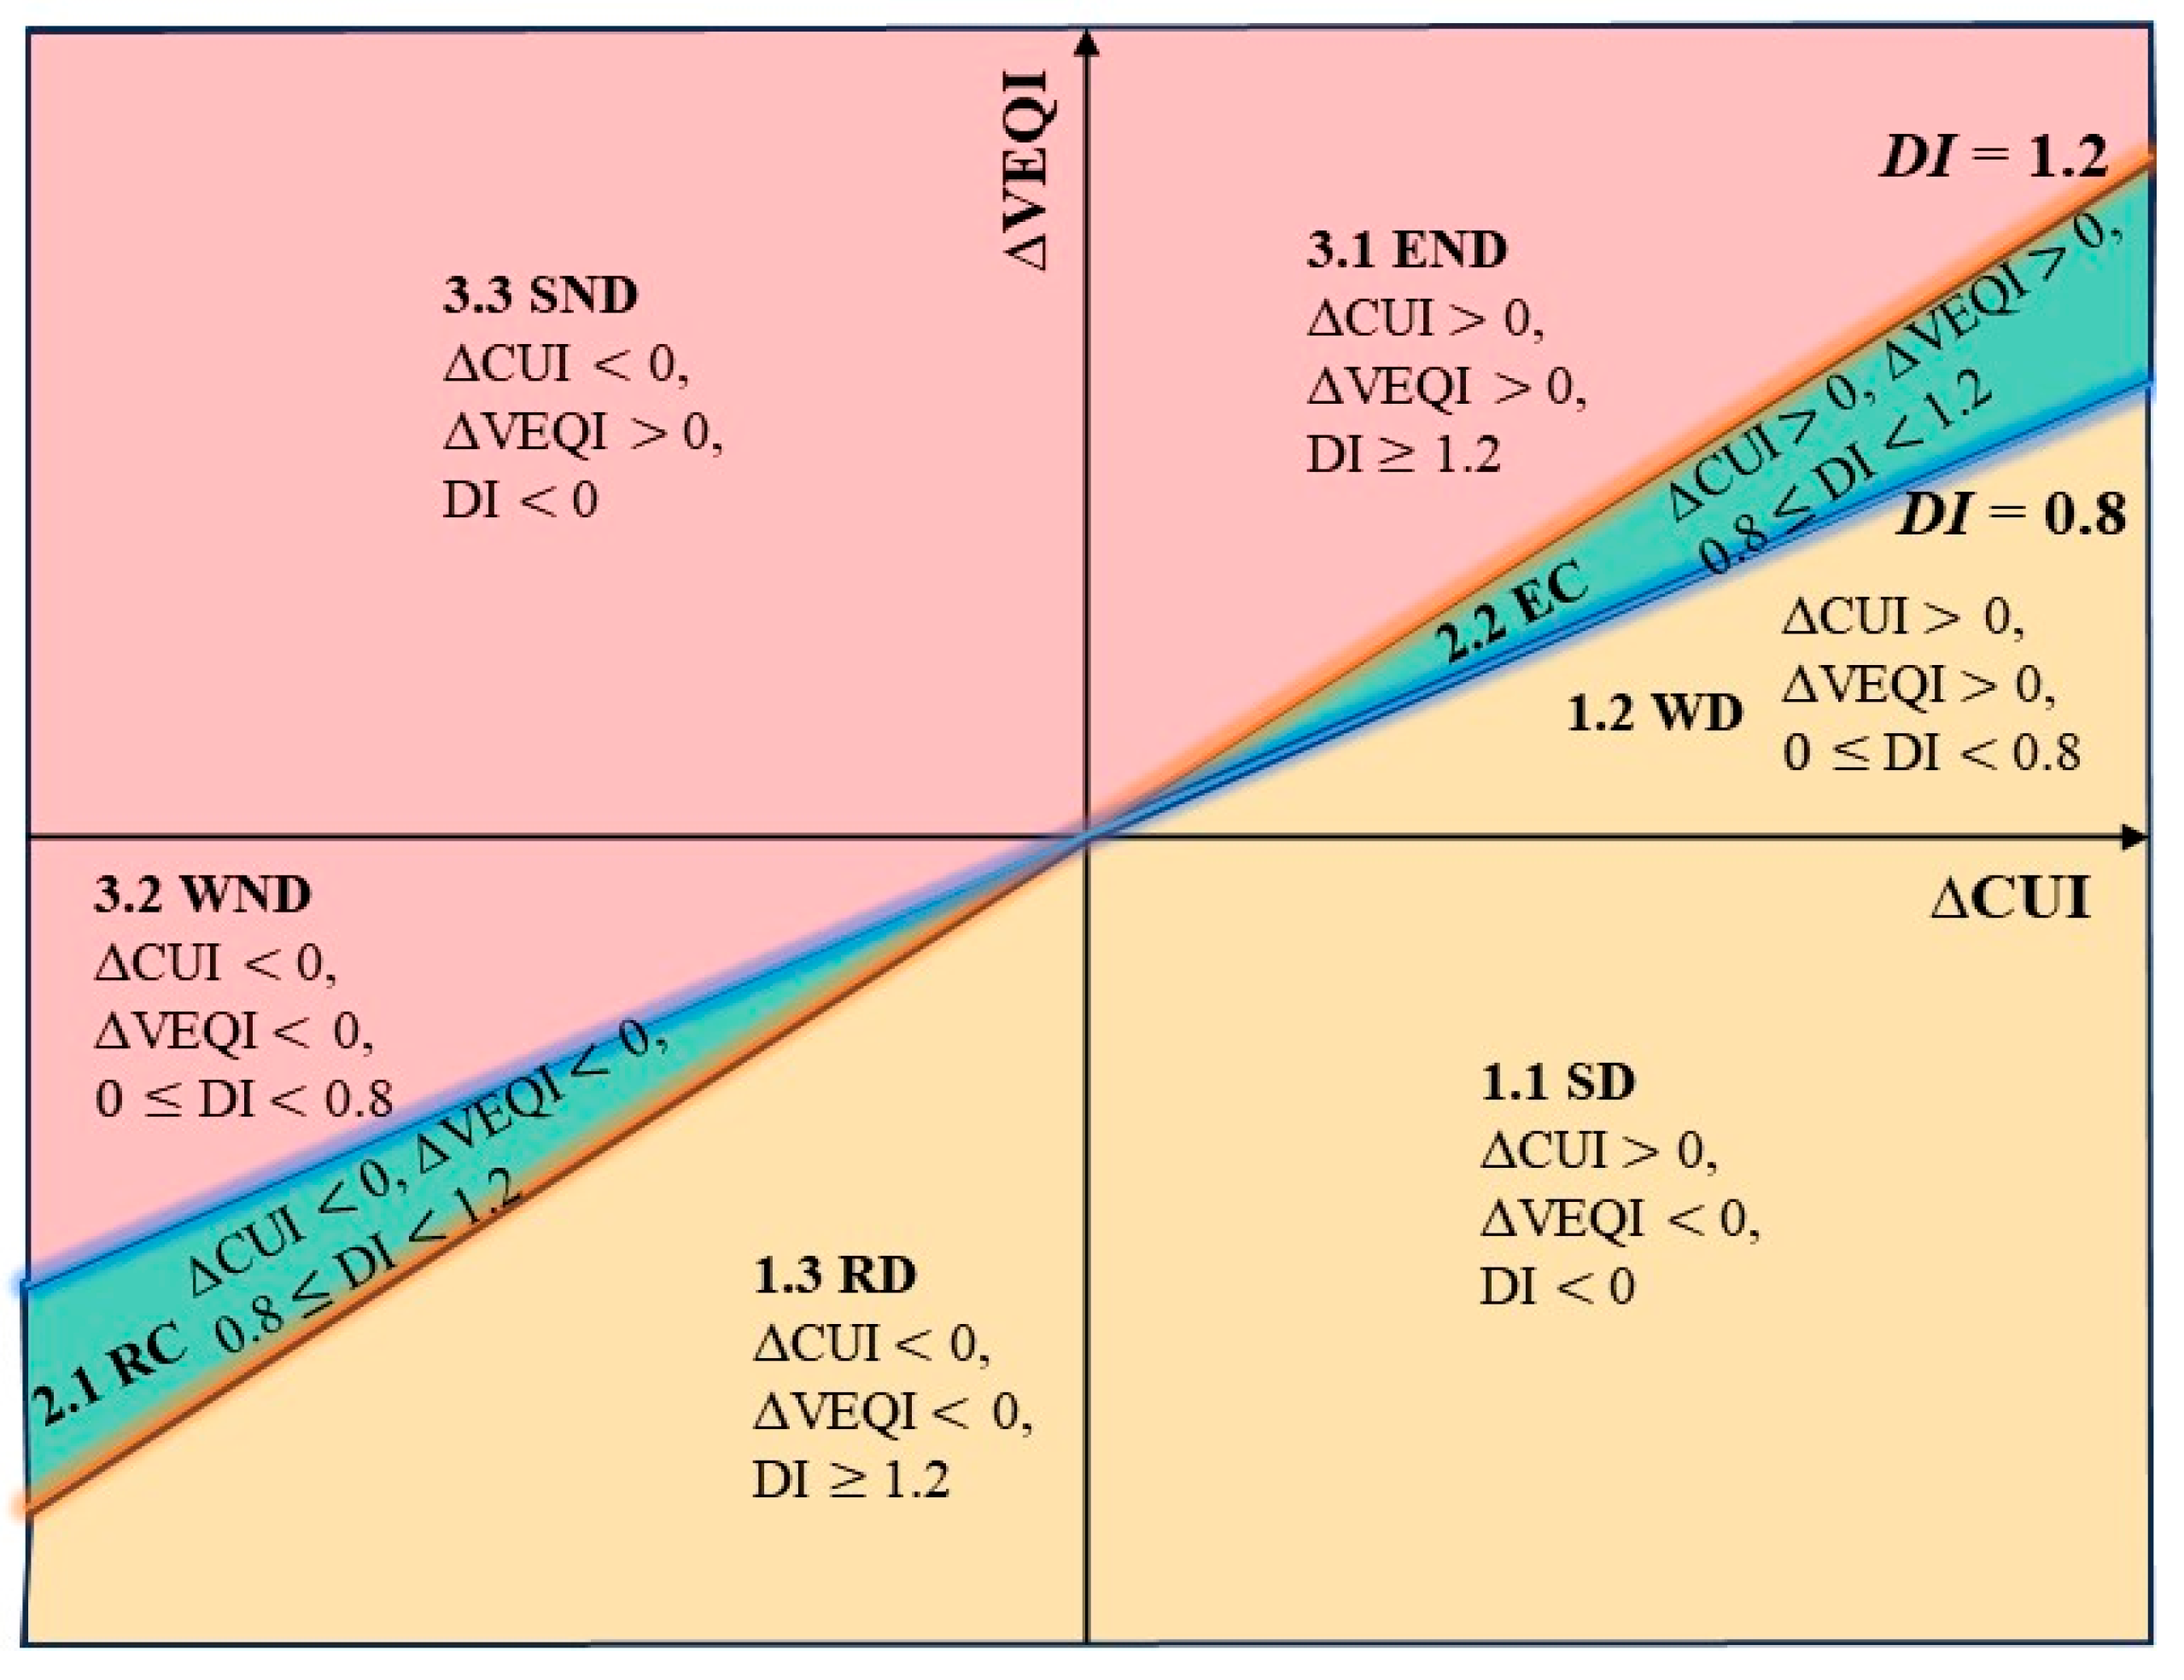
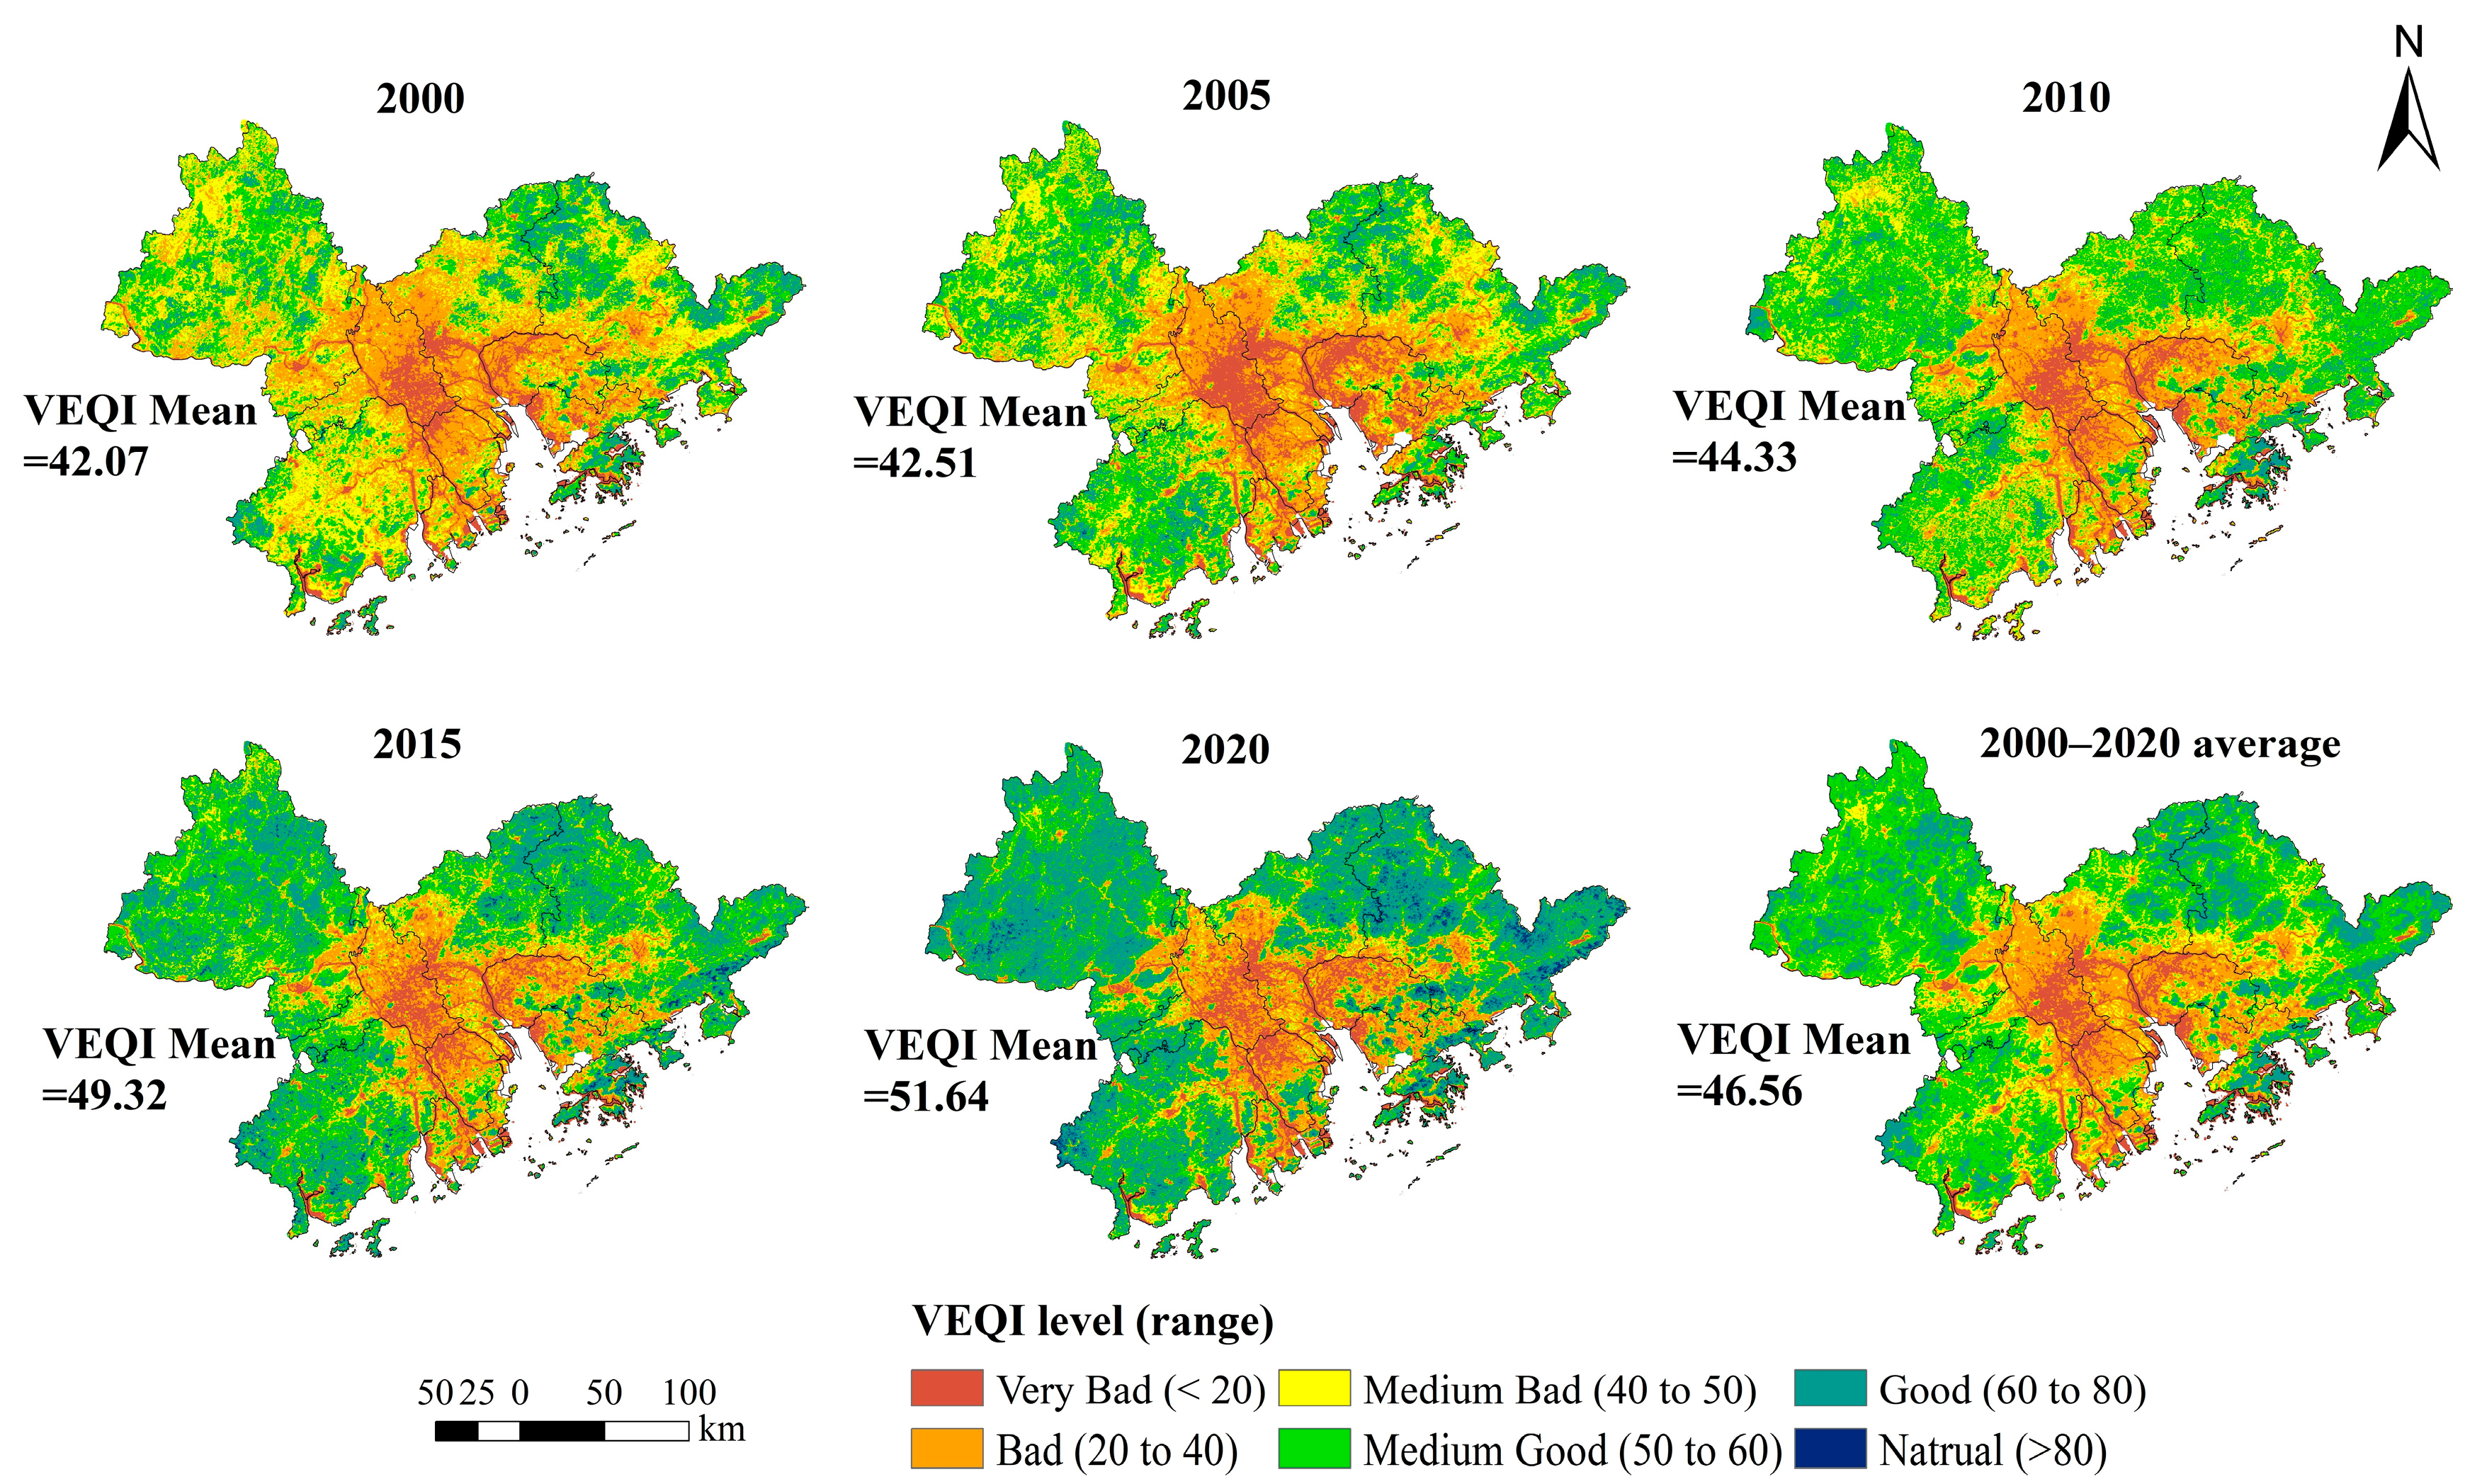
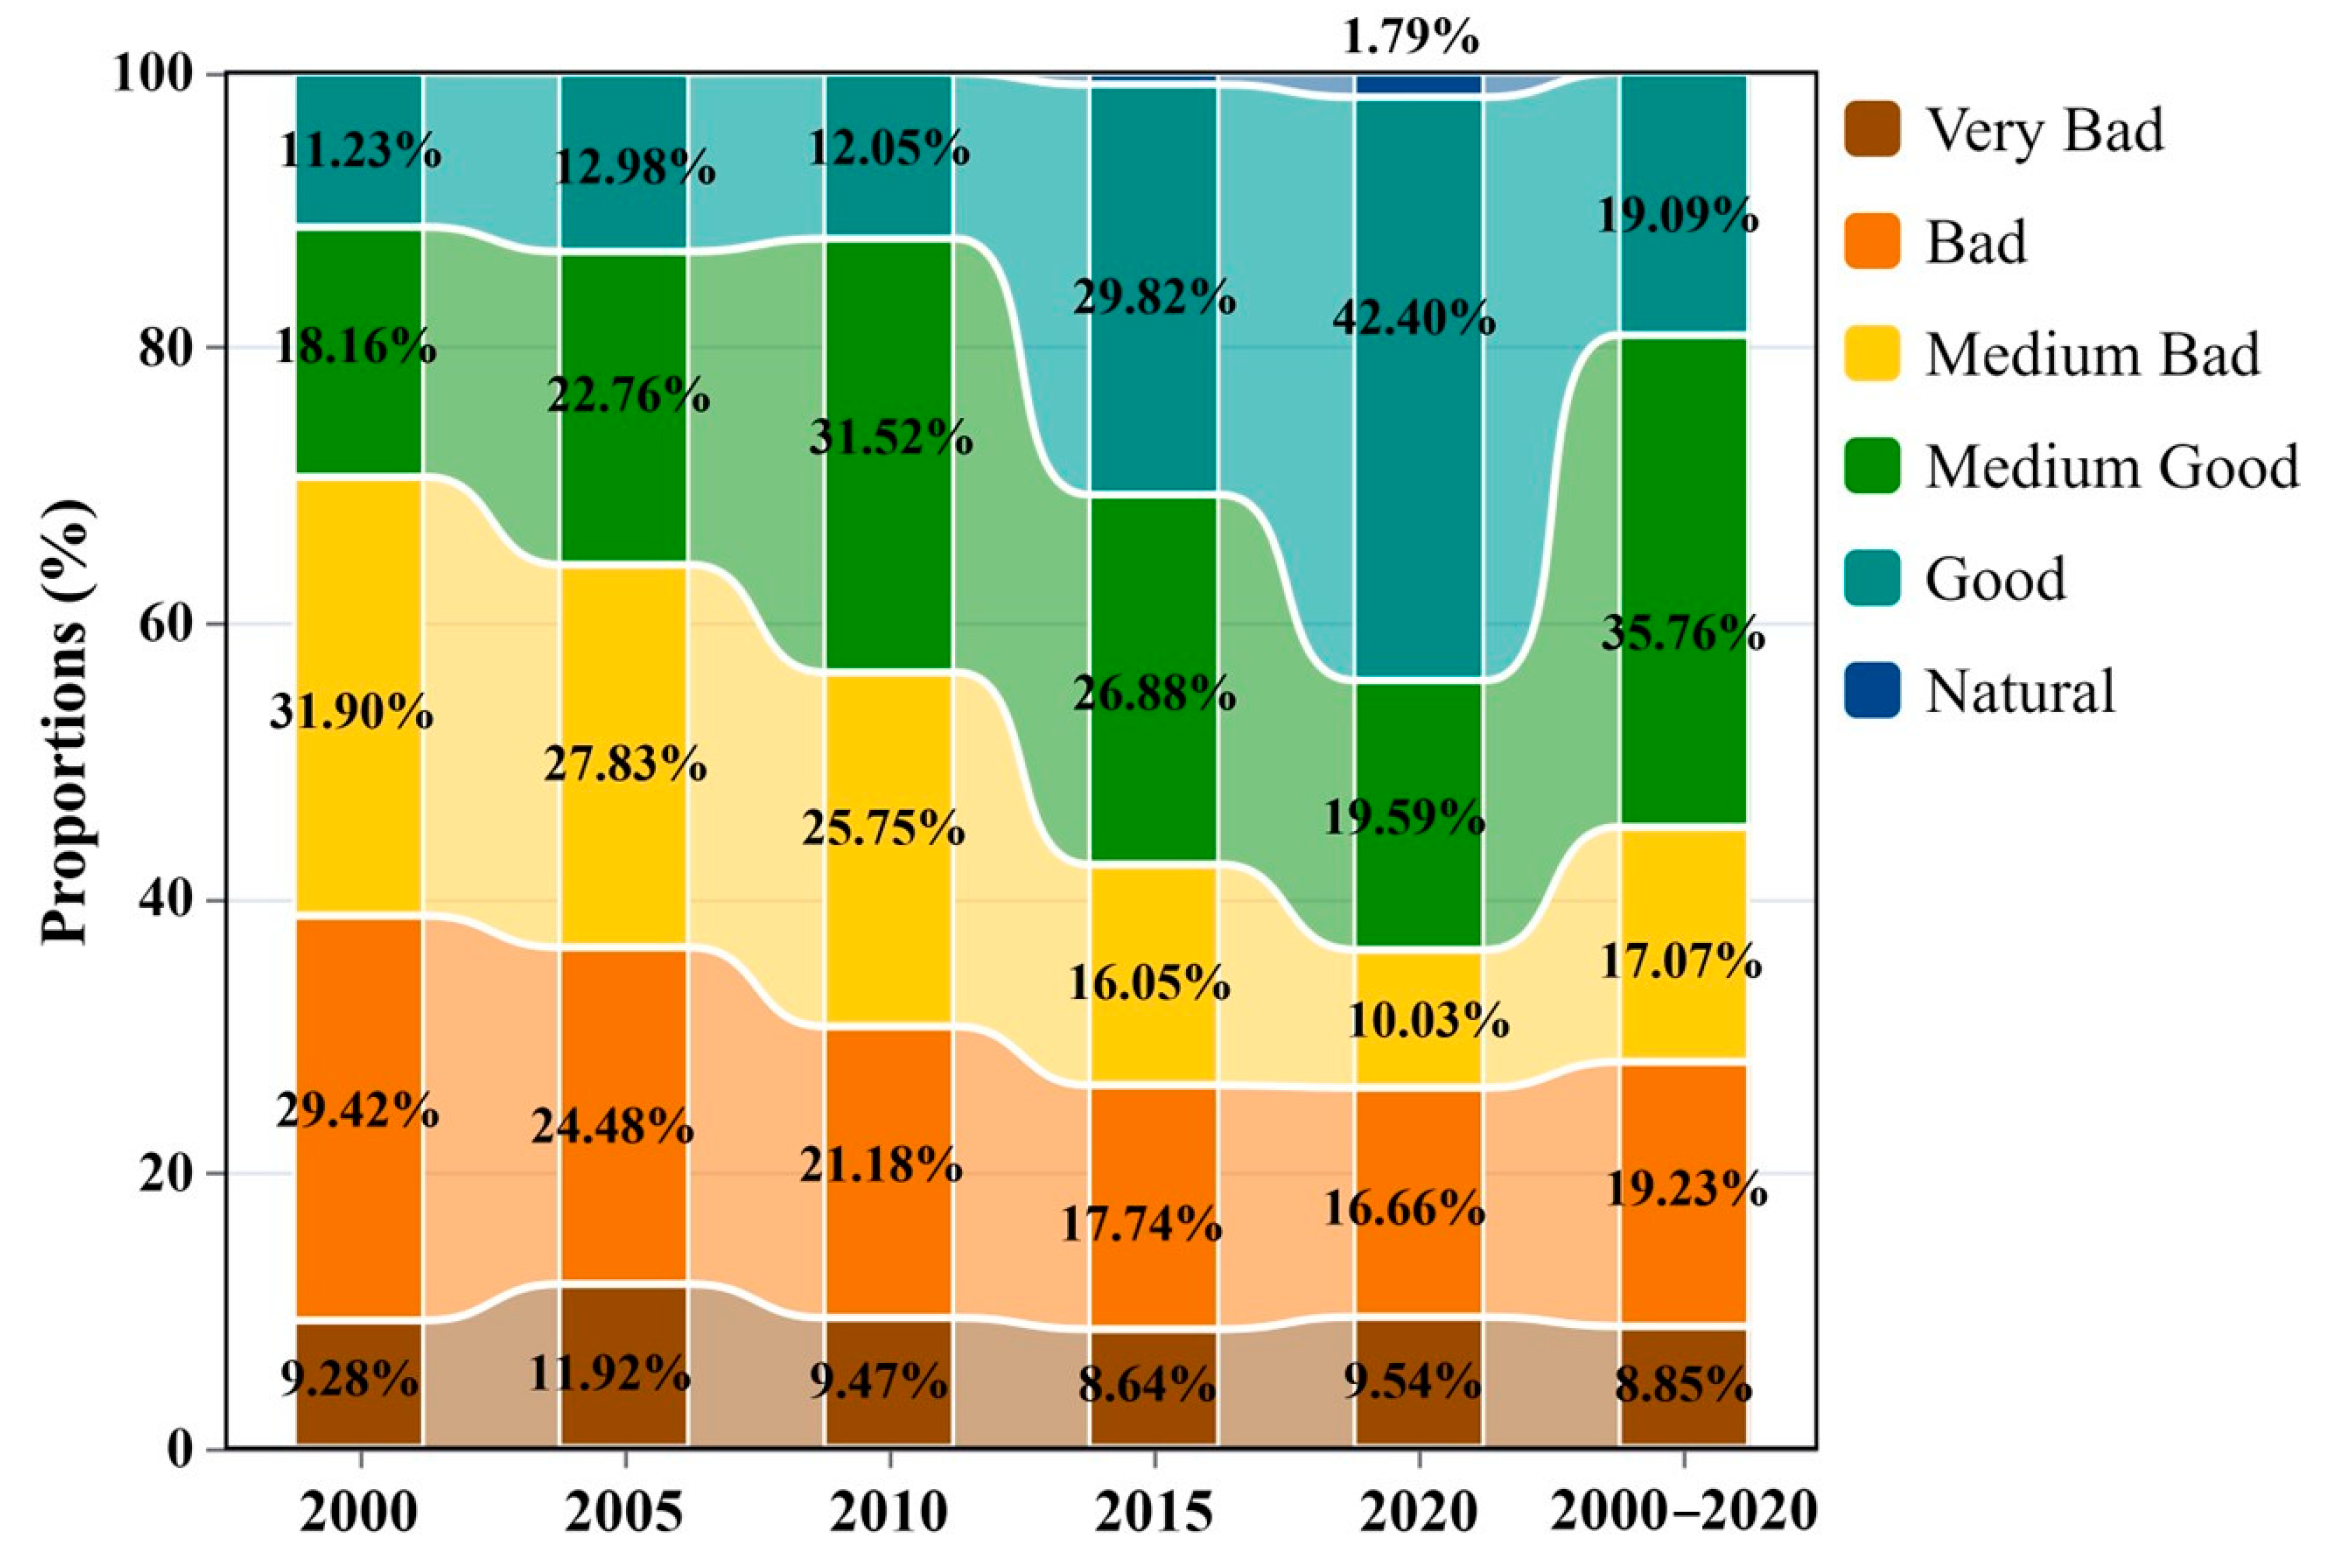


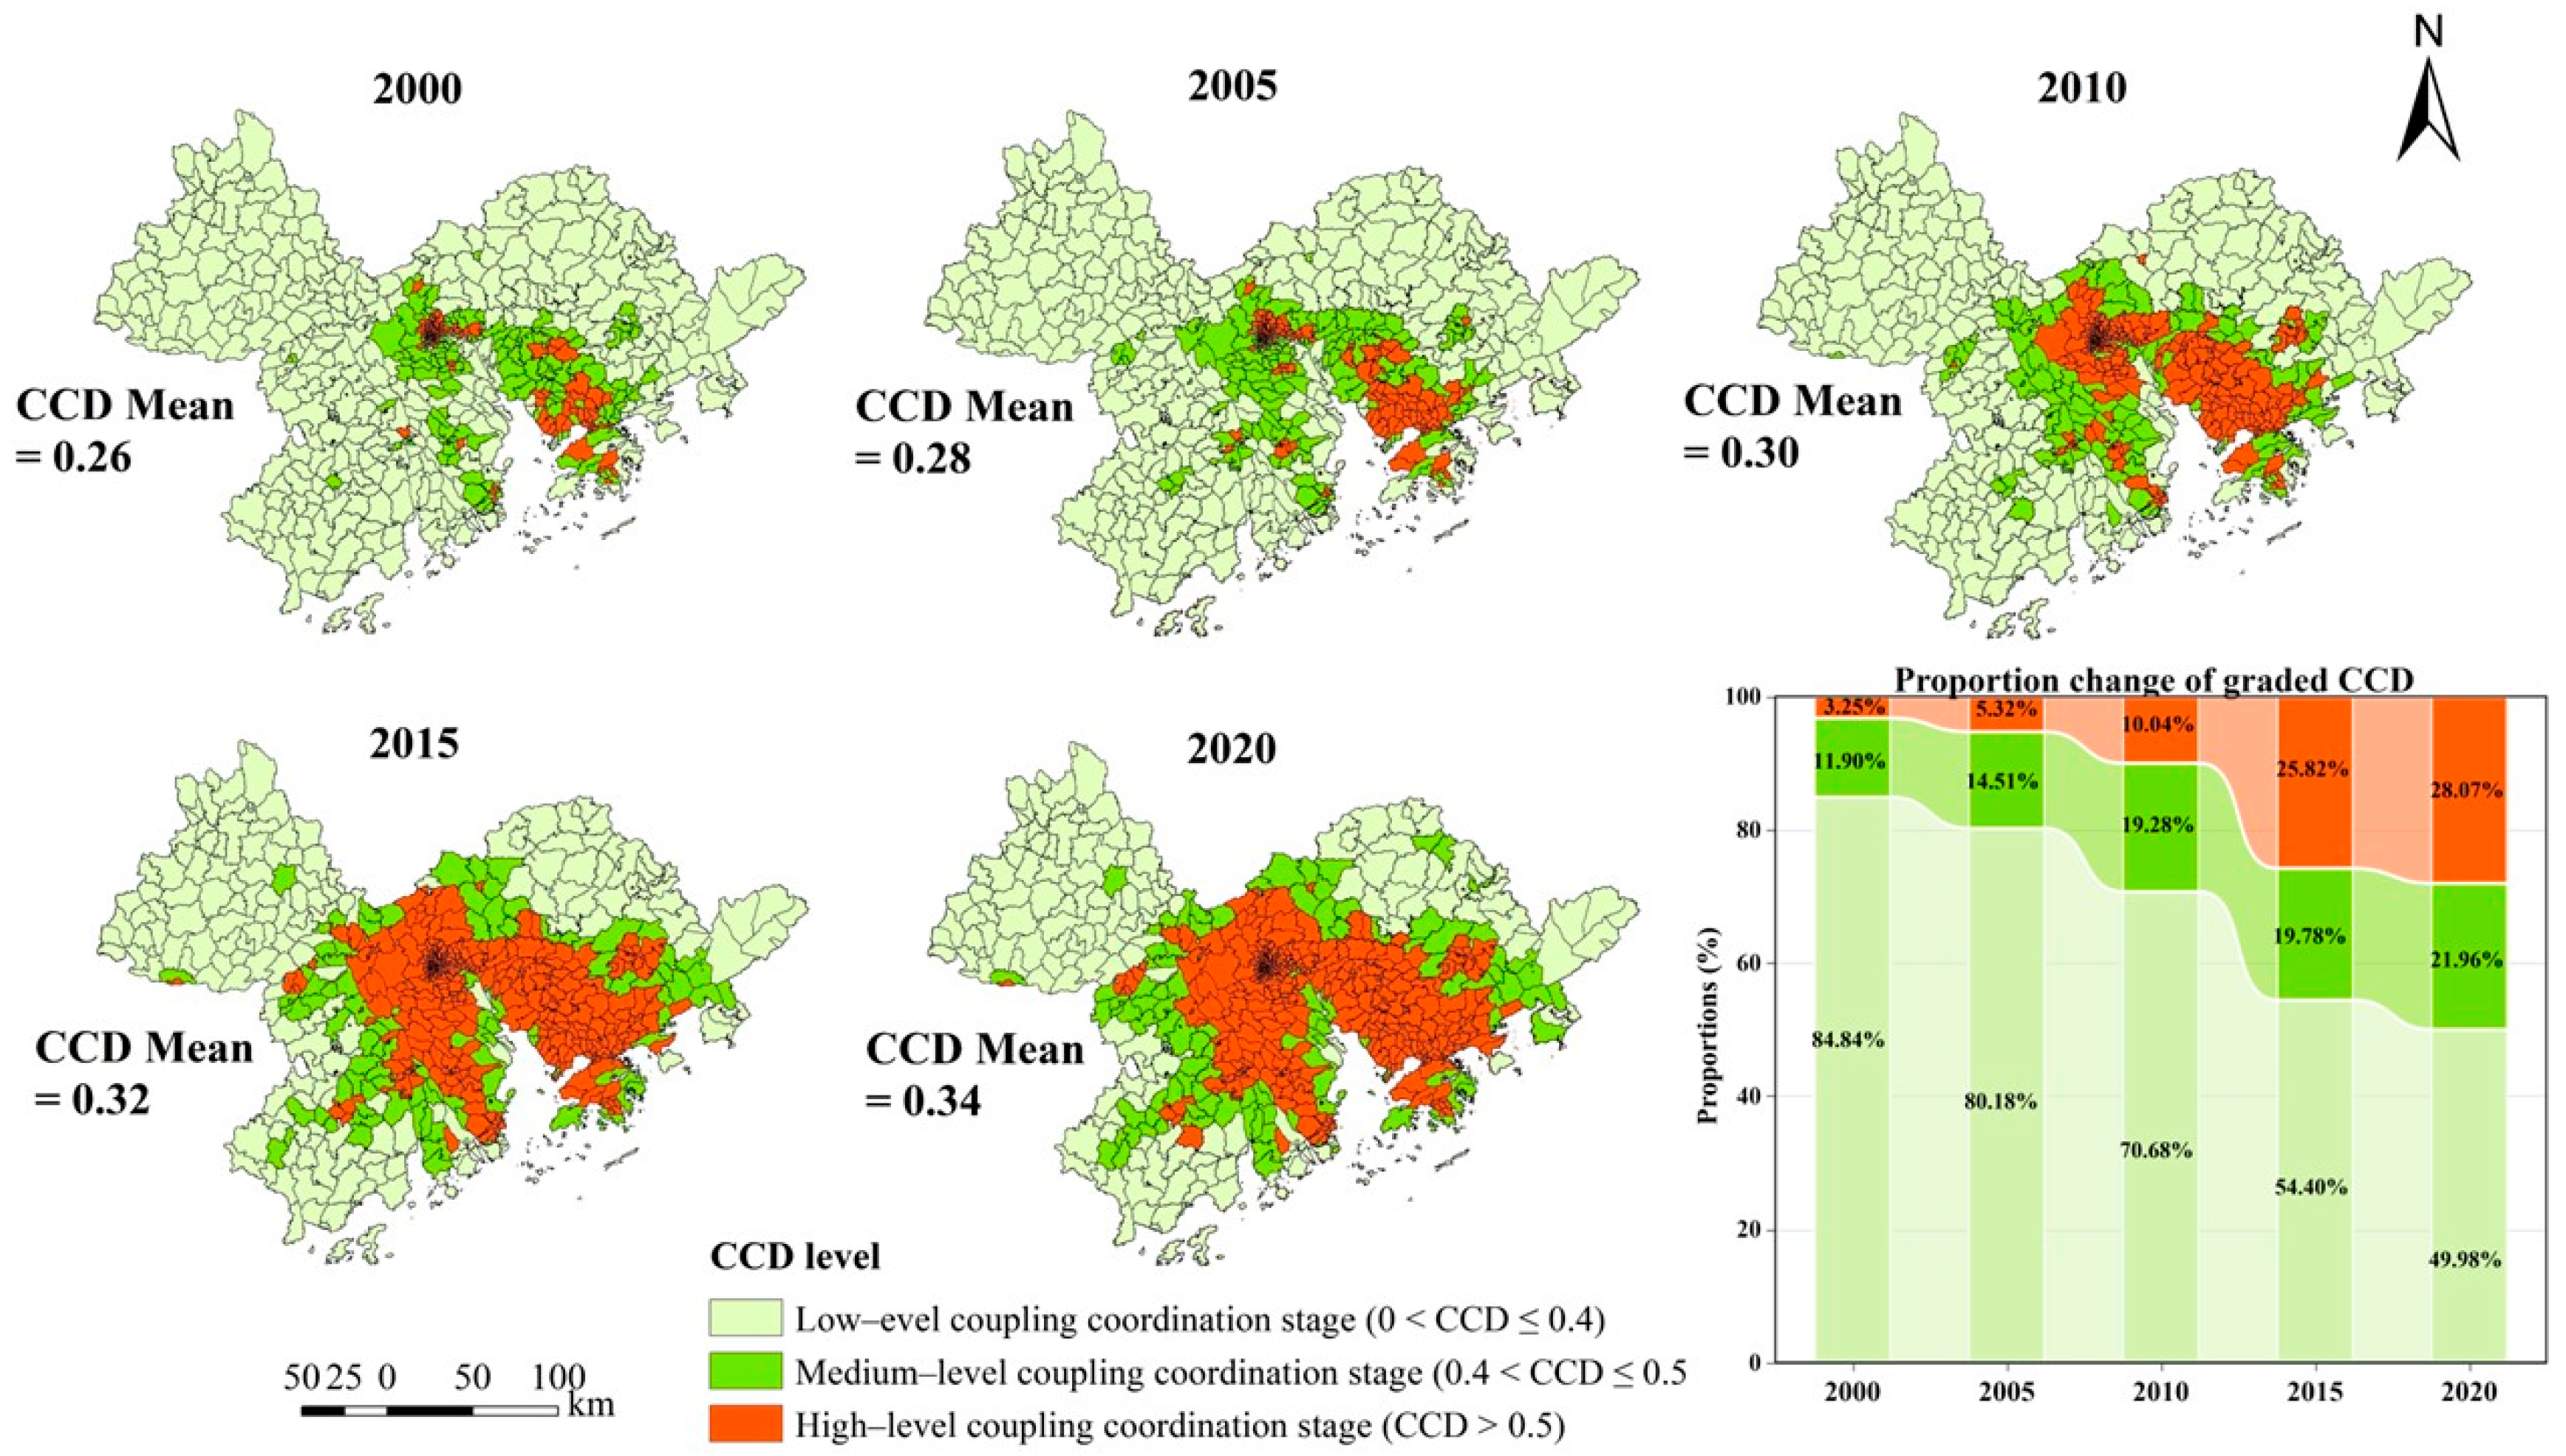
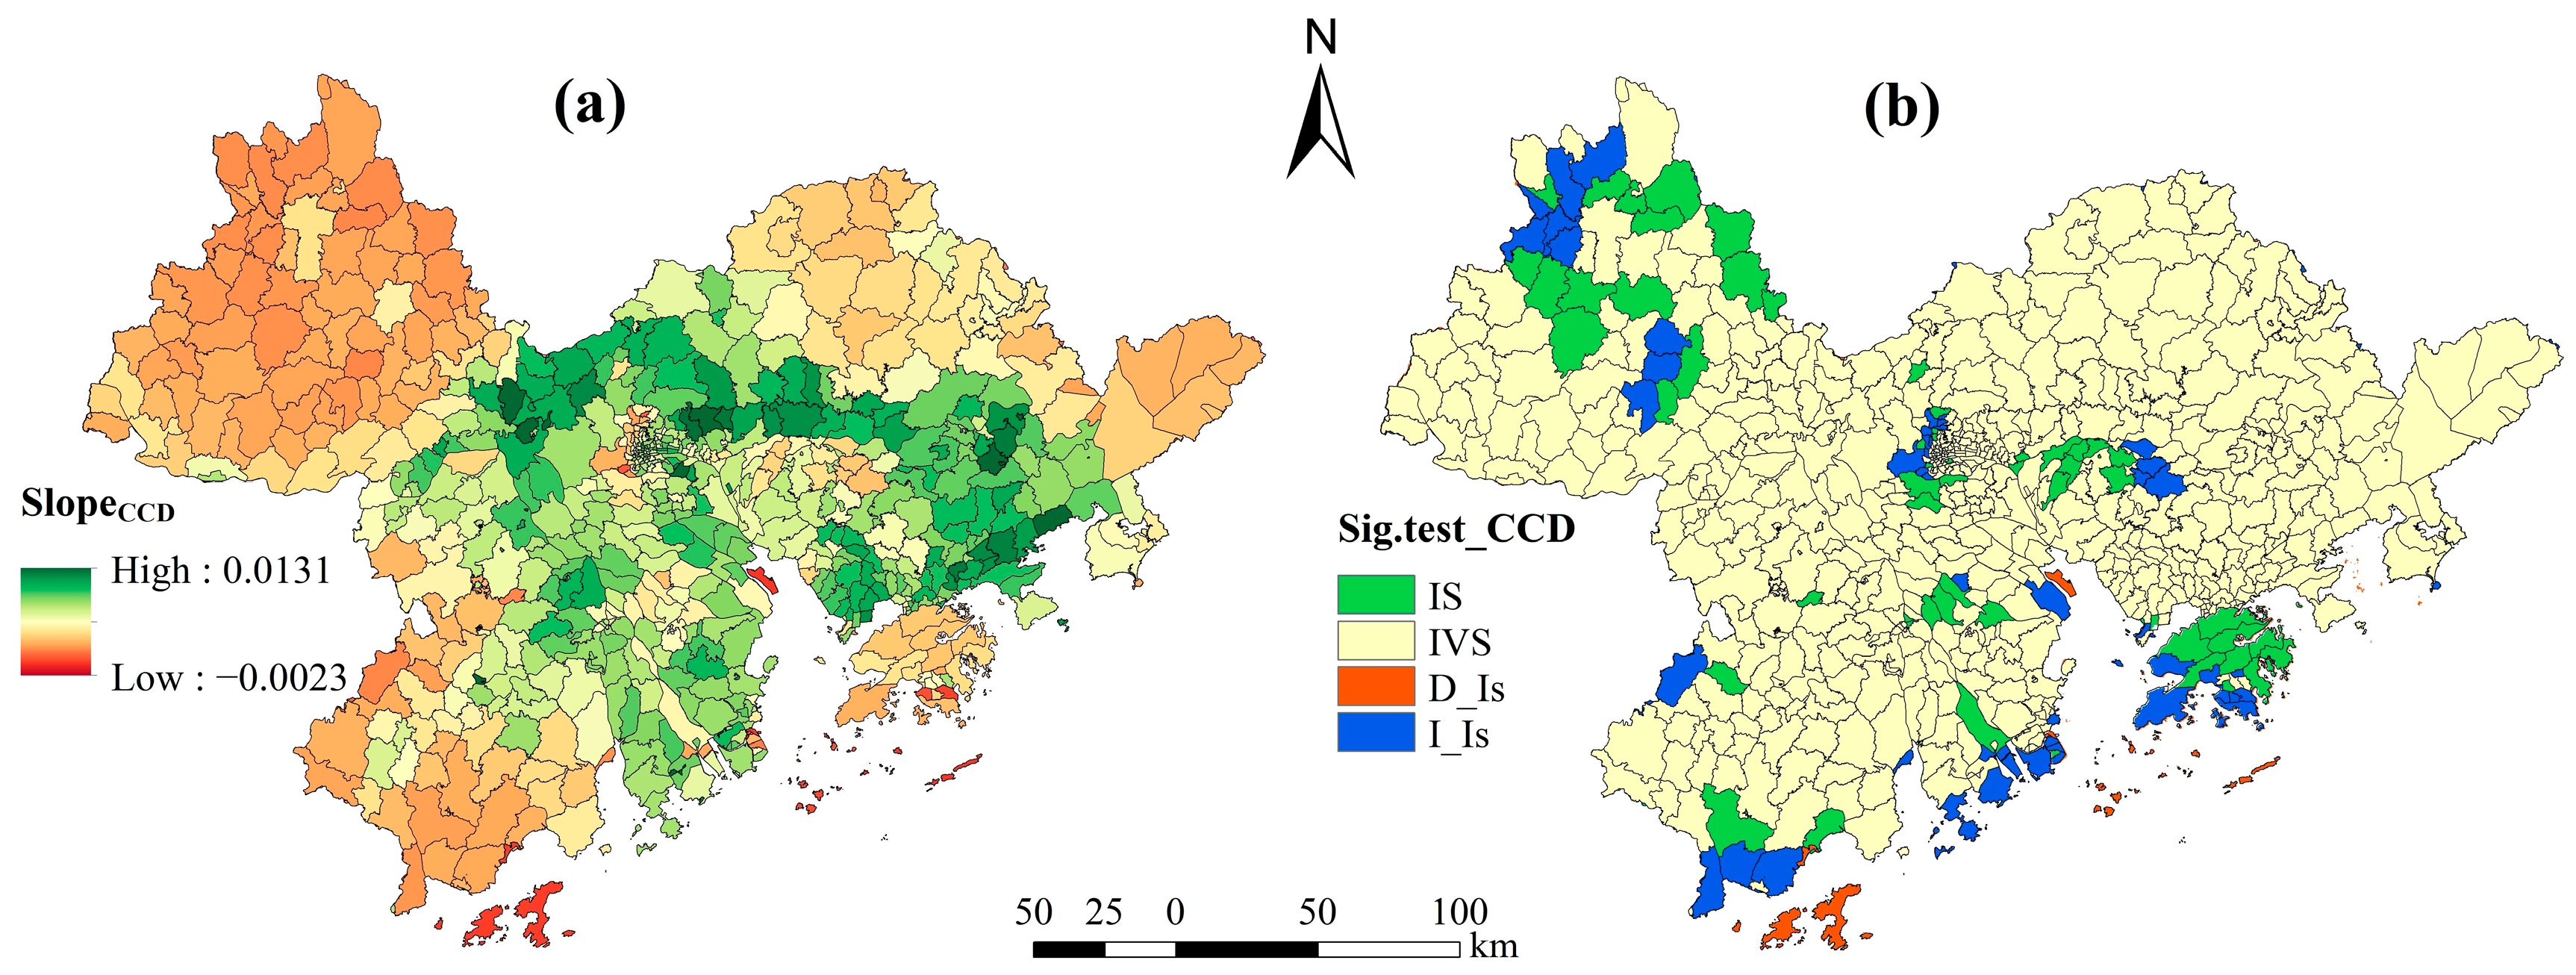


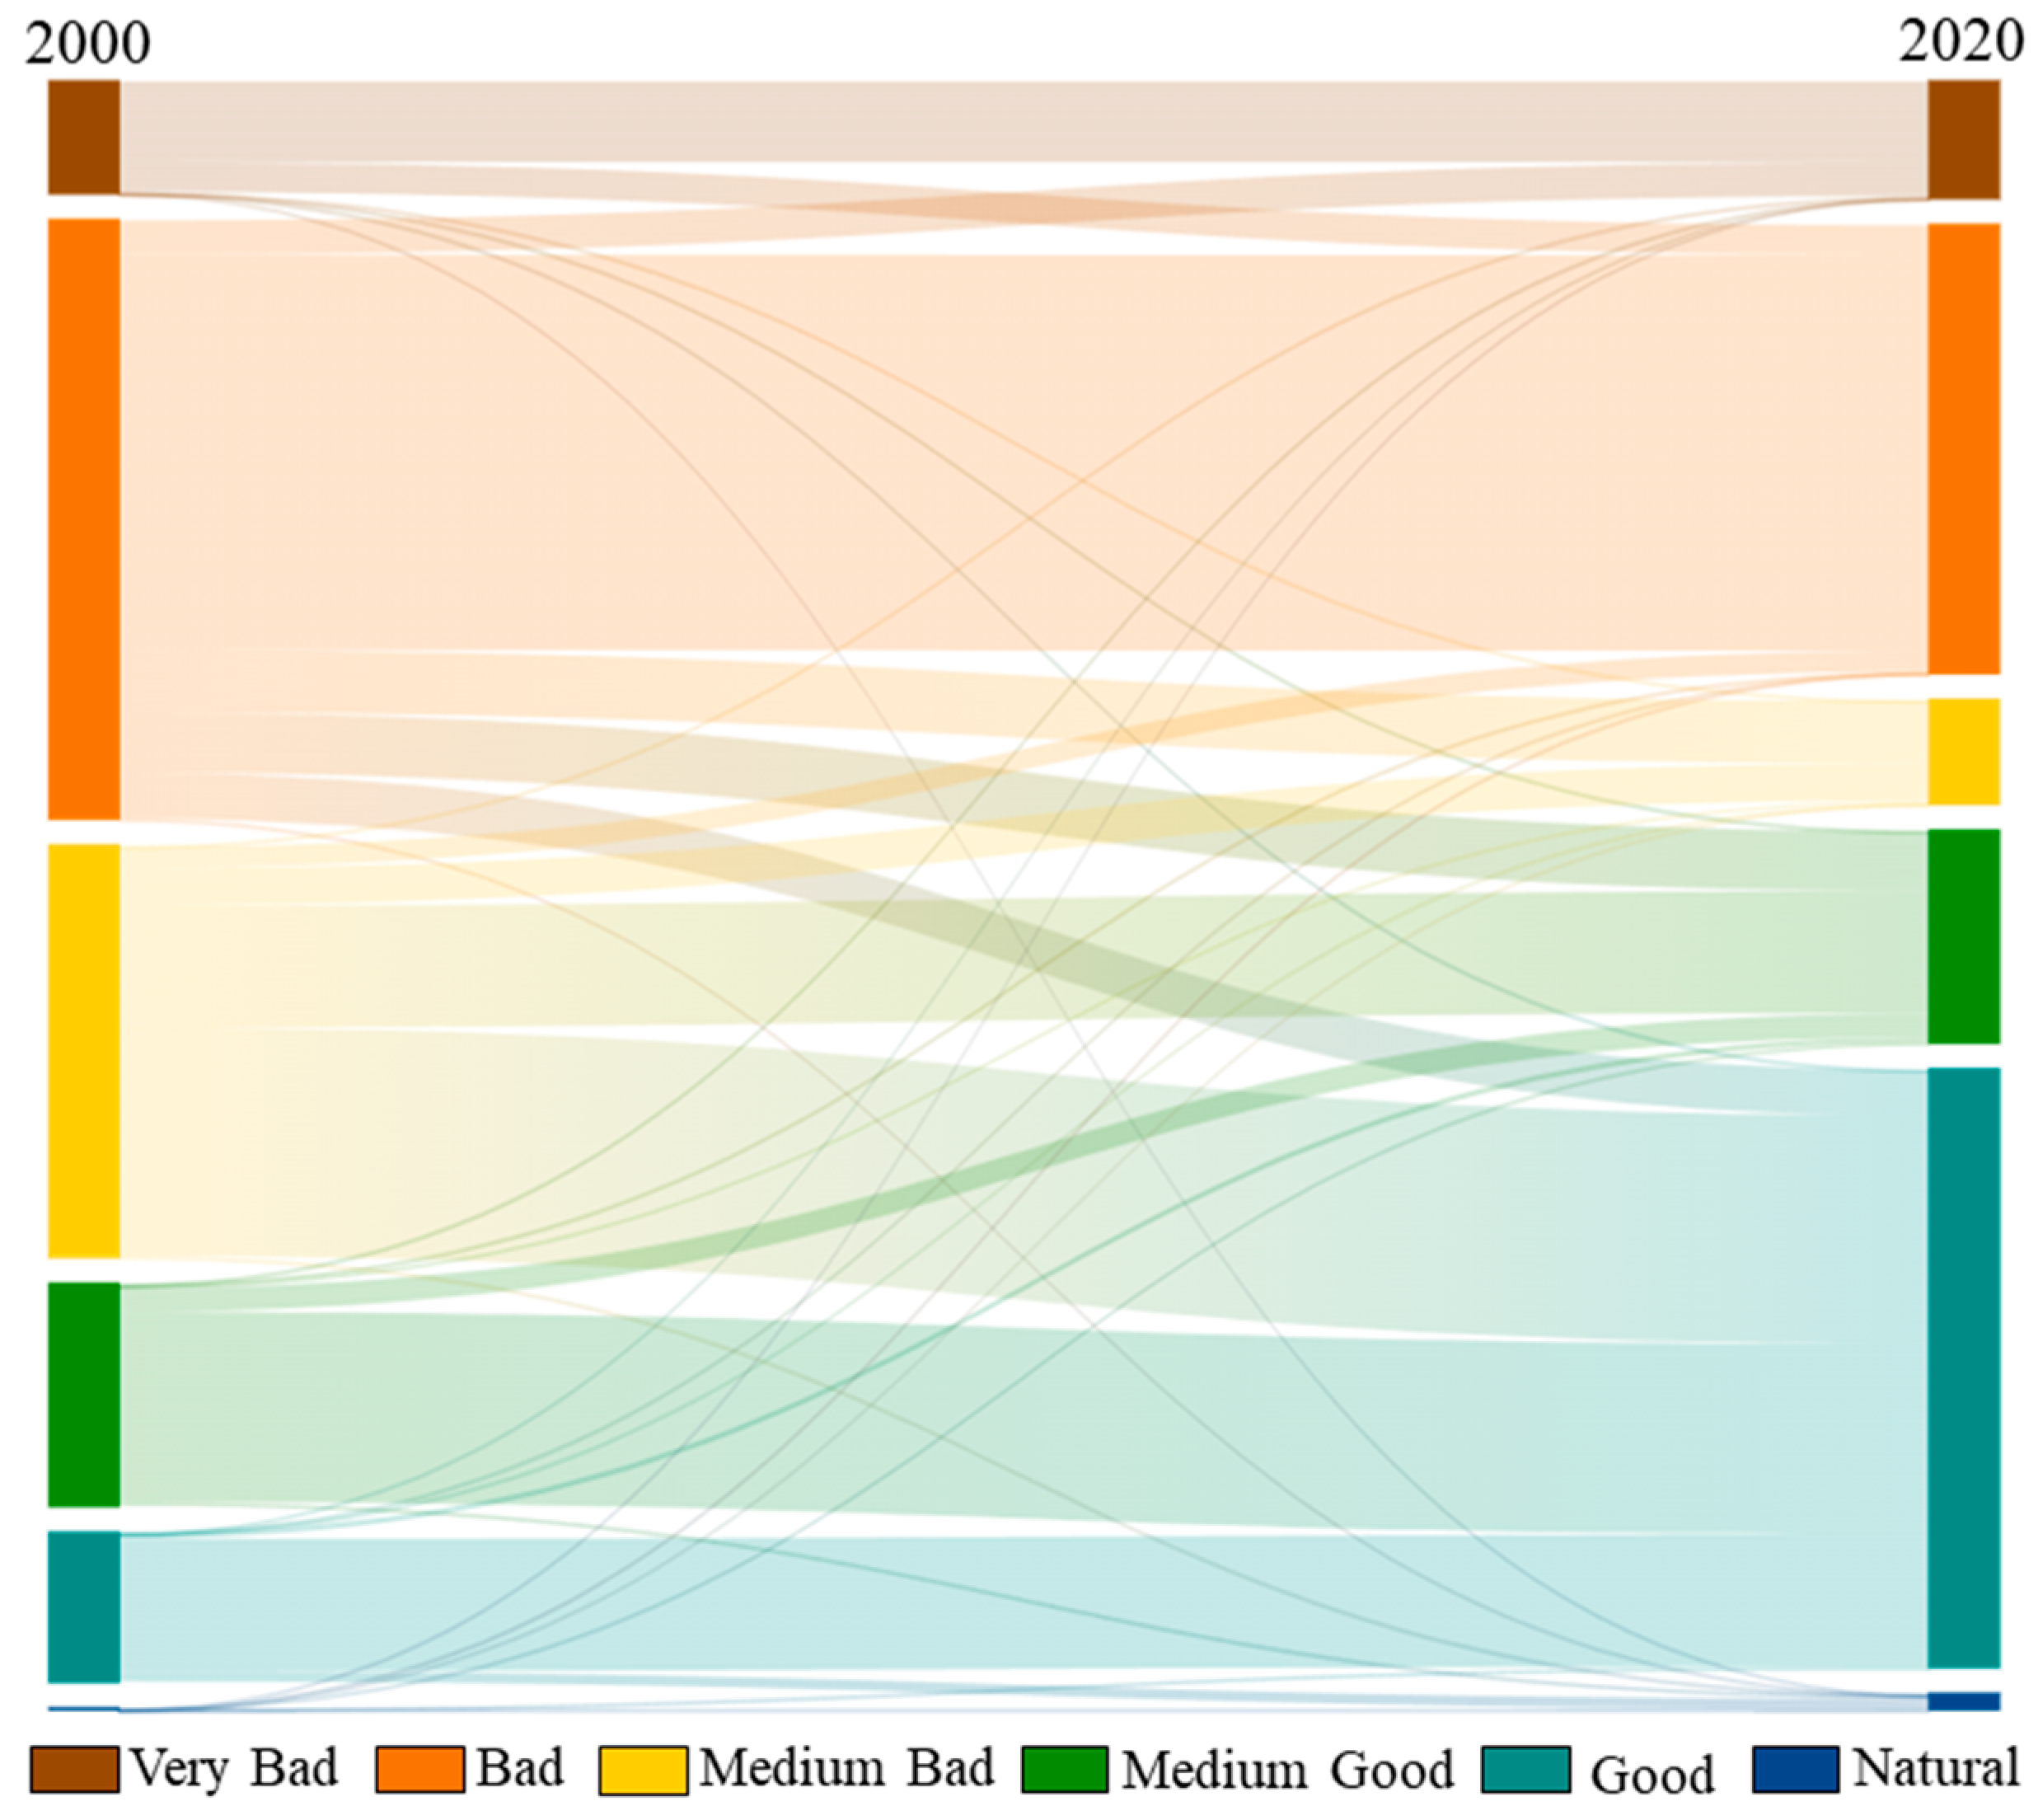
Disclaimer/Publisher’s Note: The statements, opinions and data contained in all publications are solely those of the individual author(s) and contributor(s) and not of MDPI and/or the editor(s). MDPI and/or the editor(s) disclaim responsibility for any injury to people or property resulting from any ideas, methods, instructions or products referred to in the content. |
© 2024 by the authors. Licensee MDPI, Basel, Switzerland. This article is an open access article distributed under the terms and conditions of the Creative Commons Attribution (CC BY) license (https://creativecommons.org/licenses/by/4.0/).