Article

Revetment Affects Nitrogen Removal and N2O Emission at the Urban River–Riparian Interface

School of Design, Shanghai Jiao Tong University, Shanghai 200240, China
*
Author to whom correspondence should be addressed.
Land 2024, 13(8), 1310; https://doi.org/10.3390/land13081310
Submission received: 12 July 2024 / Revised: 15 August 2024 / Accepted: 17 August 2024 / Published: 19 August 2024
(This article belongs to the Special Issue Climate Mitigation Potential of Urban Ecological Restoration)

Abstract

:
River–riparian interface (RRI) plays a crucial role in nitrogen removal and N2O emissions, but different revetment constructions can significantly alter the associated outcomes. Identifying which type of revetment can reduce N2O emissions while still removing nitrogen is a key issue in urban development. This study constructed three types of revetments along the same river section, and measured soil, vegetation, microbial, denitrification, and N2O emission characteristics to explore the synergistic effects of revetment types on nitrogen removal and N2O emissions. The study showed that revetments affected nitrogen removal and N2O emissions in RRI by influencing denitrification. nirK mainly affected nitrogen removal, while nosZII mainly influenced N2O emissions. Environmental factors in the permeable revetment led to significantly higher gene abundances of nirK and nosZII compared to those in the natural and impermeable revetments. As a result, the denitrification potential of the permeable revetment (34.32 ± 1.17 mg/(kg·d)) was 22.43% and 8.84% higher than those of the natural and impermeable revetments, respectively. The N2O emission rate (0.35 ± 0.01 mg/(m2·h)) was 29.22% and 22.19% lower than those of the natural and impermeable revetments, respectively. Permeable revetment could have been the best for the nitrogen removal and N2O emission reduction. These results provide a theoretical basis and guidance for urban ecological construction.

1. Introduction

The riparian–river interface (RRI) is the waterfront region of the riparian zone, serving as a transitional zone between aquatic and terrestrial ecosystems, facilitating frequent exchange and transformation of matter and energy. Therefore, the RRI is the primary area where the riparian zone exerts its ecological functions, playing a crucial role in the ecological restoration of water bodies and in reducing greenhouse gases in urban waterfront areas [1]. Nitrogen, one of the major pollutants causing eutrophication in water bodies, can be significantly reduced through denitrification processes at the RRI. Riparian zones contribute to nitrogen removal by intercepting, adsorbing, storing, and facilitating nitrification and denitrification processes [2,3,4]. Globally, riparian zones can remove approximately 67.5% of nitrogen entering water bodies through surface runoff [5]. Among these processes, nitrification and denitrification are crucial for converting nitrogen pollutants in riparian ecosystems into gaseous forms, representing key mechanisms for eliminating nitrogen pollutants from riparian ecosystems. In an aerobic environment, nitrification is the progressive transformation of ammonium nitrogen into nitrate nitrogen (NO3) or nitrite nitrogen (NO2). The nitrification process, which is powered by ammonia-oxidizing archaea (AOA) and ammonia-oxidizing bacteria (AOB), begins with ammonia oxidation, which is the key rate-limiting phase [6]. In an anaerobic environment, the denitrification process gradually converts soluble nitrate or nitrite nitrogen to gaseous nitrogen [7]. However, during the nitrification and denitrification processes, nitrogen can be transformed into nitrogen gas (N2) as well as nitrous oxide (N2O) [8,9]. Nitrous oxide is a persistent greenhouse gas, and despite its lower atmospheric concentration, it has a warming potential 298 times that of CO2 [10,11]. Although direct research data on N2O emissions at the RRI of urban riparian zones are lacking, studies on similar wetland ecosystems suggest that, despite wetlands covering only 5% of the total global land area, they contribute to 20% of the current global N2O emissions. As riparian zones are a type of wetland ecosystem characterized by high soil organic matter content, shallow groundwater levels, and frequent aerobic–anaerobic transitions, their N2O emissions are of significant concern. Therefore, while the water–land interface of urban riparian zones plays a role in removing nitrogen pollutants from water bodies and restoring aquatic ecosystems, it also emits N2O, contributing to the greenhouse effect.
Numerous revetments are constructed between RRI and the river as a result of the city’s ongoing growth for flood control and slope stabilization. Natural revetment (NR, the revetments in this study are composed of vegetation), permeable revetment (PR, the revetments in this study are composed of imitation wooden piles), and impermeable revetment (IR, the revetments in this study are composed of concrete) are the three forms of revetment that are classified based on how they affect the material and energy exchange between rivers and RRI [1]. The addition of these revetments will inevitably alter the initial material and energy cycles of RRI and river water. Our previous research [1,12] has found that the frequency of water exchange between river water and soil (or the frequency of wetting and drying cycles) follows this order: NR > PR > IR. This directly affects the soil’s water, nutrient, air, and thermal properties, subsequently influencing the interactions among various elements in the soil ecosystem and changing the growth environment for nitrifying and denitrifying microorganisms. Our previous research has confirmed that revetments alter the soil environment by influencing the ways and frequencies of water transport between the river and the RRI [1]. The differences in soil properties among NR, IR, and PR at the RRI are significant.
The abundance of nitrification and denitrification genes will change with variations in the soil environment, which will impact the nitrogen removal capability and N2O emission at RRI [13,14,15,16,17,18,19]. However, recent studies have not explored how revetments impact the abundance of nitrification and denitrification genes, and it remains unknown how revetments will affect nitrogen removal or N2O emissions in RRI. The connections between nitrification, denitrification, and N2O emissions in the RRI are also unknown. N2O emissions and nitrogen removal must be balanced, which is another uncertainty.
In order to investigate the synergistic mechanisms of different revetment types on nitrogen removal and N2O emissions at the RRI, this study established NR, PR, and IR in the same river segment. As shown in Figure 1, we hypothesize that the three types of revetments—natural (NR), permeable (PR), and impermeable (IR)—have different effects on the exchange of materials and energy between the soil and river water. This impact is primarily reflected in the frequency of water and nutrient exchanges. These differences lead to variations in soil moisture, temperature, nutrients, and pH in the RRI under different revetments. Consequently, these differences also influence other soil properties and vegetation characteristics in the RRI. The variations in soil properties and vegetation characteristics affect the nitrifying and denitrifying microorganisms living in the soil, resulting in differences in nitrogen removal capacity and N2O emission potential. The following is the study’s purpose: (1) to determine the differences in the abundance of nitrification and denitrification genes, nitrification (NPs) and denitrification potentials (DPs), and N2O emission rates among different revetments; (2) to analyze the pathways of denitrification and N2O emissions in the RRI; (3) to explore the mechanisms by which revetments influence nitrogen removal and N2O emissions in the RRI. The study’s findings can be used to build urban reed beds with high denitrification rates and low N2O emissions.

2. Materials and Methods

2.1. Study Area and Field Sampling

The experimental study was conducted in Shanghai, eastern China (31°2′4″ N, 121°26′16″ E). The region has a warm, humid subtropical monsoon climate. The average annual temperature is 17.6 °C, the average annual rainfall is 1200 mm, and the average annual sunlight duration is 1885 h (Figure 2). NR, RP, and IR were constructed in a river stretch ten years ago. This can guarantee the consistency of the experimental river’s characteristics (during the experiment, river water samples were also collected. The relevant parameters of the river water were measured using a portable multi-parameter water quality meter (LH-C640, Lianhua, Shanghai, China). The specific measurements are as follows: pH of 7, nitrate nitrogen levels of 2.523 mg/L, ammonium nitrogen levels of 0.439 mg/L, and nitrite nitrogen levels of 0.042 mg/L), as well as the initial test characteristics of the RRI soil, which effectively addresses the issue that it is challenging to control the variables in a field experiment. Additionally, it gives revetment enough time to influence the evolution of RRI’s soil ecosystem. Moreover, the RRI of the experimental site has essentially the same types of herbaceous plants (Kalimeris indica (L.) Sch.–Bip), which are less impacted by human activity and lack any aquatic plants.
In this study, the riparian zone (RRI), which is frequently impacted by river water changes, is located 1.2 m away from the revetment since the human eye can easily distinguish between the two. To assure the correctness of the data, we, therefore, set up quadrats at a distance of 1 m from the revetment, three replicate quadrats in each group, five sampling points in each quadrat (N = 3 × 3 × 5), and the soil from five sample points was uniformly mixed into one. And the experiment was conducted for two consecutive days with two sets of repeated trials.
In each quadrat, soil samples at depths of 0–20 cm, 20–40 cm, and 40–60 cm were taken due to the high groundwater level and significant soil evaporation in the study area (there is typically more water in the soil below 50 cm of the RRI). These depths are referred to as surface soil, middle soil, and deep soil, respectively. On 18 July and 19 July 2022 (repeated collection for two days), we took soil samples because of the high temperature and frequent changes in river levels. It is important to prevent the destruction of the soil structure while using soil samples to analyze soil physical parameters. An additional portion of the soil samples was utilized to assess the chemical properties, nitrification (NP) and denitrification potential (DP), and the number of nitrifying and denitrifying microorganisms, all of which needed to be kept at low temperatures before being instantly sent for measurements in the lab.

2.2. Soil Physical and Chemical Properties

A three-parameter soil meter was used to measure the temperature and moisture content of the soil (SM150, DELTA-T, Cambridge, UK). To determine soil bulk density, undamaged soil samples were dried in a ring knife. The soil in the ring knife was submerged in water, and the volume of the soil was measured after the air was removed. The soil was then dried, and its specific gravity was determined by weighing the dry soil mass after drying. Utilizing the specific gravity method, soils were sieved to assess soil texture [20]. Thereafter, total porosity (TP) was determined using bulk density and specific gravity (Equation (1)). Capillary porosity (CP) was calculated as the ratio of capillary water volume to total soil volume, whereas the difference between TP and CP was utilized to determine air-filled porosity (AFP). Using an ORP meter (ORP-2096, Boqu, Shanghai, China), the oxidation–reduction potential (ORP) was determined. A pH meter was used to determine the pH of the soil after combining soil and water in a 1:5 ratio. A soil nutrient detector (LD-GT4, Lynd, Shandong, China) was used to measure the total nitrogen (TN) in the soil. An automatic discontinuous chemical analyzer (Smartchem200, Alliance Company, Paris, France) was used to monitor ammonium nitrogen (NH4+-N) and NO3-N. Furthermore, soil organic matter (SOM) was calculated as the amount of heated potassium dichromate required to oxidize organic carbon in soil samples.
T P = 1 B D / S G
where TP is soil total porosity, BD is soil bulk density (g/m3), and SG is soil specific gravity (g/m3).

2.3. Plant Biomass Measurements

Three 20 × 20 cm quadrats were selected to measure the herb biomass. The sections of the aboveground herbs were taken out, washed, and sealed for storage. The 20 × 20 cm quadrat served as the boundary for an excavation of a soil block that was 60 cm deep. Additionally, underground roots were cleaned and preserved from the block in sealed bags. The weights of the aboveground (AB) and underground (UB) biomass of the herbaceous plants were determined by drying to a constant weight at 105 °C, respectively [21].

2.4. Nitrifying and Denitrifying Microorganisms

Using the PowerSoil DNA Isolation Kit (M5635-02, Omega, Guangzhou, China), the total DNA of each sample was directly extracted from the sample, in accordance with the product’s instructions. By using 0.8% agarose gel electrophoresis, genomic DNA was extracted and kept at −80 °C for later usage. AOA and AOB were quantified using the Funglyn Biotech TIB-8600 real-time PCR equipment and the primer pairs amoAF (STAATGGTCTGGCTTAGACG)/amoAR(GCGGCCATCCATCTGTATGT) and bamoA1F (GGGTTTCTACTGGTGGT)/bamoA2R (CCCCTCKGSAAAGCCTTCTTC), respectively. The nirS and nirK were measured using the primers cd3Af (GTSAACGTSAAGGARACSGG)/R3cdR (GASTTCGGGRTGSGTCTTGA) and nirK1aCuF (ATCATGGTSCTGCCGCG)/nirKR3CuR (GCCTCGATCAGRTTGGTT), respectively. Primer nosZ2F (CGCRACGGCAASAAGGTSMSSGT)/nosZ2R (CAKRTGCAKSGCRTGGCAGAA) and nosZII-F (CTIGGICCIYTKCAYAC)/nosZII-R (GCIGARCARAAITCBGTRC) were used to quantify nosZI and nosZII, respectively. Twenty microliters was used for the reaction mixture, which also contained 10 μL of a 2 × SYBR real-time PCR pre-mixture (Q712-02, Vazyme, Nanjing, China), 1 μL of template DNA (8 ng), and 0.8 μL of AOA and AOB primer (5 mM). Nuclease-free water was added until a total volume of 20 μL was attained. The qPCR cycle appeared as follows: 95 °C for 5 min, 95 °C for 30 s, 60 °C for 30 s, and 72 °C for 1 min, 40 cycles. Every PCR run’s threshold cycle (Ct) result was compared to a known standard DNA concentration.

2.5. Nitrification and Denitrification Potentials

The rates and capacities of nitrification and denitrification are measured by the essential indicators, i.e., NPs and DPs. DPs are also used to measure the nitrogen removal capacity. The procedure previously described by Yan et al. [22] for making the NP determination was followed. In a 50 mL culture container, 10 g of fresh soil was added together with 20 mL of an incubation solution with a pH of 7.2 (0.2 M KH2PO4, 0.2 M K2HPO4, and 0.05 M (NH4)2SO4 in a volume ratio of 3:7:30). Parafilm was used to seal the bottles, and they were shaken for 24 h at 25 °C (200 rpm/min). NO3-N concentrations were measured before and after incubations using an automatic discontinuous chemical analyzer (Smartchem200, Alliance Company, Paris, France).
The acetylene inhibition approach was used to determine DPs [23]. Ten grams of fresh soil and 20 mL of incubation solution (containing final concentrations of 1.0 g L−1 chloramphenicol, 0.1 g L−1 potassium nitrate, and 0.18 g L−1 glucose) were combined in a 50 mL culture bottle. Before adding acetylene gas to a headspace at a final concentration of 10% (v/v), bottles were sealed and purged with N2 gas to establish anaerobic conditions. Then, bottles were kept at 25 °C in the dark for 24 h. A gas chromatograph (Agilent 6890 N, Agilent Technologies Inc., Shanghai, China) fitted with an electron capture detector was used to measure the before and after N2O concentrations.

2.6. N2O Emission Rate

With three replication chambers at each site, in situ N2O emission rates were determined using closed-chamber techniques [24]. The N2O flux at RRI was measured using a static chamber that consists of an upper chamber and a base. A fan for air mixing is put in the upper room, and during the measurement, a probe is installed to monitor air pressure and temperature. To create a sealed environment, the base is buried in the soil. From 9:00 to 10:00, every 20 min, 200 mL of gas samples was taken from the indoor environment using a glass syringe for the measurement. A 500 mL gas collecting bag (BKMAM, Hunan, China) was then injected. Gas samples were brought instantly to the laboratory, where they were measured by a gas chromatograph within a day (GC-2010). The gas collection was conducted simultaneously with the soil and vegetation sampling, and it was repeated for two days in July 2022.

2.7. Statistical Analysis

Prior to statistical analysis, the Kolmogorov–Smirnov test was performed to verify the normality of the data. The effects of revetment type and depth on NP and DP, N2O emission rate, nitrification and denitrification microbial abundance, soil physical and chemical parameters, and plant traits were studied using one-way analysis of variance (ANOVA). Moreover, the correlation among various factors, including nitrification and denitrification, microbial abundance, NP, DP, N2O emission rate, and physical and chemical parameters of soil, was examined using Pearson correlation analysis. The Origin 2021 software was used to conduct all the statistical analysis procedures, whereas CANOCO5 was used to perform RDA analysis of the NP, DP, and N2O emission rates. Furthermore, the structural equation model (SEM) in Amos Graphics has been used to establish, estimate, and test causal models for the analysis of observable explicit variables and unobservable implicit variables.

3. Results

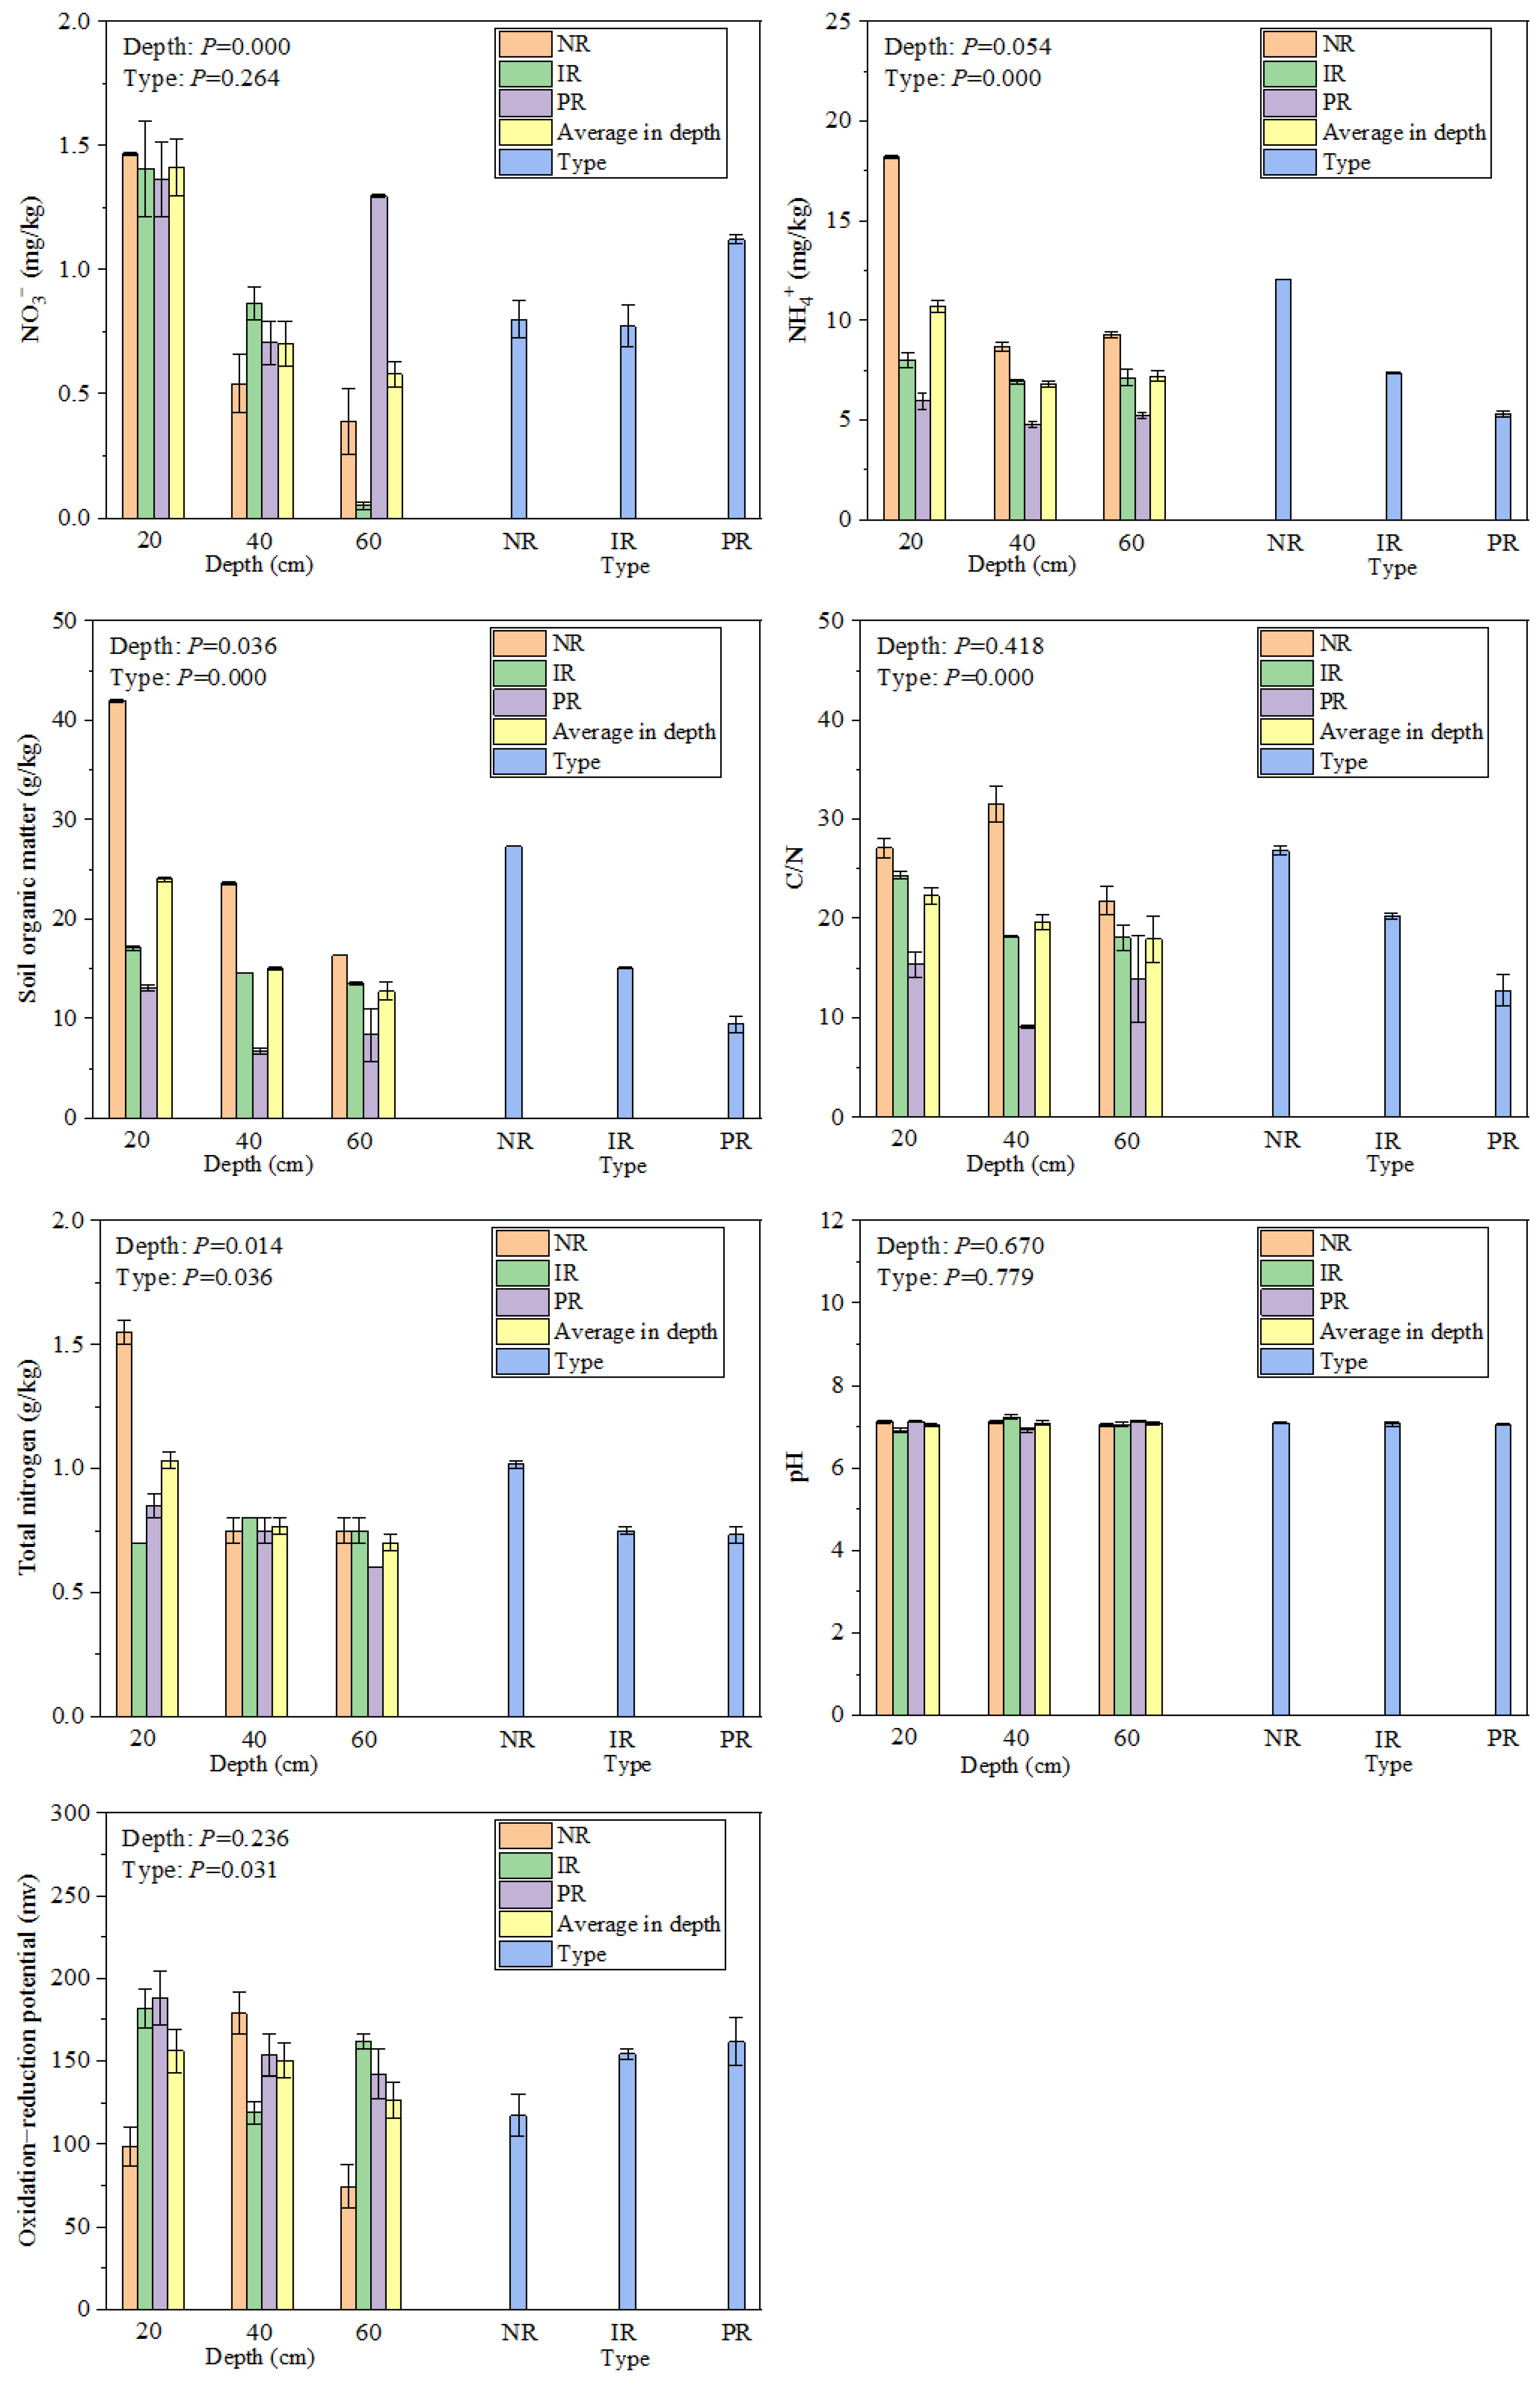
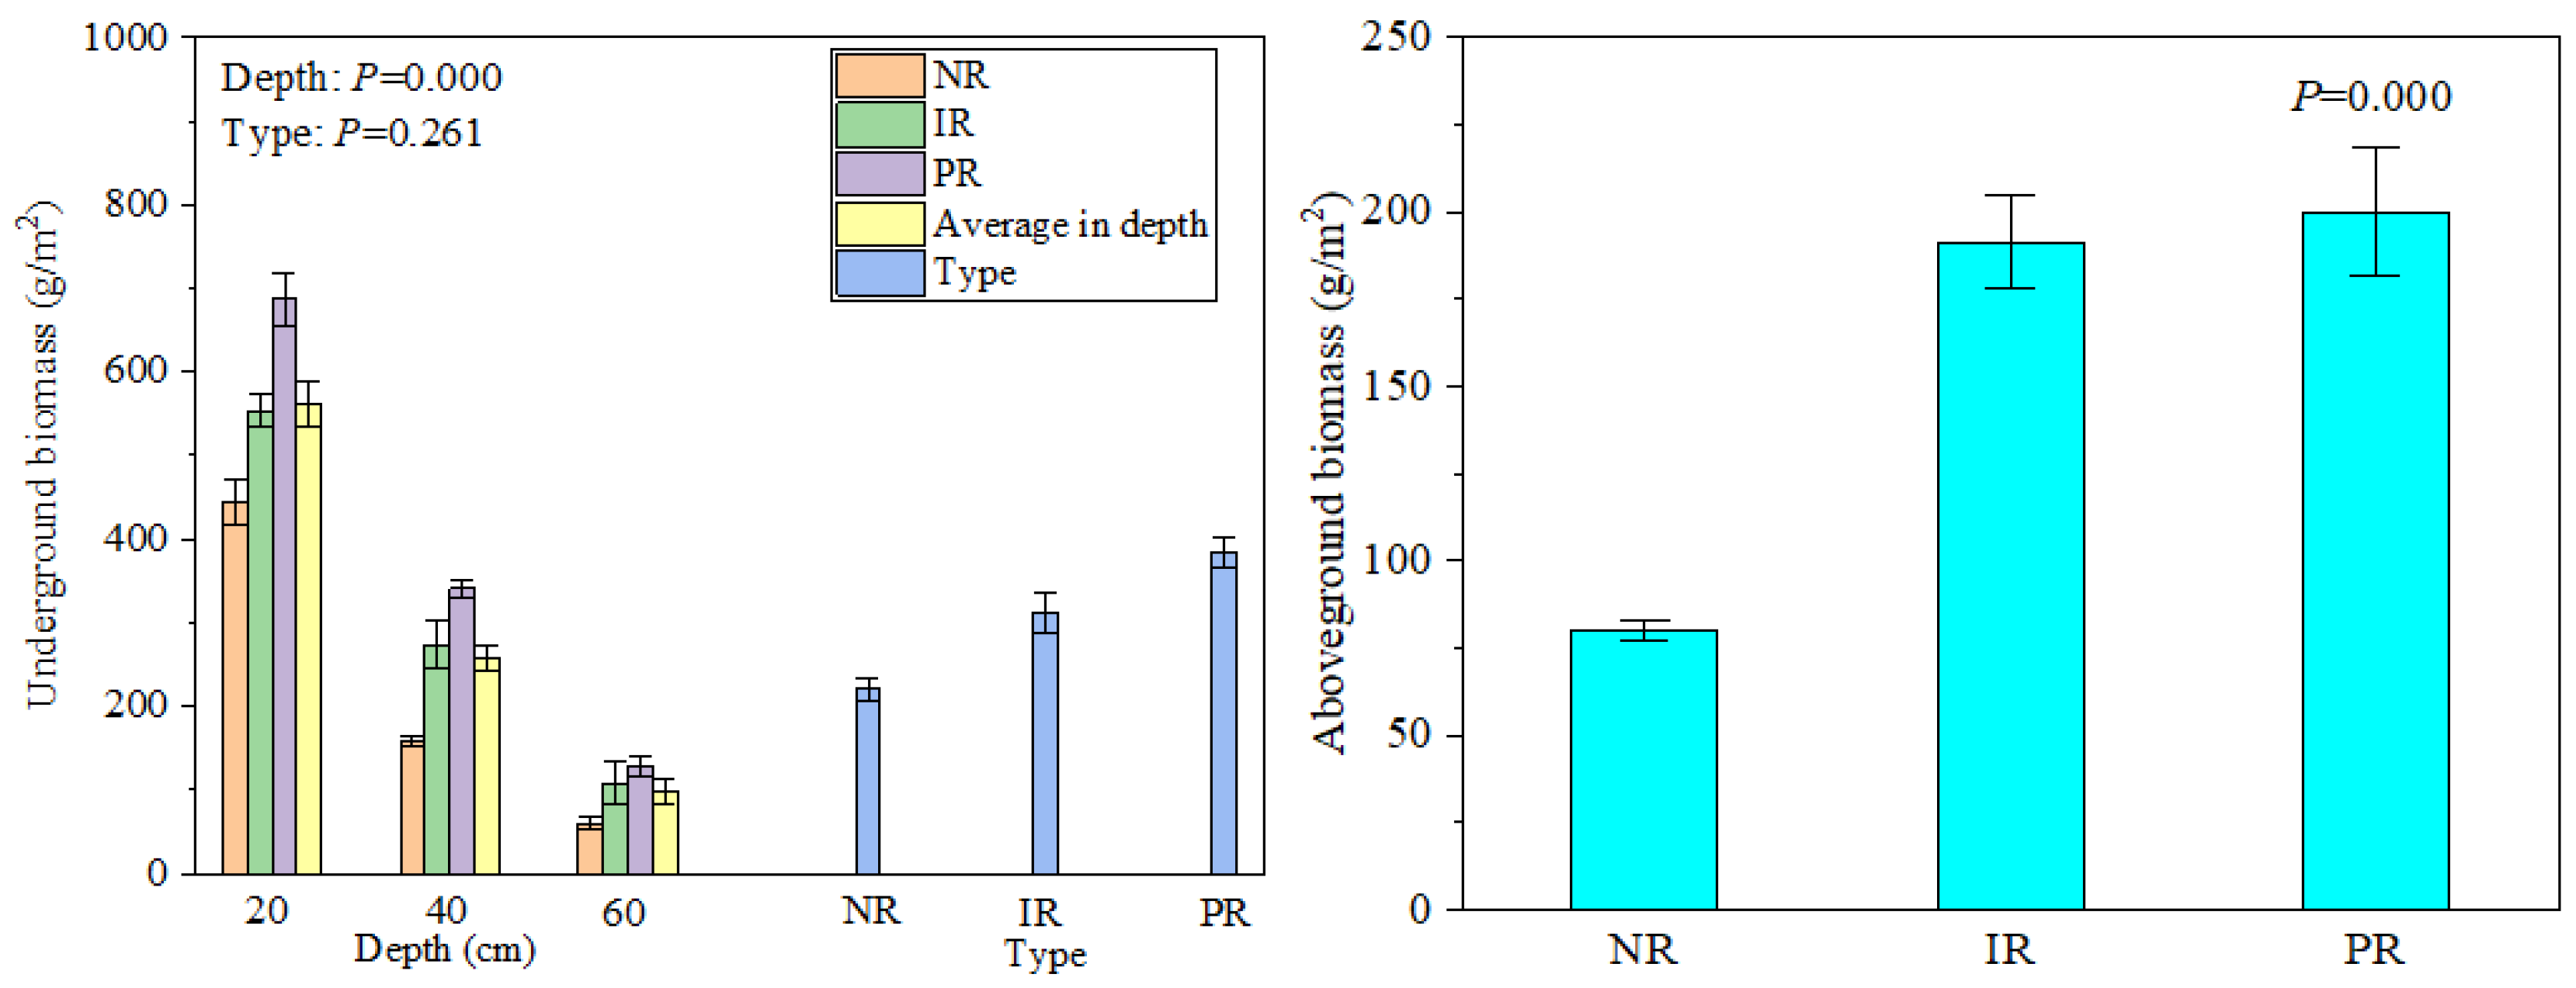
3.1. Soil Physical and Chemical Properties and Plant Biomass Characteristics

In Figure 3, the difference between TP and CP is notable in the revetment, but the AFP difference is insignificant. The largest in NR and the smallest in IR were the TP (59.15 ± 0.01%) and CP (56.89 ± 0.01%). And the difference in soil moisture in revetment is significant. The soil moisture was highest in NR (43.98 ± 0.15%) and lowest in IR (35.11 ± 0.41%). Additionally, the variation in soil temperature is large at soil depth but small at the revetment, as illustrated in Figure 3.
According to Figure 4, the changes in NH4+, C/N, ORP, SOM, and TN were considerable in the revetment. The highest concentration of NH4+ was found in NR (12.05 ± 0.03 mg/kg), which was 1.64 and 2.27 times greater than that of IR and PR, respectively. The C/N in NR (26.81 ± 0.45) was the highest and was 1.33 times and 2.10 times greater than in IR and PR, respectively. PR had the highest ORP (161.44 ± 14.44 mv), which was 1.38 and 1.05 times more than NR and IR, respectively. The SOM had the highest NR (27.28 ± 0.02 g/kg) and smallest PR (9.38 ± 0.87 g/kg) values with increasing soil depth. As soil depth increased, TN had the highest concentration of NR (1.02 ± 0.02 g/kg), which was 1.36 times greater than IR and 1.39 times greater than PR, respectively. The variation in NO3 is considerable in soil depth but not in a revetment. Additionally, neither at soil depth nor at revetment, the pH differential was appreciably different.
In revetment, the difference in AB is significant, as illustrated in Figure 5. The biggest AB (200.07 ± 18.30 g/m2) was found in PR, which was 2.49 and 1.05 times larger than that of NR and IR, respectively. The difference in UB is large at soil depth but not significant at revetment. As soil depth increased, UB dropped.

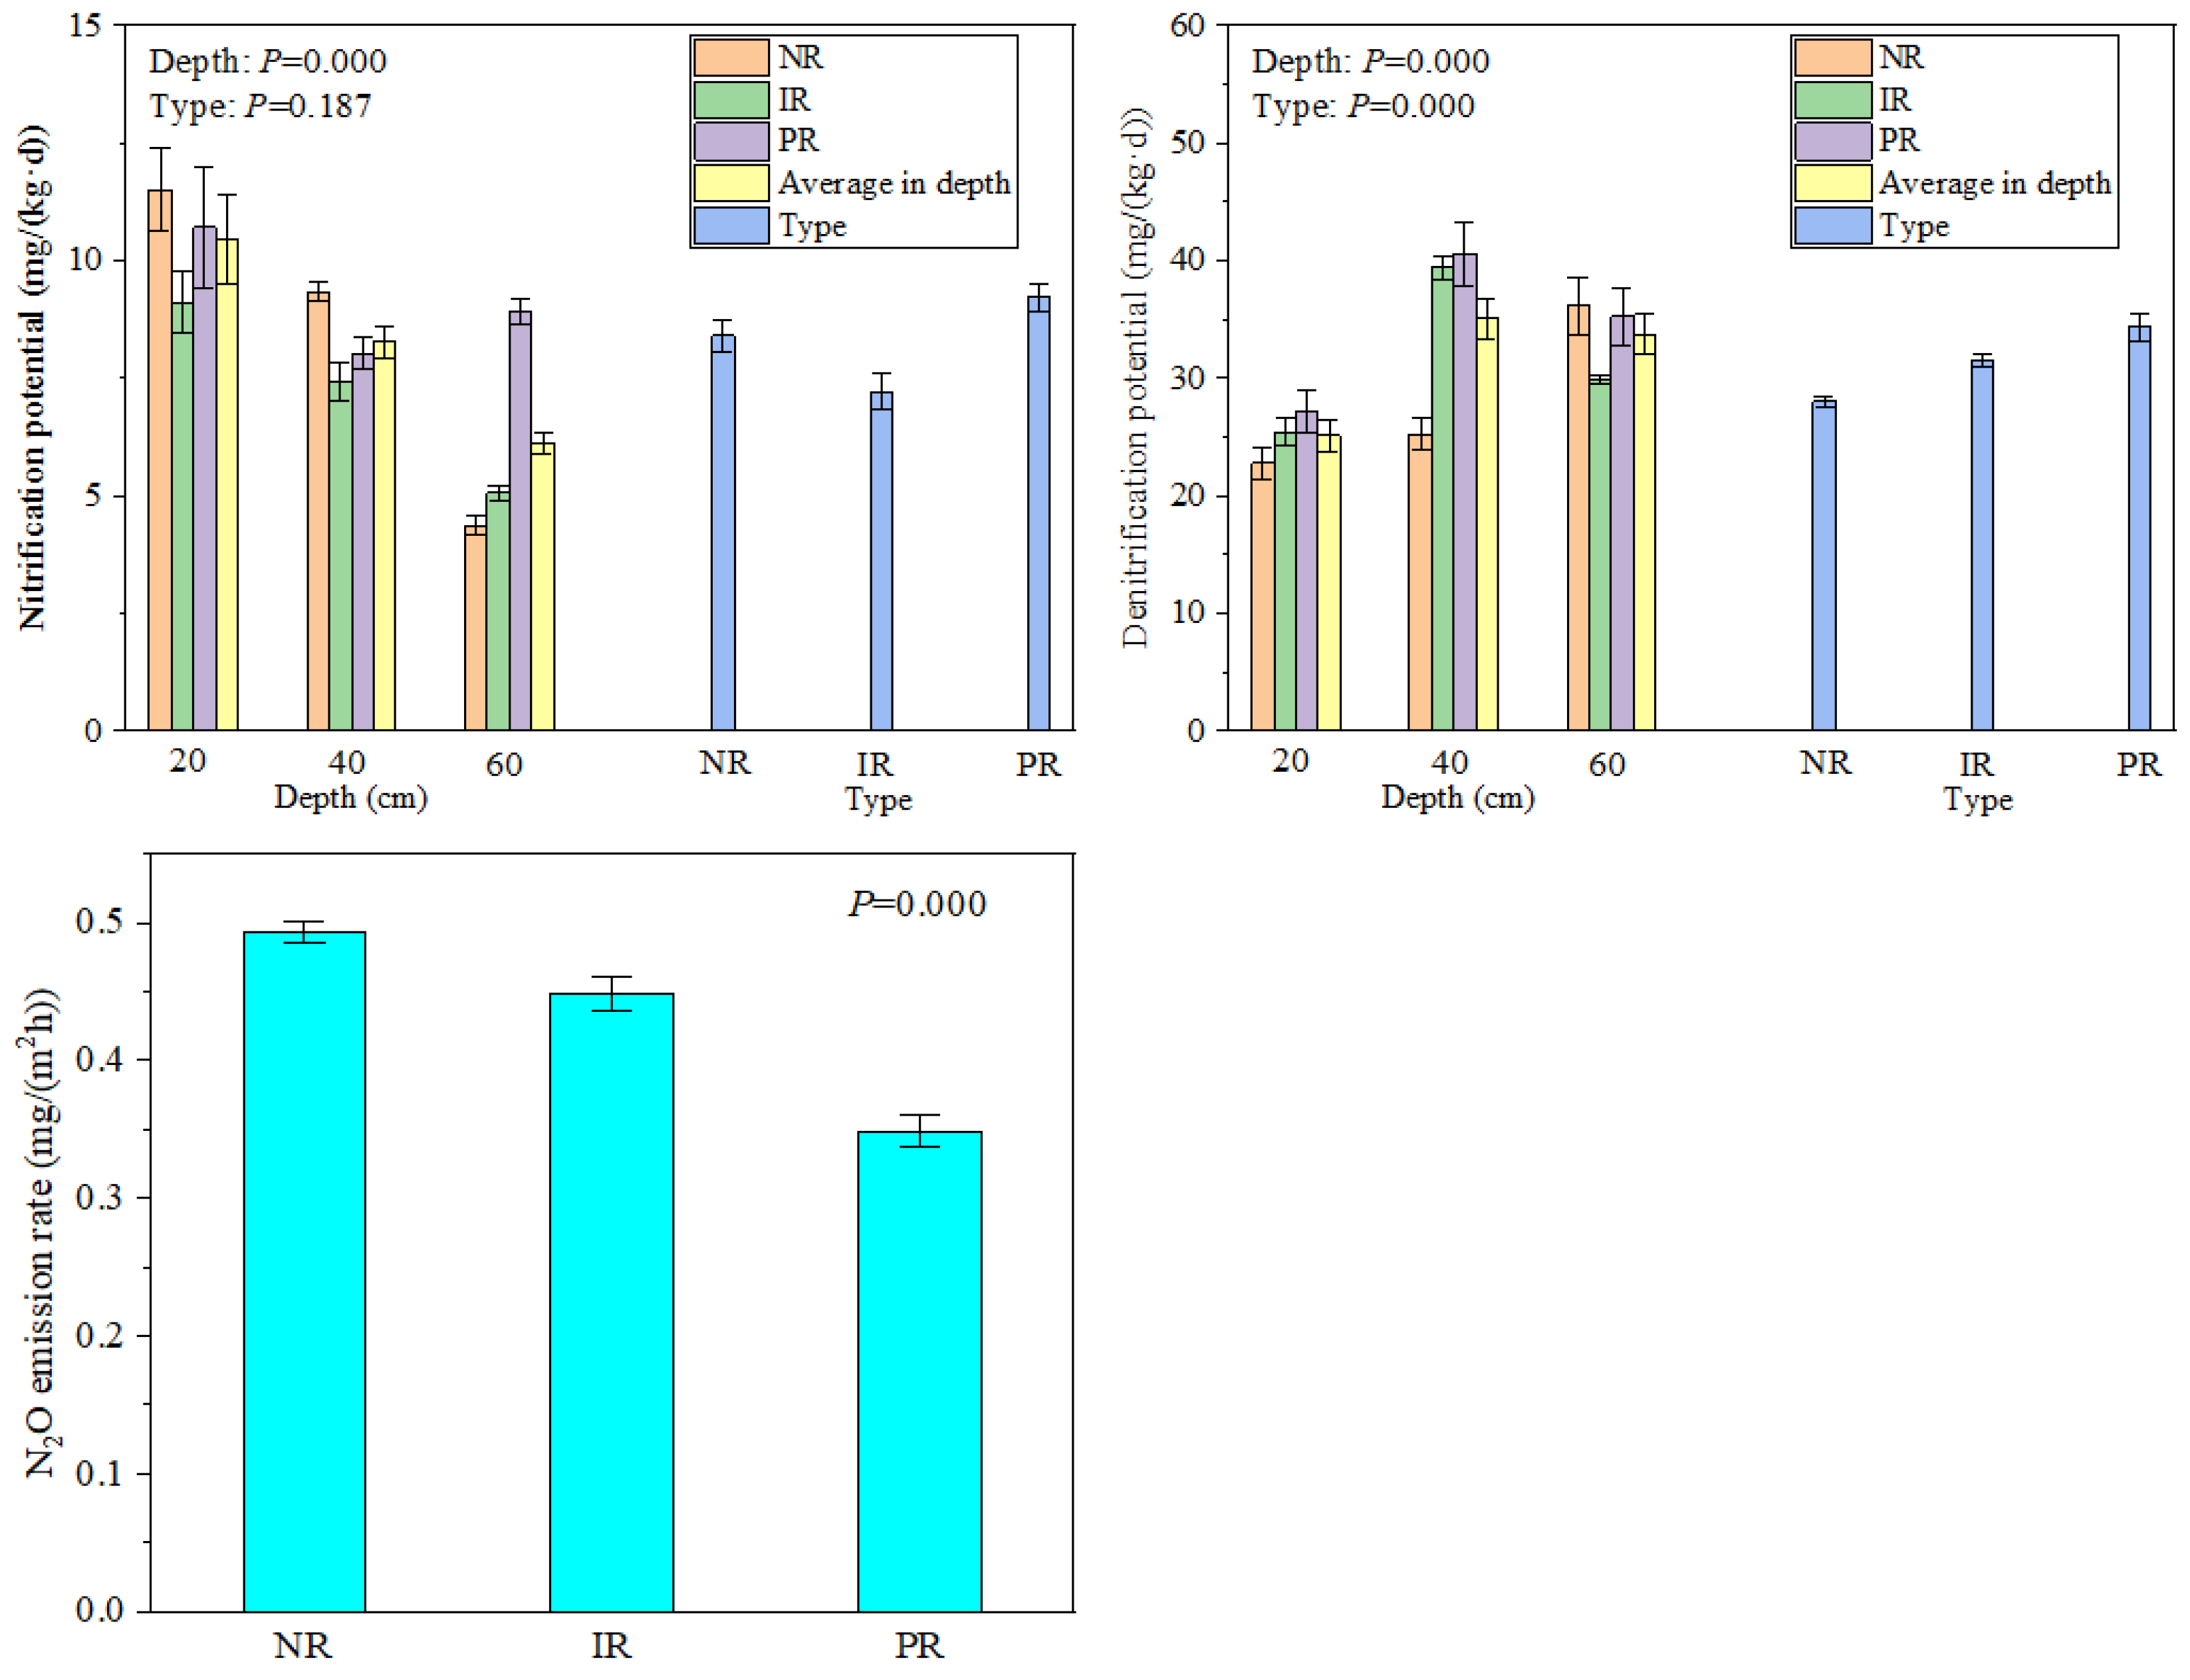
3.2. Nitrification, Denitrification Potential, and N2O Emission Characteristics

In Figure 6, the difference of NP in revetment is not statistically significant, but there was a large DP difference. The biggest DP (34.32 ± 1.17 mg/(kg·d)) belonged to PR, which was 1.09 and 1.22 times larger than the DPs of IR and NR, respectively. And the variation in N2O emission rate in revetment is also significant; the emission rate of NR (0.49 ± 0.01 mg/(m2h)) is 1.10 and 1.41 times that of IR and PR, respectively. Additionally, the NP and DP variations in soil depth are significant.

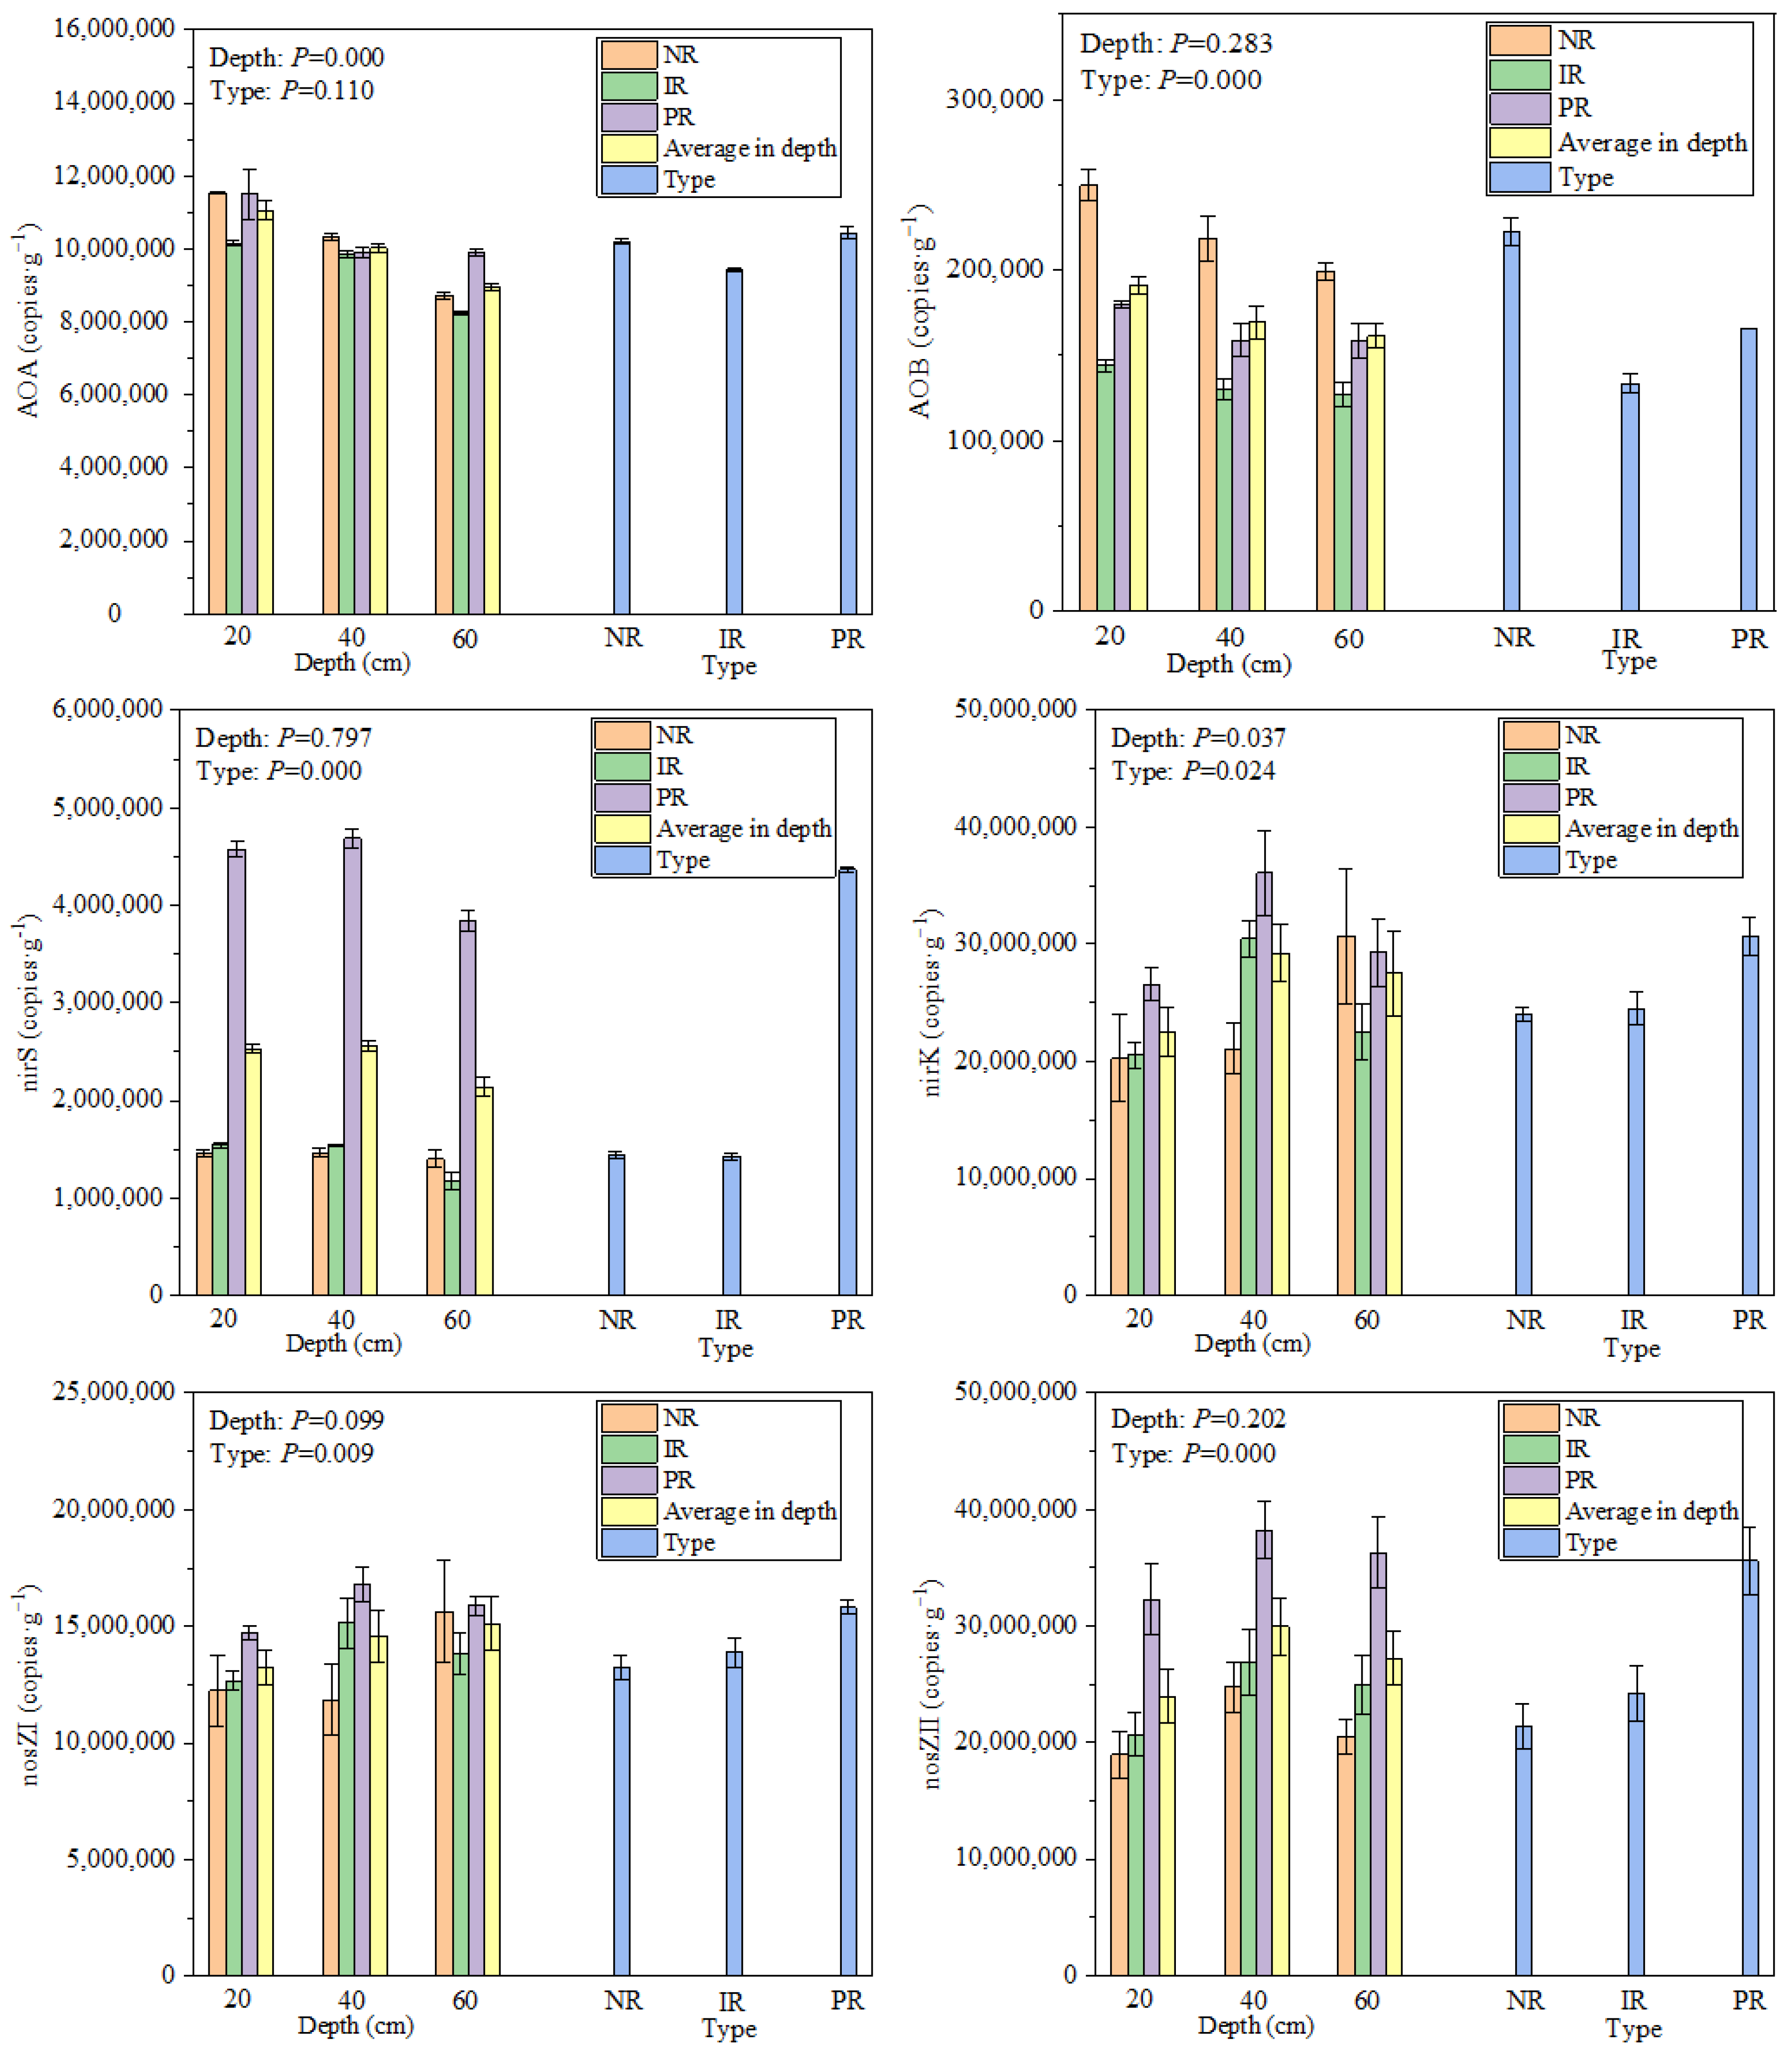
3.3. Nitrification and Denitrification Gene Abundance Characteristics

In Figure 7, the difference in AOA gene abundance in revetment is not statistically significant. AOB, nirS, nosZI, and nosZII gene abundance variations are significant in the revetment but not in the soil depth. The AOB gene was most abundant in NR (2.22 ± 0.08 × 10⁵ copies/g) and least abundant in IR (1.34 ± 0.05 × 10⁵ copies/g). PR had the highest level of nirS gene abundance (4.37 ± 0.03 × 10⁶ copies g−1), which was 3.02 times and 3.07 times greater than that of NR and IR, respectively. The maximum number of nosZI copies per genome (1.58 ± 0.03 × 10⁷ copies·g−1) was found in PR, which was 1.19 and 1.14 times more abundant than NR and IR, respectively. The maximum number of copies of the nosZII gene (3.56 ± 0.28 × 10⁷ copies·g−1) was found in PR, which was 1.66 and 1.47 times more abundant than NR and IR, respectively. Both soil depth and revetment showed a substantial change in nirK gene abundance.

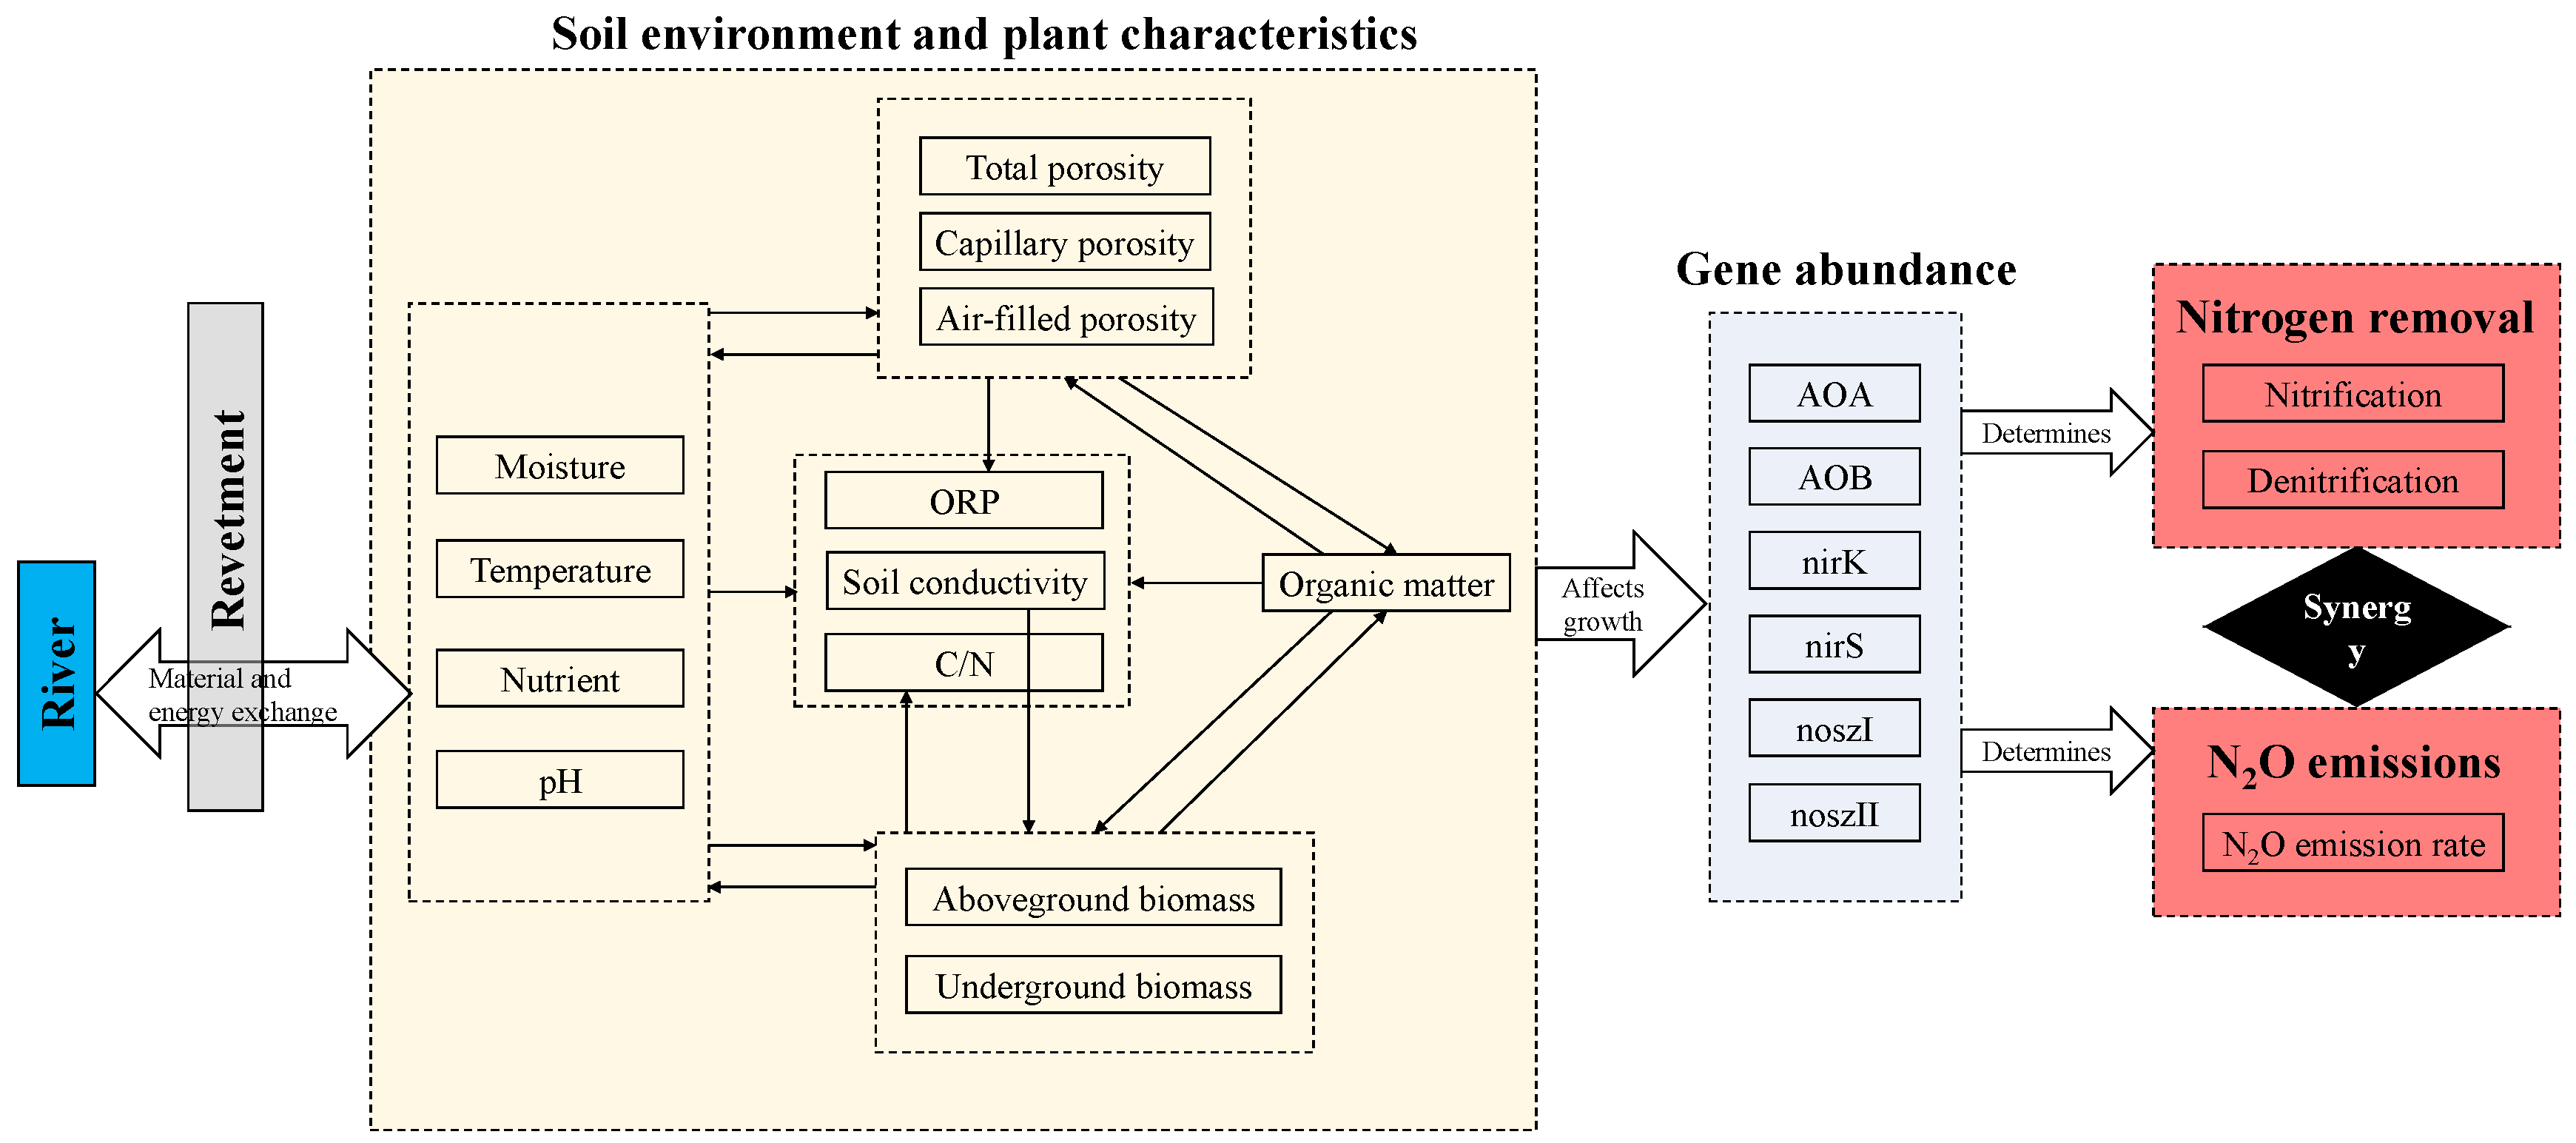
3.4. Interactions within Soil Ecosystems

As shown in Figure 8, soil moisture is significantly negatively correlated with AB and UB. TN and SOM are significantly negatively correlated with AB and not significantly correlated with UB. Soil moisture is significantly positively correlated with TP and CP, while the correlation with SOM and soil porosity is not significant. TP, CP, and moisture are significantly negatively correlated with ORP, and UB is significantly positively correlated with ORP. The C/N ratio is significantly positively correlated with SOM and significantly negatively correlated with AB.

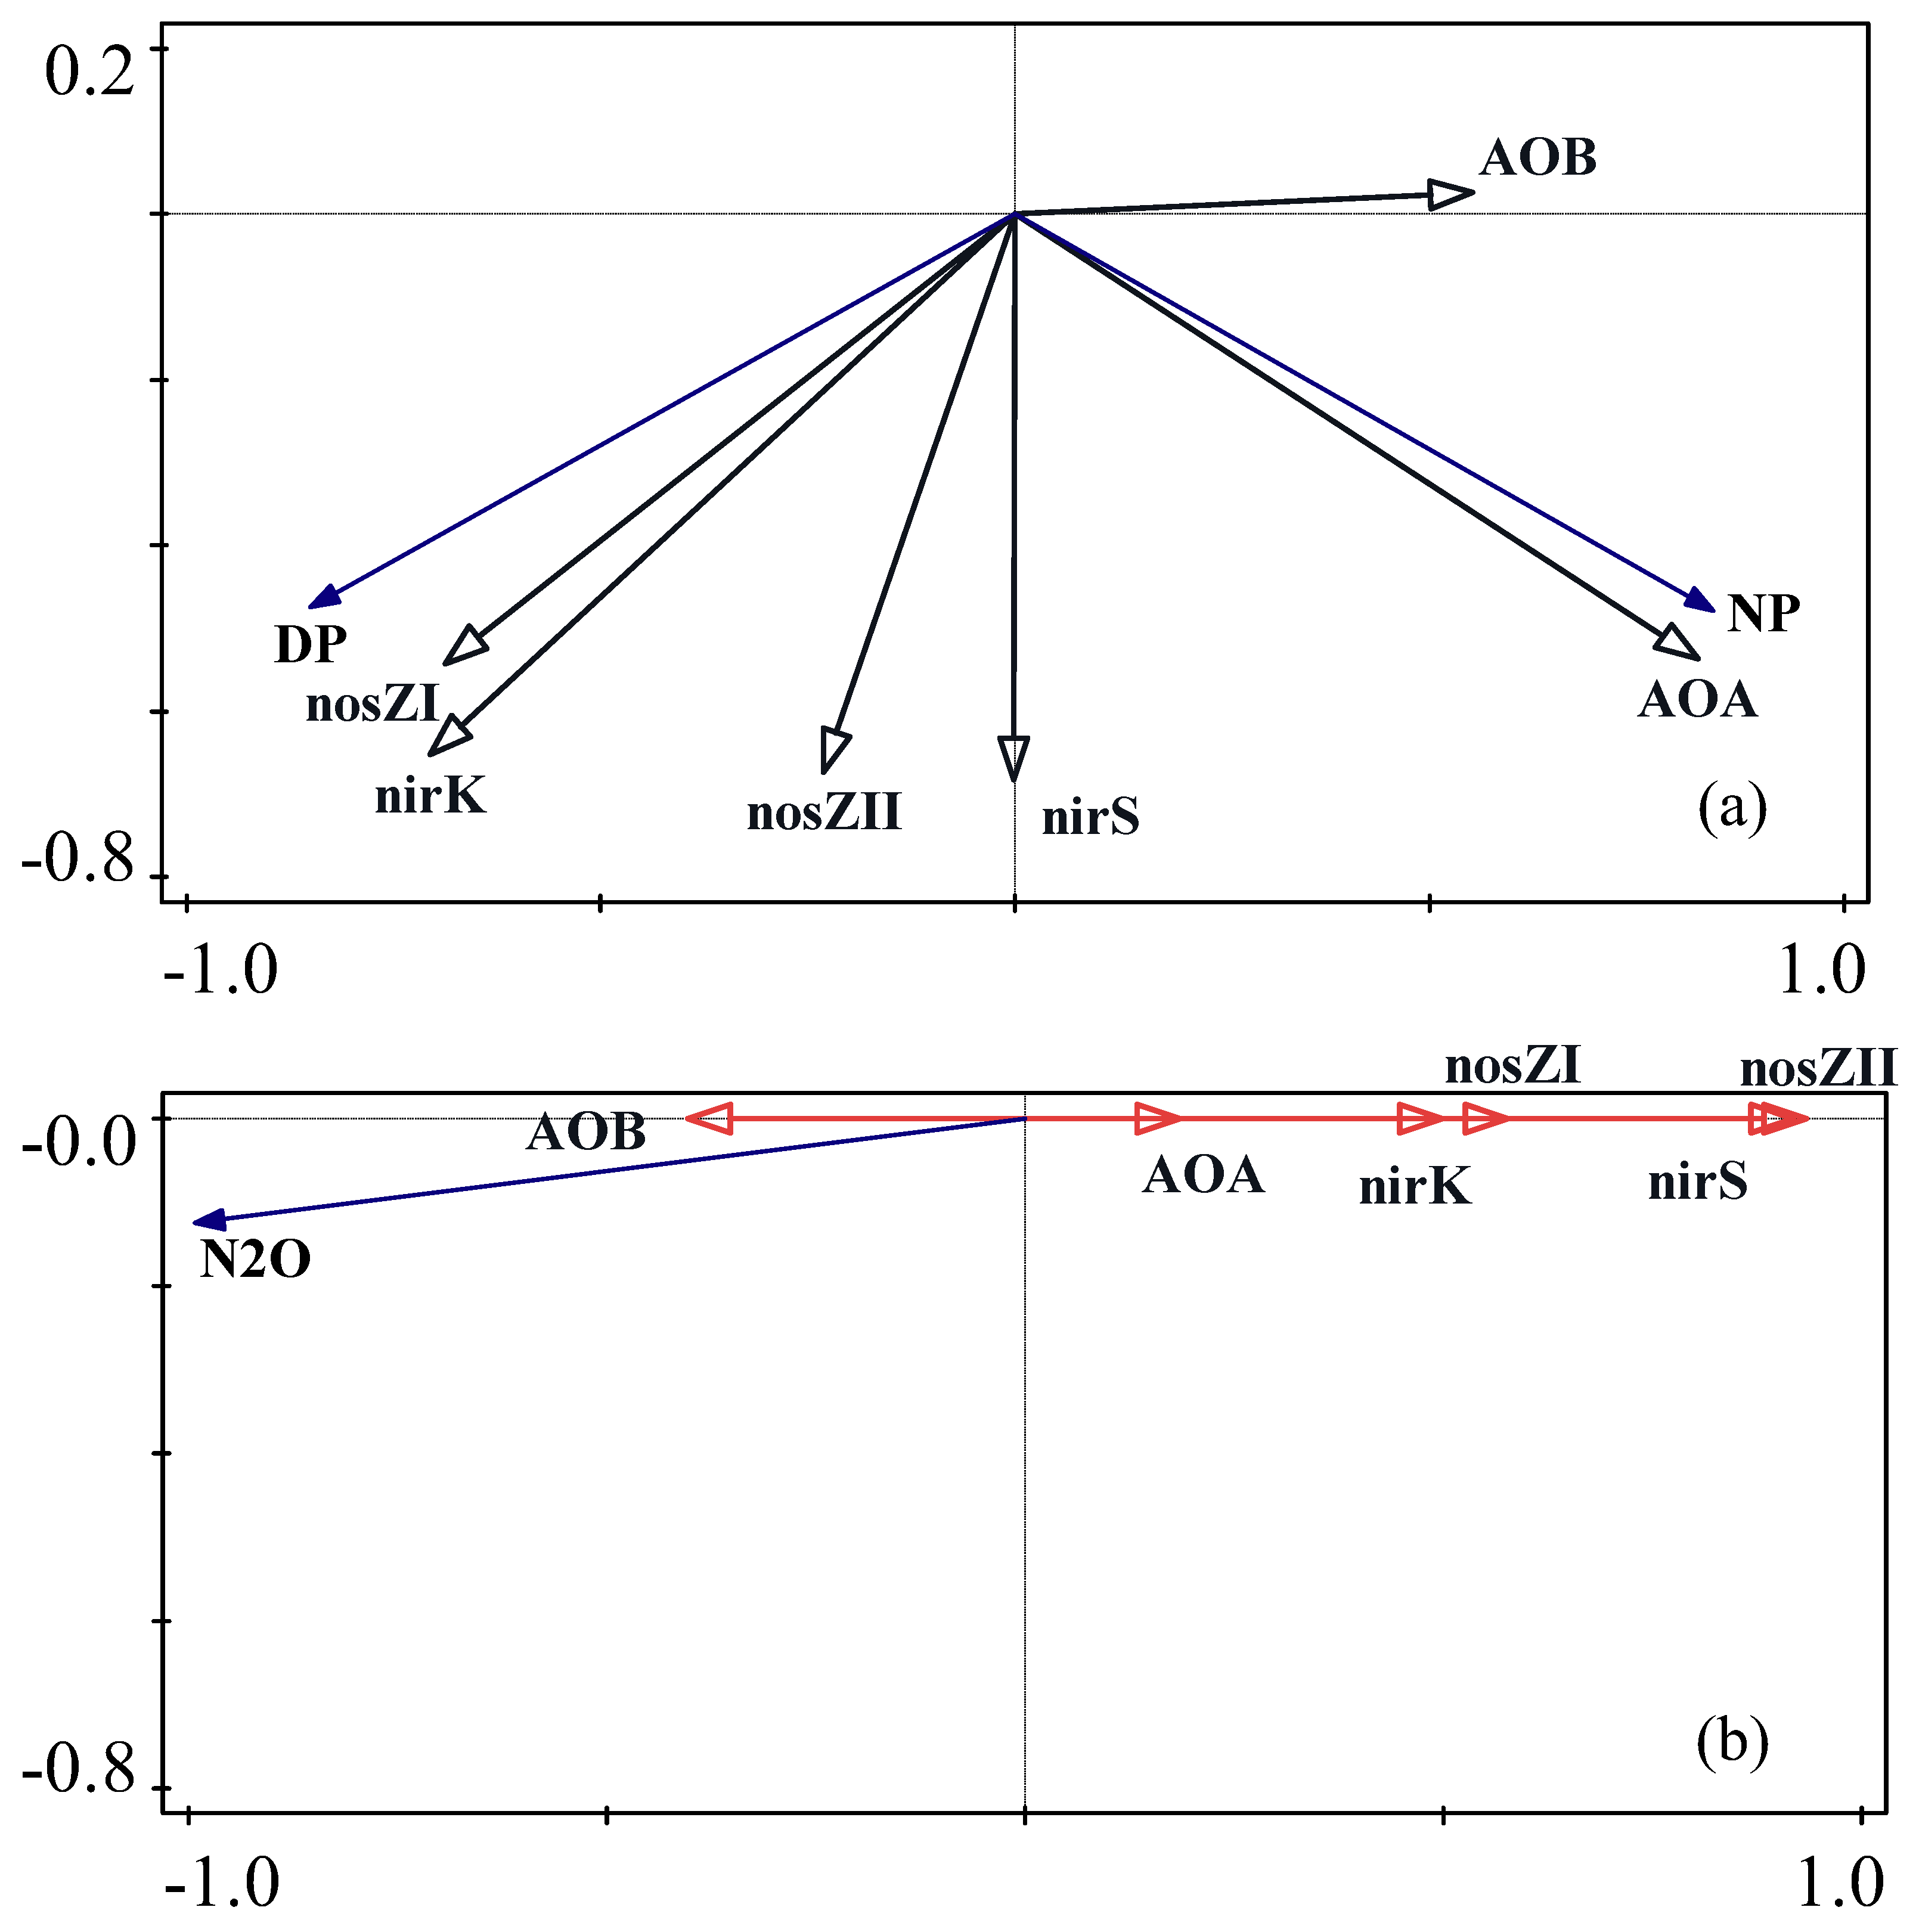
3.5. Correlation and Redundancy Analysis of Soil Ecosystems and the Abundance of Nitrification and Denitrification Microbial Genes

According to Figure 9, there is a significant positive correlation between AOA and NP, a weak positive correlation between AOB and NP, a weak negative correlation between AOA and AOB and DP, a non-significant negative correlation between AOA and N2O emissions, and a significant positive correlation between AOB and N2O emissions. As opposed to nirS, nirK, nosZI, and nosZ being significantly negatively connected with N2O emissions, nirK, nosZI, and nosZII were significantly favorably correlated with DP. Significantly favorable correlations between AOA and soil temperature, SOM, TN, NO3, and UB were found. AOB was strongly inversely connected with AB and considerably positively correlated with N2O emission, moisture, C/N, SOM, TN, NH4+, TP, and CP. Significantly negative correlations between the C/N, SOM, and NH4+ and nirS, nirK, nosZI, and nosZII were found. DP is primarily influenced by nirK, NP is primarily influenced by AOA, and the N2O emission rate is primarily influenced by nosZII, as seen in Figure 10.

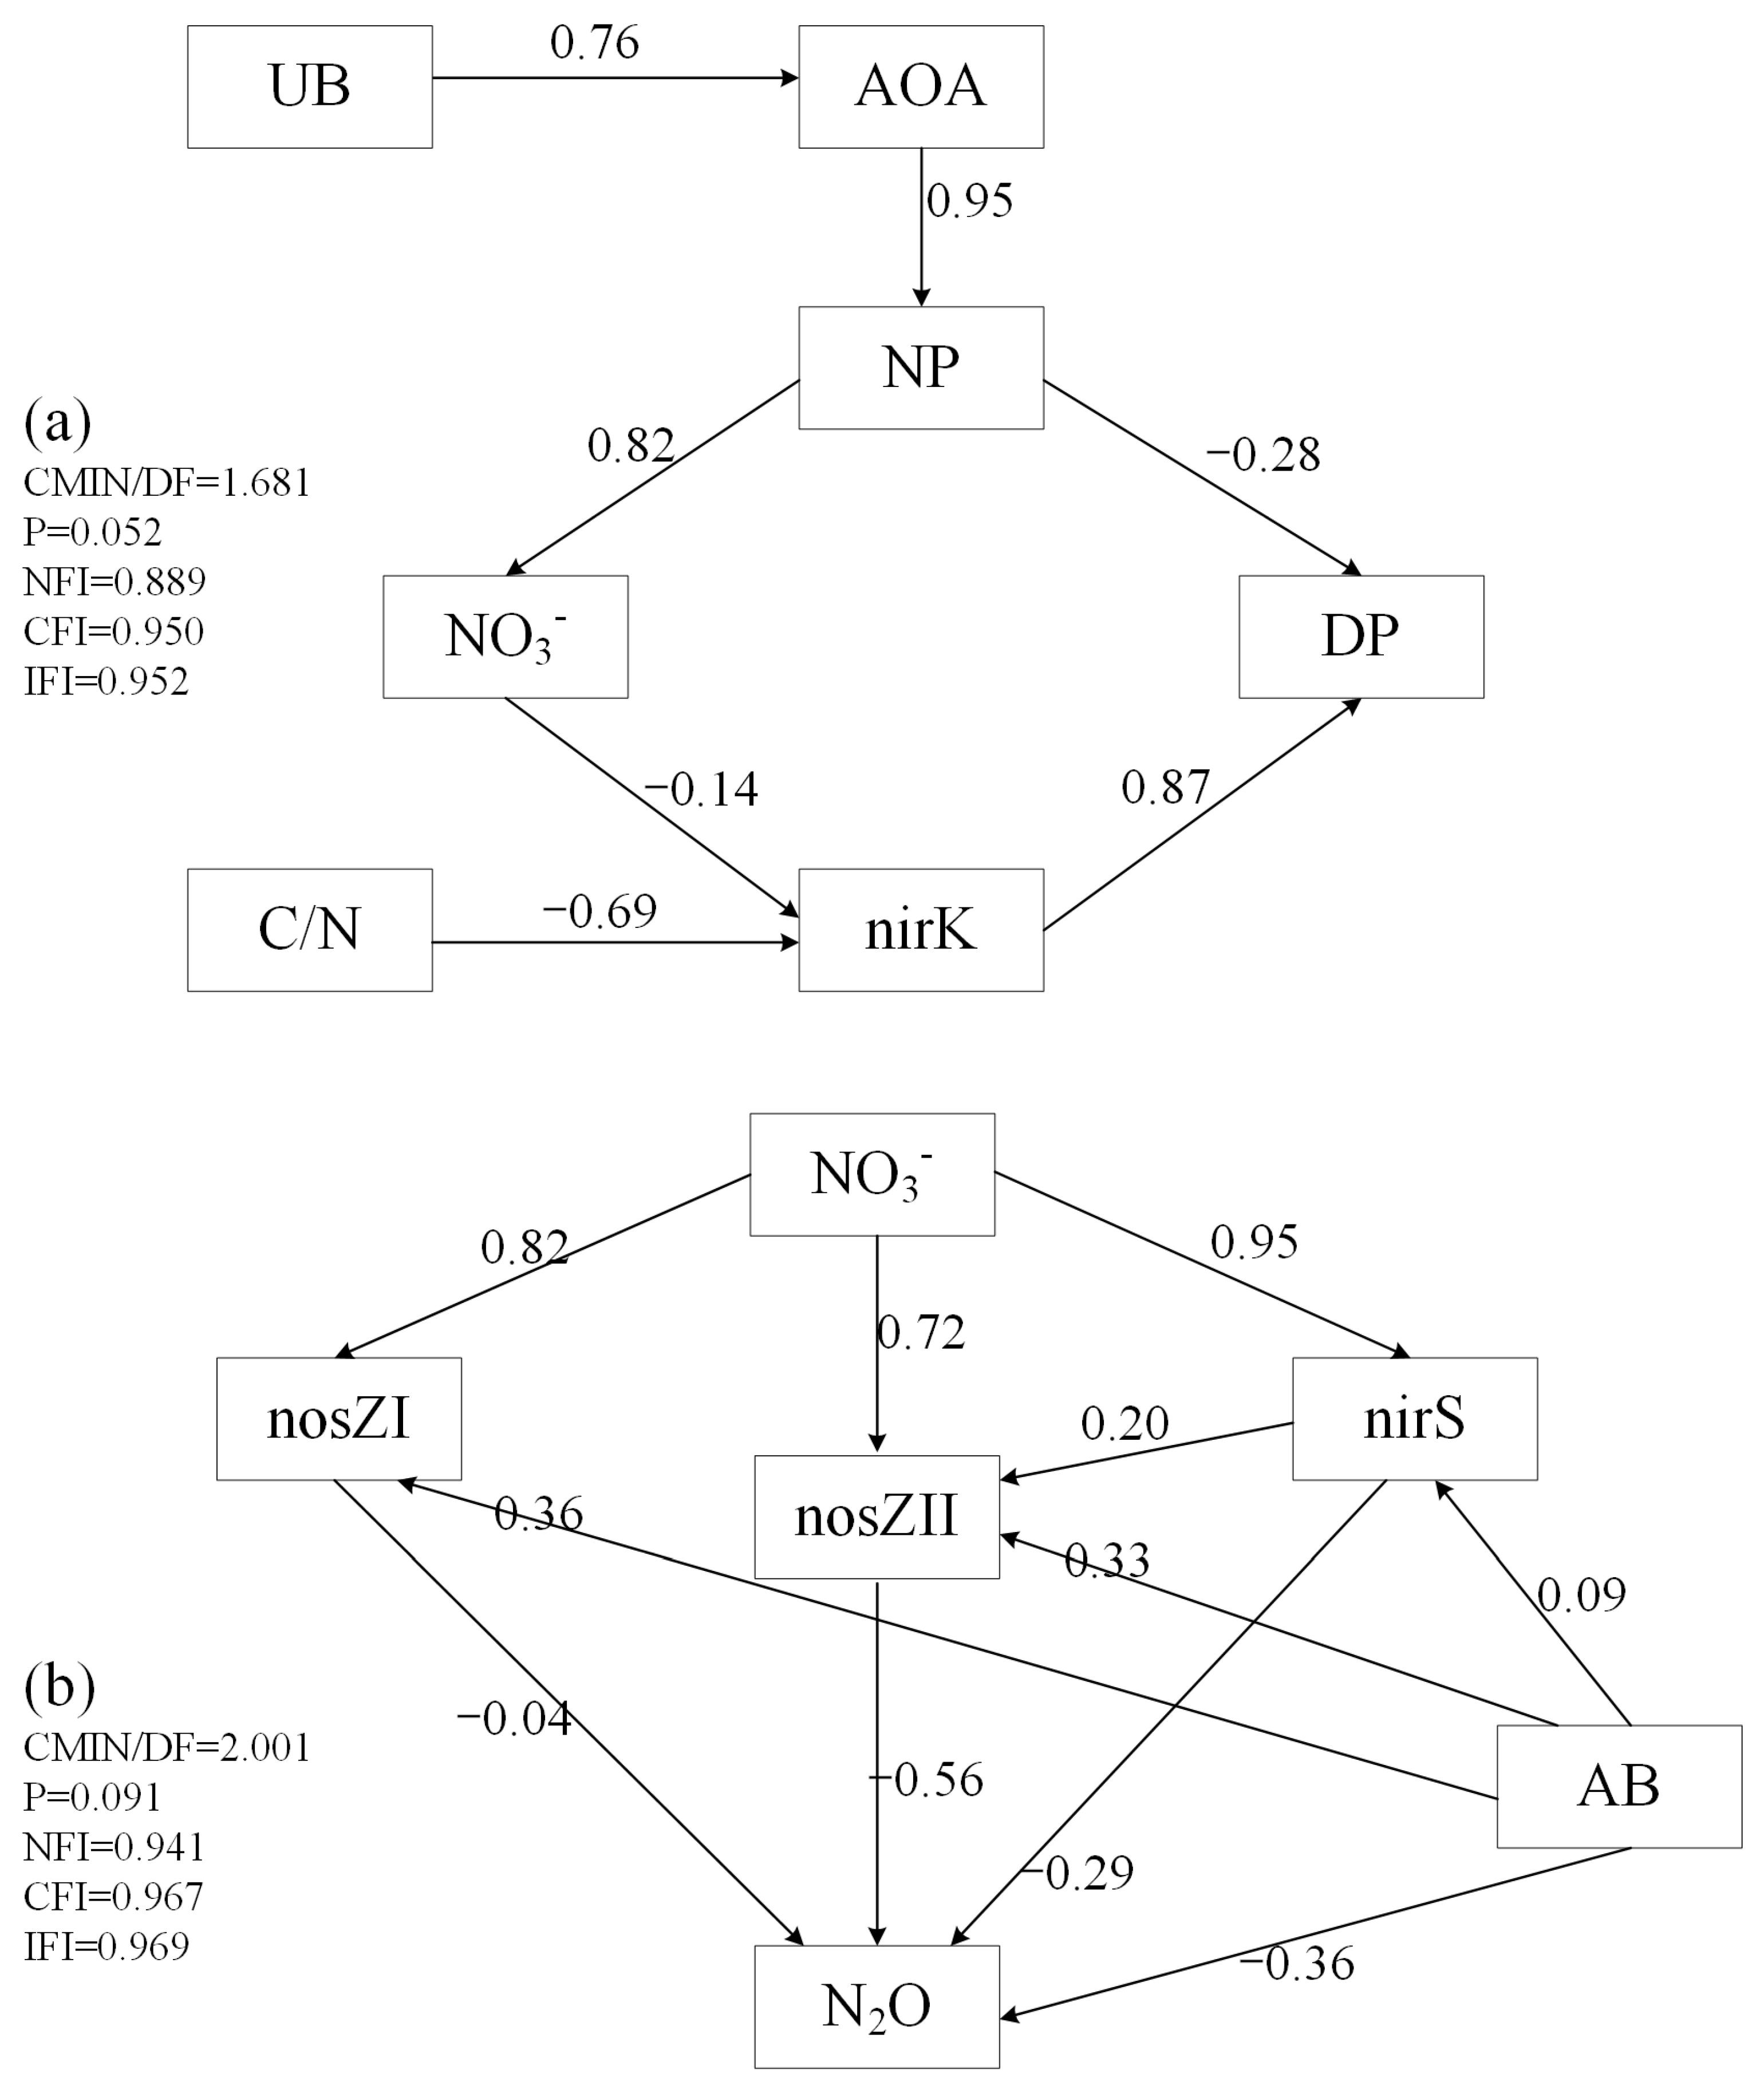
3.6. Structural Equation Model

In the denitrification model (Figure 11a and Table 1) (CMIN/DF = 1.681, p = 0.052, NFI = 0.889, CFI = 0.950, IFI = 0.952; these indicators show that the quality of the model fitting data is good), the direct influence of nirK on DP is the highest; however, the indirect effect of C/N on DP is also significant. The C/N can affect DP by acting on nirK; UB and AOA can affect DP through NP. NirS, nosZI, and nosZII have a direct impact on N2O emissions according to the N2O emission model (Figure 11b and Table 1) (CMIN/DF = 2.001, p = 0.091, NFI = 0.941, CFI = 0.967, IFI = 0.969, these indicators show that the quality of the model fitting data is good). By altering nirS, nosZI, and nosZII, NO3 can have an impact on N2O emissions. Additionally, we discovered that nosZII can be impacted by nirS. The biggest effects are caused directly by nosZII and indirectly by NO3.

4. Discussion

4.1. Revetment Affects AOA, AOB, nirS, nirK, nosZI, nosZII at RRI

For AOA and AOB, the difference in gene abundance of AOA is not significant across different revetment types. However, the gene abundance of AOB at the NR is significantly higher than the IR and PR (Figure 7). This result can be collectively explained from four aspects: (1) In the summer, the RRI has high soil moisture and abundant anaerobic conditions. AOB relies on dissolved oxygen in soil moisture for growth [25,26,27]. The NR has high efficiency in the exchange of river water and soil moisture [1]. This allows timely replenishment of river water after soil moisture evaporation, with dissolved oxygen included. Additionally, the NR experiences more frequent dry–wet alternation [1], disrupting soil aggregates and resulting in significantly higher TP and CP [28,29,30,31] (Figure 3). This not only increases soil water storage space but also enhances the efficiency of river water replenishment [32,33], providing more opportunities for AOB to obtain dissolved oxygen. (2) The transport of soil nutrients relies on the process of water transport, and the natural revetment (NR) has more frequent exchanges of substances and energy between soil water and river water. In this process, there are more opportunities to obtain ammonium nitrogen [1], resulting in a significantly higher ammonium nitrogen content (Figure 4). This provides more substrates for AOB, leading to a significantly higher gene abundance of AOB compared to other revetment types. (3) The more frequent dry–wet alternation at the NR accelerates the decomposition of soil aggregates, causing the release of nutrients such as organic matter encapsulated in soil aggregates into the soil [34,35]. This results in significantly higher nutrient contents such as SOM and TN in the NR (Figure 4). This provides more usable nutrients for AOB, leading to a higher gene abundance. (4) The increase in AB consumes more SOM, reduces the C/N ratio, and also inhibits the replenishment of soil oxygen [1]. AOB has lower affinity for oxygen and nutrients [25,27,36,37,38]. Therefore, the smaller aboveground biomass at the NR is more favorable for the growth of AOB.
For nirS, nirK, nosZI, and nosZII, their gene abundances in the PR are significantly higher than in the NR and IR (Figure 7). This is because the soil moisture in PR is less than NR, and the dry–wet alternation in PR releases a higher content of organic matter and receives a higher nutrient replenishment from river water compared to IR. These factors result in significantly higher aboveground biomass in PR (Figure 5), providing a more stable anaerobic environment for denitrifying microorganisms and favoring the metabolic activity of denitrifying microorganisms [19,39,40,41].

4.2. Revetment Affects Denitrification Potential at RRI

In the revetment, the difference in NP was not substantial (Figure 6). This is due to the fact that AOA is the primary determinant of NP and that differences in AOA are only significant in soil depth (Figure 7). However, some researchers contend that in neutral or alkaline soils, AOB should be the primary catalyst for nitrification [42]. We think that this is connected to the hot summer soil temperatures [14,43,44]. However, it is also connected to the RRI’s more prevalent anoxic environment [25,26,27,45]. In the revetment, the difference in DP was large, and PR’s DP was significantly higher than that of NR and IR’s (PR > IR > NR) (Figure 6). This is simple to understand because nirK, nosZI, and nosZII are significantly positively correlated with DP, and their abundance differences in the revetment (PR > IR > NR) are significant.
As shown in Figure 12, the moisture exchange frequency in PR is higher than in IR, and the organic matter released during dry–wet alternation is more abundant in PR. And the soil permeability in PR is better than NR [1]. These factors result in significantly higher belowground biomass of plants in PR compared to NR and IR, providing more nutrients and oxygen for AOA and promoting their growth [46,47,48]. This leads to a significantly higher gene abundance of AOA in PR compared to NR and IR (Figure 7). The NP in PR is significantly higher, providing more substrates (nitrate nitrogen) for the denitrification process. Meanwhile, the dry–wet alternation frequency in PR is higher than in IR, and the organic matter absorbed by PR plants is more than in NR. These factors result in a significantly lower carbon-to-nitrogen ratio in PR soil compared to NR and IR, promoting the decomposition of organic matter and the release of nitrogen. Under the combined influence of nitrate nitrogen and carbon-to-nitrogen ratio, the gene abundance of nirK in PR is significantly higher than in NR and IR, and the DP of PR is also higher than in NR and IR.

4.3. Revetment Affects N2O Emissions at RRI

This study’s findings show that AOB is significantly positively correlated with N2O emissions and that AOA is not significantly correlated with N2O emissions, showing that AOB contributes more to N2O emissions than AOA does and that the nitrification process is a key factor in the production of N2O in humid environments [49]. Compared to nirK, nirS is substantially less abundant (Figure 7). Strong negative correlations exist between nirS and N2O emissions, while minor negative correlations exist between nirK and N2O emissions. This suggests that nirS-type denitrifying bacteria are more likely than nirK-type denitrifying bacteria to complete denitrification [50,51]. Additionally, nosZII has a modest negative correlation with N2O emissions, while nosZI has a high negative correlation. This demonstrates that nosZII denitrifying bacteria have a stronger affinity for N2O than nosZI [52,53,54,55]. According to our research, nitrification and abiotic variables may be significant N2O producers, and denitrification at the RRI is advantageous to N2O consumption. This phenomenon has the following justification: (1) The RRI frequently receives river water and has a high groundwater level, contributing to a rich anaerobic environment in the soil [1], where N2O reductase is particularly sensitive to oxygen levels [56]. Denitrifying bacteria always select nitrogen oxides as an alternate electron acceptor when oxygen is scarce, leading to complete denitrification and low N2O emissions [57,58]. (2) The NO3 concentration in our study location is relatively low. Denitrifying bacteria will utilize all denitrification intermediates (NO2, NO, and N2O) to their greatest advantage when nitrate is scarce, which promotes complete denitrification and low N2O emissions [59,60]. The revetment (PR< IR< NR) has a considerable difference in N2O emissions. This is due to the revetment’s distinct differences in the quantity of denitrifying bacteria, particularly nosZII (PR > IR > NR); nosZII are more likely to undergo complete denitrification. This study demonstrates that the primary variable affecting N2O emissions is nosZII because nosZII is usually genetically capable of reducing N2O but cannot produce N2O [51,61]. Notably, we discovered a strong association between nosZII and nirS. This may suggest that when anaerobic conditions are stable, nirS carries out complete denitrification. When anaerobic conditions are unstable, nirS carries out incomplete denitrification, and in this case, nosZII utilizes the byproduct of incomplete denitrification (N2O).
As shown in Figure 13, the moisture exchange frequency and efficiency in PR are more conducive to the increase in both aboveground and belowground biomass. A larger belowground biomass can promote the growth of AOA, resulting in higher NP and providing more substrates (nitrate nitrogen) for denitrification. A larger aboveground biomass can stabilize the anaerobic environment in the soil. Therefore, the gene abundances of nirS, nosZI, and nosZII in PR are significantly higher than in NR and IR (Figure 7). These denitrifying microorganisms reduce N2O emissions through complete denitrification under oxygen and nitrogen limitations [57,58,60].

5. Conclusions

The research results indicate that the impact of revetments on NP in the RRI is not significant, but revetments can affect nitrogen removal and N2O emissions in the RRI by influencing DP. The soil moisture in PR is less than NR, and the moisture exchange frequency is greater than IR. This results in higher aboveground and belowground biomass in PR compared to NR and IR. Compared to NR and IR, in PR, plant roots decompose a greater amount of soil organic matter into simpler organic compounds by breaking down complex molecules such as polysaccharides, nucleic acids, and proteins in the soil organic matter, making these compounds more readily absorbed by the plants. A larger belowground biomass can provide nutrients and oxygen for AOA, promoting the nitrification process and providing more substrates (nitrate nitrogen) for denitrification. The lower C/N ratio accelerates the decomposition of organic matter in the soil and the release of nitrogen. These factors lead to a significantly higher abundance of the nirK gene in PR compared to NR and IR. Since nirK is the main influencing factor for denitrification potential in the RRI, the denitrification potential of PR is significantly higher than NR and IR. Additionally, a higher aboveground biomass can stabilize the anaerobic environment in the soil, increasing the gene abundances of nirS, noszI, and noszII. This results in a significantly lower N2O emission capacity in PR compared to NR and IR. These findings comprehensively describe the mechanisms by which revetments impact nitrogen removal and N2O emissions in the RRI, enable the development of riparian zones that combine nitrogen removal and greenhouse gas emission reduction, and offer more precise instructions for the design of urban revetments.

Author Contributions

Conceptualization, Z.M.; Methodology, Z.M.; Software, Z.M.; Validation, C.X.; Formal analysis, R.J., J.W. and Y.Q.; Investigation, Z.M.; Resources, C.X.; Data curation, Z.M.; Writing—original draft, Z.M.; Writing—review & editing, C.X. and R.J.; Supervision, C.X., J.W. and Y.Q.; Project administration, S.C.; Funding acquisition, S.C. All authors have read and agreed to the published version of the manuscript.

Funding

This research was funded by the National Natural Science Foundation of China (No. 32271934).

Data Availability Statement

The original contributions presented in the study are included in the article, further inquiries can be directed to the corresponding author.

Conflicts of Interest

The authors declare that they have no known competing financial interests or personal relationships that could have appeared to influence the work reported in this paper.

Abbreviations

AbbreviationsFull Name
RRIRiver–riparian interface
PRPermeable revetment
NRNatural revetment
IRImpermeable revetment
NPNitrification potential
DPDenitrification potential
TPTotal porosity
CPCapillary porosity
AFPAir-filled porosity
ORPOxidation–reduction potential
TNTotal nitrogen
SOMSoil organic matter
ABPlant aboveground biomass
UBPlant underground biomass

References

  1. Man, Z.; Xie, C.; Jiang, R.; Liang, A.; Wu, H.; Che, S. Effects of revetments on soil ecosystems in the urban river-riparian interface. iScience 2022, 25, 105277. [Google Scholar] [CrossRef] [PubMed]
  2. Adekalu, K.O.; Olorunfemi, I.A.; Osunbitan, J.A. Grass mulching effect on infiltration, surface runoff and soil loss of three agricultural soils in Nigeria. Bioresour. Technol. 2007, 98, 912–917. [Google Scholar] [CrossRef]
  3. Liu, X.; Vidon, P.; Jacinthe, P.-A.; Fisher, K.; Baker, M. Seasonal and geomorphic controls on N and P removal in riparian zones of the US Midwest. Biogeochemistry 2014, 119, 245–257. [Google Scholar] [CrossRef]
  4. Hester, E.T.; Brooks, K.E.; Scott, D.T. Comparing reach scale hyporheic exchange and denitrification induced by in-stream restoration structures and natural streambed morphology. Ecol. Eng. 2018, 115, 105–121. [Google Scholar] [CrossRef]
  5. Mayer, P.M.; Reynolds, S.K., Jr.; McCutchen, M.D.; Canfield, T.J. Meta-Analysis of Nitrogen Removal in Riparian Buffers. J. Environ. Qual. 2007, 36, 1172–1180. [Google Scholar] [CrossRef] [PubMed]
  6. Shen, J.-P.; Zhang, L.-M.; Di, H.J.; He, J.-Z. A review of ammonia-oxidizing bacteria and archaea in Chinese soils. Front. Microbiol. 2012, 3, 296. [Google Scholar] [CrossRef] [PubMed]
  7. Hou, S.; Ai, C.; Zhou, W.; Liang, G.; He, P. Structure and assembly cues for rhizospheric nirK- and nirS-type denitrifier communities in long-term fertilized soils. Soil Biol. Biochem. 2018, 119, 32–40. [Google Scholar] [CrossRef]
  8. Yan, L.; Xie, C.; Xu, X.; Che, S. The influence of revetment types on soil denitrification in the adjacent tidal urban riparian zones. J. Hydrol. 2019, 574, 398–407. [Google Scholar] [CrossRef]
  9. Yan, L.; Xie, C.; Liang, A.; Jiang, R.; Che, S. Effects of revetments on soil denitrifying communities in the urban river-riparian interface. Chemosphere 2021, 263, 128077. [Google Scholar] [CrossRef]
  10. Ravishankara, A.R.; Daniel, J.S.; Portmann, R.W. Nitrous Oxide (N2O): The Dominant Ozone-Depleting Substance Emitted in the 21st Century. Science 2009, 326, 123–125. [Google Scholar] [CrossRef]
  11. Stocker, T. Climate Change 2013: The Physical Science Basis: Working Group I Contribution to the Fifth Assessment Report of the Intergovernmental Panel on Climate Change; Cambridge University Press: Cambridge, UK, 2014. [Google Scholar]
  12. Man, Z.; Xie, C.; Qin, Y.; Che, S. Effects of Revetments on Nitrification and Denitrification Potentials in the Urban River–Riparian Interface. Land 2024, 13, 333. [Google Scholar] [CrossRef]
  13. Xu, X.; Ran, Y.; Li, Y.; Zhang, Q.; Liu, Y.; Pan, H.; Guan, X.; Li, J.; Shi, J.; Dong, L.; et al. Warmer and drier conditions alter the nitrifier and denitrifier communities and reduce N2O emissions in fertilized vegetable soils. Agric. Ecosyst. Environ. 2016, 231, 133–142. [Google Scholar] [CrossRef]
  14. E Taylor, A.; Giguere, A.T.; Zoebelein, C.M.; Myrold, D.D.; Bottomley, P.J. Modeling of soil nitrification responses to temperature reveals thermodynamic differences between ammonia-oxidizing activity of archaea and bacteria. ISME J. 2016, 11, 896–908. [Google Scholar] [CrossRef] [PubMed]
  15. Xu, X.; Liu, X.; Li, Y.; Ran, Y.; Liu, Y.; Zhang, Q.; Li, Z.; He, Y.; Xu, J.; Di, H. High temperatures inhibited the growth of soil bacteria and archaea but not that of fungi and altered nitrous oxide production mechanisms from different nitrogen sources in an acidic soil. Soil Biol. Biochem. 2017, 107, 168–179. [Google Scholar] [CrossRef]
  16. Portilho, I.I.R.; Savin, M.C.; Borges, C.D.; Tsai, S.M.; Mercante, F.M.; Roscoe, R.; de Carvalho, L.A. Maintenance of N cycling gene communities with crop-livestock integration management in tropical agriculture systems. Agric. Ecosyst. Environ. 2018, 267, 52–62. [Google Scholar] [CrossRef]
  17. Mukhtar, H.; Lin, Y.-P.; Lin, C.-M.; Petway, J.R. Assessing thermodynamic parameter sensitivity for simulating temperature responses of soil nitrification. Environ. Sci. Process. Impacts 2019, 21, 1596–1608. [Google Scholar] [CrossRef]
  18. Tzanakakis, V.A.; Taylor, A.E.; Bakken, L.R.; Bottomley, P.J.; Myrold, D.D.; D¨orsch, P. Relative activity of ammonia oxidizing archaea and bacteria determine nitrification-dependent N2O emissions in Oregon forest soils. Soil Biol. Biochem. 2019, 139, 107612. [Google Scholar] [CrossRef]
  19. Sun, H.; Jiang, S. A review on nirS-type and nirK-type denitrifiers via a scientometric approach coupled with case studies. Environ. Sci. Process. Impacts 2022, 24, 221–232. [Google Scholar] [CrossRef]
  20. Andrade, R.; Mancini, M.; Teixeira, A.F.d.S.; Silva, S.H.G.; Weindorf, D.C.; Chakraborty, S.; Guilherme, L.R.G.; Curi, N. Proximal sensor data fusion and auxiliary information for tropical soil property prediction: Soil texture. Geoderma 2022, 422, 115936. [Google Scholar] [CrossRef]
  21. Man, Z.; Weng, B.; Yang, Y.; Gong, X.; Li, M.; Yu, Z. Effects of the Freezing–Thawing Cycle Mode on Alpine Vegetation in the Nagqu River Basin of the Qinghai–Tibet Plateau. Water 2019, 11, 2122. [Google Scholar] [CrossRef]
  22. Yan, L.; Xie, C.; Xu, X.; Che, S. Effects of revetment type on the spatial distribution of soil nitrification and denitrification in adjacent tidal urban riparian zones. Ecol. Eng. 2019, 132, 65–74. [Google Scholar] [CrossRef]
  23. Liu, W.; Xiong, Z.; Liu, H.; Zhang, Q.; Liu, G. Catchment agriculture and local environment affecting the soil denitrification potential and nitrous oxide production of riparian zones in the Han River Basin, China. Agric. Ecosyst. Environ. 2016, 216, 147–154. [Google Scholar] [CrossRef]
  24. Zhao, S.; Wang, Q.; Zhou, J.; Yuan, D.; Zhu, G. Linking abundance and community of microbial N2O-producers and N2O-reducers with enzymatic N2O production potential in a riparian zone. Sci. Total. Environ. 2018, 642, 1090–1099. [Google Scholar] [CrossRef] [PubMed]
  25. Stewart, F.J.; Ulloa, O.; DeLong, E.F. Microbial meta transcriptomics in a permanent marine oxygen minimum zone. Environ. Microbiol. 2012, 14, 23–40. [Google Scholar] [CrossRef] [PubMed]
  26. Liu, S.; Hu, B.; He, Z.; Zhang, B.; Tian, G.; Zheng, P.; Fang, F. Ammonia-oxidizing archaea have better adaptability in oxygenated/hypoxic alternant conditions compared to ammonia-oxidizing bacteria. Appl. Microbiol. Biotechnol. 2015, 99, 8587–8596. [Google Scholar] [CrossRef]
  27. Du, J.; Meng, L.; Qiu, M.; Chen, S.; Zhang, B.; Song, W.; Cong, P.; Zheng, X. Ammonia-oxidizing archaea and ammonia-oxidizing bacteria communities respond differently in oxy-gen-limited habitats. Front. Environ. Sci. 2022, 10, 976618. [Google Scholar] [CrossRef]
  28. Rajaram, G.; Erbach, D. Effect of wetting and drying on soil physical properties. J. Terramechanics 1999, 36, 39–49. [Google Scholar] [CrossRef]
  29. Cosentino, D.; Chenu, C.; Le Bissonnais, Y. Aggregate stability and microbial community dynamics under drying–wetting cycles in a silt loam soil. Soil Biol. Biochem. 2006, 38, 2053–2062. [Google Scholar] [CrossRef]
  30. Jozefaciuk, G.; Czachor, H. Impact of organic matter, iron oxides, alumina, silica and drying on mechanical and water stability of artificial soil aggregates. Assessment of new method to study water stability. Geoderma 2014, 221–222, 1–10. [Google Scholar] [CrossRef]
  31. Xu, X.-T.; Shao, L.-J.; Huang, J.-B.; Xu, X.; Liu, D.-Q.; Xian, Z.-X.; Jian, W.-B. Effect of wet-dry cycles on shear strength of residual soil. Soils Found. 2021, 61, 782–797. [Google Scholar] [CrossRef]
  32. Wang, T.; Franz, T.E.; Zlotnik, V.A.; You, J.; Shulski, M.D. Investigating soil controls on soil moisture spatial variability: Numerical simulations and field observations. J. Hydrol. 2015, 524, 576–586. [Google Scholar] [CrossRef]
  33. Wang, Y.; Zhang, Z.; Guo, Z.; Xiong, P.; Peng, X. The dynamic changes of soil air-filled porosity associated with soil shrinkage in a Vertisol. Eur. J. Soil Sci. 2022, 73, e13313. [Google Scholar] [CrossRef]
  34. Morugán-Coronado, A.; García-Orenes, F.; Mataix-Solera, J.; Arcenegui, V.; Mataix-Beneyto, J. Short-term effects of treated wastewater irrigation on Mediterranean calcareous soil. Soil Tillage Res. 2011, 112, 18–26. [Google Scholar] [CrossRef]
  35. Rabbi, S.M.; Warren, C.R.; Swarbrick, B.; Minasny, B.; McBratney, A.B.; Young, I.M. Microbial decomposition of organic matter and wetting–drying promotes aggregation in artificial soil but porosity increases only in wet-dry condition. Geoderma 2024, 447, 116924. [Google Scholar] [CrossRef]
  36. Martens-Habbena, W.; Berube, P.M.; Urakawa, H.; de la Torre, J.R.; Stahl, D.A. Ammonia oxidation kinetics determine niche separation of nitrifying Archaea and Bacteria. Nature 2009, 461, 976–979. [Google Scholar] [CrossRef]
  37. Verhamme, D.T.; I Prosser, J.; Nicol, G.W. Ammonia concentration determines differential growth of ammonia-oxidising archaea and bacteria in soil microcosms. ISME J. 2011, 5, 1067–1071. [Google Scholar] [CrossRef]
  38. Wang, C.; Tang, S.; He, X.; Ji, G. The abundance and community structure of active ammonia-oxidizing archaea and ammonia-oxidizing bacteria shape their activities and contributions in coastal wetlands. Water Res. 2020, 171, 115464. [Google Scholar] [CrossRef] [PubMed]
  39. Desnues, C.; Michotey, V.D.; Wieland, A.; Zhizang, C.; Fourçans, A.; Duran, R.; Bonin, P.C. Seasonal and diel distributions of denitrifying and bacterial communities in a hypersaline microbial mat (Camargue, France). Water Res. 2007, 41, 3407–3419. [Google Scholar] [CrossRef] [PubMed]
  40. Knapp, C.W.; Dodds, W.K.; Wilson, K.C.; O’brien, J.M.; Graham, D.W. Spatial Heterogeneity of Denitrification Genes in a Highly Homogenous Urban Stream. Environ. Sci. Technol. 2009, 43, 4273–4279. [Google Scholar] [CrossRef]
  41. Graham, D.W.; Trippett, C.; Dodds, W.K.; O’brien, J.M.; Banner, E.B.; Head, I.M.; Smith, M.S.; Yang, R.K.; Knapp, C.W. Correlations between in situ denitrification activity and nir-gene abundances in pristine and impacted prairie streams. Environ. Pollut. 2010, 158, 3225–3229. [Google Scholar] [CrossRef]
  42. Zhang, L.M.; Hu, H.W.; Shen, J.P.; He, J.Z. Ammonia-oxidizing archaea have more important role than ammo-nia-oxidizing bacteria in ammonia oxidation of strongly acidic soils. ISME J. 2012, 6, 1032–1045. [Google Scholar] [CrossRef] [PubMed]
  43. Duan, P.; Wu, Z.; Zhang, Q.; Fan, C.; Xiong, Z. Thermodynamic responses of ammonia-oxidizing archaea and bacteria explain N2O production from greenhouse vegetable soils. Soil Biol. Biochem. 2018, 120, 37–47. [Google Scholar] [CrossRef]
  44. Lin, Y.-P.; Ansari, A.; Wunderlich, R.F.; Lur, H.-S.; Cao, T.N.-D.; Mukhtar, H. Assessing the influence of environmental niche segregation in ammonia oxidizers on N2O fluxes from soil and sediments. Chemosphere 2022, 289, 133049. [Google Scholar] [CrossRef]
  45. Kim, J.; Jung, M.; Park, S.; Rijpstra, W.; Sinninghe Damsté, J.; Madsen, E.; Rhee, S. Cultivation of a highly enriched ammonia-oxidizing archaeon of thaumarchaeotal group I.1b from an agricultural soil. Environ. Microbiol. 2012, 14, 1528–1543. [Google Scholar] [CrossRef]
  46. Jin, K.; Shen, J.; Ashton, R.W.; White, R.P.; Dodd, I.C.; Parry, M.A.J.; Whalley, W.R. Wheat root growth responses to horizontal stratification of fertiliser in a water-limited environment. Plant Soil 2014, 386, 77–88. [Google Scholar] [CrossRef]
  47. Lange, M.; Eisenhauer, N.; Sierra, C.A.; Bessler, H.; Engels, C.; Griffiths, R.I.; Mellado-Vázquez, P.G.; Malik, A.A.; Roy, J.; Scheu, S.; et al. Plant diversity increases soil microbial activity and soil carbon storage. Nat. Commun. 2015, 6, 6707. [Google Scholar] [CrossRef] [PubMed]
  48. Bengough, A.G.; Loades, K.; McKenzie, B.M. Root hairs aid soil penetration by anchoring the root surface to pore walls. J. Exp. Bot. 2016, 64, 1071–1078. [Google Scholar] [CrossRef]
  49. Huang, T.; Gao, B.; Hu, X.-K.; Lu, X.; Well, R.; Christie, P.; Bakken, L.R.; Ju, X.-T. Ammonia-oxidation as an engine to generate nitrous oxide in an intensively managed calcareous Fluvo-aquic soil. Sci. Rep. 2014, 4, 3950. [Google Scholar] [CrossRef]
  50. Jones, C.; Stres, B.; Rosenquist, M.; Hallin, S. Phylogenetic Analysis of Nitrite, Nitric Oxide, and Nitrous Oxide Res-piratory Enzymes Reveal a Complex Evolutionary History for Denitrification. Mol. Biol. Evol. 2008, 25, 1955–1966. [Google Scholar] [CrossRef] [PubMed]
  51. Graf, D.R.H.; Jones, C.M.; Hallin, S. Intergenomic Comparisons Highlight Modularity of the Denitrification Pathway and Underpin the Importance of Community Structure for N2O Emissions. PLoS ONE 2014, 9, e114118. [Google Scholar] [CrossRef]
  52. Yoon, S.; Nissen, S.; Park, D.; Sanford, R.A.; Löffler, F.E. Nitrous Oxide Reduction Kinetics Distinguish Bacteria Harboring Clade I NosZ from Those Harboring Clade II NosZ. Appl. Environ. Microbiol. 2016, 82, 3793–3800. [Google Scholar] [CrossRef] [PubMed]
  53. Suenaga, T.; Hori, T.; Riya, S.; Hosomi, M.; Terada, A. Enrichment, isolation, and characterization of high-affinity N2O-reducing bacteria in a gas-permeable membrane reactor. Environ. Sci. Technol. 2019, 53, 12101–12112. [Google Scholar] [CrossRef] [PubMed]
  54. Suenaga, T.; Riya, S.; Hosomi, M.; Terada, A. Biokinetic characterization and activities of N2O-reducing bacteria in response to various oxygen levels. Front. Microbiol. 2018, 9, 697–707. [Google Scholar] [CrossRef] [PubMed]
  55. Zhao, S.; Zhou, J.; Yuan, D.; Wang, W.; Zhou, L.; Pi, Y.; Zhu, G. NirS-type N2O-producers and nosZ II-type N2O-reducers determine the N2O emission potential in farmland rhizosphere soils. J. Soils Sediments 2019, 20, 461–471. [Google Scholar] [CrossRef]
  56. Thomson, A.J.; Giannopoulos, G.; Pretty, J.; Baggs, E.M.; Richardson, D.J. Biological sources and sinks of nitrous oxide and strategies to mitigate emissions. Philos. Trans. R. Soc. B Biol. Sci. 2012, 367, 1157–1168. [Google Scholar] [CrossRef] [PubMed]
  57. Cai, Y.; Ding, W.; Luo, J. Nitrous oxide emissions from Chinese maizeewheat rotation systems: A 3-year field measurement. Atmos. Environ. 2013, 65, 112–122. [Google Scholar] [CrossRef]
  58. Wu, L.; Tang, S.; He, D.; Wu, X.; Shaaban, M.; Wang, M.; Zhao, J.; Khan, I.; Zheng, X.; Hu, R.; et al. Conversion from rice to vegetable production increases N2O emission via increased soil organic matter mineralization. Sci. Total Environ. 2017, 583, 190–201. [Google Scholar] [CrossRef] [PubMed]
  59. Felgate, F.; Giannopoulos, G.; Sullivan, M.J.; Gates, A.J.; Clarke, T.A.; Baggs, E.; Rowley, G.; Richardson, D.J. The impact of copper, nitrate and carbon status on the emission of nitrous oxide by two species of bacteria with biochemically distinct denitri-fication pathways. Environ. Microbiol. 2012, 14, 1788–1800. [Google Scholar] [CrossRef] [PubMed]
  60. Juhanson, J.; Hallin, S.; Söderström, M.; Stenberg, M.; Jones, C.M. Spatial and phyloecological analyses of nosZ genes underscore niche differentiation amongst terrestrial N2O reducing communities. Soil Biol. Biochem. 2017, 115, 82–91. [Google Scholar] [CrossRef]
  61. Domeignoz-Horta, L.; Putz, M.; Spor, A.; Bru, D.; Breuil, M.; Hallin, S.; Philippot, L. Non-denitrifying nitrous oxide-reducing bacteria—An effective N2O sink in soil. Soil Biol. Biochem. 2016, 103, 376–379. [Google Scholar] [CrossRef]
Figure 1. Scientific hypothesis.
Land 13 01310 g001
Figure 2. The location of the study area and the distribution of sampling points, (a) is the natural revetment, (b) is the impermeable revetment, (c) is the permeable revetment, (d) is the quadrat and sample distribution, (e) is the depth.
Land 13 01310 g002
Figure 3. Soil physical properties at RRI, “Average in depth” refers to the average value for each soil layer.
Land 13 01310 g003
Figure 4. Soil chemical properties at RRI, “Average in depth” refers to the average value for each soil layer.
Land 13 01310 g004
Figure 5. Plant biomass at RRI, “Average in depth” refers to the average value for each soil layer.
Land 13 01310 g005
Figure 6. Nitrification potential, denitrification potential, and N2O emission rate at RRI, “Average in depth” refers to the average value for each soil layer.
Land 13 01310 g006
Figure 7. Nitrification and denitrification gene abundance at RRI, “Average in depth” refers to the average value for each soil layer.
Land 13 01310 g007
Figure 8. Correlation analysis among soil ecosystem elements, * indicates p ≤ 0.05.
Land 13 01310 g008
Figure 9. Correlation analysis of soil ecosystems and the abundance of nitrification and denitrification microbial genes, * indicates p ≤ 0.05.
Land 13 01310 g009
Figure 10. Redundancy analysis of nitrification potential, denitrification potential, and N2O emission rate, (a) is the RDA analysis of nitrification potential (NP) and denitrification potential (DP), and (b) is the RDA analysis of N2O emissions.
Land 13 01310 g010
Figure 11. The denitrification and N2O emission mechanism at RRI, (a) is the structural equation model of nitrification potential (NP) and denitrification potential (DP), and (b) is the structural equation model of N2O emissions.
Land 13 01310 g011
Figure 12. Mechanism of revetment on denitrification potential in the RRI.
Land 13 01310 g012
Figure 13. Mechanism of revetment on N2O emissions in the RRI.
Land 13 01310 g013
Table 1. Direct, indirect, and total benefits of environmental factors on denitrification and N2O emission at RRI.
DenitrificationDirect EffectsIndirect EffectsTotal Effects
nirK0.8700.87
C/N0−0.6003−0.6003
NO30−0.1218−0.1218
NP−0.28−0.099876−0.379876
AOA0−0.266−0.266
UB0−0.20216−0.20216
N2O EmissionsDirect EffectsIndirect EffectsTotal Effects
nosZII−0.560−0.56
nosZI−0.040−0.04
nirS−0.29−0.112−0.402
NO30−0.7115−0.7115
AB−0.36−0.2253−0.5853
Disclaimer/Publisher’s Note: The statements, opinions and data contained in all publications are solely those of the individual author(s) and contributor(s) and not of MDPI and/or the editor(s). MDPI and/or the editor(s) disclaim responsibility for any injury to people or property resulting from any ideas, methods, instructions or products referred to in the content.

