

Towards Uncovering Three Decades of LULC in the Brazilian Drylands: Caatinga Biome Dynamics (1985–2019)

 , ,
, ,  ,
,
Abstract
:1. Introduction
2. Materials and Methods
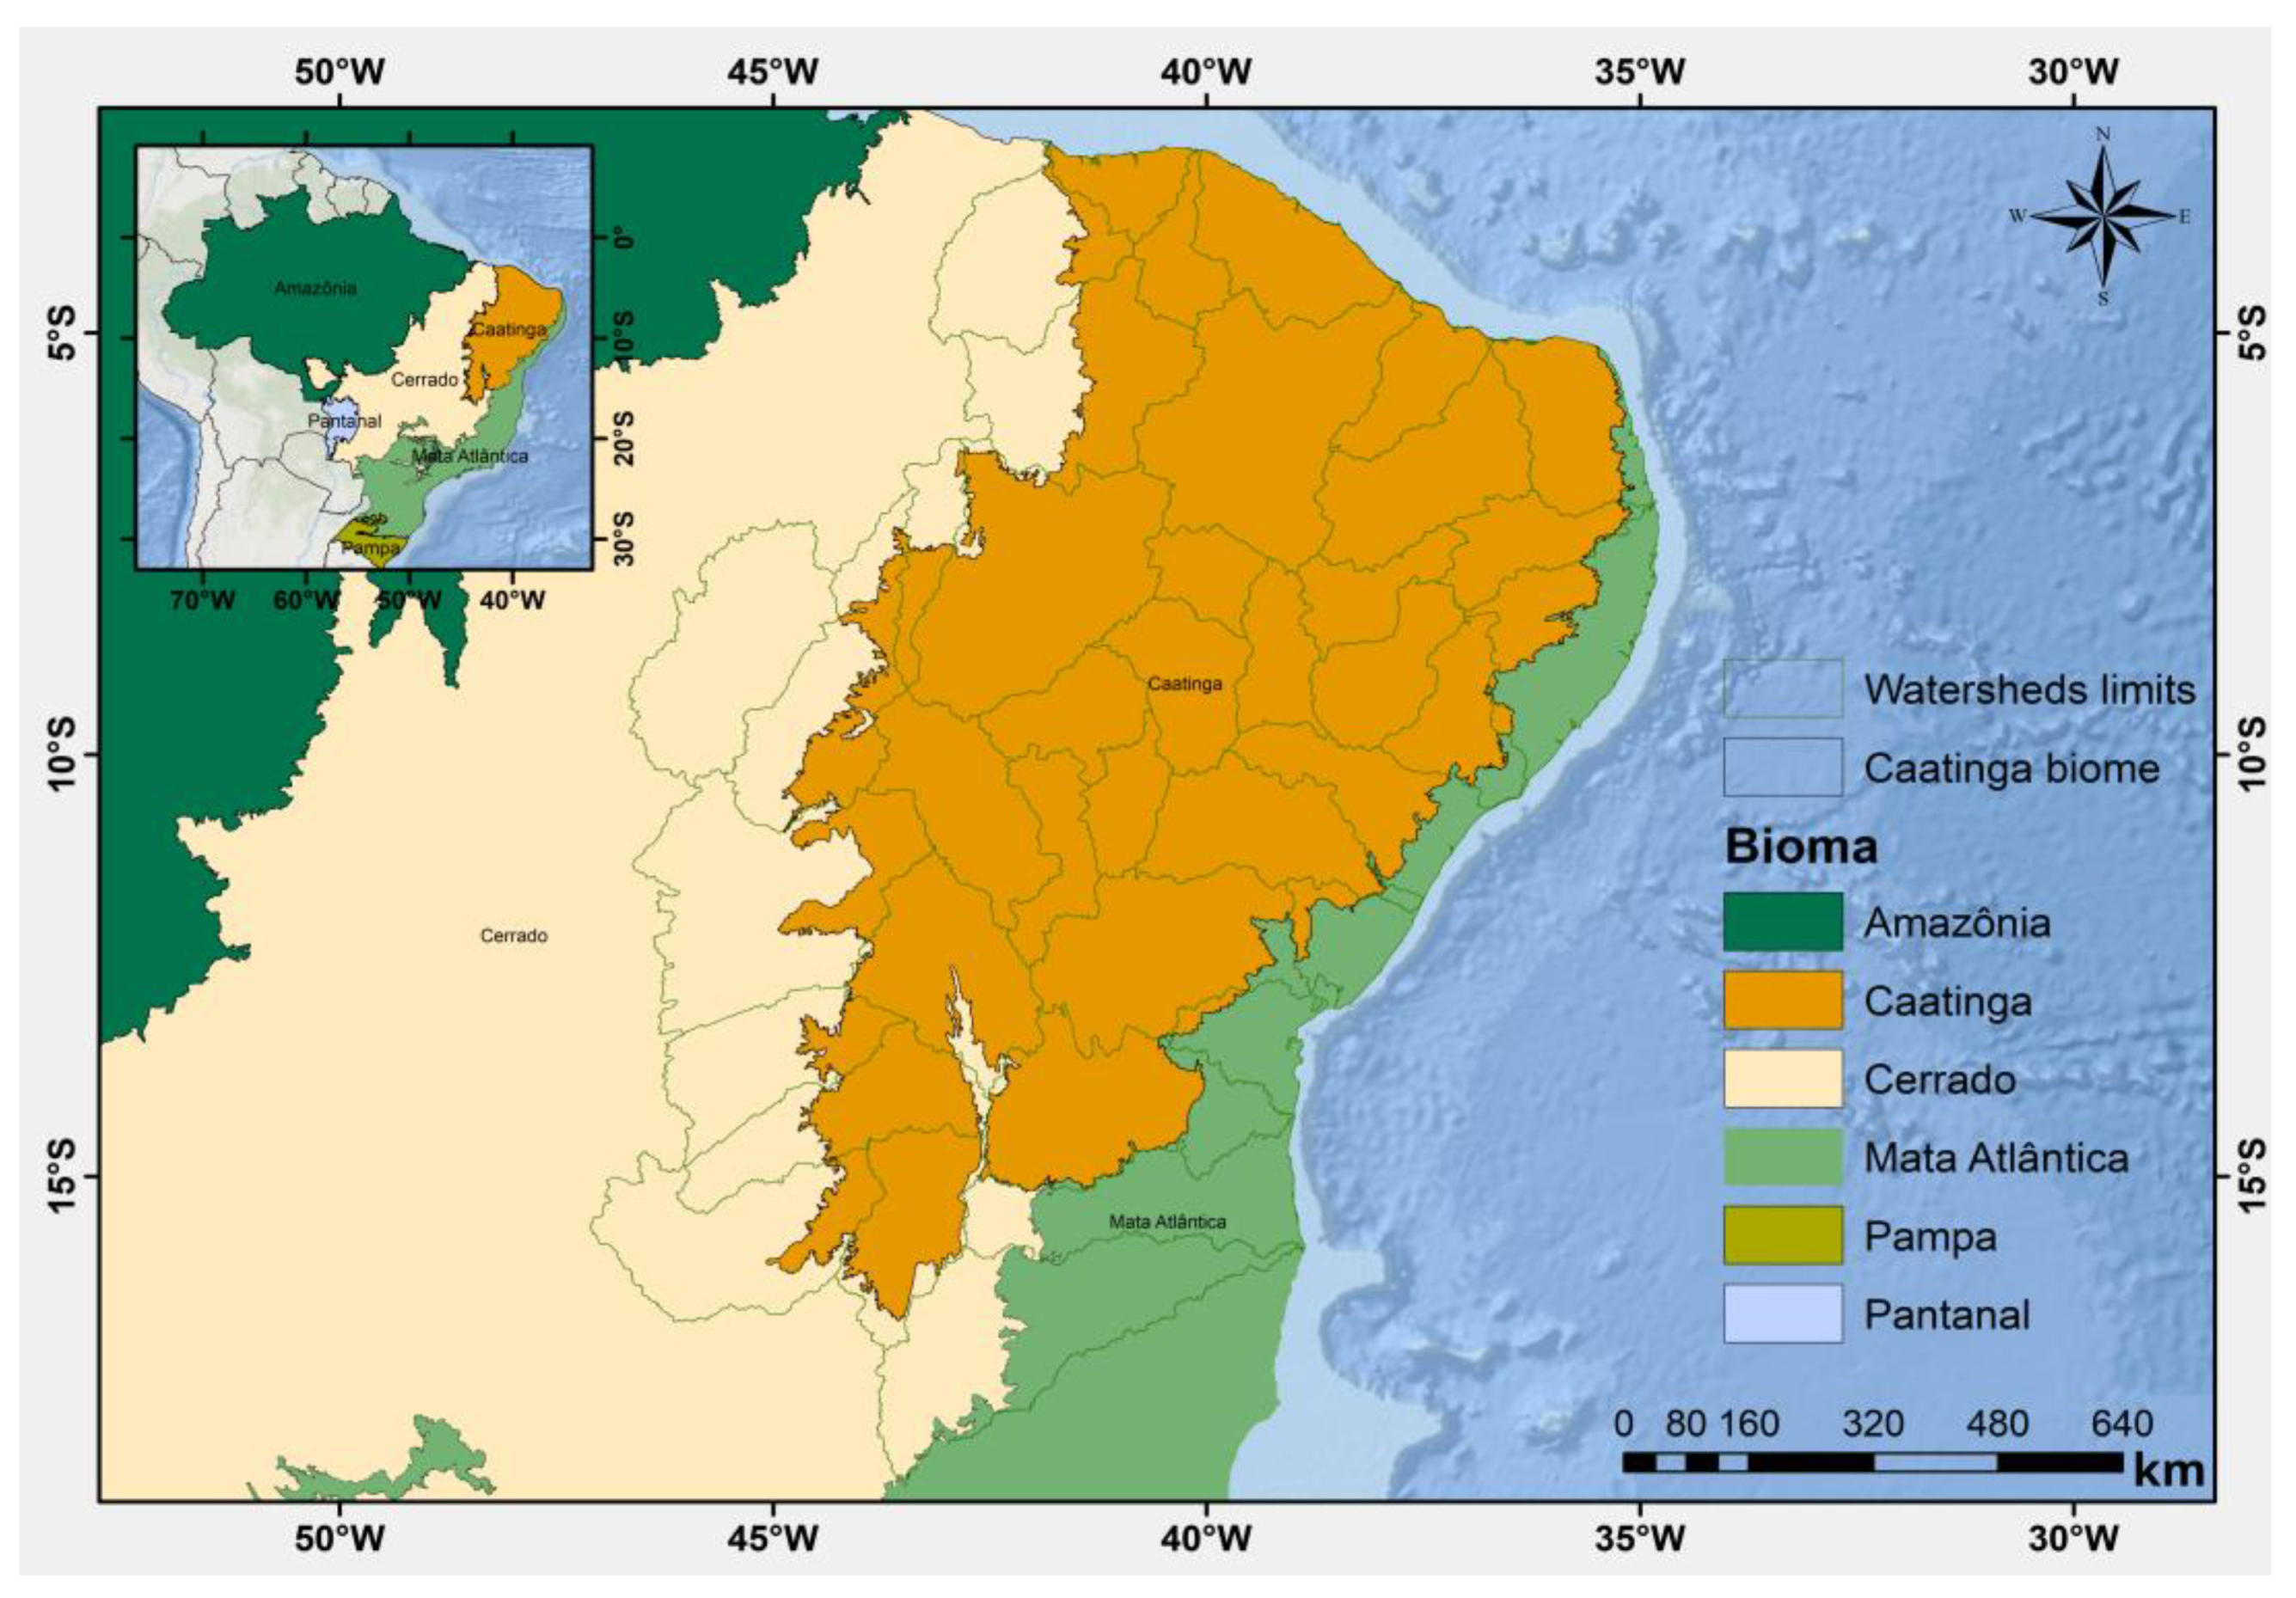
2.1. Study Area
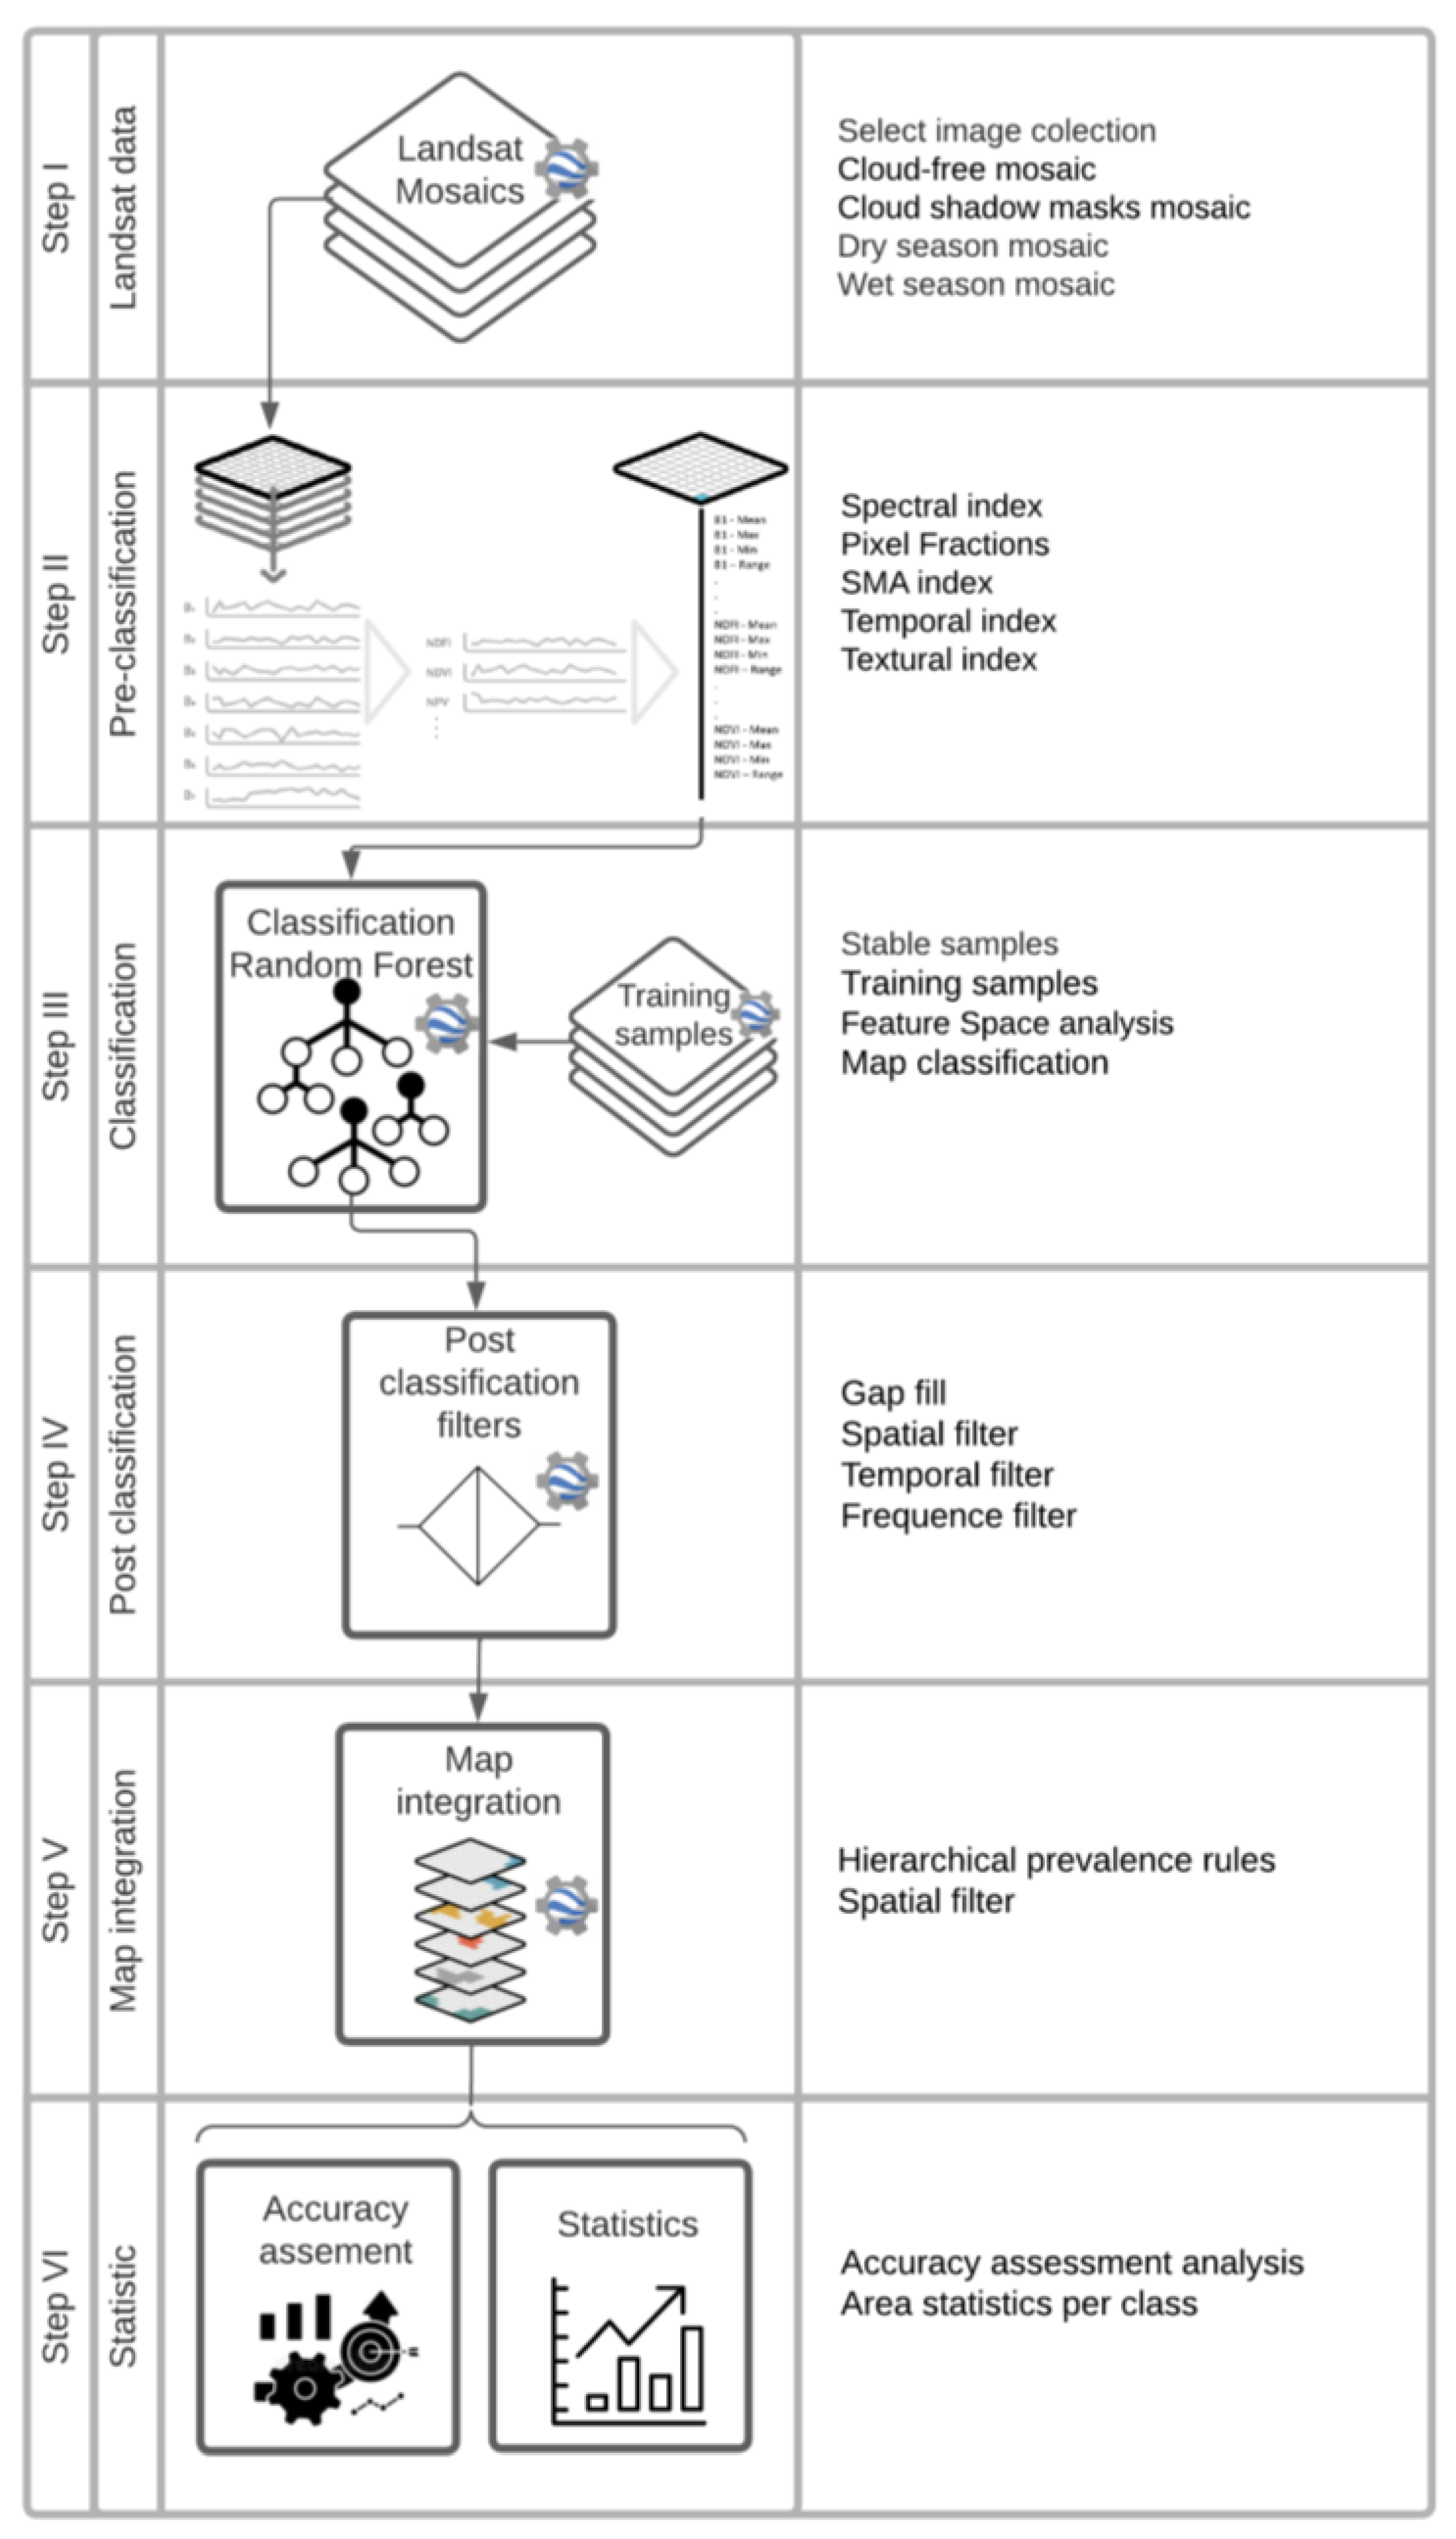
2.2. Land Use and Land Cover Strategy Mapping
2.3. Cross-Cutting Themes
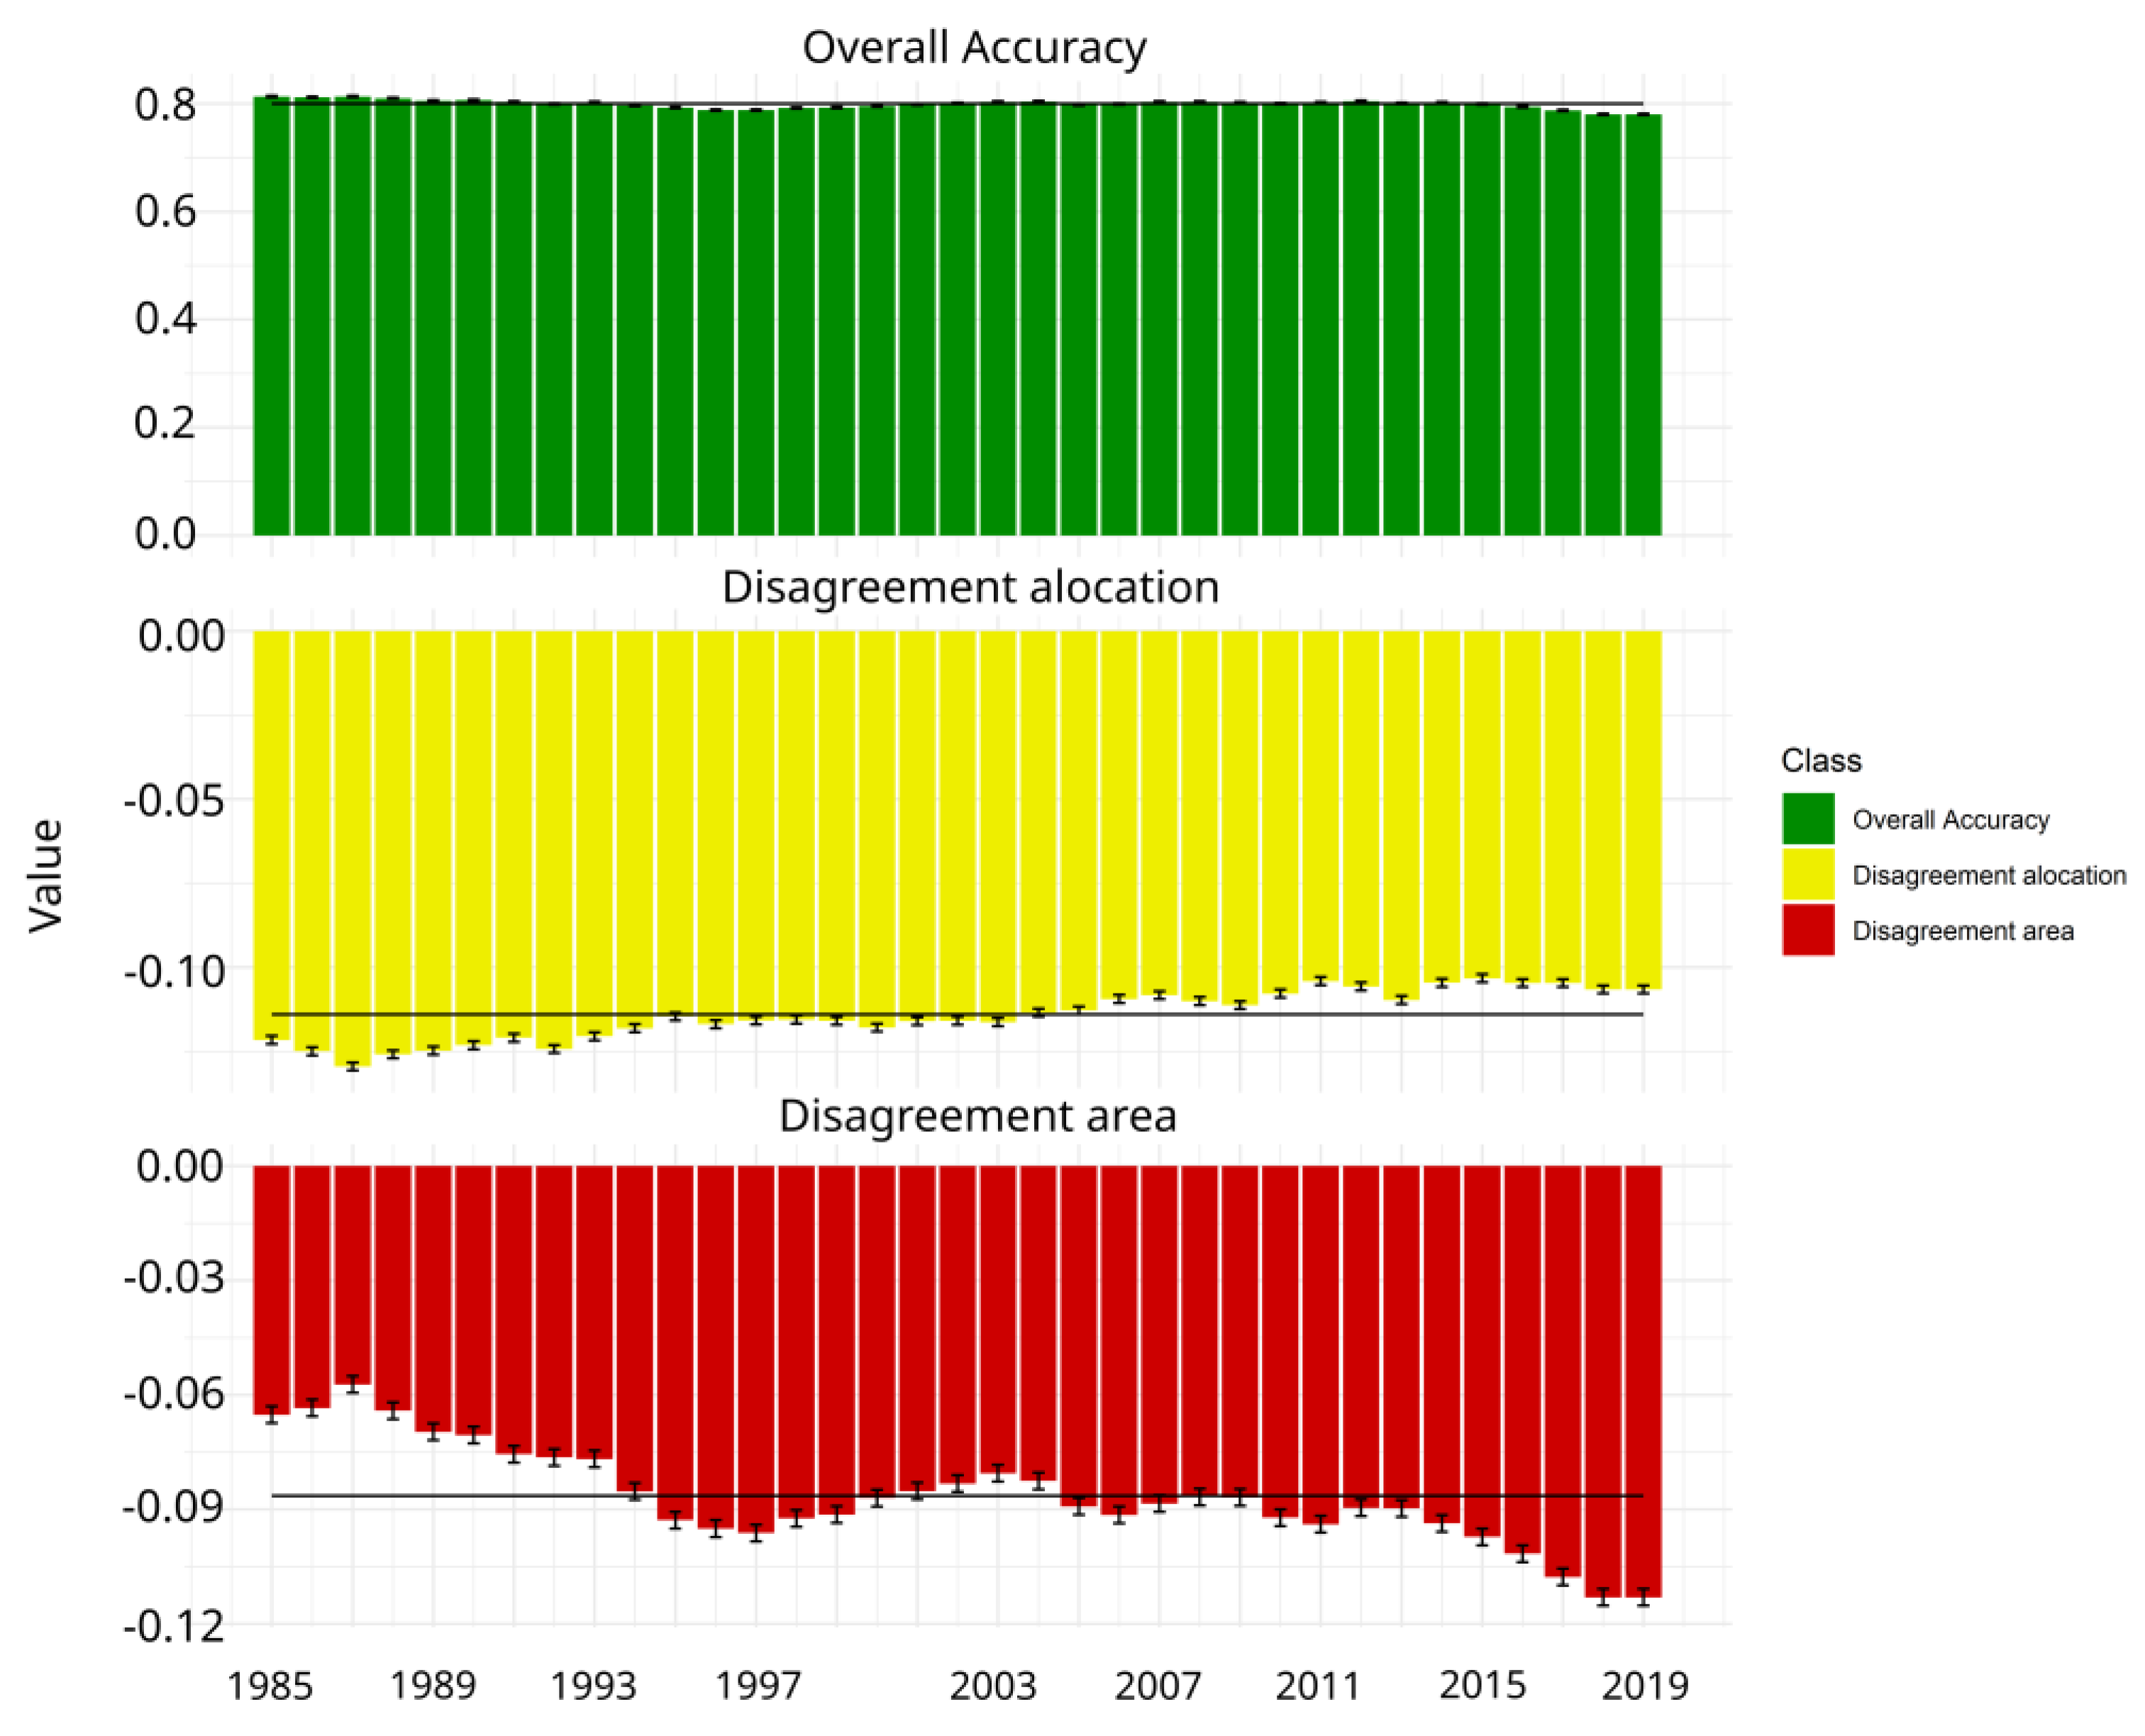
2.4. Accuracy Assessment
2.5. General Analysis
3. Results
4. Discussion
5. Conclusions
Author Contributions
Funding
Data Availability Statement
Acknowledgments
Conflicts of Interest
References
- Siegmund-Schultze, M. A Multi-Method Approach to Explore Environmental Governance: A Case Study of a Large, Densely Populated Dry Forest Region of the Neotropics. Environ. Dev. Sustain. 2021, 23, 1539–1562. [Google Scholar] [CrossRef]
- Santos, J.C.; Leal, I.R.; Almeida-Cortez, J.S.; Fernandes, G.W.; Tabarelli, M. Caatinga: The Scientific Negligence Experienced by a Dry Tropical Forest. Trop. Conserv. Sci. 2011, 4, 276–286. [Google Scholar] [CrossRef]
- Menezes, R.; Sampaio, E.; Giongo, V.; Pérez-Marin, A. Biogeochemical Cycling in Terrestrial Ecosystems of the Caatinga Biome. Braz. J. Biol. 2012, 72, 643–653. [Google Scholar] [CrossRef] [PubMed]
- Leal, I.R.; Da Silva, J.M.C.; Tabarelli, M.; Lacher, T.E. Changing the Course of Biodiversity Conservation in the Caatinga of Northeastern Brazil. Conserv. Biol. 2005, 19, 701–706. [Google Scholar] [CrossRef]
- Da Costa, C.R.G.; da Silva, M.G.; Da Costa, C.A.G.; Da Cunha, R.S.M.; De Sousa, M.M.; de Sousa, M.V.P.; Linhares, A.C.M.; de Sousa Silva, S.; de Lima Marques, A.; de Moura, D.C. Bioindicators of Behavior and Regeneration of a Caatinga Area in the Brazilian Semi-Arid-A Review. J. For. 2022, 9, 1–8. [Google Scholar] [CrossRef]
- Prăvălie, R. Drylands Extent and Environmental Issues. A global approach. Earth Sci. Rev. 2016, 161, 259–278. [Google Scholar] [CrossRef]
- Safriel, U.; Adeel, Z.; Puigdefabregas, J. Dryland Systems. In Ecosystems and Human Well-Being: Current State and Trends; Hassan, R., Scholes, R., Ash, N., Eds.; Island Press: Washington, DC, USA, 2005; Volume 1, pp. 623–662. ISBN 9781559632287. [Google Scholar]
- Davies, J.; Poulsen, L.; Schulte-Herbrüggen, B.; Mackinnon, K.; Crawhall, N.; Henwood, W.D.; Dudley, N.; Smith, J.; Gudka, M. Conserving Dryland Biodiversity; IUCN Publications Unit: Nairobi, Kenya, 2012. [Google Scholar]
- Fu, B.; Stafford-Smith, M. Dryland Social-Ecological Systems in Changing Environments; Fu, B., Stafford-Smith, M., Eds.; Springer Nature: Singapore, 2024; ISBN 978-981-99-9374-1. [Google Scholar]
- Marques, M.; Schwilch, G.; Lauterburg, N.; Crittenden, S.; Tesfai, M.; Stolte, J.; Zdruli, P.; Zucca, C.; Petursdottir, T.; Evelpidou, N.; et al. Multifaceted Impacts of Sustainable Land Management in Drylands: A Review. Sustainability 2016, 8, 177. [Google Scholar] [CrossRef]
- Fagan, M.E. A Lesson Unlearned? Underestimating Tree Cover in Drylands Biases Global Restoration Maps. Glob. Chang. Biol. 2020, 26, 4679–4690. [Google Scholar] [CrossRef] [PubMed]
- Reynolds, J.F.; Smith, D.M.S.; Lambin, E.F.; Turner, B.L.; Mortimore, M.; Batterbury, S.P.J.; Downing, T.E.; Dowlatabadi, H.; Fernández, R.J.; Herrick, J.E.; et al. Global Desertification: Building a Science for Dryland Development. Science 2007, 316, 847–851. [Google Scholar] [CrossRef]
- Lu, N.; Wang, M.; Ning, B.; Yu, D.; Fu, B. Research Advances in Ecosystem Services in Drylands under Global Environmental Changes. Curr. Opin. Environ. Sustain. 2018, 33, 92–98. [Google Scholar] [CrossRef]
- Maestre, F.T.; Benito, B.M.; Berdugo, M.; Concostrina-Zubiri, L.; Delgado-Baquerizo, M.; Eldridge, D.J.; Guirado, E.; Gross, N.; Kéfi, S.; Le Bagousse-Pinguet, Y.; et al. Biogeography of Global Drylands. New Phytol. 2021, 231, 540–558. [Google Scholar] [CrossRef] [PubMed]
- da Silva, J.M.C.; Leal, I.R.; Tabarelli, M. Caatinga: The Largest Tropical Dry Forest Region in South America; Silva, J.M.C., da Leal, I.R., Tabarelli, M., Eds.; Springer International Publishing: Cham, Switzerland, 2017; ISBN 978-3-319-68338-6. [Google Scholar]
- Inara, E.; Leal, R.; José, M.T.; Cardoso Da Silva, M. Ecologia e Conservação da Caatinga; Editora Universitária UFPE: Recife, Brazil, 2003. [Google Scholar]
- Antongiovanni, M.; Venticinque, E.M.; Fonseca, C.R. Fragmentation Patterns of the Caatinga Drylands. Landsc. Ecol. 2018, 33, 1353–1367. [Google Scholar] [CrossRef]
- Antongiovanni, M.; Venticinque, E.M.; Matsumoto, M.; Fonseca, C.R. Chronic Anthropogenic Disturbance on Caatinga Dry Forest Fragments. J. Appl. Ecol. 2020, 57, 2064–2074. [Google Scholar] [CrossRef]
- De Albuquerque, U.P.; De Lima Araújo, E.; El-Deir, A.C.A.; De Lima, A.L.A.; Souto, A.; Bezerra, B.M.; Ferraz, E.M.N.; Maria Xavier Freire, E.; Sampaio, E.V.D.S.B.; Las-Casas, F.M.G.; et al. Caatinga Revisited: Ecology and Conservation of an Important Seasonal Dry Forest. Sci. World J. 2012, 2012, 205182. [Google Scholar] [CrossRef] [PubMed]
- Ganem, K.A.; Dutra, A.C.; de Oliveira, M.T.; de Freitas, R.M.; Grecchi, R.C.; da Silva Pinto Vieira, R.M.; Arai, E.; Silva, F.B.; Sampaio, C.B.V.; Duarte, V.; et al. Mapping Caatinga Vegetation Using Optical Earth Observation Data—Opportunities and Challenges. Rev. Bras. Cartogr. 2020, 72, 829–854. [Google Scholar] [CrossRef]
- MMA. Mapas de Cobertura Vegetal Dos Biomas Brasileiros.PROBIO. 2006. Available online: https://antigo.mma.gov.br/informma/item/486-probio.html (accessed on 11 April 2019).
- Beuchle, R.; Grecchi, R.C.; Shimabukuro, Y.E.; Seliger, R.; Eva, H.D.; Sano, E.; Achard, F. Land Cover Changes in the Brazilian Cerrado and Caatinga Biomes from 1990 to 2010 Based on a Systematic Remote Sensing Sampling Approach. Appl. Geogr. 2015, 58, 116–127. [Google Scholar] [CrossRef]
- Teixeira, L.P.; Lughadha, E.N.; da Silva, M.V.C.; Moro, M.F. How Much of the Caatinga Is Legally Protected? An Analysis of Temporal and Geographical Coverage of Protected Areas in the Brazilian Semiarid Region. Acta Bot. Bras. 2021, 35, 473–485. [Google Scholar] [CrossRef]
- Kassas, M. Desertification: A General Review. J. Arid. Environ. 1995, 30, 115–128. [Google Scholar] [CrossRef]
- Helldén, U.; Tottrup, C. Regional Desertification: A Global Synthesis. Glob. Planet. Chang. 2008, 64, 169–176. [Google Scholar] [CrossRef]
- Tomasella, J.; Vieira, R.M.S.P.; Barbosa, A.A.; Rodriguez, D.A.; de Santana, M.O.; Sestini, M.F. Desertification Trends in the Northeast of Brazil over the Period 2000–2016. Int. J. Appl. Earth Obs. Geoinf. 2018, 73, 197–206. [Google Scholar] [CrossRef]
- Tsai, D.; Potenza, R.P.; Quintana, G.; Cardoso, A.M.; Silva, F.B.; Graces, I.; Coluna, I.; Carvalho, K.; Zimbres, B.; Silva, C.; et al. Análise das Emissões de Gases de Efeito Estufa e Suas Implicações Para as Metas Climáticas do Brasil 1970–2022; SEEG: Brasília, Brazil, 2022. [Google Scholar]
- Castro, F.C.; dos Santos, A.M. Salinity of The Soil and The Risk of Desertification in the Semiarid Region. Mercator 2020, 19, 1–13. [Google Scholar] [CrossRef]
- Castelletti, H.; Cardoso, J.M.; Silva, D.; Tabarelli, M. Quanto Ainda Resta da Caatinga? Uma Estimativa Preliminar; Editora da Universidade Federal de Pernambuco: Recife, Brazil, 2003. [Google Scholar]
- Ministério do Meio Ambiente. Subsídios para a Elaboração do Plano de Ação Para a Prevenção e Controle do Desmatamento na Caatinga; Cidade Gráfica e Editora: Brasilia, Brazil, 2010. [Google Scholar]
- Souza, C.; Azevedo, T. MapBiomas General “Handbook”—Algorithm Theoretical Basis Document (ATBD); MapBiomas: São Paulo, Brazil, 2023. [Google Scholar]
- Souza, C.M.; Shimbo, J.Z.; Rosa, M.R.; Parente, L.L.; Alencar, A.; Rudorff, B.F.; Hasenack, H.; Matsumoto, M.; Ferreira, L.G.; Souza-Filho, P.W.; et al. Reconstructing Three Decades of Land Use and Land Cover Changes in Brazilian Biomes with Landsat Archive and Earth Engine. Remote Sens. 2020, 12, 2735. [Google Scholar] [CrossRef]
- Gorelick, N.; Hancher, M.; Dixon, M.; Ilyushchenko, S.; Thau, D.; Moore, R. Google Earth Engine: Planetary-Scale Geospatial Analysis for Everyone. Remote Sens. Environ. 2017, 202, 18–27. [Google Scholar] [CrossRef]
- IBGE—Instituto Brasileiro de Geografia e Estatística. Manual Técnico da Vegetação Brasileira: Sistema Fitogeográfico: Inventário das Formações Florestais e Campestres: Técnicas e Manejo de Coleções Botânicas: Procedimentos Para Mapeamentos; IBGE: Rio de Janeiro, Brazil, 2012. [Google Scholar]
- Antongiovanni, M.; Venticinque, E.M.; Tambosi, L.R.; Matsumoto, M.; Metzger, J.P.; Fonseca, C.R. Restoration Priorities for Caatinga Dry Forests: Landscape Resilience, Connectivity and Biodiversity Value. J. Appl. Ecol. 2022, 59, 2287–2298. [Google Scholar] [CrossRef]
- Salazar, A.A.; Arellano, E.C.; Muñoz-sáez, A.; Miranda, M.D.; da Silva, F.O.; Zielonka, N.B.; Crowther, L.P.; Silva-ferreira, V.; Oliveira-reboucas, P.; Dicks, L.V. Restoration and Conservation of Priority Areas of Caatinga’s Semi-arid Forest Remnants Can Support Connectivity within an Agricultural Landscape. Land 2021, 10, 550. [Google Scholar] [CrossRef]
- Breiman, L. Random Forests. Mach. Learn. 2001, 45, 5–32. [Google Scholar] [CrossRef]
- R Core Team. R: A Language and Environment for Statistical Computing; R Foundation for Statistical Computing: Vienna, Austria, 2020. [Google Scholar]
- R Core Team. The R Project for Statistical Computing; R Foundation for Statistical Computing: Vienna, Austria, 2013; Available online: http://www.rproject.org/ (accessed on 6 July 2013).
- RStudio. RStudio|Open Source & Professional Software for Data Science Teams—RStudio. Available online: https://rstudio.com/ (accessed on 26 September 2020).
- Allaire, J.J. Integrated Development Environment for R; RStudio Inc.: Vienna, Austria, 2020. [Google Scholar]
- Wickham, H. Ggplot2; Use R! Springer International Publishing: Cham, Switzerland, 2016; ISBN 978-3-319-24275-0. [Google Scholar]
- Mekuria, W.; Aynekulu, E. Exclosure Land Management for Restoration of the Soils in Degraded Communal Grazing Lands in Northern Ethiopia. Land. Degrad. Dev. 2013, 24, 528–538. [Google Scholar] [CrossRef]
- Mas, J.F.; de Vasconcelos, R.N.; Franca-Rocha, W. Analysis of High Temporal Resolution Land Use/Land Cover Trajectories. Land. 2019, 8, 30. [Google Scholar] [CrossRef]
- Joppa, L.N.; O’Connor, B.; Visconti, P.; Smith, C.; Geldmann, J.; Hoffmann, M.; Watson, J.E.M.; Butchart, S.H.M.; Virah-Sawmy, M.; Halpern, B.S.; et al. Filling in Biodiversity Threat Gaps. Science 2016, 352, 416–418. [Google Scholar] [CrossRef]
- Newbold, T.; Hudson, L.N.; Hill, S.L.L.; Contu, S.; Lysenko, I.; Senior, R.A.; Börger, L.; Bennett, D.J.; Choimes, A.; Collen, B.; et al. Global Effects of Land Use on Local Terrestrial Biodiversity. Nature 2015, 520, 45–50. [Google Scholar] [CrossRef]
- Searchinger, T.D.; Waite, R.; Hanson, C.; Ranganathan, J.; Dumas, P.; Matthews, E. Creating a Sustainable Food Future; World Resources Report: Cancun, Mexico, 2018. [Google Scholar]
- Lewis, S.L.; Edwards, D.P.; Galbraith, D. Increasing Human Dominance of Tropical Forests. Science 2015, 349, 827–832. [Google Scholar] [CrossRef] [PubMed]
- Tilman, D.; Balzer, C.; Hill, J.; Befort, B.L. Global Food Demand and the Sustainable Intensification of Agriculture. Proc. Natl. Acad. Sci. USA 2011, 108, 20260–20264. [Google Scholar] [CrossRef]
- Curtis, P.G.; Slay, C.M.; Harris, N.L.; Tyukavina, A.; Hansen, M.C. Classifying Drivers of Global Forest Loss. Science 2018, 361, 1108–1111. [Google Scholar] [CrossRef] [PubMed]
- Song, X.-P.; Hansen, M.C.; Potapov, P.; Adusei, B.; Pickering, J.; Adami, M.; Lima, A.; Zalles, V.; Stehman, S.V.; Di Bella, C.M.; et al. Massive Soybean Expansion in South America since 2000 and Implications for Conservation. Nat. Sustain. 2021, 4, 784–792. [Google Scholar] [CrossRef]
- Gibbs, H.K.; Ruesch, A.S.; Achard, F.; Clayton, M.K.; Holmgren, P.; Ramankutty, N.; Foley, J.A. Tropical Forests Were the Primary Sources of New Agricultural Land in the 1980s and 1990s. Proc. Natl. Acad. Sci. USA 2010, 107, 16732–16737. [Google Scholar] [CrossRef] [PubMed]
- Laurance, W.F.; Clements, G.R.; Sloan, S.; O’Connell, C.S.; Mueller, N.D.; Goosem, M.; Venter, O.; Edwards, D.P.; Phalan, B.; Balmford, A.; et al. A Global Strategy for Road Building. Nature 2014, 513, 229–232. [Google Scholar] [CrossRef]

| LULC Classification | Description | Symbology |
|---|---|---|
| Forest Formation | Natural Vegetation tree with a high-density continuous canopy, or resulting from different disturbances such as fire, selective logging, and forest resulting from natural regrowth. This level includes Natural Forest Formation Vegetation types with a predominance of tree species with high density and canopy in different states of disturbance. |  |
| Savanna Formation | Savana vegetation types have a tree layer varying in density, distributed over a continuous shrub-herbaceous cover. |  |
| Non-Forest Natural Formation | Vegetation with a shrub-herbaceous stratum, including patches with a shrub-herbaceous stratum. This level includes wetlands (Floodplain with river and lake influence, herbaceous shrub vegetation, and/or arboreal and pioneer formations), marshes (marine influence), Salt flats (Apicuns formations often without tree vegetation, associated with saline and a less flooded area in the mangrove), Grassland Formation (Vegetation with a predominance of herbaceous stratum and shrub-herbaceous stratum), and Rocky Outcrop with a partial presence of rock vegetation and a high slope. |  |
| Pasture | Pasture areas planted are related to farming activity. |  |
| Agriculture | Areas predominantly occupied by annual crops, perennial crops, and semi-perennial Crops. |  |
| Mosaic of Agriculture and Pasture | Farming areas where it was not possible to distinguish between pasture and agriculture. |  |
| Non-vegetated area | Non-vegetated surface areas. This level includes Beach and Dune (Sandy areas), Urban Infrastructure (Urban areas with non-vegetated surfaces, including roads, highways, and construction), and Mining (Areas related to large mineral extraction. Only areas belonging to the National Department of Mineral Production’s (DNPM) chart (SIGMINE) were considered). |  |
| Water | Rivers, lakes, dams, reservoirs, and other water bodies. This level includes Natural and Artificial lakes, aquaculture, and salt production activities. |  |
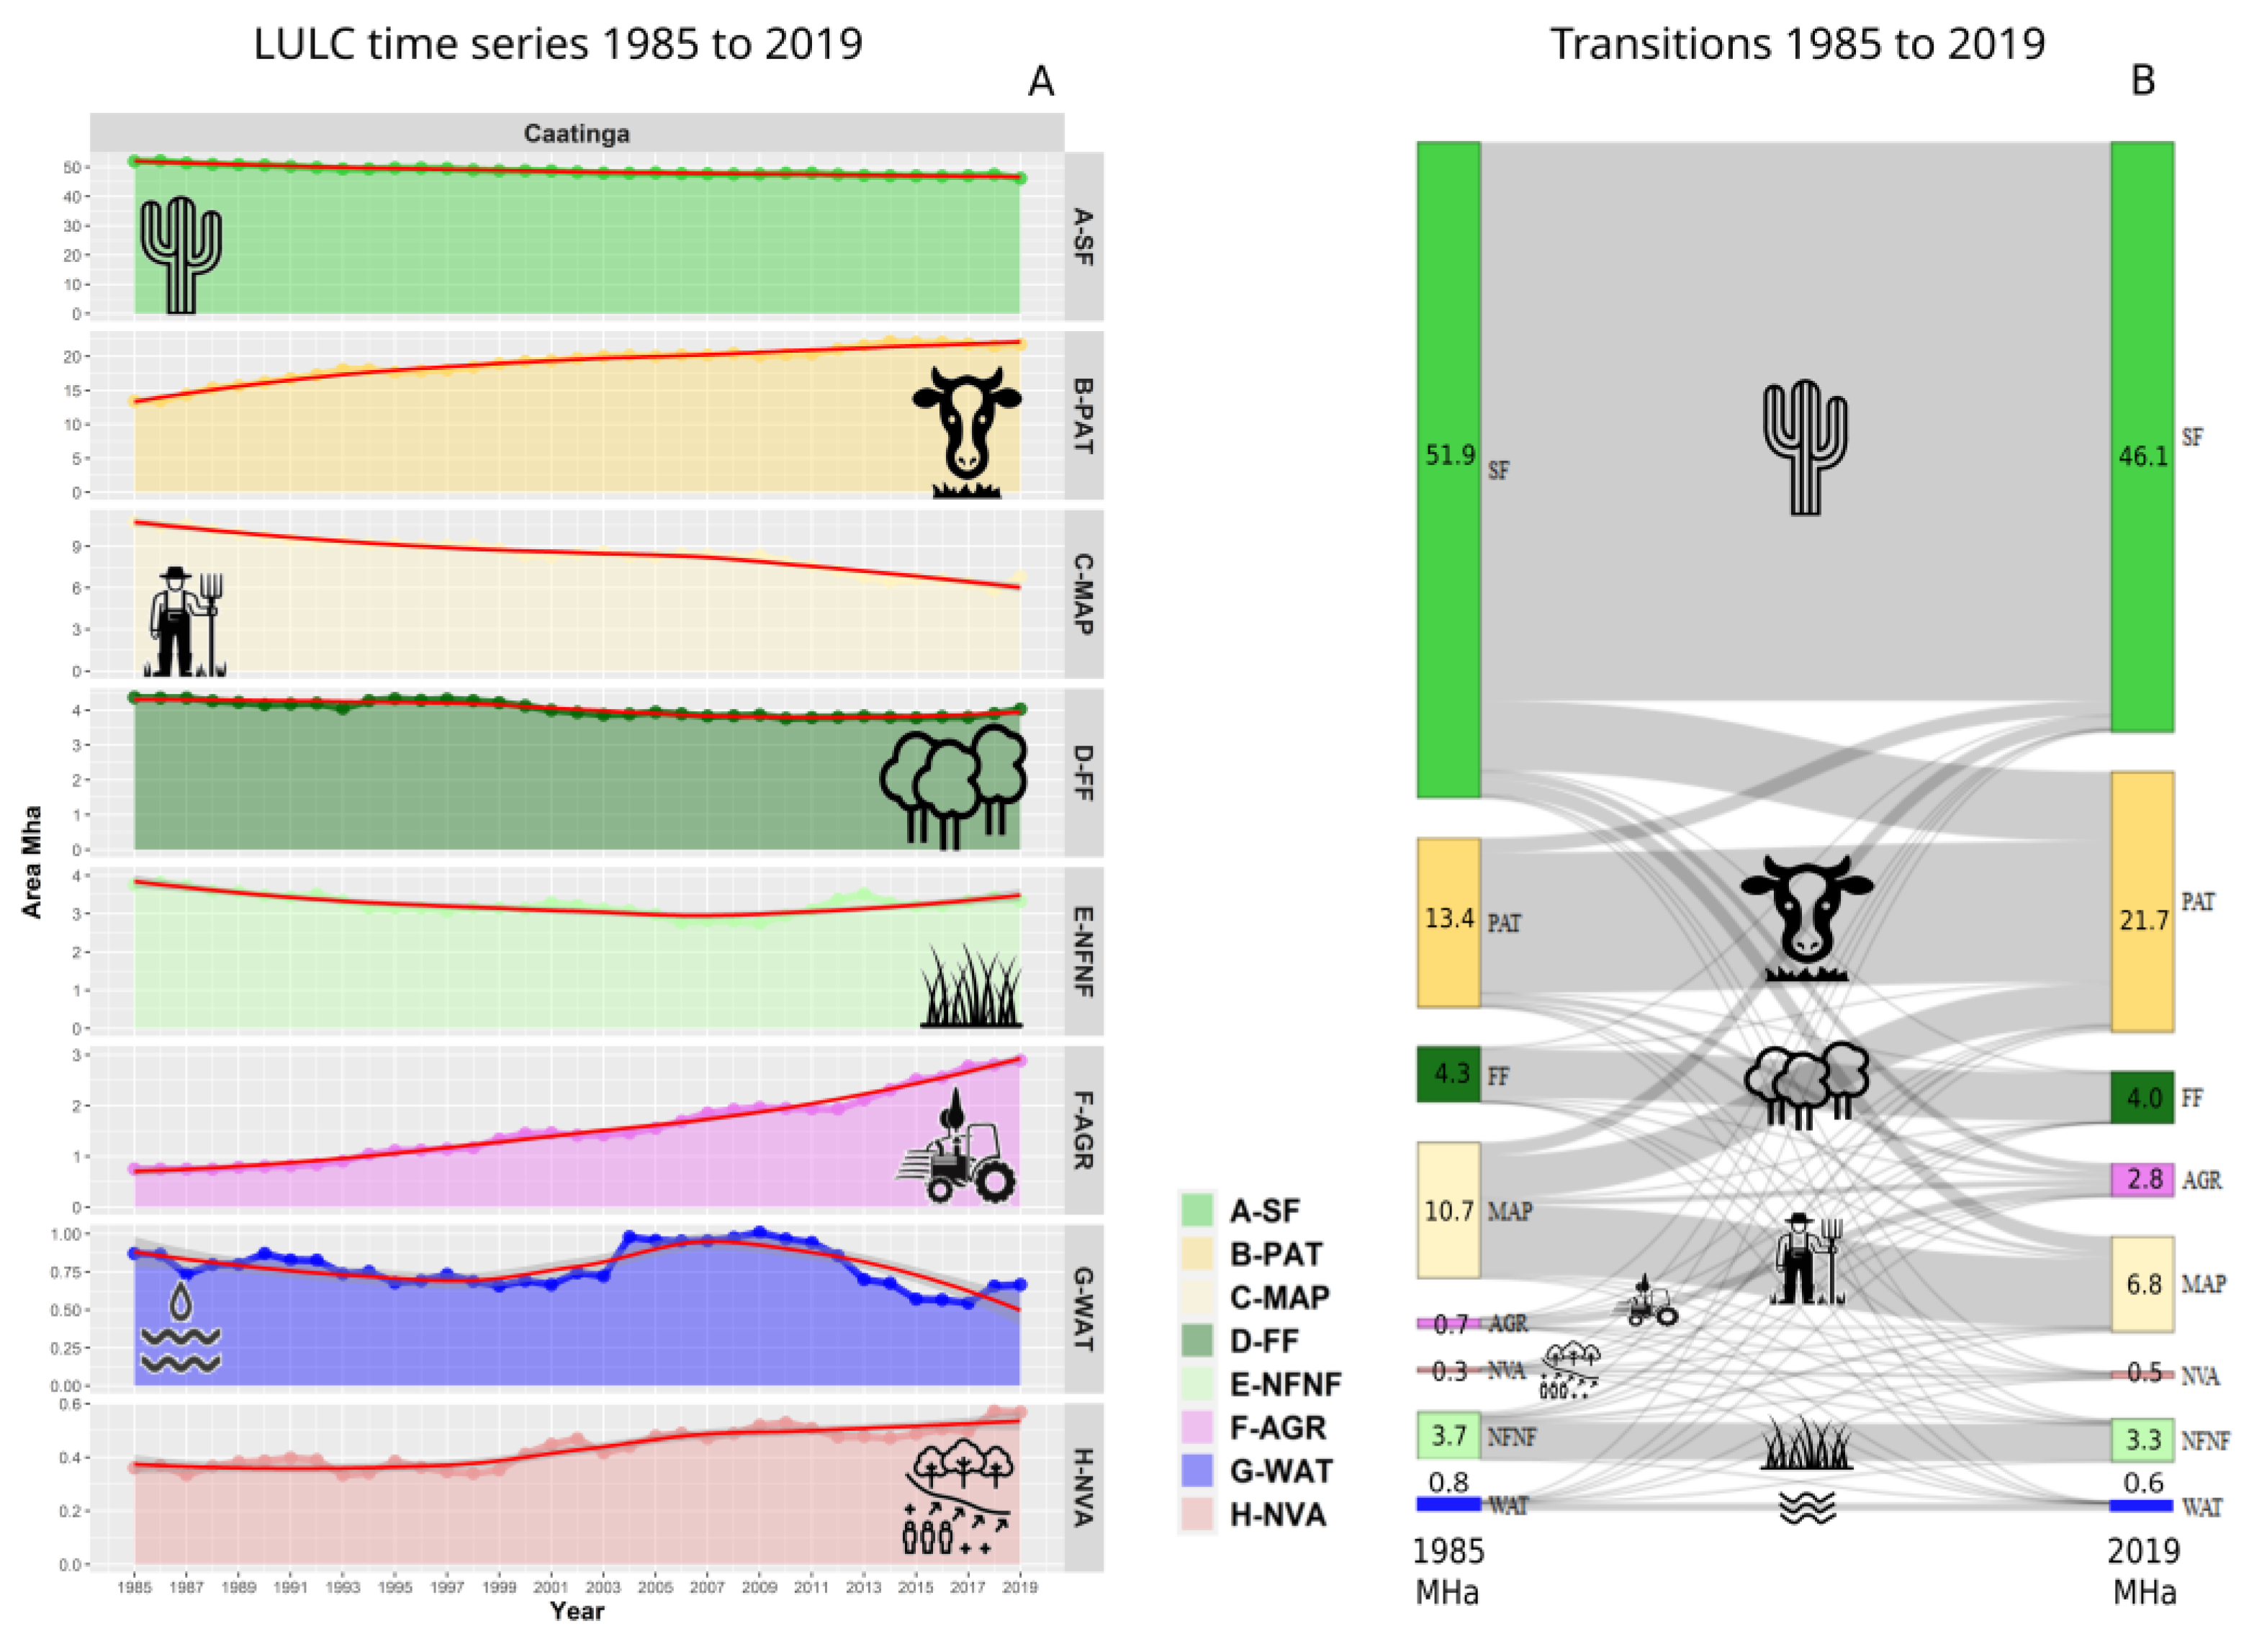
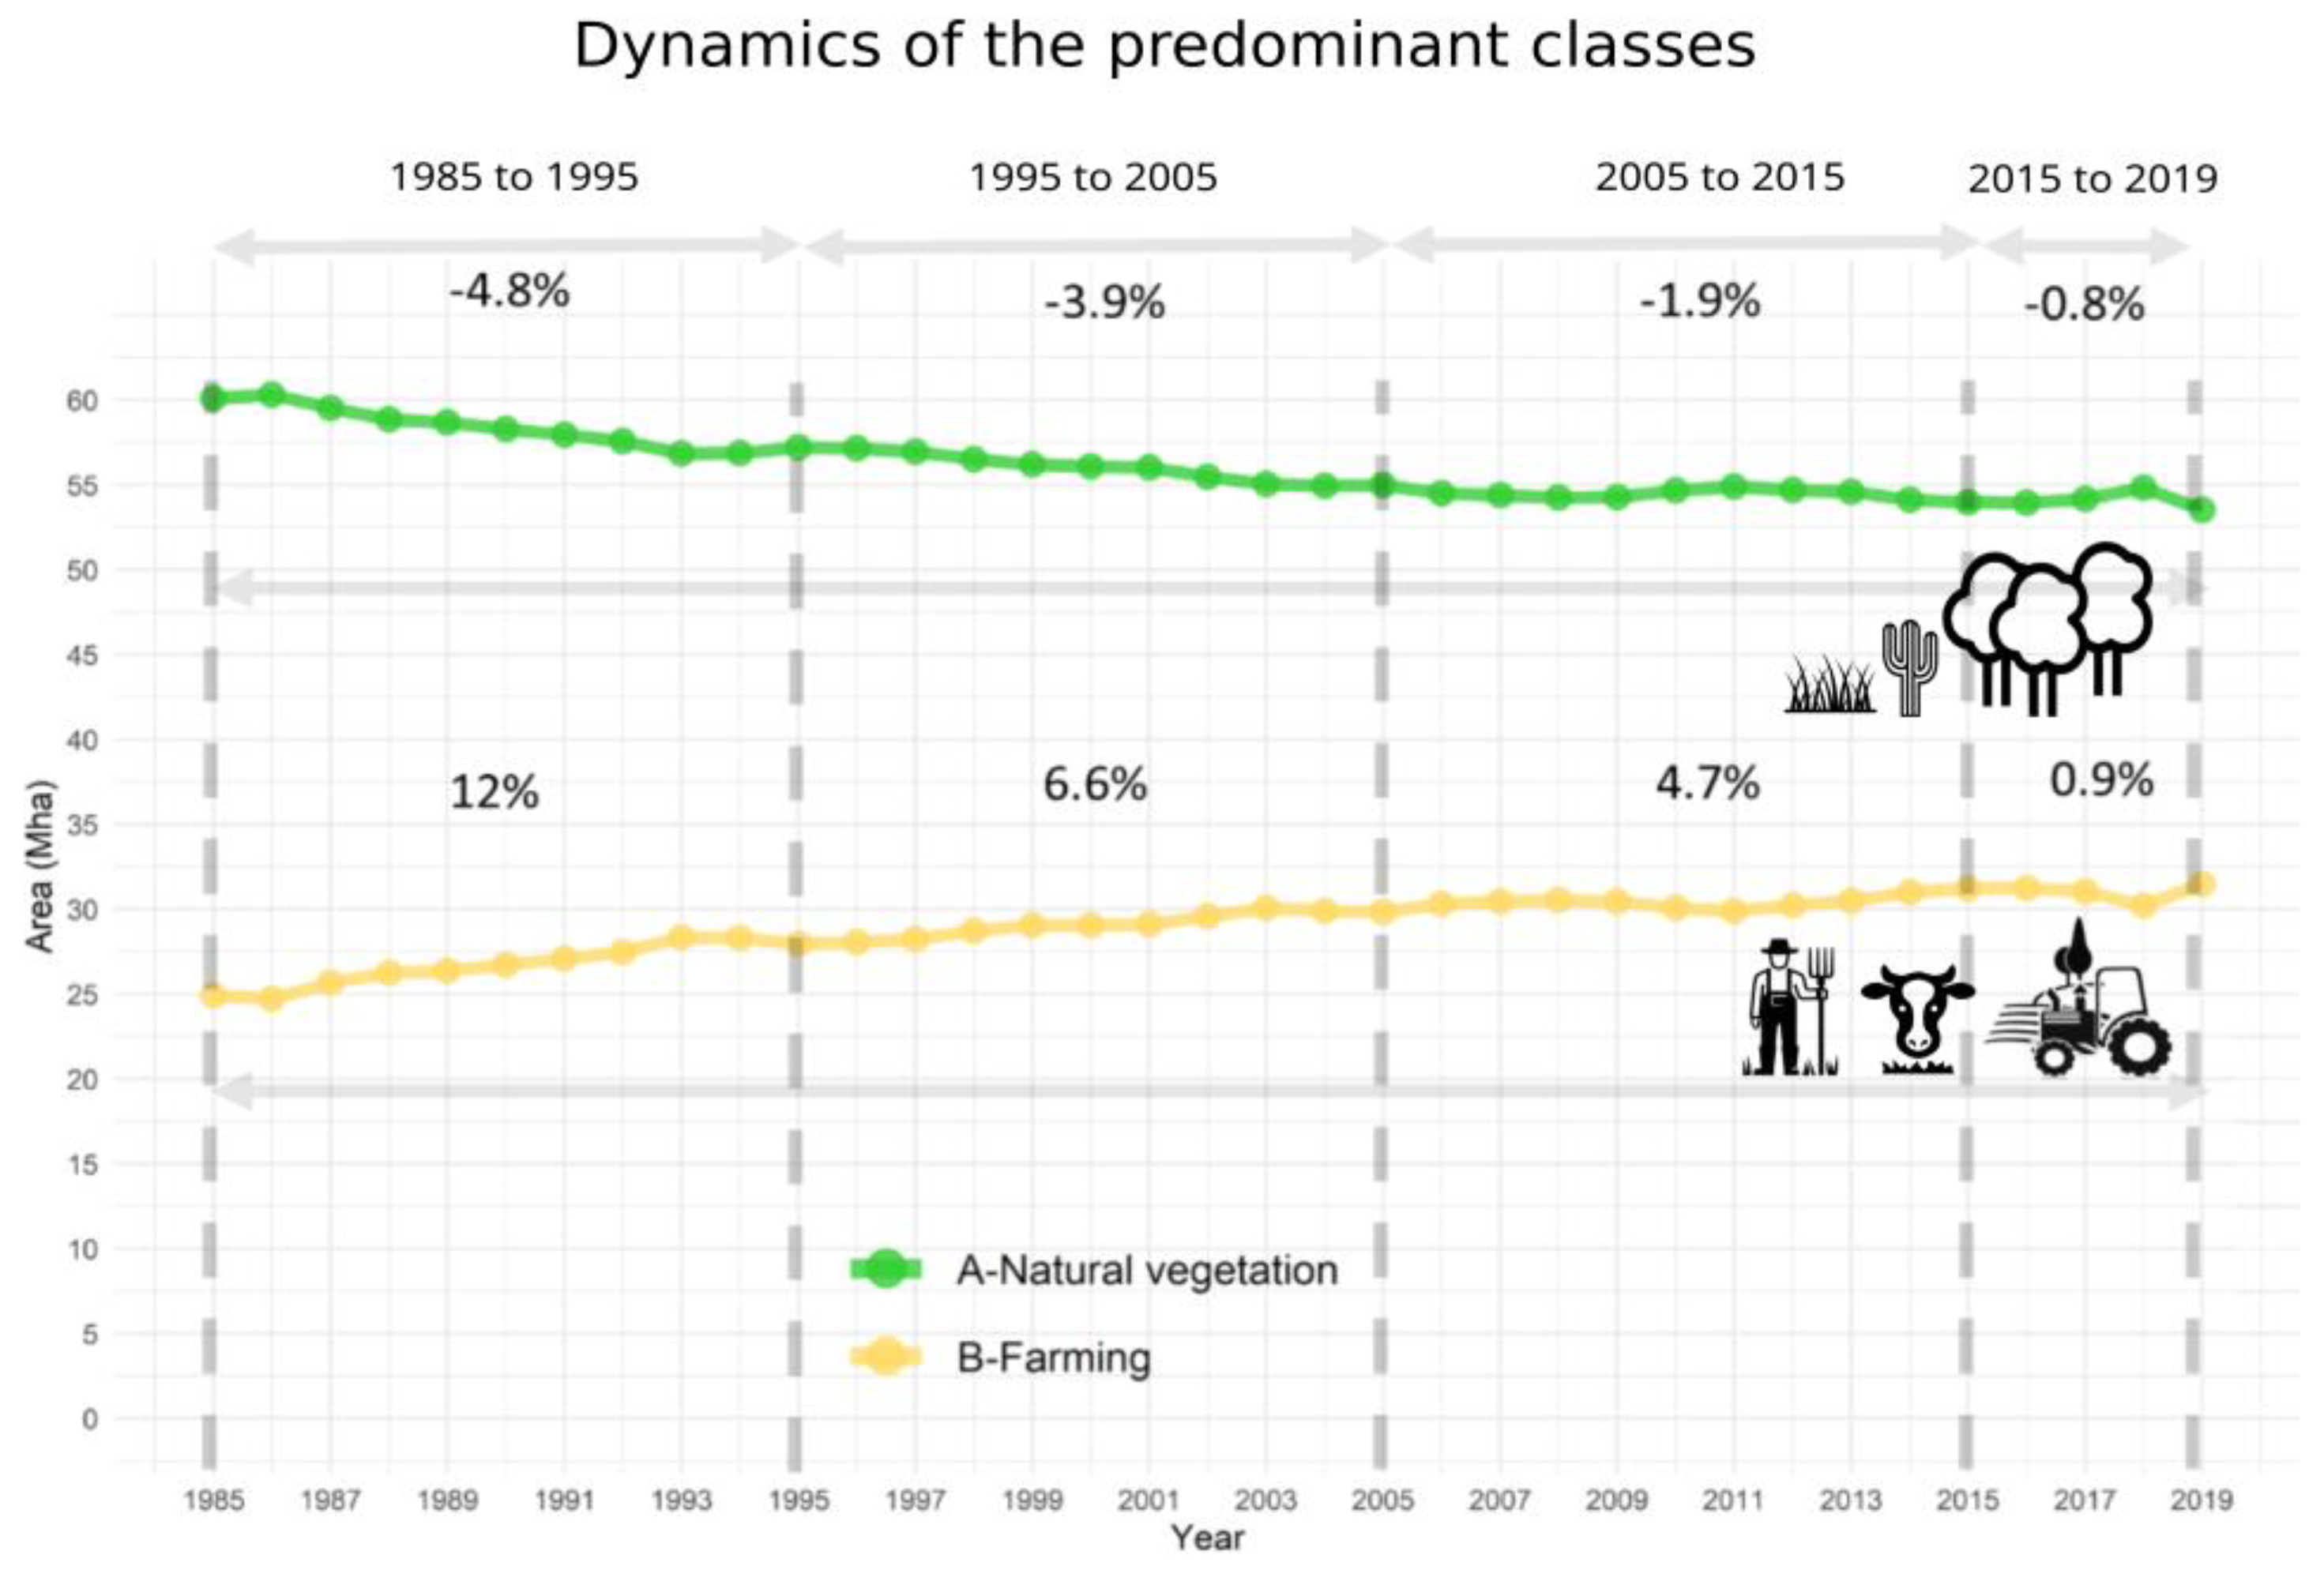
| Class | 1985 (Mha) | 2019 (Mha) | Variation | |
|---|---|---|---|---|
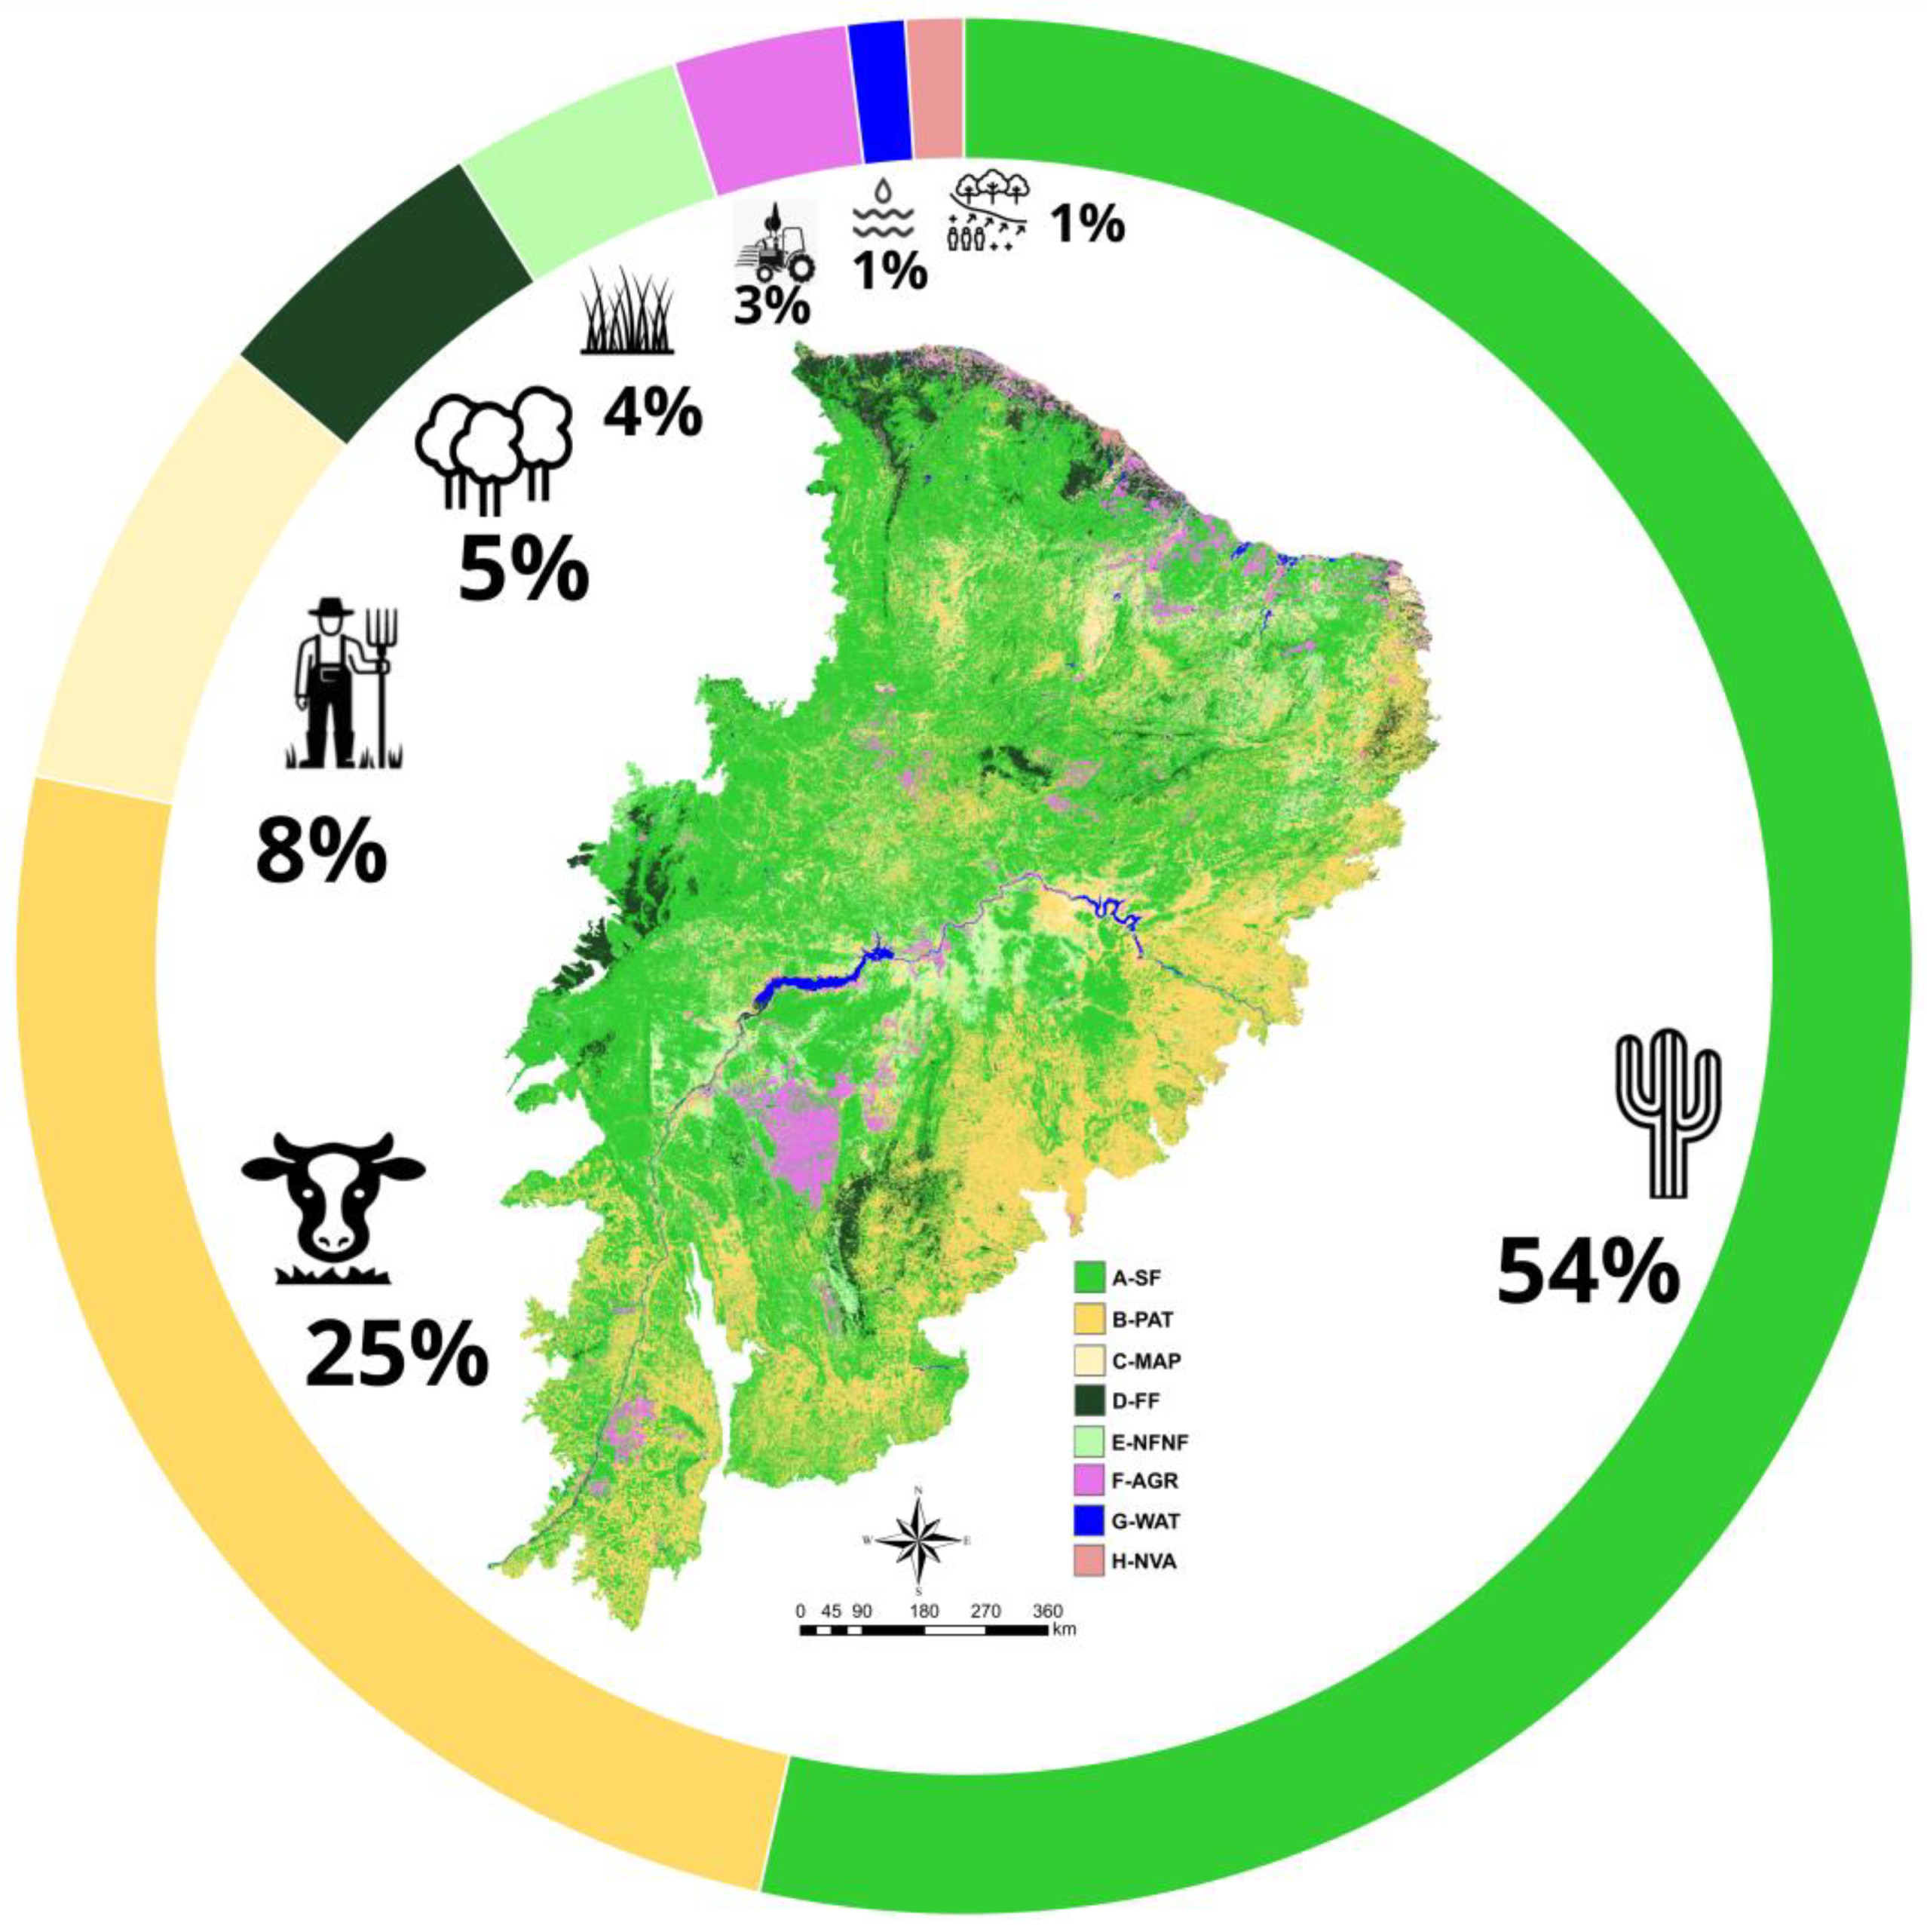
| Natural vegetation | Forest Formation | 4.37 | 4.03 | −8% |
| Savanna Formation | 51.96 | 46.17 | −11% | |
| Non Forest Natural Formation | 3.76 | 3.33 | −12% | |
| Nom natural | Mosaic of Agriculture and Pasture | 10.76 | 6.82 | −37% |
| Pasture | 13.41 | 21.78 | 62% | |
| Agriculture | 0.75 | 2.89 | 284% | |
| Non Vegetated Area | 0.36 | 0.57 | 58% | |
| Water | 0.87 | 0.67 | −24% | |
Disclaimer/Publisher’s Note: The statements, opinions and data contained in all publications are solely those of the individual author(s) and contributor(s) and not of MDPI and/or the editor(s). MDPI and/or the editor(s) disclaim responsibility for any injury to people or property resulting from any ideas, methods, instructions or products referred to in the content. |
© 2024 by the authors. Licensee MDPI, Basel, Switzerland. This article is an open access article distributed under the terms and conditions of the Creative Commons Attribution (CC BY) license (https://creativecommons.org/licenses/by/4.0/).
Share and Cite
Franca Rocha, W.J.S.; Vasconcelos, R.N.; Costa, D.P.; Duverger, S.G.; Lobão, J.S.B.; Souza, D.T.M.; Herrmann, S.M.; Santos, N.A.; Franca Rocha, R.O.; Ferreira-Ferreira, J.; et al. Towards Uncovering Three Decades of LULC in the Brazilian Drylands: Caatinga Biome Dynamics (1985–2019). Land 2024, 13, 1250. https://doi.org/10.3390/land13081250
Franca Rocha WJS, Vasconcelos RN, Costa DP, Duverger SG, Lobão JSB, Souza DTM, Herrmann SM, Santos NA, Franca Rocha RO, Ferreira-Ferreira J, et al. Towards Uncovering Three Decades of LULC in the Brazilian Drylands: Caatinga Biome Dynamics (1985–2019). Land. 2024; 13(8):1250. https://doi.org/10.3390/land13081250
Chicago/Turabian StyleFranca Rocha, Washington J. S., Rodrigo N. Vasconcelos, Diego P. Costa, Soltan Galano Duverger, Jocimara S. B. Lobão, Deorgia T. M. Souza, Stefanie M. Herrmann, Nerivaldo A. Santos, Rafael O. Franca Rocha, Jefferson Ferreira-Ferreira, and et al. 2024. "Towards Uncovering Three Decades of LULC in the Brazilian Drylands: Caatinga Biome Dynamics (1985–2019)" Land 13, no. 8: 1250. https://doi.org/10.3390/land13081250