Article

Study on Wetland Evolution and Landscape Pattern Changes in the Shaanxi Section of the Loess Plateau in the Past 40 Years

1
State Key Laboratory of Soil Erosion and Dryland Farming on the Loess Plateau, Institute of Water and Soil Conservation, Chinese Academy of Sciences and Ministry of Water Resources, Yangling 712100, China
2
Shaanxi Key Laboratory of Disaster Monitoring and Mechanism Simulation, Baoji University of Arts and Sciences, Baoji 721013, China
3
College of Natural Resources and Environment, Northwest A & F University, Yangling 712100, China
*
Author to whom correspondence should be addressed.
Land 2024, 13(8), 1268; https://doi.org/10.3390/land13081268
Submission received: 20 June 2024 / Revised: 8 August 2024 / Accepted: 9 August 2024 / Published: 12 August 2024

Abstract

:
The Shaanxi section is the central region of the Loess Plateau. Its unique wetland environment plays an indispensable role in regional ecological environment security. Clarifying the characteristics of wetland changes in the region is an important prerequisite for wetland management and protection. This study, based on the remote sensing data of the Shaanxi section of the Loess Plateau, analyzed the changes in the wetland area and type transfer in this region in 1980, 1990, 2000, 2010 and 2020 using the wetland dynamic degree model, the Markov transfer matrix, the landscape pattern index, and centroid analysis. The results showed that, from 1980 to 2020, the total wetland area and natural wetland area in the Shaanxi section of the Loess Plateau continued to shrink, decreasing by 79.35 km2 and 80.50 km2, respectively, while the artificial wetland area increased by 1.14 km2. Among the regions, Xi’an experienced the most significant reduction, with a total decrease of 83.04 km2 over 40 years, followed by Xianyang City, where the wetland area decreased by 6.50 km2. In contrast, the wetland areas of Yulin City, Weinan City, Yan’an City, Baoji City and Tongchuan City increased slightly. From 1980 to 2020, the change in the wetland types in the Shaanxi section of the Loess Plateau was mainly characterized by transfers between beach lands and river canals. River canals are the primary type of wetland in this region. The degree of fragmentation is the highest in reservoir potholes, while marshes have the largest clumpiness index. Over the same period, the centroid of the wetlands in the Shaanxi section of the Loess Plateau moved from south to north as a whole, although, between 1990 and 2000, the centroid position remained relatively stable. These results provide a theoretical basis and data support for wetland monitoring and protection in the Shaanxi section of the Loess Plateau and also provide a reference for the protection and sustainable development of other inland wetland resources in arid and semi-arid regions.

1. Introduction

As one of the three major ecosystems in the world, wetlands have important ecological functions, such as water conservation, water purification, flood storage, climate regulation and biodiversity maintenance [1]. They are known as the ‘‘kidneys of the Earth’’ [2,3,4]. Due to the impact of climate change and human activities, the wetland area in China has been continuously reduced and the ecological function has been degraded [5,6,7]. Wetland protection is an important part of the ‘‘integration of mountains, rivers, forests, fields, lakes and grasses’’ and has a profound impact on climate change, social development and the human living environment [8,9]. Therefore, exploring wetlands’ evolution and changes in their landscape patterns is essential in maintaining the stability of wetland ecosystems.
In recent years, quantitative analysis methods for landscape patterns have been widely used in both domestic and international research [10,11,12]. These methods mainly include the landscape pattern index and the landscape dynamic change model. Lu et al. [13] employed the landscape pattern index method and a logistic regression model to reveal the evolution of coastal wetland landscape patterns and their driving factors. The results indicated the significant fragmentation of natural wetland patches and a complex overall landscape level index. Similarly, Wang et al. [14] utilized landscape pattern analysis and principal component analysis to investigate the spatial and temporal evolution of wetland types, landscape indices and their influencing factors in the middle reaches of the Shule River. Li et al. [15] also used the landscape pattern index to quantitatively and qualitatively analyze the temporal and spatial evolution characteristics of the wetlands in the Yellow River Basin, identifying paddy fields as the dominant wetland type. Additionally, Xu et al. [16], Wang et al. [17] and Yin et al. [18] used the landscape pattern index to study the landscape pattern changes in the Yongjiuwa wetland, East Dongting Lake and Bayinbuluke Swan Lake alpine wetland, respectively. In summary, most scholarly research has primarily focused on large-scale wetlands and major lake wetlands, with insufficient detailed analysis of landscape pattern changes at the city and county levels.
The Loess Plateau, located in the north–central part of China, is the largest loess accumulation area in the world and belongs to the arid and semi-arid climate zone. However, the Yellow River has brought a number of valuable wetland resources to the vast and arid and barren Loess Plateau [19]. Due to the intensification of climate change and human activities, the wetlands of the Loess Plateau are generally in a state of degradation and shrinkage [20]. The Shaanxi section of the Loess Plateau (SSLP) mainly includes the Guanzhong area and Northern Shaanxi area north of the Qinling Mountains. Within this section, Weinan City in the Guanzhong area and Yulin City in Northern Shaanxi are the main wetland distribution areas. In the Guanzhong area, the wetlands are primarily distributed along the Wei River and its tributaries, consisting mainly of river and marsh wetlands; the lake wetlands are mainly distributed in Dingbian County, Yuyang District and Shenmu City of Yulin City in Northern Shaanxi and other inland areas; and the marsh wetlands are mainly distributed in Pucheng County and Heyang County of Weinan City, as well as in Dingbian County, Yuyang District, Hengshan District and Jingbian County of Yulin City (Figure 1). Due to their scattered distribution, comprehensive studies on the overall changes in the wetlands in this region are limited, with most research focusing on specific wetlands like the Hongjiannao and Yellow River wetlands. This study uses remote sensing data on the 30 m land use in the SSLP to analyze the wetland evolution and landscape pattern changes from 1980 to 2020. The goal is to provide a scientific reference for wetland protection and rational resource utilization in this area, thereby contributing to national ecological security.

2. Materials and Methods
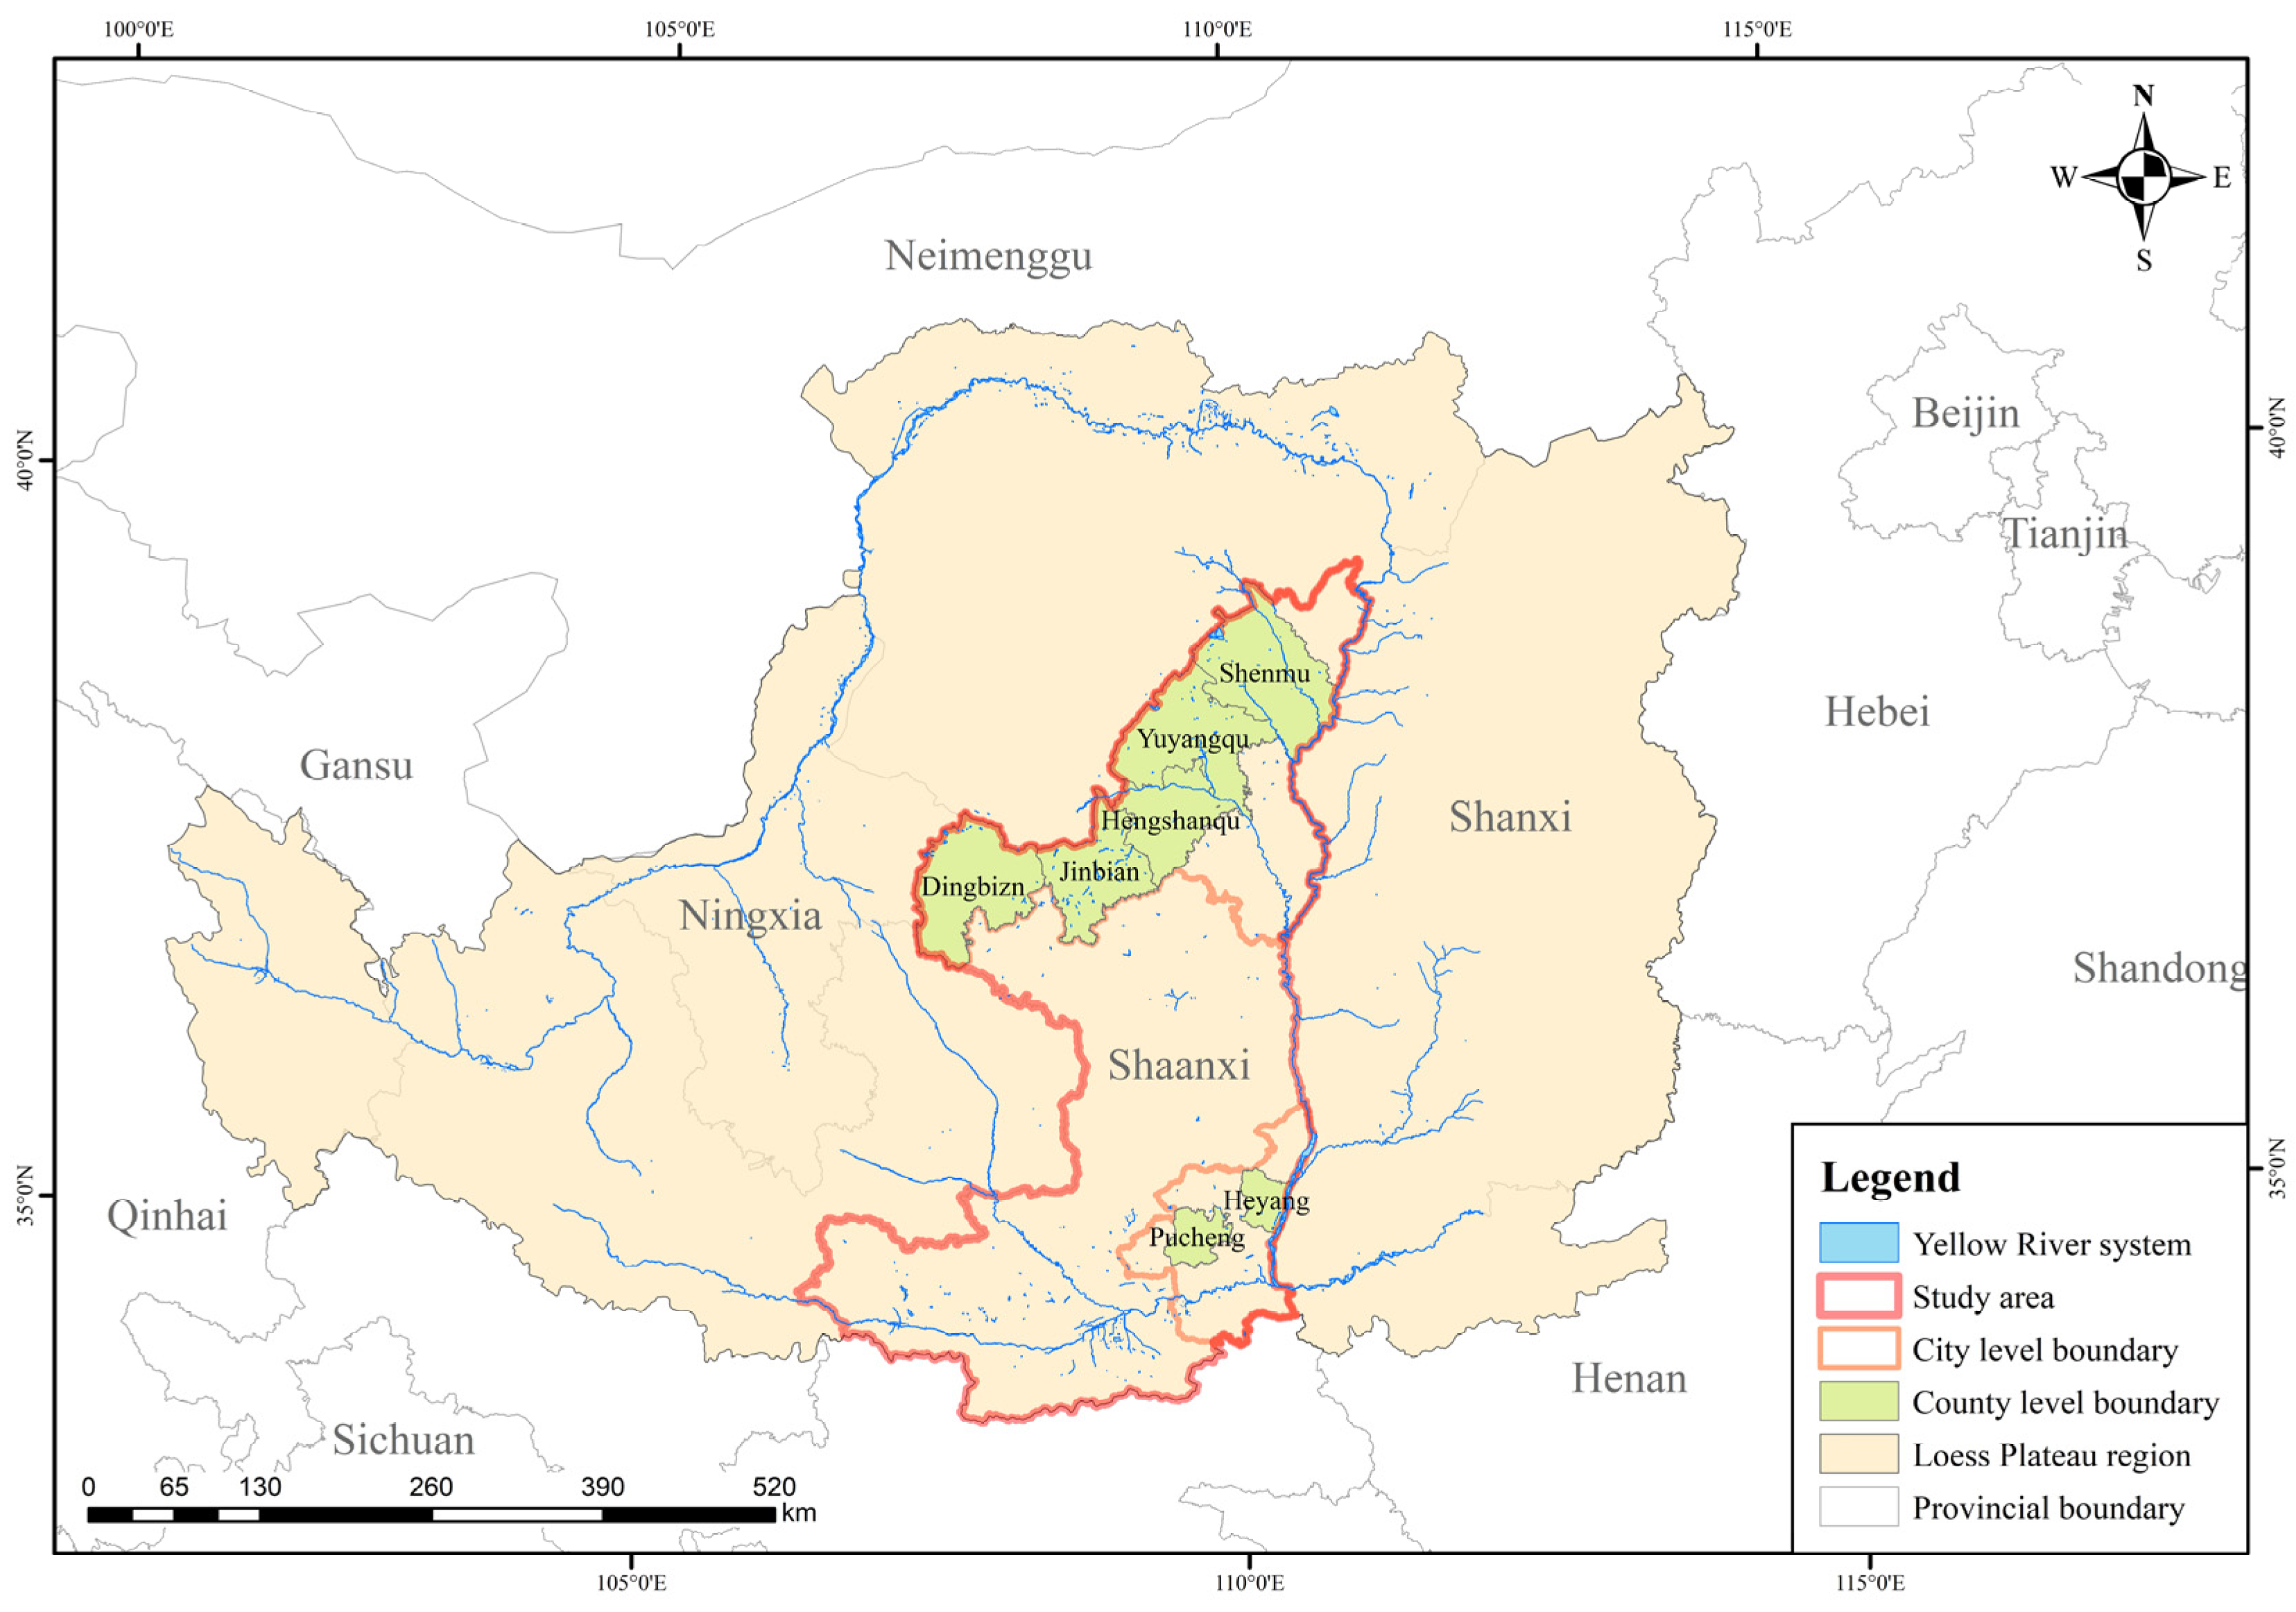
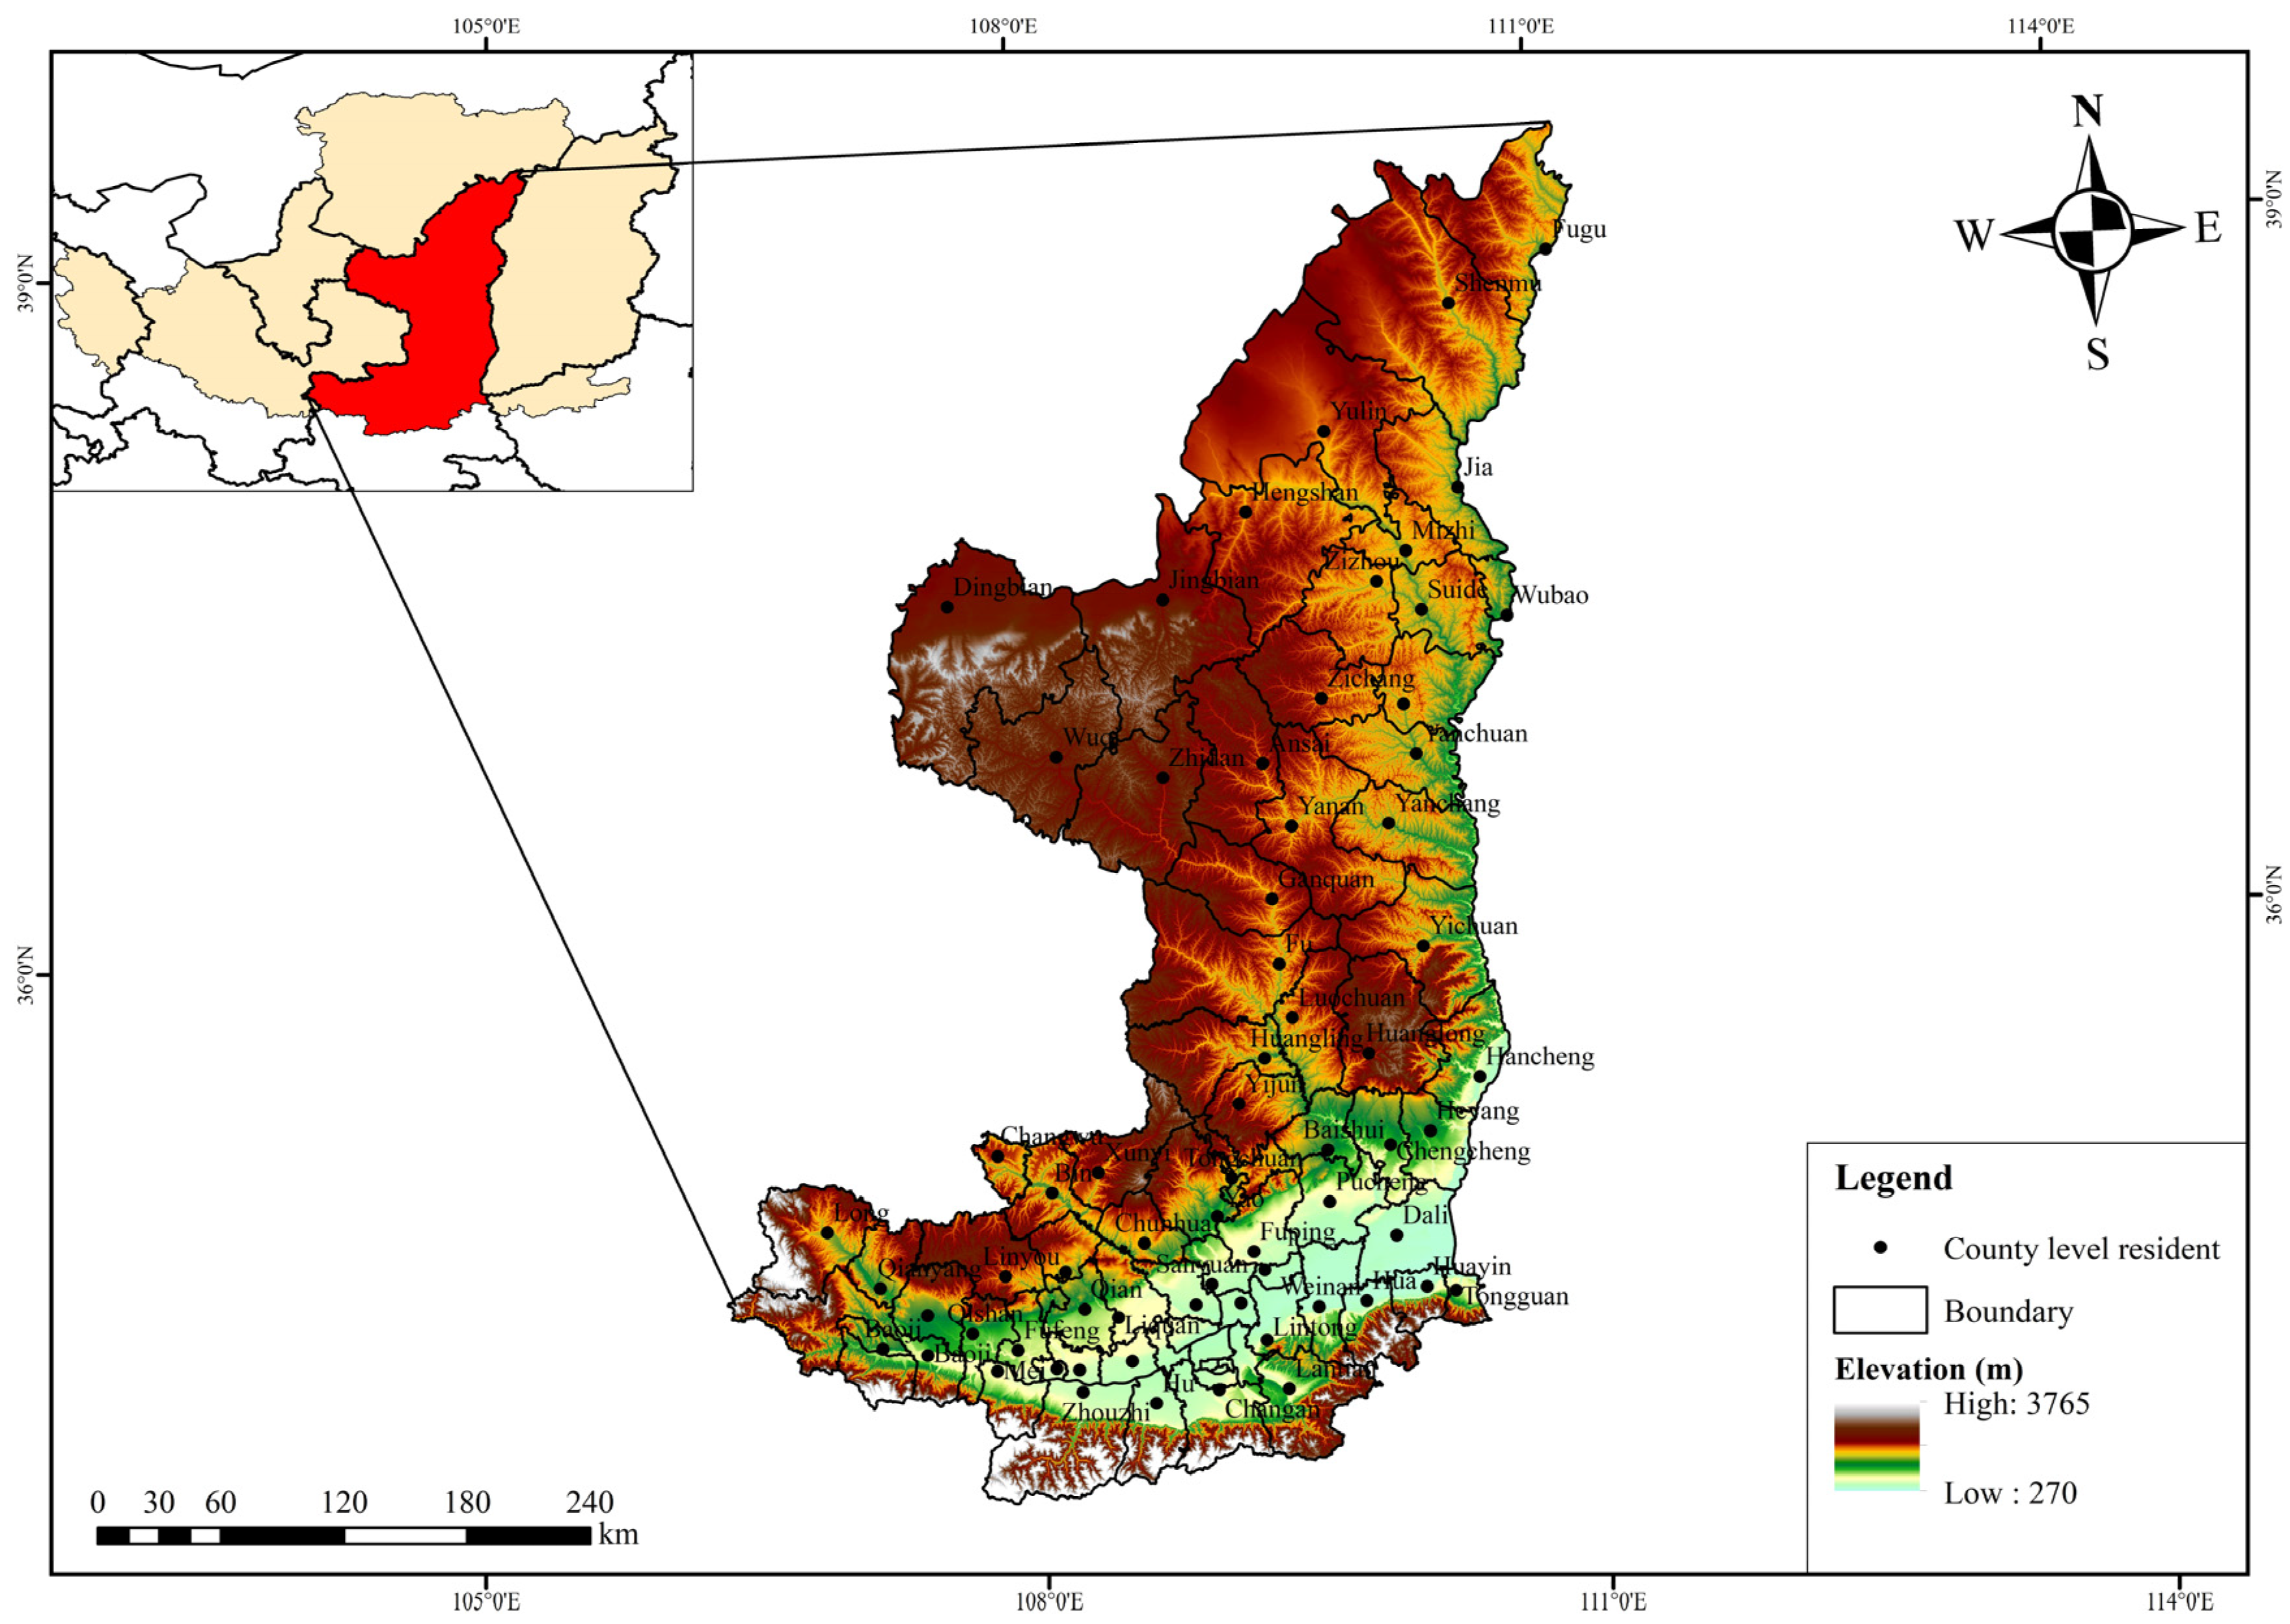
2.1. Study Area

The SSLP (107°30′–111°15′ E, 34°10′–39°35′ N) is located in the central and northern part of Shaanxi Province (Figure 2), encompassing the Guanzhong area and the Northern Shaanxi region north of the Qinling Mountains. Covering an area of 129,988.6 km2, it accounts for 63.2% of Shaanxi Province’s total area and 20.3% of the Loess Plateau. This region includes major cities such as Xi’an, Baoji, Xianyang, Weinan, Tongchuan, Yan’an and Yulin. The SSLP belongs to the temperate continental monsoon climate zone, with an annual average temperature of 7~14 °C and annual precipitation amounting to 300~700 mm. The basic landform types include loess plateaus, beams, hills, ravines and river terraces, with loess as the predominant soil type. It is one of the most serious ecological environment problems in the Loess Plateau [21,22]. Since 1999, large-scale efforts to convert farmland to forest and grassland in Shaanxi’s Loess Plateau have greatly improved the vegetation conditions [23,24,25,26]. However, the Second National Wetland Survey in Shaanxi Province in 2013 indicated that the wetlands in this region continue to shrink and degrade due to factors such as drought, land reclamation and mineral resource development [27,28].

2.2. Data Sources and Preprocessing

The data in this study mainly included 30 m land use remote sensing monitoring data for 1980, 1990, 2000, 2010 and 2020, as well as the average temperature, annual precipitation, city- and county-level boundaries and population data for Shaanxi Province from 1980 to 2020. These datasets were provided by the Data Center for Resource and Environmental Science, Chinese Academy of Sciences (RESDC) (http://www.resdc.cn/), accessed on 7 September 2022 [29]. The remote sensing monitoring data on land use primarily came from Landsat-MSS, TM, ETM and Landsat 8 images. Landsat-MSS remote sensing image data were used for 1980; Landsat-TM/ETM remote sensing image data were used for 1990, 2000 and 2010; and Landsat 8 remote sensing image data were used for 2020. The dataset was constructed by man–machine interactive visual interpretation [30]. In the process of interpretation, the county was taken as the unit, and the county interpretation result *.shp file was generated. Then, using the graphics to edit, check, modify errors, organize and summarize, such as checking the spot attribute code errors, including whether there were missing code and duplicate code phenomena, after modification, the edges of the adjacent county data were completed, and the land use/cover interpretation result data were generated. The classification system used in this study adopted a two-level approach. The first level categorized land into cultivated land, forest land, grassland, water areas, construction land and unused land. The second level further divided these categories into 25 types based on the natural attributes of the land resources. In order to ensure the validity and credibility of the data, two methods of random sampling verification using field survey points and random sampling verification using verification lines were applied to test the accuracy. The field inspection and research data were obtained from multiple field inspections and surveys conducted by the research group in the study area from 2016 to 2023. This was mainly used to deeply understand the geographical location and socioeconomic status of the study area, as well as to verify the remote sensing data and improve the authenticity and reliability of the data.
Based on the characteristics and distribution of the wetland types in the SSLP, this study classified the land use types in the study area using remote sensing monitoring data combined with field investigation data. The wetland types were divided into six categories: paddy fields, river canals, lakes, reservoir potholes, beach land and marshes (Table 1).
According to the distribution characteristics of the wetlands in the SSLP, six indices were selected at the level of the type (Table 2), including the class area (CA), percentage of landscape (PLAND), patch density (PD), largest patch index (LPI), mean patch size (AREA-MN) and clumpiness index (CLUMPY). At the landscape level, six indices were selected (Table 2), including the number of patches (NP), patch density (PD), landscape shape index (LSI), contagion index (CONTAG), Shannon’s diversity index (SHDI) and Shannon’s evenness index (SHEI).

2.3. Methods

2.3.1. Wetland Dynamic Degree Model

The dynamic degree of a single wetland change represents the rate of change in the wetland area over a specific period. In this study, we constructed a dynamic degree model to analyze the wetland changes in the SSLP. This model reflects the characteristics of changes in the wetland landscape area within the study area and helps to explore the intensity of the wetland area changes over different periods [31,32]. Its expression is as follows:
K = S 2 S 1 S 1 × 1 T × 100 %
where K is the annual change rate of a single wetland type; S1 and S2 are the wetland type areas at the beginning and end of the study period, respectively; T is the time interval of the change.

2.3.2. Markov Transfer Matrix

The land use transfer matrix quantitatively describes the area transformation and transfer states between land use elements at the beginning and end of the study period. It fully reflects the direction of land use changes over a specific time period. The Markov transition matrix simulates the dynamic process of landscape transitions from one state to another through its transition matrix [33,34,35]. This method effectively simulates short-time-series data. Therefore, in this study, we use the Markov transfer matrix to analyze the development and evolution of various wetland landscape types over time. Its expression is as follows:
A i j = A 11 A 12 A 1 n A 21 A 22 A 2 n   A n 1 A n 2   A n n
where A represents the area of the landscape type; i represents the initial time of the study; j represents the end time of the study; n is the total number of landscape types.

2.3.3. Landscape Pattern Index

The landscape pattern index can effectively condense landscape pattern information and is a commonly used index for the quantitative analysis of a landscape’s spatial structure. It can accurately analyze the dynamic changes in the wetland landscape patterns in the Shaanxi section of the Loess Plateau [36,37,38]. This study selected 12 indicators from the type level and landscape level and used the Fragstats 4.2 software to analyze the spatial heterogeneity, fragmentation degree, patch complexity and other characteristics of the wetland landscape in the SSLP.

2.3.4. Centroid Analysis

The centroid analysis method, also known as the standard deviation ellipse, reflects the internal patterns and directional differences in the spatial distribution of landscape elements [39,40]. This study uses the centroid analysis method to calculate the center of gravity of the wetlands and explores the spatial and temporal evolution trends of the wetlands in the SSLP. Its expression is as follows:
S D E x = i = 1 n x i x ¯ 2 n
S D E y = i = 1 n y i y ¯ 2 n
where xi and yi are the coordinates of the ground objects; SDEx and SDEy represent the center of the ellipse; x   ¯ and y ¯ represent the average center; n is the total number of analyzed objects.

3. Results

3.1. Analysis of Spatio-Temporal Variation in Wetland Area

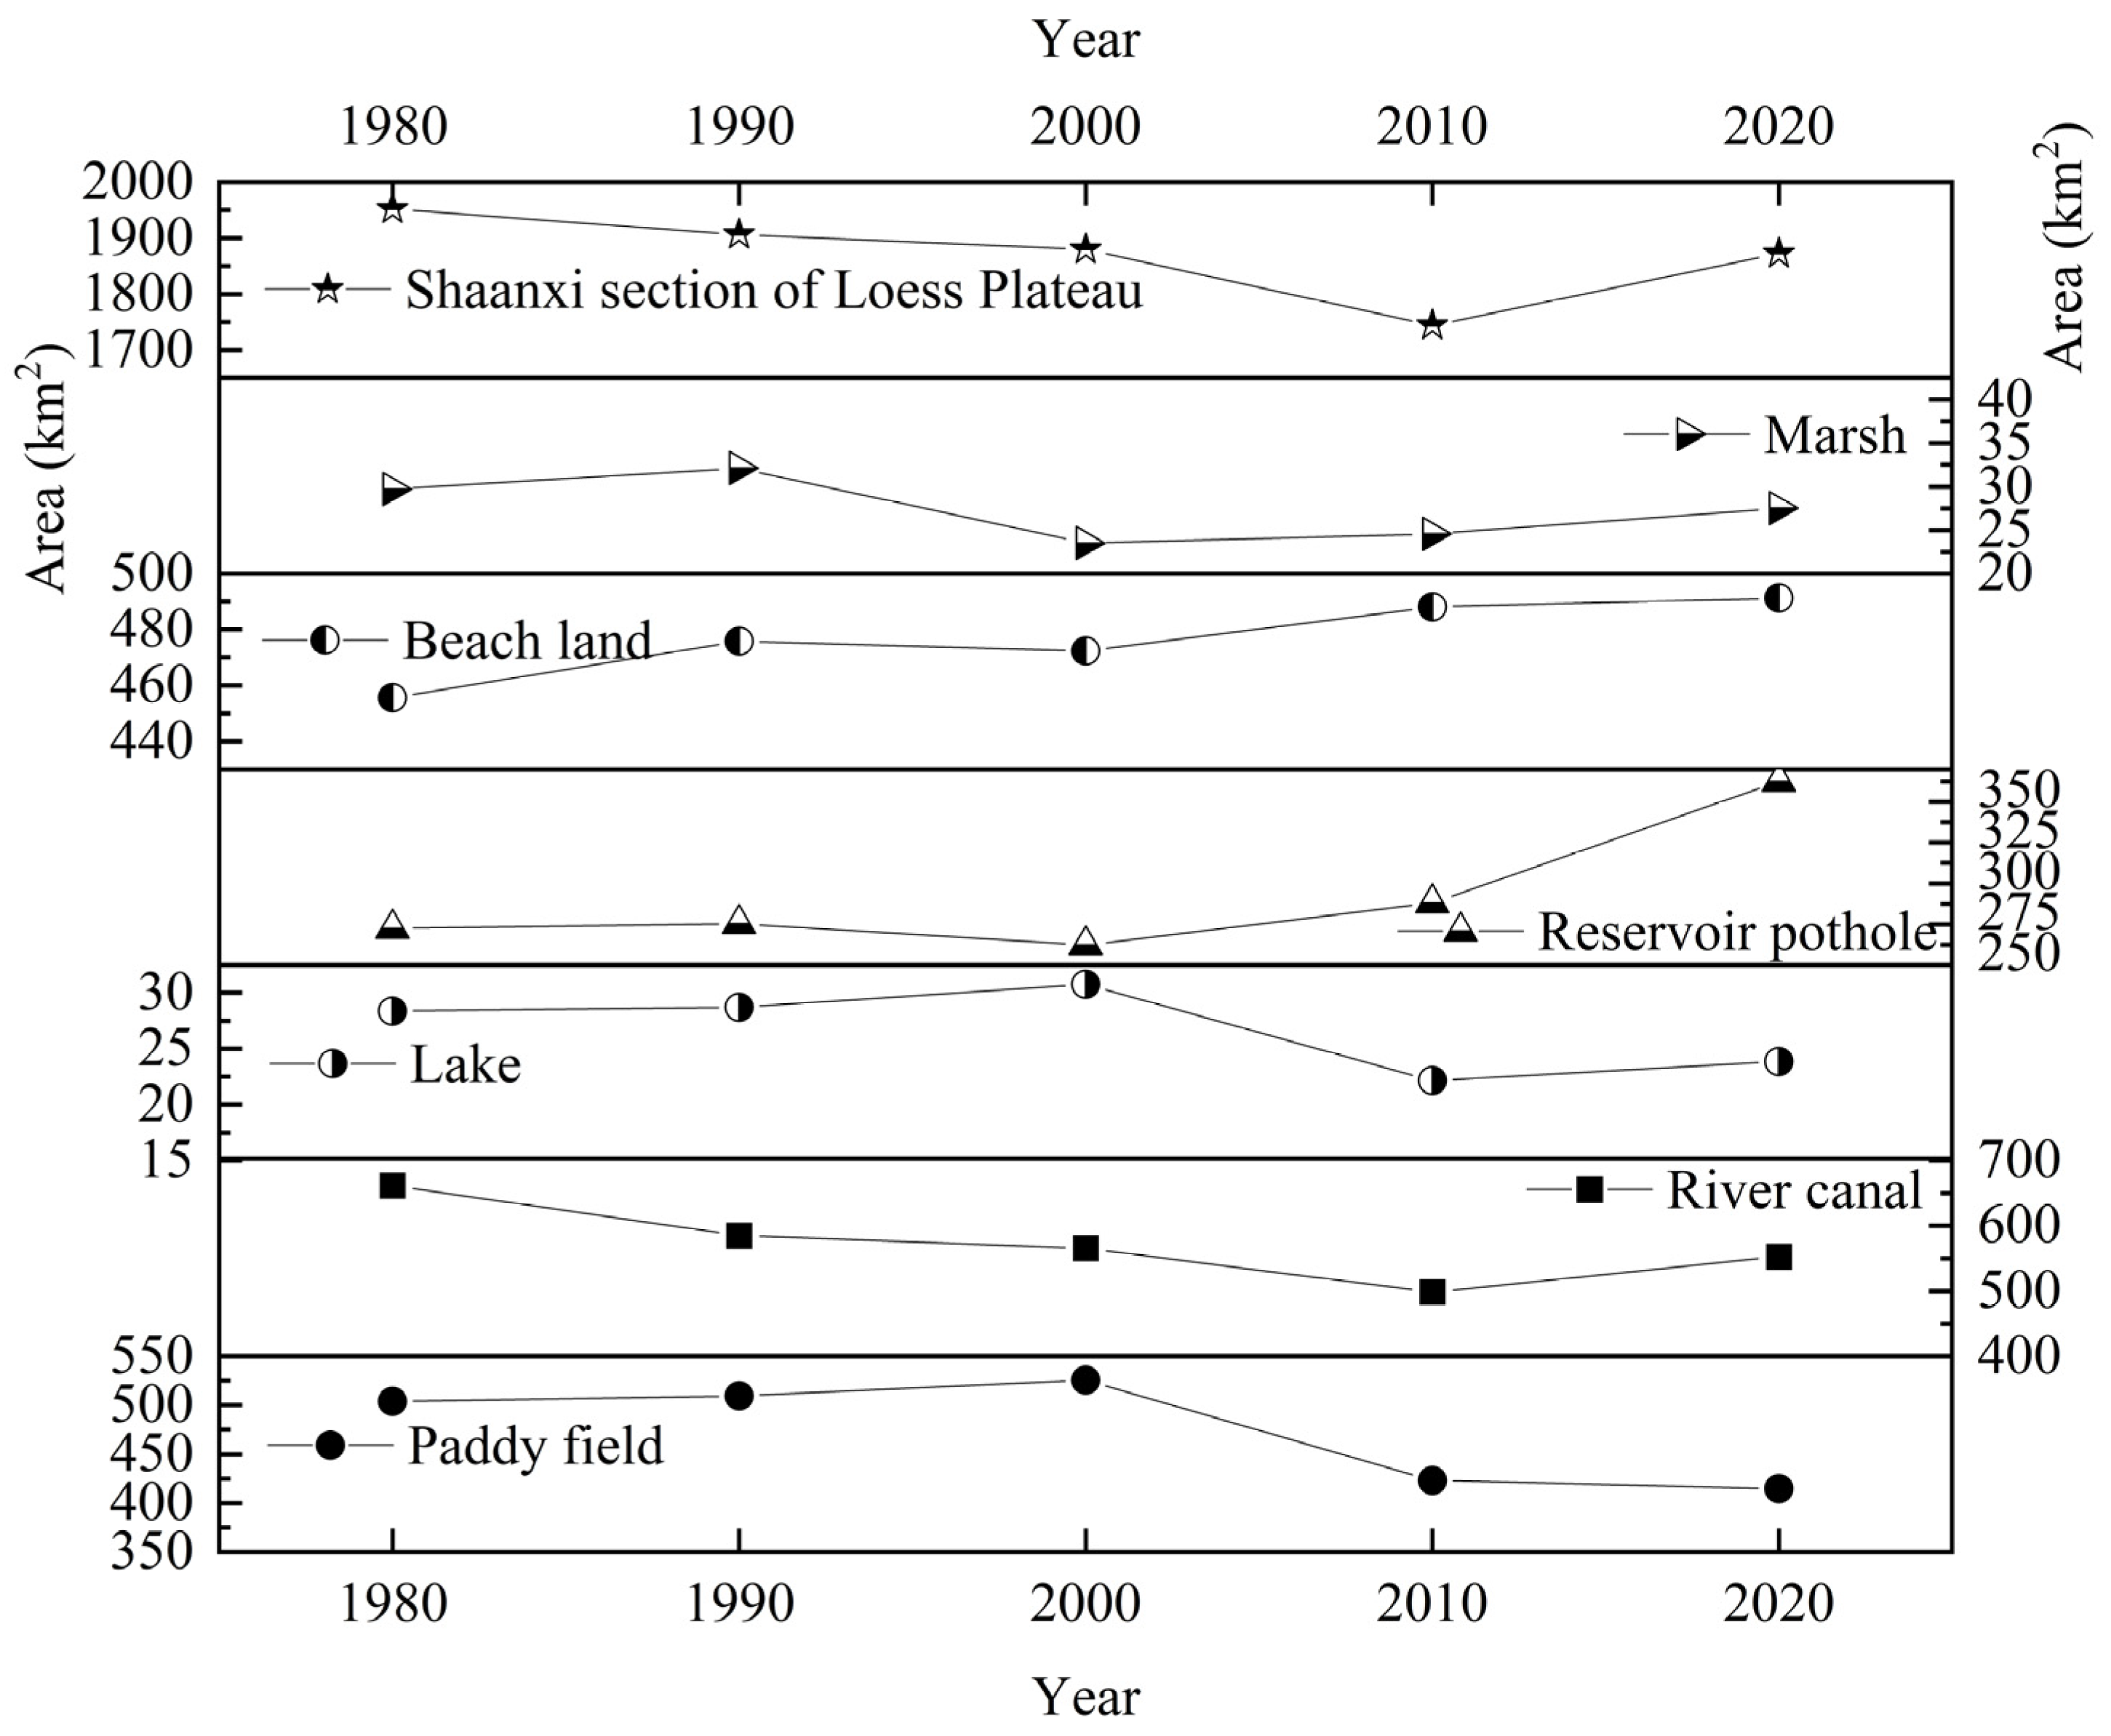
3.1.1. Temporal Variation Analysis

Table 3 shows the changes in the areas of natural wetlands, artificial wetlands and total wetlands in the SSLP from 1980 to 2020. The data reveal a consistent decline in the area of natural wetlands and total wetlands over the past 40 years, with decreases of 80.50 km2 and 79.35 km2, respectively. Conversely, the area of artificial wetlands has slightly increased by 1.14 km2. However, the trend of shrinkage in artificial wetlands intensified in 2010. Despite this, the total area of natural wetlands has consistently remained higher than that of artificial wetlands. The significant reduction in the wetland area in 2010 can be attributed primarily to drought [41,42,43]. In 1980–1985, with the increase in the temperature and precipitation, the degree of drought in Northern Shaanxi decreased. From 1985 to 2010, due to the continuous and rapid increase in the temperature, the evaporation was far greater than the precipitation, which caused the drought degree in Northern Shaanxi to increase [44]. The rainfall in the Guanzhong area did not change much from 1980 to 1983. From 1984 to 2010, the rainfall decreased first and then increased, but the increase was less than the decrease, which caused the rainfall in the Guanzhong area to generally decrease. From 1980 to 2010, the temperature in the Guanzhong area showed an upward trend. From 1980 to 1983, the temperature change was not large. From 1984 to 1997, the temperature rose rapidly and the change was large. From 2007 to 2010, the temperature was at a high level [45]. According to the comparison of the cultivated land area in 2000 and 2010 in the Shaanxi Statistical Yearbook in 2001 and 2011, the paddy field area in the study area also decreased significantly [46,47]. Overall, the total wetland area and natural wetland area decreased, while the artificial wetland area increased, indicating that human activities have an important impact on the wetland ecological environment.
Table 4 shows the changes in the areas of various types of wetlands in the SSLP from 1980 to 2020. Over the study period, the area of paddy fields initially increased, reaching its peak at 525.59 km2 in 2000, before declining. The area of river canals showed a continuous decrease but slightly increased to 552.70 km2 in 2020. Similarly, lakes initially expanded, with the largest area recorded in 2000 at 30.77 km2, before decreasing. Conversely, the area of reservoir ponds steadily increased, reaching its peak at 23.86 km2 in 2020. Beach land exhibited a gradual increase, with the largest area recorded in 2020 at 491.30 km2; marshes experienced fluctuations, initially increasing and then decreasing and slowly increasing again, with the largest area observed in 1990 at 32.12 km2.
Figure 3 shows the area changes of the wetland landscape types in the SSLP from 1980 to 2020. From 1980 to 1990, the area of river canals experienced the most significant shrinkage, accompanied by a notable decrease in the area of natural wetlands. During the period from 1990 to 2000, there was a serious decline in the area of beach land and marshes. From 2000 to 2010, the area of reservoir ponds witnessed the most significant increase, while the area of paddy fields sharply decreased. In the subsequent decade, from 2010 to 2020, the areas of reservoir ponds, river canals and beach land increased, alongside slight increases in the areas of marshes and lakes, while the area of paddy fields continued to decline. Notably, during this period, both artificial and natural wetlands saw an increase in their respective areas.

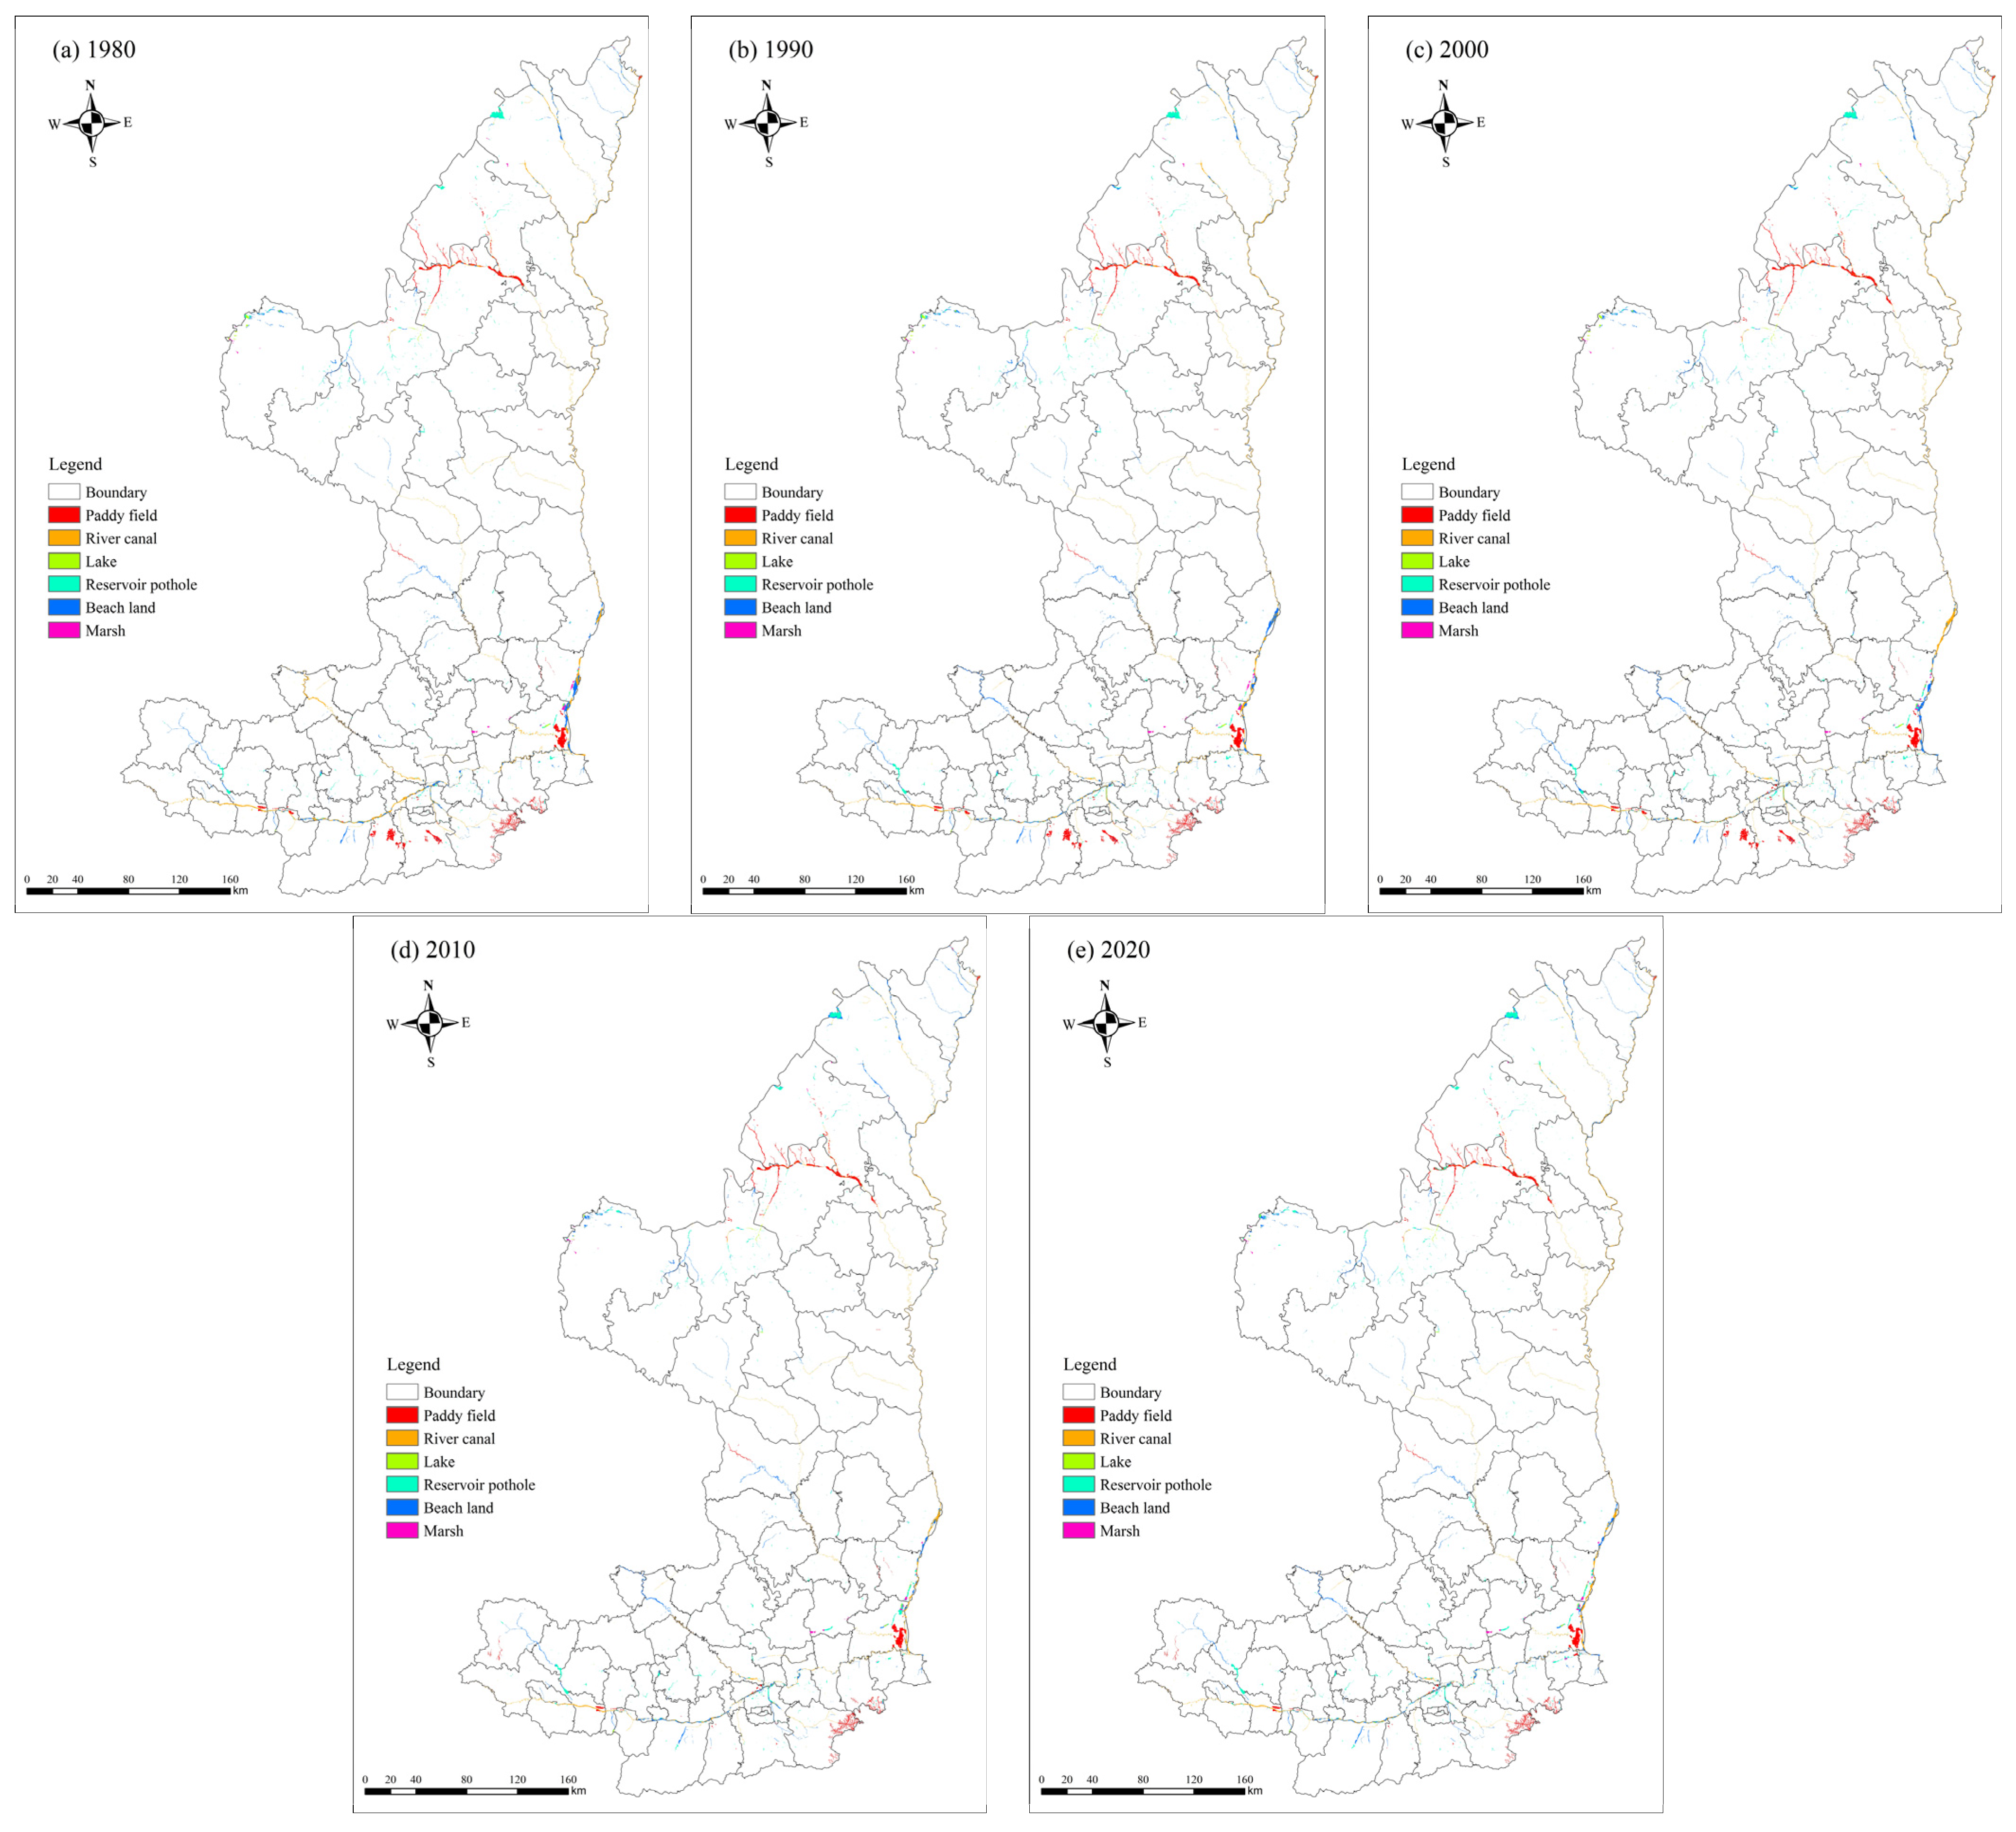
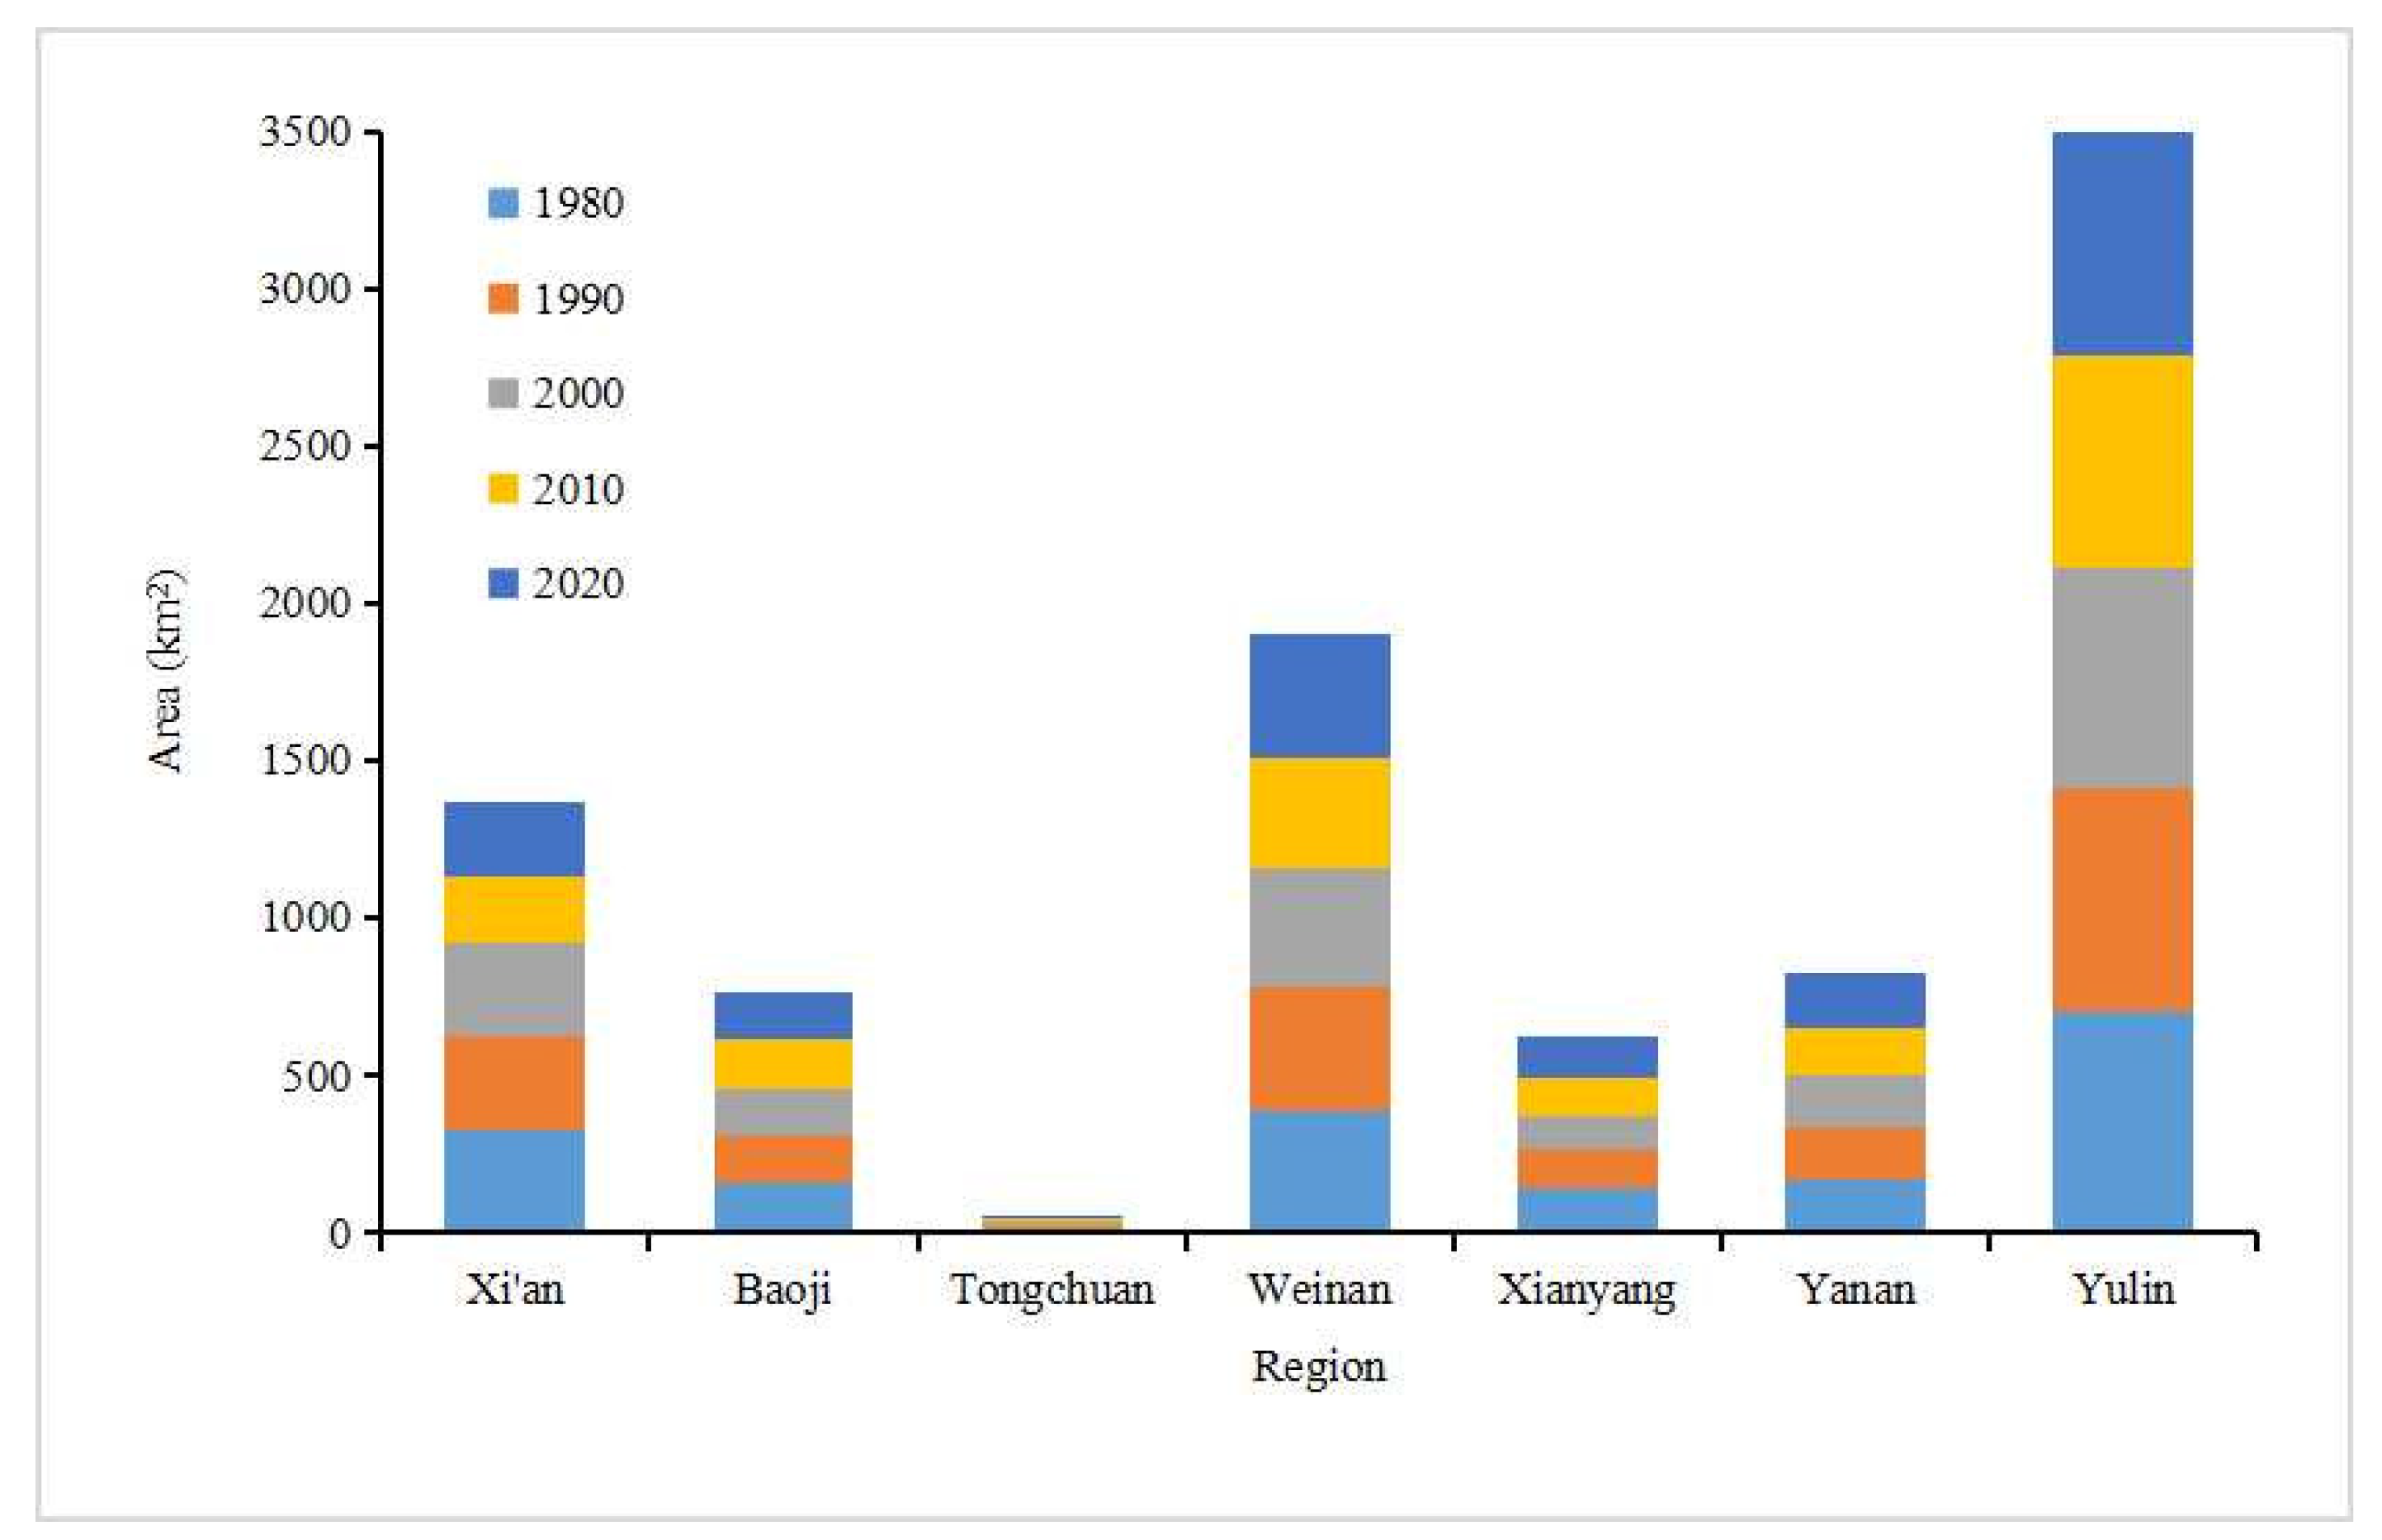
3.1.2. Spatial Variation Analysis

Among the various wetland types, paddy fields and river canals are the most widely distributed. Paddy fields are primarily found in Weinan City, Xi’an City and Yulin City, with a small presence in Baoji City. River canals are distributed in various urban areas in the study area, including the Yellow River, Weihe River, Wuding River and tributaries at all levels. Lakes are relatively sparse, mainly concentrated in Weinan City and Yulin City. Reservoir ponds are predominantly located in Weinan City and Yulin City, with a few scattered in other urban areas. The beach land area is small, and the cities with the largest distribution areas are Weinan City, Xi’an City and Yulin City. Their distribution has no specific pattern and is relatively scattered. River canals, lakes, beach land and marshes are mainly distributed along the main lines of rivers, while paddy fields and reservoir ponds are mainly distributed near the main lines of rivers and near villages (Figure 4).
From 1980 to 2020, the total wetland area changes in the seven cities in the SSLP generally showed a gradual shrinking trend. Among these cities, Yulin City had the largest total wetland area, followed by Weinan City, Xi’an City, Yan’an City, Baoji City, Xianyang City and Tongchuan City, in descending order. During the same period, the wetland area in Xi’an City shrank the most, followed by Xianyang City, and the wetland areas in Yulin City, Weinan City, Yan’an City, Baoji City and Tongchuan City increased (Figure 5).
Figure 6 illustrates the changes in the wetlands in the SSLP from 1980 to 2020. From 1980 to 1990, 42 counties and districts experienced changes in wetlands, with Dali County having the most changes, followed by Hancheng City. Between 1990 and 2000, the wetlands in 41 counties and districts changed, with Hancheng City showing the most changes, followed by Shenmu City. During 2000 to 2010, 63 counties and districts saw changes, with the highest frequency in Shenmu City, followed by Dali County; this period had the most frequent changes. From 2010 to 2020, the wetlands in 59 counties and districts changed, with Shenmu City again having the most changes, followed by Heyang County. Over the entire period from 1980 to 2020, Hancheng City had the most changes in wetlands, followed by Shenmu City and Dali County.

3.2. Analysis of Dynamic Characteristics of Wetland Landscape

Table 5 shows the variation and change rates of the wetland areas in the SSLP. As shown in Table 5, the total wetland area in the SSLP decreased by 79.35 km2 from 1980 to 2020, and the annual change rate was −0.10%. The wetland area changes of paddy fields, river canals, lakes, reservoir ponds, beach land and marshes were −88.81 km2, −109.51 km2, −4.53 km2, 89.95 km2, 35.70 km2 and −2.16 km2, and the annual change rates were −0.44%, −0.41%, −0.40%, 0.83%, 0.20% and −0.18%. In the SSLP, the largest variation in wetland types was seen for river canals, and the smallest variation was seen for marshes.
From 1980 to 1990, except for lakes, all wetland types were transferred, and the area transferred to beaches was the largest, which was 63.53 km2. From 1990 to 2000, river canals were mainly transferred to paddy fields, reservoir ponds and beach lands. The largest area transferred to beach land was 55.63 km2, and the maximum area transferred from beach land to river channels was 53.85 km2. From 2000 to 2010, the area of river channels transferred to beach land was the largest, which was 87.09 km2, and the transfer areas from beach land to river channels and reservoir ponds were 50.02 km2 and 21.12 km2, respectively. From 2010 to 2020, a total of 78.26 km2 of beach land was transferred to other wetland types. The beach land was mainly transferred to river channels, with a transfer area of 64.98 km2. River channels experienced transfers to various wetland types, notably 56.24 km2 to beach land, the largest recipient. Over the entire period from 1980 to 2020, paddy fields primarily transitioned to reservoir ponds (7.12 km2), river channels to beach land (96.78 km2) and beach land to river channels (56.99 km2). Lakes were primarily transferred to reservoir ponds, beach land and marshes, while reservoir ponds and beach land underwent transfers to other wetland types and marshes mainly transitioned to lakes and reservoir ponds (Figure 7).

3.3. Analysis of Change Characteristics of Wetland Landscape Pattern

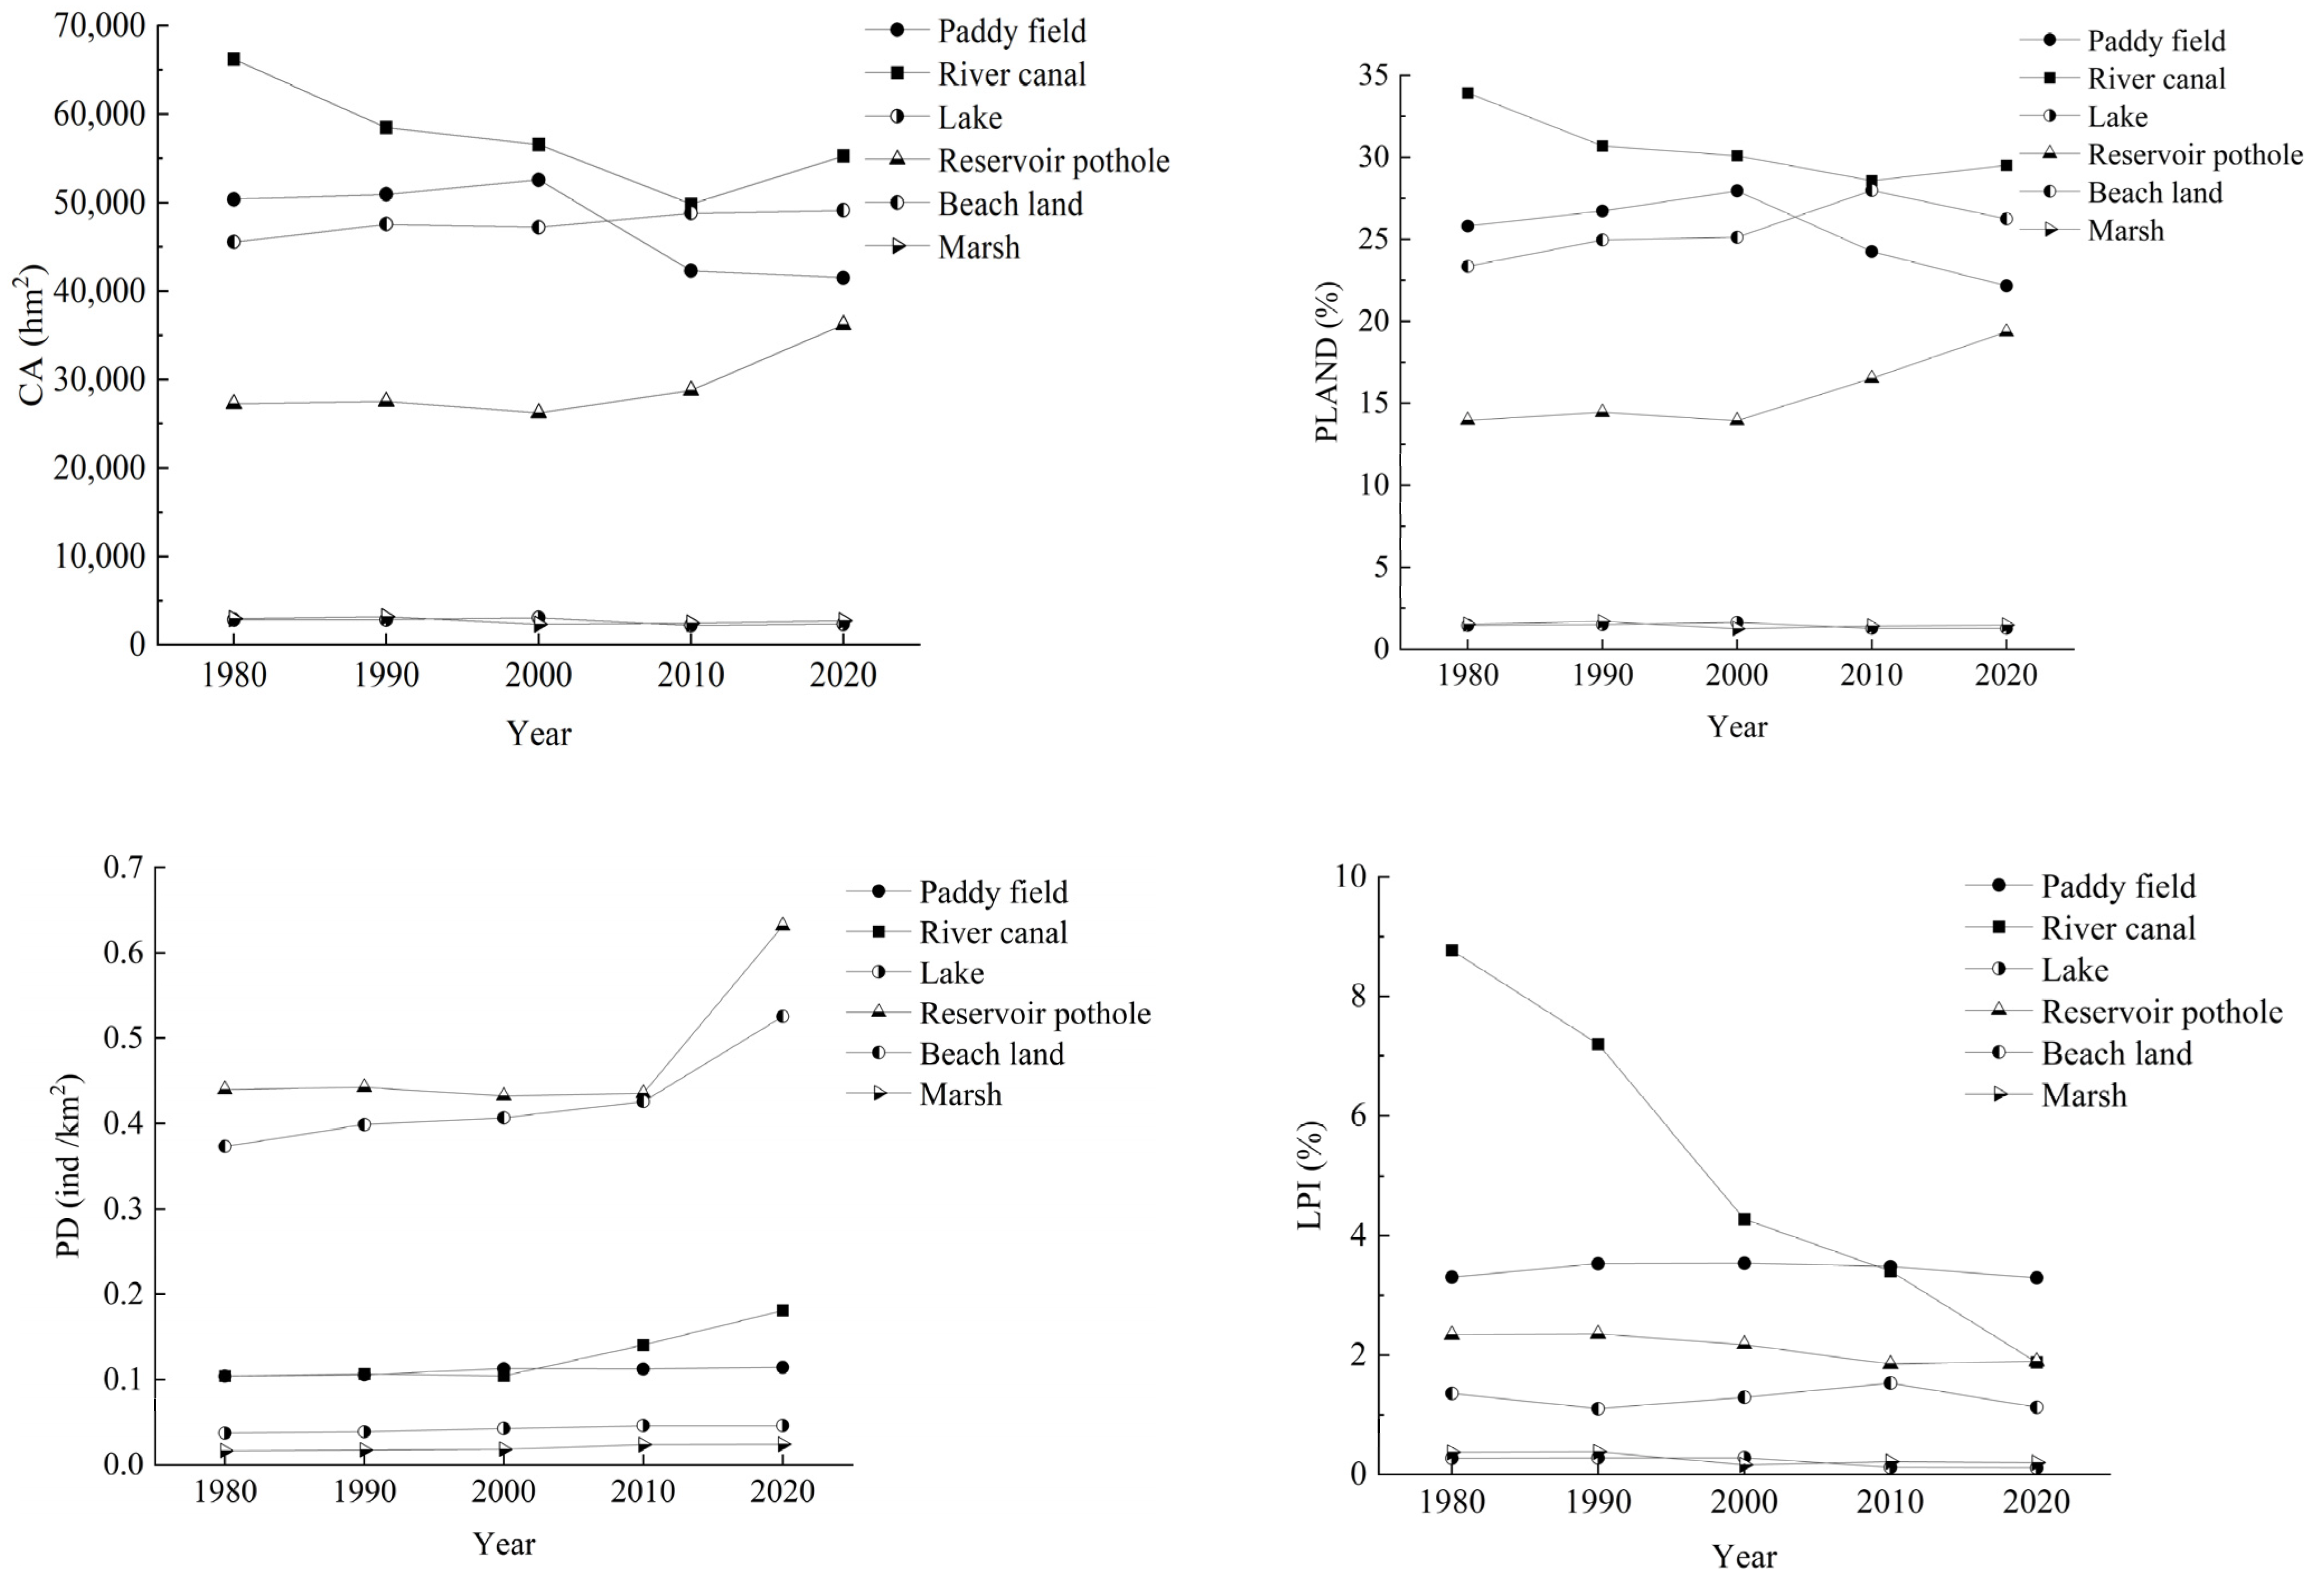
3.3.1. Variation Characteristics of Wetland Landscape Pattern at Type Level

Figure 8 shows the change trends of the wetland landscape pattern index in the SSLP in different periods at the level of the type. During the five periods, river channels consistently exhibited the largest class area and percentage of landscape, which were higher than those of other wetland types, and these were the main landscape types in the study area.
During these periods, the patch density of reservoir ponds was consistently the highest, with the most significant inter-annual fluctuation range, indicating pronounced fragmentation. Following closely was the patch density of beach land, which showed an overall increasing trend in inter-annual fluctuation. River channels also displayed a rising trend in patch density. In contrast, the patch densities of paddy fields, lakes and marshes remained relatively small and stable over the years.
During these periods, the largest patch index of river channels exhibited a sharp decline each year, while the largest patch indices of other wetland types showed minor fluctuations, suggesting greater human-induced disturbances for river channels.
The mean patch size, indicative of landscape fragmentation, showed variations over time. From 1980 to 2000, river channels had the largest mean patch size, followed by paddy fields. Following 2010, the mean patch size of paddy fields was the largest, followed by river channels. The mean patch sizes of lakes, reservoir ponds, beaches and marshes were small, and the landscape patches were fragmented and scattered.
The clumpiness index, reflecting patch aggregation, varied across the different wetland types. Marshes consistently had the highest clumpiness index with minimal inter-annual fluctuations. The clumpiness indices of paddy fields and reservoir ponds showed a pattern of an initial increase followed by a decrease. For lakes, beach land and river channels, there was a gradual decrease from 1980 to 2000, followed by a sharp drop from 2000 to 2010 and relatively consistent trends thereafter. River channels exhibited the lowest clumpiness index, indicating high fragmentation and low connectivity in their spatial distribution.

3.3.2. Variation Characteristics of Wetland Landscape Pattern at Landscape Level

It can be seen from Table 6 that the number of patches and patch density are increasing. The landscape shape index increased from 106.19 to 117.89, indicating increasing complexity in the edge shapes of various landscape types and greater integration between different landscape areas. The fluctuation of the contagion index decreased, while the fluctuations of Shannon’s diversity index and Shannon’s evenness index increased. This indicates that the degree of landscape fragmentation in the SSLP is increasing, reflecting the significant impact of human activities on the landscape pattern of the SSLP.

3.4. Analysis of Centroid Changes of Wetland Landscape Pattern

As shown in Figure 9, the centroid of the wetlands in the SSLP moved from south to north as a whole. From 1980 to 1990, the centroid shifted to the southeast, reaching its easternmost point. This shift was mainly caused by the reduction in the area of artificial wetlands. During this period, rainstorms in the northwest often caused water damage to small reservoirs, reducing the area of reservoir ponds. From 1990 to 2000, the centroid remained relatively stable, indicating that the wetland areas increased or decreased evenly across the region. From 2000 to 2010, the centroid moved southwest, reaching its southernmost point. During this period, due to the influence of climate warming and drying, the areas of natural wetlands and artificial wetlands showed a decreasing trend, and the changes in the areas of rivers, paddy fields, lakes and reservoir ponds were the key to its reduction. From 2010 to 2020, the centroid moved north and east, reaching its northernmost point. The main reason was that the areas of natural wetlands and artificial wetlands showed an increasing trend during this period, and the areas of other wetland types increased significantly, with the exception of paddy fields.

4. Conclusions

(1) As a result of human activities and the effects of climate change, the total wetland area decreased by 79.35 km2 from 1980 to 2020. During this period, artificial wetlands increased by 1.14 km2, while natural wetlands decreased by 80.50 km2. Natural wetlands are mainly distributed along the main lines dominated by rivers, while artificial wetlands are mainly distributed near the main lines dominated by rivers and near villages. The wetlands in the SSLP are concentrated in Weinan City, Yulin City and Xi’an City. The wetland area in Xi’an City shrank the most. From 1980 to 2020, Hancheng City experienced the most significant changes in wetlands, followed by Shenmu City and Dali County. The decade from 2000 to 2010 saw the highest frequency of changes, affecting 63 districts and counties.
(2) From 1980 to 2020, various wetland types transferred frequently to each other, mainly between beach land and river channels. The area transferred from river channels to beach land was 96.78 km2, and the transfer area from beach land to river channels was 56.99 km2. The changes in river channels were the largest. Lakes were mainly transferred to reservoir ponds, beach land and marshes. Reservoir ponds and beach land were transferred to other wetland types, and marshes were mainly transferred to lakes and reservoir ponds.
(3) The analysis of the landscape pattern index reveals that rivers are the main wetland type in the SSLP. Reservoir ponds have the highest patch density and the highest degree of fragmentation. Lakes, reservoir ponds, beaches and marshes have smaller mean patch sizes, and the landscape patches are fragmented and scattered. The clumpiness index of river channels is the lowest, indicating that the spatial distribution is discrete, the degree of fragmentation is high and the connectivity is low. The fluctuations in the Shannon diversity index and Shannon evenness index increased, indicating that the overall landscape in the Shaanxi section of the Loess Plateau is becoming more diversified.
(4) From 1980 to 2020, the direction of the change in the centroid of the wetlands in the SSLP was significant, and it moved from south to north as a whole. It can be divided into four stages: from 1980 to 1990, the centroid moved southeast; from 1990 to 2000, the centroid remained relatively stable; from 2000 to 2010, the centroid moved southwest; and from 2010 to 2020, the centroid moved northeast. The change in the wetlands centroid was mainly concentrated in Baota District and Ganquan County.

Author Contributions

Conceptualization, Z.X. and R.H.; methodology, Y.W.; software, Z.X.; validation, L.Y.; formal analysis, R.H.; investigation, Y.W., Z.X. and R.H.; resources, Y.W. and Z.X.; writing—original draft preparation, Z.X.; writing—review and editing, Y.W., Z.X., R.H. and L.Y.; funding acquisition, Y.W. All authors have read and agreed to the published version of the manuscript.

Funding

This study was funded by the State Key Laboratory of Soil Erosion and Dryland Farming on the Loess Plateau Project (F2010121002-202322); the Yulin City Science and Technology Plan Project (2023-CXY-176); and the Baoji University of Arts and Sciences Research Project.

Data Availability Statement

The updated 1980, 1990, 2000, 2010 and 2020 land use data of the Shaanxi section of the Loess Plateau were obtained from the Resource and Environmental Science Data Center of the Chinese Academy of Sciences (http://www.resdc.cn/), accessed on 7 September 2022. Data are contained within the article. The data are not publicly available due to national security policies.

Acknowledgments

We are grateful to Jonathan for polishing and commenting on the language throughout the manuscript, and we are also grateful to the three anonymous reviewers for their valuable comments and suggestions that improved this study.

Conflicts of Interest

The authors declare no conflicts of interest.

References

  1. Dar, A.S.; Rashid, I.; Bhat, U.S.; Dar, A.J. Evaluation of ecosystem services vis-à-vis perceptions and attitudes of local communities towards Wetland conservation in Kashmir Himalaya. Environ. Dev. 2024, 51, 101041. [Google Scholar] [CrossRef]
  2. Song, C. Influence of Global Climate Change on wetlands. Wetl. Sci. 2003, 1, 122–127. [Google Scholar]
  3. Niu, Z.; Zhang, H.; Wang, X.; Yao, W.; Zhou, D.; Zhao, K.; Zhao, H.; Li, N.; Huang, H.; Li, C.; et al. Mapping wetland changes in China between 1978 and 2008. Chin. Sci. Bull. 2012, 57, 2813–2823. [Google Scholar] [CrossRef]
  4. Hu, S.; Niu, Z.; Chen, Y.; Li, L.; Zhang, H. Global wetlands: Potential distribution, wetland loss, and status. Sci. Total Environ. 2017, 586, 319–327. [Google Scholar] [CrossRef] [PubMed]
  5. Wang, R.; Wang, Y.; Yang, Q.; Yang, G.; Zhang, G.; Liu, B. The current situation, problems and countermeasures of wetland resources in China. Resour. Sci. 2000, 22, 9–13. [Google Scholar]
  6. Niu, Z.; Chen, X.; Zhao, K.; Zhou, D.; Guo, J.; Liang, L.; Wang, X.; Li, D.; Huang, H.; Wang, Y.; et al. Remote sensing of wetland change in 1990 and 2000 base year in China. Sci. Sin. (Terrae) 2010, 40, 768–775. [Google Scholar]
  7. Mao, D.; Wang, Z.; Luo, L.; Ren, C.; Jia, M. Monitoring the Evolution of Wetland Ecosystem Pattern in Northeast China from 1990 to 2013 Based on Remote Sensing. J. Nat. Resour. 2016, 31, 1253–1263. [Google Scholar]
  8. Jia, M.; Wang, Z.; Mao, D.; Huang, C.; Lu, C. Spatial-temporal changes of China’s mangrove forests over the past 50 years: An analysis towards the Sustainable Development Goals (SDGs). Chin. Sci. Bull. 2021, 66, 3886–3901. [Google Scholar] [CrossRef]
  9. Copeland, H.E.; Tessman, S.A.; Girvetz, E.H.; Roberts, L.; Enquist, C.; Orabona, A.; Patla, S.; Kiesecker, G. A geospatial assessment on the distribution, condition, and vulnerability of Wyoming’s wetlands. Ecol. Indic. 2010, 10, 869–879. [Google Scholar] [CrossRef]
  10. Liang, M.; Xie, Z.; Mao, D.; Wang, Z.; Yan, H.; Kang, Y. Landscape Dynamics of Wetlands of International Importance in Dongting Lake Area for 5 Periods since 1980. Wetl. Sci. 2020, 18, 40–46. [Google Scholar]
  11. Chen, A.; Sui, X.; Wang, D.; Liao, W.; Ge, H.; Tao, J. Landscape and avifauna changes as an indicator of Yellow River Delta Wetland restoration. Ecol. Eng. 2016, 86, 162–173. [Google Scholar] [CrossRef]
  12. Jiang, W.; Wang, W.; Xie, Z.; Gao, S. A Study on Changes of Wetland Ecology Landscape of Sanjiang Plain Using RS and GIS. Geogr. Geo-Inf. Sci. 2003, 19, 28–31. [Google Scholar]
  13. Lu, X.; Zhao, Q.; Ye, H.; Li, Y.; Zheng, W.; Li, S.; Li, Y. Analysis of landscape change and driving factors of coastal wetlands in yancheng, Jiangsu Province. Trans. Oceanol. Limnol. 2022, 44, 23–32. [Google Scholar]
  14. Wang, Y.; Zhao, C.; Zeng, H.; Kang, M.; Zhao, T.; Tang, Y. Spatial-temporal evolution of wetland landscape patterns and its influencing factors in the middle reaches of the Shule River. Arid Zone Res. 2022, 39, 282–291. [Google Scholar]
  15. Li, H.; Zhang, J.; Guo, J. Spatial-temporal evolution pattern of wetland landscape in the Yellow River Basin. Bull. Surv. Mapp. 2021, 28–33. [Google Scholar] [CrossRef]
  16. Xu, X.; Wang, X.; Jia, H.; Zhu, X. Seasonal landscape pattern changes in Bayanbulak swan lake alpine wetland. J. Agric. Resour. Environ. 2020, 7, 82–91. [Google Scholar]
  17. Wang, H.; Xu, Y.; Li, L.; Liu, X.; Jiao, Y. Landscape Pattern Evolution and Driving Force Analysis of Yongnianwa Wetland. Wetl. Sci. 2023, 21, 197–207. [Google Scholar]
  18. Yin, X.; Tan, C.; Ke, Y.; Zhou, D. Evolution and driving factors of salt marsh wetland landscape pattern in the Yellow River Delta in 1973–2020. Acta Ecol. Sin. 2024, 44, 67–80. [Google Scholar]
  19. Liu, G.; Bai, Y.; Zhang, T.; Wang, Z.; Hu, C. Effects of wetland reconstruction on bird diversity in the agro-pastoral ecotone of the Loess Plateau. J. Hydraul. Eng. 2018, 49, 1097–1108. [Google Scholar]
  20. Chen, K.; Cong, P.; Lei, W. Impacts of human activities on the changes of wetland landscape types in the Yellow River Delta during the past 40 years. Mar. Environ. Sci. 2019, 38, 736–744+750. [Google Scholar]
  21. He, J.; He, L.; Lv, D.; Cheng, Z.; Xue, F.; Liu, B.; Zhang, X. Spatiotemporal variation and its driving mechanism of photosynthetic vegetation in the Loess Plateau from 2001 to 2020. Chin. J. Plant Ecol. 2023, 47, 306–318. [Google Scholar] [CrossRef]
  22. Yuan, X. Study on the Index System of Wetland Ecological Red Line Delimitation in Guanzhong Area of Shaanxi Province. Master’s Thesis, Baoji University of Arts and Sciences, Baoji, China, 2019. [Google Scholar]
  23. Ye, Z.; Zhang, H.; Yang, Z.; Zhang, Y.; Li, T.; Zhao, X.; Xue, C. Spatial differentiation effects and risk detection of meteorological elements to vegettation cover on the Loess Plateau of northern Shaanxi. Acta Ecol. Sin. 2024, 44, 2379–2395. [Google Scholar]
  24. Chen, S.; Zhang, Q.; Chen, Y.; Zhou, H.; Xiang, Y.; Liu, Z.; Hou, Y. Vegetation Change and Eco-Environmental Quality Evaluation in the Loess Plateau of China from 2000 to 2020. Remote Sens. 2023, 15, 424. [Google Scholar] [CrossRef]
  25. Han, L.; Cao, X.; Zhu, H.; Chen, R.; Zhao, Y.; Liu, Z.; Zhao, Z.; Chang, Y.; Yang, M.; Gao, Y. Change of vegetation coverage and driving factor in the North Shaanxi Loess Plateau based on characteristic zoning. Acta Ecol. Sin. 2023, 43, 8564–8577. [Google Scholar]
  26. Qiu, H.; Zhang, J.; Han, H.; Cheng, X.; Kang, F. Study on the impact of vegetation change on ecosystem services in the Loess Plateau, China. Ecol. Indic. 2023, 154, 110812. [Google Scholar] [CrossRef]
  27. State Forestry Bureau. China Wetlands Resources Shaanxi Volume; Chinese Forestry Publishing House: Beijing, China, 2015; pp. 157–158. [Google Scholar]
  28. Xiong, P.; Zi, S. Types and Distribution Characteristics of Main Wetlands in Shaanxi Province. For. Sci. Technol. Inf. 2020, 52, 14–16+20. [Google Scholar]
  29. Xu, X.; Liu, J.; Zhang, S.; Li, R.; Yan, C.; Wu, S. China Multi-Period Land Use Land Cover Remote Sensing Monitoring Data Set (CNLUCC); Data Registration and Publishing System of Resource and Environmental Science Data Center, Chinese Academy of Sciences: Beijing, China, 2018. [Google Scholar]
  30. Liu, J.; Kuang, W.; Zhang, Z.; Xu, X.; Qin, Y.; Ning, J.; Zhou, W.; Zhang, S.; Li, R.; Yan, C.; et al. Basic characteristics and spatial pattern of land use change in China since 1980s. J. Geogr. Sci. 2014, 24, 195–210. [Google Scholar] [CrossRef]
  31. Chen, Y.; Ke, X.; Liu, F.; Min, M. Area, Distribution and Variation of Wetlands in Wuhan for 4 Periods since 1987. Wetl. Sci. 2019, 17, 553–558. [Google Scholar]
  32. Gao, J.; Gao, M.; Zhao, Z.; Han, Z.; Han, X.; Gao, W. Wetland Landscape Pattern Changes and Driving Forces in Qilihai Lagoon, 1987–2015. J. Hydroecology 2018, 39, 8–16. [Google Scholar]
  33. Ren, H.; Ren, C.; Wang, Z.; Liu, P. Dynamics of Area and Distribution of the Wetlands in Changchun City since 1990 and Its Influencing Factors. Wetl. Sci. 2023, 21, 575–581. [Google Scholar]
  34. Qiu, Z.; Mao, D.; Xiang, H.; Du, B.; Wang, Z. Patterns and Changes of Wetlands in the Yellow River Basin for 5 Periods. Wetl. Sci. 2021, 19, 518–526. [Google Scholar] [CrossRef]
  35. Ding, P. Analysis of Wetland Landscape Pattern Changes and Driving Forces in Shaanxi Province from 1980 to 2018. Master’s Thesis, Baoji University of Arts and Sciences, Baoji, China, 2021. [Google Scholar]
  36. Niu, J. Multi-Scale Landscape Pattern Analysis and Ecological Environment Ecaluation of Wetlands in the Yellow River Delta. Master’s Thesis, Shandong Jianzhu University, Jinan, China, 2023. [Google Scholar]
  37. Wang, S. Dynamic Evolution of Wetland Landscape Pattern in Taihu Lake Basin and Its Multi-Level Driving Mechanism. Master’s Thesis, Suzhou University of Science and Technology, Suzhou, China, 2022. [Google Scholar]
  38. Lv, J.; Jiang, W.; Wang, W.; Chen, K.; Deng, Y.; Chen, Z.; Li, Z. Wetland landscape pattern change and its driving forces in Beijing-Tianjing-Hebei region in recent 30 years. Acta Ecol. Sin. 2018, 38, 4492–4503. [Google Scholar]
  39. Liu, X.; Zhang, P.; Zhang, Y.; Liu, X.; Zhao, C. Distribution and Variation of Wetlands in Daqing City for 4 Periods since 1987. Wetl. Sci. 2018, 16, 357–359. [Google Scholar]
  40. Ding, P.; Liu, B.; Zhang, J.; Yu, B.; Wang, N.; Qi, J.; Wang, Y. Wetland Area, Landscape Index and Its Change in Weinan City in 5 Periods Since 1980. For. Sci. Technol. 2021, 46, 41–45. [Google Scholar]
  41. Cai, X.; Wu, S.; He, H.; Jiang, C.; Sun, X.; Gao, H.; Zheng, G. Change of Extreme Climate Events in Shaanxi Province under Global Warming. J. Desert Res. 2012, 32, 1095–1101. [Google Scholar]
  42. Li, M.; Deng, Y.; Ge, C.; Wang, G.; Chai, X. Characteristics of Meteorological Drought across the Loess Plateau and Their Linkages with Large-scale Climatic Factors during 1961–2017. Ecol. Environ. Sci. 2020, 29, 2231–2239. [Google Scholar]
  43. Lei, X.; Li, Q.; Wang, J.; Li, H.; Li, H.; Li, T. The Drought ang Flood Evolution Law in the Guanzhong Area and the Analyses of the Present Century’s Drought and Flood Characteristics. J. Catastrophology 2016, 31, 101–109. [Google Scholar]
  44. Ning, X.; Dong, J.; Yan, J. Abrupt change of temperature in northern Shaanxi and its influence on drought and flood disasters. J. Arid Land Resour. Environ. 2011, 25, 102–106. [Google Scholar]
  45. Xiong, G. Analysis of dynamic evolution characteristics of rainfall and temperature in Guanzhong area. J. Anhui Agric. Sci. 2015, 43, 192–194+198. [Google Scholar]
  46. Shaanxi Provincial Bureau of Statistics. Shaanxi Statistical Yearbook 2001; China Statistical Publishing House: Beijing, China, 2001. [Google Scholar]
  47. Shaanxi Provincial Bureau of Statistics. Shaanxi Statistical Yearbook 2011; China Statistical Publishing House: Beijing, China, 2011. [Google Scholar]
Figure 1. Location map of study area.
Land 13 01268 g001
Figure 2. Overview of the study area in the SSLP.
Land 13 01268 g002
Figure 3. Area changes of wetland landscape types in the SSLP from 1980 to 2020.
Land 13 01268 g003
Figure 4. Spatial distribution of wetlands in the SSLP from 1980 to 2020.
Land 13 01268 g004
Figure 5. Wetland changes in various urban areas from 1980 to 2020.
Land 13 01268 g005
Figure 6. Wetland changes in the SSLP from 1980 to 2020.
Land 13 01268 g006aLand 13 01268 g006b
Figure 7. The transfer chord diagrams of the wetland land use in the SSLP from 1980 to 2020.
Land 13 01268 g007
Figure 8. Map of wetland landscape types in the SSLP from 1980 to 2020.
Land 13 01268 g008aLand 13 01268 g008b
Figure 9. Wetlands centroid in the SSLP.
Land 13 01268 g009
Table 1. Definition of 6 secondary sub-categories of wetland types.
Wetland TypeDefinition
Paddy fieldIt refers to cultivated land with guaranteed water resources and irrigation facilities, where water can be irrigated normally in general years to plant aquatic crops such as rice and lotus root, including cultivated land with the rotation of rice and dry land crops.
River canalIt refers to naturally formed and artificially excavated rivers and the land below the perennial water level of the trunk. Artificial canals include embankments.
LakeIt refers to land below the perennial water level in the naturally formed water area.
Reservoir potholeIt refers to land below the perennial water level in the artificially constructed water storage area.
Beach landIt refers to land between the water levels of rivers and lakes in the normal water period.
MarshIt refers to land with flat and low-lying terrain, poor drainage, long-term humidity, seasonal water accumulation or perennial water accumulation and the surface growth of hygrophytes.
Table 2. Definitions of landscape indices.
Landscape IndexEcological Signification
CAIt shows how the landscape component size, especially used to reflect the number of landscapes composed of a certain patch type, affects the richness of species to a certain extent.
PDIt is the basic index of landscape pattern analysis, which can not only reflect the number of patches per unit area but also reflect the uniformity of the spatial distribution of landscape patches and can also reflect the degree of landscape fragmentation.
NPThis index is used to reflect the heterogeneity of the landscape and can represent the spatial pattern characteristics of the landscape. The value of the index is proportional to the fragmentation of the landscape. Generally speaking, the larger the number of patches, the more serious the fragmentation, and vice versa.
LPIIt is one of the key indexes reflecting landscape heterogeneity. To a certain extent, it can help to determine the dominant landscape types in the landscape. A change in its value has a positive correlation with the intensity and frequency of human disturbance, and its change can also reflect the direction and intensity of human activities.
LSIThis index measures the shape complexity by calculating the degree of deviation between the shape of a patch in the area and a circle or square of the same area.
SHDIThis is a measurement index based on information theory that can reflect the heterogeneity of the landscape and is especially sensitive to the non-uniform distribution of each block type in the landscape.
SHEIThis index is equal to the SHDI divided by the maximum possible diversity under a given landscape abundance (equal distribution of each patch type).
PLANDThis index is the proportion of the total area of a certain patch type to the total landscape patch area, reflecting the composition of the landscape. To a certain extent, it can reflect the dominant landscape type in the landscape.
CLUMPYIt reflects the aggregation and dispersion of patches in the landscape.
CONTAGThis index describes the degree of agglomeration or the extension trends of different patch types in the landscape. It is one of the most important indexes to describe the landscape pattern.
AREA-MNIt reflects the degree of fragmentation of the landscape.
Table 3. Areas of the wetlands in the SSLP from 1980 to 2020.
PeriodNatural Wetland Area (km2)Artificial Wetland Area (km2)Total Wetland Area (km2)
19801175.90776.211952.10
19901121.76784.801906.56
20001092.33787.771880.10
20101033.17711.071744.24
20201095.40777.351872.75
Table 4. Areas of various types of wetlands in the SSLP from 1980 to 2020.
PeriodNatural Wetland Area (km2)Artificial Wetland Area (km2)
River
Canals
Beach LandLakesMarshesTotalPaddy FieldsReservoir PotholesTotal
1980662.20455.6128.3929.701175.90503.74272.47776.21
1990585.12475.8028.7232.121121.76509.40275.40784.80
2000565.76472.2930.7723.501092.33525.59262.19787.77
2010498.28488.1622.14524.581033.17423.03288.04711.07
2020552.70491.3023.8627.541095.40414.92362.42777.35
Table 5. Wetland area variations and change rates in the SSLP.
Wetland Type1980–19901990–20002000–20102010–20201980–2020
VariationRateVariationRateVariationRateVariationRateVariationRate
Paddy fields5.660.11%16.190.32%−102.56−1.95%−8.10−0.19%−88.81−0.44%
River
canals
−77.08−1.16%−19.36−0.33%−67.49−1.19%54.421.09%−109.51−0.41%
Lakes0.330.12%2.060.72%−8.62−2.80%1.700.77%−4.53−0.40%
Reservoir potholes2.930.11%−13.22−0.48%25.850.99%74.382.58%89.950.83%
Beach land20.200.44%−3.52−0.07%15.870.34%3.140.06%35.700.20%
Marshes2.420.81%−8.62−2.68%1.080.46%2.961.21%−2.16−0.18%
Total
wetlands
−45.54−0.23%−26.46−0.14%−135.86−0.72%128.500.74%−79.35−0.10%
Table 6. Landscape pattern indices of the SSLP in five periods.
Index19801990200020102020
NP (ind)20982114209820632851
PD (ind/km2)1.071.111.121.181.52
LSI106.19107.56107.94110.76117.89
CONTAG (%)57.3156.6956.9156.4555.92
SHDI1.45591.4731.46151.47081.4806
SHEI0.81260.82210.81570.82090.8263
Disclaimer/Publisher’s Note: The statements, opinions and data contained in all publications are solely those of the individual author(s) and contributor(s) and not of MDPI and/or the editor(s). MDPI and/or the editor(s) disclaim responsibility for any injury to people or property resulting from any ideas, methods, instructions or products referred to in the content.

