Article

Integrating Entropy Weight and MaxEnt Models for Ecotourism Suitability Assessment in Northeast China Tiger and Leopard National Park

Key Laboratory for Geographical Process Analysis & Simulation of Hubei Province, College of Urban and Environmental Science, Central China Normal University, Wuhan 430079, China
*
Author to whom correspondence should be addressed.
Land 2024, 13(8), 1269; https://doi.org/10.3390/land13081269
Submission received: 20 May 2024 / Revised: 26 July 2024 / Accepted: 9 August 2024 / Published: 12 August 2024
(This article belongs to the Special Issue Landscape-Scale Sustainable Tourism Development)

Abstract

:
The development of ecotourism in protected areas faces the challenge of balancing conservation and ecotourism. Ecotourism suitability assessments are essential tools for managing tourism in these areas. However, current assessments often overlook biological factors, leading to adverse effects on wildlife. This study uses the Northeast China Tiger and Leopard National Park as a case study to establish a comprehensive assessment system that integrates ecotourism suitability with tiger and leopard habitat suitability, thereby linking ecotourism with wildlife conservation. The primary research methods include ecotourism suitability analysis based on the entropy weight method and habitat suitability analysis using the MaxEnt model. Based on the zoning results of ecotourism and habitat suitability, a comprehensive ecotourism suitability zoning map was produced. This map indicates that areas of very high suitability account for 45.62% of the total area, covering approximately 6152.563 km2, and are primarily located on the edges of village clusters. These areas can be prioritized for developing tourism infrastructure. The comprehensive ecotourism assessment system can balance the development of ecotourism with wildlife conservation, contributing significantly to the coordinated development of economic, social, and environmental objectives.

1. Introduction

Globally, the establishment of nature reserves is a crucial strategy for biodiversity conservation and natural resource management [1]. However, with the rise of ecotourism, the conflict between tourism activities within reserves and environmental protection has become increasingly prominent [2]. Excessive tourist influx and improper tourism management often lead to resource overconsumption [3]. Additionally, ecological damage and pollution threaten the original biodiversity of the reserves [4]. The situation in China is particularly severe [5]. Due to its large population, the massive influx of tourists into nature reserves poses greater challenges to tourism management.
Ecotourism primarily refers to a form of tourism that focuses on ecological environments as the main attraction and is conducted under the principles of sustainable development [6]. It emphasizes ecological protection and aims to provide a pleasurable experience in an eco-friendly manner [7]. Ecotourism has long been seen as a potential win–win strategy that can protect the environment while meeting human needs [8]. However, there is ongoing debate among scholars about the conditions under which ecotourism can effectively serve as a conservation tool [9]. Ecologists and conservation biologists have criticized ecotourism, claiming it has negative impacts on wildlife populations [10]. Therefore, it is essential to develop effective ecotourism management strategies in protected areas to continually reduce the negative impacts of ecotourism on biodiversity conservation [11].
In current ecotourism management practices in protected areas, zoning is a commonly used tool, where managers divide the protected area into regions with varying levels of human activity and related development [12]. To scientifically manage ecotourism zoning in protected areas, ecotourism suitability assessments have been widely applied [13,14,15]. An ecotourism suitability assessment involves evaluating a specific area using scientific methods and criteria to determine its appropriateness for ecotourism activities. Many studies use a combination of GIS and multi-criteria decision analysis (MCDA) methods for these assessments [16,17]. Essentially, MCDA is a procedure that helps with spatial decision making by breaking down multiple options into a set of measurable criteria. It includes four stages: selecting evaluation criteria, standardizing criteria, determining criteria weights, and establishing decision rules [18]. The most common MCDA method is the Analytic Hierarchy Process (AHP), with most authors preferring to combine GIS and AHP for ecotourism zoning [19,20,21]. However, this method has some limitations; subjective evaluations by each decision maker can significantly influence the weights determined by AHP, leading to potentially biased results [16]. The entropy weight method (EWM), which objectively derives criteria weights, has attracted some scholars’ attention. Zhang used information entropy to determine weights and established a tourism destination competitiveness evaluation model, assessing the competitiveness of tourism destinations in the Yangtze River Delta, China [22]. Feng analyzed the characteristics of the tourism destination ecosystem in Dunhuang City from an entropy perspective, creating a sustainability evaluation model for tourism destination ecosystems based on information entropy [23]. Liang developed a comprehensive measurement model for the sustainable capacity of scenic spots using the entropy method to determine model weights and combined it with the TOPSIS method for a comprehensive analysis of the sustainable capacity of scenic spots across China’s provinces [24]. Related research shows that the entropy weight method is widely used in evaluation models within the tourism field. This study used the entropy weight method to assess ecotourism suitability for two main reasons: First, this method derives weights based on actual data differences from each sample, avoiding human influence, and thus providing more objective criteria weights. Second, the weighting process of the entropy weight method is transparent and repeatable [25].
Current evaluations of ecotourism zoning often focus on ecotourism potential and environmental carrying capacity. Assessing ecotourism potential involves identifying the advantages of ecotourism resources in a particular area to evaluate its market attractiveness and sustainable development capacity. For example, Omarzadeh used GIS-MCDA techniques with 28 spatial indicators to evaluate the potential for sustainable ecotourism development in different regions of West Azerbaijan Province, Iran, thus identifying areas with the potential to attract tourists [26]. On the other hand, environmental carrying capacity assessments identify the maximum number of visitors an area can support without causing irreversible ecological damage [27]. For instance, Salemi utilized ecological carrying capacity (ECC) as an essential tool for planning natural areas and sustainable ecotourism development. By employing the ANP (Analytic Network Process) model and the PSR (Pressure–State–Response) conceptual model, Salemi determined the potential and ecological carrying capacity of the study area and ultimately produced an ecological carrying capacity map for ecotourism development [28]. Evaluations of ecotourism potential are tourism development-oriented and often overlook ecological conservation. Although environmental carrying capacity assessments consider the negative impacts of tourism, they primarily focus on maximizing the human use of resources while neglecting the survival needs of wildlife. Overall, existing evaluations of ecotourism zoning overlook the core of biodiversity conservation—the impact on wildlife. Wildlife factors, including the habitat needs of wildlife, migration patterns, and reproductive behaviors [29], are essential elements that must be considered when assessing the suitability of ecotourism in nature reserves. Traditional evaluation methods often fail to fully account for these biological characteristics when developing tourism plans and activities, potentially negatively impacting the survival of certain species. For example, some tourism activities might disturb the normal breeding behavior or migration routes of animals, and they could even lead to the direct destruction of habitats for some sensitive species [10,30,31].
Introducing habitat suitability models into the evaluation and planning of ecotourism in nature reserves provides a new approach for ensuring biodiversity conservation. These models are typically based on extensive ecological and biological data, such as species distribution records, habitat types, climate conditions, and other environmental variables [32,33,34]. Using these data, the models can assess the suitability of different areas for specific species and generate detailed habitat suitability maps [35]. For example, by utilizing species distribution models like MaxEnt (Maximum Entropy Model), researchers can predict the potential distribution areas of wildlife [36,37,38]. This helps identify which tourism activities might overlap with these sensitive areas. Such models can assist managers in avoiding the placement of major tourism facilities within the core habitats of species. They can also guide adjustments to tourism routes, limits on the number of visitors, or closures of certain areas during specific seasons to reduce disturbances to animals.
The Northeast China Tiger and Leopard National Park (NCTLNP), established in 2021 as one of China’s first national parks, carries significant responsibility for biodiversity conservation in China [39]. The primary goal of this park is to protect the critically endangered Amur tiger and leopard, both of which are large feline predators with high demands for habitat integrity and stability [40,41,42]. Incorporating biological factors into the evaluation of ecotourism can help planners design tourism strategies that meet visitor needs while minimizing the impact on these sensitive species. This approach prevents ecological protection from being ignored due to an excessive focus on tourism development, ensuring the harmonious coexistence of tourism activities and environmental conservation.
This study proposes a spatial evaluation framework for ecotourism and habitat suitability for Amur tigers and leopards, aiming to achieve the coordinated development of ecotourism and wildlife habitat protection within the NCTLNP. By integrating and analyzing Geographic Information System (GIS) data, biological habitat data, and tourism resource data, this framework forms a comprehensive assessment method to ensure that tourism activities do not threaten the living environment of Amur tigers and leopards. Ultimately, the evaluation framework provides a detailed spatial planning map. This map clearly distinguishes areas suitable for tourism development. It also identifies areas that require strict habitat protection through a comprehensive map. This planning not only secures the living space for Amur tigers and leopards, but also optimizes the use of tourism resources, promoting the sustainable development of ecotourism.

2. Materials and Methods
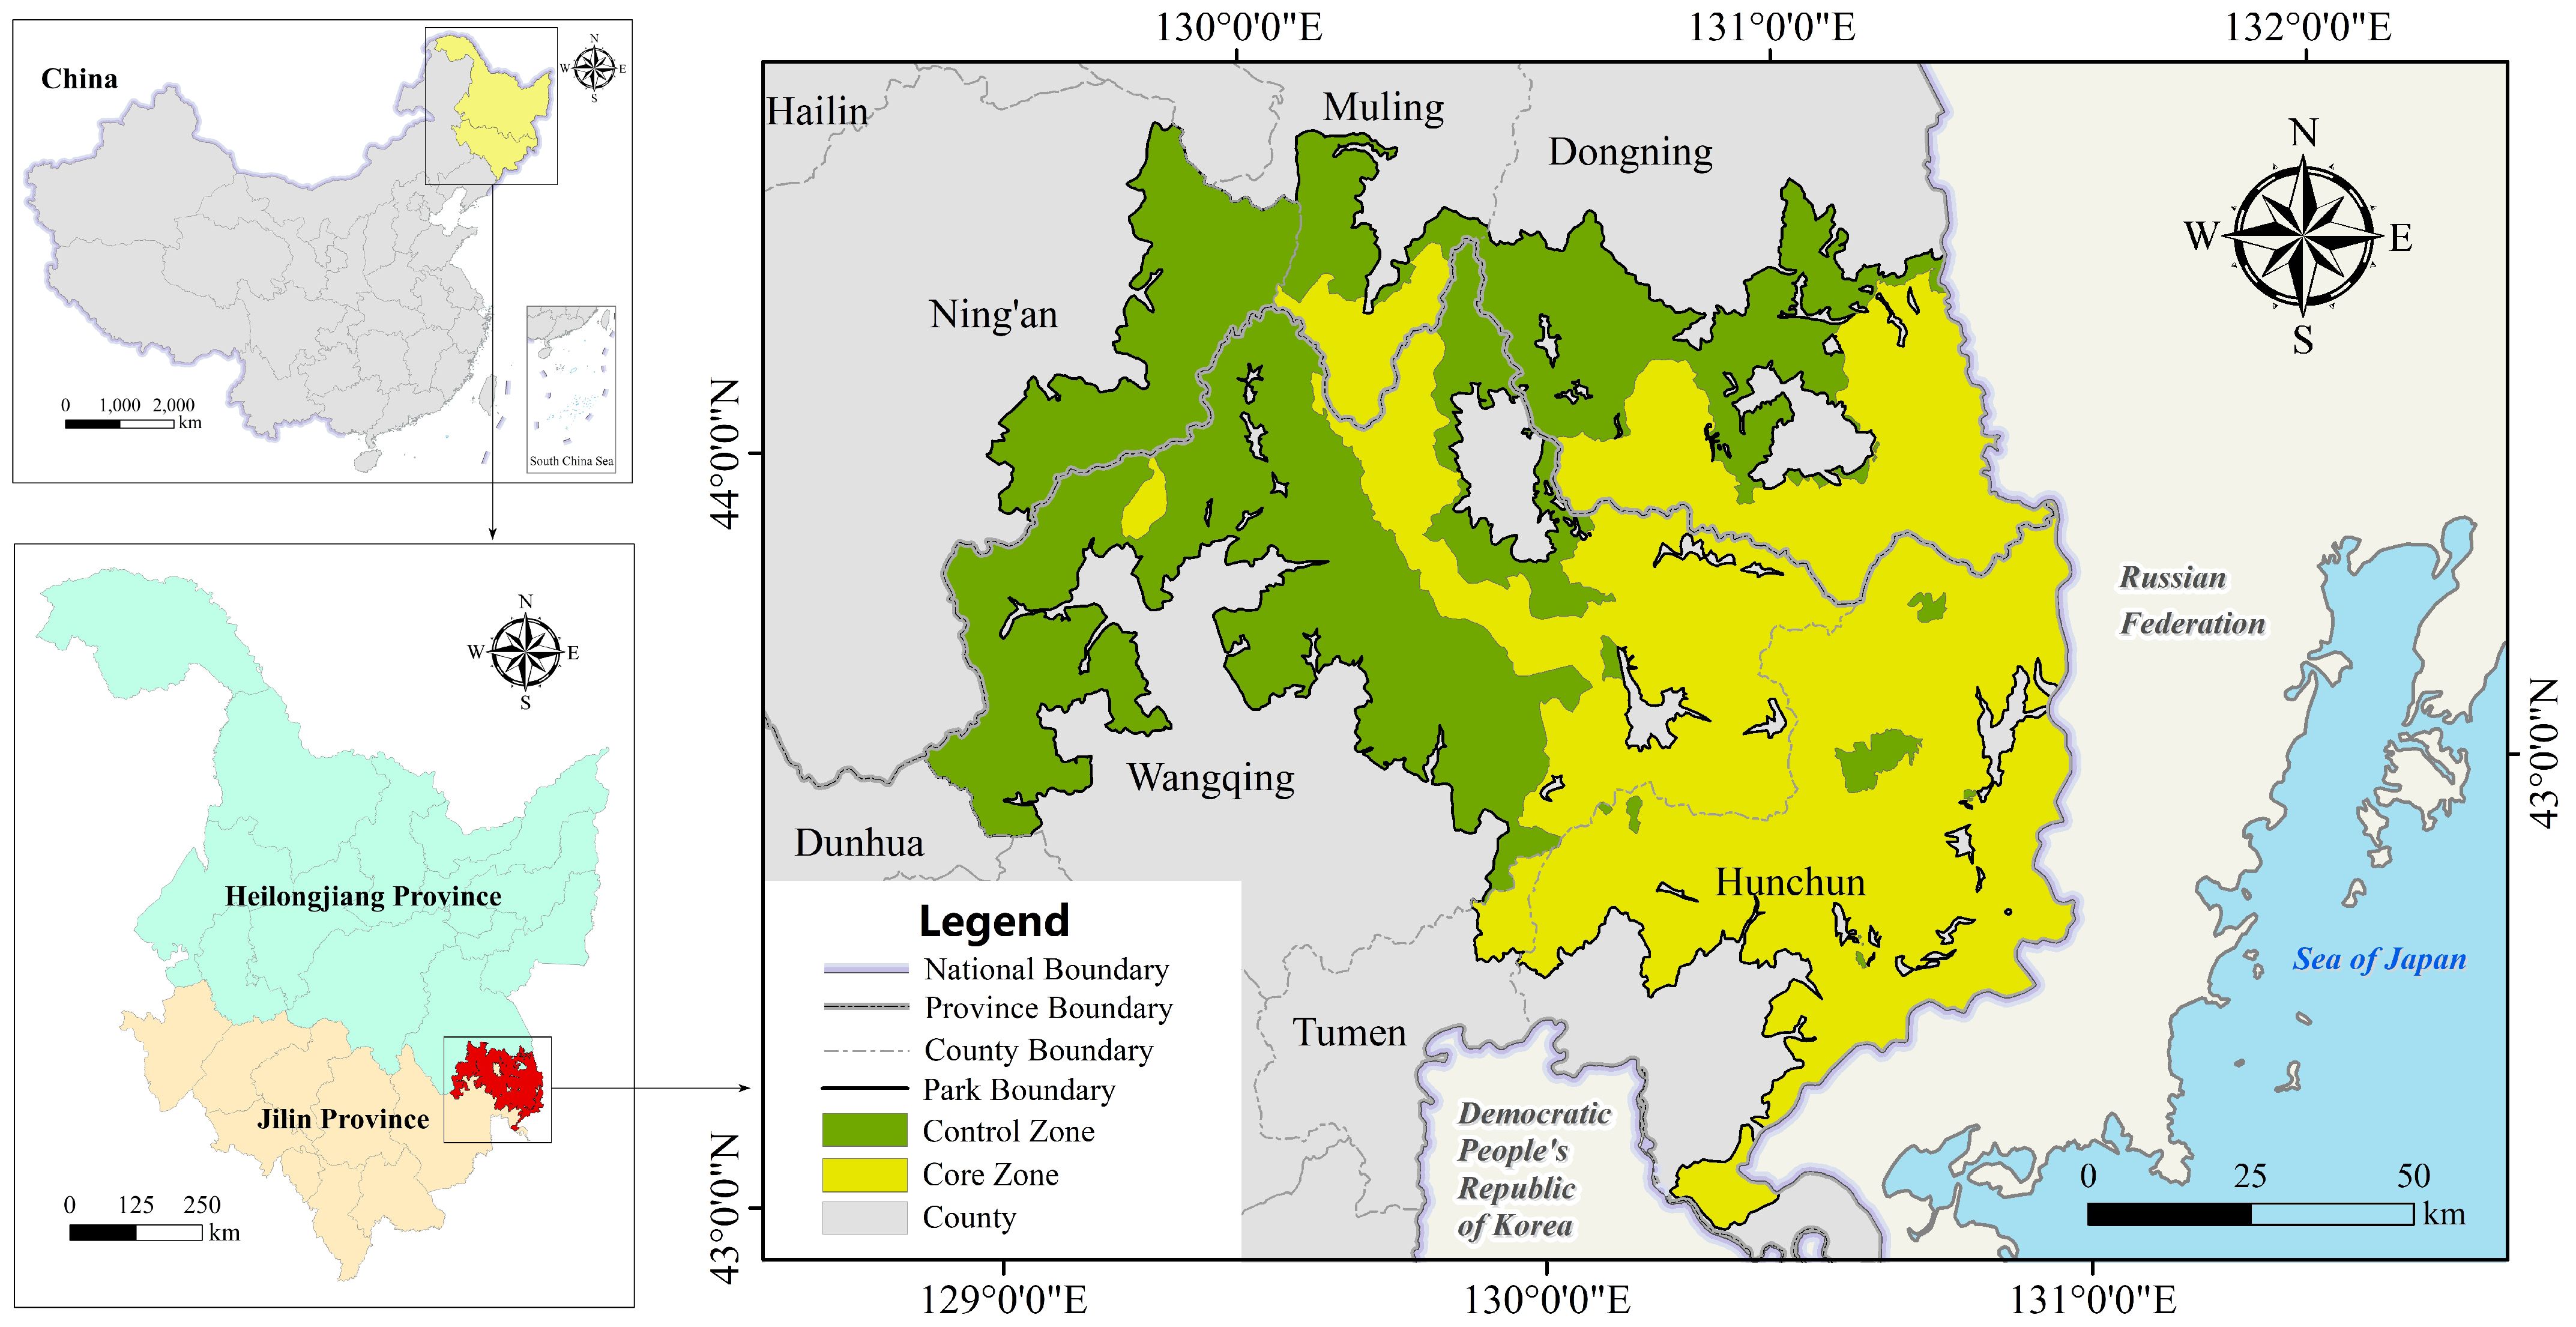
2.1. Study Area

The NCTLNP spans across the Jilin and Heilongjiang provinces (129°05′01″–131°18′52″, 42°38′45″–44°18′36″), covering six counties (with a total area of 14,065 km2): Hunchun, Wangqing, Tumen, Dongning, Muling, and Ning’an (Figure 1). Located in the southern part of the Laoye Mountain Range, a branch of the Changbai Mountains, the park is mainly composed of low-to-mid-elevation mountains, valleys, and hills. It includes a well-developed river system with eight major rivers, including the Hunchun, Suifen, and Muling Rivers. The park experiences a temperate continental monsoon climate, marked by windy, dry springs with minimal rainfall; short, hot summers; cool, rapidly cooling autumns; and lengthy, cold winters. The forest coverage rate in the park is up to 96.6%, with a total forested area of 13,583 km2, comprising 76.1% broadleaf forests, 16.6% coniferous forests, and 7.3% mixed broadleaf–conifer forests. The NCTLNP is home to a rich diversity of wildlife, including 397 species of wild vertebrates and 14 nationally protected species such as Amur tigers and leopards.
Benefiting from its diverse landscapes and abundant wildlife, the NCTLNP holds significant potential for ecotourism development. However, it is still necessary to ensure the survival needs of Amur tigers and leopards while developing ecotourism. According to the ‘Master Plan for the Northeast Tiger and Leopard National Park (2022–2030)’ published on the official website of the NCTLNP Administration [43], the park is divided into the Core Zone and Control Zone (see Figure 1). The Core Zone, which accounts for 53.9% of the total park area, provides essential protection to enable the Amur Tiger and Leopard populations to thrive. In contrast, the Control Zone, which comprises 46.1% of the park, is an area where educational and recreational activities can be conducted. Although this plan establishes basic spatial zoning, it may be too simplistic and lack detailed guidance for practical tourism development. Traditional scenic area planning often overly prioritizes tourism development at the expense of ecological protection. This study integrates the entropy weight method (EWM) and the Maximum Entropy (MaxEnt) model to perform a comprehensive assessment of ecotourism suitability in the park. The aim is to balance the needs of protection and tourism development, ensuring the long-term health and stability of the park’s ecosystems.

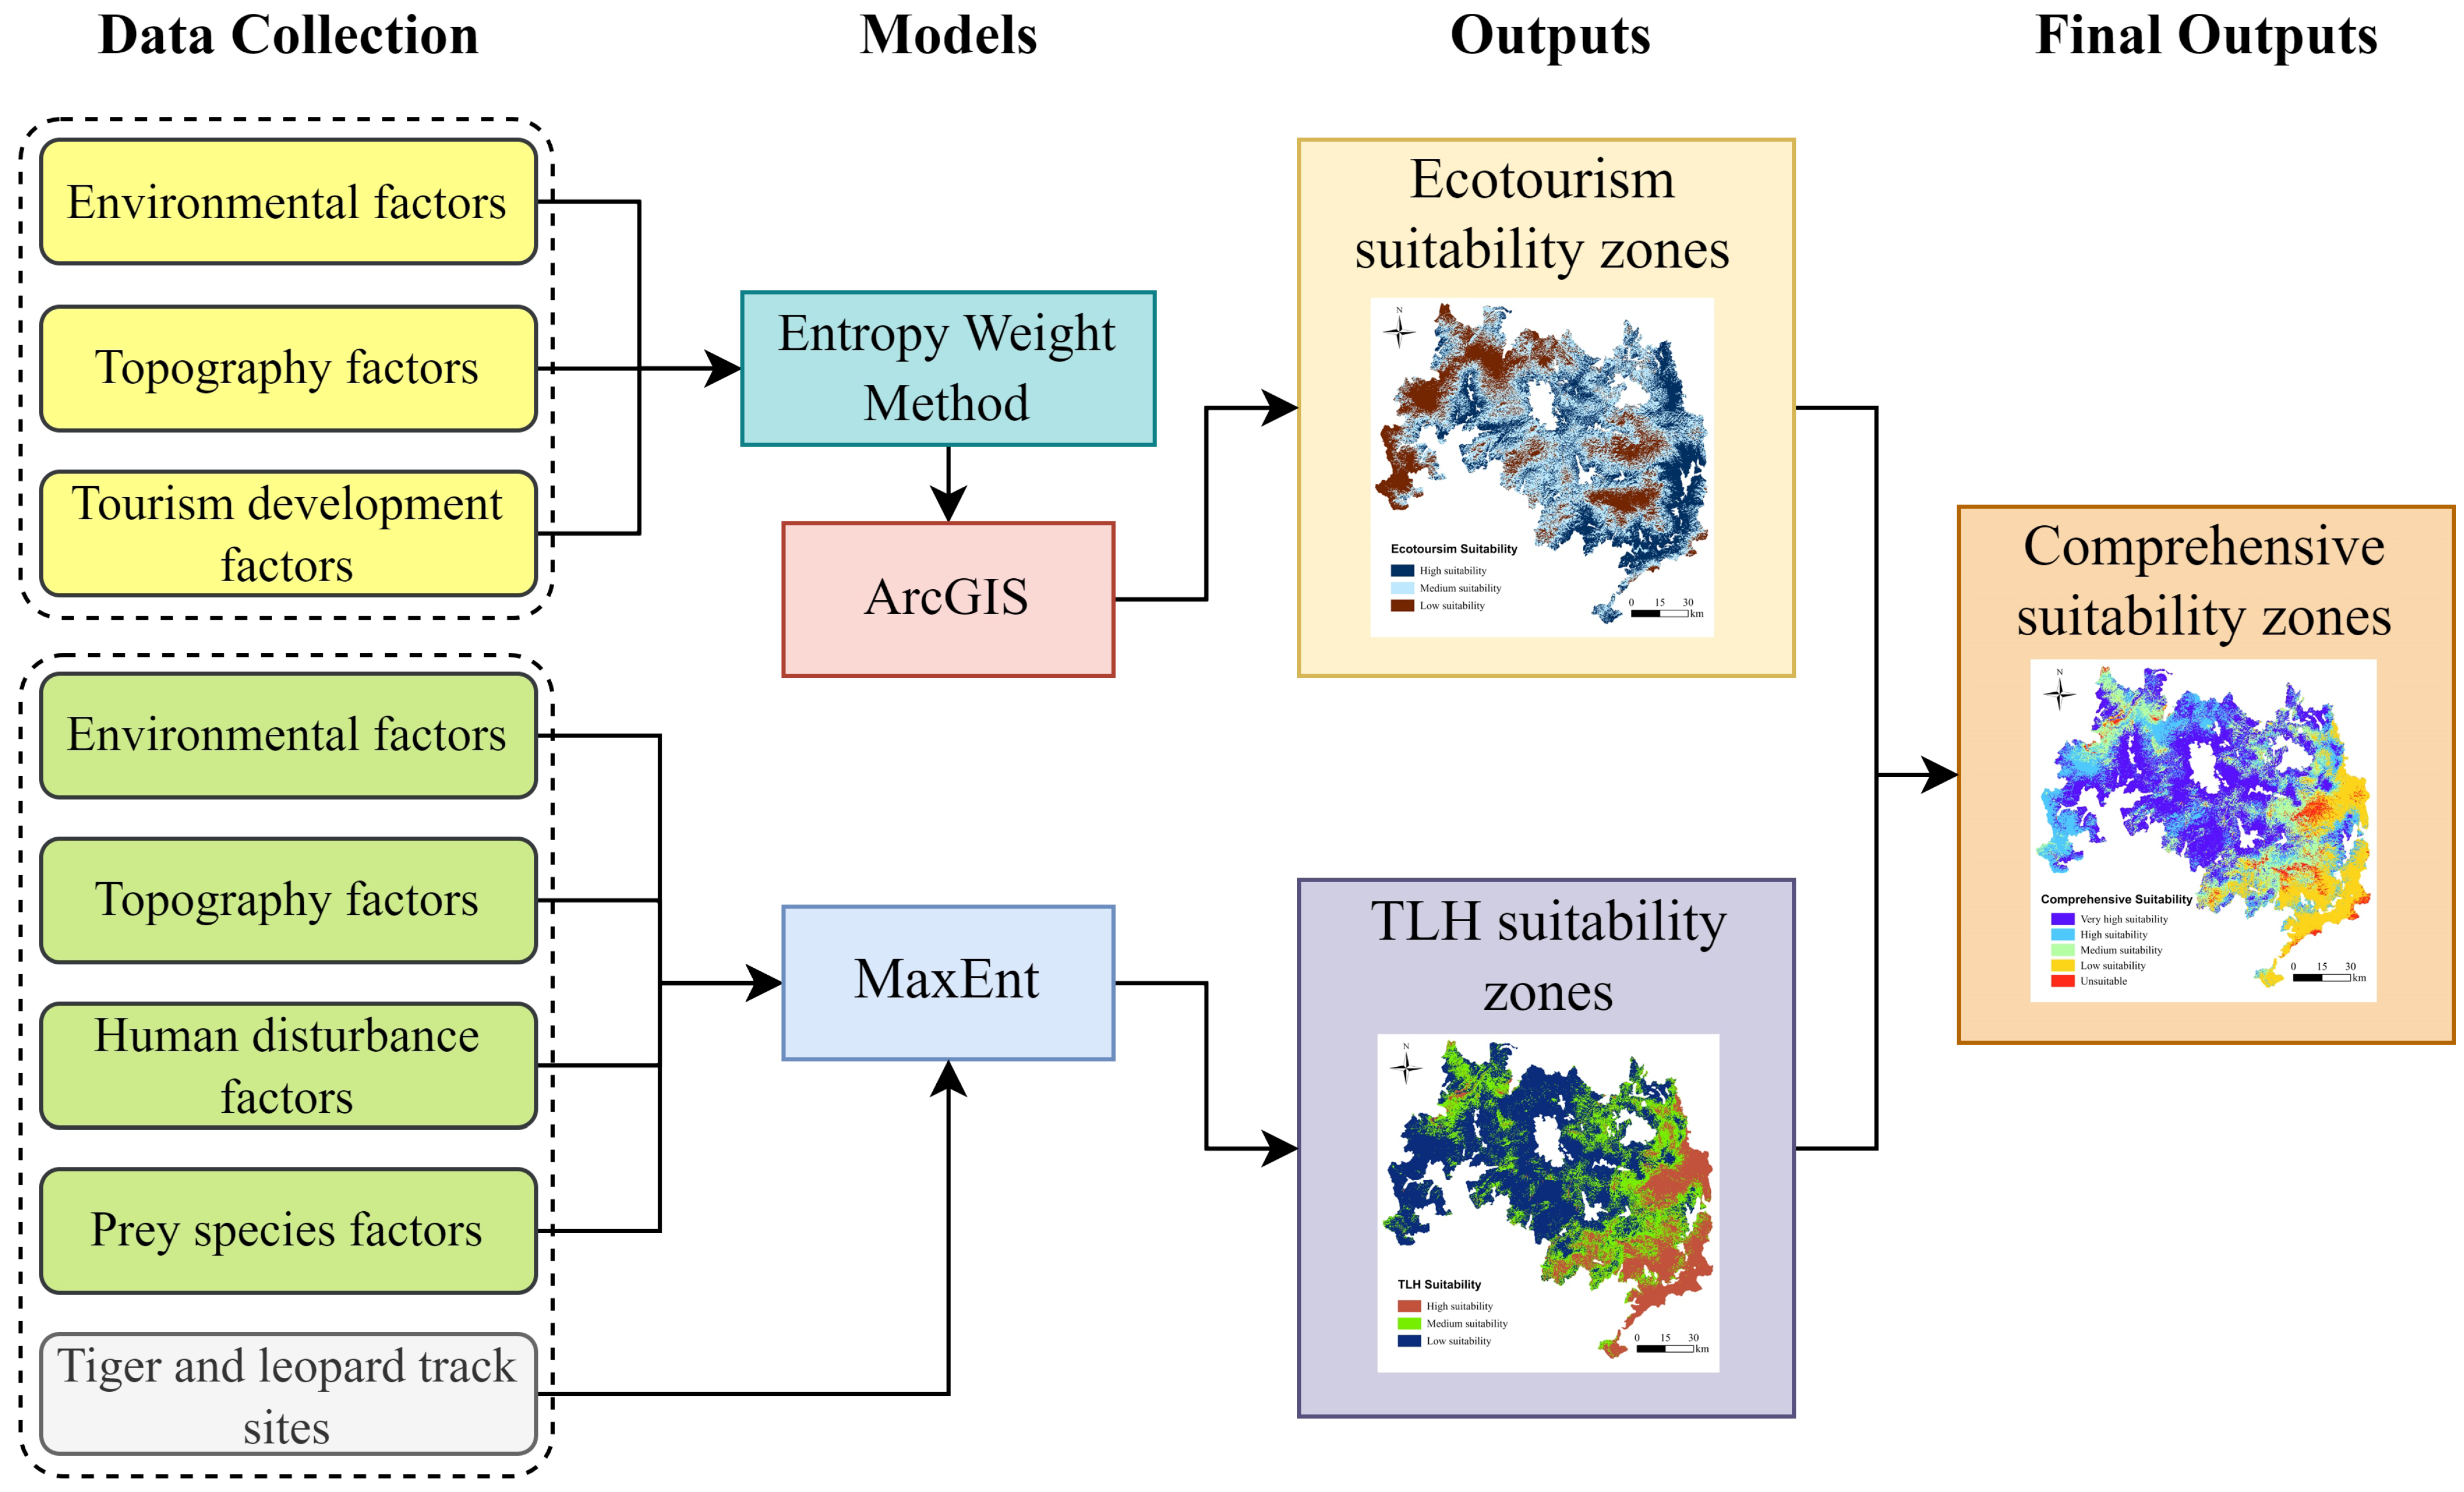
2.2. Methodological Overview

This study aims to assess the ecotourism suitability of the NCTLNP using a combination of the EWM and MaxEnt model. As illustrated in Figure 2, the research methodology is divided into four main steps: data collection, model establishment, result output, and the final assessment.
Firstly, in the data collection phase, this study identified the key factors influencing ecotourism suitability assessment, including environmental, topography, and tourism development factors. Additionally, to evaluate tiger and leopard habitat (TLH) suitability, factors such as the environment, topography, human disturbance, prey species factors, and tiger and leopard track sites were selected as the assessment criteria. In the model construction phase, the EWM was initially applied to the collected multivariate data to allocate weights, determining the relative importance of each factor in the assessment model. Following the acquisition of these weights, spatial data analysis was conducted using ArcGIS software. Based on the weight results, the data layering analysis preliminarily identified areas suitable for ecotourism. Furthermore, we precisely predicted potential activity areas for tigers and leopards utilizing the MaxEnt model. Finally, this study integrated the ecotourism suitability zones with the TLH suitability zones, producing a comprehensive map of ecotourism suitability.

2.3. Data Preparation

2.3.1. Screening of Criteria

In this study, through a literature review, we identified the key factors influencing ecotourism suitability (Table 1) and TLH suitability (Table 2). Although there is an overlap among several evaluation criteria in the two assessment systems, each system also includes unique factors specific to its management and conservation objectives.
We identified 12 criteria for ecotourism suitability assessment (Table 1). These criteria were selected based on their relationship with the ecotourism potential of protected areas. Environmental factors are considered crucial for the development of ecotourism in protected areas as the feasibility of ecotourism fundamentally depends on its environmental potential [44]. To evaluate the environmental potential for ecotourism in protected areas, this study selected criteria such as the NDVI [45,46], land use classes [47,48], soil erosion [49,50], temperature [51,52], precipitation [52,53], and distance to rivers [52,54]. Topography factors, including elevation, slope, and aspect, may also influence the potential for ecotourism [55,56]. Tourism development factors refer to the current state of tourist service facilities, which provide convenience for visitors. This study selected three criteria to assess the tourism development foundation of protected areas: distance to roads, distance to villages, and distance to tourist attractions [52,55].
A total of 13 criteria were selected for TLH suitability assessment (Table 2). These criteria are closely related to the survival needs of Amur tigers and leopards. High-quality wildlife habitats can provide food, water, vegetation cover, and space for wildlife [57]. To ensure the natural environment for tiger and leopard habitats, the selected environmental factors include criteria such as the NDVI [58,59], land use classes [59,60], soil erosion [61,62], temperature, precipitation [59,63], and distance to rivers [64]. These are important indicators for assessing the environmental quality of tiger and leopard habitats. Topography factors such as elevation, slope, and aspect affect vegetation growths [65], which, in turn, impacts the hunting behavior of tigers because they prefer densely vegetated areas that provide cover for hunting and resting [66]. Additionally, human disturbance factors mainly refer to the distance to roads and villages as these factors are directly related to the safety and disturbance of tiger and leopard habitats [67]. Most importantly, for large carnivores like tigers and leopards, high-quality habitats mean an abundant prey supply [68]. Among the prey factors, wild boar and roe deer are important food sources for tigers and leopards [40,69]. Their distribution density directly affects the food availability and energy intake of tigers and leopards, thereby determining their survival status and reproductive success.

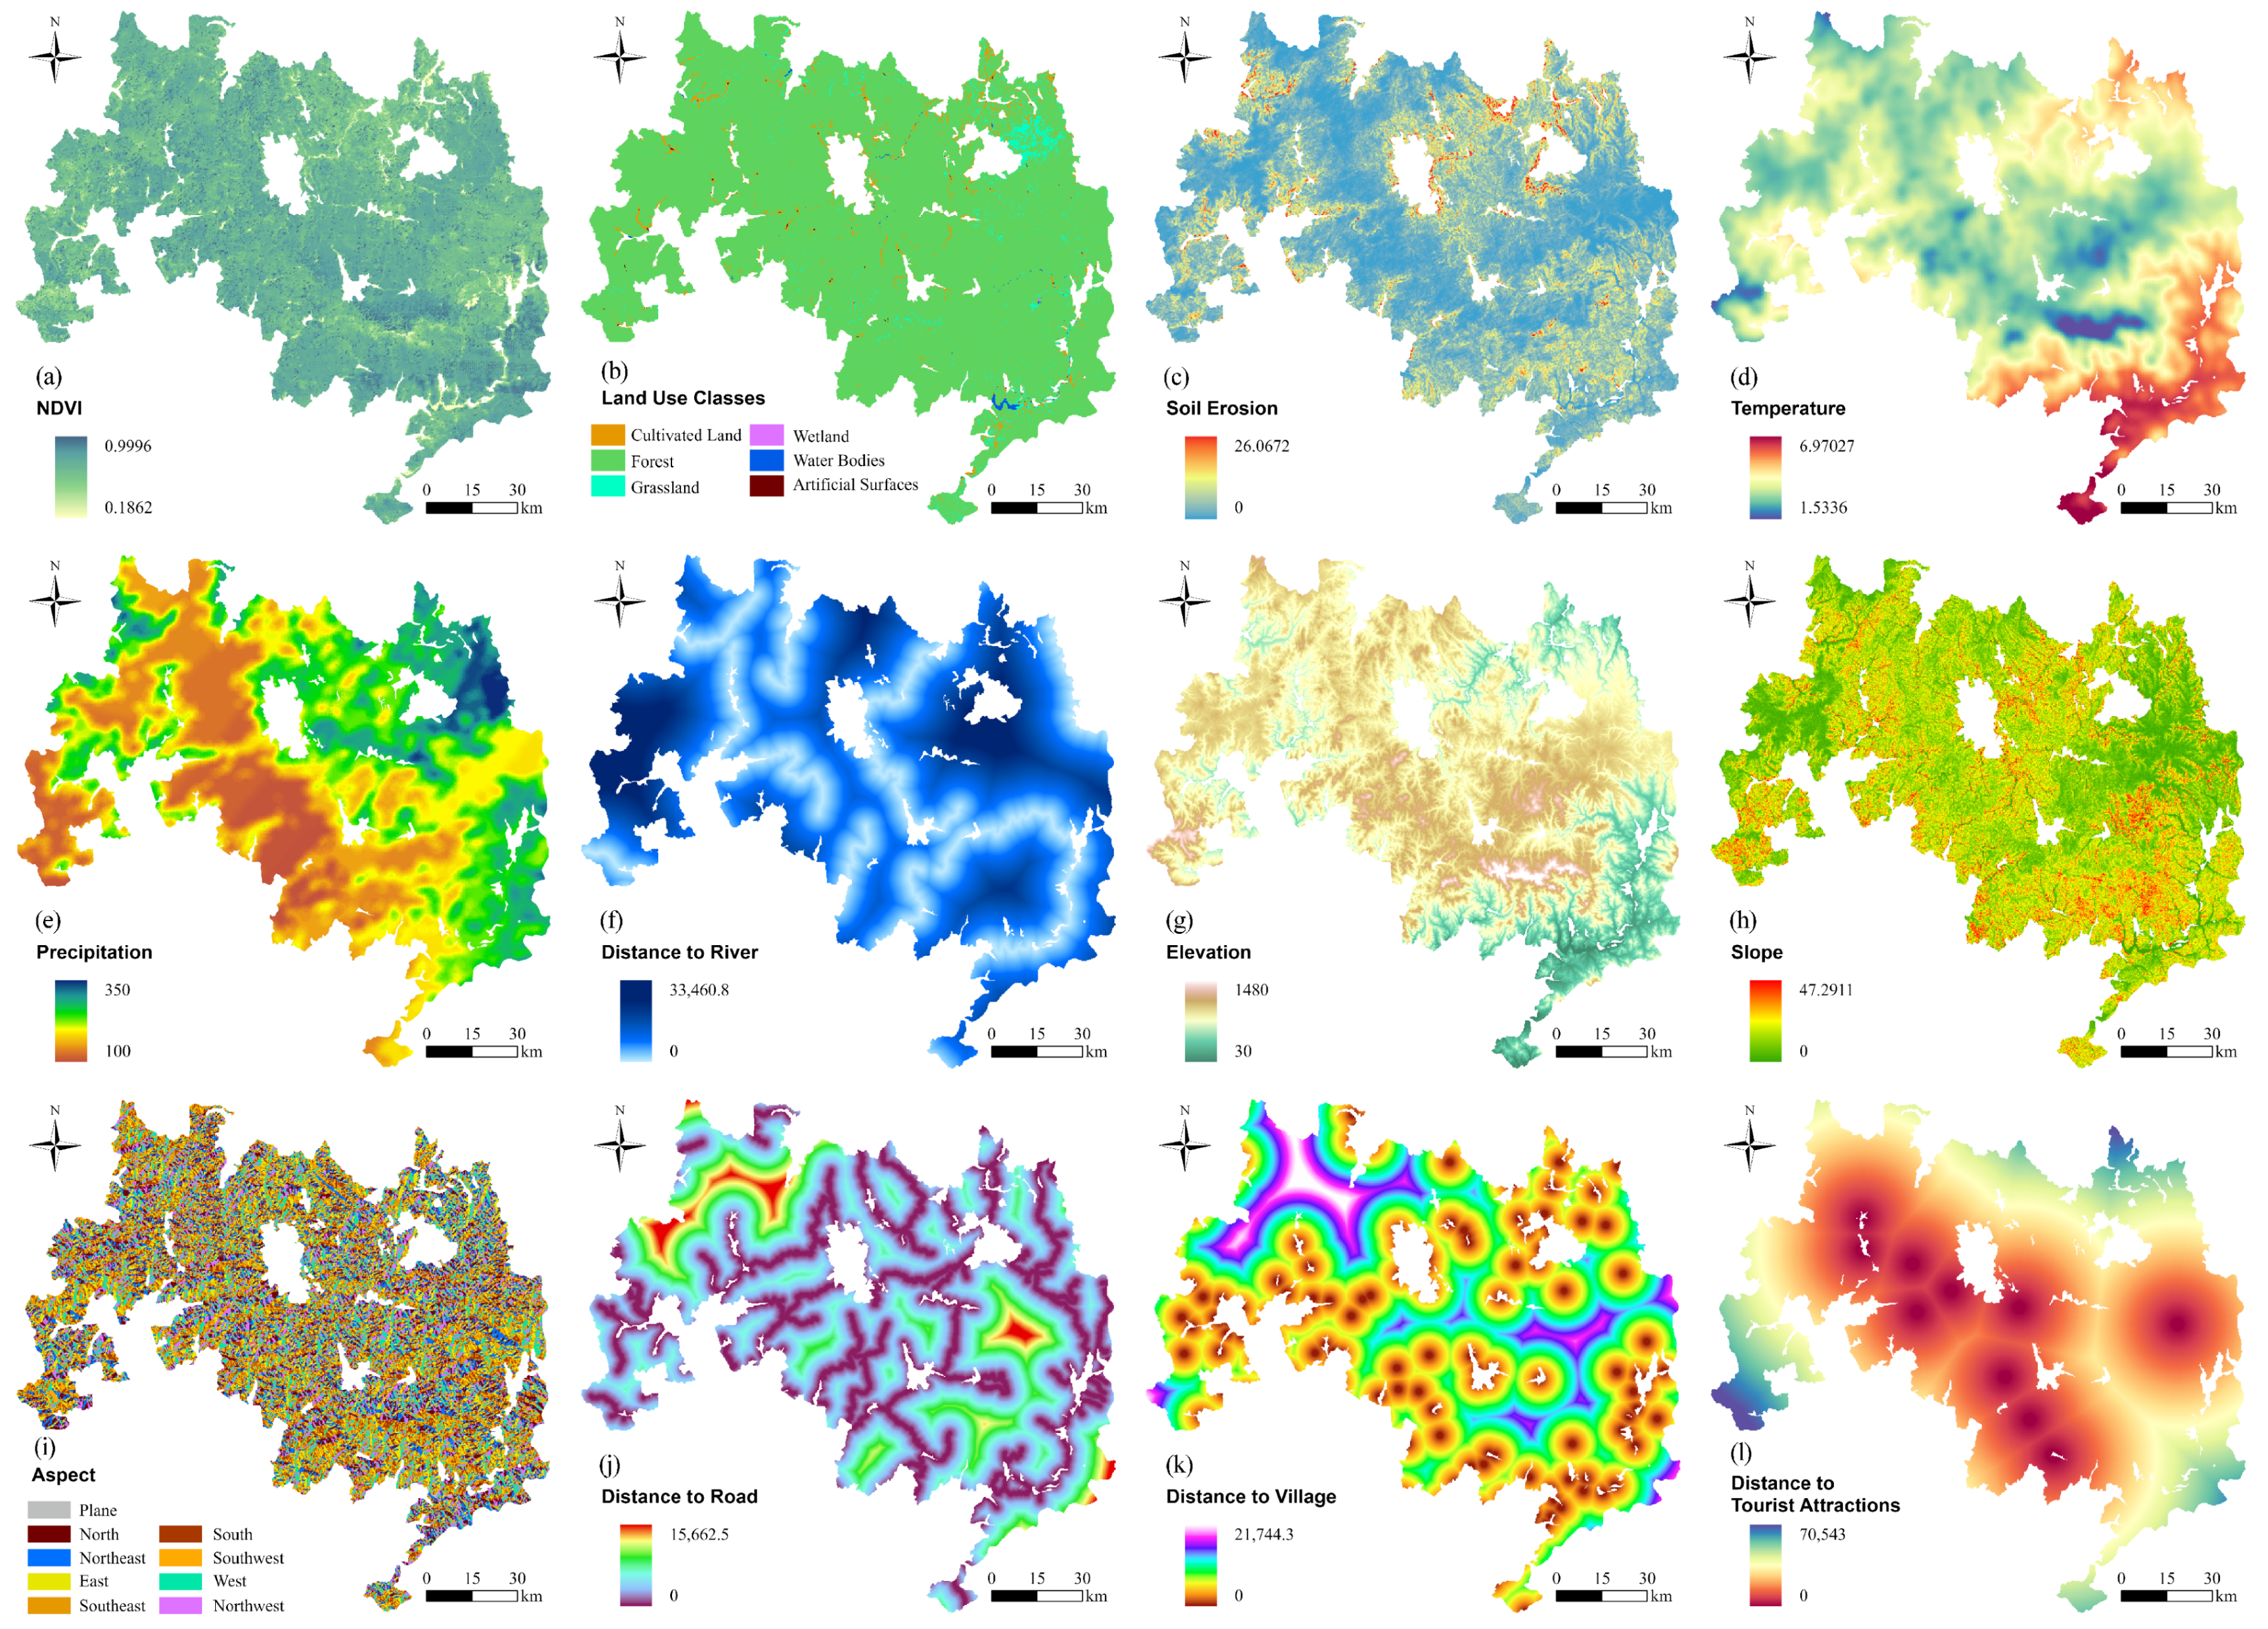
2.3.2. Dataset and Preprocessing

The accuracy and reliability of data sources and preprocessing steps are vital for ensuring the quality of our analysis. According to the research framework, we need to collect the data of 15 criteria (data sources are detailed in Table 3). After data preprocessing, a spatial dataset comprising 15 criteria was ultimately obtained. The selected habitat criteria distributions of the Amur tigers and leopards are shown in Figure 3.
The data preprocessing involved acquiring remote sensing and geographic data from various databases and platforms. The analytical methods used included extracting slope and aspect with ArcGIS Slope Analysis, calculating distances with ArcGIS Distance Analysis Tool and Euclidean distance analysis, and obtaining village spatial distribution data through geocoding. In particular, the density of prey species such as wild boar and roe deer data were acquired through line transect sampling surveys conducted by the NCTLNP Administration (Figure 4a). The empirical Bayesian kriging interpolation method in ArcGIS was utilized to generate population density distribution maps for wild boar and roe deer (Figure 4b,c). The WGS 1984 Albers projection coordinate system was selected to ensure the accuracy of our research results. All of the data were standardized to a unified resolution of 250 m.

2.4. Entropy Weight Method

The entropy weight method (EWM) is an analytical technique based on the principle of information entropy. The method is utilized for multi-criteria decision analysis, and it has been widely applied in fields such as engineering [70], environmental science [71], economics [72], and management [73]. Information entropy, originally proposed by Shannon in 1948 [74], measures the uncertainty of information. In EWM, information entropy serves as a metric for the disorder of a system, and it is used to assess the effective information content of various evaluation indicators. This evaluation involves calculating the entropy values of each indicator to measure the dispersion of indicator data or the uncertainty of information. According to the basic principles of information theory, information is a measure of the orderliness of a system, while entropy is a measure of the disorder of a system. Therefore, based on the definition of information entropy, the entropy value of an indicator can be used to determine the amount of information it contains. A higher entropy value indicates that the indicator is more disordered. As a result, it contains less information. When the variability of the indicator data is greater, the data distribution is uneven, resulting in a smaller calculated entropy value (see Equations (5) and (6) below for the calculation process). This indicates that the indicator data provide more information and should be given a higher weight. Conversely, if the variability of the data is smaller, the data distribution is uniform, resulting in a larger entropy value. This indicates that the indicator data provide less information and should be assigned a lower weight [75]. Therefore, the entropy value of each indicator can be calculated to assess their importance in the overall evaluation. The greater the variability of the indicator data, the greater its contribution to the overall evaluation. Compared to subjective weighting models like AHP, EWM minimizes the impact of human factors on the weighting of indicators, thereby enhancing the scientific and objective nature of assessment results [76]. In this study, the EWM was employed to determine the weights of indicators within the ecotourism suitability assessment system, which were subsequently utilized in ArcGIS overlay analyses for data integration. The computation steps of the EWM are listed as follows [77,78,79,80]:
Step 1:
Assuming there are m evaluation objects and n evaluation criteria, the initial decision Matrix X is constructed as follows:
X = x 11 x 12 x 1 n x 21 x 22 x 2 n x m 1 x m 2 x m n , i = 1 , 2 , , m , j = 1 , 2 , , n ,
where m is the number of raster cells in the data layer, n is the number of criteria for ecotourism suitability assessment, and x i j denotes the value of the i-th raster cell on Criterion j.
Step 2:
Due to the different dimensions of criteria data, it is necessary to normalize the initial decision matrix. Since the criteria selected in this study have both positive and negative types (refer to Table 1), they require differentiated processing during normalization. The normalized decision matrix can be represented as follows:
Y = y 11 y 12 y 1 n y 21 y 22 y 2 n y m 1 y m 2 y m n , i = 1 , 2 , , m , j = 1 , 2 , , n ,
where y i j represents the standardized value of the i-th raster cell on Criterion j, and y i j [ 0 , 1 ] .
The normalization process for positive criteria is as follows:
y i j = x i j ( x i j ) min i ( x i j ) max i ( x i j ) min i .
The normalization process for negative criteria is as follows:
y i j = ( x i j ) max i x i j ( x i j ) max i ( x i j ) min i ,
where ( x i j ) min i is the minimum value of the i-th raster cell on Criterion j, and ( x i j ) max i is the maximum value of the i-th raster cell on Criterion j.
Step 3:
Determine the Information Entropy e j of the evaluation criteria. The formula for weight entropy is as follows:
e j = 1 ln m i = 1 m p i j ln p i j ,
p i j = y i j i = 1 m y i j ,
where e j represents the entropy of Criterion j, and p i j represents the proportion of the Value y i j of the i-th raster cell to the total sum of all raster cell values for the same Criterion j.
P i j represents the relative importance of Indicator j in the i-th grid. When y i j is unevenly distributed among different grids, a certain y i j value is significantly larger than other y i j values. Then, the P i j corresponding to y i j will be significantly larger than other y i j (calculated by Equation (6)). Assuming that the P i j corresponding to a certain y i j is approximately 1 and that other P i j are approximately 0, the Information Entropy e j will reach its minimum value approaching 0 (calculated by Equation (5)). This would indicate that the system’s disorder is low. When y i j is evenly distributed among different grids, each P i j will be approximately 1 m , and the Information Entropy e j will reach its maximum value, which is 1 (calculated by Equation (5)). This would indicate that the system’s disorder is high.
Step 4:
Determine the weight of evaluation Criterion j. The formula is as follows:
w j = 1 e j j = 1 n ( 1 e j ) ,
where w j [ 0 , 1 ] , and j = 1 n w j = 1 .

2.5. MaxEnt Model

The MaxEnt model is a statistical model for simulating species distribution based on the Maximum Entropy theory. It uses past or current species distribution information along with various environmental data to model the potential geographic distribution of species [81]. The Maximum Entropy Principle was introduced by Jaynes in 1957 [82], originating from Shannon’s theory of information entropy. In information theory, entropy is a measure used to quantify uncertainty. The Maximum Entropy Principle is a method for constructing probability distributions based on existing incomplete information. This principle assumes that the probability distribution with the highest entropy should be selected when the available information is insufficient for a completely accurate determination. This approach ensures maximum objectivity and neutrality given the constraints of the existing data [83]. Incomplete observational data, such as unrecorded species presence at specific locations, can introduce significant biases in models that assess the relationships between wildlife and their habitats [84]. In scenarios of such incomplete information, the MaxEnt model is proven to be an exceptionally effective tool for examining species distribution and habitat relationships. Phillips et al. developed the machine learning-based software package MaxEnt version 3.4.1, which is based on the theory of maximum entropy, for habitat suitability modeling [85]. This study utilized MaxEnt version 3.4.4 (available at: http://biodiversityinformatics.amnh.org/open_source/maxent/, accessed on 8 February 2024) for the habitat suitability modeling of tigers and leopards.
The TLH suitability assessment model was established using 13 criteria grouped into 4 factors: environmental, topography, human disturbance, and prey species factors. Within the NCTLNP, a total of 142 tiger and leopard trace points were recorded. For the MaxEnt habitat analysis and modeling, 75% of these trace points (107 points) were randomly selected as the training set, with the remaining 25% (35 points) comprising the test set. To enhance the model stability during parameter selection, the bootstrap method was utilized as the run type, with a maximum of 5000 iterations, and was repeated 10 times. The average habitat suitability index derived from these ten computations was adopted as the final model outcome. MaxEnt, configured to the logistic output format, produced a raster map depicting the probability distribution of the species. In this map, each grid cell value, expressed in floating-point format, indicates the probability of species occurrence, and it is calculated via logistic transformation, ranging from 0 to 1 [86,87]. MaxEnt’s performance was assessed through threshold-independent Receiver Operating Characteristic (ROC) analysis and the Area Under the ROC Curve (AUC). The AUC values span from 0.5 to 1.0, with values close to 1 reflecting superior model performance. The model performance is classified as fail (0.5–0.6), poor (0.6–0.7), fair (0.7–0.8), good (0.8–0.9), or excellent (0.9–1.0) [88]. Furthermore, the Jackknife method was employed to determine the importance of the variables in the final model. The Jackknife test constructs models by sequentially using only one variable or excluding one variable at a time and compares the differences in the training gain, test gain, and AUC values among the models to evaluate the importance of environmental variables [89].

2.6. Comprehensive Suitability Zoning Methodology

We employed an innovative method of integrated suitability zoning by analyzing the interaction between TLH suitability and ecotourism suitability, resulting in a comprehensive suitability map for ecotourism. This study prioritized ecological protection based on TLH suitability and integrated assessments of ecotourism suitability to develop a comprehensive suitability map. Specifically, we initially categorized the region into low, medium, and high levels based on the TLH suitability assessment. As TLH suitability is directly related to the conservation of tiger and leopard habitats, areas with lower suitability are considered more appropriate for ecotourism development. Subsequently, each TLH suitability level was combined with ecotourism suitability levels (high, medium, or low) to create nine different scenarios. These scenarios were then synthesized to establish five comprehensive suitability categories ranging from very high to unsuitable (Figure 5). For instance, an area with high TLH suitability, even if also highly suitable for ecotourism, would still be categorized as a low suitability area on the comprehensive suitability map. This approach prioritizes ecological conservation by considering the needs and protection of habitats before planning ecotourism development. The comprehensive suitability map not only identifies areas suitable for development, but also marks sensitive areas that need protection or should be avoided. This provides a scientific and systematic assessment tool for developing ecotourism within the NCTLNP, effectively balancing ecological conservation with tourism development and offering scientific support and practical guidelines for sustainable tourism.

3. Results

3.1. Ecotourism Suitability Modeling

3.1.1. Weights from Entropy

According to the steps described in Section 2.4, the entropy weight method was employed to analyze the collected data on ecotourism suitability criteria and calculate objective weights. The weights of each evaluation criterion derived from the entropy weight method reflect the importance of each criterion in influencing the assessment outcomes. Table 4 lists the criteria for ecotourism suitability assessment along with their respective weights.
Based on the theories discussed in Section 2.4, the greater the data variability, the smaller the entropy value, and the higher the weight. If absolute dispersion is defined as the standard deviation (SD), then relative dispersion is referred to as the coefficient of variation (CV) [90]. Both SD and CV are widely used as indicators to measure the degree of data variability [91,92]. When a factor has a high SD and CV, it indicates significant differences among different samples. When a high variability factor has a smaller entropy value, it provides more information. As a result, it has a greater impact on the suitability for ecotourism and consequently higher weights. The SD of precipitation data (Aa5) is 0.2031 and its CV is 54.47%, both of which are the highest. This indicates that the precipitation data have the highest degree of variability. Therefore, the data’s entropy value is the lowest and are assigned the highest weight of 0.2604. Similarly, criteria such as aspect (Ab3), distance to tourist attractions (Ac3), and temperature (Aa4) also have high degrees of data variability, resulting in higher weights. Overall, precipitation (Aa5), aspect (Ab3), distance to tourist attractions (Ac3), and temperature (Aa4) have a greater influence on the assessment of ecotourism suitability. In contrast, for the NDVI (Aa1), its CV was only 3.19% and its SD was 0.0297. This indicates that the NDVI data have low variability, larger entropy value, and less information content. Consequently, it was assigned a relatively small weight of only 0.0011. In summary, Table 4 illustrates the relationship between the data variability and weight: criteria with greater variability typically have smaller entropy values and are assigned higher weights in the entropy weight method. This weighting approach ensures that criteria with high data variability and high information content have a greater impact on the results during the overall assessment.

3.1.2. Ecotourism Suitability Distribution

Utilizing the weight values from the various criteria listed in Table 4, overlay analysis was performed in ArcGIS 10.8 on the twelve standard raster data layers depicted in Figure 3. These data layers were subsequently reclassified into three categories—high suitability, medium suitability, and low suitability—using the Natural Breaks (Jenks) classification method, as shown in Figure 6. The research results, presented in Table 5, revealed that 27.08% (3765.313 km2) of the study area is highly suitable for ecotourism development, 43.90% (6103.625 km2) is moderately suitable, and 29.02% (4034.875 km2) is lowly suitable.
The areas highly suitable for ecotourism are primarily located in the northeastern part of Hunchun and the southeastern part of Dongning, both of which are adjacent to the China–Russia border. Additionally, the outskirts of village clusters in Wangqing also present significant areas of high suitability. These regions, characterized by relatively low elevation, are well suited for various ecotourism activities. The low elevation promotes easy access and exploration of natural landscapes by tourists, thereby improving convenience and the overall quality of the travel experience. Moreover, the average temperature in this area of the NCTLNP is relatively higher compared to other regions, providing more favorable climatic conditions for tourism activities. This ensures a more pleasant travel environment for most of the year. Surrounding villages provide essential infrastructure support for ecotourism, including accommodation, dining, and transportation services, which enhances the overall appeal of these regions for ecotourism. Consequently, due to the advantageous natural conditions and relatively well-developed infrastructure, these areas are highly suitable for ecotourism development.
Moderately suitable areas for ecotourism are mainly distributed on the edge of the highly suitable zones and are generally scattered. They are sporadically located in the central part of Hunchun, the northwestern part of Dongning, and the central part of Wangqing. The significant variations in terrain and occasional insufficient vegetation cover make these areas less appealing in natural landscapes and ecological environments compared to highly suitable areas. Nevertheless, these regions still possess valuable ecotourism resources and hold considerable potential for ecotourism development.
The ecotourism low-suitability zones are primarily distributed in block and strip patterns, exhibiting relatively scattered and irregular shapes. These areas are mainly concentrated in the central and northwestern parts of Wangqing, the northeastern part of Ning’an, the southern part of Muling, and the northwestern part of Hunchun. Overall, these areas receive relatively low precipitation, which may result in less abundant natural vegetation, thereby affecting biodiversity and reducing the attractiveness of ecotourism. Additionally, the high elevation in these regions makes it more difficult to access and explore, thereby lowering their accessibility to general tourists. The rugged landscape not only limits the types and scope of visitor activities, but also reduces the safety of tourism activities.

3.2. Tiger and Leopard Habitat Suitability Modeling

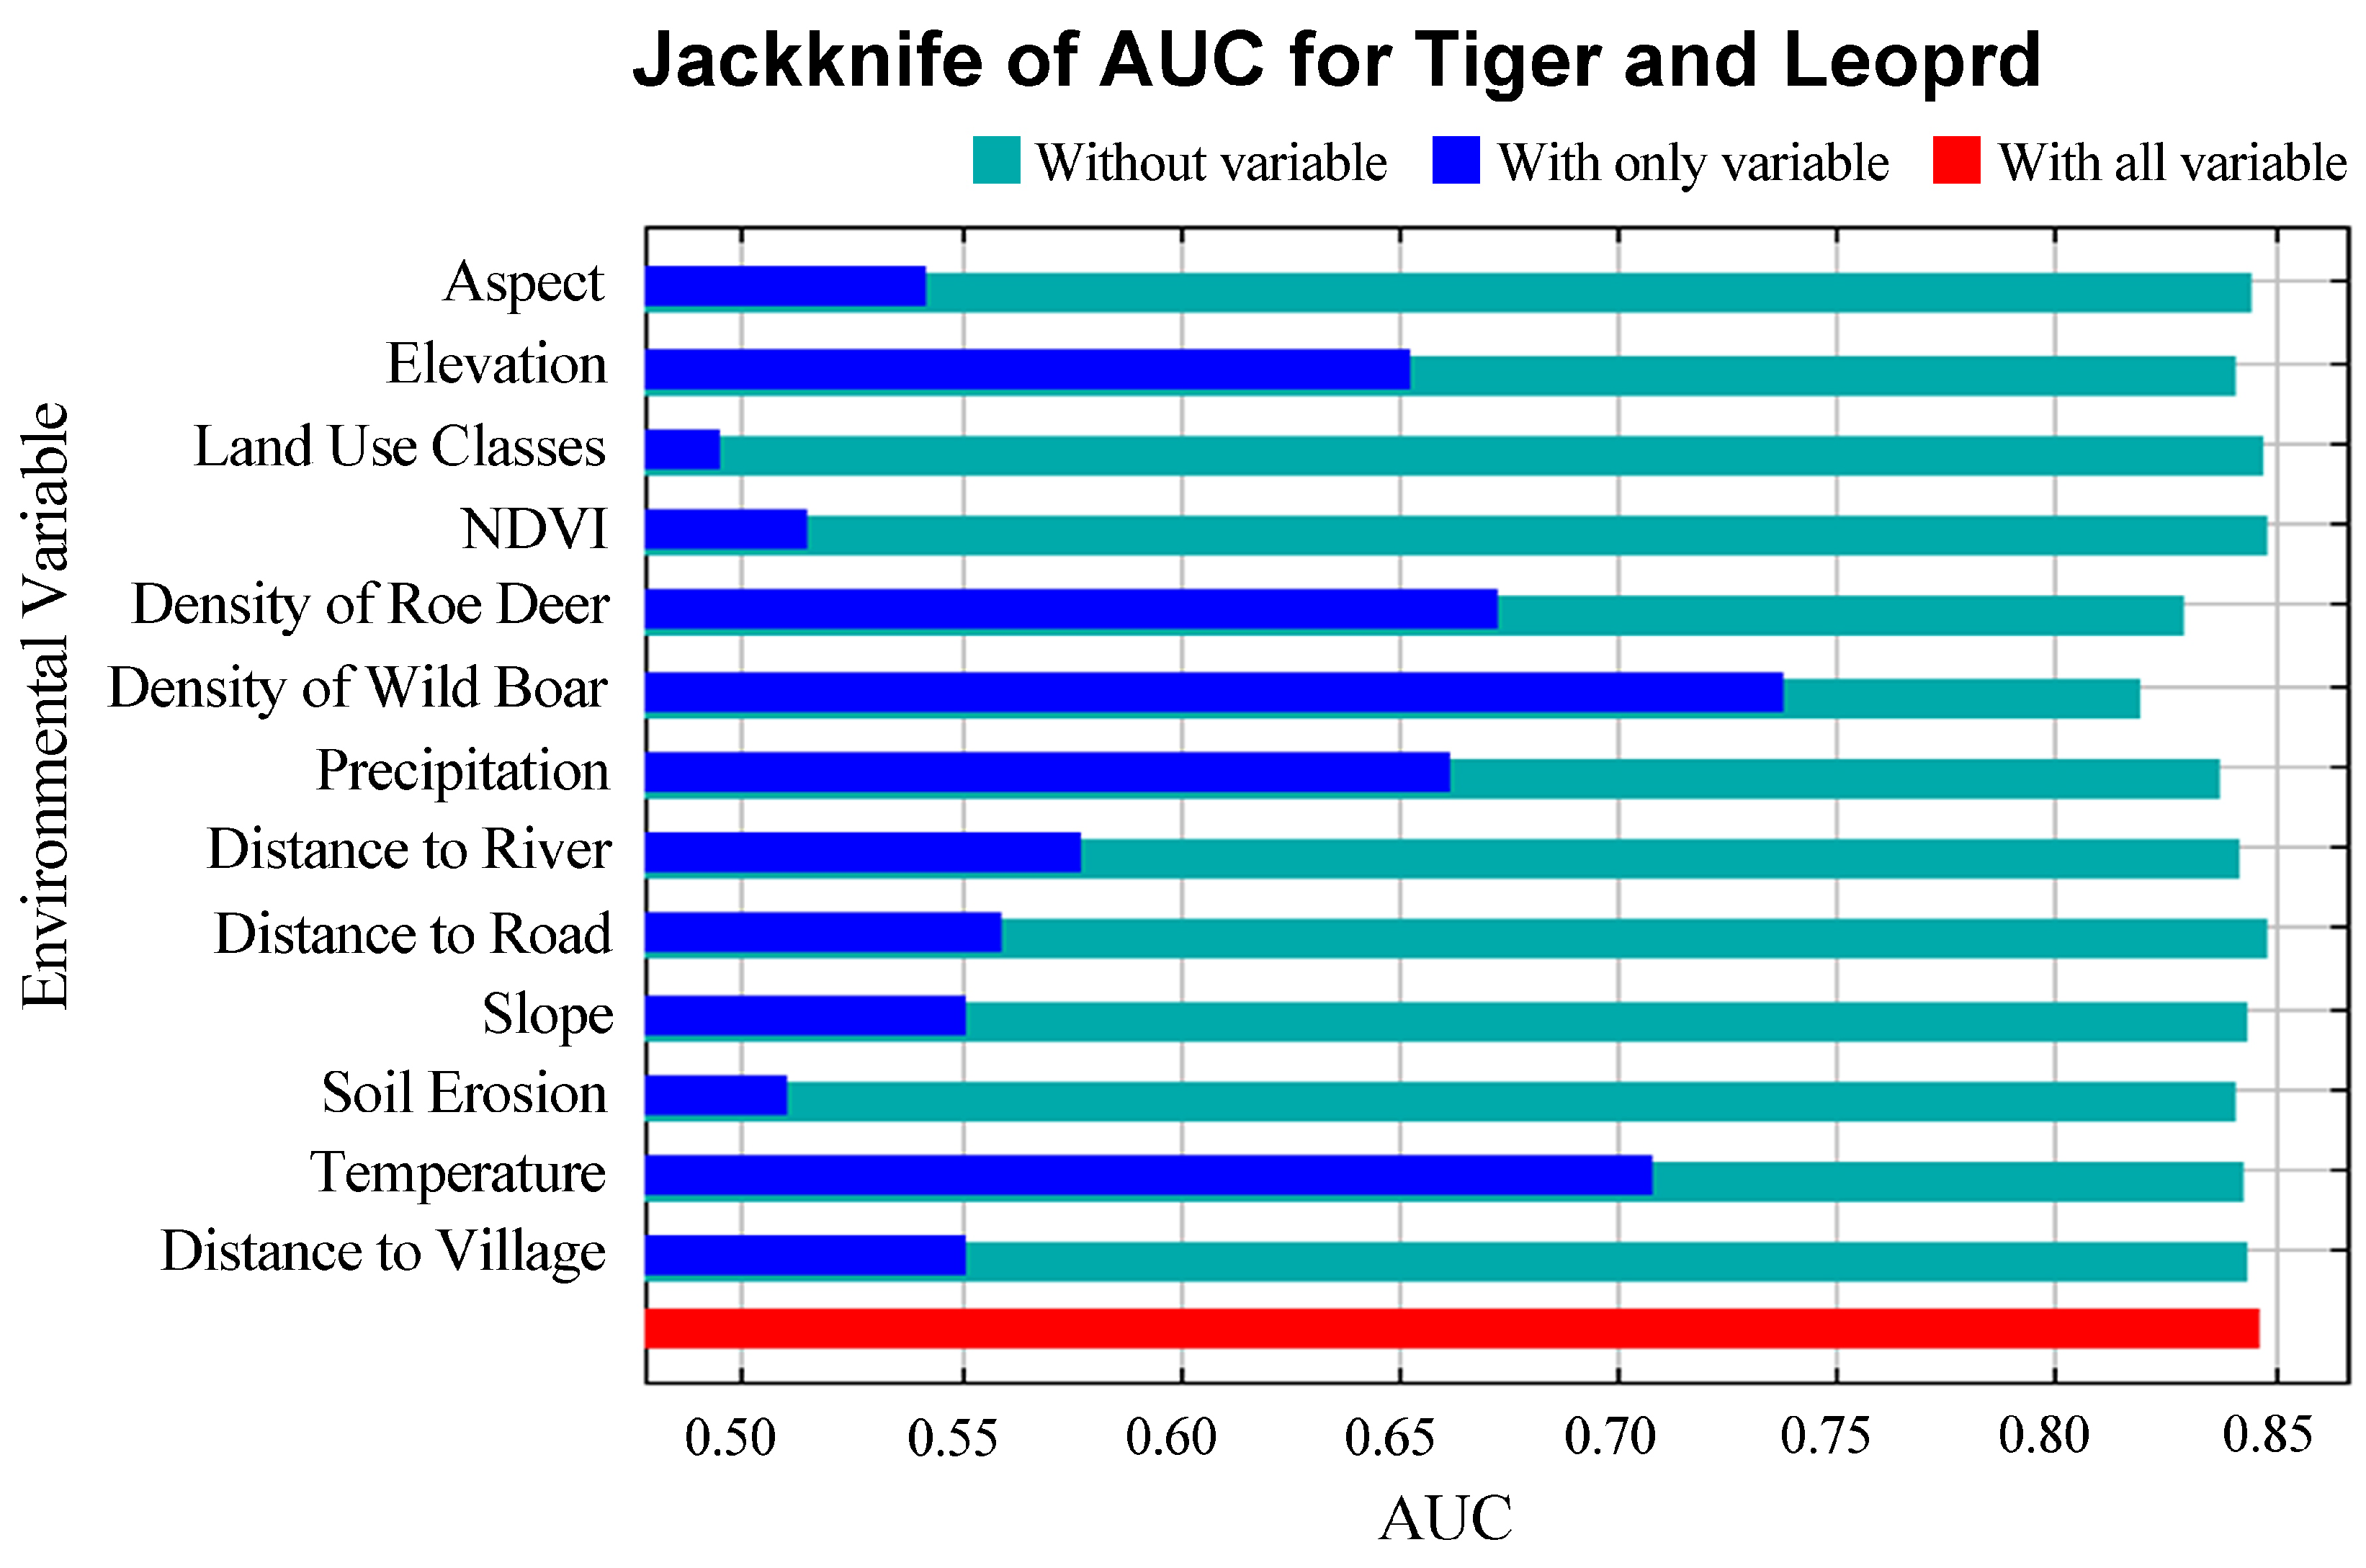
3.2.1. Model Performance

The Receiver Operating Characteristic (ROC) curve (Figure 7) evaluates the performance of the MaxEnt model developed in this study for predicting TLH suitability in the NCTLNP. As shown in Figure 7, the model’s average Area Under the Curve (AUC) was 0.905, which is close to 1, indicating that the model has a high accuracy in distinguishing between suitable and unsuitable habitats. Generally, the closer the AUC value is to 1, the better the predictive performance of the model. Therefore, this AUC value effectively confirms the high accuracy of the MaxEnt model constructed in this study for predicting the TLH suitability in the park.

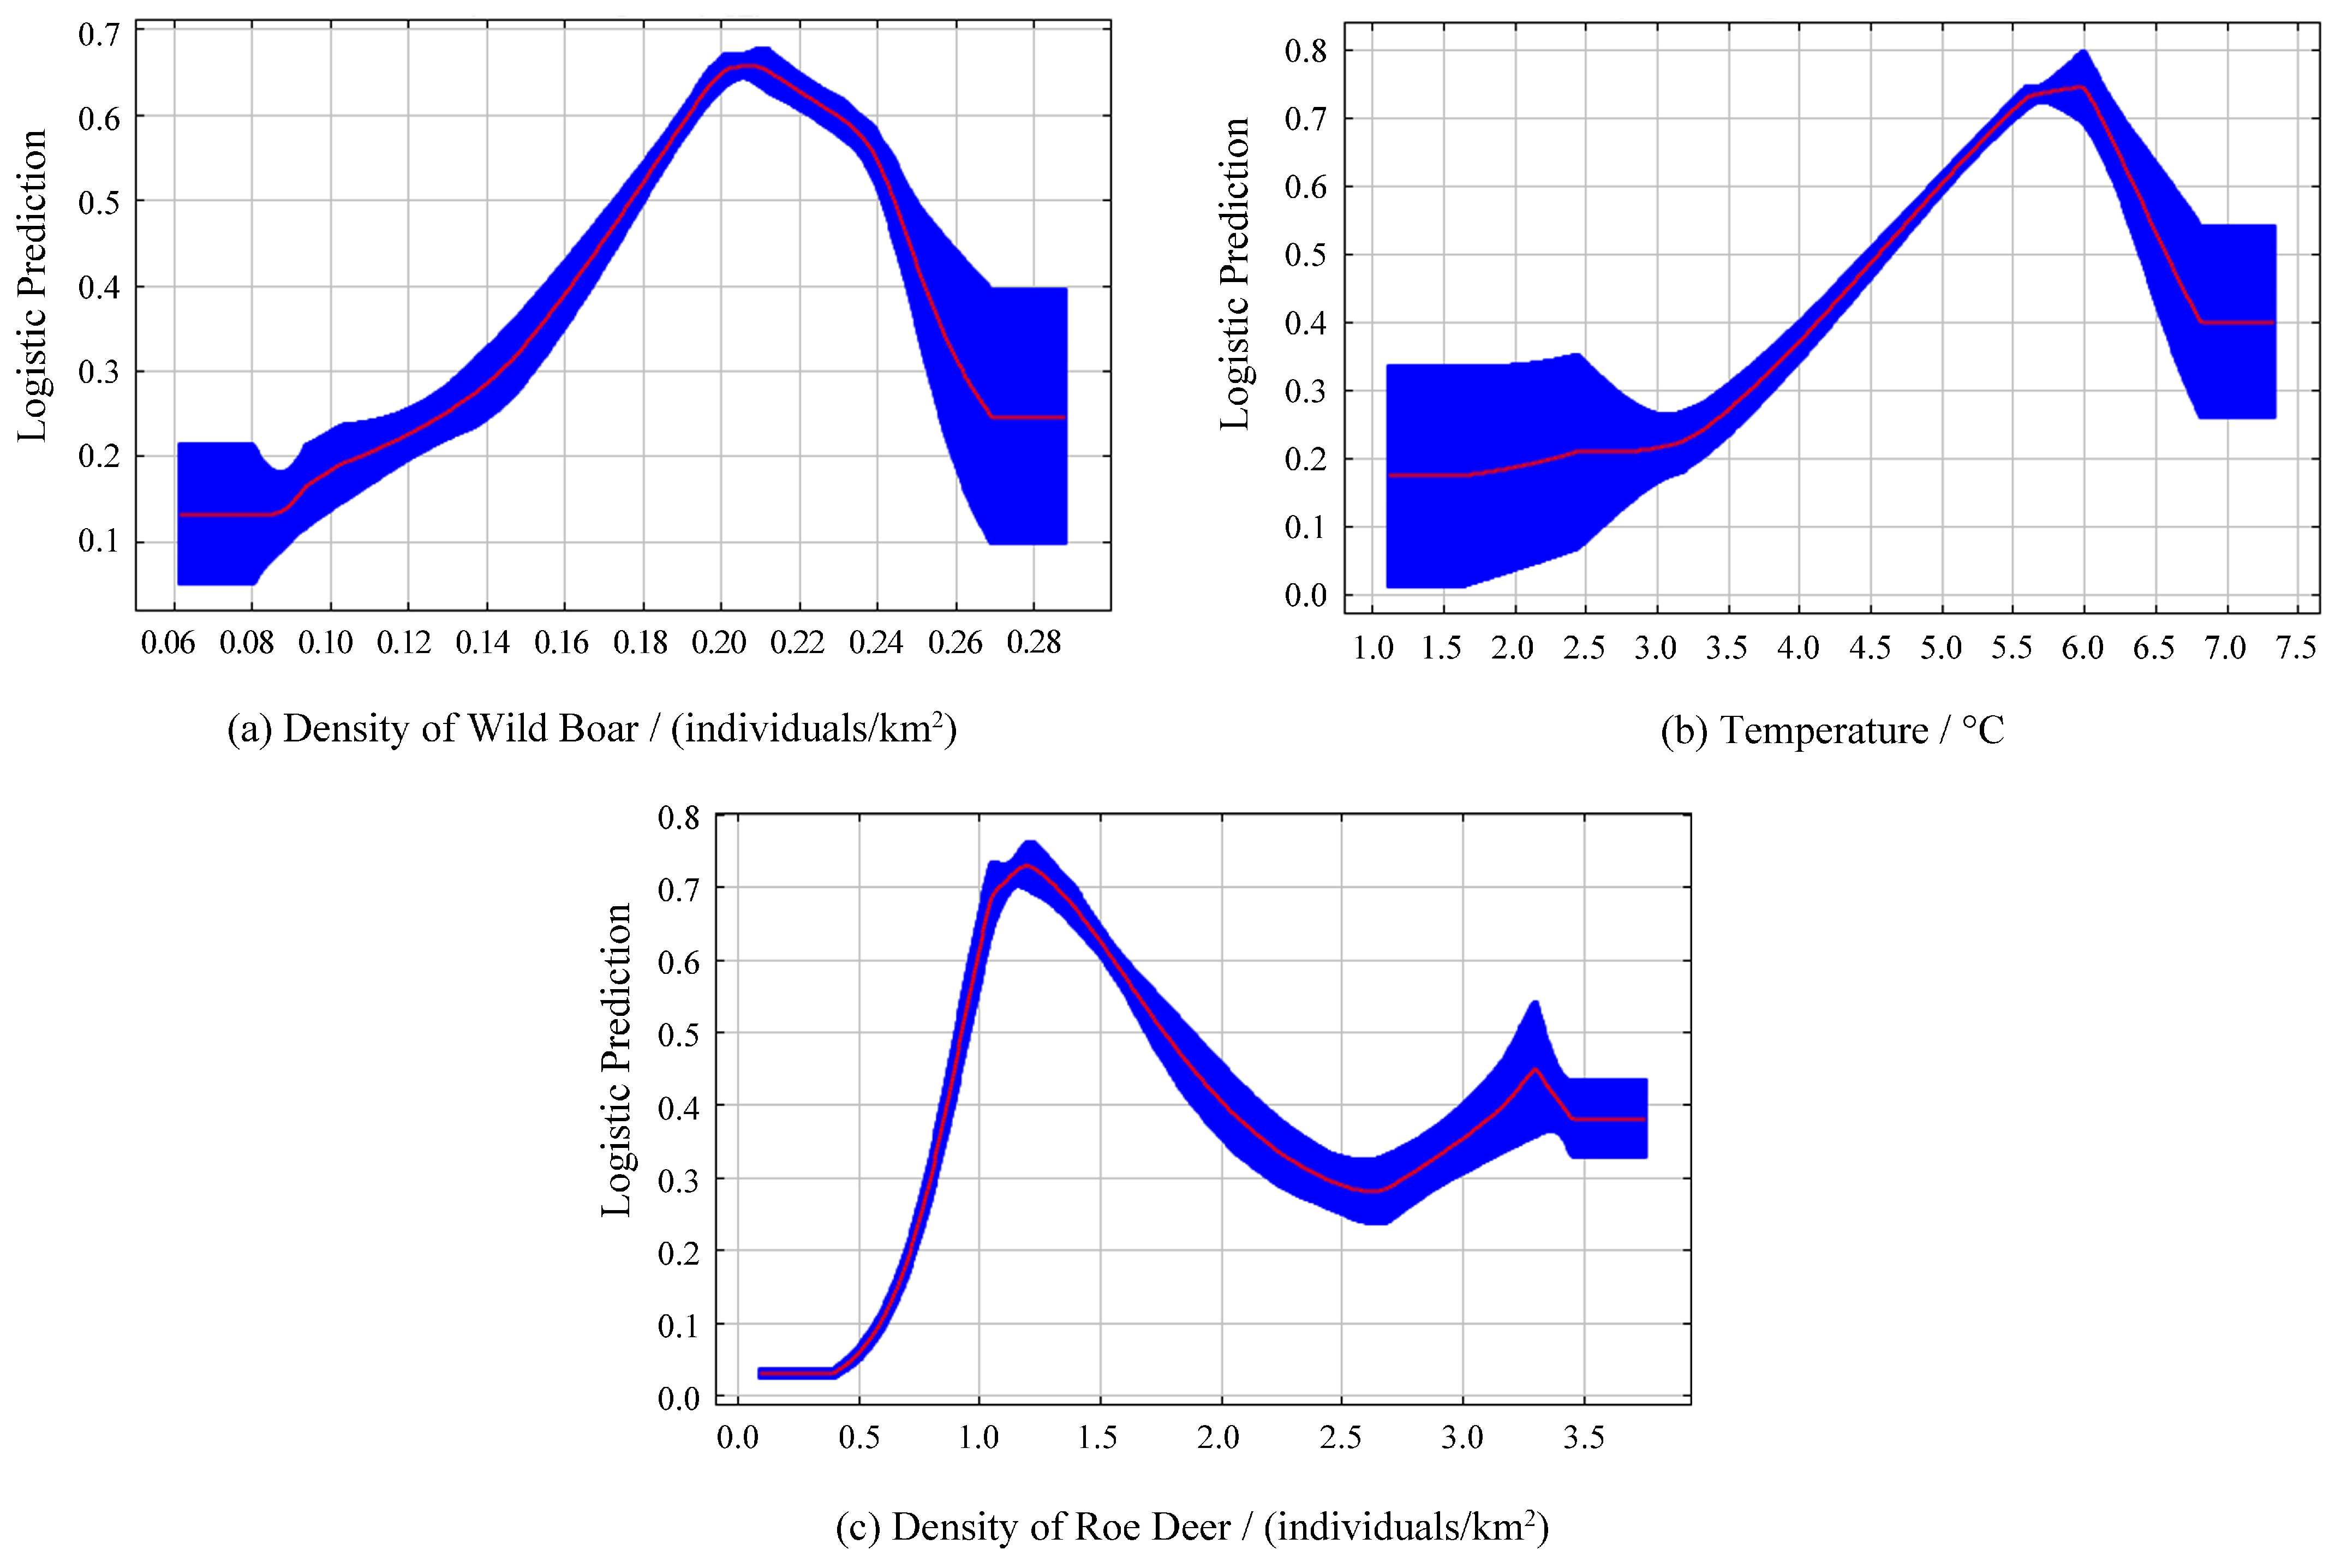
3.2.2. Variables Influencing Habitat Suitability

According to the variable contribution analysis when using the MaxEnt model (Table 6), the three variables with the highest contribution rates were density of wild boars, temperature, and density of roe deer, contributing 29.3%, 18.6%, and 12%, respectively. The total contribution rate of these variables reached 59.9%, indicating that they are the primary factors influencing the habitat suitability of the Amur tigers and leopards. Soil erosion, precipitation, and distance to rivers, with respective contribution rates of 6.1%, 5.5%, and 5%, serve as secondary factors affecting this habitat suitability. Other variables had contribution rates of less than 5%, suggesting that their influence on the habitat suitability of the Amur tigers and leopards is relatively minor. The results of the AUC value Jackknife test (Figure 8) also indicated that the density of wild boars, temperature, and density of roe deer have the most significant impact on the model’s predictions, while the effects of precipitation and elevation are secondary. The influence of other variables on the model results was minimal.
The response curves of the major variables to occurrence probability of the Amur tigers and leopards (Figure 9) reveal the best environmental conditions for their habitats. The optimal habitat suitability for Amur tigers and leopards is achieved when the density of wild boars is between 0.18 and 0.24 individuals per square kilometer, with suitability declining in areas with either significantly lower or higher densities.
Additionally, Amur tigers and leopards prefer environments with average temperatures between 5.0 and 6.5 °C as lower temperatures negatively impact their survival. The occurrence probabilities of the Amur tigers and leopards reached their peak when the density of roe deer was between 1.0 and 1.5 individuals per square kilometer. After this peak, as the density of roe deer increased, the occurrence probabilities of these predators initially decreased significantly, and then exhibited a slight increase before declining again.

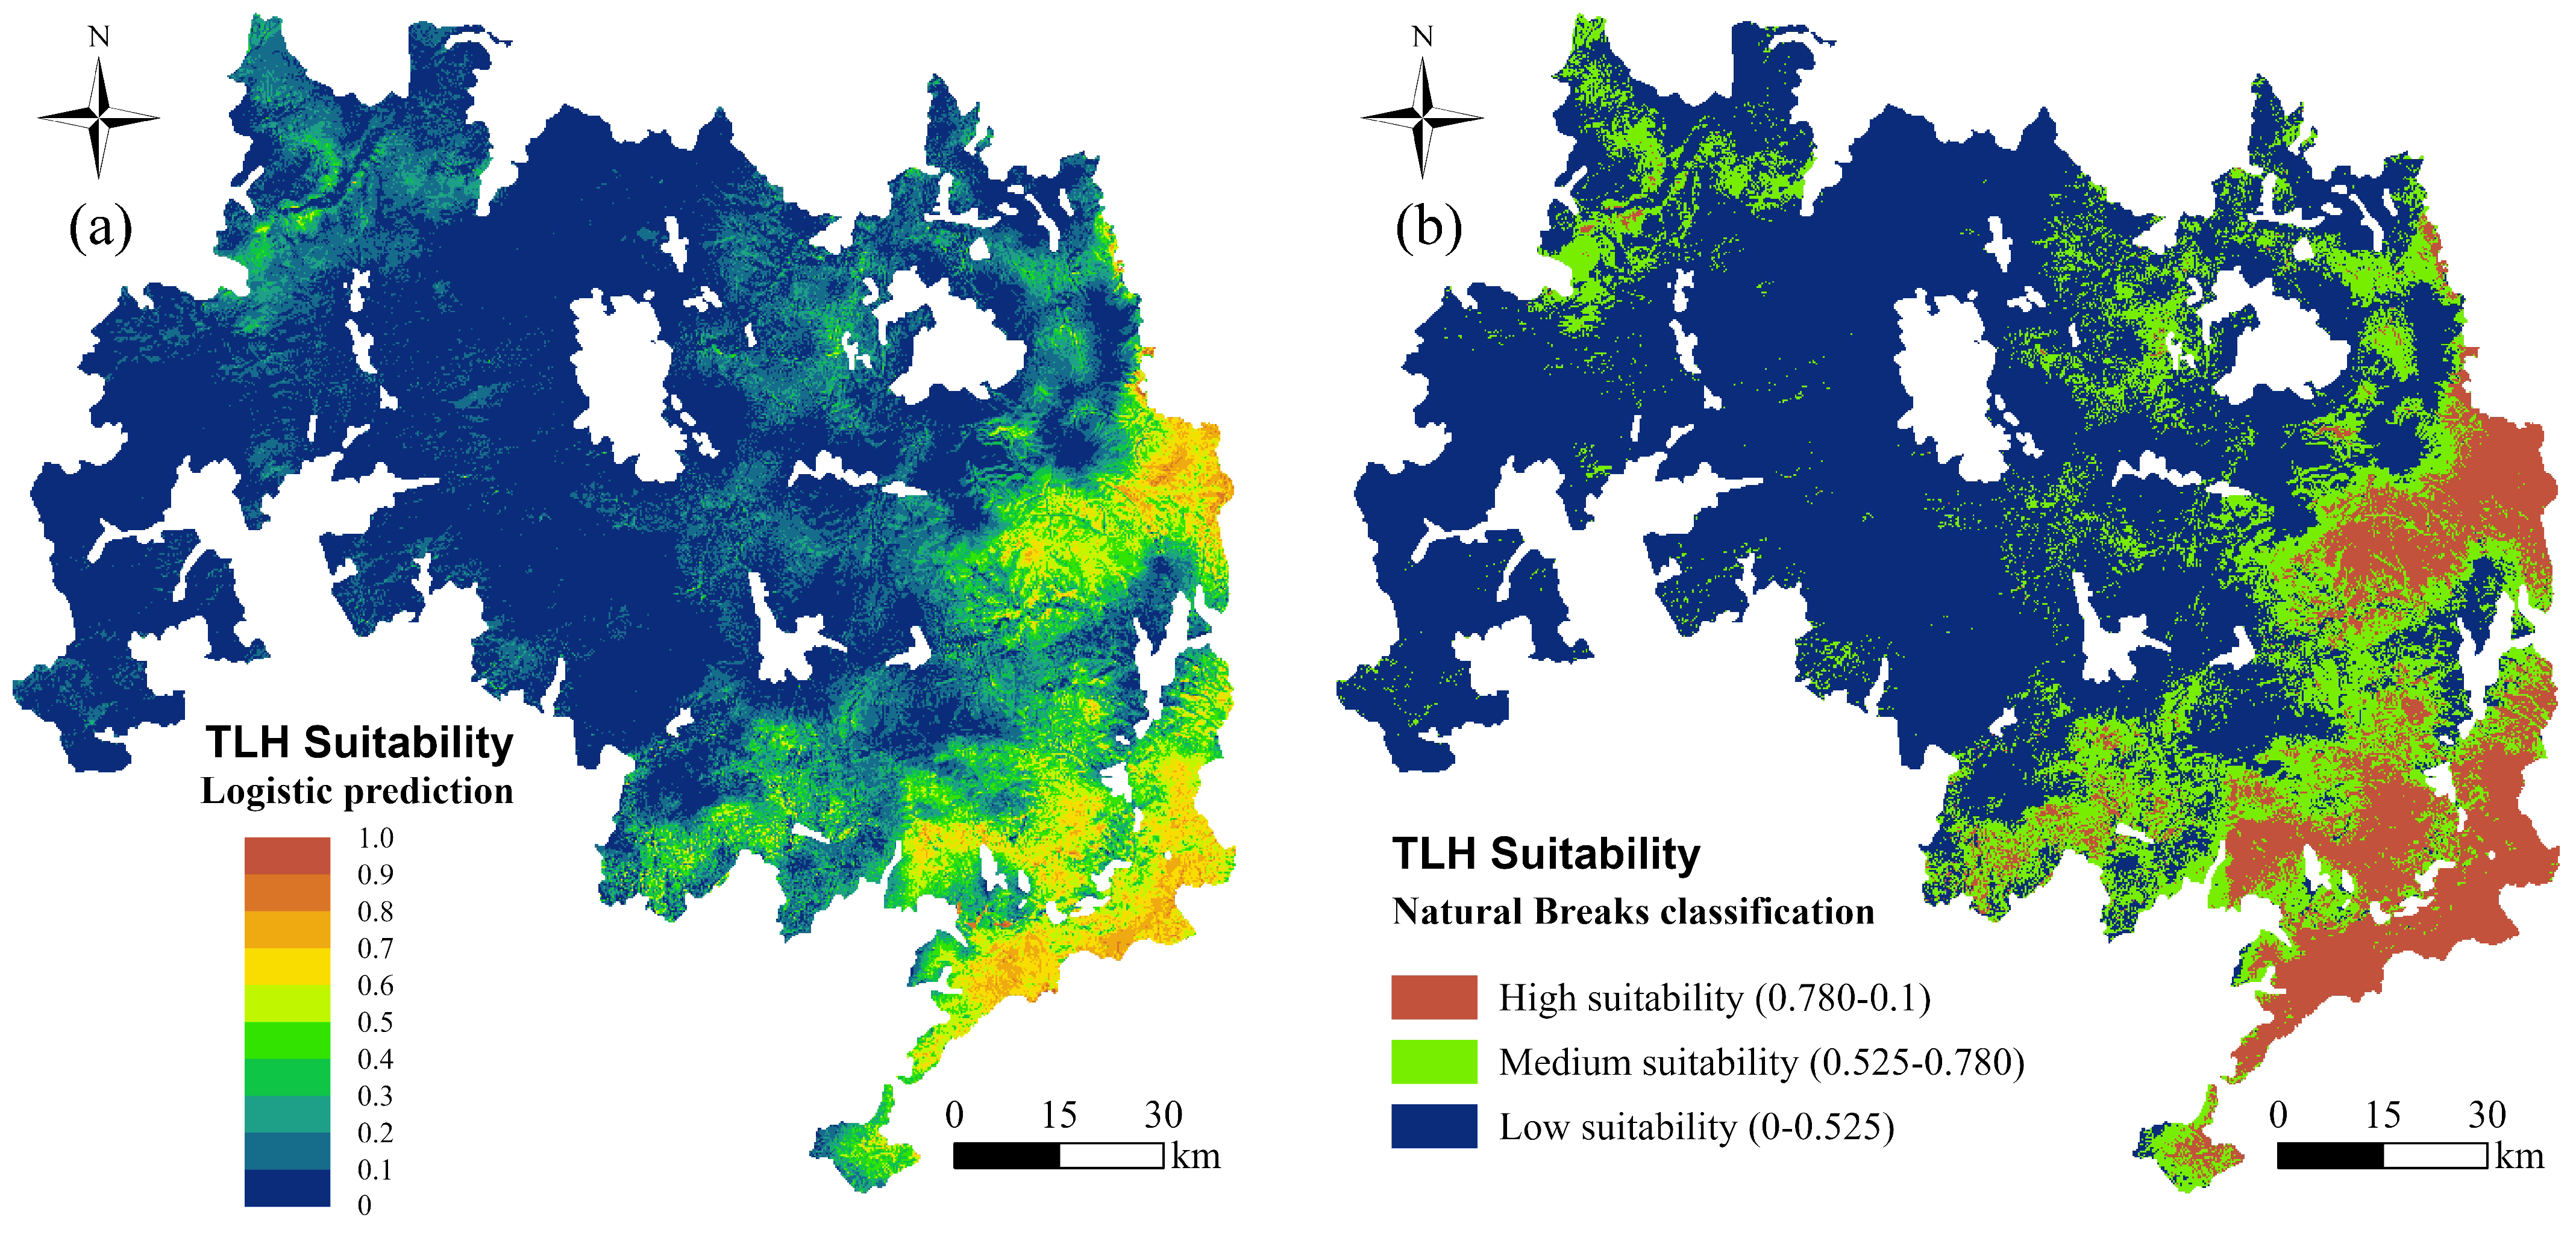
3.2.3. Habitat Suitability Distribution

The MaxEnt model generated a suitability distribution probability map for tiger and leopard habitats (Figure 10a), with logistic prediction values ranging from 0 to 1. Areas with logistic prediction values closer to 1 indicate a higher probability of tiger and leopard presence, suggesting that these areas are more suitable for their habitation. To further classify the habitat suitability, this study used the Natural Breaks (Jenks) classification to categorize the logistic prediction values. Areas with logistic prediction values from 0.780 to 1.0 were classified as high suitability zones, 0.525 to 0.780 as medium suitability zones, and 0 to 0.525 as low suitability zones (Figure 10b).
Within the study area, the distribution of habitat suitability was categorized as follows (refer to Table 7): High suitability areas encompassed 1716.688 km2 or 12.73% of the total study area, and they were primarily located in the southeastern corner of the park, mostly within Hunchun. This region not only serves as a frequent location for wild boars, providing abundant prey resources, but also benefits from relatively higher annual average temperatures compared to other areas of the park, which are advantageous for the breeding and survival of tigers and leopards, thus making it an optimal habitat. Medium suitability areas cover 2718.688 km2, representing 20.15% of the study area, and they were found to primarily surround the high suitability zones, as well as in the hinterlands of Hunchun, the southern part of Dongning, and the northeastern part of Ning’an. Although these regions partially satisfy the habitat requirements of tigers and leopards, they do not exhibit the ideal conditions found in the high suitability areas. The low suitability areas, which were the largest category, span 9053.750 km2, accounting for 67.12% of the total park area. These regions extend over half of the park, predominantly across the western parts, including Wangqing, northeastern Ning’an, southern Muling, and southern Dongning. Due to the clustering of villages, frequent human activities, and severe landscape fragmentation, these areas are considered unsuitable habitats for tigers and leopards [39].

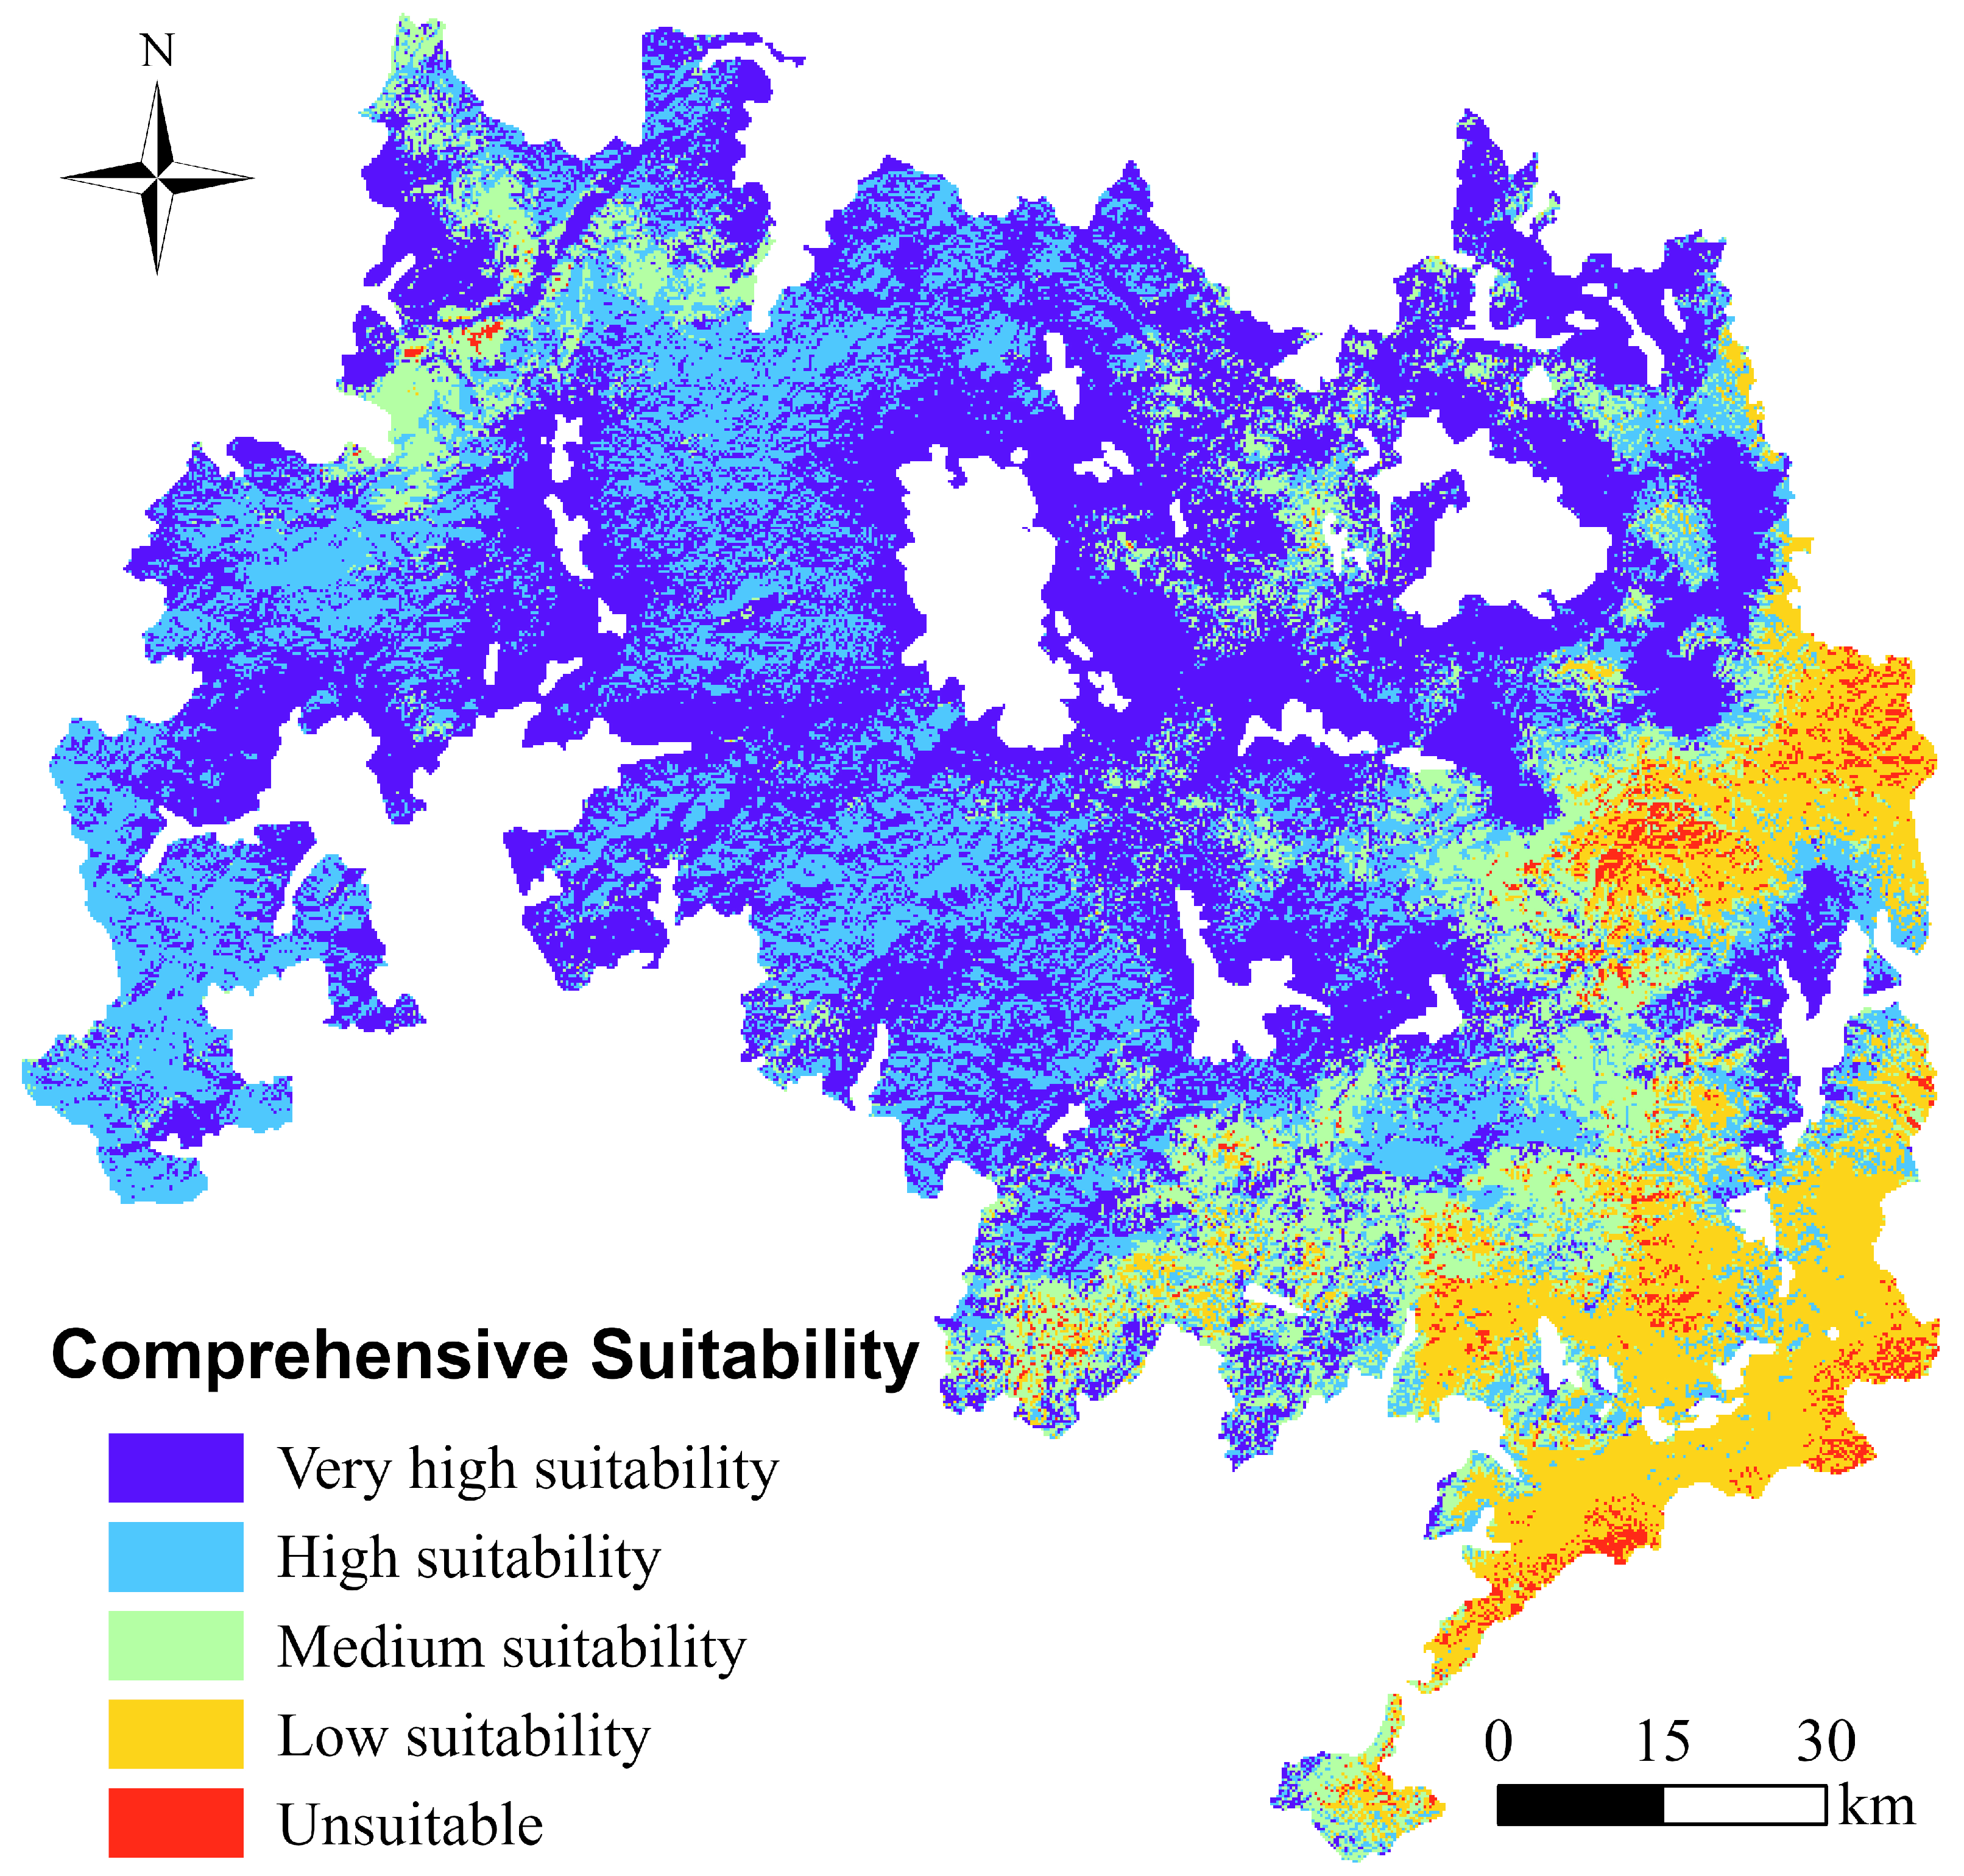
3.3. Assessment of Comprehensive Ecotourism Suitability

This study generated a comprehensive ecotourism suitability map based on the analysis of ecotourism suitability zoning along with the suitability zoning of tiger and leopard habitats. As shown in Figure 11, the map categorizes the area into five classes: very high suitability, high suitability, medium suitability, low suitability, and unsuitable. This classification was guided by the principles of environmental conservation and sustainable tourism, aiming to explore the potential of ecological tourism without adversely affecting the critical habitats of these species. According to the results presented in Table 8, the distribution of each category was as follows: very high suitability (45.62%), high suitability (28.23%), medium suitability (13.43%), low suitability (11.03%), and unsuitable (1.69%).
The regions of very high suitability for ecotourism covered the largest proportion, with an area of approximately 6152.563 km2, and they are primarily located on the edges of village clusters. These regions are notably in the northern part of Wangqing, the southern part of Dongning, as well as scattered areas in Ning’an, Muling, and Hunchun. Their proximity to village clusters allows these areas to offer necessary facilities for ecotourism. However, the closer these areas are to the villages, the greater the human disturbance to species such as tigers and leopards, making them unsuitable as habitats. As a result, the areas surrounding the villages emerge as optimal locations for developing ecotourism. Moving forward, these should be prioritized as focal areas for the planning and development of ecotourism.
The areas of high suitability cover approximately 3806.500 km2. The distribution exhibits relatively scattered and discontinuous characteristics interwoven with highly suitable areas. It is widely distributed in the central and western parts of the park, covering the central and northwestern regions of Wangqing, the eastern edge of Ning’an, the southern part of Muling City, and sporadic areas in Hunchun. These regions are categorized as low suitability habitats for tigers and leopards, but due to factors such as steep terrain, they are also considered low suitability areas for ecotourism. Although the terrain imposes significant limitations on the types of activities, taking into account the preferential principle of the ecology, ecotourism activities can still be conducted in these areas. The areas of medium suitability cover about 1811.313 km2 and are mainly scattered around the high suitability regions.
Finally, the areas with low suitability and those that are unsuitable cover approximately 1487.813 km2 and 228.063 km2, respectively. These regions are primarily situated in the southeast corner of the park, specifically the China–Russia border region and central areas in Hunchun. These regions serve as highly suitable habitats for key wildlife species such as tigers and leopards, where the ecosystems maintain a high level of integrity and being pristine. Consequently, ecotourism activities in these areas could damage these sensitive and fragile ecological environments. Given the critical importance of biodiversity conservation and ecological balance, these regions must be explicitly excluded from ecotourism development.

4. Discussion

This study integrates the entropy weight method and the MaxEnt model to generate a comprehensive ecotourism suitability map for the NCTLNP, providing a detailed suitability assessment. This map thoroughly reflects the effects of various influencing factors, including ecotourism suitability and habitat suitability factors for tigers and leopards, thus offering a scientific basis for ecotourism development.
This study separately listed the factors affecting wildlife to create an independent wildlife habitat suitability evaluation system, which was then combined with the traditional ecotourism suitability evaluation system for comprehensive analysis. This approach amplifies the influence of wildlife factors in ecotourism evaluations. Previous research has primarily established ecotourism evaluation index systems based on ecological and human variables using environmental indicators to reflect ecological protection. But they rarely considered the impact of wildlife factors. For instance, Marcelo used tourism impact assessment (TIA) to evaluate three protected areas in Uruguay, identifying fifteen major tourism activities that could affect four biological components (i.e., biodiversity, vegetation cover, soil, and water) and twenty-one potential impacts [93]. Hasan combined Geographic Information Systems (GIS) with the fuzzy analytic hierarchy process (F-AHP) to assess the relative importance of physical, natural, environmental, and socio-economic factors on the suitability of ecotourism sites, where variables such as elevation, precipitation, geology, and land use formed the ecological variables [94]. The NCTLNP is the only national park in China dedicated to the protection of wild Amur tigers and leopards. Its ecotourism evaluation must fully consider the unique ecological needs and conservation requirements of these species. If wildlife factors are merely treated as a single indicator, their importance may be under-represented. Therefore, it is necessary to establish a separate habitat suitability index system for tigers and leopards. This approach not only helps comprehensively reflect the key factors affecting the habitats of Amur tigers and leopards, but also ensures that ecotourism activities align with their conservation needs, avoiding adverse impacts on their living environment.
The generated comprehensive suitability map meticulously assesses the quality and distribution of Amur tiger and leopard habitats. It not only provides a scientific basis for ecotourism planning in the NCTLNP, but also offers strong support for the management and decision making of the protected area. In the future, areas classified as ‘Very High Suitability’ and ‘High Suitability’ should be prioritized for tourism development. These areas can serve as primary zones for developing tourism infrastructure, such as visitor centers, viewing platforms, and trails. Suitable ecotourism projects, such as wildlife observation, nature education, and hiking, can be considered for development. At the same time, ecological protection must be prioritized. ‘Medium Suitability’ areas, which are more scattered, should serve as auxiliary tourism development zones. These areas can support moderate development of low-impact tourism activities, such as bike trails, camping areas, and nature exploration. ‘Low Suitability’ and ‘Unsuitable’ areas should be restricted to limited scientific research and environmental monitoring activities to ensure their ecosystems are not disturbed by human activities. Additionally, a comprehensive management system should be established to enhance visitor management and education. Promoting eco-friendly tourism practices will reduce the negative impact of tourism on the environment. Regular environmental monitoring and evaluation should be conducted to adjust tourism planning based on actual conditions, ensuring the park’s sustainable development.
The practical significance of this study extends beyond the NCTLNP and holds broad applicability. It offers valuable references for other protected areas with flagship species conservation. Flagship species possess symbolic and influential qualities. Protecting these flagship species also protects other ‘background species’ at the same time [95]. Additionally, they play a crucial role in maintaining the structure and regulation of local ecosystems [96]. This study not only considers traditional natural and environmental variables, but also lists the habitat needs of flagship species as a separate evaluation system, ensuring that the conservation needs of these species are fully reflected in ecotourism planning. Specifically, for reserves that contain important flagship species such as orangutans, giant pandas, and elephants [97], this comprehensive suitability assessment method is equally applicable. By integrating ecotourism suitability factors with the habitat suitability factors of flagship species, protected area managers can more accurately identify the regions suitable for the survival of flagship species and the development of ecotourism. This approach not only maximizes the protection of flagship species and their habitats, but also enhances the quality and attractiveness of ecotourism.
This study has some limitations. First, the accuracy and quantity of the sample data may limit the MaxEnt model’s ability to predict species suitability distribution. Additionally, the comprehensive suitability map do not account for temporal and spatial dynamics. In the future, dynamic models should be introduced to consider these temporal and spatial changes, thereby enhancing the adaptability of ecotourism planning.

5. Conclusions

This study focuses on the Northeast China Tiger and Leopard National Park, establishing a comprehensive ecological tourism evaluation system that integrates the suitability of ecotourism with the suitability of tiger and leopard habitats. The aim is to achieve a balance between the development of ecotourism and the protection of wildlife through scientific and rational planning. The entropy weight method was employed in this study to objectively determine the weights of various factors influencing ecotourism suitability. This method measures the amount of information based on entropy values, thereby avoiding the biases introduced by subjective weighting and enhancing the scientific validity and accuracy of the assessment. Using the entropy weight method, we identified the factors significantly impacting ecotourism suitability and assigned them appropriate weights, making the assessment results more objective and reliable. At the same time, the MaxEnt model was utilized to predict the habitat suitability of Amur tigers and leopards. The MaxEnt model uses species distribution data and environmental variables to estimate the potential distribution areas of species. This process ensures that the comprehensive suitability assessment fully considers the conservation needs of wildlife. This study separately lists the habitat needs of flagship species, providing a scientific basis for tourism planning in the NCTLNP. It also offers a reference for other protected areas with flagship species conservation, helping to balance the demands of ecotourism and biodiversity conservation.

Author Contributions

Conceptualization, Q.Q. and Y.W.; methodology, software, validation, formal analysis, investigation, resources, data curation, writing—original draft preparation, writing—review and editing, and visualization, Q.Q.; supervision, project administration, and funding acquisition, Y.W. All authors have read and agreed to the published version of the manuscript.

Funding

This research was funded by China Scholarship Council (grant number 202206770006).

Data Availability Statement

Section 2 of this paper details the data sources. The public datasets can be requested from the authors, but the local datasets cannot be shared due to confidentiality restrictions.

Acknowledgments

We appreciate the assistance provided by the Northeast China Tiger and Leopard National Park Administration during the data collection phase. In addition, we would like to thank the reviewers for providing constructive comments on this manuscript.

Conflicts of Interest

The authors declare no conflicts of interest.

Appendix A

Table A1. The mean and standard deviation of the criteria.
CriteriaMeanStandard Deviation
NDVI0.93230.0295
Soil Erosion (t/(ha·y))1.66601.6328
Temperature (°C)3.95560.7866
Precipitation (mm)193.243250.7853
Distance to Rivers (m)8084.56655978.0179
Elevation (m)623.2827186.4150
Slope (°)12.74027.1697
Distance to Roads (m)3915.39193090.1823
Distance to Villages (m)7339.29944041.9888
Distance to Tourist Attractions (m)23,416.130314,227.1499
Density of Wild Boars (individuals/km2)0.15320.0512
Density of Roe Deer (individuals/km2)2.19790.6214
Table A2. The process of transforming categorical data to continuous data.
CriteriaCategoryValueReasons
Land Use ClassesForest6Higher vegetation areas, like forests and grasslands, support biodiversity and offer essential resources. As a result, these areas benefit ecotourism and provide suitable habitats for Amur tigers and leopards.
Grassland5
Wetland4
Water3
Cropland2
Building1
AspectSouth9South-facing slopes receive the most sunlight, promoting dense vegetation and suitable habitats. As sunlight decreases in other directions, vegetation diversity declines. Plane areas are ranked last due to their monotonous landscape, reducing ecotourism appeal and providing poor cover for tigers and leopards.
Southeast8
Southwest7
East6
West5
Northeast4
Northwest3
North2
Plane1

References

  1. Ma, Z.; Chen, Y.; Melville, D.S.; Fan, J.; Liu, J.; Dong, J.; Tan, K.; Cheng, X.; Fuller, R.A.; Xiao, X.; et al. Changes in area and number of nature reserves in China. Conserv. Biol. 2019, 33, 1066–1075. [Google Scholar] [CrossRef] [PubMed]
  2. Gössling, S. Global environmental consequences of tourism. Glob. Environ. Change 2002, 12, 283–302. [Google Scholar] [CrossRef]
  3. Baloch, Q.B.; Shah, S.N.; Iqbal, N.; Sheeraz, M.; Asadullah, M.; Mahar, S.; Khan, A.U. Impact of tourism development upon environmental sustainability: A suggested framework for sustainable ecotourism. Environ. Sci. Pollut. Res. 2023, 30, 5917–5930. [Google Scholar] [CrossRef] [PubMed]
  4. Rawat, U.; Agarwal, N.K. Biodiversity: Concept, threats and conservation. Environ. Conserv. J. 2015, 16, 19–28. [Google Scholar] [CrossRef]
  5. Yuxi, Z.; Linsheng, Z.; Ling-en, W.; Hu, Y. Measuring the conflict tendency between tourism development and ecological protection in protected areas: A study on National Nature Reserves in China. Appl. Geogr. 2022, 142, 102690. [Google Scholar] [CrossRef]
  6. Diamantis, D. The concept of ecotourism: Evolution and trends. Curr. Issues Tour. 1999, 2, 93–122. [Google Scholar] [CrossRef]
  7. Jeong, E.; Lee, T.; Brown, A.D.; Choi, S.; Son, M. Does a national park enhance the environment-friendliness of tourists as an ecotourism destination? Int. J. Environ. Res. Public Health 2021, 18, 8321. [Google Scholar] [CrossRef] [PubMed]
  8. Stronza, A.; Pêgas, F. Ecotourism and conservation: Two cases from Brazil and Peru. Hum. Dimens. Wildl. 2008, 13, 263–279. [Google Scholar] [CrossRef]
  9. Stronza, A.L.; Hunt, C.A.; Fitzgerald, L.A. Ecotourism for conservation? Annu. Rev. Environ. Resour. 2019, 44, 229–253. [Google Scholar] [CrossRef]
  10. Shannon, G.; Larson, C.L.; Reed, S.E.; Crooks, K.R.; Angeloni, L.M. Ecological consequences of ecotourism for wildlife populations and communities. In Ecotourism’s Promise and Peril: A Biological Evaluation; Springer: Berlin/Heidelberg, Germany, 2017; pp. 29–46. [Google Scholar]
  11. Costa, T.d.O.; Assis, L.R.d.; Calijuri, M.L.; Assemany, P.P.; Lima, G.S. Defining priority zones for conservation and ecotourism in a protected area. Rev. Árvore 2016, 40, 769–779. [Google Scholar] [CrossRef]
  12. Thede, A.K.; Haider, W.; Rutherford, M.B. Zoning in national parks: Are Canadian zoning practices outdated? J. Sustain. Tour. 2014, 22, 626–645. [Google Scholar] [CrossRef]
  13. Mahdavi, A.; Niknejad, M. Site suitability evaluation for ecotourism using MCDM methods and GIS: Case study-Lorestan province, Iran. J. Biodivers. Environ. Sci. 2014, 4, 425–437. [Google Scholar]
  14. Mansour, S.; Al-Awhadi, T.; Al-Hatrushi, S. Geospatial based multi-criteria analysis for ecotourism land suitability using GIS & AHP: A case study of Masirah Island, Oman. J. Ecotour. 2020, 19, 148–167. [Google Scholar]
  15. Acharya, A.; Mondal, B.K.; Bhadra, T.; Abdelrahman, K.; Mishra, P.K.; Tiwari, A.; Das, R. Geospatial analysis of geo-ecotourism site suitability using AHP and GIS for sustainable and resilient tourism planning in West Bengal, India. Sustainability 2022, 14, 2422. [Google Scholar] [CrossRef]
  16. Fadafan, F.K.; Soffianian, A.; Pourmanafi, S.; Morgan, M. Assessing ecotourism in a mountainous landscape using GIS–MCDA approaches. Appl. Geogr. 2022, 147, 102743. [Google Scholar] [CrossRef]
  17. Quinta-Nova, L.; Ferreira, D. Analysis of the suitability for ecotourism in Beira Baixa region using a spatial decision support system based on a geographical information system. Reg. Sci. Policy Pract. 2024, 16, 12583. [Google Scholar] [CrossRef]
  18. Wong, F.K.; Fung, T. Ecotourism planning in Lantau Island using multiple criteria decision analysis with geographic information system. Environ. Plan. B Plan. Des. 2016, 43, 640–662. [Google Scholar] [CrossRef]
  19. Harishnaika, N.; Arpitha, M.; Ahmed, S.; Ashwini, K. Geospatial investigation of site suitability for ecotourism development using AHP and GIS techniques in Uttara Kannada district, Karnataka state, India. World Dev. Sustain. 2023, 3, 100114. [Google Scholar]
  20. Pathmanandakumar, V.; Goh, H.C.; Chenoli, S.N. Identifying potential zones for ecotourism development in Batticaloa district of Sri Lanka using the GIS-based AHP spatial analysis. GeoJournal Tour. Geosites 2023, 46, 252–261. [Google Scholar] [CrossRef]
  21. Maaiah, B.; Al-Badarneh, M.; Al-Shorman, A. Mapping potential nature based tourism in Jordan using AHP, GIS and remote sensing. J. Ecotour. 2023, 22, 260–280. [Google Scholar] [CrossRef]
  22. Zhang, H.; Gu, C.L.; Gu, L.W.; Zhang, Y. The evaluation of tourism destination competitiveness by TOPSIS & information entropy–A case in the Yangtze River Delta of China. Tour. Manag. 2011, 32, 443–451. [Google Scholar]
  23. Feng, H.; Chen, X.; Heck, P.; Miao, H. An entropy-perspective study on the sustainable development potential of tourism destination ecosystem in Dunhuang, China. Sustainability 2014, 6, 8980–9006. [Google Scholar] [CrossRef]
  24. Liang, X.; Liu, C.; Li, Z. Measurement of scenic spots sustainable capacity based on PCA-entropy TOPSIS: A case study from 30 provinces, China. Int. J. Environ. Res. Public Health 2018, 15, 10. [Google Scholar] [CrossRef] [PubMed]
  25. Xue, H.; Wang, X.; Xu, X. Evaluation of tourism development level of urban agglomeration in the middle reaches of Yangtze River based on entropy weight method. In Proceedings of the 2023 6th International Conference on E-Business, Information Management and Computer Science, Hong Kong, China, 30–31 December 2023; pp. 196–202. [Google Scholar]
  26. Omarzadeh, D.; Pourmoradian, S.; Feizizadeh, B.; Khallaghi, H.; Sharifi, A.; Kamran, K.V. A GIS-based multiple ecotourism sustainability assessment of West Azerbaijan province, Iran. J. Environ. Plan. Manag. 2022, 65, 490–513. [Google Scholar] [CrossRef]
  27. Sobhani, P.; Esmaeilzadeh, H.; Sadeghi, S.M.M.; Marcu, M.V. Estimation of ecotourism carrying capacity for sustainable development of protected areas in Iran. Int. J. Environ. Res. Public Health 2022, 19, 1059. [Google Scholar] [CrossRef] [PubMed]
  28. Salemi, M.; Jozi, S.A.; Malmasi, S.; Rezaian, S. A new model of ecological carrying capacity for developing ecotourism in the protected area of the north karkheh, Iran. J. Indian Soc. Remote Sens. 2019, 47, 1937–1947. [Google Scholar] [CrossRef]
  29. Shaw, A.K. Drivers of animal migration and implications in changing environments. Evol. Ecol. 2016, 30, 991–1007. [Google Scholar] [CrossRef]
  30. Penteriani, V.; López-Bao, J.V.; Bettega, C.; Dalerum, F.; del Mar Delgado, M.; Jerina, K.; Kojola, I.; Krofel, M.; Ordiz, A. Consequences of brown bear viewing tourism: A review. Biol. Conserv. 2017, 206, 169–180. [Google Scholar] [CrossRef]
  31. Macdonald, C.; Gallagher, A.J.; Barnett, A.; Brunnschweiler, J.; Shiffman, D.S.; Hammerschlag, N. Conservation potential of apex predator tourism. Biol. Conserv. 2017, 215, 132–141. [Google Scholar] [CrossRef]
  32. Bai, J.J.; Hou, P.; Zhao, Y.H.; Xu, H.T.; Zhang, B. Research progress of species habitat suitability models and their verification. Chin. J. Ecol. 2022, 41, 1423. [Google Scholar]
  33. Rew, J.; Cho, Y.; Moon, J.; Hwang, E. Habitat suitability estimation using a two-stage ensemble approach. Remote Sens. 2020, 12, 1475. [Google Scholar] [CrossRef]
  34. Mohammadi, A.; Almasieh, K.; Nayeri, D.; Adibi, M.A.; Wan, H.Y. Comparison of habitat suitability and connectivity modelling for three carnivores of conservation concern in an Iranian montane landscape. Landsc. Ecol. 2022, 37, 411–430. [Google Scholar] [CrossRef]
  35. Su, H.; Bista, M.; Li, M. Mapping habitat suitability for Asiatic black bear and red panda in Makalu Barun National Park of Nepal from Maxent and GARP models. Sci. Rep. 2021, 11, 14135. [Google Scholar] [CrossRef] [PubMed]
  36. Naqibzadeh, A.; Sarhangzadeh, J.; Sotoudeh, A.; Mashkour, M.; Thomalsky, J. Habitat Suitability Modeling for Wildlife Management Objectives by Using Maximum Entropy Method. J. Hum. Earth Future 2021, 2, 371–381. [Google Scholar] [CrossRef]
  37. Zvidzai, M.; Mawere, K.K.; N’andu, R.J.; Ndaimani, H.; Zanamwe, C.; Zengeya, F.M. Application of maximum entropy (MaxEnt) to understand the spatial dimension of human–wildlife conflict (HWC) risk in areas adjacent to Gonarezhou National Park of Zimbabwe. Ecol. Soc. 2023, 28, 18. [Google Scholar] [CrossRef]
  38. Anand, V.; Oinam, B.; Singh, I.H. Predicting the current and future potential spatial distribution of endangered Rucervus eldii eldii (Sangai) using MaxEnt model. Environ. Monit. Assess. 2021, 193, 147. [Google Scholar] [CrossRef] [PubMed]
  39. Zhang, X.; Ning, X.; Wang, H.; Zhang, X.; Liu, Y.; Zhang, W. Quantitative assessment of the risk of human activities on landscape fragmentation: A case study of Northeast China Tiger and Leopard National Park. Sci. Total Environ. 2022, 851, 158413. [Google Scholar] [CrossRef]
  40. Yang, H.; Dou, H.; Baniya, R.K.; Han, S.; Guan, Y.; Xie, B.; Zhao, G.; Wang, T.; Mou, P.; Feng, L.; et al. Seasonal food habits and prey selection of Amur tigers and Amur leopards in Northeast China. Sci. Rep. 2018, 8, 6930. [Google Scholar] [CrossRef] [PubMed]
  41. Yang, H.; Zhao, X.; Han, B.; Wang, T.; Mou, P.; Ge, J.; Feng, L. Spatiotemporal patterns of Amur leopards in northeast China: Influence of tigers, prey, and humans. Mamm. Biol. 2018, 92, 120–128. [Google Scholar] [CrossRef]
  42. Qi, J.; Holyoak, M.; Ning, Y.; Jiang, G. Ecological thresholds and large carnivores conservation: Implications for the Amur tiger and leopard in China. Glob. Ecol. Conserv. 2020, 21, e00837. [Google Scholar] [CrossRef]
  43. Notice on Public Solicitation of Opinions on the Master Plan of Northeast Tiger and Leopard National Park (2022–2030) (Draft for Solicitation of Comments). Northeast China Tiger and Leopard National Park Official Website. 24 July 2023. Available online: http://hubaogy.cn/index.php/index/news/show/id/2819.html (accessed on 23 January 2024).
  44. Parker, S.; Khare, A. Understanding success factors for ensuring sustainability in ecotourism development in southern Africa. J. Ecotour. 2005, 4, 32–46. [Google Scholar] [CrossRef]
  45. Rafa, N.; Nuzhat, S.; Uddin, S.M.N.; Gupta, M.; Rakshit, R. Ecotourism as a forest conservation tool: An NDVI analysis of the Sitakunda Botanical Garden and Ecopark in Chattogram, Bangladesh. Sustainability 2021, 13, 12190. [Google Scholar] [CrossRef]
  46. Idris, N.S.; Mustapha, M.A.; Sulaiman, N.; Khamis, S.; Husin, S.M.; Darbis, N.D.A. The dynamics of landscape changes surrounding a firefly ecotourism area. Glob. Ecol. Conserv. 2021, 29, e01741. [Google Scholar] [CrossRef]
  47. Abrehe, S.; Girma, A.; Nigusse, A.G. Potential ecotourism site suitability evaluation for sustainable natural resource management in Kafta Sheraro National Park (KSNP), north-western Tigray, Ethiopia. J. Ecotour. 2021, 20, 341–370. [Google Scholar] [CrossRef]
  48. Ghasemi, M.; Charrahy, Z.; González-García, A. Mapping cultural ecosystem services provision: An integrated model of recreation and ecotourism opportunities. Land Use Policy 2023, 131, 106732. [Google Scholar] [CrossRef]
  49. Chin, C.L.; Moore, S.A.; Wallington, T.J.; Dowling, R.K. Ecotourism in Bako National Park, Borneo: Visitors’ perspectives on environmental impacts and their management. J. Sustain. Tour. 2000, 8, 20–35. [Google Scholar] [CrossRef]
  50. Mafi-Gholami, D.; Nouri-Kamari, A. Environmental impact assessment of ecotourism on mangroves. Int. J. Environ. Monit. Prot. 2018, 5, 24–30. [Google Scholar]
  51. Hornoiu, R.I.; Frâncu, L.G. The Analysis of Climate Change Effects on Ecotourism in Local Communities in Protected Areas. Qual.-Access Success 2015, 16, 71. [Google Scholar]
  52. Ronizi, S.R.A.; Mokarram, M.; Negahban, S. Utilizing multi-criteria decision to determine the best location for the ecotourism in the east and central of Fars province, Iran. Land Use Policy 2020, 99, 105095. [Google Scholar] [CrossRef]
  53. Deason, G.; Seekamp, E.; Terando, A.; Rojas, C. Tourist perceptions of climate change impacts on mountain ecotourism in Southern Mexico. Tour. Hosp. 2023, 4, 451–466. [Google Scholar] [CrossRef]
  54. Goharipour, H.; Hajiluie, M.M. A study on river ecotourism development: Case study: Karaj River. Int. J. Geogr. Geol. 2016, 5, 73–85. [Google Scholar] [CrossRef]
  55. Bunruamkaew, K.; Murayam, Y. Site suitability evaluation for ecotourism using GIS & AHP: A case study of Surat Thani province, Thailand. Procedia-Soc. Behav. Sci. 2011, 21, 269–278. [Google Scholar]
  56. Fung, T.; Wong, F.K. Ecotourism planning using multiple criteria evaluation with GIS. Geocarto Int. 2007, 22, 87–105. [Google Scholar] [CrossRef]
  57. Mallegowda, P.; Rengaian, G.; Krishnan, J.; Niphadkar, M. Assessing habitat quality of forest-corridors through NDVI analysis in dry tropical forests of south India: Implications for conservation. Remote Sens. 2015, 7, 1619–1639. [Google Scholar] [CrossRef]
  58. Mondal, K.; Sankar, K.; Qureshi, Q. Factors influencing the distribution of leopard in a semiarid landscape of Western India. Acta Theriol. 2013, 58, 179–187. [Google Scholar] [CrossRef]
  59. Rather, T.A.; Kumar, S.; Khan, J.A. Multi-scale habitat modelling and predicting change in the distribution of tiger and leopard using random forest algorithm. Sci. Rep. 2020, 10, 11473. [Google Scholar] [CrossRef] [PubMed]
  60. Zhai, Y.; Li, W.; Shi, S.; Gao, Y.; Chen, Y.; Ding, Y. Spatio-temporal dynamics of ecosystem service values in China’s Northeast Tiger-Leopard National Park from 2005 to 2020: Evidence from environmental factors and land use/land cover changes. Ecol. Indic. 2023, 155, 110734. [Google Scholar] [CrossRef]
  61. Asok, V.S.; Sobha, V. Spatial Information Technology as a tool for soil erosion assessment using USLE-A study in the Shendurney Wild Life Sanctuary, South Kerala, India. Int. J. Environ. Sci. 2011, 1, 1978–2003. [Google Scholar]
  62. Joost, R.E. Conservation: Erosion control, soil management and remediation, and effects on wildlife habitat. Tall Fescue Twenty-First Century 2009, 53, 489–507. [Google Scholar]
  63. Baral, K.; Adhikari, B.; Bhandari, S.; Kunwar, R.M.; Sharma, H.P.; Aryal, A.; Ji, W. Impact of climate change on distribution of common leopard (Panthera pardus) and its implication on conservation and conflict in Nepal. Heliyon 2023, 9, e12807. [Google Scholar] [CrossRef] [PubMed]
  64. Sarkar, M.S.; Segu, H.; Bhaskar, J.; Jakher, R.; Mohapatra, S.; Shalini, K.; Shivaji, S.; Reddy, P.A. Ecological preferences of large carnivores in remote, high-altitude protected areas: Insights from Buxa Tiger Reserve, India. Oryx 2018, 52, 66–77. [Google Scholar] [CrossRef]
  65. Zeng, X.H.; Zhang, W.J.; Song, Y.G.; Shen, H.T. Slope aspect and slope position have effects on plant diversity and spatial distribution in the hilly region of Mount Taihang, North China. J. Food Agric. Environ. 2014, 12, 391–397. [Google Scholar]
  66. Khan, M.M.H.; Chivers, D.J. Habitat preferences of tigers Panthera tigris in the Sundarbans East Wildlife Sanctuary, Bangladesh, and management recommendations. Oryx 2007, 41, 463–468. [Google Scholar] [CrossRef]
  67. Miquelle, D.G.; Rozhnov, V.V.; Ermoshin, V.; Murzin, A.A.; Nikolaev, I.G.; Hernandez-Blanco, J.A.; Naidenko, S.V. Identifying ecological corridors for Amur tigers (Panthera tigris altaica) and Amur leopards (Panthera pardus orientalis). Integr. Zool. 2015, 10, 389–402. [Google Scholar] [CrossRef] [PubMed]
  68. Carbone, C.; Gittleman, J.L. A common rule for the scaling of carnivore density. Science 2002, 295, 2273–2276. [Google Scholar] [CrossRef] [PubMed]
  69. Wang, L.; Feng, J.; Mou, P.; Wang, T. Relative abundance of Roe deer (Capreolus pygargus) related to overstory structure and understory food resources in Northeast China. Glob. Ecol. Conserv. 2023, 46, e02542. [Google Scholar] [CrossRef]
  70. Zhang, C.; Li, Q.; Ma, Z.; Wang, Z.; Yu, T. Study on optimization of energy consumption and surface quality of ultrasonic vibration-assisted polishing process based on entropy weight method. J. Clean. Prod. 2024, 442, 140975. [Google Scholar] [CrossRef]
  71. Fujin, T.; Qingshan, M.; Ming, Z.; Zhimin, T. Evaluation of water quality in Xin’anjiang River Basin based on principal component analysis and entropy weight method. Geol. China 2023, 50, 495–505. [Google Scholar]
  72. Zhao, D.; Li, C.; Wang, Q.; Yuan, J. Comprehensive evaluation of national electric power development based on cloud model and entropy method and TOPSIS: A case study in 11 countries. J. Clean. Prod. 2020, 277, 123190. [Google Scholar] [CrossRef]
  73. Li, J.; Chen, Y.; Yao, X.; Chen, A. Risk management priority assessment of heritage sites in China based on entropy weight and TOPSIS. J. Cult. Herit. 2021, 49, 10–18. [Google Scholar] [CrossRef]
  74. Shannon, C.E. A mathematical theory of communication. Bell Syst. Tech. J. 1948, 27, 379–423. [Google Scholar] [CrossRef]
  75. Liu, L.; Zhou, J.; An, X.; Zhang, Y.; Yang, L. Using fuzzy theory and information entropy for water quality assessment in Three Gorges region, China. Expert Syst. Appl. 2010, 37, 2517–2521. [Google Scholar] [CrossRef]
  76. Zhu, Y.; Tian, D.; Yan, F. Effectiveness of entropy weight method in decision-making. Math. Probl. Eng. 2020, 2020, 3564835. [Google Scholar] [CrossRef]
  77. Zou, T.; Guo, P.; Wu, Q. Applying an entropy-weighted TOPSIS method to evaluate energy green consumption revolution progressing of China. Environ. Sci. Pollut. Res. 2023, 30, 42267–42281. [Google Scholar] [CrossRef] [PubMed]
  78. Li, Z.; Luo, Z.; Wang, Y.; Fan, G.; Zhang, J. Suitability evaluation system for the shallow geothermal energy implementation in region by Entropy Weight Method and TOPSIS method. Renew. Energy 2022, 184, 564–576. [Google Scholar] [CrossRef]
  79. Cao, X.; Wei, C.; Xie, D. Evaluation of scale management suitability based on the entropy-TOPSIS method. Land 2021, 10, 416. [Google Scholar] [CrossRef]
  80. Nyimbili, P.H.; Erden, T. A hybrid approach integrating entropy-AHP and GIS for suitability assessment of urban emergency facilities. ISPRS Int. J. Geo-Inf. 2020, 9, 419. [Google Scholar] [CrossRef]
  81. Li, Y.; Li, M.; Li, C.; Liu, Z. Optimized maxent model predictions of climate change impacts on the suitable distribution of cunninghamia lanceolata in China. Forests 2020, 11, 302. [Google Scholar] [CrossRef]
  82. Jaynes, E.T. Information theory and statistical mechanics. Phys. Rev. 1957, 106, 620. [Google Scholar] [CrossRef]
  83. Berrill, J.; Davis, R. Maximum entropy and the magnitude distribution. Bull. Seismol. Soc. Am. 1980, 70, 1823–1831. [Google Scholar]
  84. Baldwin, R.A. Use of maximum entropy modeling in wildlife research. Entropy 2009, 11, 854–866. [Google Scholar] [CrossRef]
  85. Phillips, S.J.; Anderson, R.P.; Schapire, R.E. Maximum entropy modeling of species geographic distributions. Ecol. Model. 2006, 190, 231–259. [Google Scholar] [CrossRef]
  86. Yuan, H.S.; Wei, Y.L.; Wang, X.G. Maxent modeling for predicting the potential distribution of Sanghuang, an important group of medicinal fungi in China. Fungal Ecol. 2015, 17, 140–145. [Google Scholar] [CrossRef]
  87. Zhao, Y.; Deng, X.; Xiang, W.; Chen, L.; Ouyang, S. Predicting potential suitable habitats of Chinese fir under current and future climatic scenarios based on Maxent model. Ecol. Inform. 2021, 64, 101393. [Google Scholar] [CrossRef]
  88. Wei, B.; Wang, R.; Hou, K.; Wang, X.; Wu, W. Predicting the current and future cultivation regions of Carthamus tinctorius L. using MaxEnt model under climate change in China. Glob. Ecol. Conserv. 2018, 16, e00477. [Google Scholar] [CrossRef]
  89. Zhao, J.; Yu, W.; He, K.; Zhao, K.; Zhou, C.; Wright, J.A.; Li, F. Evaluating the urban-rural differences in the environmental factors affecting amphibian roadkill. Sustainability 2023, 15, 6051. [Google Scholar] [CrossRef]
  90. Brown, C.E. Coefficient of variation. In Applied Multivariate Statistics in Geohydrology and Related Sciences; Springer: Berlin/Heidelberg, Germany, 1998; pp. 155–157. [Google Scholar]
  91. Bowman, D.T. Common use of the CV: A statistical aberration in crop performance trials (Contemporary Issue). J. Cotton Sci. 2001, 5, 137–141. [Google Scholar]
  92. Barde, M.P.; Barde, P.J. What to use to express the variability of data: Standard deviation or standard error of mean? Perspect. Clin. Res. 2012, 3, 113–116. [Google Scholar] [CrossRef] [PubMed]
  93. Canteiro, M.; Córdova-Tapia, F.; Brazeiro, A. Tourism impact assessment: A tool to evaluate the environmental impacts of touristic activities in Natural Protected Areas. Tour. Manag. Perspect. 2018, 28, 220–227. [Google Scholar] [CrossRef]
  94. Zabihi, H.; Alizadeh, M.; Wolf, I.D.; Karami, M.; Ahmad, A.; Salamian, H. A GIS-based fuzzy-analytic hierarchy process (F-AHP) for ecotourism suitability decision making: A case study of Babol in Iran. Tour. Manag. Perspect. 2020, 36, 100726. [Google Scholar] [CrossRef]
  95. Caro, T.; Engilis, A., Jr.; Fitzherbert, E.; Gardner, T. Preliminary assessment of the flagship species concept at a small scale. In Animal Conservation Forum; Cambridge University Press: Cambridge, UK, 2004; Volume 7, pp. 63–70. [Google Scholar]
  96. Patel, S.K.; Ruhela, S.; Biswas, S.; Bhatt, S.; Pandav, B.; Mondol, S. The cost of sympatry: Spatio-temporal patterns in leopard dietary and physiological responses to tiger competition gradient in Rajaji Tiger Reserve, Uttarakhand, India. Conserv. Physiol. 2023, 11, coad039. [Google Scholar] [CrossRef] [PubMed]
  97. Jepson, P.; Barua, M. A theory of flagship species action. Conserv. Soc. 2015, 13, 95–104. [Google Scholar] [CrossRef]
Figure 1. Location map of the study area.
Land 13 01269 g001
Figure 2. The overall workflow of the research methodology.
Land 13 01269 g002
Figure 3. Criteria maps of the study area: (a) NDVI; (b) Land Use Classes; (c) Soil Erosion; (d) Temperature; (e) Precipitation; (f) Distance to Rivers; (g) Elevation; (h) Slope; (i) Aspect; (j) Distance to Roads; (k) Distance to Villages; (l) Distance to Tourist Attractions.
Land 13 01269 g003
Figure 4. Density maps of the prey species: (a) line transect sampling distribution (2017–2019); (b) Density of Wild Boars; (c) Density of Roe Deer.
Land 13 01269 g004
Figure 5. Comprehensive suitability zoning criteria of ecotourism based on TLH suitability and ecotourism suitability.
Land 13 01269 g005
Figure 6. Ecotourism suitability map for the NCTLNP.
Land 13 01269 g006
Figure 7. The ROC curve of the MaxEnt prediction.
Land 13 01269 g007
Figure 8. Jackknife test of the variable importance.
Land 13 01269 g008
Figure 9. The response curves of the major variables: (a) Density of Wild Boars; (b) Temperature; (c) Density of Roe Deer.
Land 13 01269 g009
Figure 10. Tiger and leopard habitat suitability map for the NCTLNP: (a) logistic prediction and (b) the Natural Breaks classification.
Land 13 01269 g010
Figure 11. Comprehensive suitability map for the NCTLNP.
Land 13 01269 g011
Table 1. Criteria selection for ecotourism suitability.
FactorsCriteriaDescriptionPositive (+) or Negative (−)
Environmental factors (Aa)NDVI (Aa1)Indicates the density and health of vegetation.+
Land Use Classes (Aa2)Describes the type of land cover.User-defined *
Soil Erosion (Aa3)/(t/(ha·y))Higher erosion areas are more sensitive to tourism.
Temperature (Aa4)/°CAffects the comfort and seasonality of tourist activities.+
Precipitation (Aa5)/mmHigher rainfall levels facilitate vegetation development.+
Distance to Rivers (Aa6)/mProximity to rivers enhances a location’s attractiveness through water-based activities and scenic value.
Topography factors (Ab)Elevation (Ab1)/mLower elevations are more accessible.
Slope (Ab2)/°Steeper slopes decrease tourism safety.
Aspect (Ab3)Plants on sun-facing slopes generally grow better.User-defined *
Tourism development factors (Ac)Distance to Roads (Ac1)/mCloser proximity to roads increases accessibility.
Distance to Villages (Ac2)/mProximity to local communities enhances cultural experiences and support services for ecotourism.
Distance to Tourist Attractions (Ac3)/mCloser proximity to existing attractions benefits tourism development.
* represents categorical data, which will be processed into positive continuous data. The transformation process is detailed in Appendix A.
Table 2. Criteria selection for TLH suitability.
FactorsCriteriaDescription
Environmental factors (Ba)NDVI (Ba1)Higher NDVI values suggest denser vegetation.
Land Use Classes (Ba2)Identifies the types of land use.
Soil Erosion (Ba3)/(t/(ha·y))Indicates the rate of soil loss, impacting the vegetation and water quality that is crucial for wildlife.
Temperature (Ba4)/°CAffects the species’ range and behavior.
Precipitation (Ba5)/mmAdequate rainfall supports lush vegetation.
Distance to Rivers (Ba6)/mProximity to rivers offers vital water resources and fosters diverse vegetation.
Topography factors (Bb)Elevation (Bb1)/mAffects climate, vegetation type, and prey availability.
Slope (Bb2)/°Steeper slopes may limit accessibility for both the predators and their prey.
Aspect (Bb3)Determines sunlight exposure, shaping prey distribution for tigers and leopards.
Human disturbance factors (Bc)Distance to Roads (Bc1)/mRoads increase human disturbance.
Distance to Villages (Bc2)/mVillages can increase human–wildlife conflicts and disturbance.
Prey species factors (Bd)Density of Wild Boars (Bd1)/(individuals/km2)Wild boar are primary prey for tigers and leopards.
Density of Roe Deer (Bd2)/(individuals/km2)Roe deer are essential prey for tigers and leopards.
Table 3. List of the criteria and their sources.
CriteriaSourceLink *Resolution
NDVINASA’s Earthdata Search (2022)ladsweb.modaps.eosdis.nasa.gov30 m
Land Use ClassesGlobeland30 (2020)www.webmap.cn/mapDataAction.do?method=globalLandCover30 m
Soil ErosionChina Science Data Bank (2020)www.scidb.cn250 m
TemperatureNational Earth System Science Data Center (2022)www.geodata.cn1000 m
PrecipitationNational Earth System Science Data Center (2022)www.geodata.cn1000 m
Distance to RiversChina’s 1:1,000,000 Basic Geographic Information Data (2015)www.webmap.cn100 m
ElevationCopernicus DEM GLO30 (2015)panda.copernicus.eu/panda30 m
SlopeCopernicus DEM GLO30 (2015)panda.copernicus.eu/panda30 m
AspectCopernicus DEM GLO30 (2015)panda.copernicus.eu/panda30 m
Distance to RoadsGaode Map (2020)www.amap.com100 m
Distance to VillagesNational Bureau of Statistics of China (2020)www.stats.gov.cn100 m
Distance to Tourist AttractionsNCTLNP Administration (2020)Local dataset250 m
Density of Wild BoarsNCTLNP Administration (2020)Local dataset250 m
Density of Roe DeerNCTLNP Administration (2020)Local dataset250 m
Tiger and Leopard Track SitesNCTLNP Administration (2020)Local dataset250 m
* All links were accessed on 30 January 2024.
Table 4. Entropy weights of ecotourism suitability criteria and normalized criteria statistics.
CriteriaWeightRankMeanStandard Deviation (SD)Coefficient of Variation (CV) * (%)
NDVI (Aa1)0.0011120.93220.02973.19
Land Use Classes (Aa2)0.0181100.97400.130213.36
Soil Erosion (Aa3)0.0126110.93790.06817.26
Temperature (Aa4)0.081340.44550.144732.48
Precipitation (Aa5)0.260310.37300.203154.47
Distance to Rivers (Aa6)0.060070.75840.178623.55
Elevation (Ab1)0.036790.59080.128621.76
Slope (Ab2)0.045480.73060.151620.75
Aspect (Ab3)0.232320.54860.277250.53
Distance to Roads (Ac1)0.077560.74960.197326.32
Distance to Villages (Ac2)0.081150.66190.185828.07
Distance to Tourist Attractions (Ac3)0.093530.66860.201430.13
* The coefficient of variation (CV) is calculated as follows: CV = SD Mean × 100 % .
Table 5. Ecotourism suitability class.
Ecotourism Suitability Map ClassArea/km2Proportion/%
High suitability3765.31327.08
Medium suitability6103.62543.90
Low suitability4034.87529.02
Table 6. Contributions of the variables to the MaxEnt model.
VariablePercent Contribution/%VariablePercent Contribution/%
Density of Wild Boars29.3Aspect4.5
Temperature18.6Distance to Road4.2
Density of Roe Deer12Slope3.9
Soil Erosion6.1Elevation2.3
Precipitation5.5Land Use Classes2.1
Distance to Rivers5NDVI1.8
Distance to Villages4.8
Table 7. Tiger and leopard habitat suitability classes.
TLH Suitability Map ClassArea/km2Proportion/%
High suitability1716.68812.73
Medium suitability2718.68820.15
Low suitability9053.75067.12
Table 8. Comprehensive suitability classes.
Comprehensive Suitability Map ClassArea/km2Proportion/%
Very high suitability6152.56345.62
High suitability3806.50028.23
Medium suitability1811.31313.43
Low suitability1487.81311.03
Unsuitable228.0631.69
Disclaimer/Publisher’s Note: The statements, opinions and data contained in all publications are solely those of the individual author(s) and contributor(s) and not of MDPI and/or the editor(s). MDPI and/or the editor(s) disclaim responsibility for any injury to people or property resulting from any ideas, methods, instructions or products referred to in the content.

