
Driving Forces behind the Reduction in Cropland Area on Hainan Island, China: Implications for Sustainable Agricultural Development
Abstract
:1. Introduction
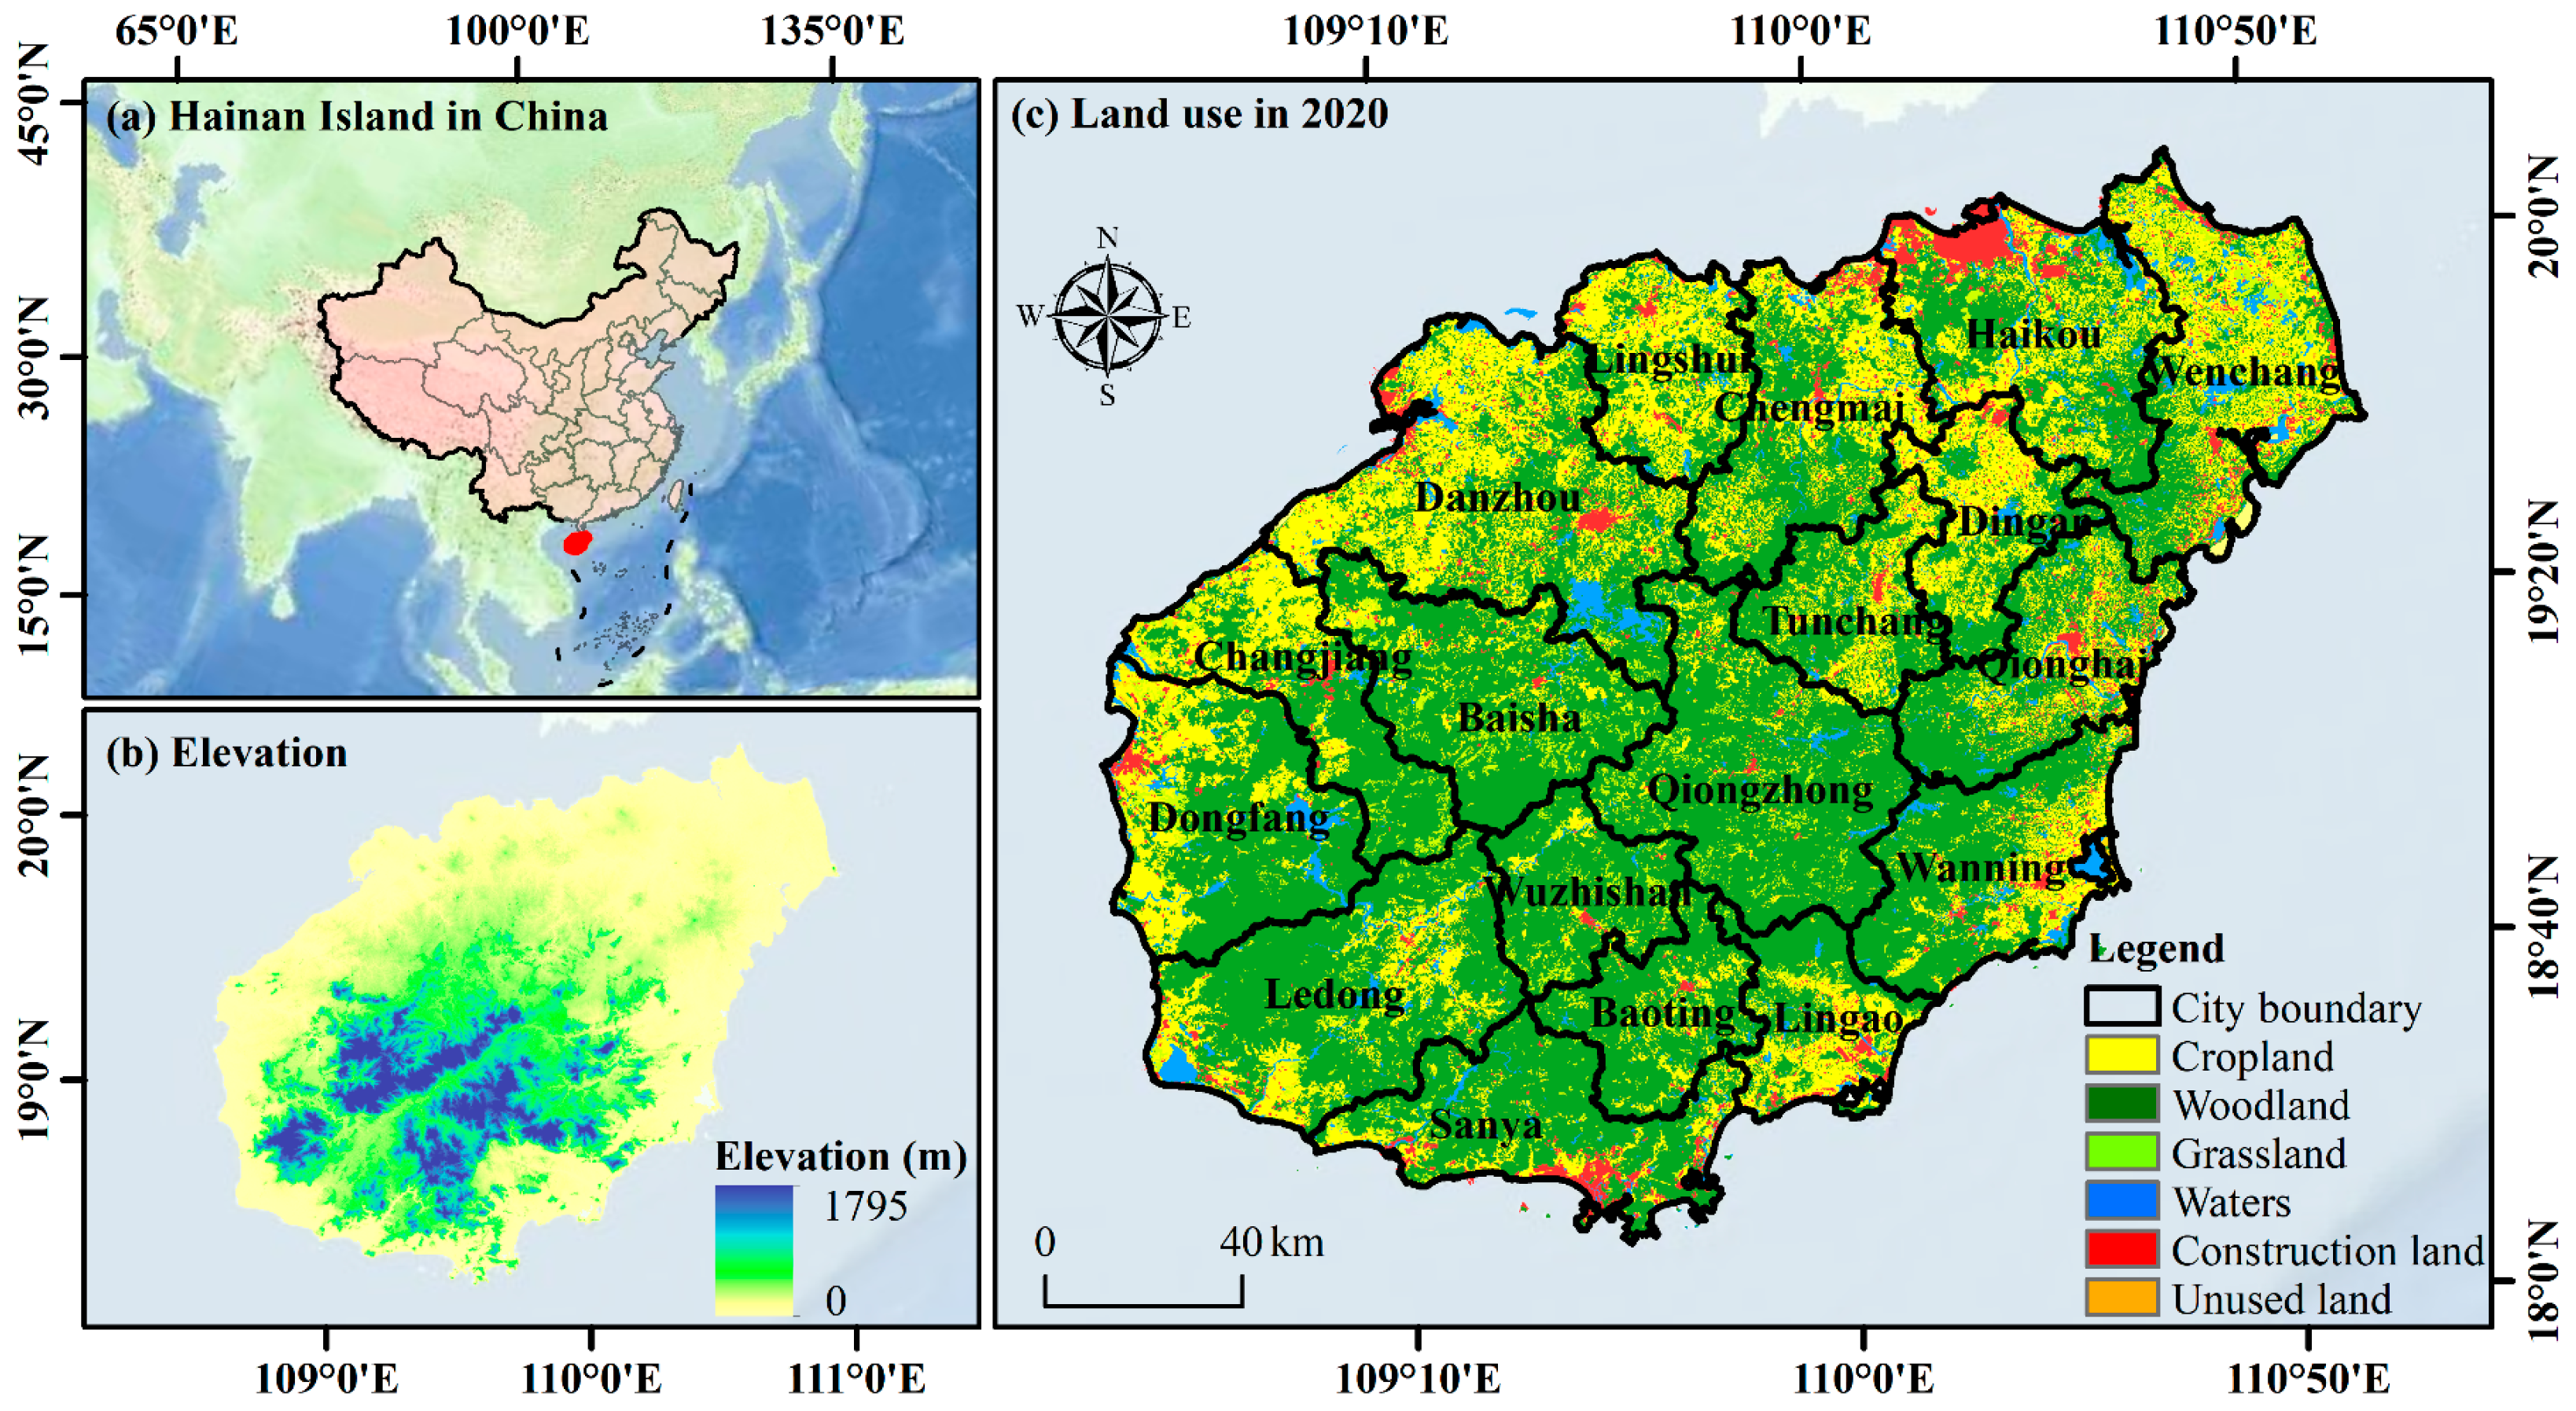
2. Study Area
3. Date Sources and Methods
3.1. Data Sources
3.2. Methods
3.2.1. Center-of-Gravity and Standard-Deviation Ellipse Models
3.2.2. Kernel Density Analysis
3.2.3. XGBoost
3.2.4. SHapley Additive exPlanations
3.2.5. GeoSOS-FLUS Model
4. Results and Analysis
4.1. Land Use Change on Hainan Island
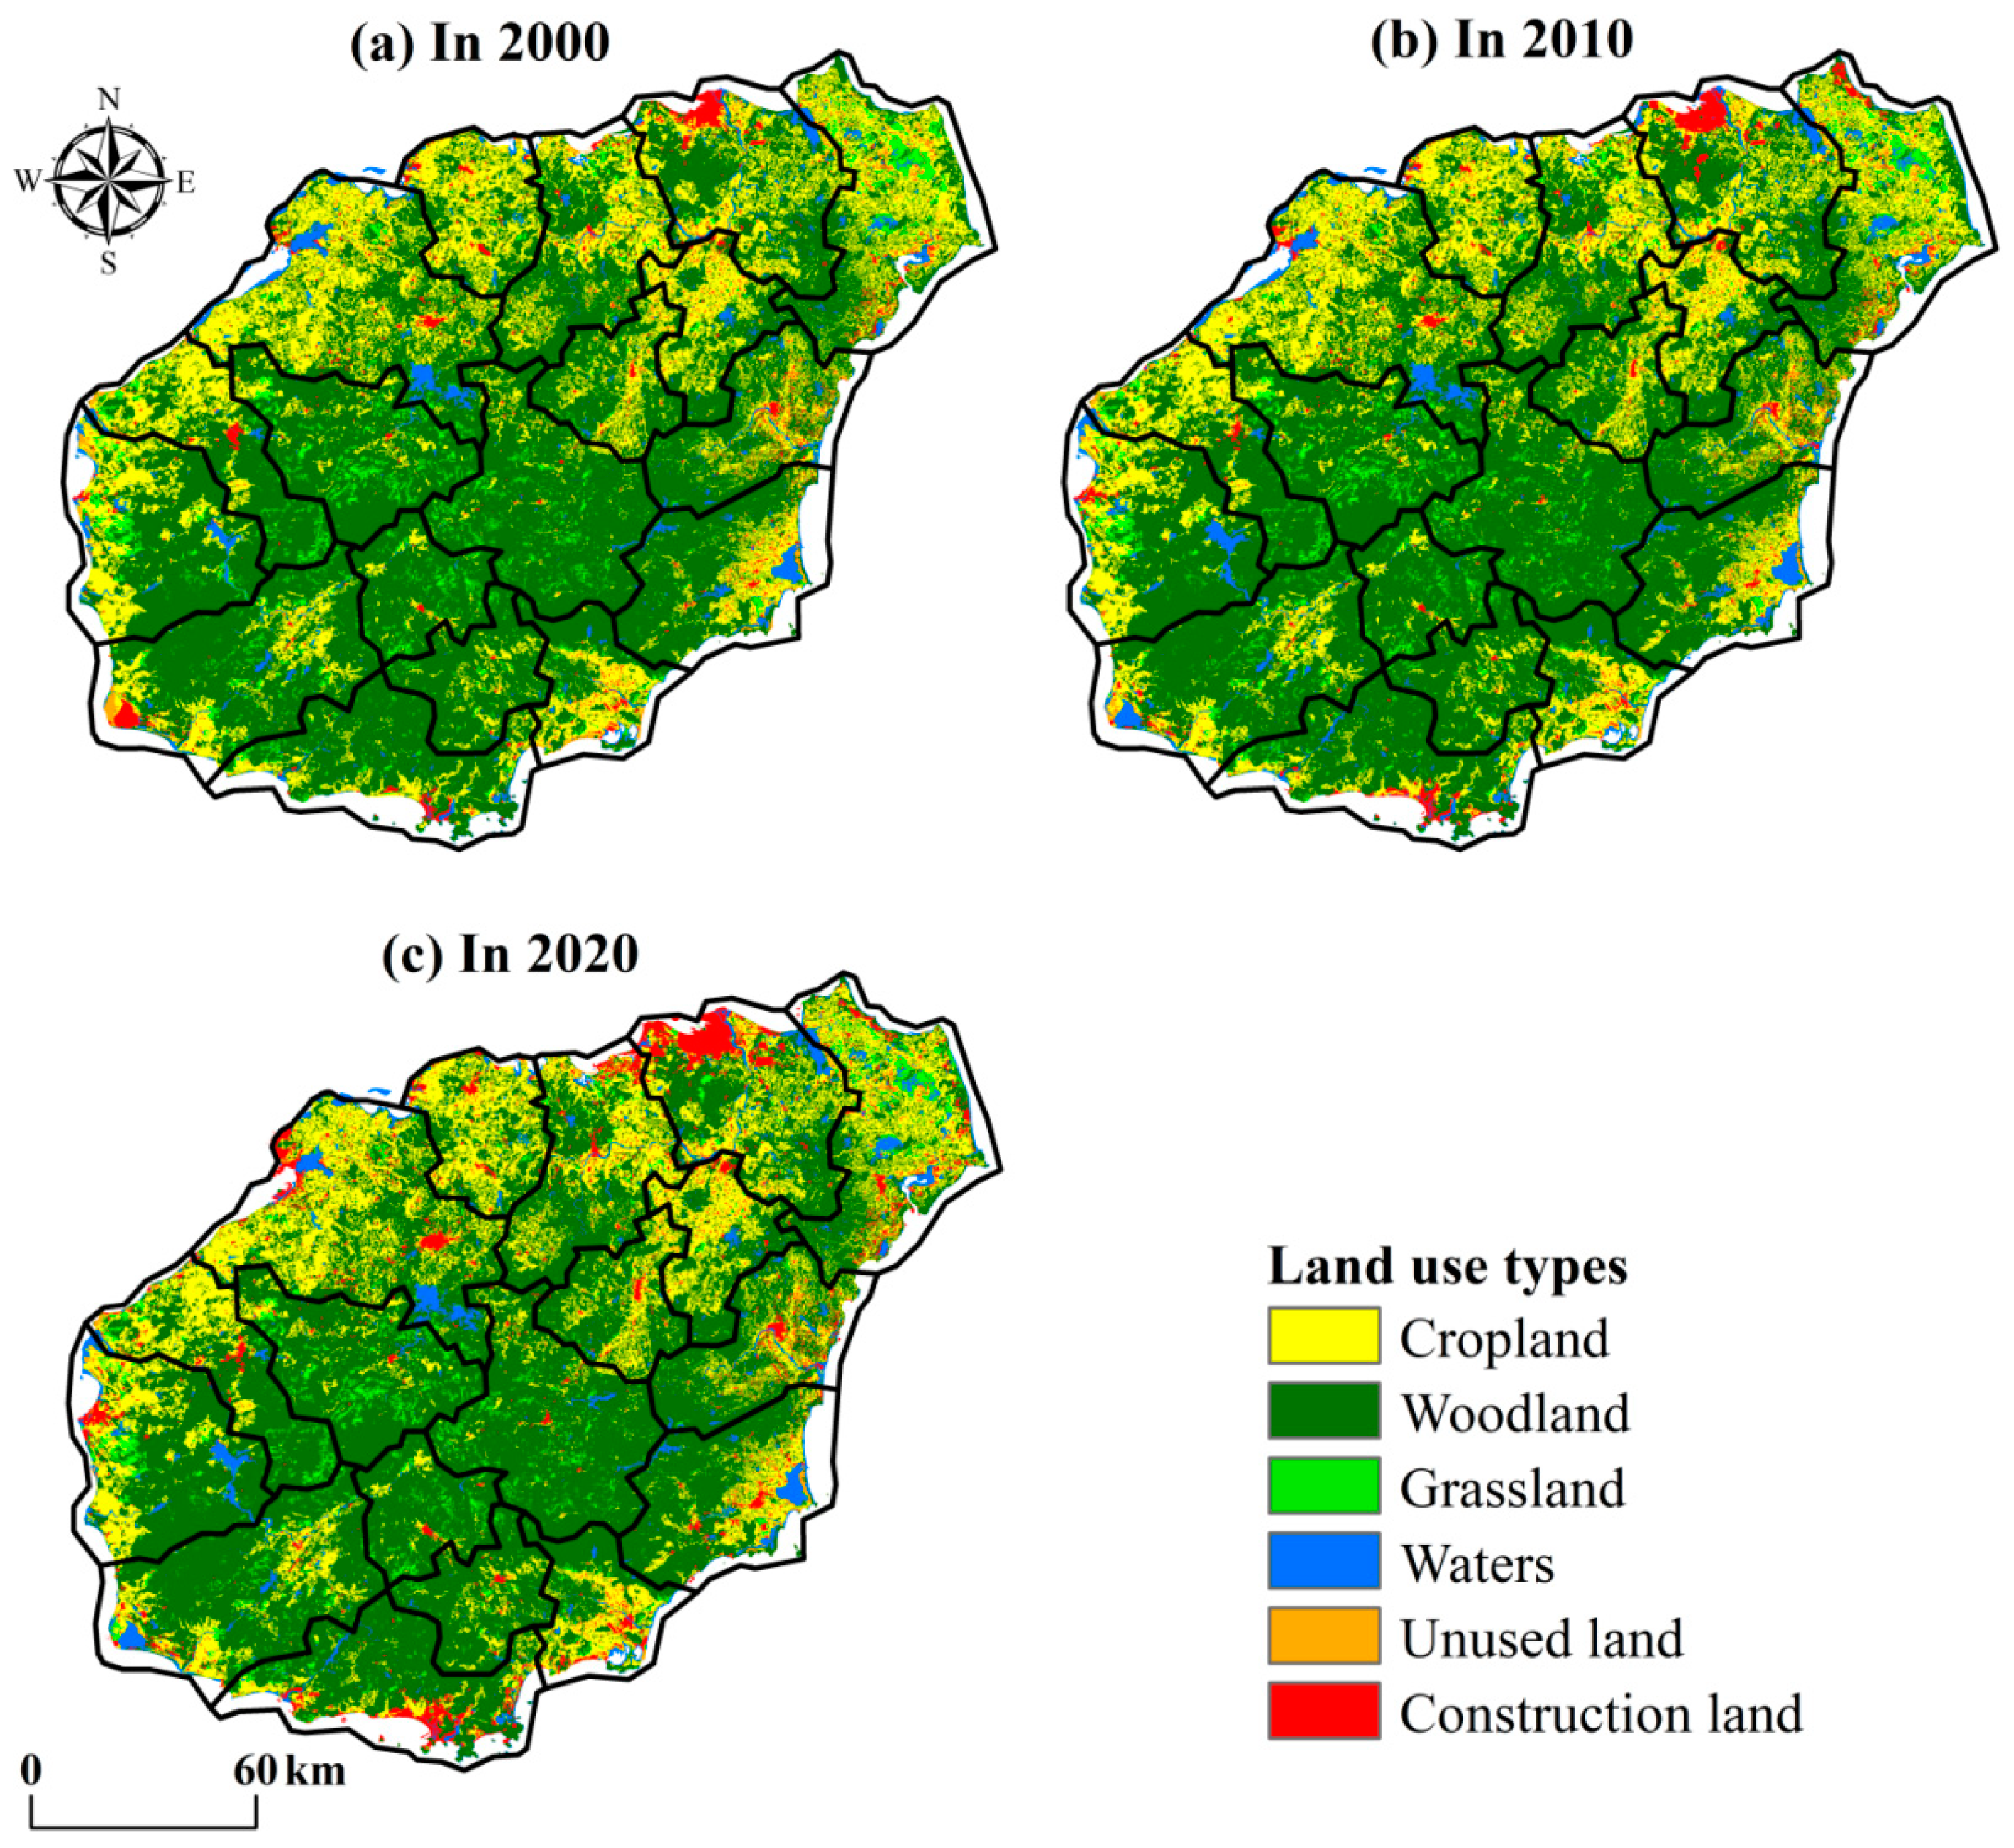
4.1.1. Characteristics of Land Use Change
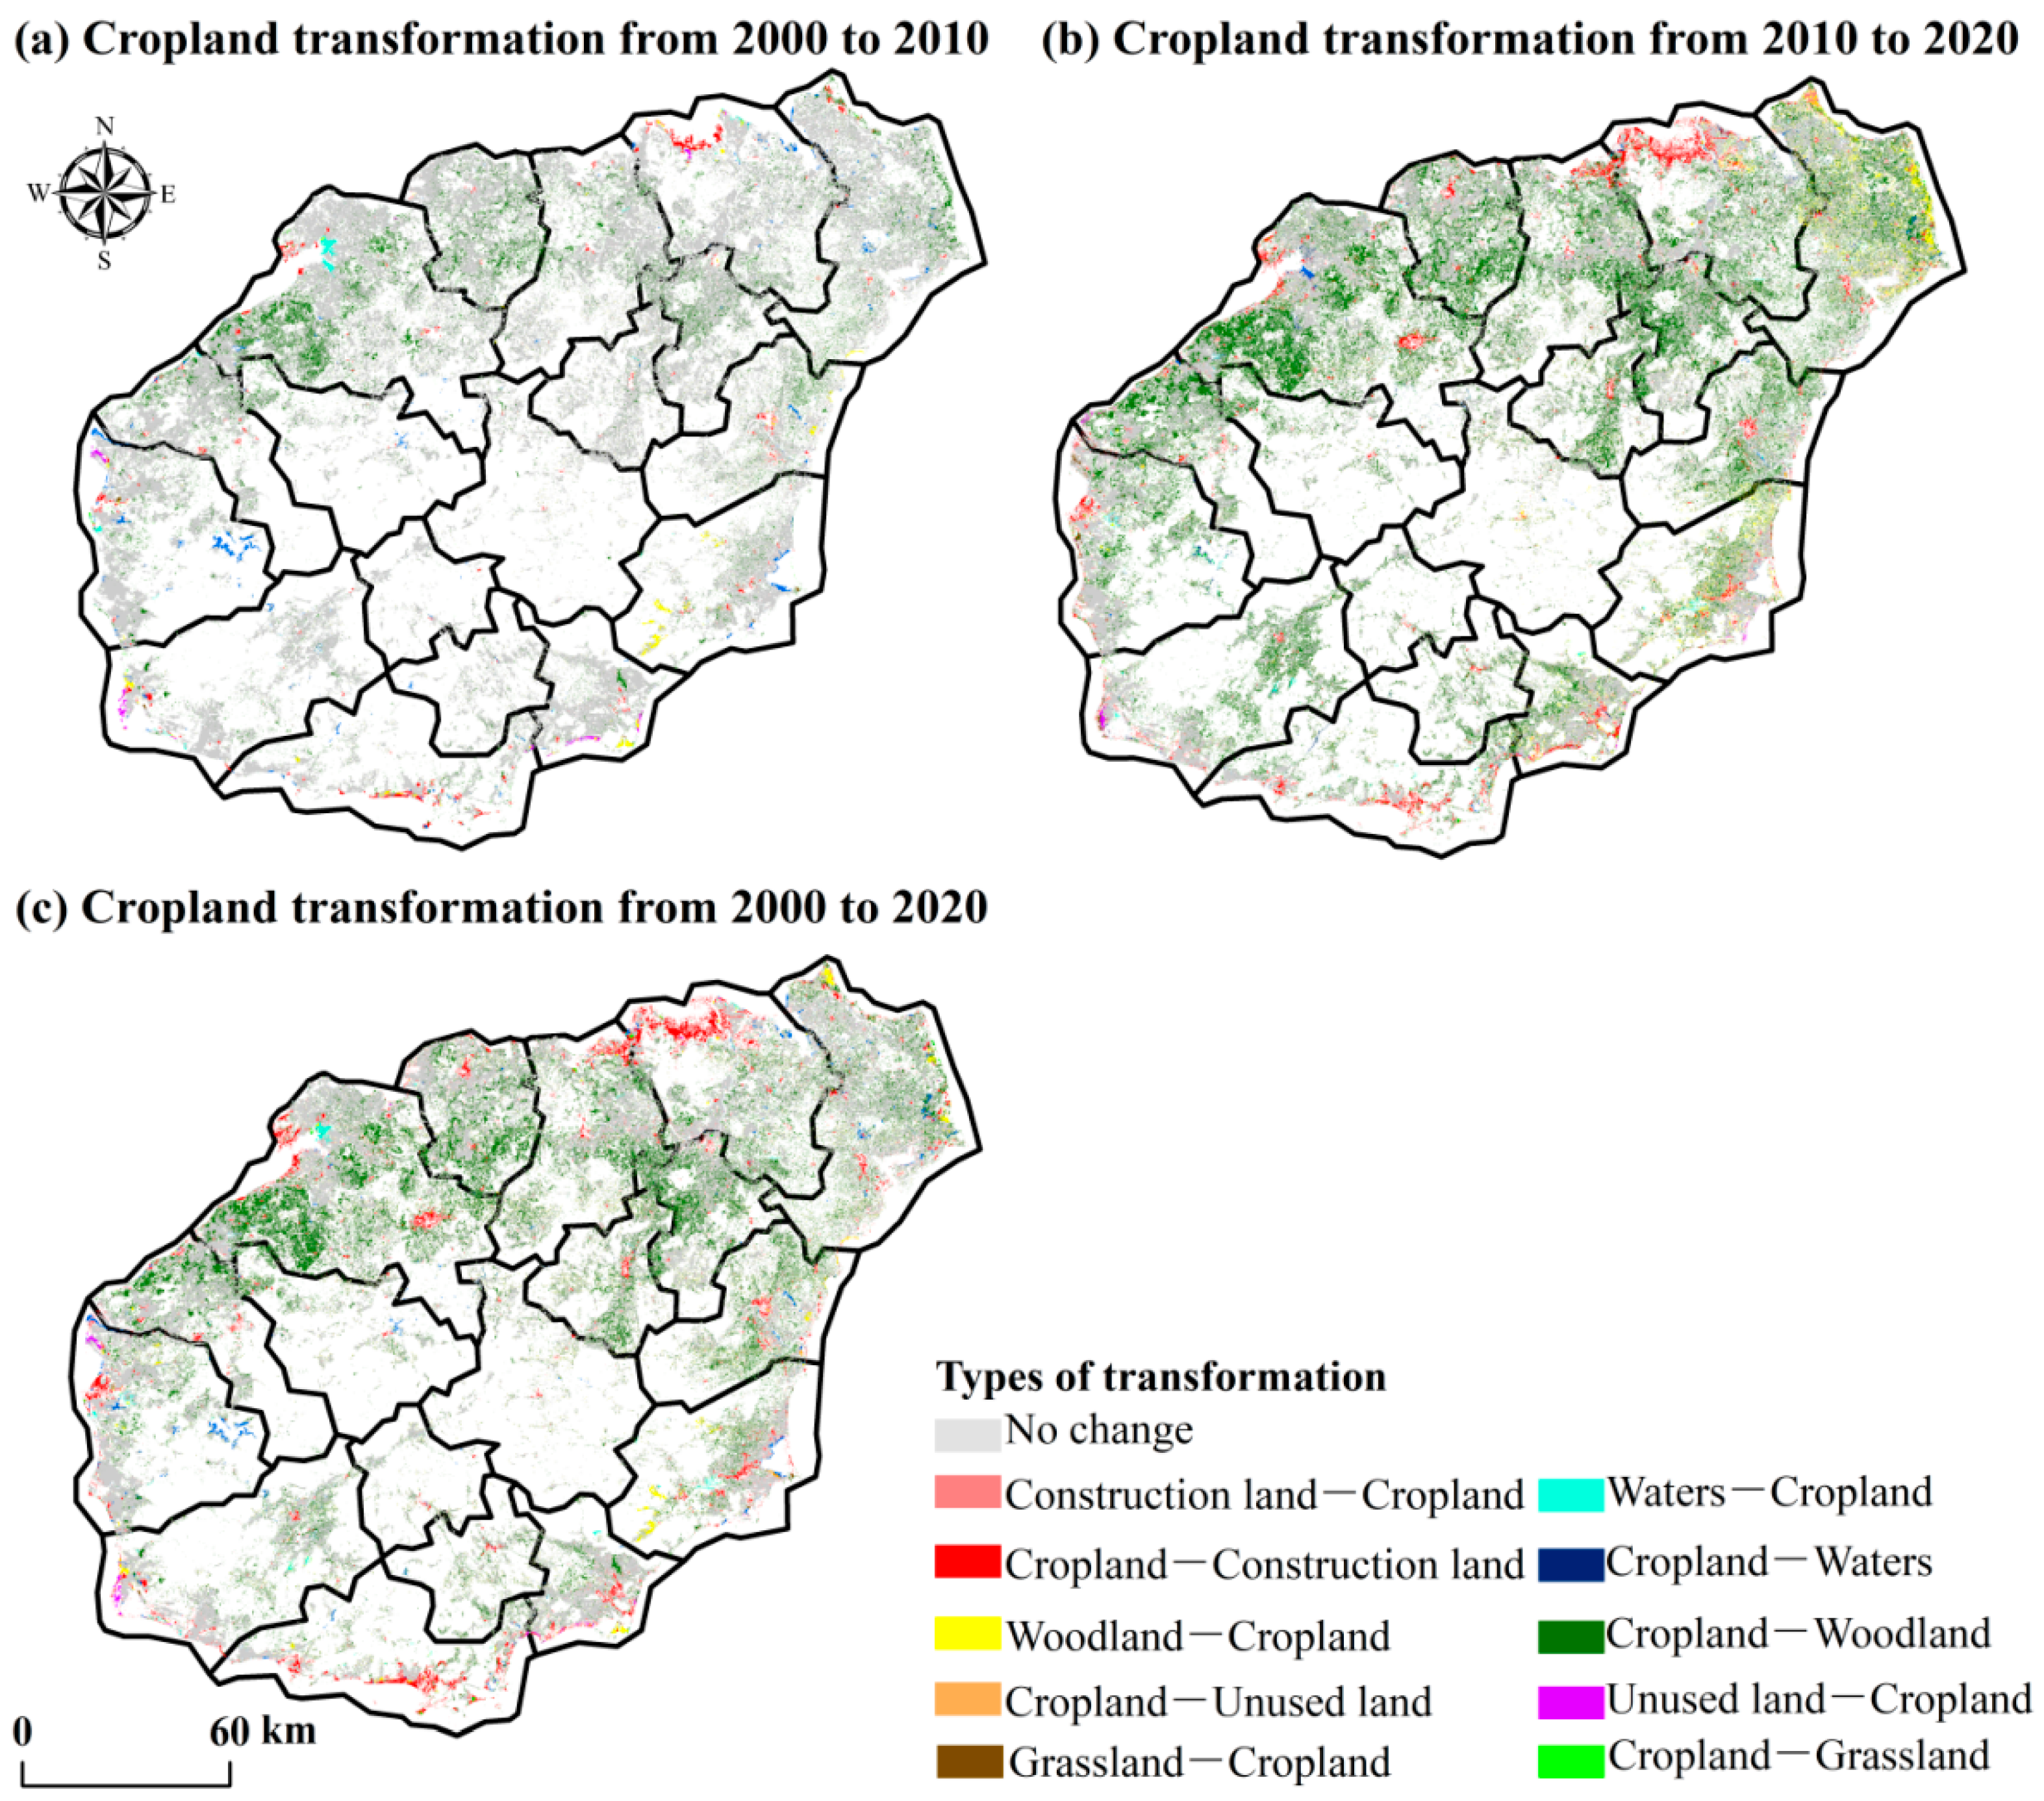
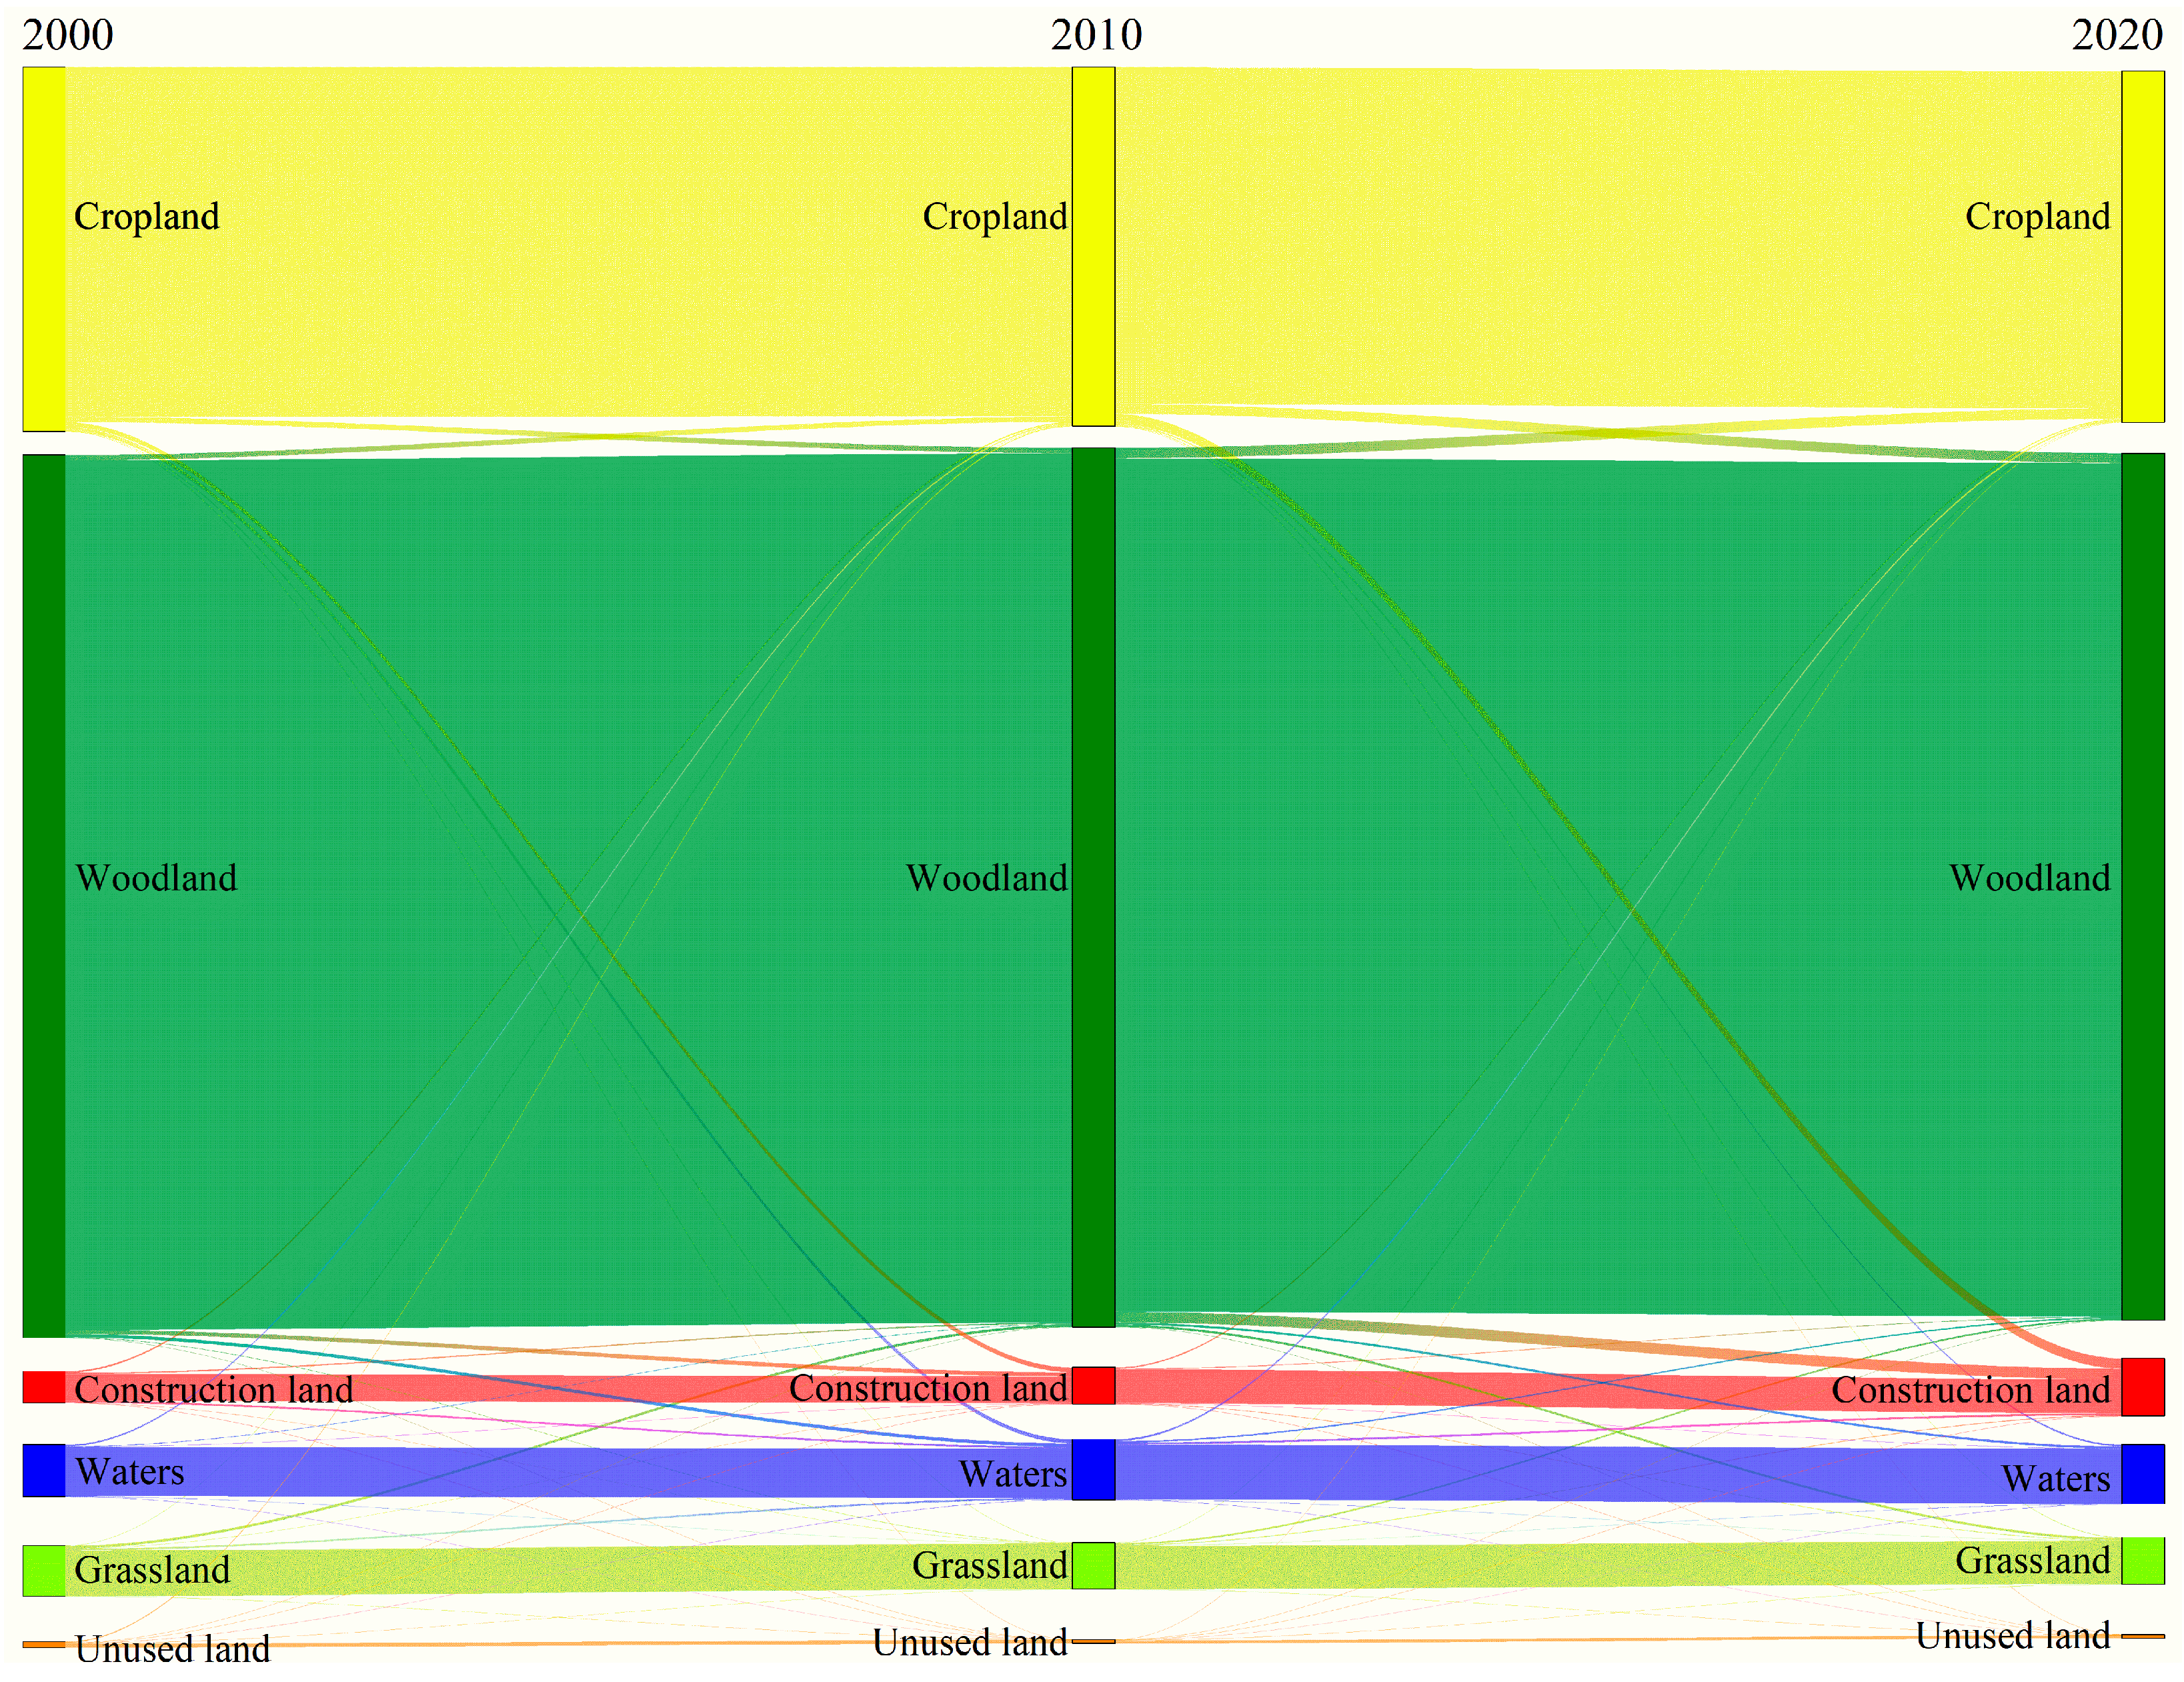
4.1.2. Trajectory of Land Use Changes
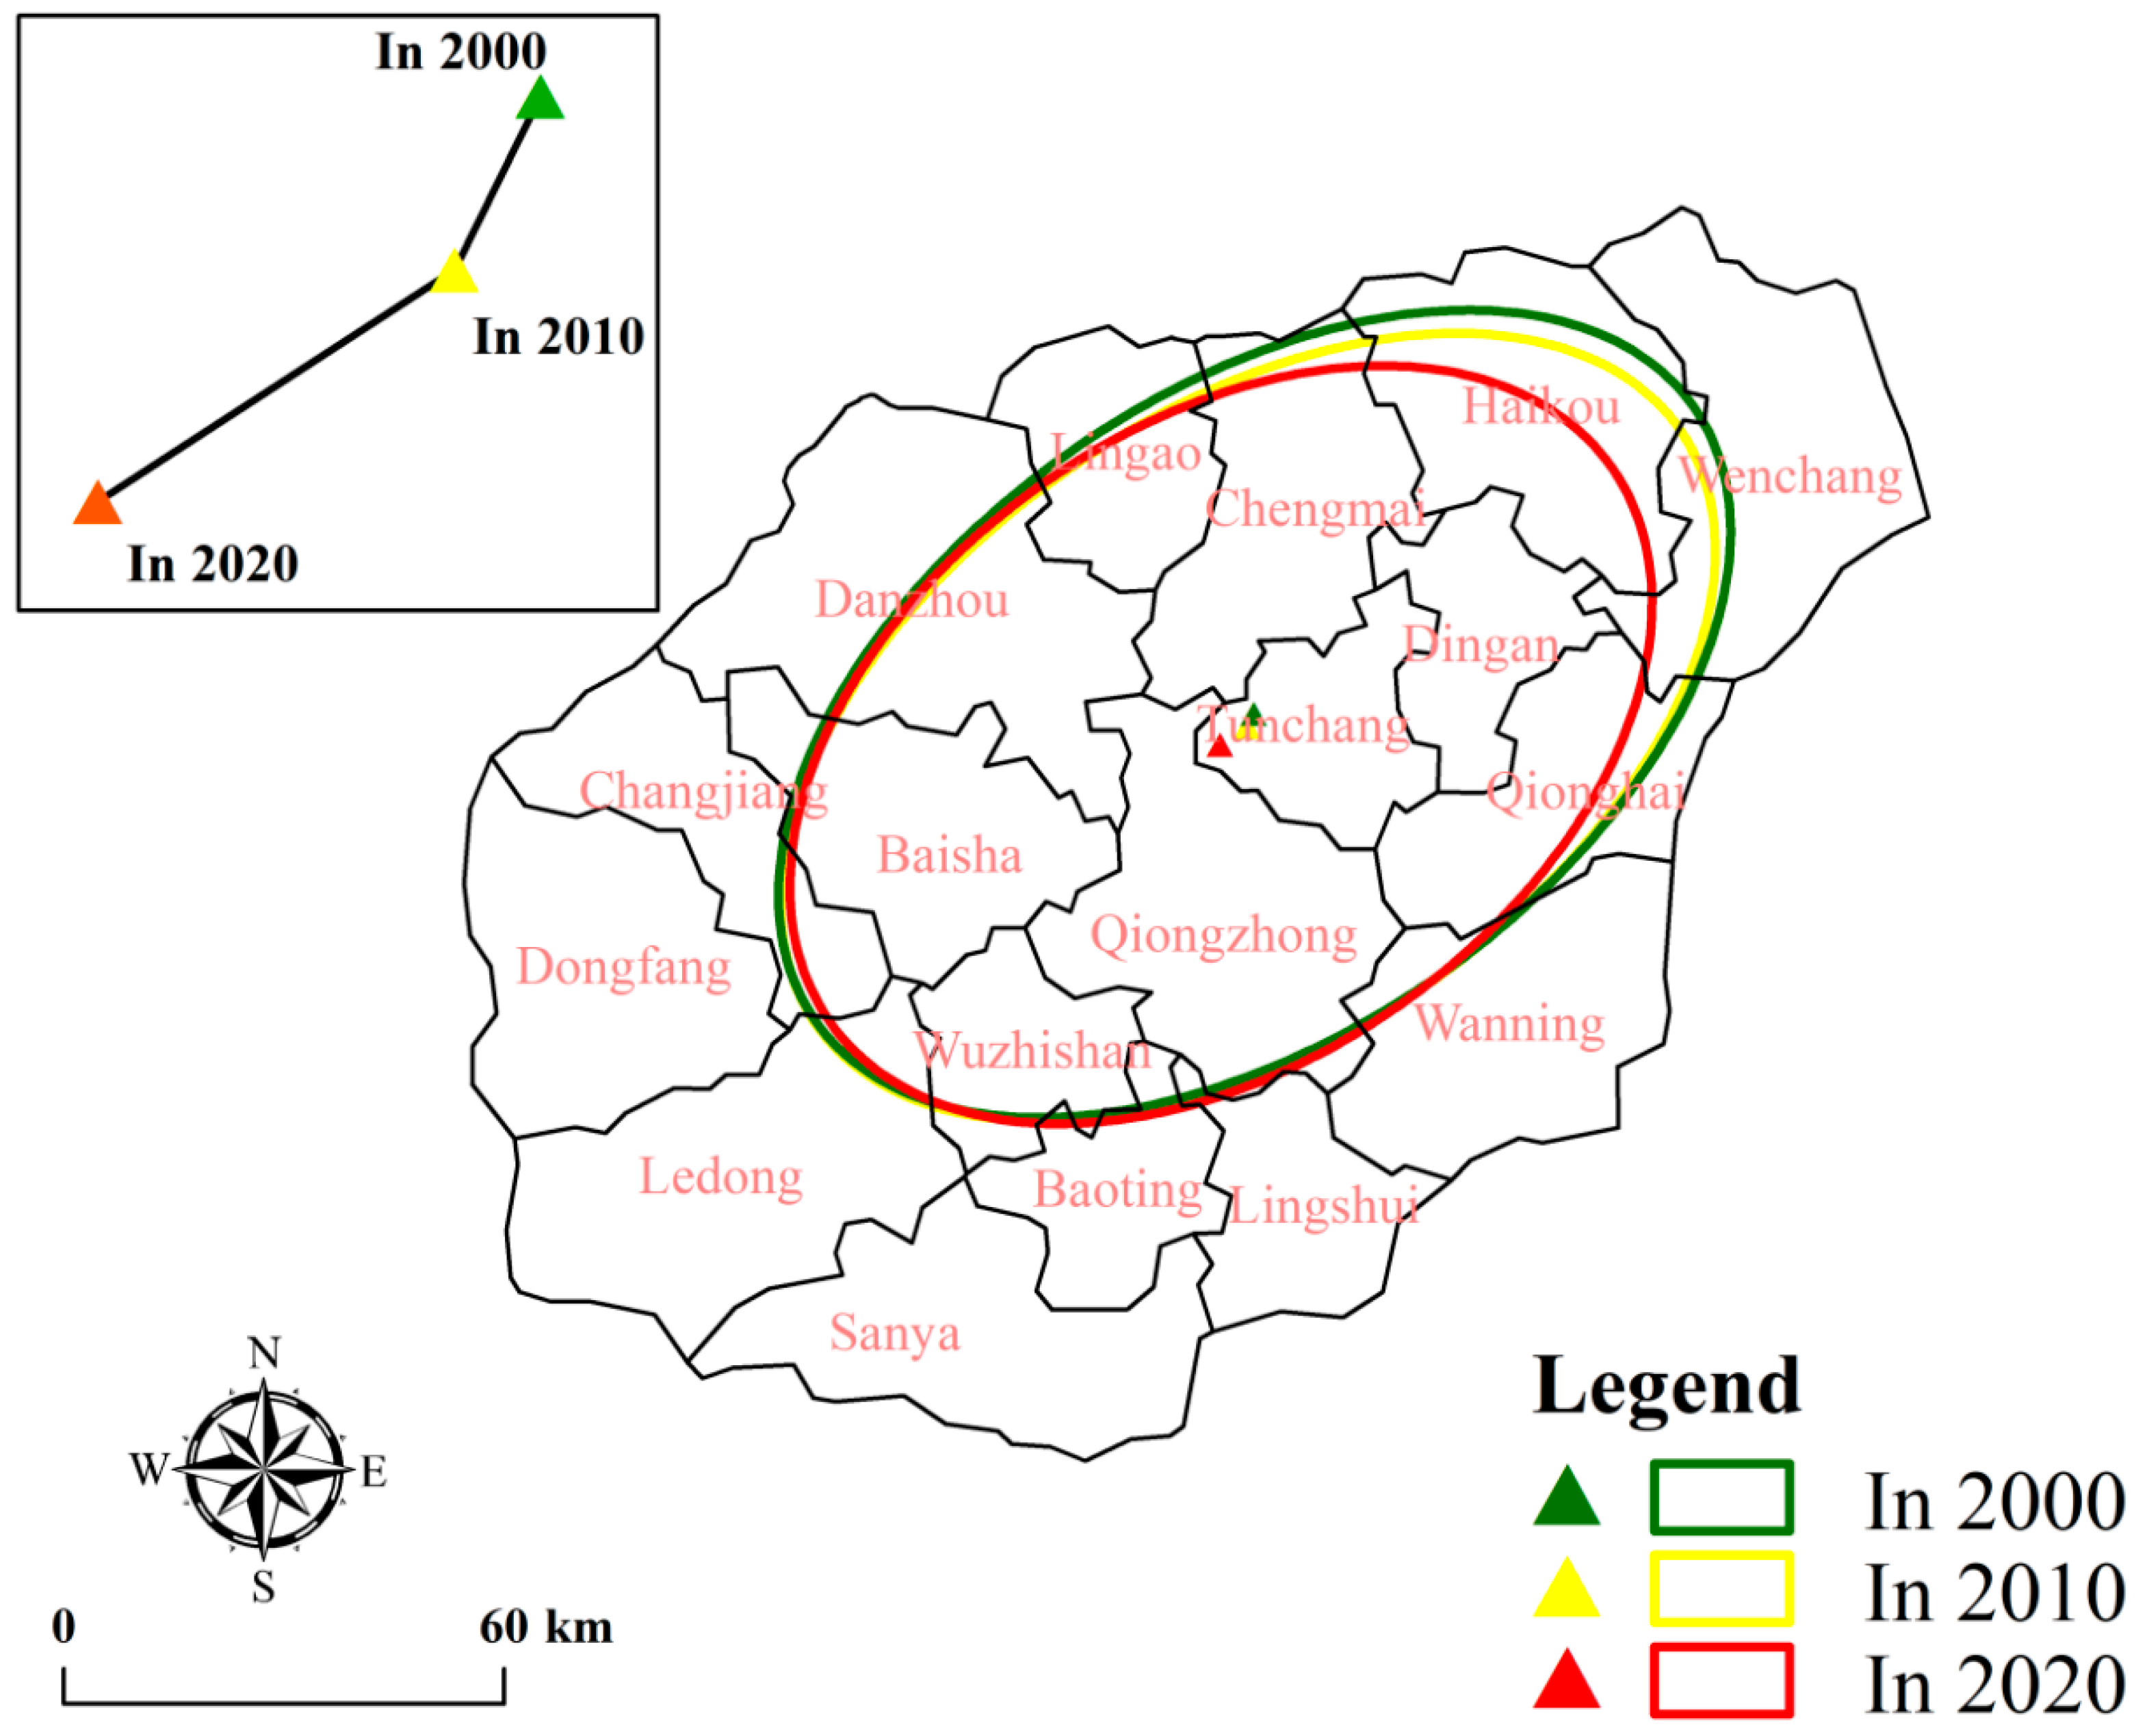
4.1.3. Center-of-Gravity and Standard-Deviation Ellipse Change in Cropland
4.2. Kernel Density of Cropland
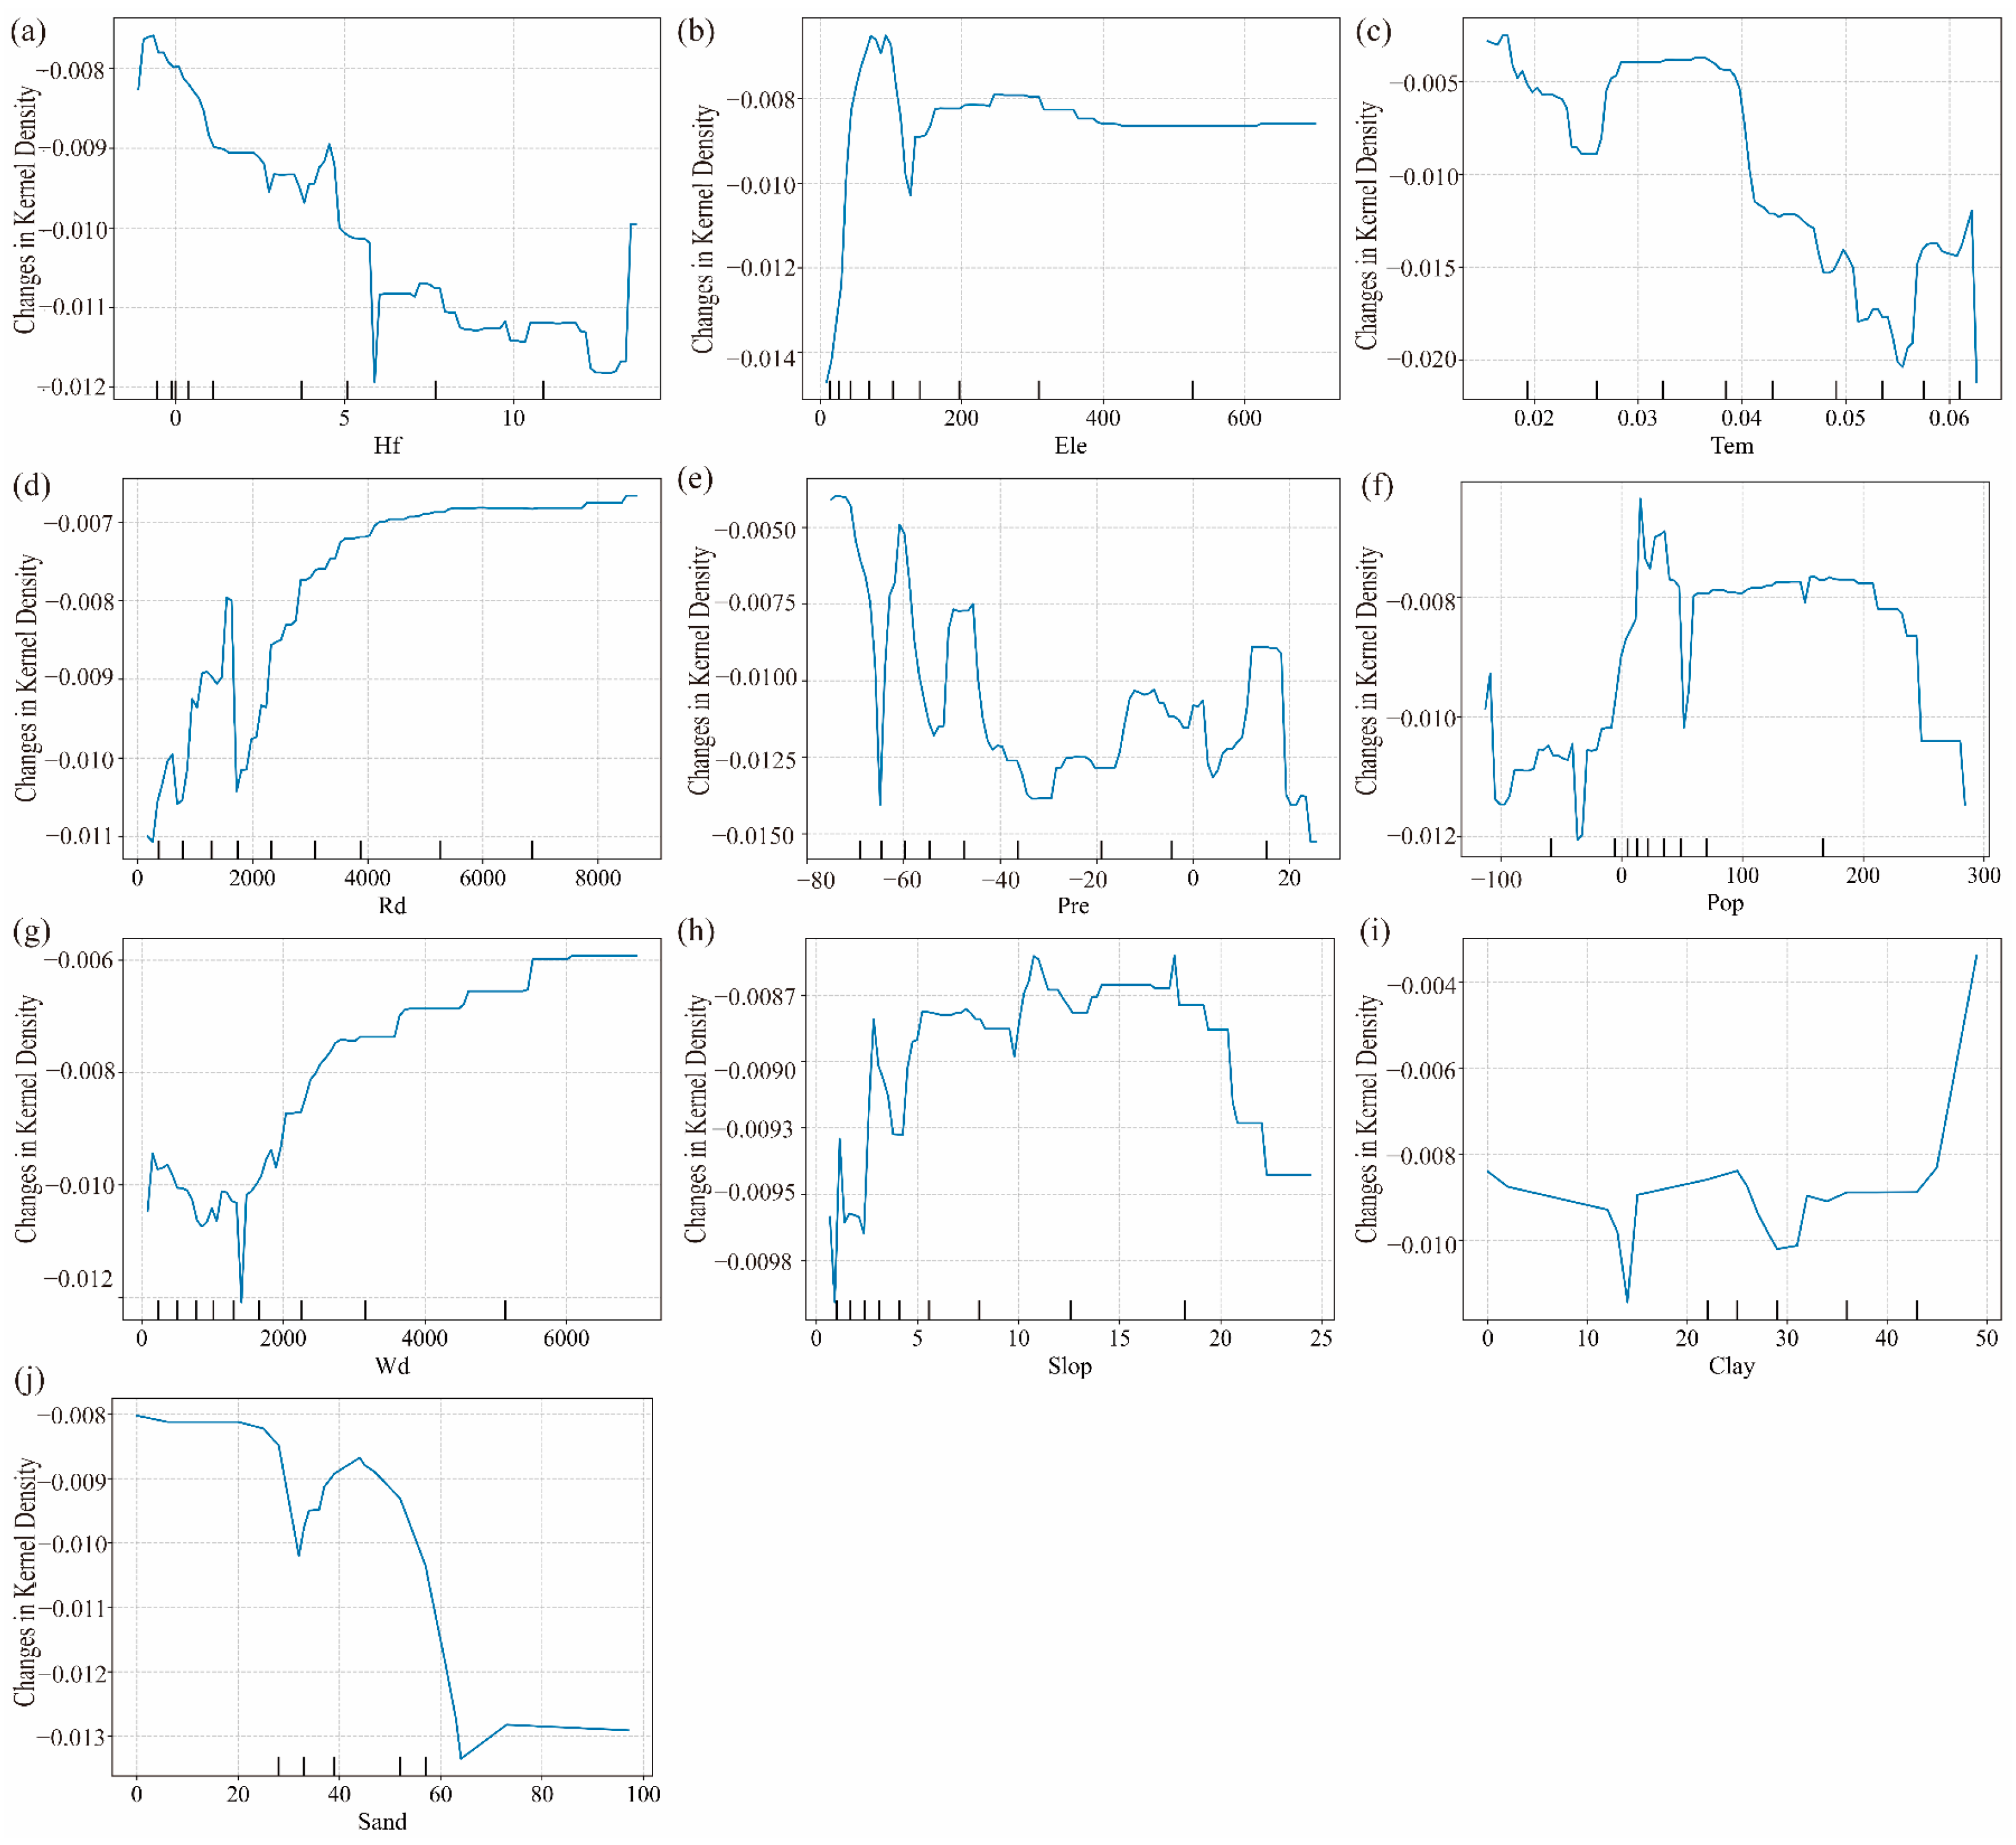
4.3. Driving Forces of Changes in Cropland KD
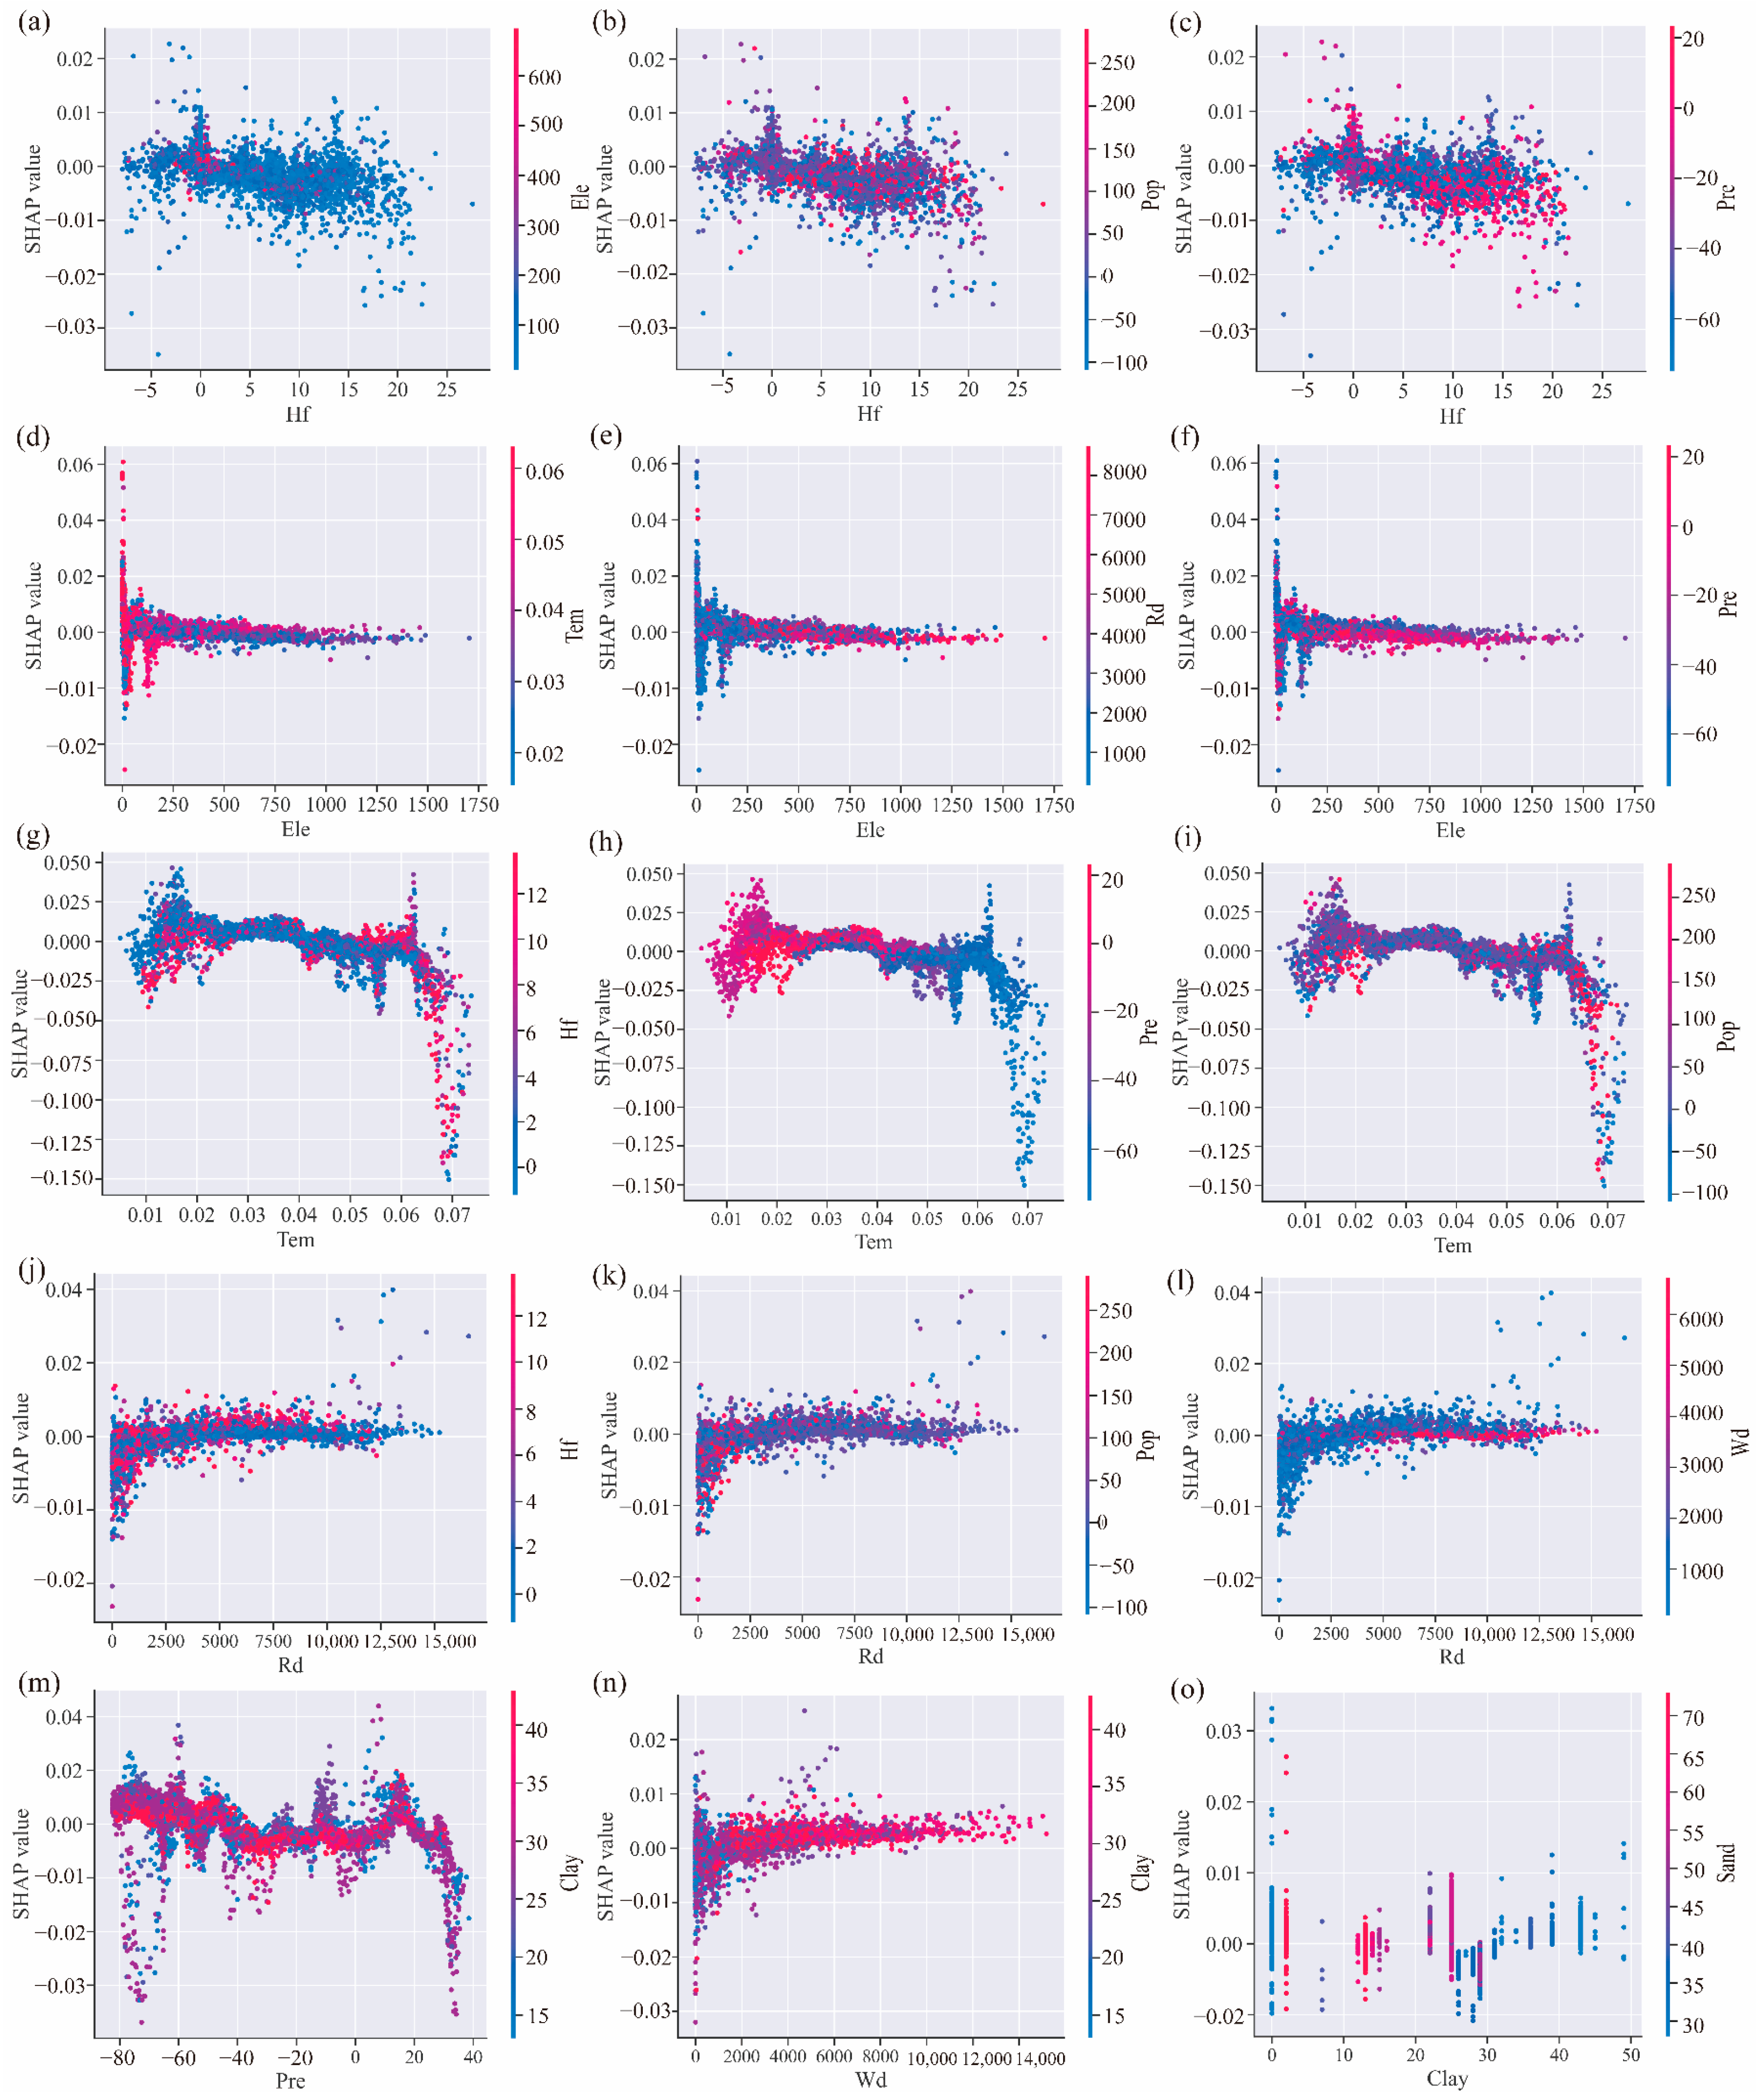
4.3.1. SHAP Interpretability Analysis
4.3.2. Impact of Interactions on KDC
4.4. Future Land Use Simulation of Hainan Island under Multiple Scenarios
5. Discussion
5.1. Spatial and Temporal Evolution of Cropland
5.2. Driving Forces of Cropland Change
5.3. Implications for Future Policies
- (1)
- Future land use planning: Facing the dual challenges of global change and regional development needs, future land use planning must be more forward-looking and adaptable. This study simulated land use changes under different policy scenarios, revealing potential changes in land area under natural development, ecological protection, and cropland protection scenarios. This suggests that policymakers should consider long-term ecological, economic, and social impacts when formulating land use policies, allocating land resources reasonably to promote sustainable land use.
- (2)
- Cropland protection and ecological balance: As awareness of ecological protection increases and food security becomes a concern, future land policies should emphasize the coordinated development of cropland and ecological environment protection. The simulation results under the cropland protection scenario indicate that appropriate policy interventions can effectively prevent the overdevelopment and unreasonable conversion of cropland, thus safeguarding agricultural productivity and ecosystem services. Policymakers need to focus not only on the quantity of cropland but also on enhancing its quality and ecological functions.
- (3)
- Flexible policy mechanisms and technical support: Future policies should provide flexibility to adapt to rapidly changing environmental and socio-economic conditions. Policy mechanisms should promote technological innovation, support sustainable agricultural practices, and develop land management technologies such as precision agriculture, ecological agriculture, and resource-efficient utilization technologies. Furthermore, policies should encourage multidisciplinary research and interdepartmental collaboration to create an integrated governance policy framework, enhancing the scientific and effective management of cropland.
5.4. Study Limitations
- (1)
- The data used in this study cover the period from 2000 to 2020. While this time period captures trends over nearly two decades, it may not fully reveal characteristics over longer time scales. Additionally, the spatial resolution of the land use data is 30 m. Although this resolution is sufficient to capture major trends at a larger scale, it may be limited in detecting finer changes, especially in small-scale land use changes.
- (2)
- Although we considered both natural factors and anthropogenic factors in this study of cropland changes, there may still be potential influencing factors not included in the model. For example, the impacts of policy changes, shifts in economic development models, and technological advancements might not be fully reflected in the current model.
- (3)
- The GeoSOS-FLUS model used for simulating future land use changes is based on the correlation between driving factors and land use types in historical data. The model assumes that these correlations will remain valid in future scenarios; however, socio-economic policy and environmental factors could significantly change in the future, altering these correlations. For instance, policy adjustments, economic model shifts, or climate change could change land use patterns, which are challenging to predict accurately using models based solely on historical data.
6. Conclusions
Author Contributions
Funding
Data Availability Statement
Acknowledgments
Conflicts of Interest
References
- Gao, H.; Gong, J.; Ye, T.; Maier, M.; Liu, J. Constructing Cropland Ecological Stability Assessment Method Based on Disturbance-Resistance-Response Processes and Classifying Cropland Ecological Types. Sci. Total Environ. 2024, 930, 172673. [Google Scholar] [CrossRef]
- Yang, R.; Xu, S.; Gu, B.; He, T.; Zhang, H.; Fang, K.; Xiao, W.; Ye, Y. Stabilizing Unstable Cropland towards Win-Win Sustainable Development Goals. Environ. Impact Assess. Rev. 2024, 105, 107395. [Google Scholar] [CrossRef]
- Li, T.; Hong, X.; Liu, S.; Wu, X.; Fu, S.; Liang, Y.; Li, J.; Li, R.; Zhang, C.; Song, X.; et al. Cropland Degradation and Nutrient Overload on Hainan Island: A Review and Synthesis. Environ. Pollut. 2022, 313, 120100. [Google Scholar] [CrossRef]
- Qi, X.; Feng, K.; Sun, L.; Zhao, D.; Huang, X.; Zhang, D.; Liu, Z.; Baiocchi, G. Rising Agricultural Water Scarcity in China Is Driven by Expansion of Irrigated Cropland in Water Scarce Regions. One Earth 2022, 5, 1139–1152. [Google Scholar] [CrossRef]
- Wang, Y.; Tao, F.; Chen, Y.; Yin, L. Interactive Impacts of Climate Change and Agricultural Management on Soil Organic Carbon Sequestration Potential of Cropland in China over the Coming Decades. Sci. Total Environ. 2022, 817, 153018. [Google Scholar] [CrossRef]
- Han, Y.; Yi, D.; Ye, Y.; Guo, X.; Liu, S. Response of Spatiotemporal Variability in Soil pH and Associated Influencing Factors to Land Use Change in a Red Soil Hilly Region in Southern China. CATENA 2022, 212, 106074. [Google Scholar] [CrossRef]
- Wang, Y.; Chen, F.; Zhao, H.; Xie, D.; Ni, J.; Liao, D. Characteristics of Agricultural Phosphorus Migration in Different Soil Layers on Purple Soil Sloping Cropland under Natural Rainfall Conditions. Front. Environ. Sci. 2023, 11, 1230565. [Google Scholar] [CrossRef]
- Du, B.; Ye, S.; Gao, P.; Ren, S.; Liu, C.; Song, C. Analyzing Spatial Patterns and Driving Factors of Cropland Change in China’s National Protected Areas for Sustainable Management. Sci. Total Environ. 2024, 912, 169102. [Google Scholar] [CrossRef]
- Chen, W.; Yang, L.; Zeng, J.; Yuan, J.; Gu, T.; Liu, Z. Untangling the Increasing Elevation of Cropland in China from 1980 to 2020. Geogr. Sustain. 2023, 4, 281–293. [Google Scholar] [CrossRef]
- Tao, J.; Zhu, J.; Zhang, Y.; Dong, J.; Zhang, X. Divergent Effects of Climate Change on Cropland Ecosystem Water Use Efficiency at Different Elevations in Southwestern China. J. Geogr. Sci. 2022, 32, 1601–1614. [Google Scholar] [CrossRef]
- Deluz, C.; Sebag, D.; Verrecchia, E.; Boivin, P. Soil Organic Matter Thermal Pools as Influenced by Depth, Tillage, and Soil Texture—A Rock-Eval® Analysis Study on the Cropland Soils of the Swiss Plateau. Geoderma 2024, 445, 116871. [Google Scholar] [CrossRef]
- Sun, Y.; Zhong, H.; Ding, Y.; Cai, H.; Peng, X. Exploring the Diverse Response of Cropland Vegetation to Climatic Factors and Irrigation across China. Agronomy 2024, 14, 188. [Google Scholar] [CrossRef]
- Sanogo, N.D.M.; Dayamba, S.D.; Renaud, F.G.; Feurer, M. From Wooded Savannah to Farmland and Settlement: Population Growth, Drought, Energy Needs and Cotton Price Incentives Driving Changes in Wacoro, Mali. Land 2022, 11, 2117. [Google Scholar] [CrossRef]
- Ullah, K.M.; Uddin, K. The Relationships between Economic Growth and Cropland Changes in Bangladesh: An Evidence Based on Annual Land Cover Data. Environ. Chall. 2021, 5, 100252. [Google Scholar] [CrossRef]
- Ibarrola-Rivas, M.J.; Granados-Ramírez, R.; Nonhebel, S. Is the Available Cropland and Water Enough for Food Demand? A Global Perspective of the Land-Water-Food Nexus. Adv. Water Resour. 2017, 110, 476–483. [Google Scholar] [CrossRef]
- Wu, J.; Jin, S.; Zhu, G.; Guo, J. Monitoring of Cropland Abandonment Based on Long Time Series Remote Sensing Data: A Case Study of Fujian Province, China. Agronomy 2023, 13, 1585. [Google Scholar] [CrossRef]
- Yang, C.; Zhai, H.; Fu, M.; Zheng, Q.; Fan, D. Multi-Scenario Simulation of Land System Change in the Guangdong–Hong Kong–Macao Greater Bay Area Based on a Cellular Automata–Markov Model. Remote Sens. 2024, 16, 1512. [Google Scholar] [CrossRef]
- Xie, E.; Chen, J.; Peng, Y.; Yan, G.; Zhao, Y. Historical and Future Dynamics of Cropland Soil Organic Carbon Stocks in an Intensive Human-Impacted Area of Southeastern China. Agric. Ecosyst. Environ. 2024, 372, 109098. [Google Scholar] [CrossRef]
- Lyu, F.; Pan, Y.; Yu, L.; Wang, X.; Yu, Z. The Impact of Anthropogenic Activities and Natural Factors on the Grassland over the Agro-Pastoral Ecotone of Inner Mongolia. Land 2023, 12, 2009. [Google Scholar] [CrossRef]
- Wang, J.; Feng, C.; Hu, B.; Chen, S.; Hong, Y.; Arrouays, D.; Peng, J.; Shi, Z. A Novel Framework for Improving Soil Organic Matter Prediction Accuracy in Cropland by Integrating Soil, Vegetation and Human Activity Information. Sci. Total Environ. 2023, 903, 166112. [Google Scholar] [CrossRef]
- Ye, Y.; Qin, Y.; Yu, R.; Wu, Q. Optimization of Chinese Land Spatial Pattern in the Transformation Process of Resource-Based Cities: A Case Study in Tongling City, China. Sci. Rep. 2024, 14, 6092. [Google Scholar] [CrossRef] [PubMed]
- Li, M.; Wei, X.; Li, B. Reconstruction of Spatial–Temporal Changes in Cropland Cover from 1650 to 1980 in Taiyuan City. Land 2023, 13, 36. [Google Scholar] [CrossRef]
- Wu, Z.; Li, S.; Wu, D.; Song, J.; Lin, T.; Gao, Z. Analysis of Characteristics and Driving Mechanisms of Non-Grain Production of Cropland in Mountainous Areas at the Plot Scale—A Case Study of Lechang City. Foods 2024, 13, 1459. [Google Scholar] [CrossRef] [PubMed]
- Fu, C.; Cheng, L.; Qin, S.; Tariq, A.; Liu, P.; Zou, K.; Chang, L. Timely Plastic-Mulched Cropland Extraction Method from Complex Mixed Surfaces in Arid Regions. Remote Sens. 2022, 14, 4051. [Google Scholar] [CrossRef]
- Wang, L.; Zhang, S.; Xiong, Q.; Liu, Y.; Liu, Y.; Liu, Y. Spatiotemporal Dynamics of Cropland Expansion and Its Driving Factors in the Yangtze River Economic Belt: A Nuanced Analysis at the County Scale. Land Use Policy 2022, 119, 106168. [Google Scholar] [CrossRef]
- Pan, S.; Liang, J.; Chen, W.; Peng, Y. Uphill or Downhill? Cropland Use Change and Its Drivers from the Perspective of Slope Spectrum. J. Mt. Sci. 2024, 21, 484–499. [Google Scholar] [CrossRef]
- Wang, Z.; Gong, X.; Zhang, Y.; Liu, S.; Chen, N. Multi-Scale Geographically Weighted Elasticity Regression Model to Explore the Elastic Effects of the Built Environment on Ride-Hailing Ridership. Sustainability 2023, 15, 4966. [Google Scholar] [CrossRef]
- Şanlıtürk, İ.H.; Kocabaş, H. Precise Calculation of Inverse Kinematics of the Center of Gravity for Bipedal Walking Robots. Appl. Sci. 2024, 14, 3706. [Google Scholar] [CrossRef]
- Qian, T.; Shi, Z.; Gu, S.; Xi, W.; Chen, J.; Chen, J.; Bai, S.; Wu, L. A Water Shortage Risk Assessment Model Based on Kernel Density Estimation and Copulas. Water 2024, 16, 1465. [Google Scholar] [CrossRef]
- Xu, Y.; Lin, K.; Hu, C.; Wang, S.; Wu, Q.; Zhang, J.; Xiao, M.; Luo, Y. Interpretable Machine Learning on Large Samples for Supporting Runoff Estimation in Ungauged Basins. J. Hydrol. 2024, 639, 131598. [Google Scholar] [CrossRef]
- Hee Shim, S.; Hyun Choi, J. Building an XGBoost Model Based on Landscape Metrics and Meteorological Data for Nonpoint Source Pollution Management in the Nakdong River Watershed. Ecol. Indic. 2024, 165, 112156. [Google Scholar] [CrossRef]
- Lai, J.; Zhao, T.; Qi, S. Spatiotemporal Variation in Vegetation and Its Driving Mechanisms in the Southwest Alpine Canyon Area of China. Forests 2023, 14, 2357. [Google Scholar] [CrossRef]
- Cai, Y.; Feng, J.; Wang, Y.; Ding, Y.; Hu, Y.; Fang, H. The Optuna–LightGBM–XGBoost Model: A Novel Approach for Estimating Carbon Emissions Based on the Electricity–Carbon Nexus. Appl. Sci. 2024, 14, 4632. [Google Scholar] [CrossRef]
- Peng, Z.; Lu, W.; Yuan, L.; Zhang, Y. The Rise of Syndicates: Social Network Analyses of Construction Waste Haulers in Hong Kong Using a Novel InfoMap-XGBoost Method. Resour. Conserv. Recycl. 2024, 206, 107663. [Google Scholar] [CrossRef]
- Liu, Y.; Fu, Y.; Peng, Y.; Ming, J. Clinical Decision Support Tool for Breast Cancer Recurrence Prediction Using SHAP Value in Cooperative Game Theory. Heliyon 2024, 10, e24876. [Google Scholar] [CrossRef] [PubMed]
- Wang, Y.; Shen, J.; Yan, W.; Chen, C. Backcasting Approach with Multi-Scenario Simulation for Assessing Effects of Land Use Policy Using GeoSOS-FLUS Software. MethodsX 2019, 6, 1384–1397. [Google Scholar] [CrossRef] [PubMed]
- Varga, O.G.; Pontius, R.G.; Singh, S.K.; Szabó, S. Intensity Analysis and the Figure of Merit’s Components for Assessment of a Cellular Automata—Markov Simulation Model. Ecol. Indic. 2019, 101, 933–942. [Google Scholar] [CrossRef]
- Gao, H.; Qin, T.; Luan, Q.; Feng, J.; Zhang, X.; Yang, Y.; Xu, S.; Lu, J. Characteristics Analysis and Prediction of Land Use Evolution in the Source Region of the Yangtze River and Yellow River Based on Improved FLUS Model. Land 2024, 13, 393. [Google Scholar] [CrossRef]
- Chen, J.; You, J.; Wei, J.; Dai, Z.; Zhang, G. Interpreting XGBoost Predictions for Shear-Wave Velocity Using SHAP: Insights into Gas Hydrate Morphology and Saturation. Fuel 2024, 364, 131145. [Google Scholar] [CrossRef]
- Huang, X.; Liu, Y.; Cong, Y.; Zhang, Y.; Zhao, X.; Huang, L.; Li, Q.; Li, L.; Hou, F. Soil Moisture Stability of Rangeland Is Higher than That of Woodland and Cropland in the Loess Plateau, China. Ecol. Indic. 2022, 144, 109543. [Google Scholar] [CrossRef]
- Zhang, Y.; Yuan, J.; You, C.; Cao, R.; Tan, B.; Li, H.; Yang, W. Contributions of National Key Forestry Ecology Projects to the Forest Vegetation Carbon Storage in China. For. Ecol. Manag. 2020, 462, 117981. [Google Scholar] [CrossRef]
- Han, N.; Yu, M.; Jia, P.; Zhang, Y.; Hu, K. Influence of Human Activity Intensity on Habitat Quality in Hainan Tropical Rainforest National Park, China. Chin. Geogr. Sci. 2024, 34, 519–532. [Google Scholar] [CrossRef]
- Ren, H.; Chen, J.; Yuan, X.; Liu, J. Composition and Diversity of the Spider Fauna in Rubber Forest and Natural Forest in Hainan Island, China. Acta Ecol. Sin. 2016, 36, 1774–1781. [Google Scholar] [CrossRef]
- Zhai, D.-L.; Cannon, C.H.; Slik, J.W.F.; Zhang, C.-P.; Dai, Z.-C. Rubber and Pulp Plantations Represent a Double Threat to Hainan’s Natural Tropical Forests. J. Environ. Manag. 2012, 96, 64–73. [Google Scholar] [CrossRef] [PubMed]
- Gu, K.; Wall, G. Rapid Urbanization in a Transitional Economy in China: The Case of Hainan Island. Singap. J. Trop. Geogr. 2007, 28, 158–170. [Google Scholar] [CrossRef]
- Shu, R.; Wang, Z.; Guo, N.; Wei, M.; Zou, Y.; Hou, K. Multi-Scenario Land Use Optimization Simulation and Ecosystem Service Value Estimation Based on Fine-Scale Land Survey Data. Land 2024, 13, 557. [Google Scholar] [CrossRef]
- Lu, Y.; He, T.; Yue, W.; Li, M.; Shan, Z.; Zhang, M. Does Cropland Threaten Urban Land Use Efficiency in the Peri-Urban Area? Evidence from Metropolitan Areas in China. Appl. Geogr. 2023, 161, 103124. [Google Scholar] [CrossRef]
- Parras, R.; De Mendonça, G.C.; Da Costa, L.M.; Rocha, J.R.; Costa, R.C.A.; Valera, C.A.; Fernandes, L.F.S.; Pacheco, F.A.L.; Pissarra, T.C.T. Land Use Footprints and Policies in Brazil. Land Use Policy 2024, 140, 107121. [Google Scholar] [CrossRef]
- Ahmad, N.; Younas, F.; Ahmad, H.R.; Sarfraz, M.; Ayub, M.A.; Maqsood, M.A.; Rasul, F.; Sardar, M.F.; Mehmood, T.; Ajarem, J.S.; et al. Soybean (Glycine Max) Cropland Suitability Analysis in Subtropical Desert Climate through GIS-Based Multicriteria Analysis and Sentinel-2 Multispectral Imaging. Land 2023, 12, 2034. [Google Scholar] [CrossRef]
- Dou, X.; Guo, H.; Zhang, L.; Liang, D.; Zhu, Q.; Liu, X.; Zhou, H.; Lv, Z.; Liu, Y.; Gou, Y.; et al. Dynamic Landscapes and the Influence of Human Activities in the Yellow River Delta Wetland Region. Sci. Total Environ. 2023, 899, 166239. [Google Scholar] [CrossRef]
- Wang, Y.; Zhang, Y.; Xian, Y.; Zhang, J.; Tan, B.; Zhang, Y. Horizontal and Vertical Variations in Soil Fertility in Response to Soil Translocation Due to Tillage-Induced Erosion on Sloping Cropland. CATENA 2024, 242, 108089. [Google Scholar] [CrossRef]
- Lu, D.; Wang, Z.; Li, X.; Zhou, Y. Evaluation of the Efficiency and Drivers of Complemented Cropland in Southwest China over the Past 30 Years from the Perspective of Cropland Abandonment. J. Environ. Manag. 2024, 351, 119909. [Google Scholar] [CrossRef] [PubMed]
- Wang, J.; Wang, Z.; Li, K.; Li, C.; Wen, F.; Shi, Z. Factors Affecting Phase Change in Coupling Coordination between Population, Crop Yield, and Soil Erosion in China’s 281 Cities. Land Use Policy 2023, 132, 106761. [Google Scholar] [CrossRef]
- Zuo, C.; Wen, C.; Clarke, G.; Turner, A.; Ke, X.; You, L.; Tang, L. Cropland Displacement Contributed 60% of the Increase in Carbon Emissions of Grain Transport in China over 1990–2015. Nat. Food 2023, 4, 223–235. [Google Scholar] [CrossRef] [PubMed]


| Categories | Driving Factors | Time | Resolution | Source |
|---|---|---|---|---|
| Land use types | 2000–2020 | 30 m | https://www.resdc.cn, accessed on 20 March 2024. | |
| Natural factors | Elevation | 30 m | https://www.resdc.cn, accessed on 20 March 2024. | |
| Slope | 30 m | |||
| Soil clay content | 1 km | |||
| Soil sand content | 1 km | |||
| Water distance | 2020 | 30 m | ||
| Temperature | 2000–2020 | 1 km | ||
| Precipitation | 2000–2020 | 1 km | ||
| Anthropogenic factors | Human footprint | 2000–2020 | 1 km | https://www.geodata.cn, accessed on 22 March 2024. |
| Population density | 2000–2020 | 1 km | ||
| Road distance | 2020 | 30 m |
| Scenario | Natural development scenario | |||||
| Land use types | Cropland | Woodland | Grassland | Waters | Construction land | Unused land |
| Cropland | 1 | 1 | 1 | 1 | 1 | 1 |
| Woodland | 1 | 1 | 1 | 1 | 1 | 1 |
| Grassland | 1 | 1 | 1 | 1 | 1 | 1 |
| Waters | 1 | 1 | 1 | 1 | 1 | 1 |
| Construction Land | 1 | 1 | 1 | 1 | 1 | 1 |
| Unused Land | 1 | 1 | 1 | 1 | 1 | 1 |
| Scenario | Ecological protection scenario | |||||
| Land use types | Cropland | Woodland | Grassland | Waters | Construction Land | Unused Land |
| Cropland | 1 | 1 | 1 | 1 | 1 | 0 |
| Woodland | 0 | 1 | 0 | 0 | 0 | 0 |
| Grassland | 0 | 1 | 1 | 1 | 0 | 0 |
| Waters | 0 | 1 | 0 | 1 | 0 | 0 |
| Construction Land | 0 | 0 | 0 | 0 | 1 | 0 |
| Unused Land | 1 | 1 | 1 | 1 | 1 | 1 |
| Scenario | Cropland protection scenario | |||||
| Land use types | Cropland | Woodland | Grassland | Waters | Construction Land | Unused Land |
| Cropland | 1 | 0 | 0 | 0 | 0 | 0 |
| Woodland | 1 | 1 | 1 | 1 | 1 | 1 |
| Grassland | 1 | 1 | 1 | 1 | 1 | 1 |
| Waters | 1 | 1 | 1 | 1 | 1 | 1 |
| Construction Land | 0 | 0 | 0 | 1 | 0 | 0 |
| Unused Land | 1 | 1 | 1 | 1 | 1 | 1 |
| Land Use Types | Area (km2) | Change Rate (%) | ||||
|---|---|---|---|---|---|---|
| 2000 | 2010 | 2020 | 2000–2010 | 2010–2020 | 2000–2020 | |
| Cropland | 9004.07 | 8656.08 | 8047.85 | −3.86% | −7.03% | −10.62% |
| Woodland | 21,827.48 | 21,872.12 | 21,885.66 | 0.20% | 0.06% | 0.27% |
| Grassland | 1229.96 | 1154.29 | 1196.51 | −6.15% | 3.66% | −2.72% |
| Water | 1281.39 | 1503.04 | 1471.63 | 17.30% | −2.09% | 14.85% |
| Construction Land | 780.69 | 983.76 | 1573.96 | 26.01% | 59.99% | 101.61% |
| Unused Land | 141.13 | 95.43 | 89.11 | −32.38% | −6.61% | −36.85% |
| Land Use Types | Natural Development | Ecological Protection | Cropland Protection | |||
|---|---|---|---|---|---|---|
| Area (km2) | Area Changes (km2) | Area (km2) | Area Changes (km2) | Area (km2) | Area Changes (km2) | |
| Cropland | 7450.85 | −597.00 | 7778.85 | −269.11 | 8496.60 | 448.75 |
| Woodland | 21,992.60 | 126.94 | 22,321.12 | 435.46 | 21,672.60 | −213.06 |
| Grassland | 1106.80 | −89.71 | 1120.07 | −76.44 | 1021.79 | −174.72 |
| Water | 1600.17 | 108.54 | 1367.05 | −104.58 | 1379.05 | −92.58 |
| Construction Land | 2065.23 | 491.27 | 1641.63 | 67.67 | 1649.99 | 76.03 |
| Unused Land | 49.07 | −40.04 | 36.01 | −53.10 | 44.68 | −44.43 |
Disclaimer/Publisher’s Note: The statements, opinions and data contained in all publications are solely those of the individual author(s) and contributor(s) and not of MDPI and/or the editor(s). MDPI and/or the editor(s) disclaim responsibility for any injury to people or property resulting from any ideas, methods, instructions or products referred to in the content. |
© 2024 by the authors. Licensee MDPI, Basel, Switzerland. This article is an open access article distributed under the terms and conditions of the Creative Commons Attribution (CC BY) license (https://creativecommons.org/licenses/by/4.0/).
Share and Cite
Guo, J.; Qi, S.; Chen, J.; Lai, J. Driving Forces behind the Reduction in Cropland Area on Hainan Island, China: Implications for Sustainable Agricultural Development. Land 2024, 13, 1274. https://doi.org/10.3390/land13081274
Guo J, Qi S, Chen J, Lai J. Driving Forces behind the Reduction in Cropland Area on Hainan Island, China: Implications for Sustainable Agricultural Development. Land. 2024; 13(8):1274. https://doi.org/10.3390/land13081274
Chicago/Turabian StyleGuo, Jianchao, Shi Qi, Jiadong Chen, and Jinlin Lai. 2024. "Driving Forces behind the Reduction in Cropland Area on Hainan Island, China: Implications for Sustainable Agricultural Development" Land 13, no. 8: 1274. https://doi.org/10.3390/land13081274