Article

Impacts of Vegetation Ratio, Street Orientation, and Aspect Ratio on Thermal Comfort and Building Carbon Emissions in Cold Zones: A Case Study of Tianjin

1
Faculty of Innovation and Design, City University of Macau, Macau 999078, China
2
School of Architecture, Tianjin University, Tianjin 300072, China
3
College of Cities and Planning, Yancheng Teachers’ University, Yancheng 224001, China
4
College of Architectural Engineering, Yancheng Polytechnic College, Yancheng 224005, China
5
College of Landscape Architecture, Sichuan Agricultural University, Chengdu 611130, China
*
Author to whom correspondence should be addressed.
Land 2024, 13(8), 1275; https://doi.org/10.3390/land13081275
Submission received: 18 July 2024 / Revised: 12 August 2024 / Accepted: 12 August 2024 / Published: 13 August 2024

Abstract

:
This research highlights that street layouts, including the vegetation ratio, street orientation, and aspect ratio, are key in diminishing urban heat islands (UHIs), building energy use, and carbon emissions. The optimal street layout for minimal building energy consumption, carbon emissions, and maximal outdoor thermal comfort in Tianjin was established via field measurements, ENVI-met 5.6.1, Energy Plus simulations, and correlation analysis. The findings indicate the following: (1) The carbon emissions of winter residential heating energy consumption are 2.9–3.2 times higher than those for summer cooling. Urban design should thus prioritize winter energy efficiency and summer thermal comfort outdoors. (2) The summer street PET (physiological equivalent temperature) inversely correlates with the vegetation ratio and aspect ratio. Winter heating energy use inversely correlates with the street orientation and directly correlates with the aspect ratio. Adequate vegetation and proper orientation can decrease energy and carbon output while enhancing summer outdoor comfort. (3) Streets with an NW–SE orientation, H/W = 0.9, and 50% trees in summer yield the best thermal comfort, while those with an NE–SW orientation, H/W = 0.3, and 50% vegetative trees in winter produce the lowest carbon emissions. These insights are instrumental in refining urban streets and building designs in cold zones.

1. Introduction

Rapid urbanization intensifies the urban heat island (UHI) effect [1], leading to diminished vegetation and reduced thermal comfort [2,3,4]. This results in an increased reliance on air conditioning [5], further escalating building energy consumption and carbon emissions [6]. Urban street canyons, coupled with their orientation and aspect ratio, are crucial to enhancing thermal environments [7,8]. Since heating and cooling dominate building energy consumption, investigating the impacts of vegetation, street orientation, and aspect ratio on energy consumption and carbon emissions is important.
Vegetation mitigates heat by reflecting short-wave radiation and evapotranspiration, thereby reducing the ambient temperature [9,10]. Its proportion and form significantly influence the urban thermal environment, with reductions in vegetation diminishing the cooling effect [11,12]. Research indicates that 20–30% tree coverage enhances thermal conditions and outdoor comfort [13]. In hot, dry climates, 50% tree coverage is optimal for high- and low-density areas [14]. In Japan, a mix of 30% trees and 70% grass reduces the heat island effect [15]. Previous studies have also examined the role of vegetation shading [16,17] and the impacts of different tree species [18] and canopy structures on urban heat [19].
The street orientation influences the airflow, solar energy distribution in urban street canyons, and, subsequently, the UHI effect and thermal performance, including the seasonal irradiation patterns on street surfaces [20]. North–south-oriented streets tend to be cooler than east–west-oriented ones [21]. While east–west streets sometimes exhibit poor thermal performance [22], Adelaide’s study found them to be preferable [23]. Some research in India suggests that orienting streets northward by 30° optimizes outdoor thermal comfort [24], highlighting the significance of street orientation as a research metric.
Streets’ aspect ratios significantly affect solar absorption, wind conditions, and heat flux, which collectively impact the UHI effect and the energy demands of buildings. Optimizing the street aspect ratio can, therefore, effectively reduce energy consumption in buildings. For instance, studies in Assiut, Egypt, have demonstrated that deep canyons can save energy [25]. Allegrini et al. highlighted the critical role of the building and street geometry in predicting buildings’ cooling demand [26]. Vallati et al. discussed how the short-wave reflection from street canyons can increase the cooling demand while decreasing the heating demand [27]. Consequently, managing the street aspect ratio is crucial for optimizing the urban thermal environment and minimizing energy consumption [28].
Urban microclimates, shaped by the prevailing climatic conditions and the configuration of urban blocks, significantly influence buildings’ energy consumption and carbon emissions [6,29]. The UHI effect is a global phenomenon that can lead to a 19.0% increase in energy for cooling and an 18.7% decrease in energy for heating, significantly altering the overall energy consumption patterns [30]. Urban areas experience an approximately 25% higher annual cooling load than their rural counterparts, highlighting the need to consider building energy consumption in cities [31]. Additionally, the UHI effect is known to cause a marked increase in the demand for cooling energy, especially in city centers [32]. Understanding the impact of the UHI effect on building energy consumption is crucial for energy reduction and sustainable development; however, accurately quantifying this impact remains a complex challenge [33].
In summary, the current research on UHIs’ effect on building energy consumption and carbon emissions predominantly addresses zones with hot summers and cold winters or hot summers and warm winters. Cold zones have been considerably less studied. Given the diverse energy usage patterns and urban forms across different climate zones, which impact the microclimate and, consequently, energy consumption and carbon emissions, findings from warmer zones are not necessarily applicable to colder ones. Most studies on the relationship between urban forms and carbon emissions have focused on provincial levels or large urban agglomerations, with limited street-level exploration [34]. Although recent research on zero-carbon community construction has emerged, the mechanisms connecting urban forms and carbon emissions at this scale remain underexplored. Additionally, the existing studies have primarily addressed thermal environments and energy consumption, often overlooking carbon emissions [35,36,37]. Furthermore, findings from macro-scale research do not provide actionable insights for block-scale planning, underscoring the need for targeted studies on block-scale carbon emissions in cold climates. This study aimed to optimize street layouts, including vegetation ratios, street orientations, and street aspect ratios, in cold zones, ensuring thermal comfort and low carbon emissions in building energy consumption. Ultimately, this study sought to mitigate the UHI effect and determine the most effective street space design for these regions. The flow chart of this research is depicted in Figure 1.

2. Materials and Methods

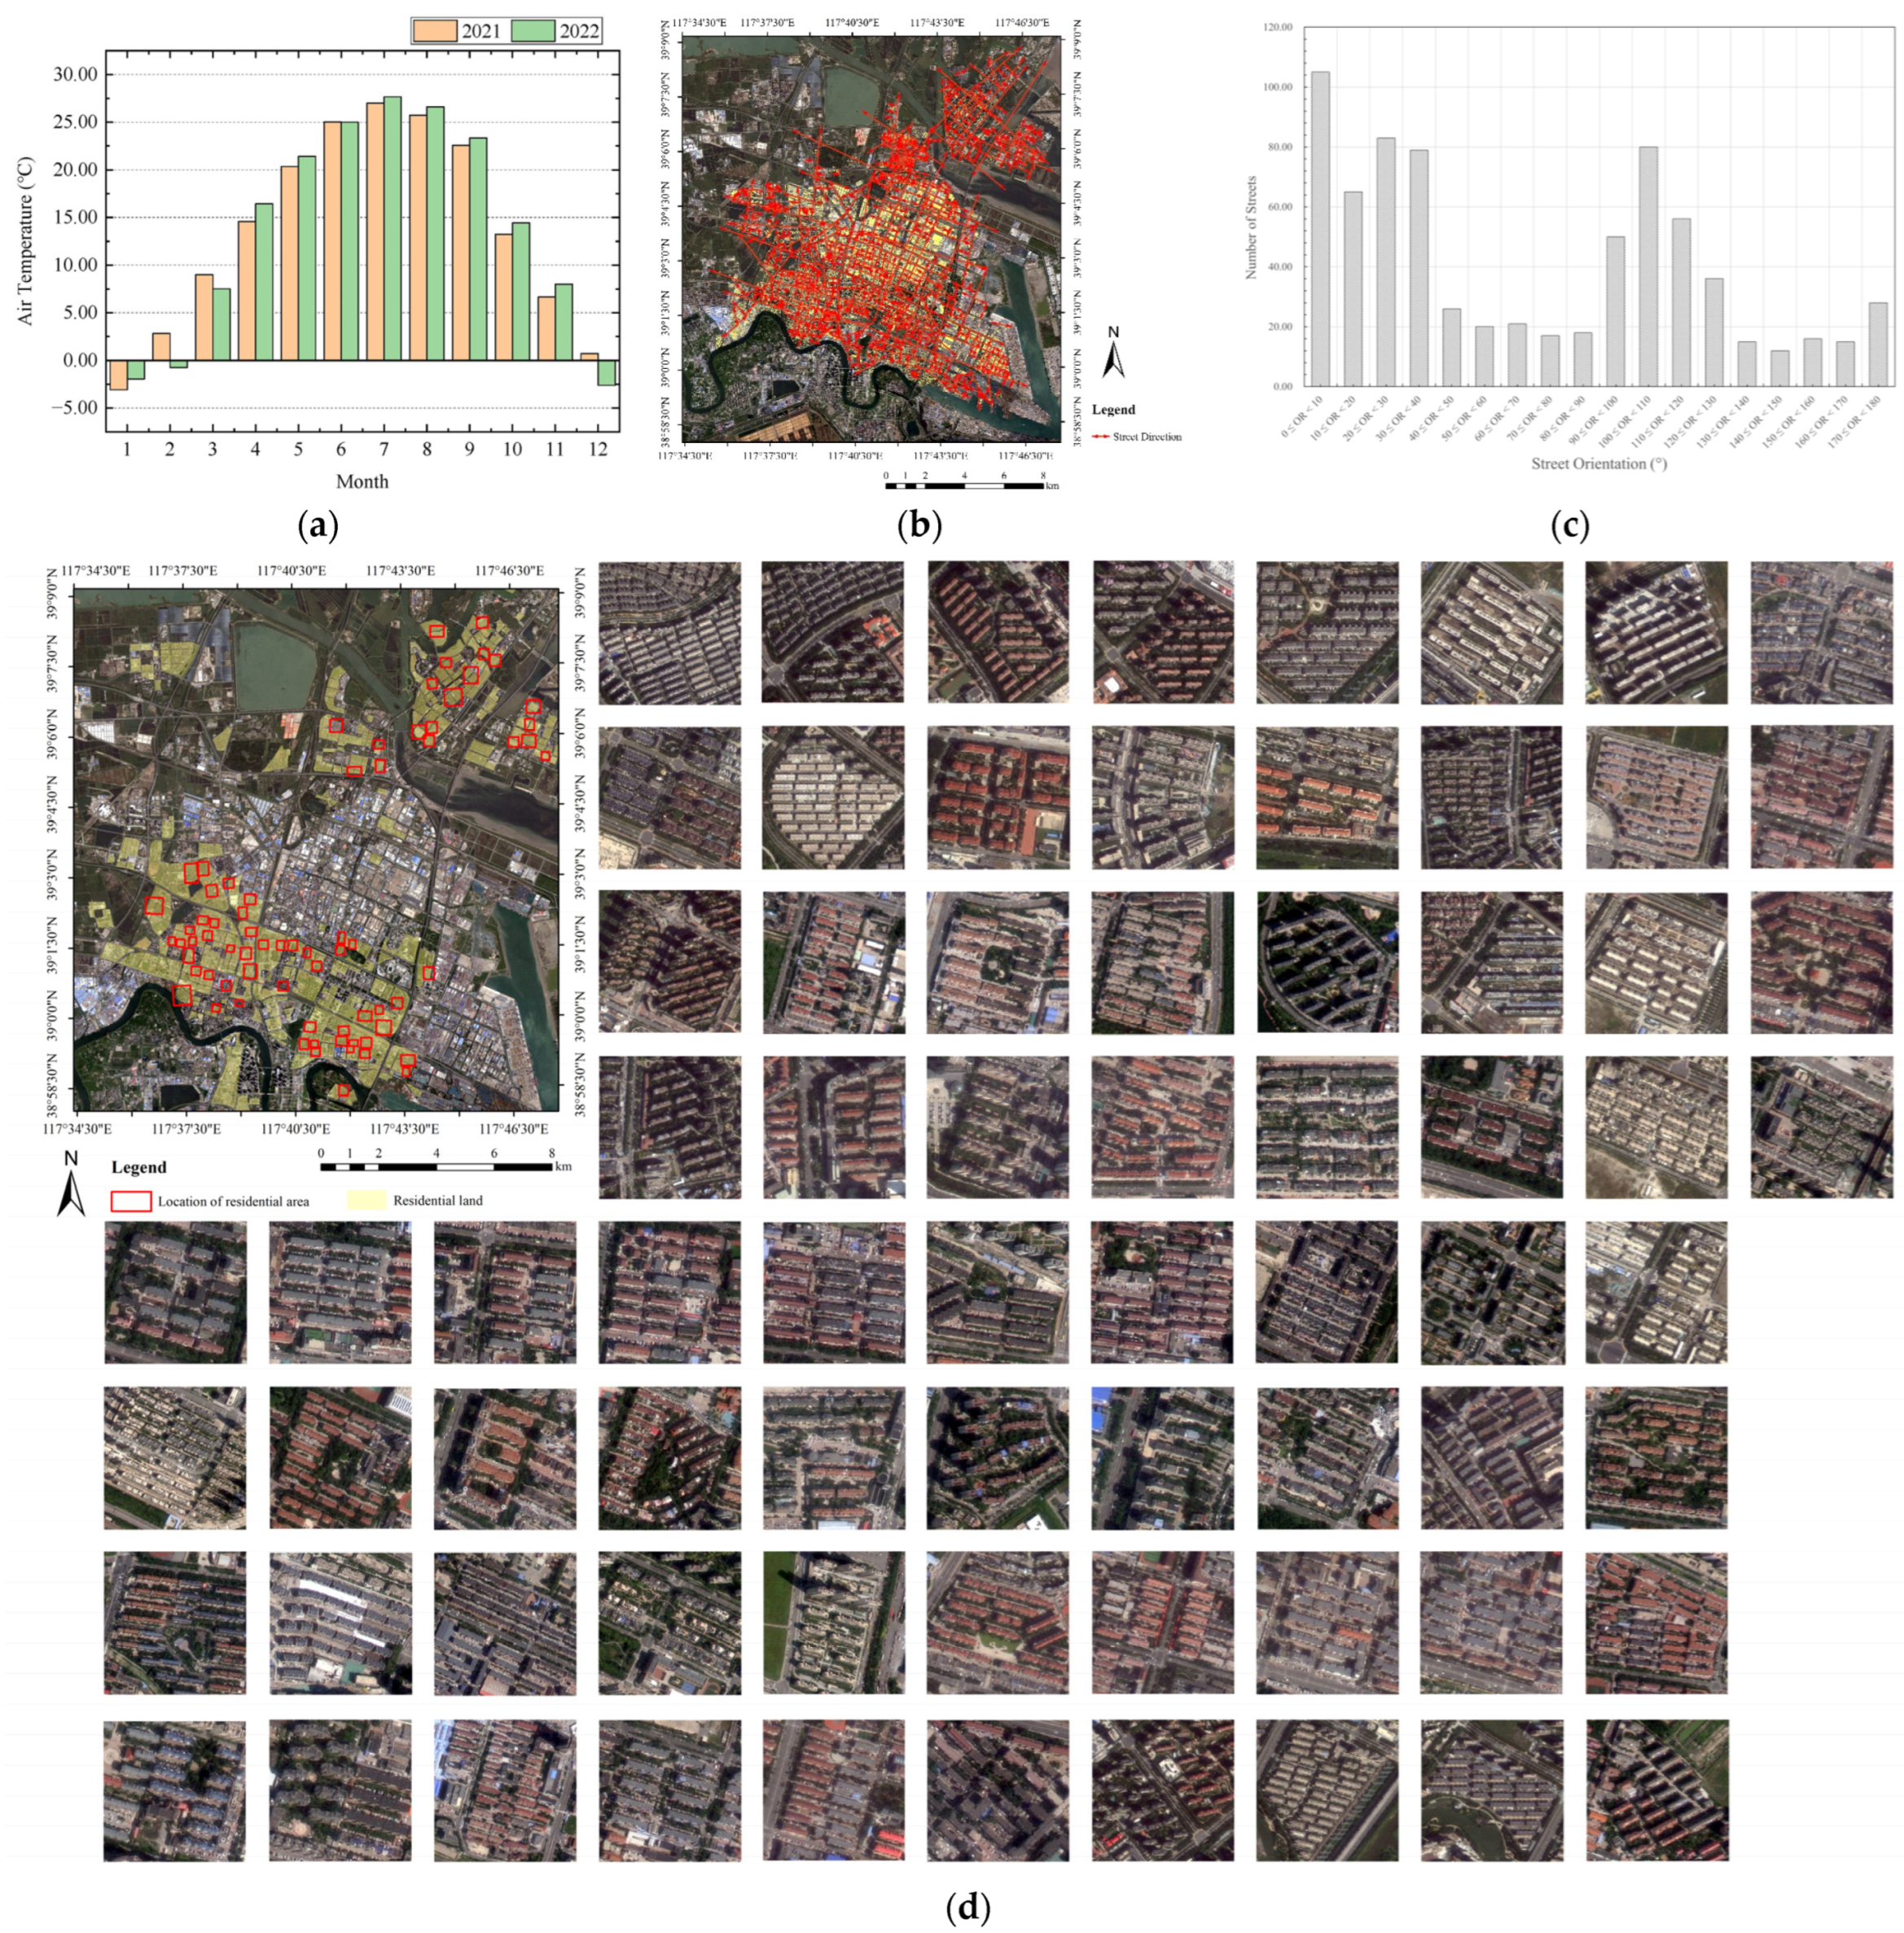
2.1. Study Area’s Regional and Climatic Characteristics

Tianjin (38°34′–40°15′ N, 116°43′–118°4′ E), located in China’s cold climate zone, features a warm temperate semi-humid monsoon climate with average annual wind speeds of 2 to 4 m/s, peaking in winter and spring and lowering in summer and autumn. Summer winds predominantly come from the southeast, occasionally pushing temperatures above 25 °C, while winter winds from the northwest can drop temperatures to approximately −1 °C (Figure 2a). The meteorological data were obtained from the National Centers for Environmental Information (NOAA) and the National Centers for Environmental Information (NCEI) (https://www.ncei.noaa.gov), accessed on 15 July 2024. These seasons experience the highest demand for heating and cooling. On 18 June 2022, and 25 December 2021, surveys in Tianjin’s Tanggu district revealed the main streets with the most deciduous trees, such as poplars and begonia.
An ArcGIS 10.5 analysis indicated that 44.74% of streets aligned between 0° and 40° and 27.92% between 90° and 130° (Figure 2b,c). This study extracted the block forms of the urban center in the Tanggu district of Tianjin via field investigations and satellite imagery. It found that the architectural group forms of urban residential areas in cold zones in China, represented by the Tianjin city area, most commonly follow a linear arrangement pattern (Figure 2d). Residential buildings typically range from mid-rise (1–8 floors) to high-rise (18–32 floors) buildings. The street aspect ratios are generally 0.3, 0.6, and 0.9.
Therefore, considering the most common and representative residential spaces in the study area, a specific street facing northwest–southeast (322°) with H/W = 0.26 and 40% trees was selected for a detailed analysis to optimize the area’s thermal environment, energy consumption, and carbon emissions (Figure 2e,f). The research model can encompass some common residential layout patterns found in Tianjin by adjusting the three variables: the vegetation ratio, street orientation, and aspect ratio.

2.2. ENVI-Met 5.6.1 Model Establishment and Feasibility Verification

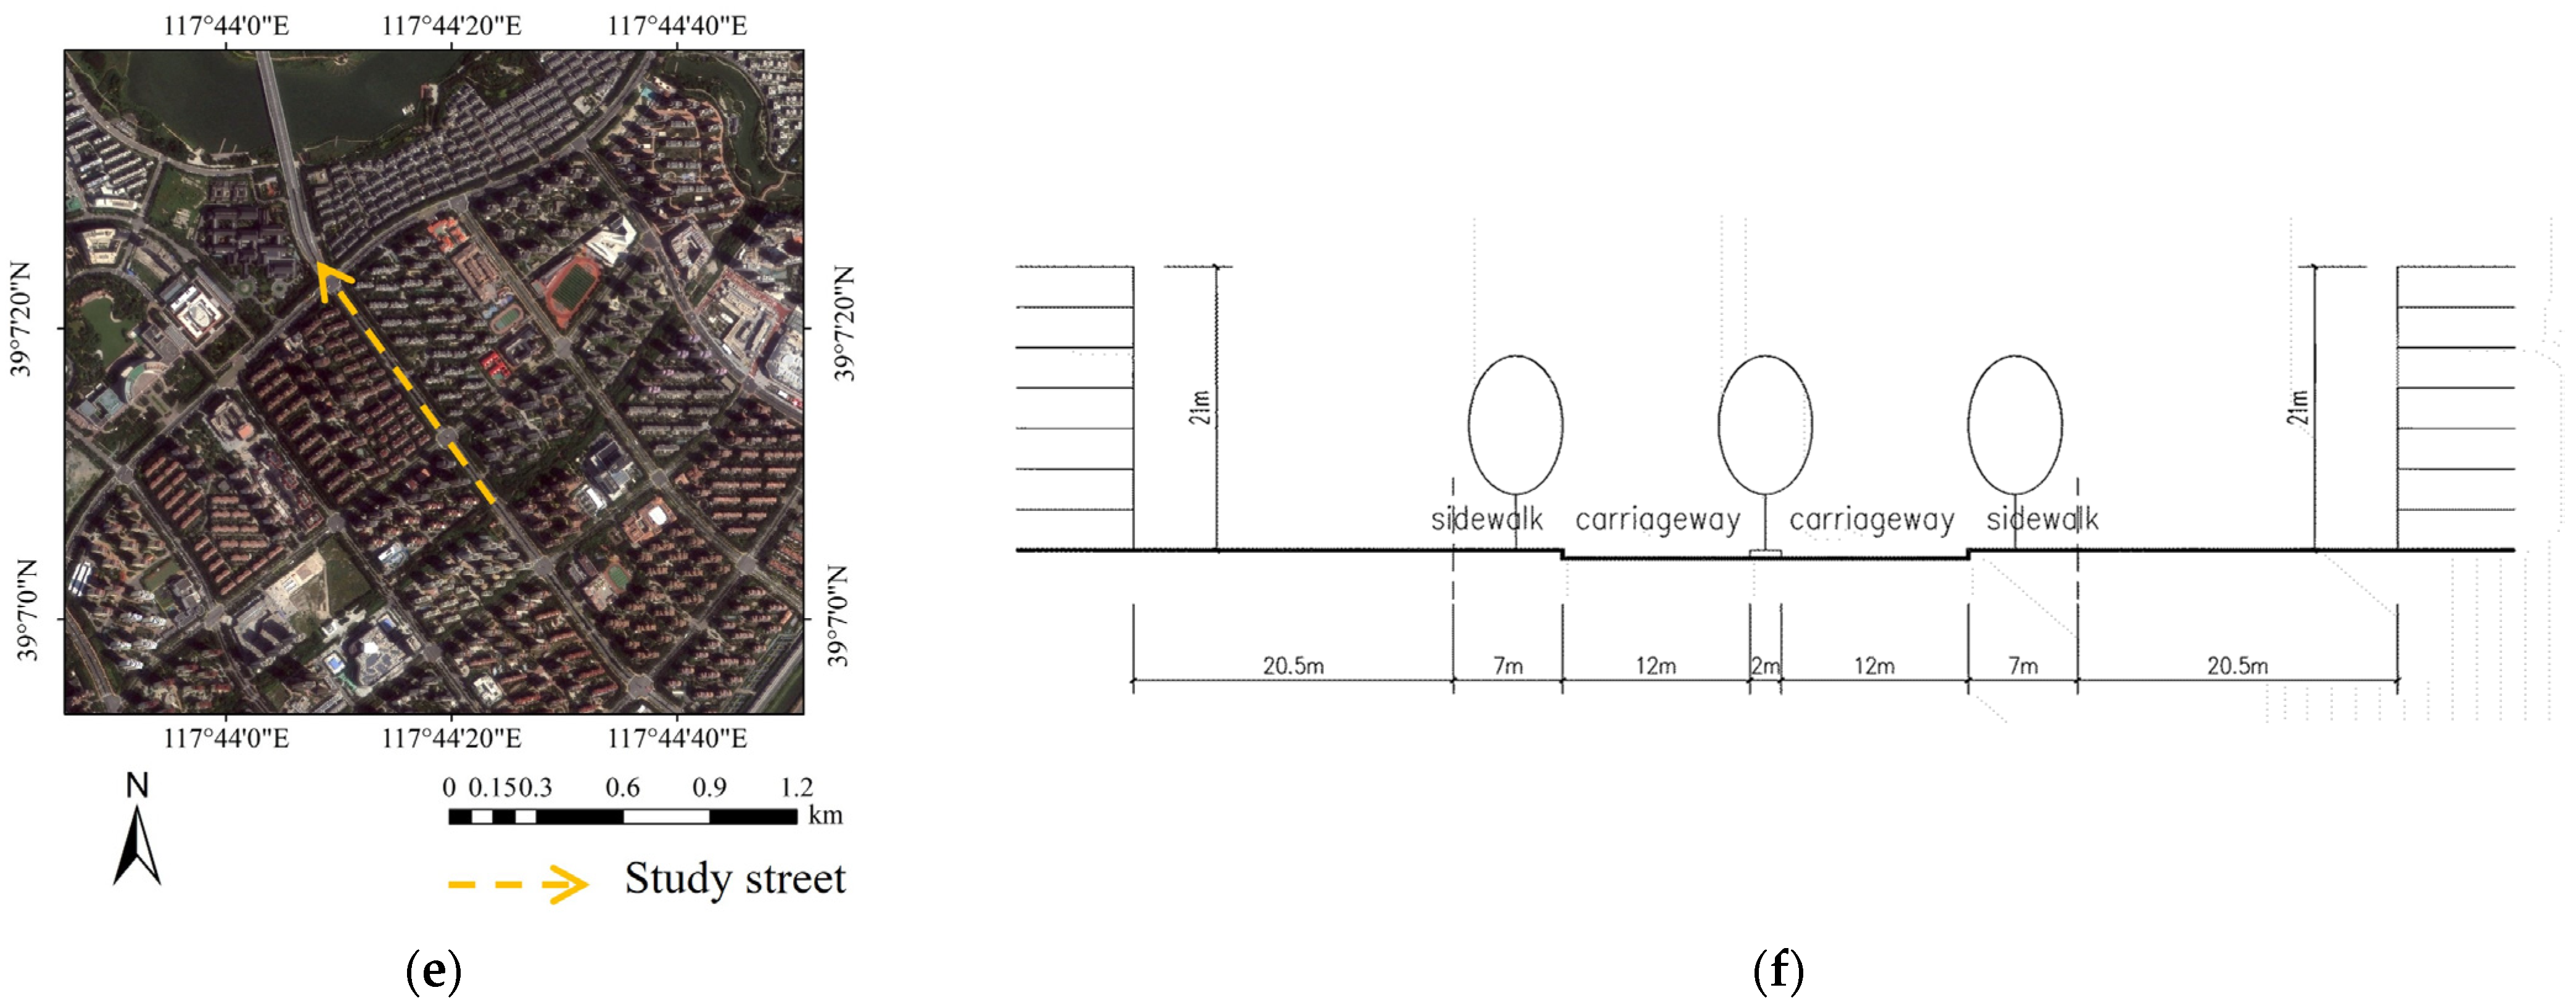
2.2.1. Field Microclimate Measurements

We conducted field measurements at 4 points during summer and 3 during winter within the study area to support the ENVI-met 5.6.1 simulation with model and meteorological data and verify its applicability and authenticity in this region (Figure 3). The measurements ran from 8:00 to 20:00, with data collected every 10 min, totaling 12 h of recorded data. The meteorological data were obtained from the NOAA and NCEI (site no. 54527099999, TIANJIN, CH; site no. 54527399999, BINHAI, CH).

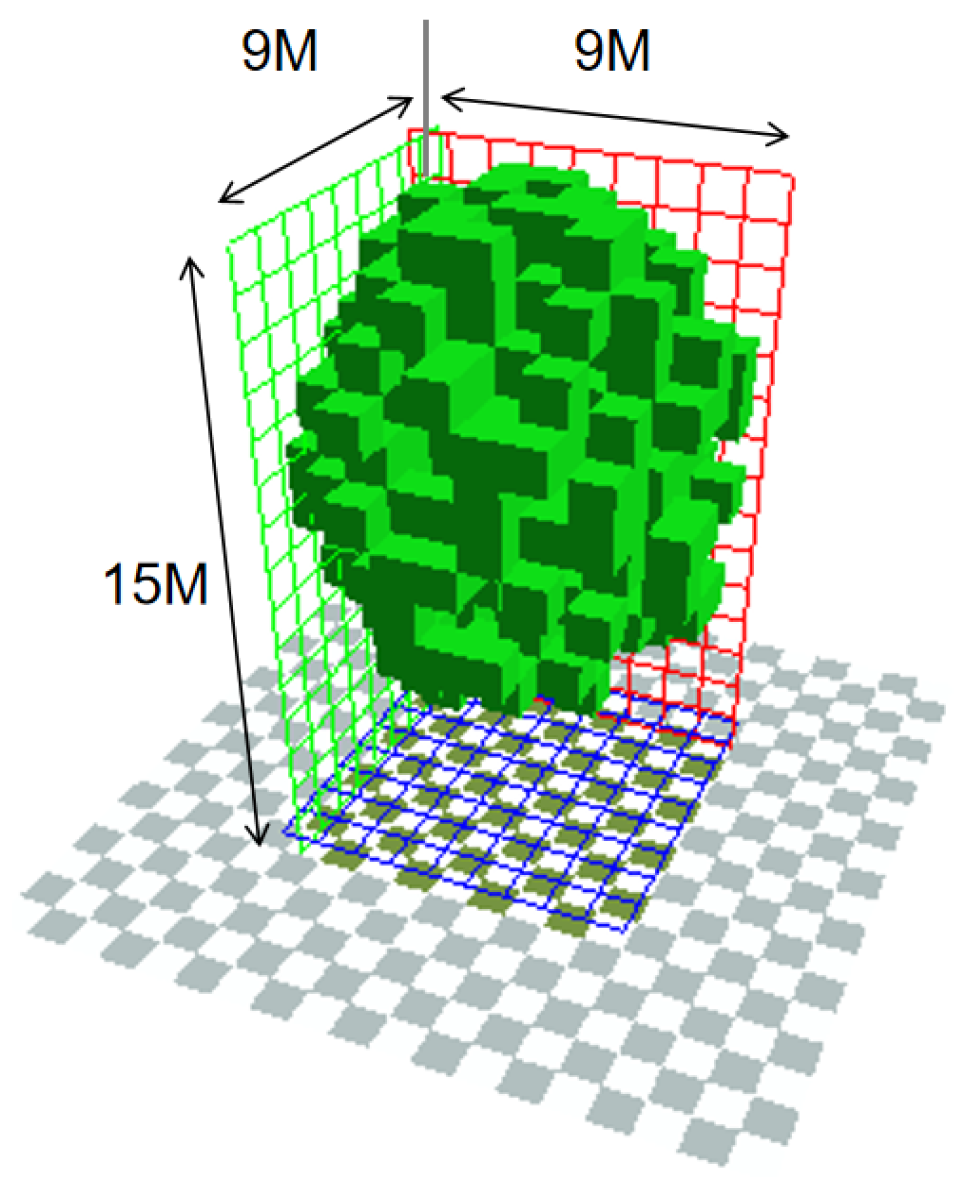
2.2.2. ENVI-Met 5.6.1 Model Description

ENVI-met 5.6.1 is applicable to varied urban forms and green features [38]. Rich vegetation databases [39] have significantly enriched microclimatic studies on streets and buildings [40,41]. The simulation settings are detailed in Table 1. We concentrated on the core street area, analyzing the air temperature, wind speed, and PET at a 1.5 m height (Figure 3). Average values from various field measurement data points, combined with the Meteorological Bureau data, optimized the model’s hourly temperature and humidity [42], ensuring simulation accuracy. We utilized leaf area density (LAD) data for the same tree species in similar climates [43,44], establishing a tree model in Albero (Figure 4) with a LAD of 1.0 and a December seasonal leaf factor of 0.3.

2.2.3. Simulation Feasibility Verification

A correlation analysis between the measured temperature and the simulated relative humidity on typical summer and winter days was conducted to assess the reliability of the ENVI-met 5.6.1 simulation. The consistency of the measured and simulated results was quantified using the R2 and the root-mean-square error (RMSE). In summer, the R2 for temperature was 0.830 (Figure 5a), with an RMSE of 0.98 °C. For the relative humidity, the R2 was 0.984, and the RMSE was 3.11% (Figure 5b). In winter, the R2 for temperature was 0.957 (Figure 5c), with an RMSE of 0.91 °C. For relative humidity, the R2 was 0.950 (Figure 5d), and the RMSE was 2.33%. Therefore, the close correlation between the measured values in both summer and winter with the simulated values underscores the consistency of the temperature and relative humidity measurements with their simulated counterparts. This demonstrates the reliability of the simulations conducted using the ENVI-met 5.6.1 software in this study.

2.3. Experimental Design

The univariate experiments examined vegetation ratio, street orientation, and aspect ratio. Modified individually within the initial model, ENVI-met 5.6.1 simulated the microclimates for each. The energy use and carbon emissions were assessed per scenario, aiming to optimize these variables for maximum thermal comfort and minimal energy and carbon emissions from buildings, factoring in summer cooling and winter heating. The model details are as follows:
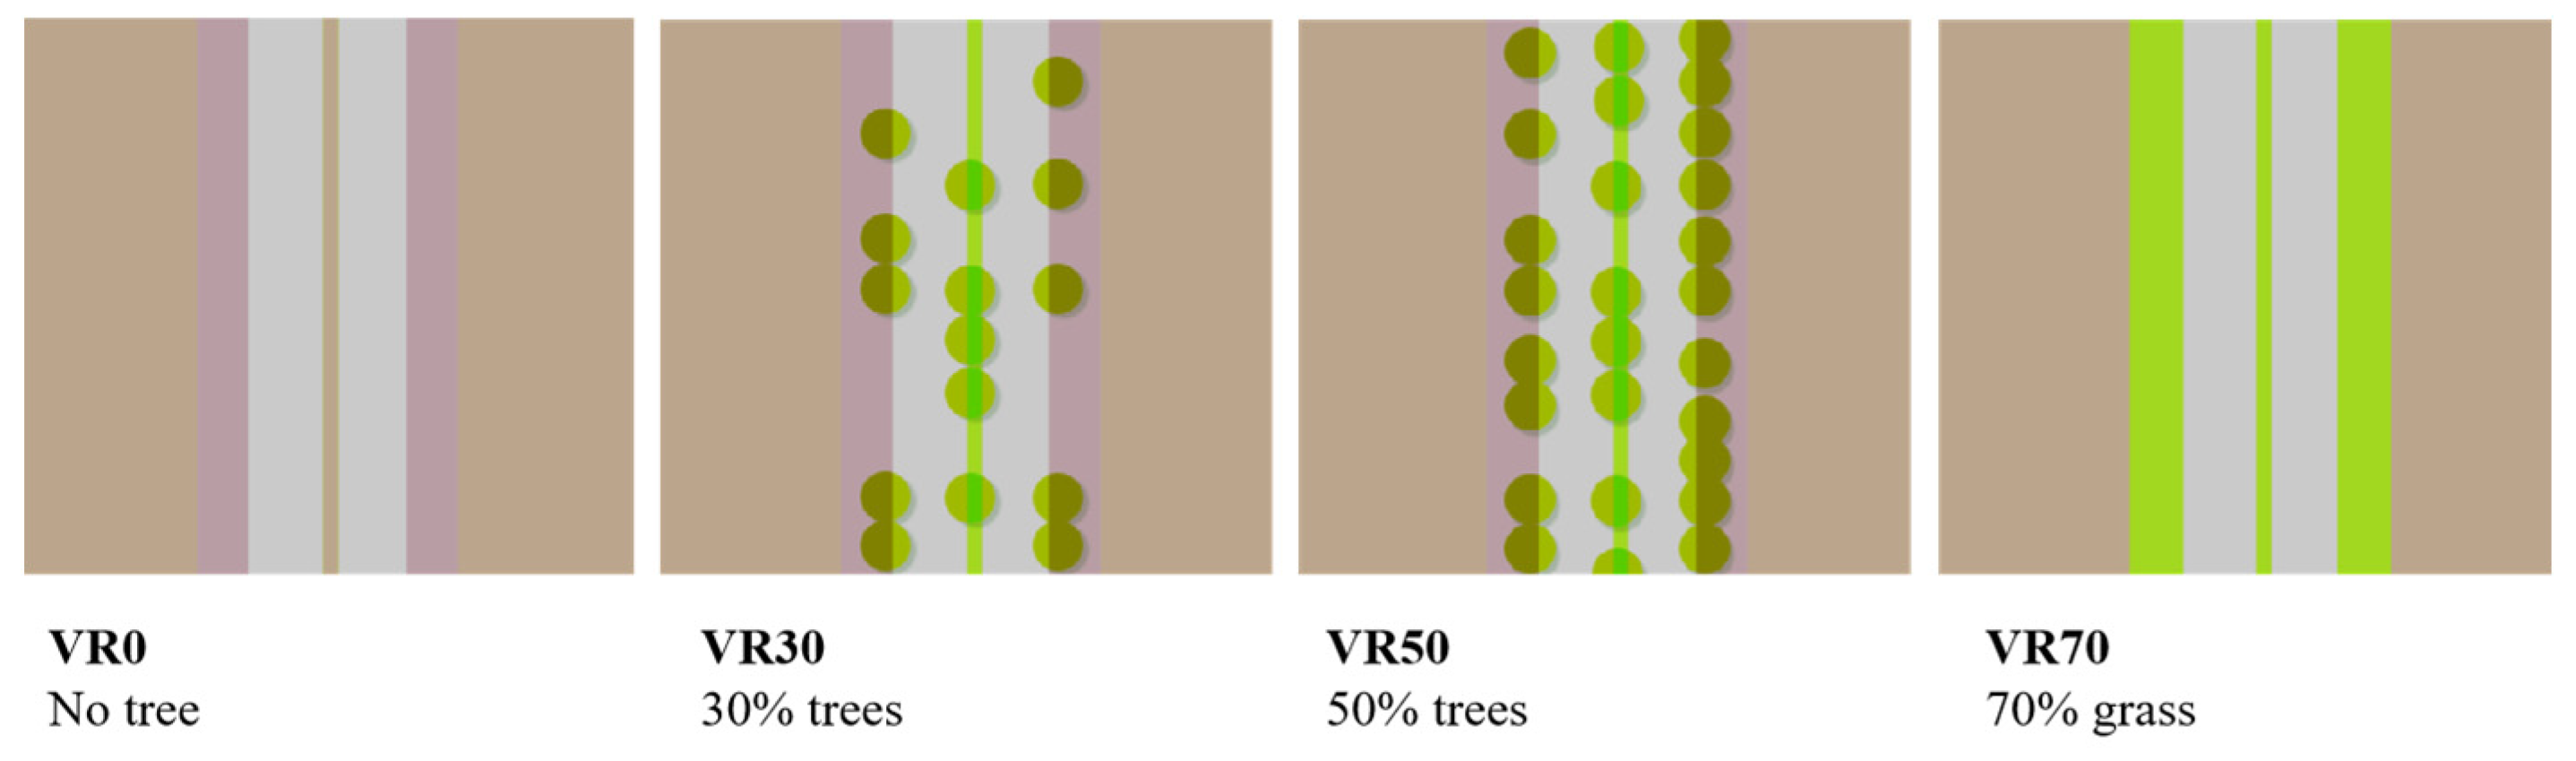
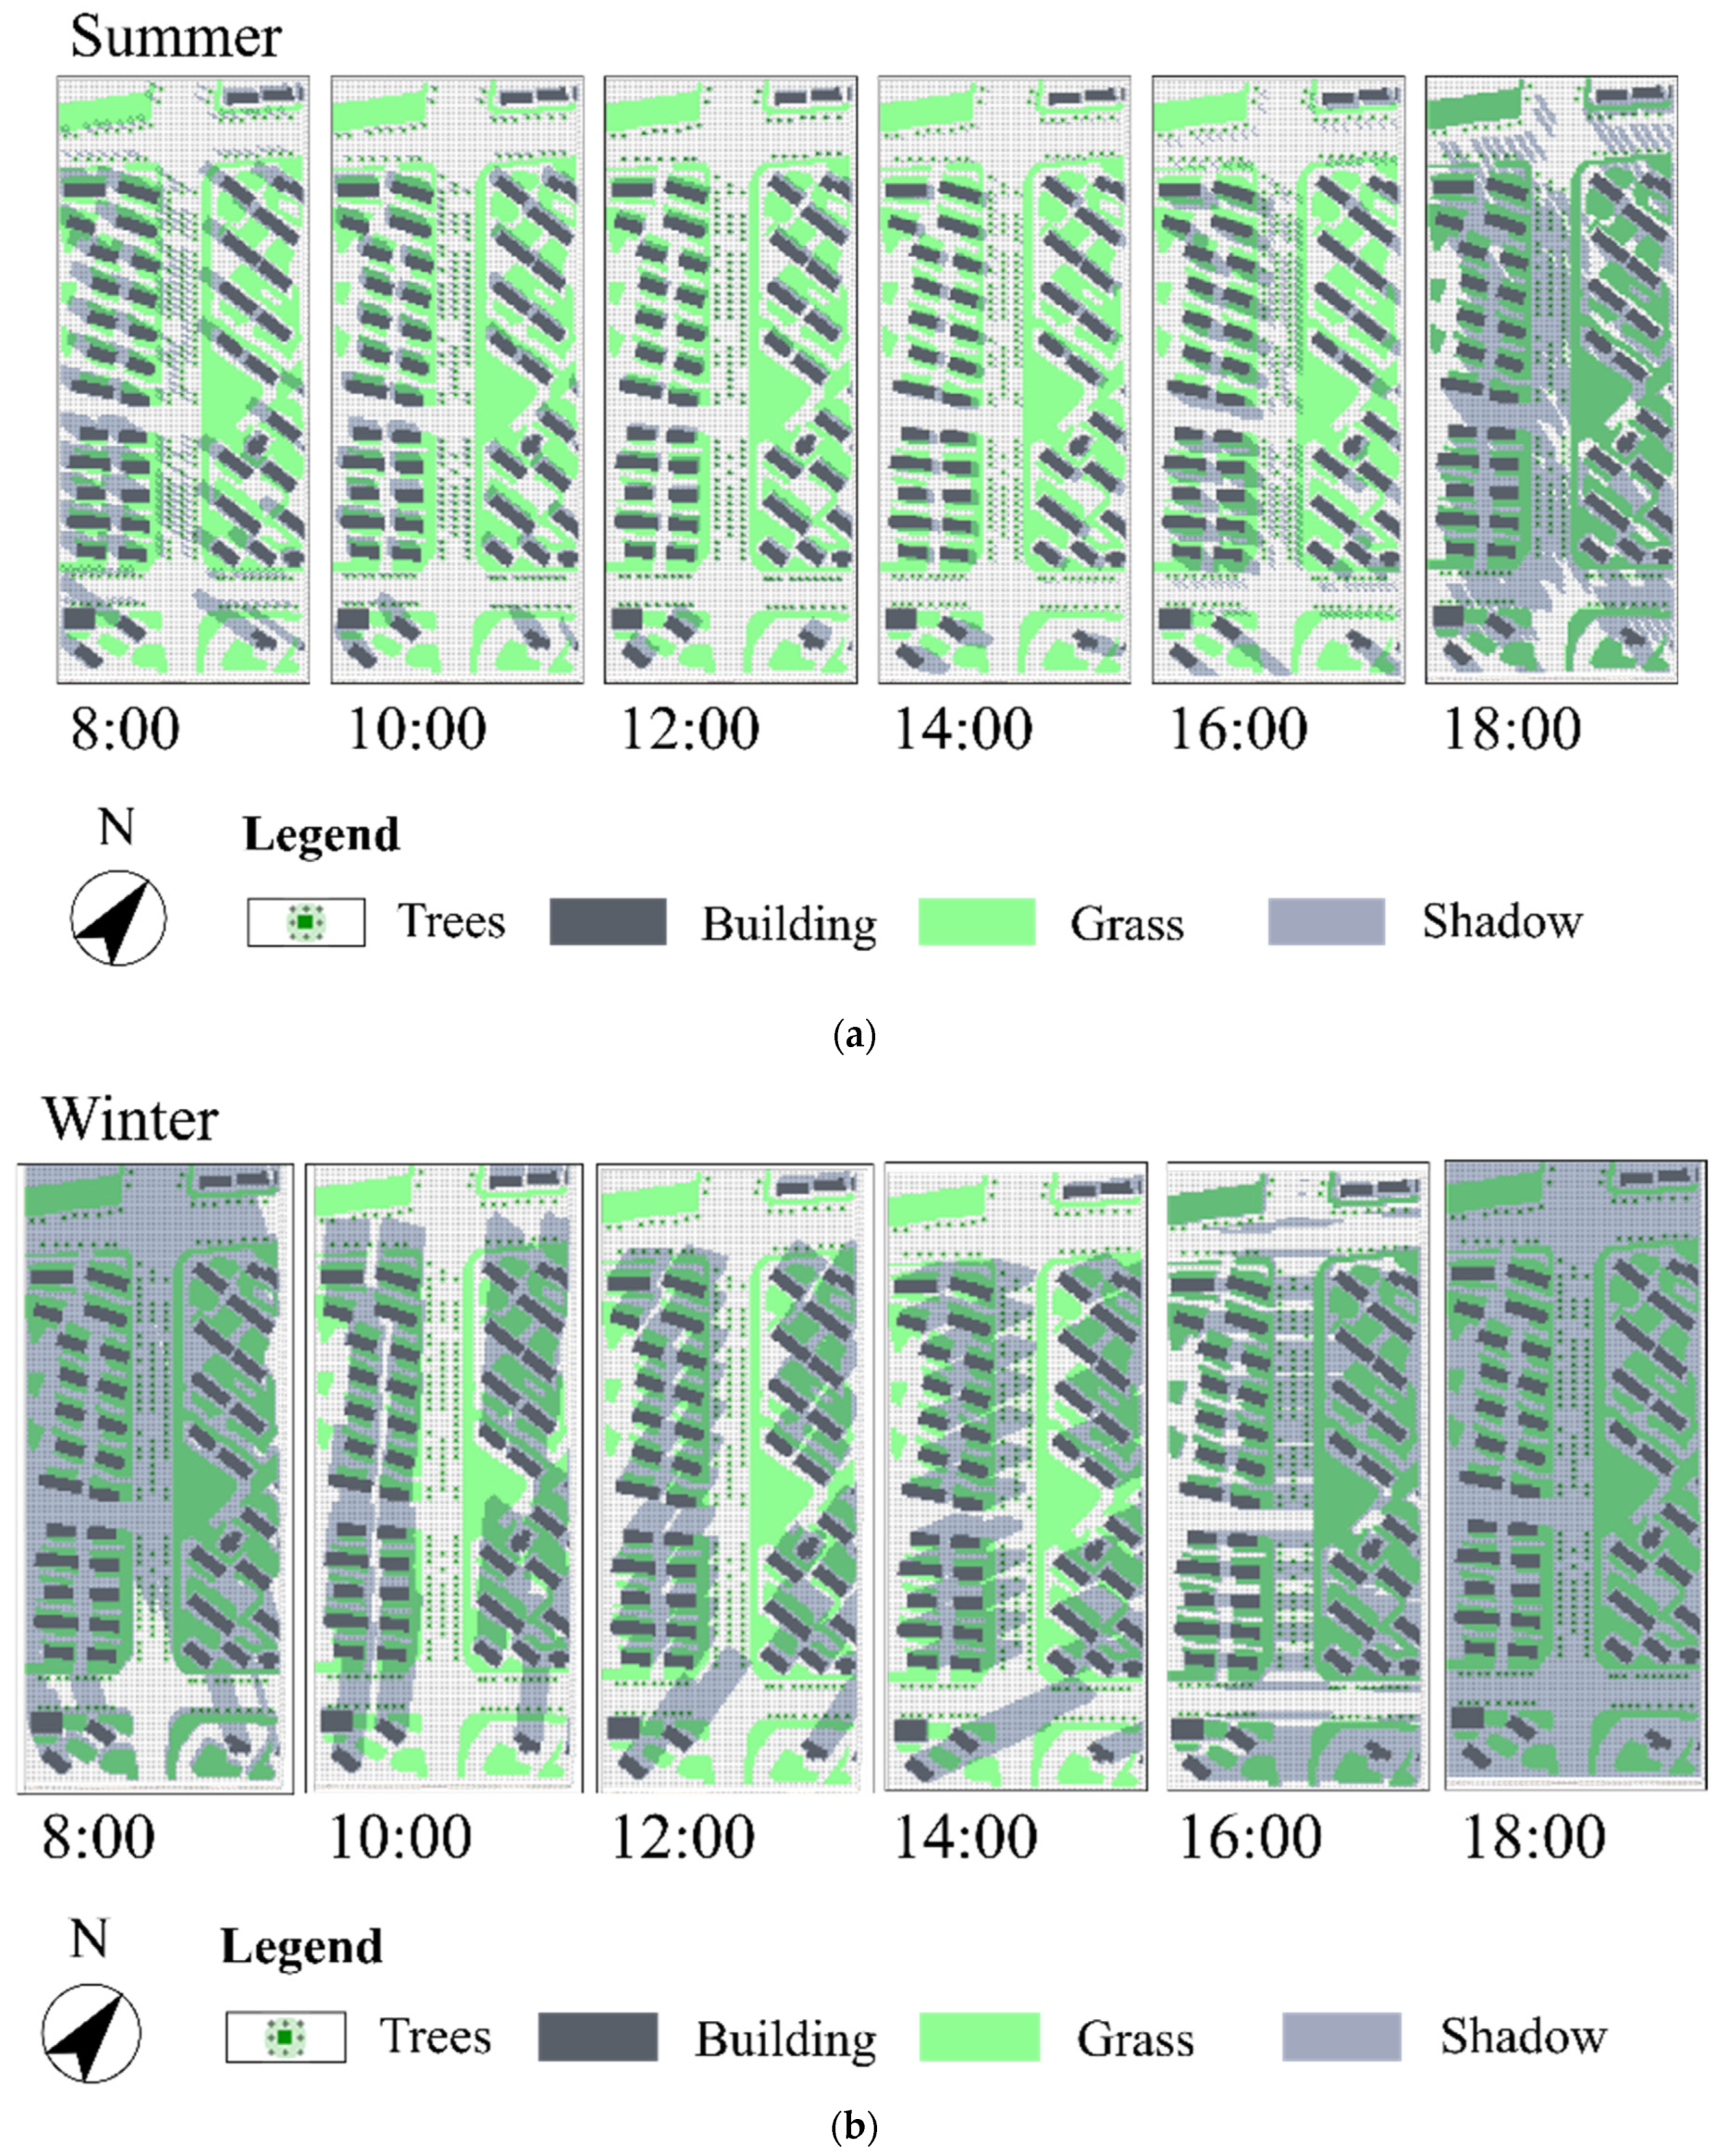
  • The univariate experiment on the vegetation ratio: The street area, comprising traffic lanes, sidewalks, and green belts, was modeled with different vegetation quantities, types, and layouts, resulting in scenarios with 0% (VR0), 30% (VR30), 50% (VR50) trees, and 70% grass (VR70) (Figure 6).
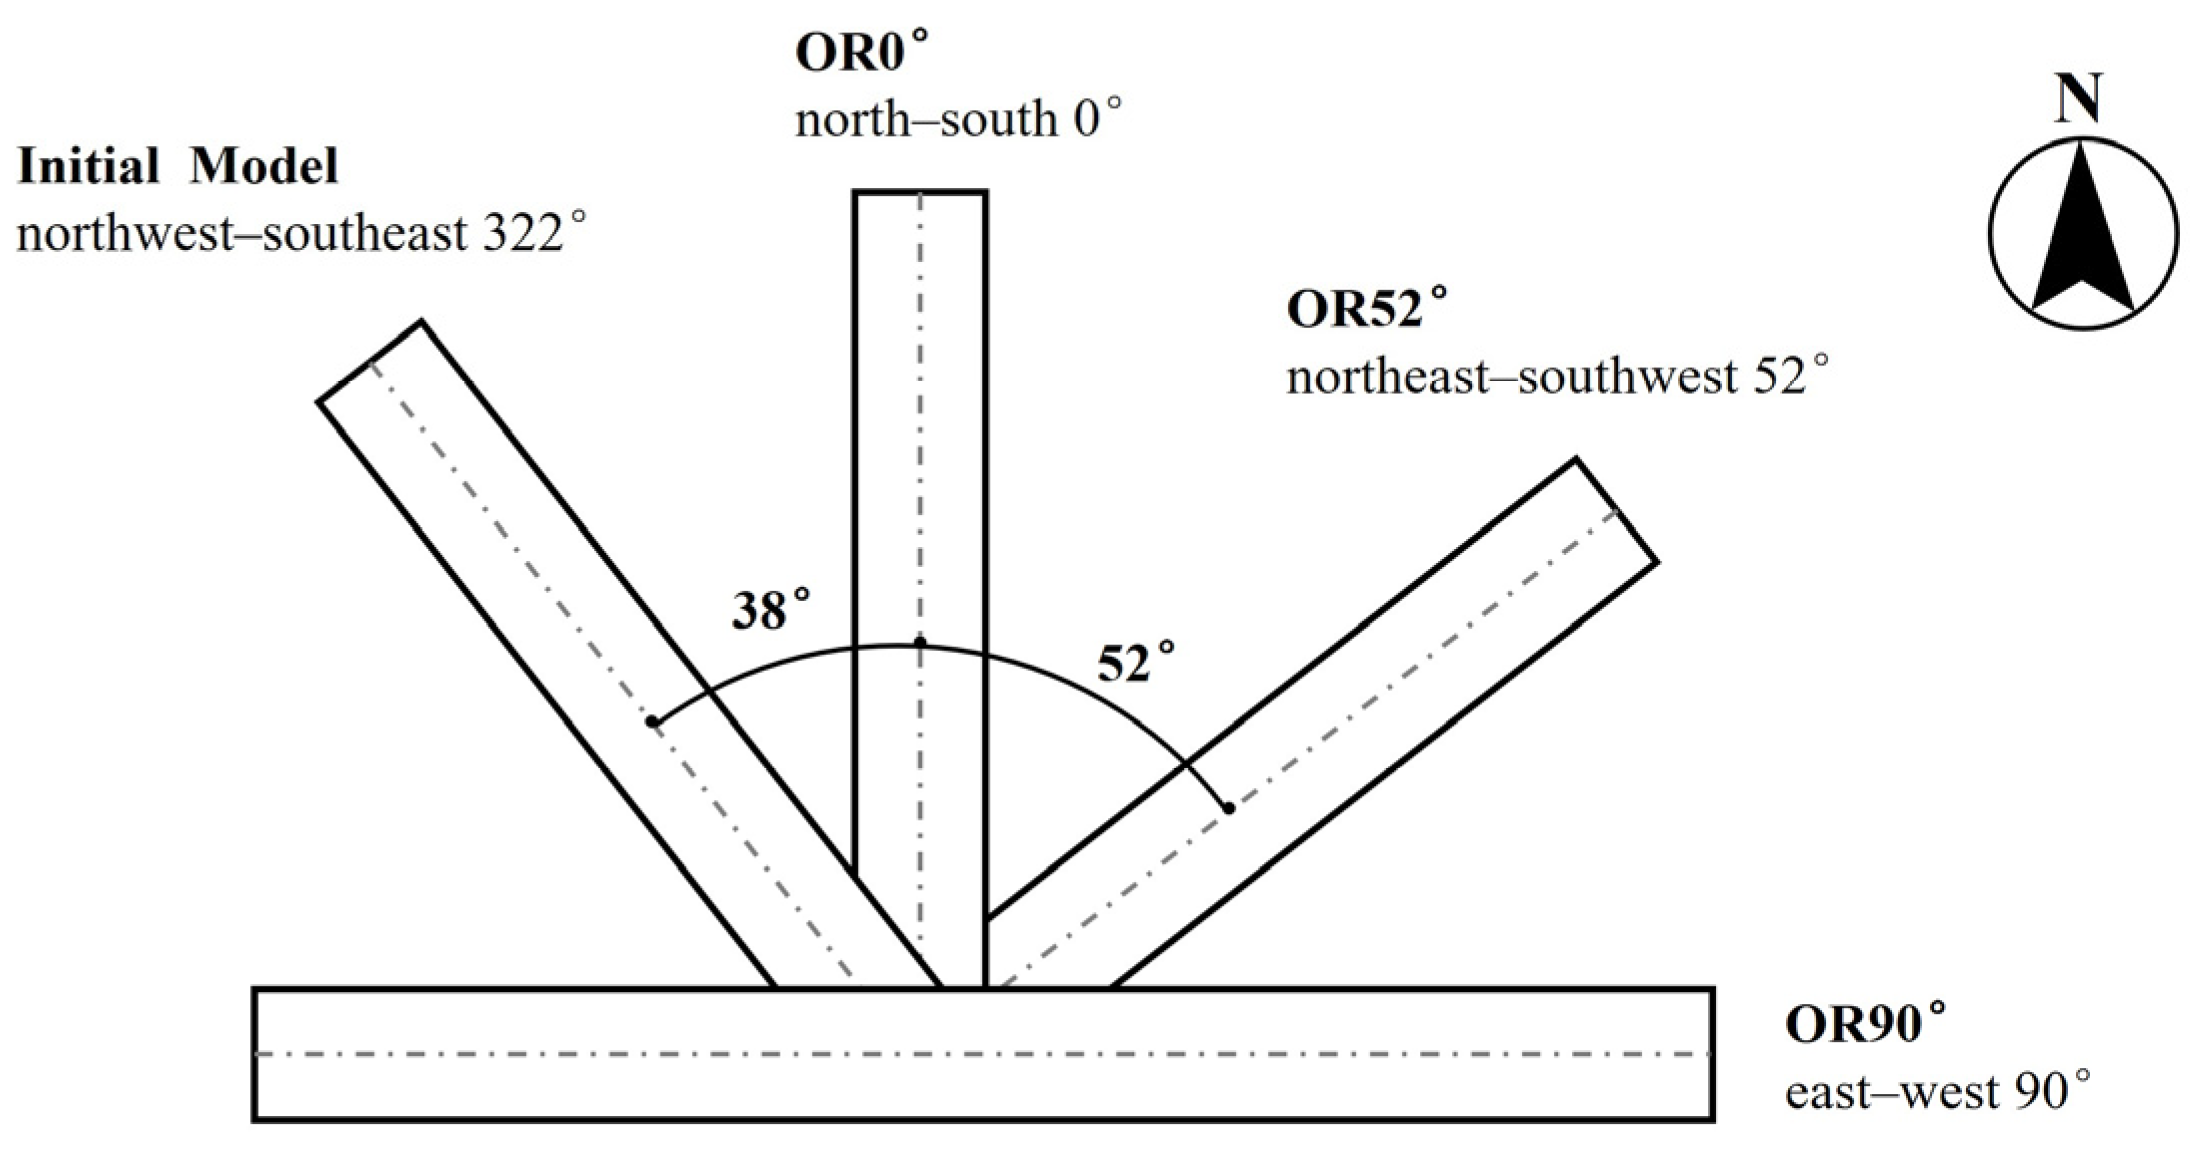
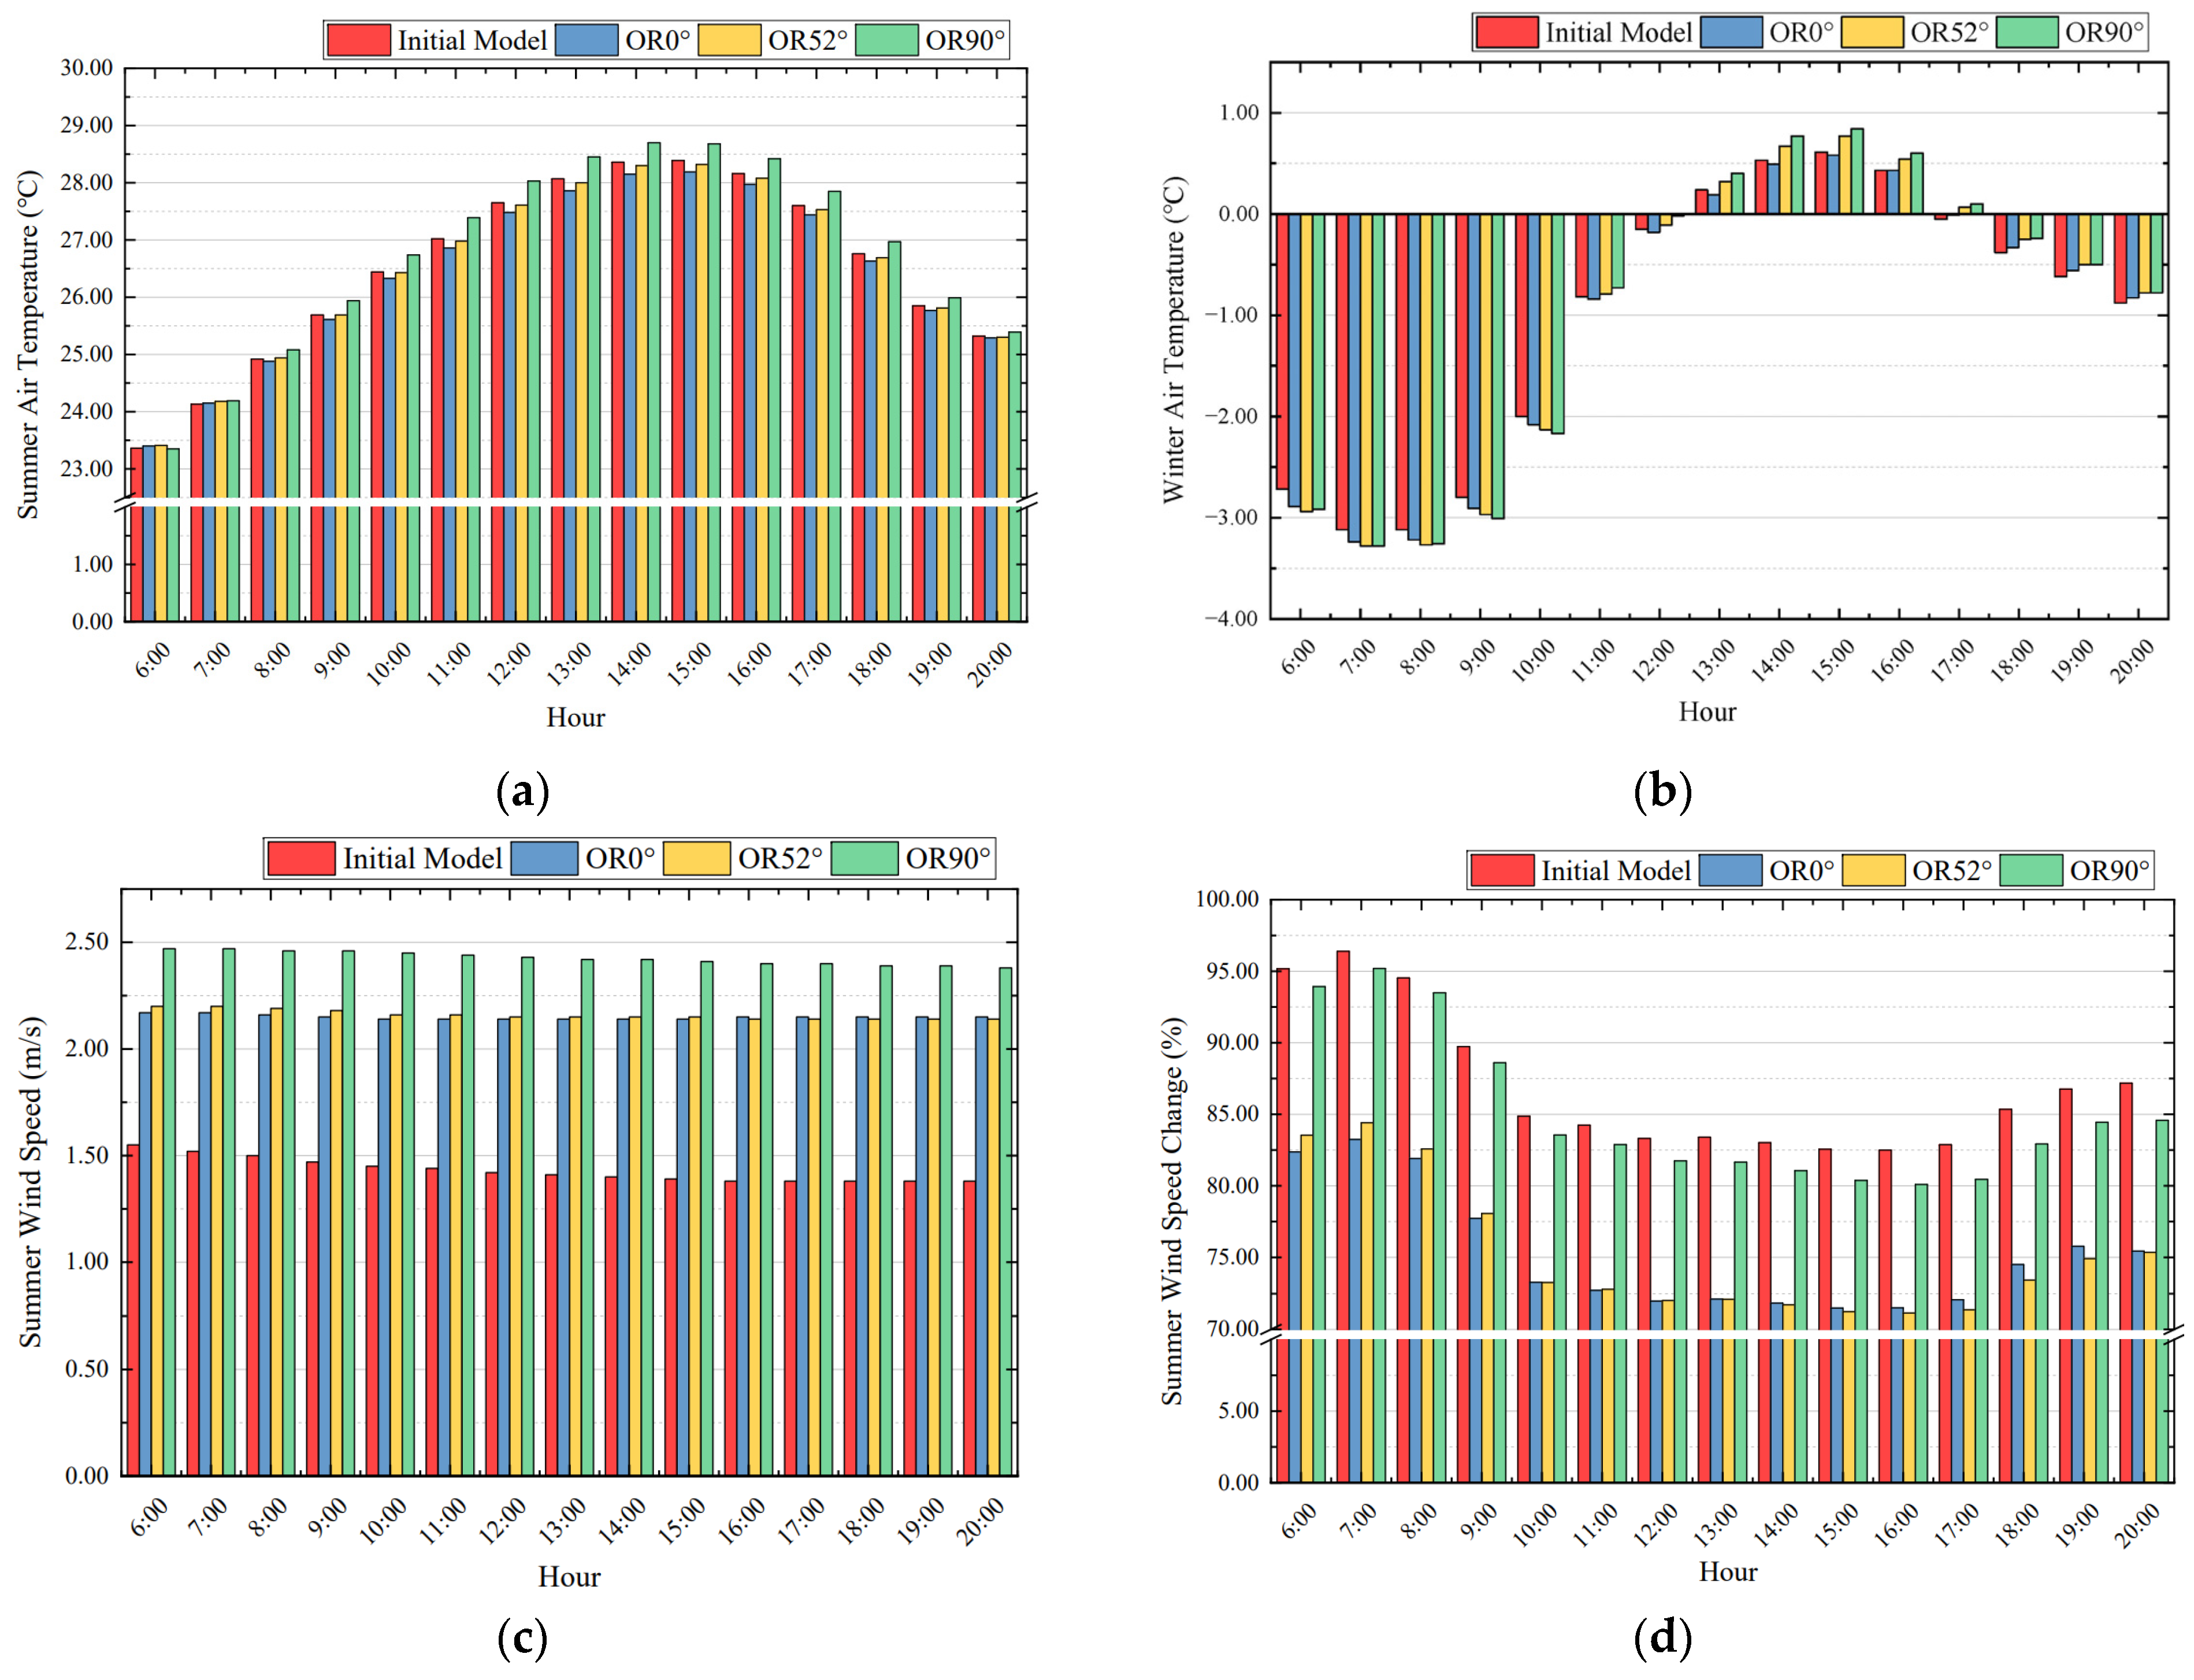
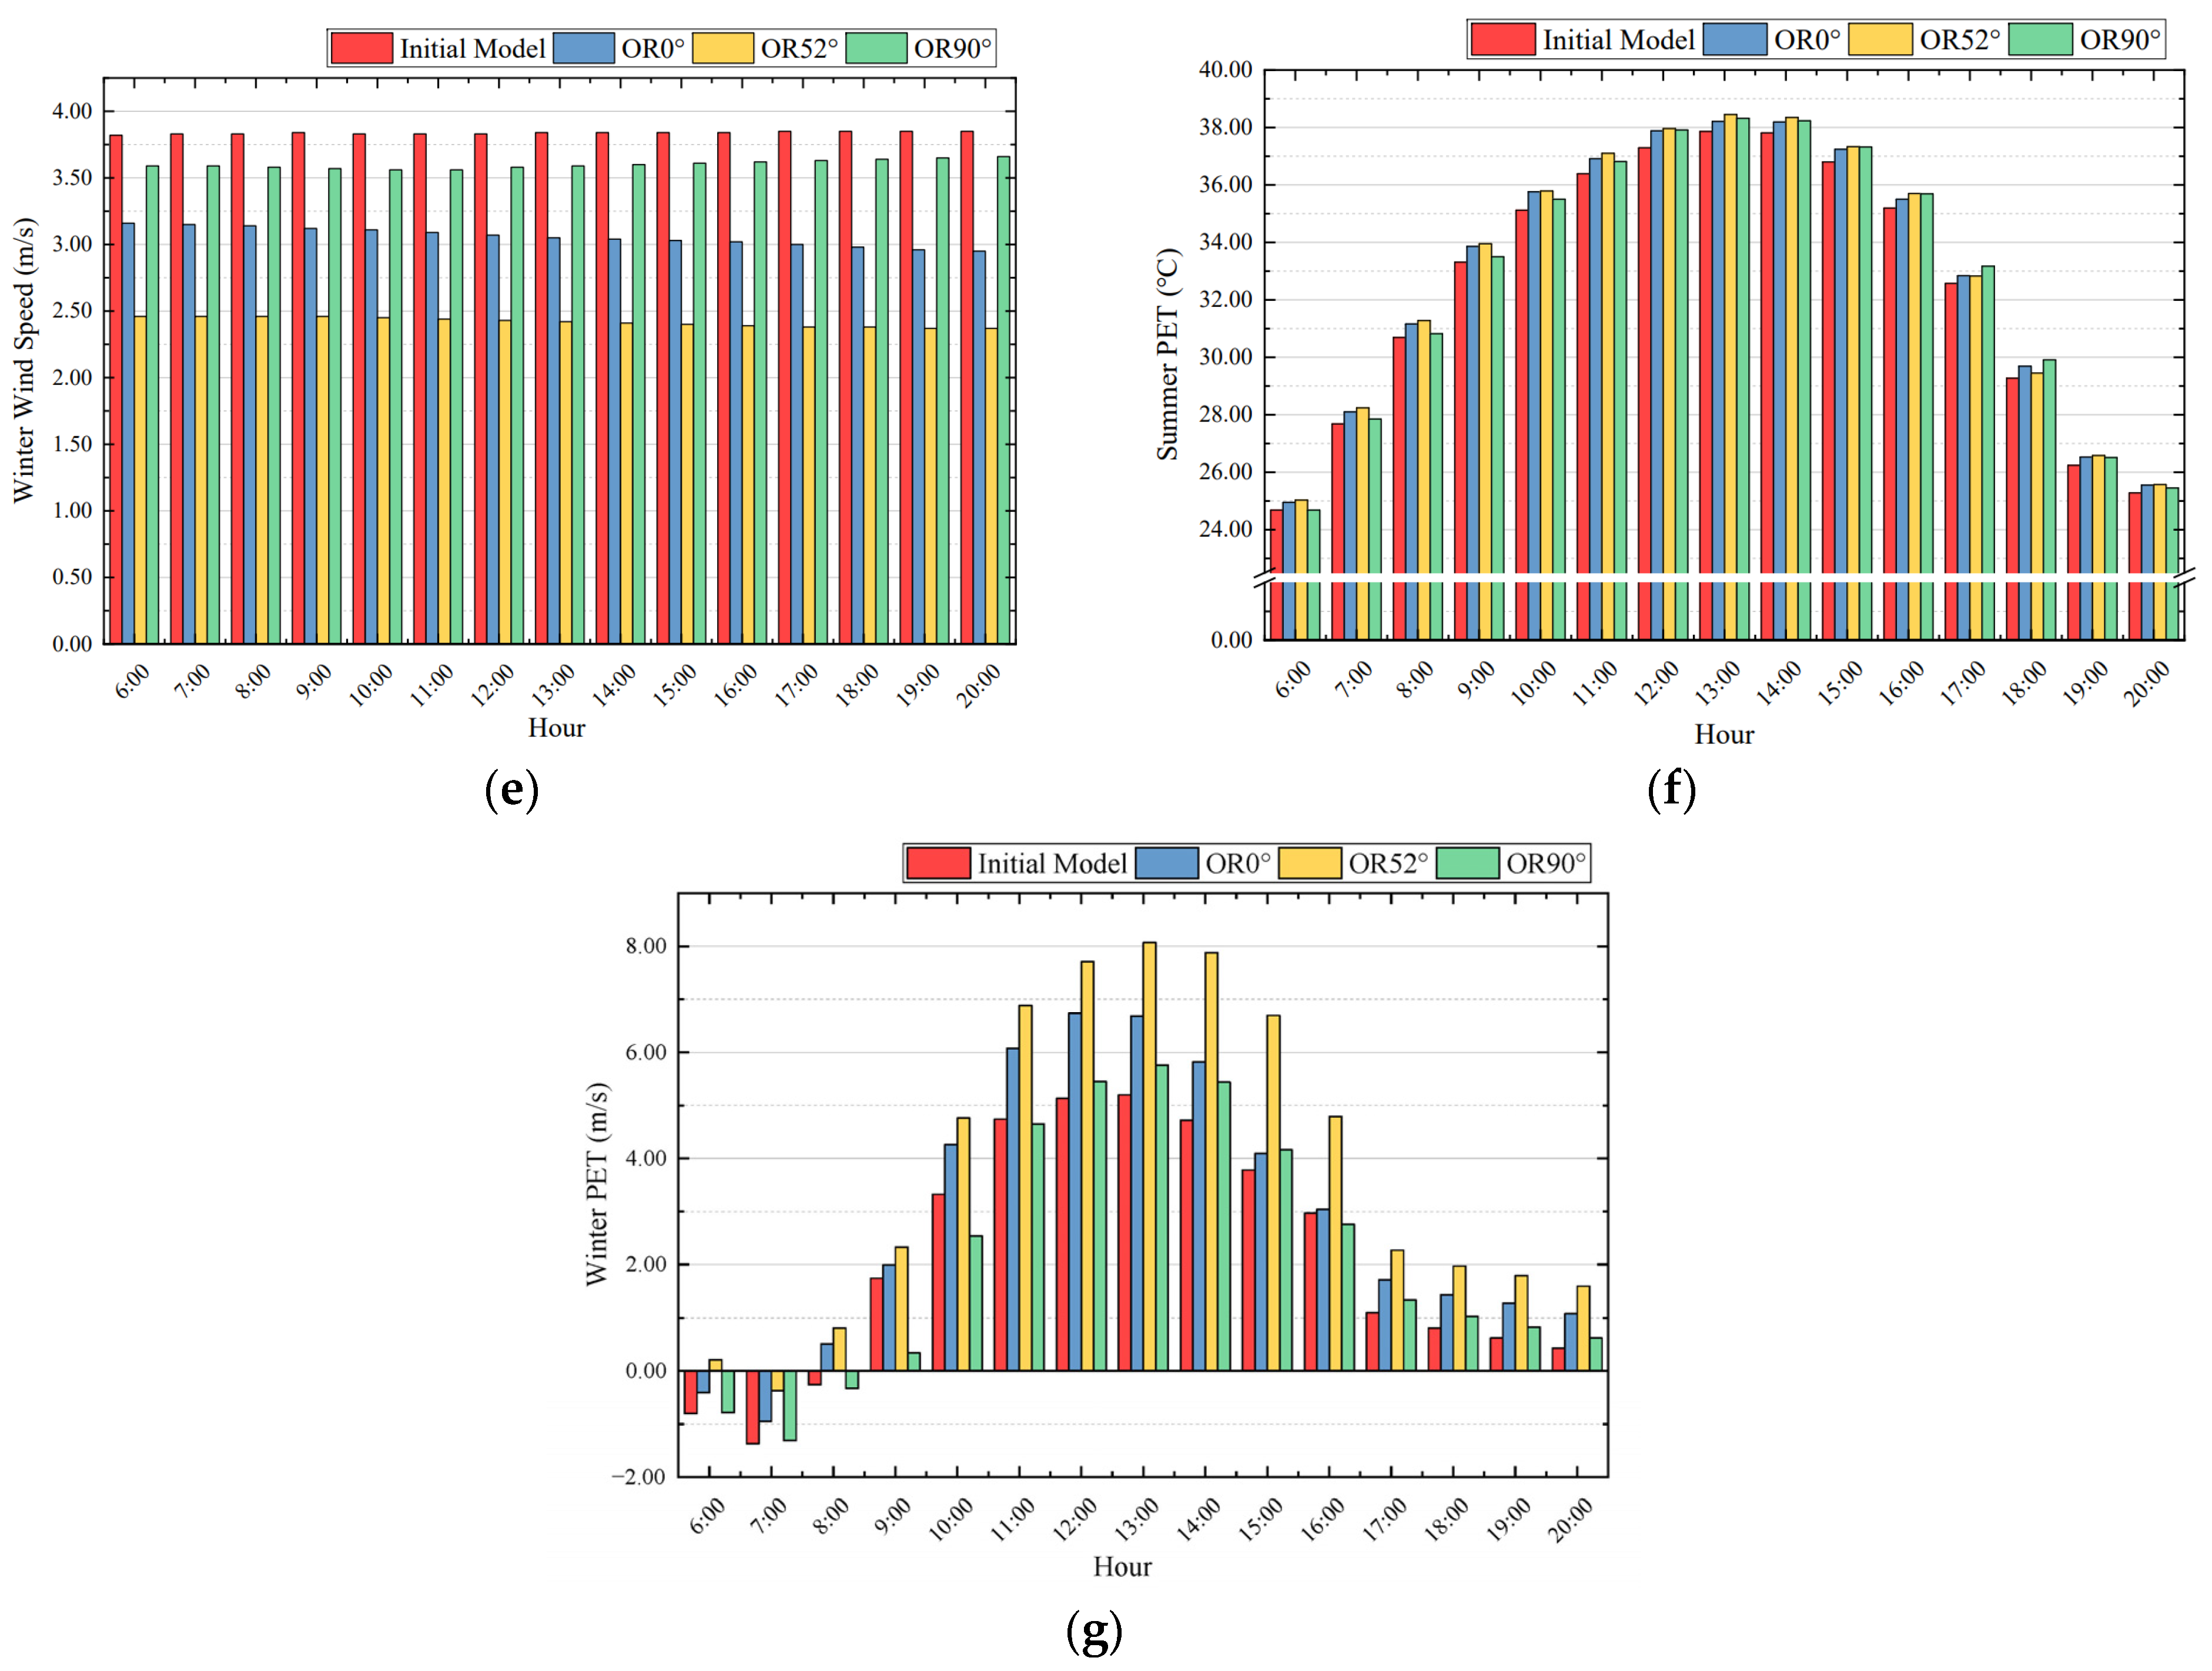
  • The univariate experiment on the street orientation: The street orientation directly influences the street’s angle relative to monsoon winds and solar radiation. New models were constructed by altering the model’s direction. These models were configured with different orientations: north–south (N–S) at 0° (OR0°), northeast–southwest (NE–SW) at 52° (OR52°), and east–west (E–W) at 90° (OR90°) (Figure 7). The angle between the street and the monsoon is shown in Table 2.
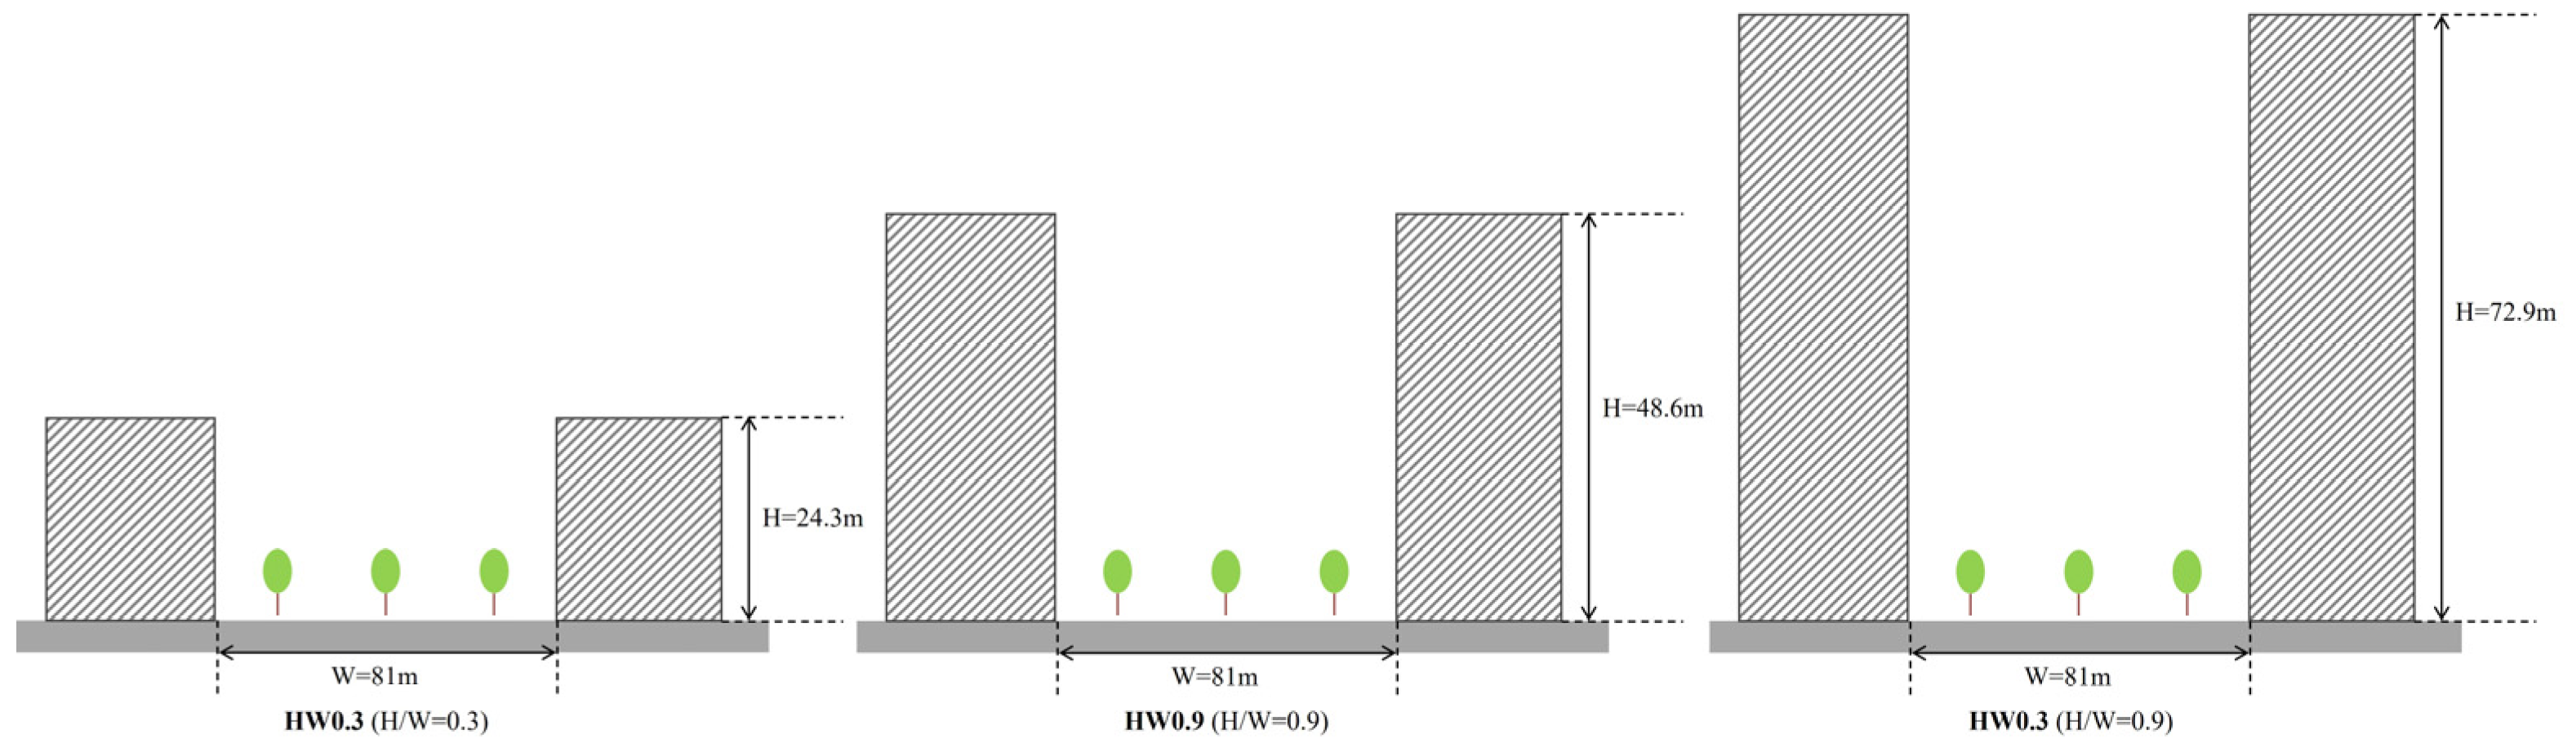
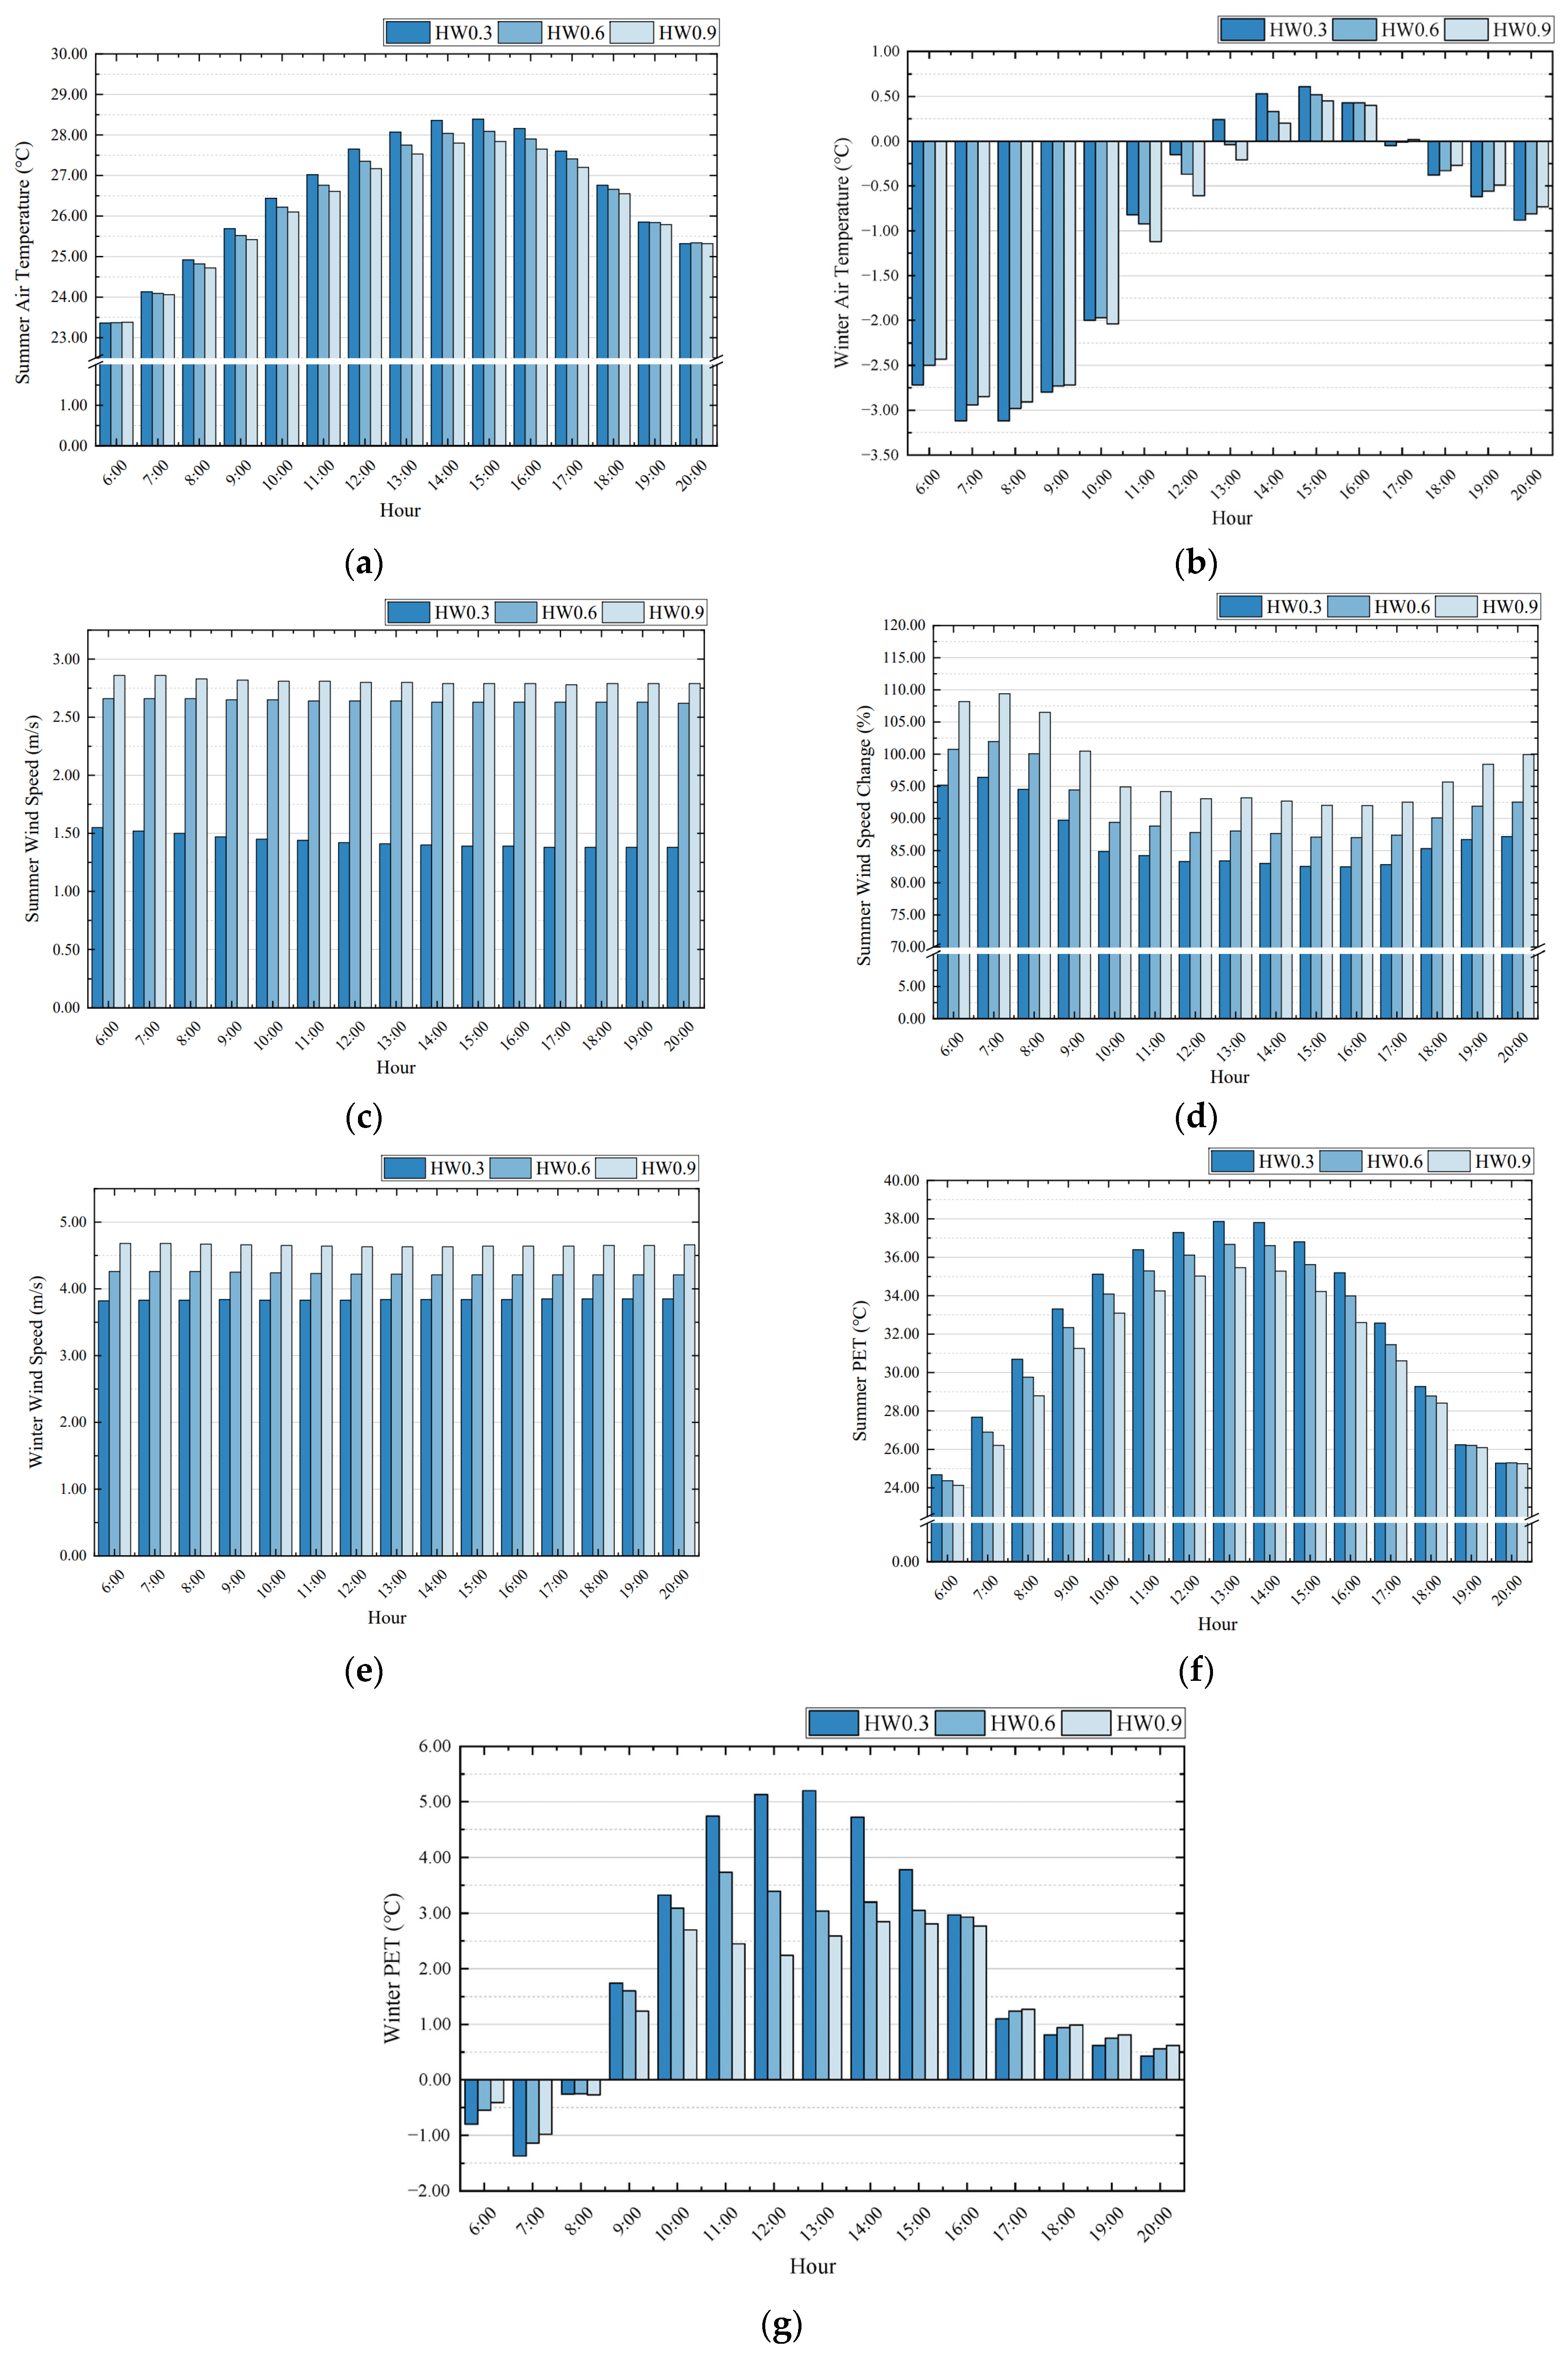
  • The univariate experiment on the street aspect ratio: New models were created by altering the building heights on either side of the street, thus adjusting the ratio of building height to the street width. The models were set with varying aspect ratios: H/W = 0.3 (HW0.3), H/W = 0.6 (HW0.6), and H/W = 0.9 (HW0.9) (Figure 8).

2.4. Thermal Comfort and Carbon Emissions

2.4.1. PET

PET is used to describe human thermal comfort. It is a comprehensive index considering climatic factors such as air temperature, wind speed, and humidity, as well as human activities, physiological conditions, and clothing. It has a high predictive accuracy and is adaptable to various climates throughout the year [46]. We calculated the PET with the BIO-met plug-in for ENVI-met 5.6.1 [45]. A typical human profile was set to standardize the conditions, i.e., a 35-year-old male wearing 0.90 cloth of outdoor clothing and walking at a preferred speed of 1.34 m/s.

2.4.2. Energy Consumption

We utilized Energy Plus to analyze the standard units (Figure 9) on the first, third, and fifth floors of the apartments in the study area, assessing their energy consumption across various conditions. These floors represented different outdoor microclimates. We could draw more accurate conclusions by calculating the energy use and carbon emissions specific to each apartment type. We compared the energy consumption during a typical summer day to winter conditions across ten scenarios to identify the most energy-efficient street space characteristics. The detailed design specifications for the apartments are provided in Table 3. The internal load characteristics are outlined in Table 4, based on the Chinese standard GB 55015 [47] and household survey data. Air conditioning was activated when indoor temperatures exceeded 26 °C in summer, and boiler heating was triggered below 18 °C in winter, with other building features set to default values in Energy Plus.
ENVI-met 5.6.1 provided hourly data on the dry bulb temperature, relative humidity, and wind speed for typical summer and winter days. The dew point temperature was calculated using an enthalpy humidity chart. The wind direction remained consistent with the initial ENVI-met 5.6.1 settings. These data were integrated into the EPW file for the Energy Plus simulations, enabling energy consumption calculations for the simulated unit.

2.4.3. Carbon Emissions

Reducing carbon emissions presents a significant global challenge, leading countries to establish nationally determined contributions (NDCs) to achieve reduction targets. Governments and businesses have implemented various policies, such as carbon taxes, emissions trading systems (ETSs), and carbon neutrality commitments. China aims for carbon peaking and neutrality by 2060. This research built on previous studies by converting summer cooling and winter heating energy consumption into carbon emission values, facilitating a clearer assessment of the environmental impact of residential energy use. This approach also simplifies international comparisons, supporting the development of global standards and agreements for energy conservation and emission reduction.
We converted the summer cooling energy and winter heating energy into carbon emissions using the carbon coefficient method to assess the environmental impact of residential energy use. This method accounted for variations in carbon emission coefficients due to diverse energy production technologies worldwide, highlighting the need for region-specific emission calculations. We applied the standards and values from Tianjin’s 2020 “Technical Guide for Verification of Building Greenhouse Gas Emission” for accurate carbon accounting.
Formula (1) expresses the quantitative calculation of CO2 greenhouse gas:
E = i = 1 n ( D i × F i )
  • E—the CO2 greenhouse gas emissions from buildings (tCO2);
  • Di—the activity data of type i emission sources, i.e., the type i energy material quantity;
  • Fi—the emission factors for type i energy sources.
For summer, our study targeted the main source of residential cooling energy: electricity-powered air conditioning. We used the “Carbon Dioxide Emission Factor of Electric Power in 2021” from China’s Ministry of Ecology and Environment and the National Bureau of Statistics, with Tianjin’s average electricity factor being 0.7366 kgCO2/kWh. For winter, the examined unit’s heating came from government central heating, delivered via hot water to house radiators. According to the data published by the China Energy Statistical Yearbook, the purchased thermal emission factor for Tianjin is 0.09900 tCO2/GJ.
Therefore, the carbon emission data of summer cooling and winter heating energy consumption were calculated via Formulas (2) and (3):
E c o o l i n g = E C c o o l i n g × E F g r i d
  • Ecooling—carbon emissions from air conditioning in summer (kgCO2);
  • ECcooling—energy consumption for air conditioning during summer (kWh);
  • EFgrid—average carbon dioxide emission factor for electricity (0.7366 kgCO2/kWh).
E h e a t i n g = ( E C h e a t i n g × E F ) × 1000
  • Eheating—carbon emissions from heating in winter (kgCO2);
  • ECheating—energy consumption for heating in winter (GJ);
  • EF—greenhouse gas emission factor for purchased heat (0.09900 tCO2/GJ).

3. Results

3.1. Basic Thermal Environmental Characteristics

Figure 10 illustrates the solar radiation pattern simulated with ENVI-met 5.6.1. The shadow cast by buildings was minimal in summer (Figure 10a) and more pronounced in winter (Figure 10b), with the narrowest shadow occurring from 10:00 to 12:00. Street temperatures rose throughout the morning, reaching a high of 28.39 °C in summer and a modest 0.61 °C in winter at 15:00 (Figure 11a). Summer humidity plummeted to 42.29% by 16:00 before increasing as solar radiation diminished. Winter humidity remained stable (Figure 11b). The wind speed was 1.38–1.55 m/s in summer and 3.82–3.85 m/s in winter, which was significantly higher (Figure 11c). The PET escalated to its peak at 13:00, registering at 37.86 °C in summer and 5.20 °C in winter, which was more gradual (Figure 11d).

3.2. Characteristics of Influence of Each Variable on Microclimate

(1) Vegetation ratio: In summer, streets with 50% trees provided optimal cooling, while in winter, streets with 50% trees or 70% grass were coldest. Streets with no trees were warmer due to more sunlight (Figure 12a,b). Temperature regulation by vegetation was most notable at 15:00 in summer and 12:00 in winter. The vegetation ratio’s impact on summer temperatures was more significant, with standard deviations (SDs) ranging from 0.02–0.09 in summer to 0.01–0.08 in winter. Summer wind speeds within the comfortable range of 1.00–5.00 m/s were achieved with all vegetation ratios. Therefore, analyzing the wind speed changes (the ratio of a point’s average wind speed to the undisturbed incoming flow’s average) was critical for assessing wind environment stability. Streets with no trees had higher summer wind speeds (2.92 m/s) and less stability, while 50% trees resulted in the lowest (2.42 m/s) and highest stability (Figure 12c,d). Winter featured lower wind speeds, with no-tree streets at 4.17 m/s and streets with 50% trees at 3.77 m/s (Figure 12e). Streets with no trees and 70% grass had higher summer PETs, with 30% and 50% trees significantly lowering the daytime PET. In the evening, streets with 50% trees and 70% grass had a lower PET (Figure 12f,g).
(2) Street orientation: E–W streets had the highest and N–S streets the lowest summer temperatures, with a difference of up to 0.59 °C at 13:00. Winter temperatures were less predictable, with NW–SE streets being warmest in the morning, while E–W temperatures rose from noon to evening (Figure 13a,b). The orientation significantly affected summer temperatures more than winter, with the summer SD being 0.03–0.25 compared with that of winter of 0.05–0.13. Summer saw the highest wind speeds on E–W streets (2.43 m/s) and the lowest on NW–SE streets (1.43 m/s). N–S and NE–SW provided more wind stability (Figure 13c,d). In winter, wind speeds decreased as the street alignment diverged from the monsoonal direction, with NW–SE experiencing the highest wind speeds (3.84 m/s) and NE–SW the lowest (2.42 m/s) (Figure 13e). The variations in the PET in summer were minimal, with NW–SE providing the best thermal comfort. NE–SW experienced the highest PET from morning to afternoon, and E–W in the evening, with a maximum difference of 0.71 °C. In winter, NE–SW offered the best thermal comfort, with N–S being the coolest in the morning and NW–SE in the afternoon, showing PET differences of up to 3.17 °C, a significant increase from summer (Figure 13f,g).
(3) Street aspect ratio: The summer air temperature and wind speed increased with the street aspect ratio. The H/W = 0.9 street showed the lowest temperatures, especially at noon due to building shadows (Figure 14a), and the highest wind speeds at 2.86 m/s. It was 1.42 m/s more than H/W = 0.3 with the optimum stability (Figure 14c,d). Conversely, H/W = 0.3 recorded the highest temperatures in winter, with a maximum difference of 0.24 °C at noon, and had the lowest wind speed (Figure 14b,e). The aspect ratio significantly affected the summer wind speeds, with a standard deviation of 0.71–0.77, compared with 0.40–0.42 in winter. The PET decreased with higher aspect ratios in both seasons, notably at noon in summer. In winter, H/W = 0.3’s PET was lowest in the morning and highest during intense sunlight. H/W = 0.9 resulted in the lowest daytime PET due to its extensive building shadows, significantly differing from other streets (Figure 14f,g).
In summary, the best scenario for temperature was a street with 50% trees, an N–S orientation, and H/W = 0.9 in summer. In winter, it was a no-tree, E–W orientation street, with H/W = 0.3. The best scenario for the wind environment was a street with 50% trees, an NE–SW orientation, and H/W = 0.3. The best scheme for the PET in summer was a street with 50% trees, a NW–SE orientation, and H/W = 0.9. In winter, it was 70% grass and an NE–SW orientation with H/W = 0.3.

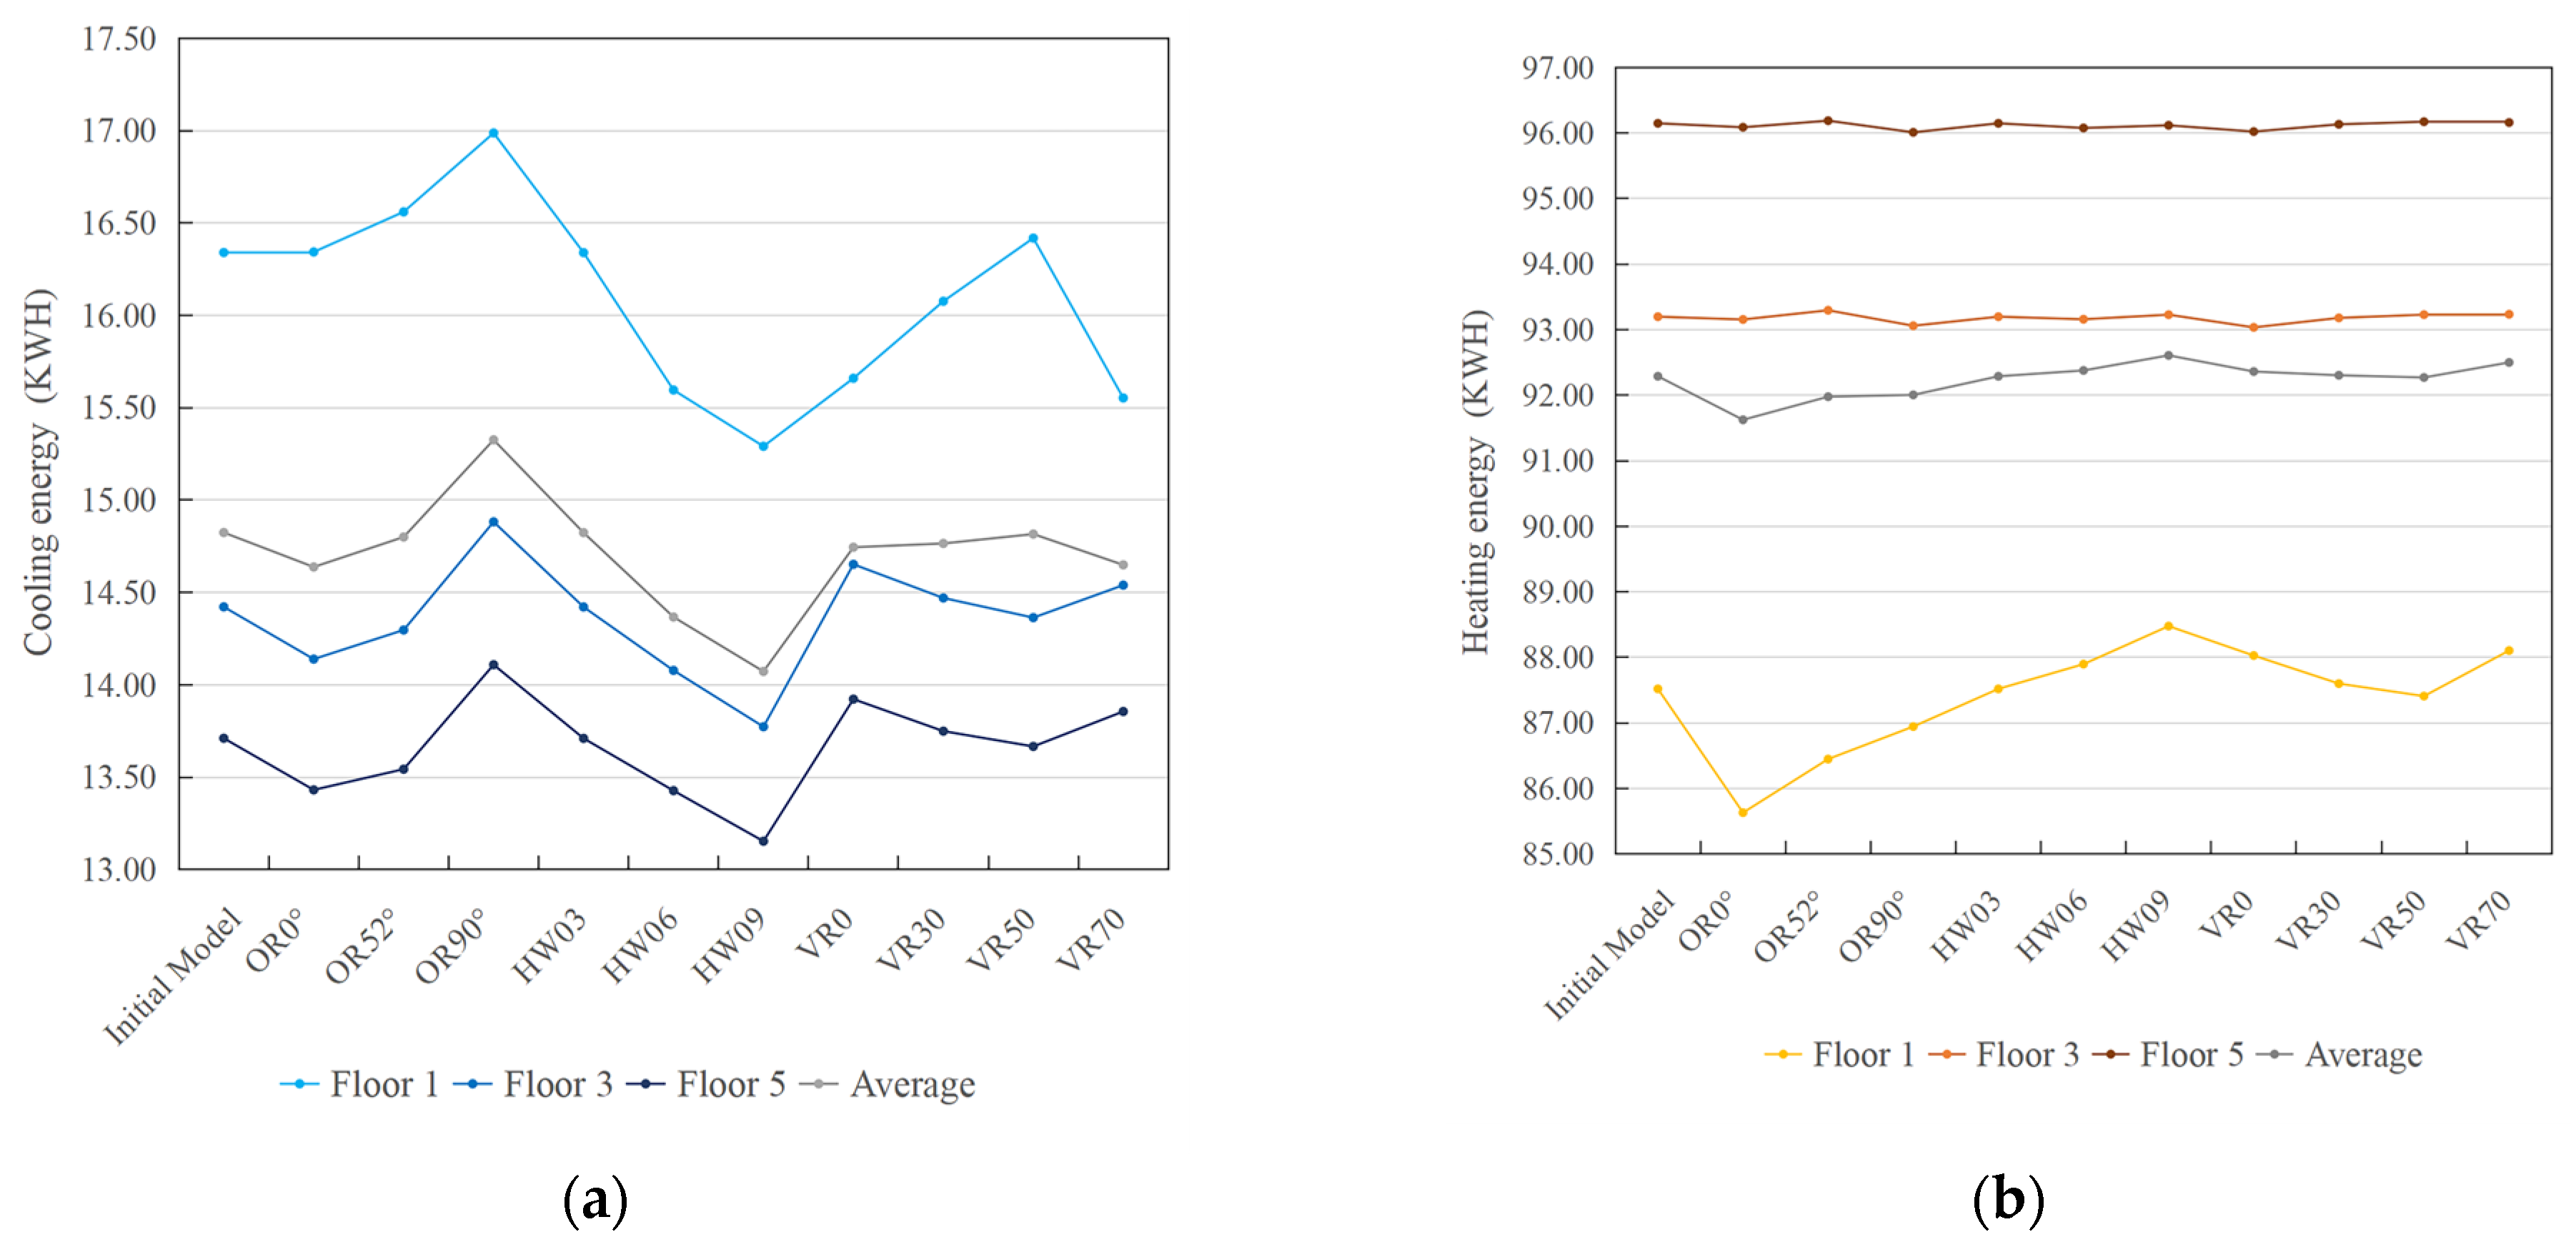
3.3. The Impacts of Street Layout on Energy Consumption and Carbon Emissions

The energy consumption of the first, third, and fifth floors during summer and winter was calculated and compared with the initial model (Figure 15). The first-floor units exhibit higher carbon emissions in summer and lower emissions in winter than the other floors. Summer emissions decreased as the floor level increased, while the winter energy demand significantly rose. The average winter energy consumption was approximately 6.0–6.6 times that of summer (Table 5). The carbon emissions were approximately 2.9–3.2 times higher, underscoring the need for winter carbon reduction.
Comparing the energy consumption across orientations, the N–S and NW–SE orientations yielded the highest efficiency in summer, saving an average of 0.69 kWh compared with the E–W direction, which exhibited the highest consumption. In winter, the NE–SW orientation was most efficient, saving 0.66 kWh over the NW–SE initial model. The optimal street aspect ratio was H/W = 0.9 in summer (with savings of 0.75 kWh). In winter, H/W = 0.3 was optimal, making H/W = 0.9 the least efficient value with an additional 0.32 kWh of consumption. Regarding vegetation, streets following the initial model (40% trees) exhibited the highest energy consumption. Streets with 70% grass were most efficient in summer, saving 0.18 kWh. In winter, streets with 50% trees were the most efficient, consuming 0.23 kWh less than those with 70% grass.
In summary, the energy consumption responses to seasonal variables were generally opposing. Thus, identifying the best solution required balancing the carbon emissions from both cooling and heating. Emphasizing winter energy savings, the optimal design featured a street with 50% trees, an NE–SW orientation, and an aspect ratio of H/W = 0.3.

4. Discussion

We analyzed the correlation between the PET and energy consumption during summer and winter under varying conditions to examine the combined influence of the street vegetation ratio, orientation, and aspect ratio on the PET and energy consumption. The analysis revealed the following:
  • The winter street orientation had a positive correlation with the PET (R2 = 0.737) and a negative correlation with energy consumption (R2 = 0.869), indicating that a larger angle between streets and the monsoon enhances PET values and lowers energy usage; however, there was no significant correlation between street orientation and PET and energy consumption in summer. The street aspect ratio had a more pronounced effect on the PET and energy consumption.
  • The street aspect ratio was negatively correlated with the PET in both summer and winter (R2 = 0.997 and 0.985). Moreover, it was negatively correlated with energy consumption in summer (R2 = 0.962) and positively correlated in winter (R2 = 0.981). This suggests that taller buildings, reflected in the aspect ratio, result in lower and higher energy consumption in summer and winter, respectively.
  • Tree cover showed a negative correlation with the PET in both summer and winter (R2 = 0.997 and 0.962) but had no significant correlation with energy consumption. The PET was primarily influenced by the street aspect ratio and vegetation cover in summer, whereas it was affected by the street orientation, aspect ratio, and vegetation coverage in winter. Conclusively, the optimal street design for summer features H/W = 0.9 with 50% trees; meanwhile, for winter, it features NE–SW streets with H/W = 0.3 and no trees.
Energy consumption trends differ by season, with summer focusing on outdoor comfort and winter on carbon emissions. The optimal model balances these needs, enhancing aspect ratios and angles between streets and the monsoon. We recommend 50% trees to optimize the PET in summer and reduce winter emissions.
This study differs from previous findings due to the geographical variations in climate zones. While hot arid climates indicate a minimal tree impact on building temperature [37], our analysis in cold zones revealed contrasting results. In hot arid cities, streets with 70% grass have the lowest summer air temperatures. Conversely, in cold zones, streets with 50% trees achieve the lowest temperatures, but the same vegetation ratio leads to poor daytime thermal comfort in winter. Energy consumption significantly varies with the vegetation ratio. Streets with 70% grass are most efficient in hot arid areas, while in cold cities, they incur the highest winter energy consumption. Additionally, the benefits of aspect ratios for summer thermal comfort align with those identified in earlier studies [49].
However, the conclusions on energy consumption differ. In severely cold zones, a higher street aspect ratio does not necessarily lead to increased energy efficiency; instead, a moderate value, such as H/W = 0.5, is optimal [50]. In contrast, in cold zones, a higher street aspect ratio correlates with lower energy consumption. We speculate that this discrepancy arises from varying demands for air conditioning in summer and heating in winter across different climate zones. The results for street orientation show both similarities and differences compared with findings in hot and humid areas [36]. The best street orientations for comfort in hot and humid climates are N–S and NW–SE, while E–W is the least favorable. In cold areas, although NW–SE also provides the best thermal comfort, N–S and E–W do not demonstrate clear distinctions in performance.
Therefore, cold regions should select different design elements from other climate zones to comprehensively address thermal comfort in summer and carbon emissions reduction in winter. Future research should expand the sample sizes, employ multi-objective optimization, and refine strategies for optimal thermal comfort and energy reduction, considering winter adaptability, which is crucial for urban low-carbon energy-saving designs and sustainable development.

5. Conclusions

The effects of the vegetation ratio, street orientation, and aspect ratio on outdoor thermal comfort, summer cooling, winter heating energy consumption, and carbon emissions in urban buildings were explored via field investigations, microclimate measurements, and ENVI-met 5.6.1 simulations. Using Tianjin as a case study, this research presents the following findings:
  • Urban design in cold zones should prioritize outdoor thermal comfort in summer and carbon emissions reduction in winter. The data from Tianjin indicate that the carbon emissions from winter heating energy consumption are 2.9–3.2 times those during summer.
  • The street orientation significantly influences energy consumption and carbon emissions, particularly concerning the winter monsoon angle. Designs should maximize this angle and augment vegetation cover to manage carbon emissions while enhancing summer comfort. The street aspect ratio needs to be strategically planned to meet specific needs.
  • The PET showed a negative correlation with the vegetation ratio and aspect ratio during summer. In contrast, winter heating consumption correlated negatively with the street orientation and positively with the aspect ratio. To boost outdoor comfort in summer, the optimal configuration is NW–SE streets with H/W = 0.9 and 50% trees. For winter comfort and carbon emissions reduction, the optimal configuration is NE–SW streets with H/W = 0.3 and 50% trees.
This study offers insights for urban planning and setting energy-saving and carbon reduction benchmarks. By optimizing street layouts, this study contributes to enhancing comfort and reducing energy consumption and emissions and supports sustainable urban development and carbon neutrality initiatives. These findings apply to cities in cold zones of northern China.

Author Contributions

Conceptualization, L.W. (Lin Wang), T.C. and L.W. (Liuying Wang); Methodology, L.W. (Lin Wang) and L.W. (Liuying Wang); Software, Y.Y. and L.W. (Liuying Wang); Formal analysis, L.W. (Liuying Wang); Investigation, H.Z. and Y.C.; Resources, H.Z. and Y.C.; Data curation, Y.Y.; Writing—original draft, L.W. (Lin Wang); Writing—review & editing, L.W. (Lin Wang), Y.Y. and L.W. (Liuying Wang); Visualization, Y.Y.; Supervision, T.C., Y.Z. and X.M.; Project administration, L.W. (Lin Wang), Y.Z. and X.M. All authors have read and agreed to the published version of the manuscript.

Funding

This research received no external funding.

Data Availability Statement

All supporting data are cited in Section 2.

Acknowledgments

The authors thank the administration of NOAA and NCEI for the free data availability.

Conflicts of Interest

The authors declare no conflict of interest.

References

  1. Grimm, N.B.; Faeth, S.H.; Golubiewski, N.E.; Redman, C.L.; Wu, J.; Bai, X.; Briggs, J.M. Global change and the ecology of cities. Science 2008, 319, 756–760. [Google Scholar] [CrossRef] [PubMed]
  2. Xiong, Y.Z.; Huang, S.P.; Chen, F.; Ye, H.; Wang, C.P.; Zhu, C.B. The Impacts of Rapid Urbanization on the Thermal Environment: A Remote Sensing Study of Guangzhou, South China. Remote Sens. 2012, 4, 2033–2056. [Google Scholar] [CrossRef]
  3. Zhang, Y.S.; Balzter, H.; Liu, B.; Chen, Y.J. Analyzing the Impacts of Urbanization and Seasonal Variation on Land Surface Temperature Based on Subpixel Fractional Covers Using Landsat Images. IEEE J. Sel. Top. Appl. Earth Obs. Remote Sens. 2017, 10, 1344–1356. [Google Scholar] [CrossRef]
  4. Renard, F.; Alonso, L.; Fitts, Y.; Hadjiosif, A.; Comby, J. Evaluation of the Effect of Urban Redevelopment on Surface Urban Heat Islands. Remote Sens. 2019, 11, 299. [Google Scholar] [CrossRef]
  5. Nouri, A.S.; Costa, J.P.; Santamouris, M.; Matzarakis, A. Approaches to Outdoor Thermal Comfort Thresholds through Public Space Design: A Review. Atmosphere 2018, 9, 108. [Google Scholar] [CrossRef]
  6. Shafique, M.; Xue, X.; Luo, X. An overview of carbon sequestration of green roofs in urban areas. Urban For. Urban Green. 2020, 47, 126515. [Google Scholar] [CrossRef]
  7. Liu, D.D.; Zhou, S.H.; Wang, L.J.; Chi, Q.; Zhu, M.Y.; Tang, W.C.; Zhao, X.; Xu, S.Q.; Ye, S.Y.; Lee, J.Y.; et al. Research on the Planning of an Urban Ventilation Corridor Based on the Urban Underlying Surface Taking Kaifeng City as an Example. Land 2022, 11, 206. [Google Scholar] [CrossRef]
  8. Abdelmejeed, A.Y.; Gruehn, D. Optimization of Microclimate Conditions Considering Urban Morphology and Trees Using ENVI-Met: A Case Study of Cairo City. Land 2023, 12, 2145. [Google Scholar] [CrossRef]
  9. Bounoua, L.; Zhang, P.; Mostovoy, G.; Thome, K.; Masek, J.; Imhoff, M.; Shepherd, M.; Quattrochi, D.; Santanello, J.; Silva, J.; et al. Impact of urbanization on US surface climate. Environ. Res. Lett. 2015, 10, 084010. [Google Scholar] [CrossRef]
  10. Rodriguez Algeciras, J.A.; Coch, H.; De la Paz Perez, G.; Chaos Yeras, M.; Matzarakis, A. Human thermal comfort conditions and urban planning in hot-humid climates-The case of Cuba. Int. J. Biometeorol. 2016, 60, 1151–1164. [Google Scholar] [CrossRef]
  11. Georgescu, M.; Morefield, P.E.; Bierwagen, B.G.; Weaver, C.P. Urban adaptation can roll back warming of emerging megapolitan regions. Proc. Natl. Acad. Sci. USA 2014, 111, 2909–2914. [Google Scholar] [CrossRef]
  12. Shashua-Bar, L.; Tsiros, I.X.; Hoffman, M.E. A modeling study for evaluating passive cooling scenarios in urban streets with trees. Case study: Athens, Greece. Build. Environ. 2010, 45, 2798–2807. [Google Scholar] [CrossRef]
  13. Ng, E.; Chen, L.; Wang, Y.; Yuan, C. A study on the cooling effects of greening in a high-density city: An experience from Hong Kong. Build. Environ. 2012, 47, 256–271. [Google Scholar] [CrossRef]
  14. Aboelata, A.; Sodoudi, S. Evaluating the effect of trees on UHI mitigation and reduction of energy usage in different built up areas in Cairo. Build. Environ. 2020, 168, 106490. [Google Scholar] [CrossRef]
  15. Onishi, A.; Cao, X.; Ito, T.; Shi, F.; Imura, H. Evaluating the potential for urban heat-island mitigation by greening parking lots. Urban For. Urban Green. 2010, 9, 323–332. [Google Scholar] [CrossRef]
  16. Park, Y.; Guldmann, J.-M.; Liu, D. Impacts of tree and building shades on the urban heat island: Combining remote sensing, 3D digital city and spatial regression approaches. Comput. Environ. Urban Syst. 2021, 88, 101655. [Google Scholar] [CrossRef]
  17. Morabito, M.; Crisci, A.; Guerri, G.; Messeri, A.; Congedo, L.; Munafo, M. Surface urban heat islands in Italian metropolitan cities: Tree cover and impervious surface influences. Sci. Total Environ. 2021, 751, 142334. [Google Scholar] [CrossRef]
  18. Gomez-Martinez, F.; de Beurs, K.M.; Koch, J.; Widener, J. Multi-Temporal Land Surface Temperature and Vegetation Greenness in Urban Green Spaces of Puebla, Mexico. Land 2021, 10, 155. [Google Scholar] [CrossRef]
  19. Chen, J.; Jin, S.; Du, P. Roles of horizontal and vertical tree canopy structure in mitigating daytime and nighttime urban heat island effects. Int. J. Appl. Earth Obs. Geoinf. 2020, 89, 102060. [Google Scholar] [CrossRef]
  20. Shishegar, N. The Impacts of Green Areas on Mitigating Urban Heat Island Effect: A Review. Int. J. Environ. Sustain. 2014, 9, 119. [Google Scholar] [CrossRef]
  21. Ali-Toudert, F.; Mayer, H. Numerical study on the effects of aspect ratio and orientation of an urban street canyon on outdoor thermal comfort in hot and dry climate. Build. Environ. 2006, 41, 94–108. [Google Scholar] [CrossRef]
  22. Watkins, R.; Kolokotroni, J.P. Climate Change and Cities || Increased Temperature and Intensification of the Urban Heat Island: Implications for Human Comfort and Urban Design. Built Environ. 2007, 33, 85–96. [Google Scholar] [CrossRef]
  23. Elnahas, M.M. The effects of urban configuration on urban air temperatures. Archit. Sci. Rev. 2003, 46, 135–138. [Google Scholar] [CrossRef]
  24. De, B.; Mukherjee, M. Optimisation of canyon orientation and aspect ratio in warm-humid climate: Case of Rajarhat Newtown, India. Urban Clim. 2018, 24, 887–920. [Google Scholar] [CrossRef]
  25. Abdallah, A.S.H. The Influence of Urban Geometry on Thermal Comfort and Energy Consumption in Residential Building of Hot Arid Climate, Assiut, Egypt. In Proceedings of the 9th International Symposium on Heating, Ventilation and Air Conditioning (Ishvac) Joint with the 3rd International Conference on Building Energy and Environment (Cobee), Tianjin, China, 12–15 July 2015; pp. 158–166. [Google Scholar]
  26. Allegrini, J.; Dorer, V.; Carmeliet, J. Analysis of convective heat transfer at building facades in street canyons and its influence on the predictions of space cooling demand in buildings. J. Wind. Eng. Ind. Aerodyn. 2012, 104, 464–473. [Google Scholar] [CrossRef]
  27. Vallati, A.; Mauri, L.; Colucci, C. Impact of shortwave multiple reflections in an urban street canyon on building thermal energy demands. Energy Build. 2018, 174, 77–84. [Google Scholar] [CrossRef]
  28. O’Malley, C.; Kikumoto, H. An investigation into heat storage by adopting local climate zones and nocturnal-diurnal urban heat island differences in the Tokyo Prefecture. Sustain. Cities Soc. 2022, 83, 103959. [Google Scholar] [CrossRef]
  29. Zhang, J.; Cui, P.; Song, H. Impact of urban morphology on outdoor air temperature and microclimate optimization strategy base on Pareto optimality in Northeast China. Build. Environ. 2020, 180, 107035. [Google Scholar] [CrossRef]
  30. Li, X.; Zhou, Y.; Yu, S.; Jia, G.; Li, H.; Li, W. Urban heat island impacts on building energy consumption: A review of approaches and findings. Energy 2019, 174, 407–419. [Google Scholar] [CrossRef]
  31. LцЁpez-Guerrero, R.E.; Verichev, K.; Moncada-Morales, G.A.; Carpio, M. How do urban heat islands affect the thermo-energy performance of buildings? J. Clean. Prod. 2022, 373, 133713. [Google Scholar] [CrossRef]
  32. Zinzi, M.; Carnielo, E. Impact of urban temperatures on energy performance and thermal comfort in residential buildings. The case of Rome, Italy. Energy Build. 2017, 157, 20–29. [Google Scholar] [CrossRef]
  33. Wang, C.; Ferrando, M.; Causone, F.; Jin, X.; Zhou, X.; Shi, X. Data acquisition for urban building energy modeling: A review. Build. Environ. 2022, 217, 109056. [Google Scholar] [CrossRef]
  34. Sun, C.; Zhang, Y.; Ma, W.; Wu, R.; Wang, S. The Impacts of Urban Form on Carbon Emissions: A Comprehensive Review. Land 2022, 11, 1403. [Google Scholar] [CrossRef]
  35. Shareef, S.; Altan, H. Urban block configuration and the impact on energy consumption: A case study of sinuous morphology. Renew. Sustain. Energy Rev. 2022, 163, 112507. [Google Scholar] [CrossRef]
  36. Abd Elraouf, R.; Elmokadem, A.; Megahed, N.; Eleinen, O.A.; Eltarabily, S. The impact of urban geometry on outdoor thermal comfort in a hot-humid climate. Build. Environ. 2022, 225, 109632. [Google Scholar] [CrossRef]
  37. Aboelata, A. Vegetation in different street orientations of aspect ratio (H/W 1:1) to mitigate UHI and reduce buildings’ energy in arid climate. Build. Environ. 2020, 172, 106712. [Google Scholar] [CrossRef]
  38. Tsoka, S.; Tsikaloudaki, A.; Theodosiou, T. Analyzing the ENVI-met microclimate model’s performance and assessing cool materials and urban vegetation applications-A review. Sustain. Cities Soc. 2018, 43, 55–76. [Google Scholar] [CrossRef]
  39. Ouyang, W.; Sinsel, T.; Simon, H.; Morakinyo, T.E.; Liu, H.; Ng, E. Evaluating the thermal-radiative performance of ENVI-met model for green infrastructure typologies: Experience from a subtropical climate. Build. Environ. 2022, 207, 108427. [Google Scholar] [CrossRef]
  40. Feng, L.; Shuai, L.; Zhou, Y.; Zhang, X.; Sun, J. Improving the green space arrangement in residential areas from the perspective of tree leaf temperature utilizing scenario simulation in ENVI-met. Sci. Total Environ. 2024, 918, 170650. [Google Scholar] [CrossRef] [PubMed]
  41. Haeri, T.; Hassan, N.; Ghaffarianhoseini, A. Evaluation of microclimate mitigation strategies in a heterogenous street canyon in Kuala Lumpur from outdoor thermal comfort perspective using Envi-met. Urban Clim. 2023, 52, 101719. [Google Scholar] [CrossRef]
  42. Morakinyo, T.E.; Kong, L.; Lau, K.K.-L.; Yuan, C.; Ng, E. A study on the impact of shadow-cast and tree species on in-canyon and neighborhood’s thermal comfort. Build. Environ. 2017, 115, 1–17. [Google Scholar] [CrossRef]
  43. Wu, Z.; Kong, F.; Wang, Y.; Sun, R.; Chen, L. The impact of greenspace on thermal comfort in a residential quarter of Beijing, China. Int. J. Environ. Res. Public Health 2016, 13, 1217. [Google Scholar] [CrossRef] [PubMed]
  44. Hong, B.; Lin, B.; Qin, H. Numerical investigation on the effect of avenue trees on PM2.5 dispersion in urban street canyons. Atmosphere 2017, 8, 129. [Google Scholar] [CrossRef]
  45. Ma, T.; Chen, T. Classification and pedestrian-level wind environment assessment among Tianjin’s residential area based on numerical simulation. Urban Clim. 2020, 34, 100702. [Google Scholar] [CrossRef]
  46. Höppe, P. The physiological equivalent temperature—A universal index for the biometeorological assessment of the thermal environment. Int. J. Biometeorol. 1999, 43, 71–75. [Google Scholar] [CrossRef]
  47. MOHURD. The General Specification for Building Energy Conservation and Renewable Energy Utilization (GB 55015); Standard Press: Beijing, China, 2021. [Google Scholar]
  48. MOHURD. Design Standard for Energy Efficiency of Residential Buildings in Severe Cold and Cold Zones; Standard Press: Beijing, China, 2018. [Google Scholar]
  49. Achour-Younsi, S.; Kharrat, F. Outdoor thermal comfort: Impact of the geometry of an urban street canyon in a Mediterranean subtropical climate—case study Tunis, Tunisia. Procedia-Soc. Behav. Sci. 2016, 216, 689–700. [Google Scholar] [CrossRef]
  50. Cui, P.; Jiang, J.; Zhang, J.; Wang, L. Effect of street design on UHI and energy consumption based on vegetation and street aspect ratio: Taking Harbin as an example. Sustain. Cities Soc. 2023, 92, 104484. [Google Scholar] [CrossRef]
Figure 1. Study flow chart. Microclimate measurements: Section 2.2.1 details field measurements conducted on the case plot using a microclimatic measuring instrument. These measurements were taken over 12 h at selected points on typical meteorological days in both summer and winter. ENVI-met 5.6.1 microclimate simulations: Section 2.2.2 describes microclimate simulations performed using ENVI-met 5.6.1. These simulations were based on data from the Bureau of Meteorology, with corrections applied using microclimatic measurement data.
Land 13 01275 g001
Figure 2. The basic situation of the study area: (a) monthly temperatures in Tianjin in 2021 and 2022; (b) ArcGIS 10.5 analysis of street orientation in Tianjin; (c) Tianjin street orientation statistics; (d) satellite imagery slices of the block forms of residential areas; (e) street location; and (f) street sections.
Land 13 01275 g002aLand 13 01275 g002b
Figure 3. Microclimate field measurement sites and the core street area.
Land 13 01275 g003
Figure 4. Standard tree model.
Land 13 01275 g004
Figure 5. Consistency verification of measured and simulated temperature and relative humidity. (a) Consistency verification of measured and simulated temperature in summer; (b) consistency verification of measured and simulated humidity in summer; (c) consistency verification of measured and simulated temperature in winter; and (d) consistency verification of measured and simulated humidity in winter.
Land 13 01275 g005
Figure 6. Vegetation ratio model design.
Land 13 01275 g006
Figure 7. Street orientation model design.
Land 13 01275 g007
Figure 8. Street aspect ratio model design.
Land 13 01275 g008
Figure 9. The simulated unit of study case.
Land 13 01275 g009
Figure 10. Shadow conditions. (a) Summer shadow conditions; (b) winter shadow conditions.
Land 13 01275 g010
Figure 11. Air temperature, humidity, wind speed, and PET of the initial model: (a) air temperature; (b) humidity; (c) wind speed; and (d) PET of the initial model.
Land 13 01275 g011
Figure 12. Microclimate at different vegetation ratios: (a) summer air temperature of different vegetation ratios; (b) winter air temperature of different vegetation ratios; (c) summer wind speed of different vegetation ratios; (d) summer wind speed change of different vegetation ratios; (e) winter wind speed of different vegetation ratios; (f) summer PET of different vegetation ratios; and (g) winter PEs of different vegetation ratios.
Land 13 01275 g012
Figure 13. Microclimate at different street orientations: (a) summer air temperature of different street orientations; (b) winter air temperature of different street orientations; (c) summer wind speed of different street orientations; (d) summer wind speed change of different street orientations; (e) winter wind speed of different street orientations; (f) summer PET of different street orientations; and (g) winter PET of different street orientations.
Land 13 01275 g013aLand 13 01275 g013b
Figure 14. Microclimate at different street aspect ratios: (a) summer air temperature of different street aspect ratios; (b) winter air temperature of different street aspect ratios; (c) summer wind speed of different street aspect ratios; (d) summer wind speed change of different street aspect ratios; (e) winter wind speed of different street aspect ratios; (f) summer PET of different street aspect ratios; and (g) winter PET of different street aspect ratios.
Land 13 01275 g014
Figure 15. Trends of energy consumption and carbon emissions of each model. (a) Summer cooling energy per unit area of each model; (b) winter heating energy per unit area of each model; (c) summer carbon emissions per unit area of each model; (d) winter carbon emissions per unit area of each model.
Land 13 01275 g015aLand 13 01275 g015b
Table 1. The simulation settings in ENVI-met 5.6.1.
Simulation SettingsSummerWinter
Meteorological conditionsAir temperature27.73 °C max.; 22.02 °C min.1.52 °C max.; −6.85 °C min.
Relative humidity84.66% max.; 42.33% min.45% max.; 23.44% min.
Wind speed measured at 10 m height2.8 m/s4.3 m/s
Wind direction (Deg)Southeast (110°)Northwest (315°)
2500 m humidity81
Clouds20
Simulation timeTotal simulation time15 h
Output time interval60 min
Start of simulation18/06/2022 at 05:0025/12/2021 at 05:00
Roughness length at the measurement site0.6 [45]
Number of nested grids5
Grid size3 m × 3 m × 7.5 m
Total number of grid cells95 × 230 × 8 (the lowest dz grid is split into 5 sub-cells)
Building materialConcrete hollow brick
Road materialAsphalt and concrete pavement
Data sources: National Oceanic and Atmospheric Administration (NOAA) and National Centers for Environmental Information (NCEI) (https://www.ncei.noaa.gov, accessed on 15 July 2024) (no. 54527099999, TIANJIN, CH, and no. 54527399999, BINHAI, CH).
Table 2. Street orientations contrasted with street and monsoon angles.
Model NameInitial ModelOR0°OR52°OR90°
Street orientationNW–SEN–SNE–SWE–W
Summer32°70°58°20°
Winter46°82°44°
Table 3. Building envelope specifications.
EnvelopeConstruction Materials and ThicknessU-Value (w/m2·K)
External wall20 mm cement plaster
70 mm XPS
20 mm render
200 mm reinforced concrete
20 mm cement plaster
0.4
Roof20 mm cement plaster
5 mm SBS waterproof material
20 mm render
70 mm XPS
20 mm render
5 mm SBS waterproof material
100 mm reinforced concrete
20 mm cement plaster
0.28
Ground floor30 mm timber flooring
20 mm cement plaster
5 mm SBS waterproof material
100 mm reinforced concrete
20 mm render
50 mm XPS
100 mm cast concrete
0.57
Window3 mm glass
12 mm argon
3 mm glass1.83
Partition wall or floor that separates heated and unheated space70 mm XPS
100 mm reinforced concrete
0.15
External door—— 0.20
Data source: Adapted with permission from Ref. [48]. 2018, Ministry of Housing and Urban-Rural Development, People’s Republic of China.
Table 4. Building internal load characteristics.
Related ParameterValue
Total gross floor area 2149.44 m2
Total conditioned area 1899.84 m2
HVACSet pointWinter: below 18 °C; summer: above 26 °C
Operating modeWinter: boiler HW 1; HW convectors
Summer: air-cooled chiller; nat. vent.
Air exchangesInfiltration0.3 ac/h
Natural ventilation3 ac/h
Internal gainsPeople2/room
Lighting5 W/m2
Equipment3.8 W/m2
1 HW: hot water. Data source: Adapted with permission from Ref. [47]. 2021, Ministry of Housing and Urban-Rural Development, People’s Republic of China.
Table 5. Average carbon emissions of simulated units.
Cooling Energy (KWH)Heating Energy (KWH)Summer Carbon Emissions (kgCO2)Winter Carbon Emissions (kgCO2)
VR0 (no trees)14.744892.362110.861032.9176
VR30 (30% trees)14.765392.304810.876132.8972
Initial model (40% trees)14.824492.289310.919632.8916
VR50 (50% trees)14.816292.270910.913632.8851
VR70 (70% grass)14.649592.500410.790832.9669
Initial model (NW–SE)14.824492.289310.919632.8916
OR0° (N–S)14.638091.978210.782432.7808
OR52° (NE–SW)14.800391.625510.901932.6551
OR90° (E–W) 15.326192.005511.289232.7905
Initial model (H/W = 0.26) 14.824492.289310.919632.8916
HW03 (H/W = 0.3) 14.823892.289210.919232.8916
HW06 (H/W = 0.6) 14.367092.378310.582732.9234
HW09 (H/W = 0.9) 14.072792.608310.366033.0053
Disclaimer/Publisher’s Note: The statements, opinions and data contained in all publications are solely those of the individual author(s) and contributor(s) and not of MDPI and/or the editor(s). MDPI and/or the editor(s) disclaim responsibility for any injury to people or property resulting from any ideas, methods, instructions or products referred to in the content.

