Article

Spatiotemporal Variations in Fingerprinting Sediment Sources in a Watershed Disturbed by Construction

1
College of Ecology and Environment, Chengdu University of Technology, Chengdu 610059, China
2
Tianfu Yongxing Laboratory, Chengdu 610213, China
3
College of Earth Science, Chengdu University of Technology, Chengdu 610059, China
4
China Academy of Transportation Sciences, Beijing 100029, China
*
Author to whom correspondence should be addressed.
Land 2024, 13(8), 1314; https://doi.org/10.3390/land13081314
Submission received: 22 July 2024 / Revised: 11 August 2024 / Accepted: 17 August 2024 / Published: 19 August 2024
(This article belongs to the Section Land, Soil and Water)

Abstract

:
Engineering construction disturbs the Earth’s surface and exacerbates soil erosion, resulting in sediment contributions at the watershed scale, the spatiotemporal variation of which remains to be clarified. Based on a typically disturbed catchment, soil samples were collected from sources such as forests, grasslands, spoil heaps, and exposed slopes. Sediment deposition was sampled in 2022 and 2023 along the main channel and fingerprinting technology was employed to calculate the relative contributions of different sources. The results indicated that the optimal composite fingerprints comprising Na₂O, Li, Sr, and Ce could effectively resolve the contributions of different sources. Natural sources were the main sediment contributors, but the average contribution decreased from 72.96% to 58.73% over two periods. In contrast, the contribution of spoil heaps and exposed slopes increased from 27.04% to 41.27% and the area percentage increased from 0.18% to 0.30%. The spoil heap represents the relatively large area of disturbance and its contact length with the river determines the sediment contribution rates, which varied spatially in a quadratic trend along the channel. Meanwhile, the sediment contribution of relatively small and dispersed exposed slopes could be quantified using a linear equation of the disturbance weighting indicator (DWI) composed of disturbed area and flow distance. These results would be helpful in assessing the environmental impact of engineering disturbances and optimizing mitigation measures.

1. Introduction

Soil plays a crucial role in food production and serves as the foundation for both Earth and human health [1]. However, the soil is also subjected to severe erosion driven by human activities, which poses significant threats to the ecological environment and food security [2]. Soil erosion results in topsoil loss, causing reductions in soil fertility and productivity, which impacts agriculture and biodiversity. Moreover, the eroded soil enters rivers, leading to sediment deposition that causes river blockage and reduced reservoir storage capacity [3]. Additionally, sediment is the primary medium for the transport of pollutants and nutrients into surface water bodies, causing water quality deterioration due to transport and deposition in rivers [4]. Therefore, there is an urgent need to clarify the soil erosion risk due to human disturbance and to implement corresponding conservation measures. At the watershed scale, identifying sediment sources can aid in understanding soil erosion and sediment deposition processes, which is crucial for optimizing the layout of soil and water conservation measures [5].
The composite fingerprinting technique has been widely adopted in recent years to determine sediment sources within watersheds. In this method, soil geochemical elements, particle size, color, and other tracers are employed as fingerprints to trace the origin of sediments. This method can address the limitations of the lack of long-term monitoring data on sediment transport and erosion [6] and therefore has been widely applied in regions such as Europe [7,8,9,10], the Americas [11,12,13], and Asia [14,15,16,17]. The reliability of this method and its importance in understanding sediment transport processes in watersheds have been validated [18,19,20,21]. Composite fingerprinting technology has been adopted to explore sediment sources in watersheds impacted by human activities. Research on land use changes and agricultural activities disturbed by humans shows that crop and grazing lands significantly increase erosion rates [22,23] and contribute up to 90% of the total sediment, as indicated by fingerprinting techniques [24].
In the above studies, the extent of natural erosion and human-induced soil erosion in watersheds has been revealed by analyzing the relative contribution rates of sediment sources to rivers. However, the impact of human activities is not reflected in land use changes and agricultural activities only. Notably, significant environmental effects also result from engineering construction. Construction causes changes in the original land use and geomorphology, with temporarily exposed slopes exhibiting high erosion and sediment yield risks [25,26,27]. In China, for instance, numerous infrastructure and construction projects have been completed over several decades [28], which have amplified the erosion risk and sediment yield. Major engineering projects also generate a significant amount of spoil, which accumulates in spoil heaps. These spoil heaps exhibit loose soil structures, steep slopes, and low vegetation cover, leading to higher soil loss rates than those in pastures and farmlands [29,30]. Therefore, large-scale spoil grounds, due to their high erosion risk and sediment yield, have become unique sediment sources [31]. Currently, in most studies on sediment sources within watersheds with engineering activities, the total sediment contribution has been determined through composite sediment samples collected at watershed outlets [32,33]. However, engineering activities exhibit both temporal and spatial variability aspects, and sediment deposition in rivers demonstrates high spatiotemporal variability. Composite sediment samples collected at watershed outlets can represent the overall watershed sediment contribution, but may not necessarily explain the spatial differentiation characteristics of the impact of engineering disturbances [34]. Therefore, the use of fingerprinting technology to trace the sources and spatiotemporal changes in deposited sediment within a given watershed can provide a more comprehensive understanding of sediment transport processes. This could help determine the effect of engineering activities on dynamic sediment deposition, which is crucial for implementing systematic land management measures in watersheds disturbed by engineering activities. Nevertheless, studies utilizing fingerprint technology to examine the spatiotemporal variability of sediment contributions from engineering activities are still rare.
To address this issue, this study focused on a typical mountainous watershed disturbed by engineering activities. Different types of disturbance, such as spoil heaps and exposed slopes within the watershed during various periods, were selected as sediment sources along with the natural lands. The composite fingerprinting technique was employed to analyze the sources of sediment deposition at various locations along the main channel. The main objectives were as follows: (1) to quantify the relative sediment contribution rates of different sources within an engineering-disturbed watershed and to elucidate the impact of engineering disturbance sources on channel sediment deposition during different periods; (2) to investigate the sources of sediment deposited at different channel locations. Notably, the spatial variation characteristics of the contributions of engineering disturbances were clarified. This research could help reveal the spatial processes and mechanisms by which soil erosion resulting from engineering disturbances affects the sediment yield of watersheds. In turn, it could provide a sound basis for soil and water conservation measures in major infrastructure construction projects.

2. Materials and Methods
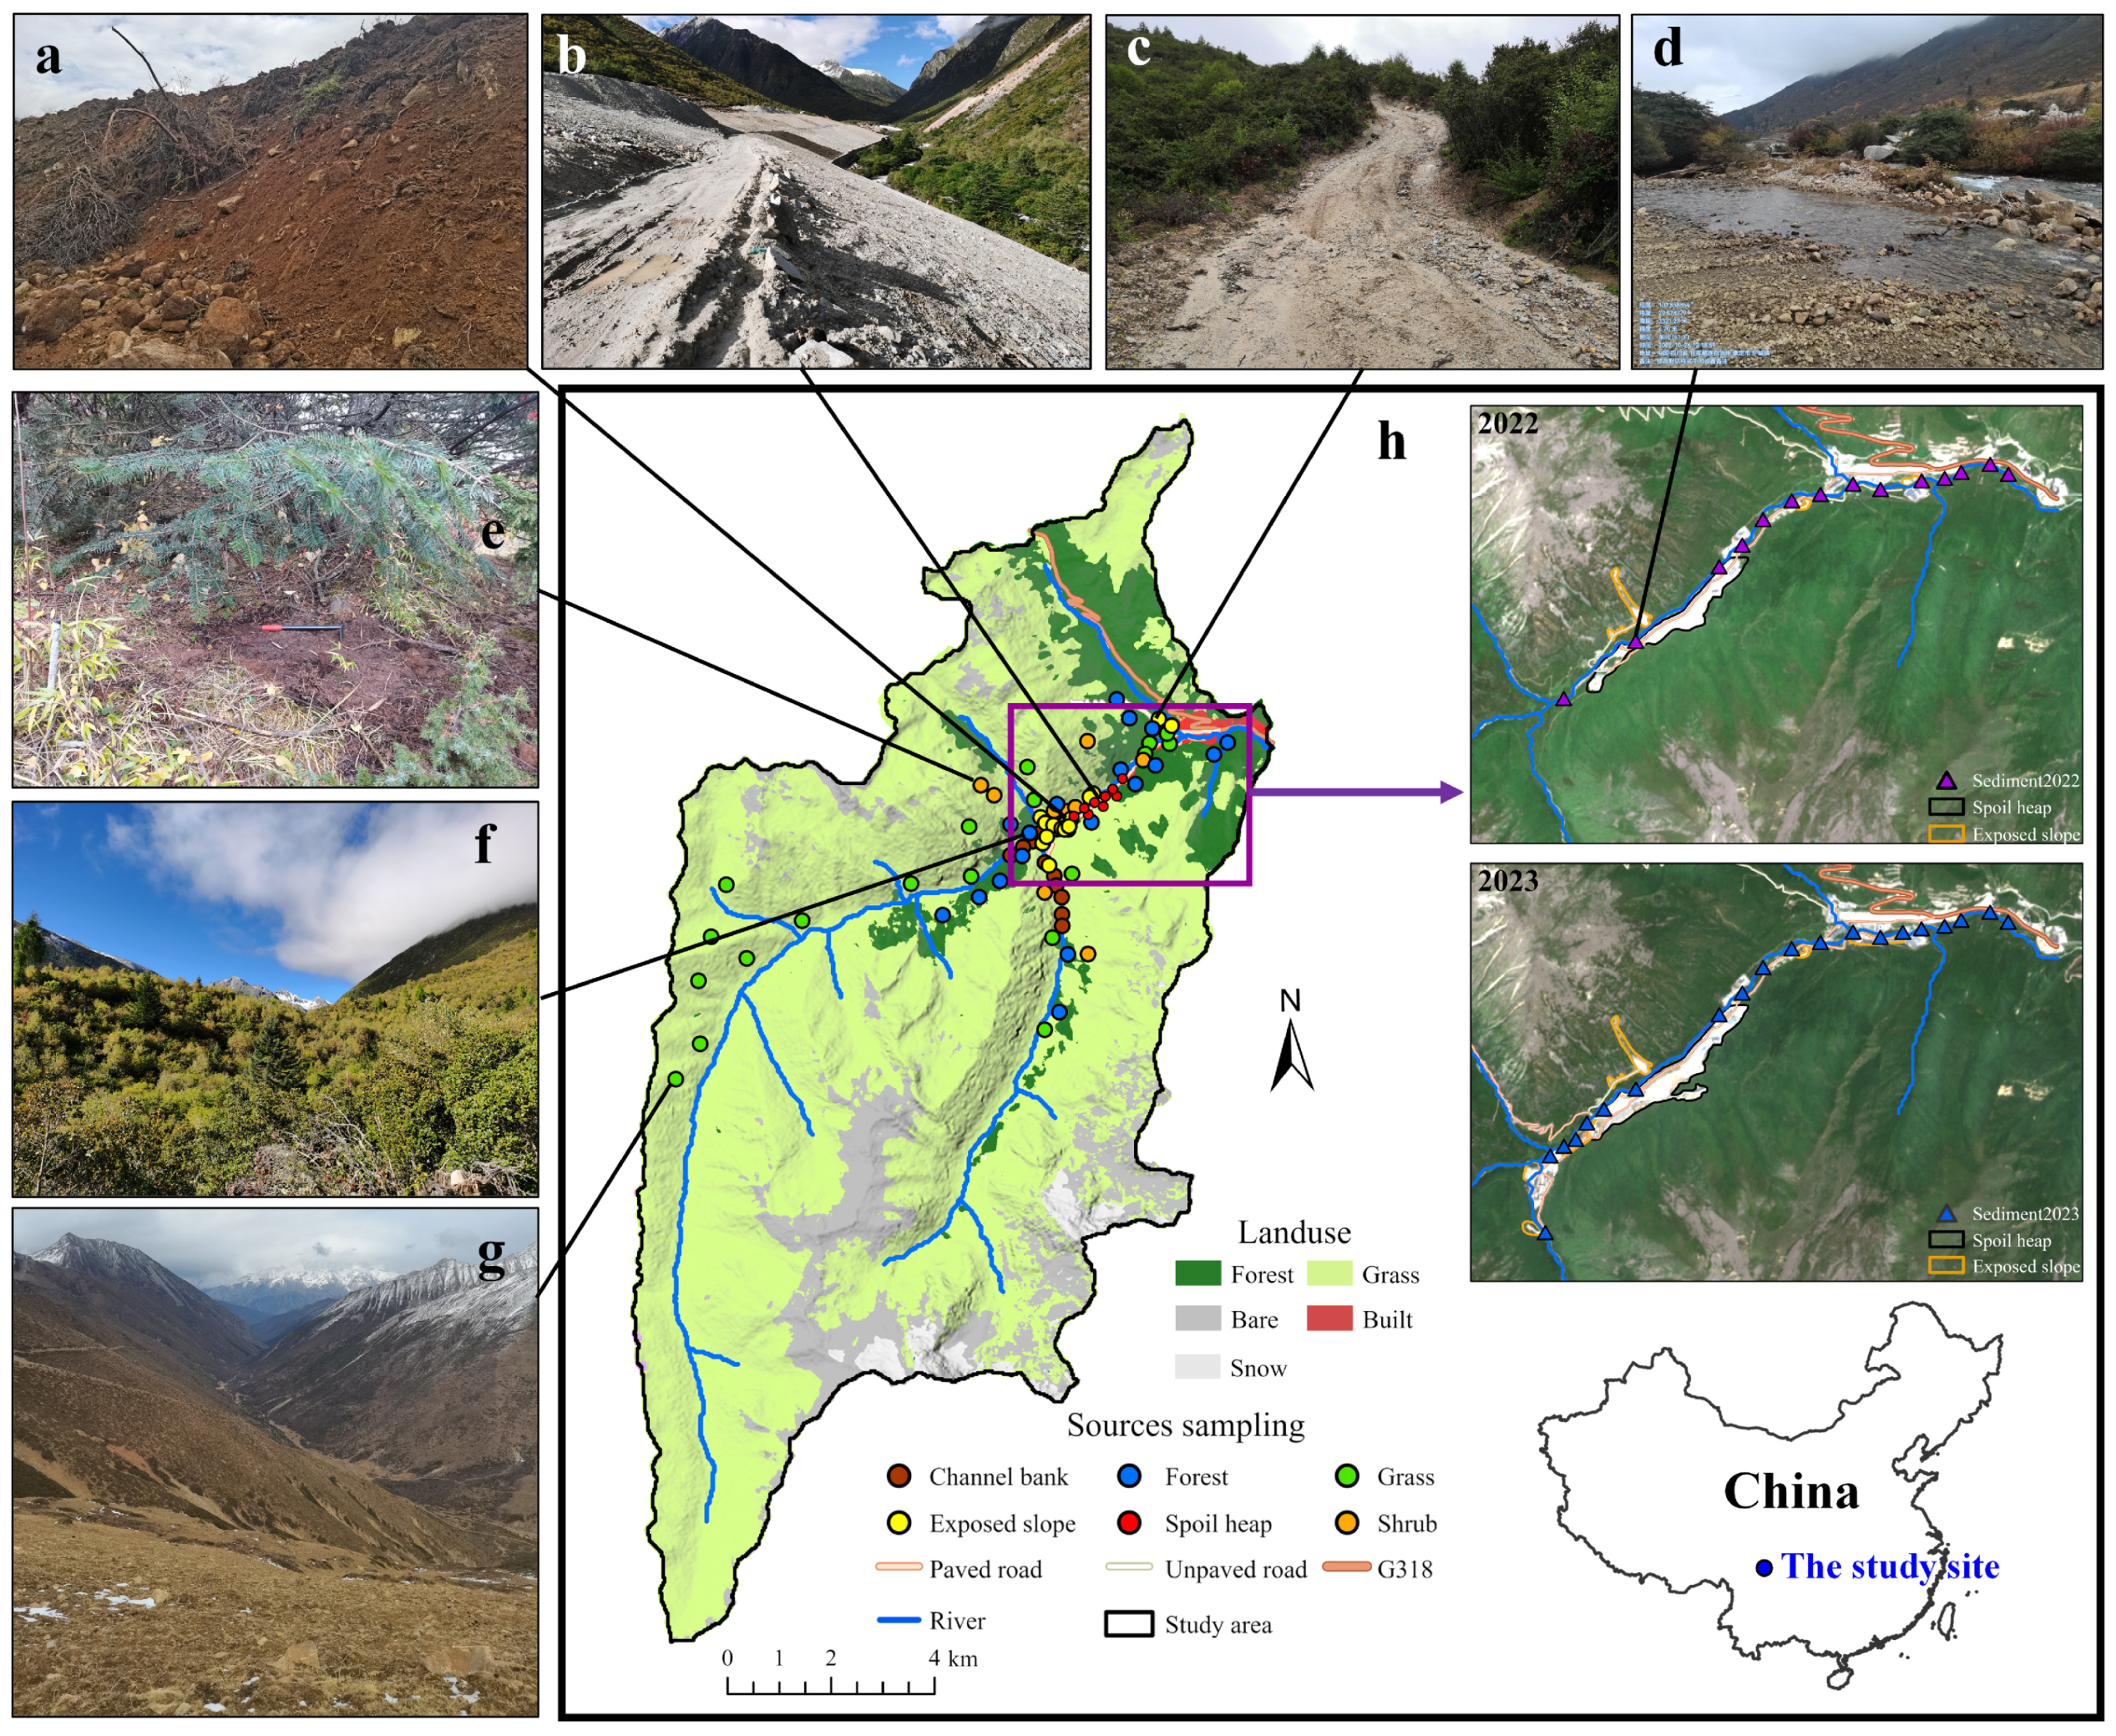
2.1. Study Area

The study area shown in Figure 1 is located in a subwatershed of the Zheduo River (a tertiary tributary of the Yangtze River) in Sichuan Province, China (101°46′05.63″~101°53′56.59″ E, 29°50′10.38″~30°02′47″ N). It is approximately 25.5 km long, covering an area of 151.22 km2, with elevations ranging from 3113 to 5497 m. The terrain of the watershed is higher in the east and lower in the west, with a gradual decrease in elevation along the river direction and relatively gentle terrain in the outlet area. The region exhibits a subtemperate plateau humid climate, with an average annual temperature of approximately 7 °C, an extreme minimum temperature of −15 °C, and an extreme maximum temperature of 30 °C. The region exhibits 177 frost-free days per year, with an average annual precipitation of 700–1200 mm. Over 70% of the annual rainfall occurs between May and September. The soil types change with increasing elevation, ranging from Luvisols and Leptosols to Cryosols according to the World Reference Base (WRB) system. The soil texture of forests is SANDY LOAM and shrublands and grasslands are LOAMY SAND. Land use in the watershed comprises forestlands, shrublands, grasslands, and bare rock. Forests, shrublands, and grasslands together cover 85% of the watershed area (Figure 1e–g). The vegetation types include Carex parvula, Rhododendron flavidum, Quercus guyavifolia, Picea likiangensis var. montigena, and Picea likiangensis var. rubescens.
Tunnel construction that began in December 2020 led to engineering disturbances, including exposed slopes and spoil heaps roads in the watershed (Figure 1a–c), with average grain sizes of 572.07 and 387.85 µm for spoil and exposed slopes. The spoil heap is a river-adjacent structure comprising a mixture of soil and rock fragments, and the fragments derive from tunnel bedrock excavation and consist of monzonitic granite rich in lithophile elements and light rare earth elements [35]. The spoil heap causes changes in the original land use and poses high risks of erosion and sediment production, providing a significant sediment source in the watershed. Moreover, exposed slopes, which are a crucial sediment source due to their higher potential ability for sediment yield compared to ordinary intact soil, were created during the construction of auxiliary facilities and roads. The construction activities in the studied watershed have been ongoing since 2020. This study was carried out during the period 2022–2023, when the disturbed areas showed significant spatiotemporal variation (Figure 1h). The disturbances in 2022 were composed of spoil heaps and exposed slopes resulting from construction activities. In comparison, the 2023 disturbances show an expansion in the scale of the spoil heaps. Additionally, due to changes in construction activities, some previously exposed slopes have been hardened, leading to a reduction or disappearance of surface disturbances. However, new engineering activities have also led to an increase in disturbed surfaces.

2.2. Sediment Sources and Channel Deposition Sampling

Field surveys and sampling were conducted in 2022 and 2023, respectively. Based on the research objectives and current land use in the watershed, potential sediment sources were categorized into undisturbed natural land use types (forests, grasslands, shrublands, and channel banks) and engineering disturbance types (spoil heaps and exposed slopes). It should be noted that bare rock areas were generally excluded when assessing soil erosion [2] and were therefore not considered as potential sediment sources. The number of source samples was determined by the proportion and distribution of sources within the watershed. The nearly homogeneous geological composition of the bedrock and the small variation in topsoil types across the study area allowed all source samples to represent the overall values of the watershed [33]. Considering the comparability for sediment tracing in the main channel, the same overall representative values for the watershed were used to trace the sources of all deposited sediments. To enhance the representativeness of source samples, forest, grassland, and shrubland samples were collected from the 0–5 cm depth of topsoil. These source samples were composite samples formed by combining three subsamples collected within a 5 m radius. Channel bank samples were taken from 0 to 2 cm depth soil in severely eroded and scoured gully walls. To avoid the influence of engineering disturbance, the above natural source sites have been selected upstream of the spoil heaps and exposed slopes or at higher elevations. Therefore, the natural source samples have not been disturbed by engineering activities and can represent completely undisturbed drainage areas in the watershed. Samples from exposed slopes include those from unpaved roads and landforms exposed by construction activities. Mixed samples from unpaved roads are collected from both the road surface and the slopes, while samples from exposed landforms are taken from the top 0–2 cm of loose soil in areas with high erosion risk. Spoil heap samples were collected from the 0–10 cm surface layer at the top, middle, and bottom of the spoil heap. All collected composite source samples weighed approximately 1 kg. As Figure 1h shows, a total of 88 potential sediment source samples were collected, including 23 samples from grasslands, 12 samples from shrublands, 18 samples from forests, 12 samples from channel banks, 9 samples from spoil heaps, and 14 samples from exposed slopes.
In this study, sediment deposition at different locations along the main channel was investigated to evaluate the sediment contributions of various sources within the catchment. To collect samples that represent the annual sediment deposition process, sampling was conducted in October at the end of the rainy season. The sampling locations occurred in flat riverbeds and flow convergence areas where sediment deposition is common. Moreover, the spatial distribution of engineering disturbance patches was considered. Multiple mixed samplings were conducted at each site, and surficial samples were collected. Since most sediment generation and deposition occurred during the rainy season, which just ended, the samples could reflect recently deposited sediments [32]. Mixed sediment samples weighing approximately 1 kg were stored in bags for subsequent analysis. A total of 14 sediment deposition samples were collected in 2022 at the different sites along the channel, as shown in Figure 1h. In contrast, 20 sediment samples were collected in 2023, among which 14 samples were obtained at the same sites as in 2022, while another 6 samples were collected at different sites with variable engineering disturbance patches. During field sampling, site surveys were conducted to obtain information on the distributions of spoil heaps, exposed slopes, and newly constructed roads using GPS technology. Meanwhile, sediment transport pathways between different disturbed patches and the river were also investigated. In addition to the field survey, the Sentinel-2 satellite image of 8 July 2022 and 23 July 2023 was used to determine the extent of the engineering disturbance areas for 2022 and 2023, respectively (Figure 1h). According to the disturbance areas shown in Figure 1h for 2022 and 2023, the upstream drainage area of sediment sampling site S03 was completely undisturbed in 2022; therefore, S03 was used as the undisturbed control site.

2.3. Laboratory Analysis

The collected soil samples were naturally dried, ground, and passed through a 2 mm sieve [34]. This range of particle sizes could represent the sources and deposited sediment conditions in the study area, especially for the disturbed sources, which are characterized by large particle sizes. Geochemical elements have been widely used in fingerprinting to trace sediment sources and provide a notable ability to differentiate various land uses. Therefore, based on the geochemical background of the study area, 17 geochemical elements were selected as fingerprints to establish a fingerprint library. K₂O, Na₂O, CaO, MgO, Al₂O₃, and SiO₂ were measured using inductively coupled plasma optical emission spectrometry (ICP-OES). Mn, Ag, Pb, Co, Ni, Li, Sn, S, Sr, La, and Ce were determined using X-ray fluorescence spectrometry (XRF).

2.4. Selection of Composite Fingerprints

2.4.1. Classification of Source Samples

A reasonable classification of source samples is critical for the composite fingerprinting method to analyze sediment sources [36,37]. To effectively classify the source samples, linear discriminant functions were employed to categorize the samples within the established fingerprint library. The classification was then refined based on the effectiveness of the categorization of various source types [38,39]. Source reclassification was performed in RStudio using linear discriminant analysis (LDA) with the Fingerpro package.

2.4.2. Optimal Composite Fingerprints

(1)
Conservatism test
The purpose of the conservatism test is to exclude nonconservative fingerprints. The fundamental assumption of the fingerprinting technique is that the tracer remains conserved during sediment transport and migration. Therefore, it is essential to ensure that the selected tracer is conservative before application [36]. The most common method is the range test, where the concentration range of fingerprints in the sediment samples must occur within the concentration range of the same fingerprints in the source samples to be considered conservative [40]. Range test was performed in RStudio using rangeTest with the Fingerpro package.
(2)
Kruskal‒Wallis H test and discriminant function analysis
Based on the two-step method proposed by Collins et al. (1997) [41], fingerprints that can be used to differentiate between sources were selected. The null hypothesis of the Kruskal–Wallis H test is that there is only one sediment source in the watershed. If the value of the test statistic (H) is greater than the critical value of the chi-square distribution (Hcr), the null hypothesis can be rejected, indicating that the watershed contains multiple sediment sources, and the considered fingerprint can be used to distinguish between these sources. Conversely, if H is less than Hcr, the fingerprint is excluded. Fingerprints that passed this test were then subjected to multivariate stepwise discriminant function analysis (DFA) to select the optimal composite fingerprints. The lower the Wilks’ lambda value (Λ) is, the larger the difference between the sample groups and the greater the distinction among the samples from different sources. The group of fingerprints with the lowest Wilks’ lambda value could be considered the optimal composite fingerprint. The Kruskal‒Wallis H test and DFA were performed in RStudio using KWTest and DFATest with the Fingerpro package. The test statistic can be calculated as follows:
H = 12 N N + 1 s = 1 m R s n s 3 N + 1
where R s is the rank sum of the fingerprint in source s ( s = 1, 2, 3, …, m ) and n s is the number of samples from source s . Moreover, N is the total number of samples from all sources, and p denotes the significance level. For p < 0.05, the H value of the fingerprint is greater than the critical value Hcr, indicating a significant difference between groups and the ability to distinguish between different sources. Conversely, fingerprints with p > 0.05 were excluded.
Λ = S S e r r o r S S e r r o r + S S t r e a t
where S S e r r o r is the within-group sum of squares, and S S t r e a t is the between-group sum of squares.

2.5. Apportion of Sediment Sources

In this study, a mixing model was applied to analyze sediment sources [42], as expressed in Equation (3). The theoretical assumption of this model is that sediment from different sources is transported to the river, where it is deposited, with the fingerprints conserved in this process. By using fingerprint information from the source and sediment samples, the model aims to construct a source–sink relationship, after which a mathematical model can be established to analyze the contribution of each source to sediment deposition. The model exhibits two prerequisites: (1) the contribution rate of each sediment source is a nonnegative value, and (2) the sum of the relative contribution rates of all sediment sources equals 1, as expressed in Equations (4) and (5), respectively. To evaluate the feasibility of the sediment source analysis results of the mixing model, the goodness of fit (GOF) is commonly used. For GOF > 80%, the results are considered acceptable [43], as expressed in Equation (6).
R e s = i = 1 n C s s i s = 1 m C s i P s C s s i 2
0 P s 1
s = 1 m P s = 1
G O F = 1 1 n i = 1 n C s s i s = 1 m C s i P s C s s i
where C s s i denotes the concentration of fingerprint i in the sediment; C s i is the concentration of fingerprint i in source s ; P s denotes the relative sediment contribution of source s ; m is the number of sediment sources; n is the number of fingerprints; i = 1, 2, …, n ; s = 1, 2, …, m ; and m n . Under the constraints of Equations (4) and (5), the relative contribution of each source can be determined by obtaining the optimal solution that minimizes R e s using the least squares method. Based on the above steps, the source contribution rates were analyzed in the Sediment Source Assessment Tool to determine the source contributions to the sediment samples [44].

2.6. Disturbance Weighting Indicator

According to the research of Shu et al. (2024) [45] and Franz et al. (2014) [33], sediment contribution is correlated with the distribution of disturbance sources and the distance between deposited sediments and these sources in the main channel. Therefore, a comprehensive disturbance weighting indicator (DWI) is proposed, considering both the area of disturbance sources and the distance from the sediment sampling site to these sources, as shown in Equation (7).
D W I = e = 1 k A e ξ a e + ξ b e
where A e (ha) represents the area of exposed slope e at the location of the deposited sediment, ξ a e (m) represents the maximum contributing distance from the exposed slope to the main channel within the range of A e , ξ b e (m) represents the distance from the location where ξ a e intersects the main channel perpendicularly to the deposited sediment in the range A e , k represents the number of exposed sources, and e = 1, 2, …, k .

3. Results

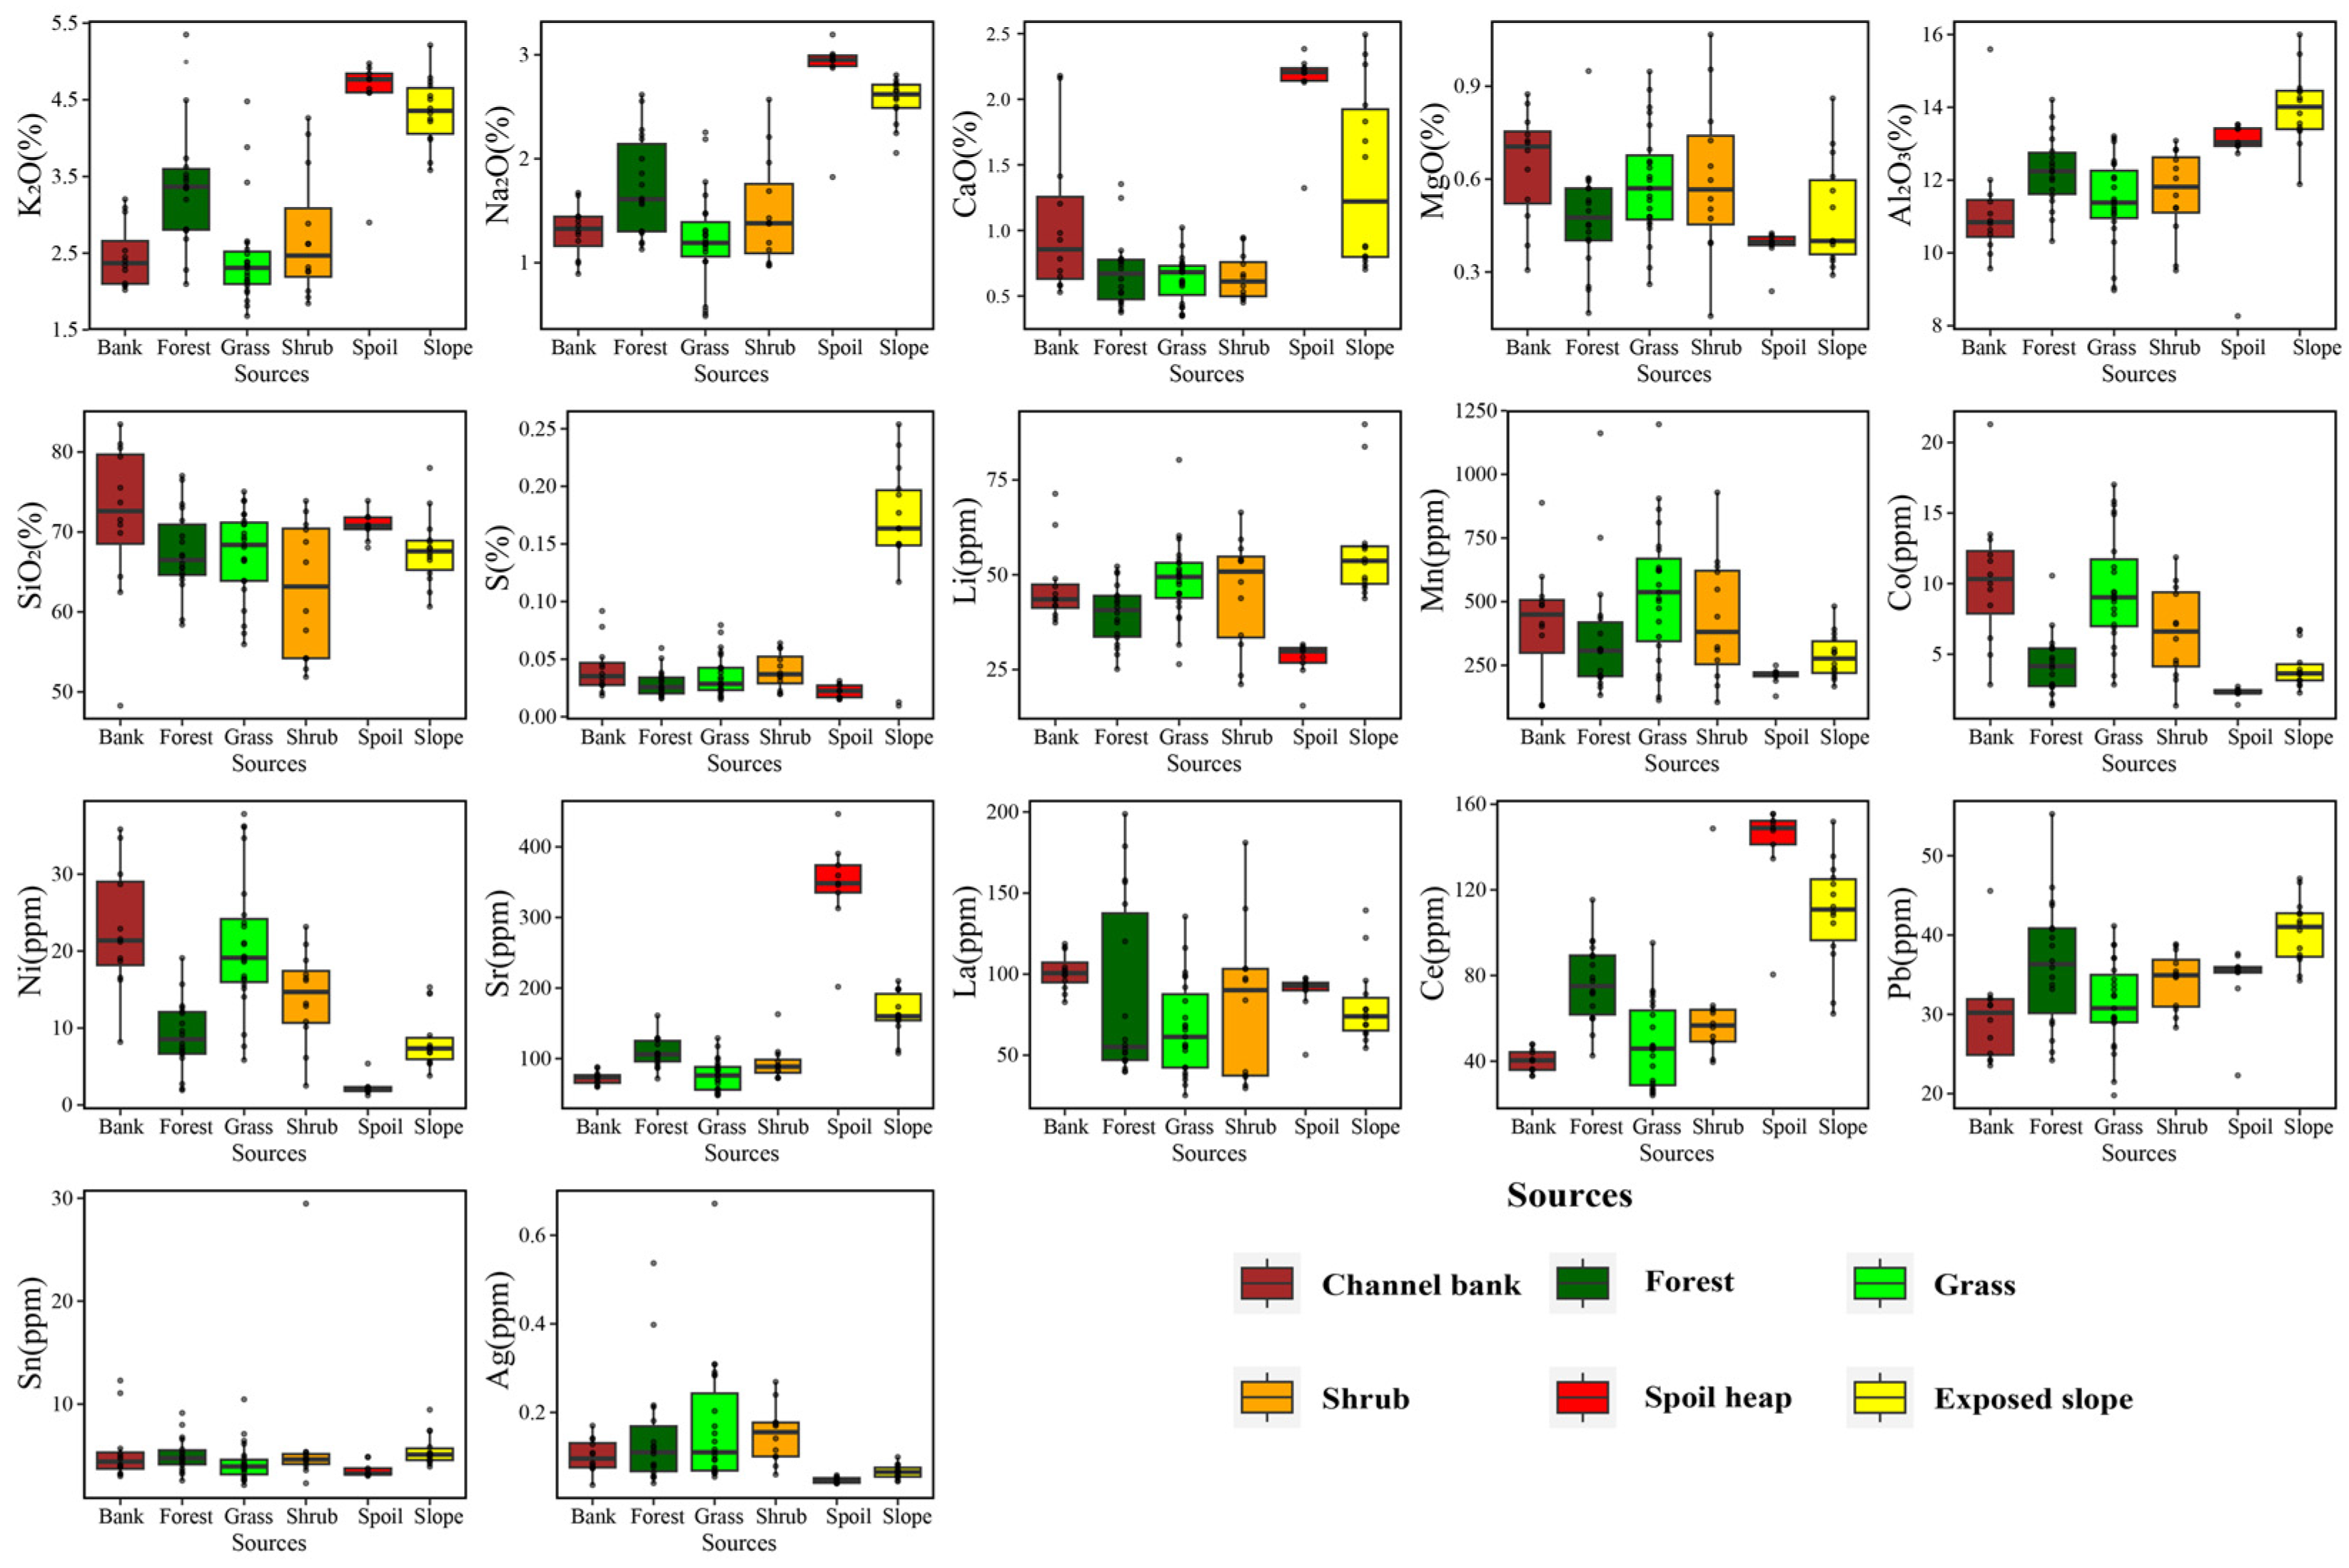
3.1. Concentration of Fingerprints in the Sources and Source Classification

Boxplots of the concentrations of the 17 selected fingerprints were created. As shown in Figure 2, the fingerprint concentrations in forests, shrublands, grasslands, and channel banks were generally similar, with soil erosion primarily occurring in the topsoil layer. The fingerprint concentrations in spoil heap material derived from tunnel construction comprising crushed rock significantly differed from those of topsoil sources derived from weathering materials. In particular, the K2O, Na2O, CaO, Sr, and Ce content of the spoil heap material is significantly higher than that of the natural land soils. The excavated deep soil on exposed slopes, caused by topsoil disturbance and stripping, exhibited markedly different concentrations of geochemical elements (especially for the higher values of the K2O, Na2O, and S) compared to those of the topsoil of forests, shrublands, and grasslands.
By combining the concentration differences in fingerprints, linear discriminant functions were employed to classify sources based on the fingerprint concentrations. As shown in Figure 3a, there was substantial overlap among the samples from forests, shrublands, grasslands, and channel banks, rendering differentiation extremely unclear. This could be due to the similar parent materials in the region, leading to limited chemical differentiation. In contrast, spoil heaps and exposed slopes could be significantly distinguished from the four natural sources (forests, grasslands, shrublands, and channel banks), while there was also significant differentiation between the spoil heaps and exposed slopes. It should be noted that the channel bank, generally recognized as a natural subsoil source, could be discriminated by tracers. This may be due to the fact that the channel bank, mainly at the lowest elevation, contains the deposited material from the upstream slopes, whereas the disturbed subsoil sources consist of tunnel rock material (the spoil heap) or the deep soil profile layer (the exposed slope), which are different from the channel material. Based on these results, the four natural sources were combined into one category as a natural background sediment source. As shown in Figure 3b, the linear discriminant function could be employed to effectively classify the three sources (natural sources, exposed slopes, and spoil heaps). The selected fingerprints could be used to effectively distinguish between these sources.

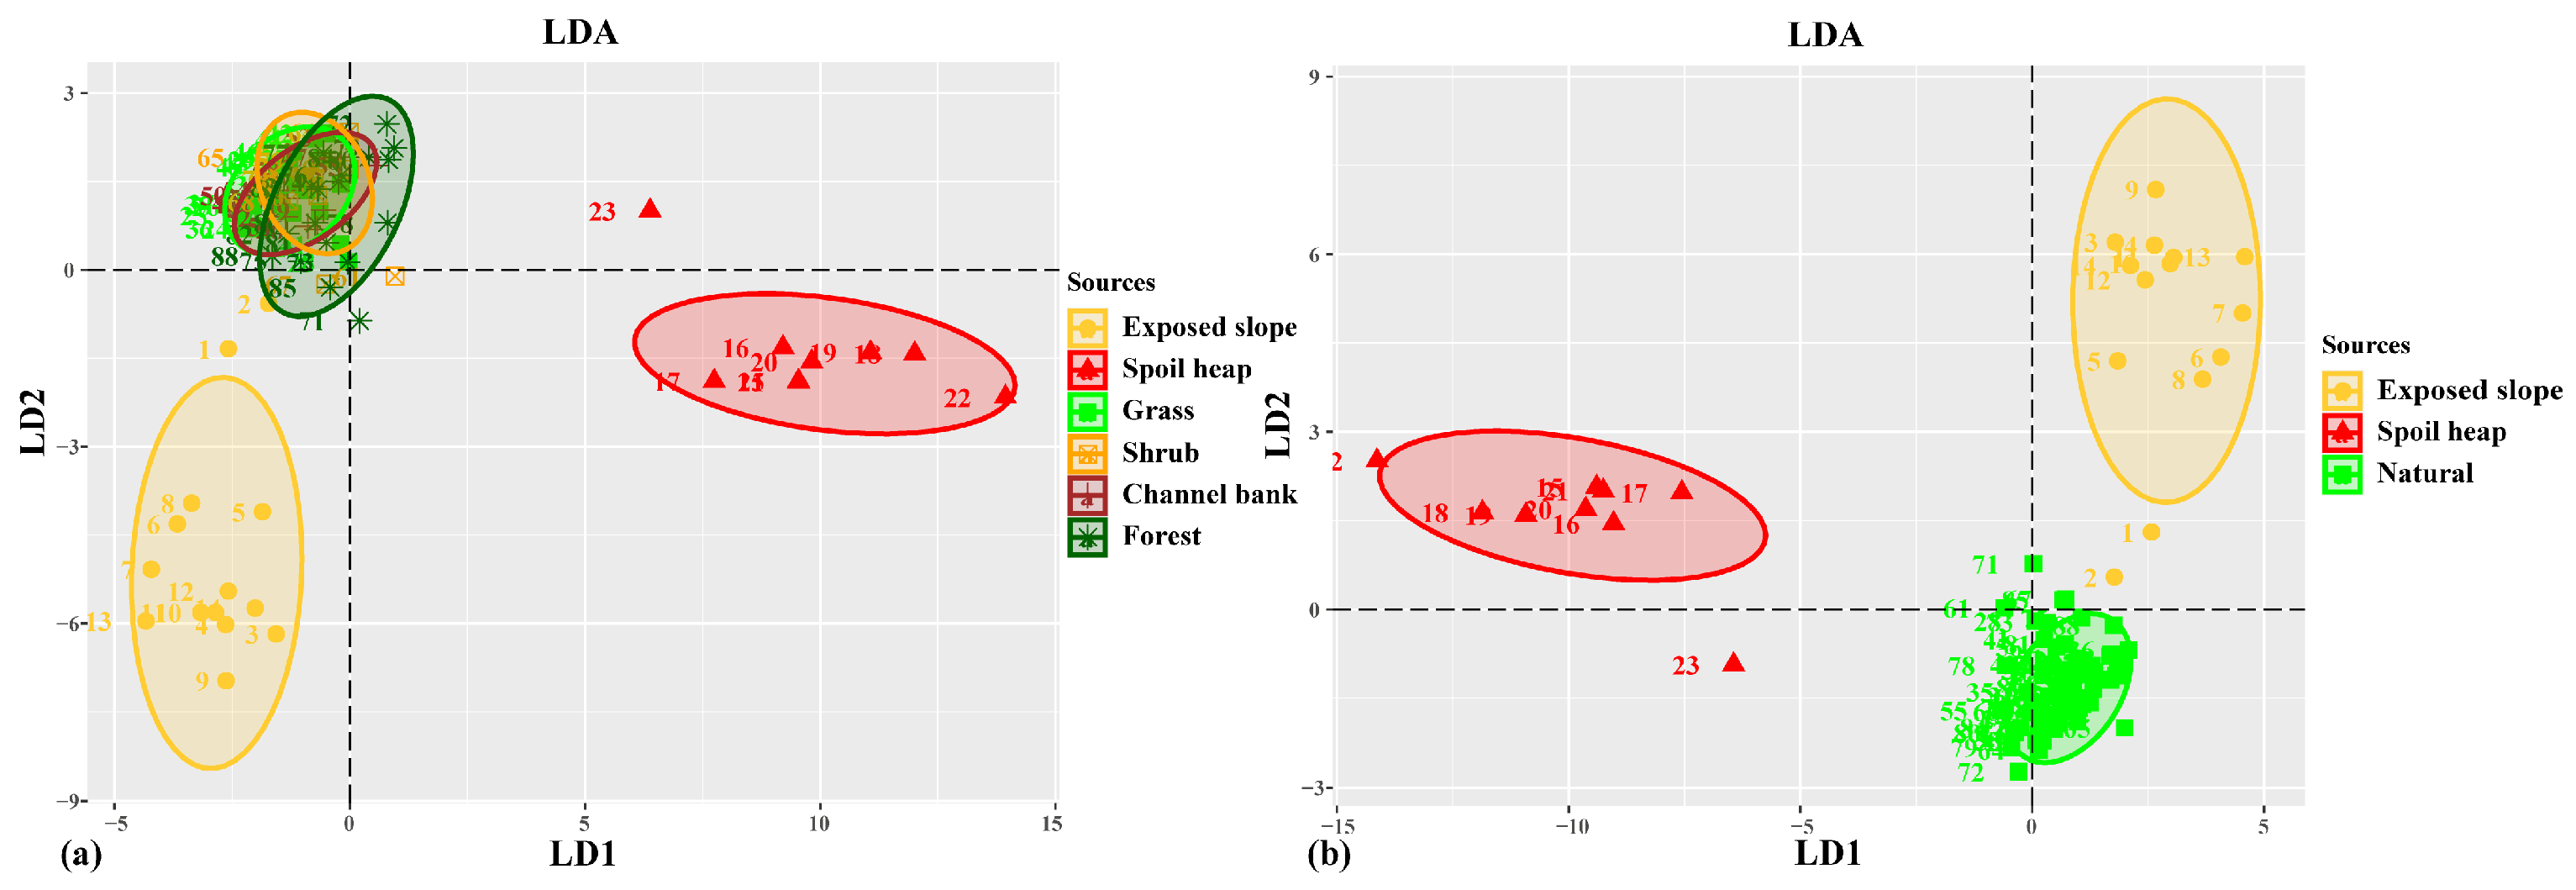
3.2. Selection of the Optimal Composite Fingerprints

As indicated in Table 1, a conservatism test of 17 fingerprints was performed. Four fingerprints (CaO, S, La, and Ag) exhibited concentrations in the deposited sediment that exceeded the concentration ranges of the sources, indicating that these four fingerprints were subjected to physicochemical changes during sediment transport, transition, and deposition. Therefore, they did not meet the conservatism criteria. The remaining 13 conserved fingerprints were subjected to the Kruskal–Wallis H test, which resulted in the elimination of SiO₂ (p > 0.05). The remaining 12 fingerprints (K₂O, Na₂O, MgO, Al₂O₃, Li, Mn, Co, Ni, Sr, Ce, Pb, and Sn) showed significant differences among the sediment sources.
As indicated in Table 2, for DFA, Na₂O, Li, Sr, and Ce were selected as the optimal composite fingerprints. This combination yielded a Wilks’ lambda value of 0.0494, with the individual fingerprints exhibiting a correct classification rate of over 70% and a cumulative classification rate of 93.7%, indicating a high differentiation ability between the sources and effective classification of the source samples. According to the results listed in Table 3, the optimal composite fingerprints (Na₂O, Li, Sr, and Ce) facilitated the correct classification of the three sources, with a correct classification rate of 92.3% for the natural source samples (forest, shrubland, grassland, and channel bank samples), 100% for the exposed slope samples, and 88.9% for the spoil heap samples. Some natural source samples were misclassified into the exposed slope category, likely because the original land use of these exposed slopes was similar to that within the misclassified category, and the degree of disturbance varied, resulting in minimal differences in geochemical properties. In summary, the selected optimal composite fingerprints facilitated the effective classification of 82 out of 88 source samples, demonstrating their capability for accurate sediment source tracing.

3.3. Spatiotemporal Variation in Sources and Their Contributions to Sediment Deposition

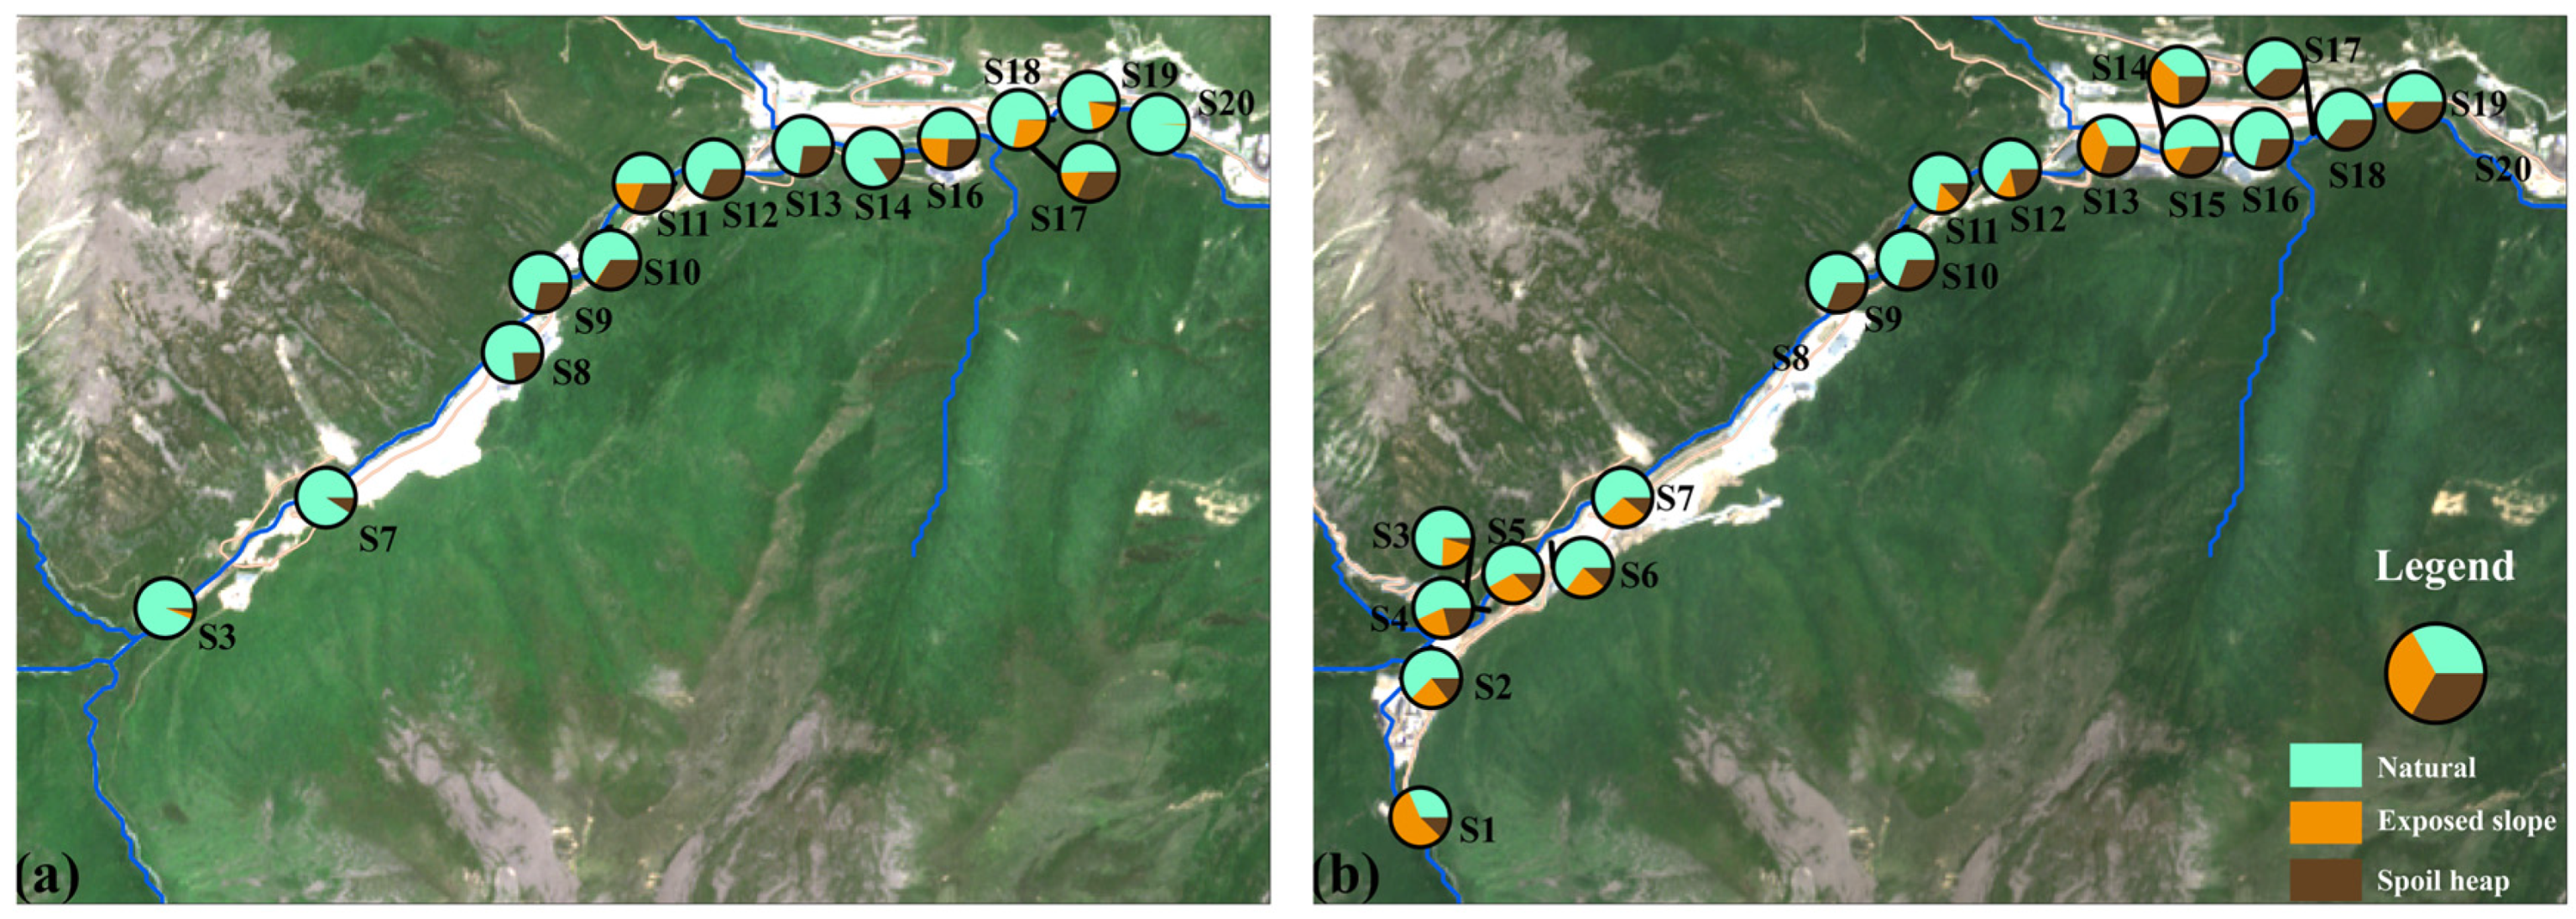
3.3.1. Sediment Source Contribution in 2022 and 2023

The optimal composite fingerprints of Sr, Na₂O, Ce, and Li were used in a mixing model to analyze the sediment sources. Any results with GOF < 0.8 were excluded because they were considered unreasonable. According to Table 4, the average sediment contribution rates of each source over the two periods indicated significant differences between 2022 and 2023. In 2022, 14 sediment deposition samples with an acceptable GOF > 0.8 were analyzed. The average contribution rates of natural sources, spoil heaps, and exposed slopes to channel sediment deposition were 72.96%, 19.00%, and 8.04%, respectively. During this period, there were exposed slopes covering a total area of 5.78 ha and spoil heaps covering 21.69 ha. In 2023, 18 sediment deposition samples with GOF > 0.8 were analyzed. The average contribution rate of natural sources was 58.73%, that of spoil heaps was 22.91%, and that of exposed slopes was 18.36%. During this period, the total area of exposed slopes and spoil heaps increased to 13.99 ha and 31.23 ha, respectively. This represents a growth of 142.04% for exposed slopes and 43.98% for spoil heaps compared to 2022. The scale of the exposed slope sources significantly increased. Comparing the average contribution rates in 2022 and 2023, there was an overall decrease in the average contribution rate of natural sources and an increase in the contribution rates of exposed slopes and spoil heaps.

3.3.2. Spatial Variation in Sediment Source Contributions

According to the spatial distribution of sediment contribution rates in 2022 (Figure 4a), natural sources contributed more than 50% of the sediment deposition at each sampling site. Notably, high contribution rates from natural sources were observed at S3 (93.67%), S7 (90.82%), and S20 (99.2%), which are located far from the engineering disturbance areas. In contrast, at sampling sites S10–S17, which occur near densely arranged disturbed areas, the contribution rate of natural sources to sediment deposition significantly decreased. With the increase in the engineering disturbance area in 2023, Figure 4b shows that the contribution rates of natural sources to channel sediment deposition notably decreased at each site. During this period, only three points (S3, S11, and S16) far from the disturbed areas exhibited natural source contribution rates close to the average value in 2022 (72.96%). At the remaining points, the contribution rates of natural sources were less than 70%, while in areas with dense engineering activities, the contribution rate decreased to less than 40% (e.g., S1, S13, and S14).
Figure 4 also shows the contribution rate of spoil material to sediment deposition. In 2022, the contribution rate of spoil heaps initially increased along the river from upstream to downstream and then decreased. From S7 (9.18%) to S10 (33.75%), the contribution rate of spoil heaps to sediment deposition notably increased. Downstream of the spoil heaps, from S11 to S20, the contribution rate gradually decreased to nearly zero. This trend could be described using the quadratic equation depicted in Figure 5a. In 2023, due to the use of spoil material for road construction near the river upstream of the spoil heap, sampling sites S1 to S5 showed an average contribution rate of 12.99%. Sampling sites S6 (11.81%) and S7 (10.78%), located at the upstream edge of the spoil heap, exhibited lower contribution rates. The contribution rates at the spoil heap outlets, namely, S9 (31.07%) and S10 (30.52%), did not significantly change compared to those in 2022. Downstream sites S11 (12.79%) and S12 (21.65%) showed a decrease in the contribution rate. Sites close to the watershed outlet, i.e., S13 to S19, which are influenced by road construction along the river, exhibited an average contribution rate higher than 30%.
In 2022, the contribution rates of exposed slopes in the middle and upper sections of the analyzed river (S3 and S7–S14) were nearly zero (Figure 4a). The upstream engineering disturbance sites were small in scale and located far from these sites. However, in the downstream section influenced by engineering activities, the average contribution rate of the exposed slopes at S16–S19 increased to 22.19%. At S20, which occurs far from engineering activities, the sediment contribution rate of the exposed slopes decreased to 0.8%. In 2023, as shown in Figure 4b, the contribution rates of exposed slopes were concentrated in the densely disturbed areas both upstream and downstream. In contrast, the middle section of the channel without disturbance contributed 0% to sediment deposition (S9, S10). In the upstream densely disturbed area, the average sediment contribution rate of the exposed slopes at sampling sites S1–S7 reached 28.89%. In the downstream section, four sediment sample sites (S11–S15), which are closer to the disturbance sites, exhibited a higher average contribution rate of 23.17%. Considering the spatial and temporal characteristics of the sediment contributions of the exposed slopes, the ratio of the exposed slope area to their distance from the sediment sampling sites was used as a comprehensive indicator. By calculating the DWI for each sediment sampling site, a linear relationship between this indicator and the sediment contribution rate of exposed slopes could be established (Figure 5b). This revealed a significant positive correlation between the indicator and the sediment contribution rate.

4. Discussion

4.1. Proportion of Different Sources in Sediment Deposition

Accurate source classification is the basis for applying fingerprinting techniques to determine the sediment contribution from different sources [46]. In this study, the optimal composite fingerprints consisting of Na2O, Sr, Ce, and Li are metallic elements that correlate with sediment sources. This finding is similar to studies that have traced sediments in disturbed watersheds, where the optimal composite fingerprints selected were mostly metallic elements [4,33,45,47,48]. This may imply that metallic elements are more suitable as tracers to distinguish the disturbed sources from the natural sources. It is important to note that the particle size selectivity of the erosion and sediment transport processes may affect the conservativeness of certain tracers and influence the results of the fingerprint analysis [49]. In this study, source samples were sieved to 2 mm, which means that a relatively high proportion of coarse soil particles were used in the measurement of trace indices. Considering that the deposited sediment sample sites are close to spoil heaps and exposed slopes, which are characterized by large particle sizes, the coarse disturbed sediments are more likely to enter channels and contribute to deposition than those from natural sources. The particle size selectivity of coarser materials may lead to tracer accumulation and exceed the highest concentrations at sources, resulting in tracer non-conservatism (e.g., the CaO in Figure 2 and Table 1). In previous research, the particle size range <63 µm has been most commonly used in sediment source fingerprinting [49]. The use of this particle size range, or even smaller fractions, may address the aforementioned influence on tracer conservativeness [50]. Future research will be needed to further explore the range of particle sizes that are suitable for use in engineering-disturbed watersheds.
On average, natural sources contributed more than 50% to sediment deposition in the sampled channel in both 2022 and 2023, indicating that they are the primary sediment sources within the watershed. This also highlights the severe soil erosion problem in the watershed. Previous studies have shown that the average soil erosion rate in the alpine canyon area of the Dadu River Basin, which includes the Zheduo River watershed, is 29 t/ha/a [51], rendering this basin one with the highest erosion risks in the upper reaches of the Yangtze River Basin [52]. In the study area, 76% of the land area is covered by grasslands, and over 57% of the area exhibits slopes greater than 25°. The limited soil and water conservation effectiveness of natural grasslands, combined with steep mountainous slopes, leads to severe soil erosion [53]. Another reason for the high contribution rate of natural sources to sediment deposition might be channel bank erosion. Studies using composite fingerprinting in similar regions have shown that sediment from gullies or erosion channels can account for more than 80% of the total sediment yield in watersheds, rendering them the main sediment sources [54,55]. It should be noted that the reclassification of sources by combining forest–grassland and channel banks into one category of natural land according to tracers improved the identification rate (Figure 3). This would provide a tracer selection strategy for classifying natural and disturbed sources. In other words, reducing the number of sources could reduce model uncertainty and enhance classification accuracy.
The combined contribution rates of spoil heaps and exposed slopes represent the impact of engineering disturbances on sediment deposition. From 2022 to 2023, the average contribution rates of engineering disturbances to channel sediment deposition at the different sites increased from 27% to 41%, while the percentages of the area disturbed by engineering activities in the watershed were only 0.18% and 0.30%, respectively. This indicates that engineering disturbances are a significant source of sediment in the watershed, despite occupying a much smaller area than natural forests and grasslands. In terms of the sediment contribution per unit area, the sediment yield from exposed slopes and spoil heaps was 184.7 times greater than that from natural sediment sources. This reflects the high-intensity surface disturbance caused by engineering activities. Exposed slopes involve the use of mechanical equipment to excavate land and clear vegetation, exposing large areas of bare soil and resulting in soil erosion rates that can be 1 to 4 orders of magnitude greater than those of natural land uses [56,57,58]. Spoil heaps are characterized as loose surface materials with low erosion resistance, resulting in soil erosion rates 10 to 100 times greater than those of natural forests [31,59]. Given that the area of spoil heaps is larger than that of exposed slopes in the watershed, spoil heaps generally contribute more to sediment deposition. However, in terms of dynamic changes, the contribution rate of exposed slopes to sediment deposition increased by 128.36% in 2023, far exceeding the increase of 20.58% in the contribution rate of spoil heaps. This suggests that the degree of erosion and sediment yield per unit area of exposed slopes are greater (1.69 times) than those of spoil heaps. This is due to the high-intensity soil erosion risk of bare excavation slopes, while the micro-terrain relief such as terraces on spoil heaps can mitigate erosion [60]. Despite the high risk of erosion mentioned above, the sealing of exposed slopes during construction reduces the area of soil loss, thereby lowering their contribution to sediment deposition. For instance, in this study, the average contribution of the exposed slopes at S16–S19, which are located at a disturbed site, decreased from 22.19% in 2022 to 0% in 2023, suggesting that the notable erosion and sedimentation caused by the exposed slopes may only represent a temporary situation [32,33].

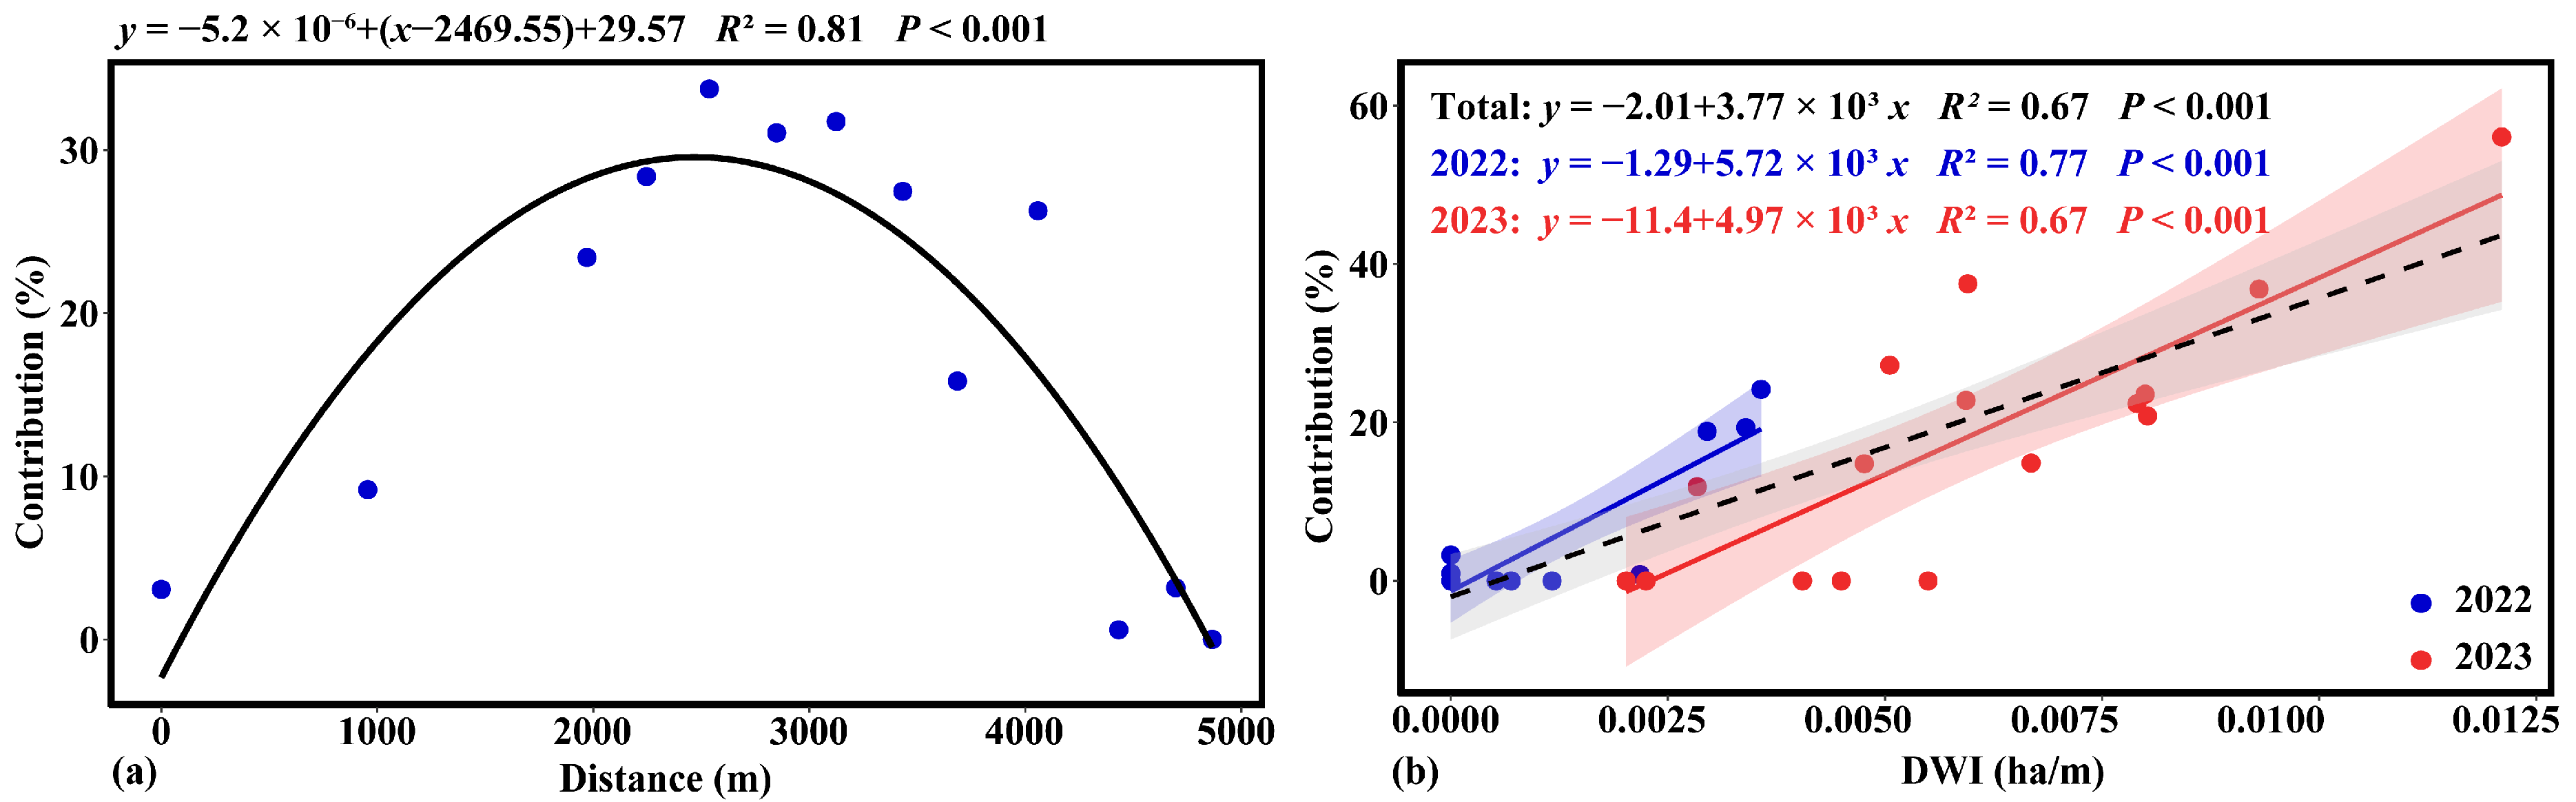
4.2. Spatial Variations in the Sediment Contribution Rates from Engineering Disturbances

In this study, the surficial deposited sediments were sampled at the end of the rainy season. Therefore, these samples would primarily reflect the erosion phenomena during the current year [61]. The annual precipitation for the years 2022 and 2023 was similar to each other and close to the average annual value [62]. On the other hand, the changes in land use and land cover in the study catchment are mainly reflected in the engineering activities that modify the surface. Therefore, the two types of engineering activities could be considered the main drivers of the spatiotemporal variability of sediment contribution rates in the catchment over two consecutive years.
In the case of the spoil heap, the trends of the quadratic function shown in Figure 5a characterize the variation mechanisms of the contribution of spoil material to sediment deposition along the channel. The parabolic increase represents the process within the spoil heap area where sediment contribution rates increase. Under the conditions of this study, spoil heaps are distributed close to the river, allowing sediment from slope erosion to directly enter the river. This continuous sediment transport into the river within the affected segment indicates an accumulation process, resulting in an increasing contribution rate of spoil material to sediment deposition. This finding is consistent with the river sediment accumulation process reported by Huang et al. (2020) [63]. It suggests that the length of contact between spoil heaps and rivers is a critical factor influencing the total amount of sediment entering the river. The contribution rate of spoil material to sediment deposition is positively correlated with the contact length between the river and the spoil heap. Notably, Figure 1 shows that the increased area of the spoil heap is mainly accumulated in the adjacent upland area rather than spread along the river, which means that the contact length between spoil heaps and rivers did not increase proportionally with the total area. This may be one reason why the sediment contribution rate of the spoil heap increased relatively slowly in 2023 compared to that of the exposed slope. Furthermore, this also reflects the fact mentioned above that the micro-terrain reduces sediment transport within the spoil heap area. Therefore, minimizing the direct contact area between spoil heaps and rivers during site selection and design is crucial for controlling sediment entry and deposition. Meanwhile, measures such as the terracing and the design of sediment basins along the flow path, which could reduce sediment generation and sediment connectivity [60,64], would be effective in preventing sediment from leaving the downstream boundary of the spoil heaps and being transported into the river.
The parabolic decrease in Figure 5a indicates that downstream of the spoil heap, the contribution rate of spoil material decreases. This finding conforms with the findings of Li et al. (2023) [65], who studied contribution rate changes in spoil heaps to river sediment deposition in southeastern Tibet using composite fingerprinting technology. As sediment is transported downstream by runoff, it is continually deposited in the river, causing a gradual reduction in its contribution rate to sediment deposition. Based on the quadratic function fitting equation in Figure 5a, the predicted maximum contribution rate of spoil heaps to sediment deposition in this study reached 29.57%, with the critical distance for this rate to decrease to zero reaching approximately 5 km. This distance could help in evaluating the downstream impact range of spoil heap sediments. In contrast to the spoil heaps, the sediment deposition distances for various fragmented exposed slope landscapes range from 0.17 to 2 km (2022: S11–S12, S19–20; 2023: S07–S09, S15–S16), indicating that a large amount of spoil material has a greater transport distance and potentially a larger extent of impact on the river environment than that of the exposed slopes. On the other hand, the sediment contribution from exposed slopes may disrupt the spatial variation trend of the spoil sediment contribution rate. This is one of the reasons why the parabolic equation developed based on 2022 data is not valid in 2023. It implies that the spatial variation in sediment contribution may be complicated in the case of sediments from different types of engineering-disturbed sources overlapping with each other.
Unlike the sediment from the spoil heaps, which enters the river directly due to the small distances, sediment from the exposed slopes is spatially dispersed and must travel a certain distance before reaching the river. The process by which sediment migrates from the source area to the river is also a crucial factor influencing the amount of sediment entering the river [66]. Therefore, when analyzing the contribution of exposed slopes to sediment deposition, it is essential to consider their distance from the river. The significant positive correlation between the sediment contribution rate from exposed slopes and the DWI, as shown in Figure 5b, could explain the spatial variation mechanism. The indicator indicates the disturbance scale and intensity at the sediment sampling points. Figure 5b shows that the disturbance from exposed slopes was greater and more extensive in 2023 than in 2022. The large-scale exposure of bare soil due to excavation disturbances was the primary reason for the high sediment contribution [45,47]. Additionally, the closer the slope sediment sources to the river, the more likely the sediment is to enter the river. According to the equation shown in Figure 5b, the critical DWI for a zero contribution rate of exposed slopes is 0.002. This suggests that controlling the scale of exposed slopes and their distance to the river within this range could help reduce their impact on river sediment deposition in the study area. If it is not possible to adjust the scale and location of exposed slopes in actual engineering projects, implementing sediment control measures such as sediment basins and check dams along the water flow path below the exposed slopes could effectively prevent sediment from entering the river [64,67].
In summary, the sediment contribution rates from the two types of engineering disturbance showed different spatiotemporal variations in the study watershed. This may reflect the role of the scale and geometry of the disturbed source in determining sediment transport to the river. The spoil heaps represent the relatively large area of disturbance. The sediment transport process within the disturbed area should be considered when assessing the environmental impact of engineering activities and taking conservation measures. On the other hand, the exposed slopes represent the disturbance type of relatively small areas and dispersed patches. The sediment contribution rate is mainly determined by the disturbed area and the distance to the river. This is consistent with our previous study on linear road segments, which showed that the flow length to the road played the most important role in determining the road-related sediment contribution rate [61]. In future research, more work should be conducted to quantify the scale and geometry characteristics of engineering disturbances with appropriate indices. Studies of more type combinations and at larger scales should be conducted. Meanwhile, the hydrological connection between different types of disturbance and the channel network should also be further clarified. In addition, the unique mechanism of soil erosion in engineering-disturbed areas [60,64] should be taken into account when comparing the sediment contribution from natural and disturbed sources.

5. Conclusions

In this study, composite fingerprinting technology was adopted to analyze the sources of channel sediment deposition in a watershed disturbed by engineering activities during the two periods of 2022 and 2023. Based on fingerprints encompassing 17 geochemical elements, conservatism tests, nonparametric tests, and multivariate stepwise DFA were employed to select the optimal composite fingerprints. The results showed that the optimal composite fingerprints comprising Na2O, Li, Sr, and Ce could be used to effectively differentiate the contributions of natural sources and engineering disturbances to sediment deposition at various locations along the river. The natural sources of forests, grasslands, shrublands, and channel banks were the primary sources of channel sediment deposition, with average contribution rates exceeding 50% during both periods. However, spoil heaps and exposed slopes, which occupied only 0.18% and 0.30% of the total area, respectively, contributed 27% and 41% to river sediment deposition in 2022 and 2023, respectively, rendering them significant sediment sources. The spatiotemporal variation in sediment contribution rates differed with the scale and geometry of the disturbed sources. For spoil heaps which represent a relatively large area of disturbance, the heterogeneity within the disturbed area and the contact length with the channel would determine the sediment contribution. A quadratic function was developed to describe the variation in the spoil heap sediment contribution rate along the channel, and the critical distance for this rate to decrease to zero was calculated to be approximately 5 km. On the other hand, the contribution of relatively small and scattered exposed slopes to river sediment deposition was related to the disturbance area and distance from the river. This contribution rate could be described by a linear equation of the DWI calculated from the above two indices. These findings revealed the spatiotemporal variation trends in sediment sources within the watershed under engineering disturbance conditions. This information is essential for assessing the environmental impact of engineering disturbances and optimizing the implementation of conservation measures.

Author Contributions

Conceptualization, L.C. and B.Z.; methodology, B.Z.; software, B.Z.; validation, B.Z., S.Y. and H.P.; formal analysis, B.Z.; investigation, B.Z., S.Y. and H.P.; resources, L.C.; data curation, B.Z. and F.L.; writing—original draft preparation, B.Z.; writing—review and editing, L.C.; visualization, B.Z. and F.L.; supervision, L.C.; project administration, L.C. and Y.K.; funding acquisition, L.C. and Y.K. All authors have read and agreed to the published version of the manuscript.

Funding

This research was funded by the National Key Research and Development Program of China, grant number 2021YFB2600105, and the Natural Science Foundation of Sichuan Province of China, grant number 2024NSFSC0105.

Data Availability Statement

The data that support the findings of this study are available from the corresponding author upon reasonable request.

Conflicts of Interest

The authors declare no conflicts of interest.

References

  1. Kopittke, P.M.; Minasny, B.; Pendall, E.; Rumpel, C.; McKenna, B.A. Healthy soil for healthy humans and a healthy planet. Crit. Rev. Environ. Sci. Technol. 2024, 54, 210–221. [Google Scholar] [CrossRef]
  2. Wang, J.Z.; Zhen, J.N.; Hu, W.F.; Chen, S.C.; Lizaga, I.; Zeraatpisheh, M.; Yang, X.D. Remote sensing of soil degradation: Progress and perspective. Int. Soil Water Conserv. Res. 2023, 11, 429–454. [Google Scholar] [CrossRef]
  3. Li, Z.Y.; Fang, H.Y. Impacts of climate change on water erosion: A review. Earth-Sci. Rev. 2016, 163, 94–117. [Google Scholar] [CrossRef]
  4. Malhotra, K.; Lamba, J.; Shepherd, S. Sources of stream bed sediment in an urbanized watershed. Catena 2020, 184, 104228. [Google Scholar] [CrossRef]
  5. Xu, Z.; Belmont, P.; Brahney, J.; Gellis, A.C. Sediment source fingerprinting as an aid to large-scale landscape conservation and restoration: A review for the Mississippi River Basin. J. Environ. Manag. 2022, 324, 116260. [Google Scholar] [CrossRef]
  6. Collins, A.L.; Walling, D.E. Documenting catchment suspended sediment sources: Problems, approaches and prospects. Prog. Phys. Geogr. 2004, 28, 159–196. [Google Scholar] [CrossRef]
  7. Collins, A.L.; Zhang, Y.; McChesney, D.; Walling, D.E.; Haley, S.M.; Smith, P. Sediment source tracing in a lowland agricultural catchment in southern England using a modified procedure combining statistical analysis and numerical modelling. Sci. Total Environ. 2012, 414, 301–317. [Google Scholar] [CrossRef]
  8. Gaspar, L.; Lizaga, I.; Blake, W.H.; Latorre, B.; Quijano, L.; Navas, A. Fingerprinting changes in source contribution for evaluating soil response during an exceptional rainfall in Spanish pre-pyrenees. J. Environ. Manag. 2019, 240, 136–148. [Google Scholar] [CrossRef] [PubMed]
  9. Lizaga, I.; Gaspar, L.; Latorre, B.; Navas, A. Variations in transport of suspended sediment and associated elements induced by rainfall and agricultural cycle in a Mediterranean agroforestry catchment. J. Environ. Manag. 2020, 272, 111020. [Google Scholar] [CrossRef]
  10. Pulley, S.; Collins, A.L. The potential for colour to provide a robust alternative to high-cost sediment source fingerprinting: Assessment using eight catchments in England. Sci. Total Environ. 2021, 792, 148416. [Google Scholar] [CrossRef] [PubMed]
  11. Gellis, A.C.; Fuller, C.C.; Van Metre, P.; Filstrup, C.T.; Tomer, M.D.; Cole, K.J.; Sabitov, T.Y. Combining sediment fingerprinting with age-dating sediment using fallout radionuclides for an agricultural stream, Walnut Creek, Iowa, USA. J. Soils Sediments 2019, 19, 3374–3396. [Google Scholar] [CrossRef]
  12. Kemper, J.T.; Rathburn, S.L.; Friedman, J.M.; Nelson, J.M.; Mueller, E.R.; Vincent, K.R. Fingerprinting historical tributary contributions to floodplain sediment using bulk geochemistry. Catena 2022, 214, 106231. [Google Scholar] [CrossRef]
  13. Zhang, X.C.; Liu, B.L. Using multiple composite fingerprints to quantify fine sediment source contributions: A new direction. Geoderma 2016, 268, 108–118. [Google Scholar] [CrossRef]
  14. Chen, F.X.; Wang, X.Y.; Li, X.X.; Wang, J.L.; Xie, D.T.; Ni, J.P.; Liu, Y.J. Using the sediment fingerprinting method to identify the sediment sources in small catchments with similar geological conditions. Agric. Ecosyst. Environ. 2019, 286, 106655. [Google Scholar] [CrossRef]
  15. Fathabadi, A.; Jansen, J.D. Quantifying uncertainty of sediment fingerprinting mixing models using frequentist and Bayesian methods: A case study from the Iranian loess Plateau. Catena 2022, 217, 106474. [Google Scholar] [CrossRef]
  16. Nosrati, K.; Akbari-Mahdiabad, M.; Ayoubi, S.; Collins, A.L. An exploratory study on the use of different composite magnetic and colour fingerprints in aeolian sediment provenance fingerprinting. Catena 2021, 200, 105182. [Google Scholar] [CrossRef]
  17. Zhang, J.; Yang, M.; Zhang, F.; Zhang, W.; Zhao, T.; Li, Y. Fingerprinting Sediment Sources After an Extreme Rainstorm Event in a Small Catchment on the Loess Plateau, PR China. Land Degrad. Dev. 2017, 28, 2527–2539. [Google Scholar] [CrossRef]
  18. Liu, Y.; Walling, D.; Yang, M.Y.; Zhang, F.B. Sediment source fingerprinting and the temporal variability of source contributions. J. Environ. Manag. 2023, 338, 117835. [Google Scholar] [CrossRef] [PubMed]
  19. Lizaga, I.; Latorre, B.; Bodé, S.; Gaspar, L.; Boeckx, P.; Navas, A. Combining isotopic and elemental tracers for enhanced sediment source partitioning in complex catchments. J. Hydrol. 2024, 631, 130768. [Google Scholar] [CrossRef]
  20. Patault, E.; Alary, C.; Franke, C.; Abriak, N.E. Quantification of tributaries contributions using a confluence-based sediment fingerprinting approach in the Canche river watershed (France). Sci. Total Environ. 2019, 668, 457–469. [Google Scholar] [CrossRef]
  21. Xiong, J.F.; Lin, C.; Ma, R.H.; Wu, Z.P.; Chen, L. Tracing sediment sources in a plain river network area by using optimized experimental design and reflectance spectroscopy. Water Res. 2024, 250, 121041. [Google Scholar] [CrossRef]
  22. Frankl, A.; Evrard, O.; Cammeraat, E.; Tytgat, B.; Verleyen, E.; Stokes, A. Tracing hotspots of soil erosion in high mountain environments: How forensic science based on plant eDNA can lead the way. An opinion. Plant Soil 2022, 476, 729–742. [Google Scholar] [CrossRef]
  23. Pulley, S.; Collins, A.L. Soil erosion, sediment sources, connectivity and suspended sediment yields in UK temperate agricultural catchments: Discrepancies and reconciliation of field-based measurements. J. Environ. Manag. 2024, 351, 119810. [Google Scholar] [CrossRef] [PubMed]
  24. Astorga, R.T.; Garcias, Y.; Borgatello, G.; Velasco, H.; Padilla, R.; Dercon, G.; Mabit, L. Use of geochemical fingerprints to trace sediment sources in an agricultural catchment of Argentina. Int. Soil Water Conserv. Res. 2020, 8, 410–417. [Google Scholar] [CrossRef]
  25. Nosrati, K.; Collins, A.L. Investigating the importance of recreational roads as a sediment source in a mountainous catchment using a fingerprinting procedure with different multivariate statistical techniques and a Bayesian un-mixing model. J. Hydrol. 2019, 569, 506–518. [Google Scholar] [CrossRef]
  26. Panagos, P.; Imeson, A.; Meusburger, K.; Borrelli, P.; Poesen, J.; Alewell, C. Soil Conservation in Europe: Wish or Reality? Land Degrad. Dev. 2016, 27, 1547–1551. [Google Scholar] [CrossRef]
  27. Zhang, L.T.; Gao, Z.L.; Yang, S.W.; Li, Y.H.; Tian, H.W. Dynamic processes of soil erosion by runoff on engineered landforms derived from expressway construction: A case study of typical steep spoil heap. Catena 2015, 128, 108–121. [Google Scholar] [CrossRef]
  28. Cheng, B.; Lv, Y.; Zhan, Y.; Su, D.; Cao, S. Constructing China’s Roads as Works of Art: A Case Study of “Esthetic Greenway” Construction in the Shennongjia Region of China. Land Degrad. Dev. 2015, 26, 324–330. [Google Scholar] [CrossRef]
  29. Hancock, G.R.; Crawter, D.; Fityus, S.G.; Chandler, J.; Wells, T. The measurement and modelling of rill erosion at angle of repose slopes in mine spoil. Earth Surf. Process. Landf. 2008, 33, 1006–1020. [Google Scholar] [CrossRef]
  30. Lv, J.R.; Luo, H.; Xie, Y.S. Impact of rock fragment size on erosion process and micro-topography evolution of cone-shaped spoil heaps. Geomorphology 2020, 350, 106936. [Google Scholar] [CrossRef]
  31. Li, J.M.; Li, L.; Wang, W.L.; Kang, H.L.; Guo, M.M.; Huang, J.Q.; Wang, Y.F.; Lou, Y.B.; Tong, X.X.; Nie, H.Y. Hydrological and erosion responses of steep spoil heaps to taproot and fibrous root grasses under simulated rainfalls. J. Hydrol. 2023, 618, 129169. [Google Scholar] [CrossRef]
  32. Bravo-Linares, C.; Ovando-Fuentealba, L.; Muñoz-Arcos, E.; Kitch, J.L.; Millward, G.E.; López-Gajardo, R.; Cañoles-Zambrano, M.; Del Valle, A.; Kelly, C.; Blake, W.H. Basin scale sources of siltation in a contaminated hydropower reservoir. Sci. Total Environ. 2024, 914, 169952. [Google Scholar] [CrossRef] [PubMed]
  33. Franz, C.; Makeschin, F.; Weiss, H.; Lorz, C. Sediments in urban river basins: Identification of sediment sources within the Lago Paranoa catchment, Brasilia DF, Brazil—Using the fingerprint approach. Sci. Total Environ. 2014, 466–467, 513–523. [Google Scholar] [CrossRef] [PubMed]
  34. Koiter, A.J.; Lobb, D.A.; Owens, P.N.; Petticrew, E.L.; Tiessen, K.H.D.; Li, S. Investigating the role of connectivity and scale in assessing the sources of sediment in an agricultural watershed in the Canadian prairies using sediment source fingerprinting. J. Soils Sediments 2013, 13, 1676–1691. [Google Scholar] [CrossRef]
  35. Li, Z.H.; Luo, Z.H.; Chen, Y.L.; Zhao, J.X. Geology and Geochemistry of the Kangding-Luding Metamorphosed Intrusions and Implication for Tectonic Setting. Geoscience 2008, 22, 181–189. Available online: https://www.geoscience.net.cn/CN/Y2008/V22/I2/181 (accessed on 2 May 2024).
  36. Collins, A.L.; Pulley, S.; Foster, I.D.L.; Gellis, A.; Porto, P.; Horowitz, A.J. Sediment source fingerprinting as an aid to catchment management: A review of the current state of knowledge and a methodological decision-tree for end-users. J. Environ. Manag. 2017, 194, 86–108. [Google Scholar] [CrossRef] [PubMed]
  37. Pulley, S.; Foster, I.; Collins, A.L. The impact of catchment source group classification on the accuracy of sediment fingerprinting outputs. J. Environ. Manag. 2017, 194, 16–26. [Google Scholar] [CrossRef] [PubMed]
  38. Lizaga, I.; Bodé, S.; Gaspar, L.; Latorre, B.; Boeckx, P.; Navas, A. Legacy of historic land cover changes on sediment provenance tracked with isotopic tracers in a Mediterranean agroforestry catchment. J. Environ. Manag. 2021, 288, 112291. [Google Scholar] [CrossRef] [PubMed]
  39. Lizaga, I.; Latorre, B.; Gaspar, L.; Navas, A. FingerPro: An R Package for Tracking the Provenance of Sediment. Water Resour. Manag. 2020, 34, 3879–3894. [Google Scholar] [CrossRef]
  40. Walling, D.E.; Russell, M.A.; Hodgkinson, R.A.; Zhang, Y. Establishing sediment budgets for two small lowland agricultural catchments in the UK. Catena 2002, 47, 323–353. [Google Scholar] [CrossRef]
  41. Collins, A.L.; Walling, D.E.; Leeks, G.J.L. Source type ascription for fluvial suspended sediment based on a quantitative composite fingerprinting technique. Catena 1997, 29, 1–27. [Google Scholar] [CrossRef]
  42. Walling, D.E.; Owens, P.N.; Leeks, G.J.L. Fingerprinting suspended sediment sources in the catchment of the River Ouse, Yorkshire, UK. Hydrol. Process. 1999, 13, 955–975. [Google Scholar] [CrossRef]
  43. Motha, J.A.; Wallbrink, P.J.; Hairsine, P.B.; Grayson, R.B. Determining the sources of suspended sediment in a forested catchment in southeastern Australia. Water Resour. Res. 2003, 39, 1056. [Google Scholar] [CrossRef]
  44. Gorman Sanisaca, L.; Gellis, A.; Lorenz, D. Sediment Source Assessment Tool (Sed_SAT). Available online: https://www.usgs.gov/software/sediment-source-assessment-tool-sedsat (accessed on 6 June 2024).
  45. Shu, C.B.; Liu, G.; Zhang, Q.; Xu, J.H.; Chen, H.; Dan, C.X.; Wang, X.K.; Shen, Y.L.; Liu, Y.; Guo, Z.; et al. Fingerprinting sediment sources in mountainous catchments disturbed by plantation and construction activities in southern China. Land Degrad. Dev. 2024, 35, 3287–3301. [Google Scholar] [CrossRef]
  46. Zhou, H.P.; Chang, W.N.; Zhang, L.J. Sediment sources in a small agricultural catchment: A composite fingerprinting approach based on the selection of potential sources. Geomorphology 2016, 266, 11–19. [Google Scholar] [CrossRef]
  47. Ferreira, C.S.S.; Walsh, R.P.D.; Blake, W.H.; Kikuchi, R.; Ferreira, A.J.D. Temporal Dynamics of Sediment Sources in an Urbanizing Mediterranean Catchment. Land Degrad. Dev. 2017, 28, 2354–2369. [Google Scholar] [CrossRef]
  48. Malhotra, K.; Lamba, J.; Srivastava, P.; Shepherd, S. Fingerprinting Suspended Sediment Sources in an Urbanized Watershed. Water 2018, 10, 1573. [Google Scholar] [CrossRef]
  49. Laceby, J.P.; Evrard, O.; Smith, H.G.; Blake, W.H.; Olley, J.M.; Minella, J.P.G.; Owens, P.N. The challenges and opportunities of addressing particle size effects in sediment source fingerprinting: A review. Earth-Sci. Rev. 2017, 169, 85–103. [Google Scholar] [CrossRef]
  50. Collins, A.L.; Blackwell, M.; Boeckx, P.; Chivers, C.A.; Emelko, M.; Evrard, O.; Foster, I.; Gellis, A.; Gholami, H.; Granger, S.; et al. Sediment source fingerprinting: Benchmarking recent outputs, remaining challenges and emerging themes. J. Soils Sediments 2020, 20, 4160–4193. [Google Scholar] [CrossRef]
  51. Zhang, H.G.; Jiang, Z.L. Research on Soil Conservation During the Dadu River Valley Construction. Res. Soil Water Conserv. 2005, 12, 46–48. Available online: http://stbcyj.paperonce.org/oa/darticle.aspx?id=20050214 (accessed on 2 May 2024).
  52. Huang, X.T.; Zheng, H.B.; John, C.; Wang, P. Characteristics of cosmogenic nuclide 10 Be in the Yangtze riverine sediments and estimations of erosion rate. Quat. Sci. 2013, 33, 671–683. [Google Scholar] [CrossRef]
  53. Cui, P.; Wang, D.J.; Fan, J.R.; Wang, Y.K.; He, X.B.; Zhu, B.; Wei, F.Q.; Wang, G.X. Current status and comprehensive control strategies of soil erosion for the upper Yangtze and other rivers in the Southwestern China. Sci. Soil Water Conserv. 2008, 6, 43–50. [Google Scholar] [CrossRef]
  54. Guo, Q.K.; Shan, Z.J.; Lu, W.; Qin, W.; Yin, Z.; Xu, H.C. Fingerprinting sediment sources in two typical watersheds in the dry-hot valleys of Southwest China: The role of gully and orchard land. Catena 2023, 233, 107479. [Google Scholar] [CrossRef]
  55. Shi, Z.L.; Blake, W.H.; Wen, A.B.; Chen, J.C.; Yan, D.C.; Long, Y. Channel erosion dominates sediment sources in an agricultural catchment in the Upper Yangtze basin of China: Evidence from geochemical fingerprints. Catena 2021, 199, 105111. [Google Scholar] [CrossRef]
  56. Faucette, L.B.; Risse, L.M.; Jordan, C.F.; Cabrera, M.L.; Coleman, D.C.; West, L.T. Vegetation and soil quality effects from hydroseed and compost blankets used for erosion control in construction activities. J. Soil Water Conserv. 2006, 61, 355–362. Available online: https://www.jswconline.org/content/jswc/61/6/355 (accessed on 2 May 2024).
  57. Harbor, J. Engineering geomorphology at the cutting edge of land disturbance: Erosion and sediment control on construction sites. Geomorphology 1999, 31, 247–263. [Google Scholar] [CrossRef]
  58. Jenny, J.P.; Koirala, S.; Gregory-Eaves, I.; Francus, P.; Niemann, C.; Ahrens, B.; Brovkin, V.; Baud, A.; Ojala, A.E.K.; Normandeau, A.; et al. Human and climate global-scale imprint on sediment transfer during the Holocene. Proc. Natl. Acad. Sci. USA 2019, 116, 22972–22976. [Google Scholar] [CrossRef]
  59. Li, J.M.; Wang, W.L.; Guo, M.M.; Kang, H.L.; Wang, Z.G.; Huang, J.Q.; Sun, B.Y.; Wang, K.; Zhang, G.H.; Bai, Y. Effects of soil texture and gravel content on the infiltration and soil loss of spoil heaps under simulated rainfall. J. Soils Sediments 2020, 20, 3896–3908. [Google Scholar] [CrossRef]
  60. Su, H.; Wang, W.L.; Kang, H.L.; Bai, Y.; Guo, M.M.; Chen, Z.X. Erosion morphology and the characteristics of runoff and sediment yielding in platform-slope system of opencast coal mine. Chin. J. Appl. Ecol. 2020, 31, 3194–3206. [Google Scholar] [CrossRef]
  61. Li, X.; Zhu, B.C.; Cao, L.X.; Li, R.; Bai, C.L.; Wang, X.J. Composite Fingerprint Analysis of Sediment Sources in a Watershed Disturbed by Road Construction in Southeastern Tibet. Land 2024, 13, 929. [Google Scholar] [CrossRef]
  62. Song, X.; Xu, L.W.; He, X.L.; Cao, P.J. Ganzi Tibetan Autonomous Prefecture Water Resources Report 2022; Ganzi Water Authority: Kangding, China, 2023; p. 27. Available online: https://slj.gzz.gov.cn/tzgs/article/533041 (accessed on 2 May 2024).
  63. Huang, Z.; Lin, B.L.; Sun, J.; Nima, L.Z.; Da, P.; Dawa, J.M. Suspended Sediment Transport Responses to Increasing Human Activities in a High-Altitude River: A Case Study in a Typical Sub-Catchment of the Yarlung Tsangpo River. Water 2020, 12, 952. [Google Scholar] [CrossRef]
  64. Cao, L.X.; Elliot, W.; Long, J.W. Spatial simulation of forest road effects on hydrology and soil erosion after a wildfire. Hydrol. Process. 2021, 35, e14139. [Google Scholar] [CrossRef]
  65. Li, X.; Shi, M.M.; Cao, L.X.; Chen, G.; Wang, Y.; Yao, L.F. A composite fingerprinting analysis of sediment sources in a construction-disturbed small watersheds of Southeast Tibet. Sci. Soil Water Conserv. 2023, 21, 113–122. [Google Scholar] [CrossRef]
  66. Elliot, W.J. WEPP internet interfaces for forest erosion prediction. J. Am. Water Resour. Assoc. 2004, 40, 299–309. [Google Scholar] [CrossRef]
  67. Robichaud, P.R.; Storrar, K.A.; Wagenbrenner, J.W. Effectiveness of straw bale check dams at reducing post-fire sediment yields from steep ephemeral channels. Sci. Total Environ. 2019, 676, 721–731. [Google Scholar] [CrossRef]
Figure 1. The map of the study area and sampling points. (ac) Photos of the exposed slope, spoil heaps, and unpaved road, respectively; (d) photo of a deposited sediment site; (e,f) photos of shrubland and forest sampling sites, respectively; (g) photo of grassland and channel; (h) the location of the study area and the sampling points.
Land 13 01314 g001
Figure 2. Boxplot of the tracer concentrations.
Land 13 01314 g002
Figure 3. Linear discriminant analysis for source classification: (a) the original sources; (b) the combined sources (natural: forests, grasslands, shrublands, and channel banks).
Land 13 01314 g003
Figure 4. The spatial distribution of sediment contribution rates: (a) in 2022; (b) in 2023.
Land 13 01314 g004
Figure 5. Equations for fitting the contributions of sources: (a) the contribution of spoil heaps in 2022; (b) the contribution of exposed slopes between 2022 and 2023.
Land 13 01314 g005
Table 1. Conservatism test and Kruskal–Wallis H test results for the fingerprints.
TracersSourcesSedimentKruskal–Wallis
H-Test
MinMaxMeanMinMaxMeanp Value
Tracer01K2O1.75.33.22.14.83.20.000 a*
Tracer02Na2O0.53.21.813.11.90.000 a*
Tracer03CaO0.32.51.00.54.92.9
Tracer04MgO0.21.10.50.40.80.60.003 a*
Tracer05Al2O38.316.012.110.513.811.50.000 a*
Tracer06SiO248.383.567.866.580.873.60.176 a
Tracer07S0.0090.250.10.0060.230.081
Tracer08Li15.589.745.231.148.739.10.000 a*
Tracer09Mn91.31196.8395.8186.31075.8387.90.004 a*
Tracer10Co1.421.36.62.211.16.20.000 a*
Tracer11Ni1.237.813.94.229.215.70.000 a*
Tracer12Sr47.9446.6126.287.1203.3148.60.000 a*
Tracer13La25.3198.882.033216.276.1
Tracer14Ce24.0155.573.851.8132.186.70.000 a*
Tracer15Pb19.855.334.322.233.928.70.000 a*
Tracer16Sn2.129.55.02.614.44.60.004 a*
Tracer17Ag0.0360.6710.1230.0310.3320.055
Concentration units of each fingerprint are consistent with those in the boxplot. a indicates that the conservatism test is passed. * indicates a significant difference at p ≤ 0.05.
Table 2. Multivariate stepwise discriminant function analysis for selecting the optimal composite fingerprints.
TracerWilks LambdaCumulative Percentage Classified (%)Individual Percentage
Classified (%)
Sr0.137987.9487.9
Na2O0.084192.1981.6
Ce0.065092.7077.4
Li0.049493.7370.3
Table 3. Confusion matrix of the predicted actual number/percentage (%) of the source samples.
SourcesPredicted Sources
NaturalExposed SlopeSpoil Heap
ActualNatural6001
Exposed slope5140
Spoil heap008
CountNatural92.3011.1
%Exposed slope7.71000
Spoil heap0088.9
Table 4. Area and average contribution of each source over two periods.
PeriodAverage Contribution (%)Area (ha)/Proportion (%)Average
GOF
n
NaturalExposed SlopeSpoil HeapExposed SlopeSpoil Heap
202272.968.0419.005.78/0.03821.69/0.1430.9114
202358.7318.3622.9113.99/0.09331.23/0.2060.8818
Disclaimer/Publisher’s Note: The statements, opinions and data contained in all publications are solely those of the individual author(s) and contributor(s) and not of MDPI and/or the editor(s). MDPI and/or the editor(s) disclaim responsibility for any injury to people or property resulting from any ideas, methods, instructions or products referred to in the content.

