Abstract
Various physical and environmental factors affect the recreational experience in national forest parks. Understanding visitors’ preferences regarding these factors is significant for promoting the physical and mental health and well-being of urban residents. This study aims to quantify residents’ usage patterns and safety perceptions of national forest parks. It focuses particularly on Santai Mountain National Forest Park in Jiangsu, China, and conducted a semi-structured questionnaire survey with 688 participants. The statistical software IBM SPSS Statistics 24 was used for data analysis. A descriptive quantitative analysis was conducted on the respondents’ demographic information. Descriptive statistics, chi-square tests, and an ordinal logistic regression model were employed to analyze the survey data. The survey results show that most visitors go to the forest park only once or twice a year, usually on weekends, holidays, and during leisure time rather than on workdays. Because the national forest park is located in the suburbs, the journey is long, and most visitors choose to drive there. Additionally, the majority of visitors go to the forest park with family and friends. Because the park is well managed and has complete safety facilities, most visitors feel safe in the national forest park.
1. Introduction
National forest parks (NFPs) are a critical component of the forest parks system, featuring distinctive scenery, valuable social resources, and a healthy ecosystem. Numerous studies have highlighted the various advantages they offer, making them essential elements of urban environments and contributing to the physical and mental well-being of individuals [1,2]. Forest parks provide several benefits to urban ecosystems, such as controlling air quality [3], regulating the climate, capturing carbon dioxide, reducing atmospheric pollution, releasing abundant oxygen, purifying water, replenishing water supplies, reducing noise [4], and preserving biodiversity [5]. Commonly referred to as “the lung of the city” and “the oxygen bar of the city,” NFPs play a significant role in reducing psychological stress, including anxiety, promoting emotional well-being, and enhancing both mental and physical health [6]. Furthermore, NFPs help mitigate the urban heat island effect, contributing to cooler city climates [7].
Urban residents can only enjoy the benefits of parks if they have reasonable access to them [8,9]. Numerous studies conducted in various cities worldwide have examined the impact of elements such as distance and time spent traveling [3], park users’ socioeconomic backgrounds [3,10], and park features [1,2] on park accessibility. However, there has been a lack of distinction between forest parks and city parks, despite significant differences in their location, landscape, activities, and scope of services. Additionally, there is limited research exploring the factors that drive demand, and to the best of our understanding, no investigations have been conducted in China. As an outcome, our study aims to bridge this gap by concentrating specifically on the differences in park use between forest parks and other urban parks. If the quality of green space is important to spots, then the nature of urban parks is an important factor to consider. For example, the size of parks and accessibility have a strong connection to park use and a boost in people’s activity levels [11].
One of the most significant variables for explaining park utilization by urban dwellers is park accessibility, which can be categorized into two distinct groups: real accessibility and prospective accessibility [12]. The first type emphasizes the utilization of natural environments, while the other focuses on the quantity of natural surroundings available in a specific area. The distance and duration of a trip are typical variables used to quantify accessibility, a concept rooted in Location Theory and Central Place Theory [13]. To account for the possibility of the impact of socio-personal features on the capacity to access services, accessibility was defined as the ease with which individuals can reach their chosen activity areas. Judgments of park accessibility are strongly influenced by both park characteristics and the sociodemographic variables of park users. In a similar vein, additional variables influencing accessibility include the quantity and quality of available space, the socioeconomic background of users, the proximity to competing amenities, the capacity of facilities to meet user demands, the quality of facility maintenance, and the perceived safety of the facilities offered [14]. Other research confirms that the utilization of green spaces is influenced by various factors, particularly the proximity, quality, and quantity of available green areas [15]. The demand for ecological services is significantly influenced by socioeconomic and demographic characteristics [11]. Other studies primarily focus on the sociodemographic traits of park users, including factors such as race, gender, age, and income, which all play a significant role in park and greenspace utilization, as documented in existing research [16]. Certain academic studies indicate that people of color and those with lower incomes are more likely to have limited access to parks [17]. Furthermore, some studies investigate the accessibility of urban parks for children, revealing potential issues related to equity and environmental justice [18,19]. National forest parks are not universally present, which highlights a limitation of this study. Countries and regions such as mainland China [3,20,21], Taiwan [5], the Czech Republic [22], and the United States [23] have these parks.
Currently, research on the use of NFPs is predominantly concentrated in Europe and North America, with significantly fewer studies in Asia, particularly in China. This is especially true for studies on the use and safety of NFPs. Previous research has primarily focused on the impact of environmental characteristics and user behavior on the use of NFPs. However, there is a notable lack of systematic analysis from a socio-ecological perspective, especially regarding the influence of different sociodemographic characteristics (such as gender, household registration, age, education level, marital status, and occupation) on the leisure experiences of NFP visitors. Consequently, this study aims to address these gaps by incorporating sociodemographic factors into the examination of leisure experiences in NFPs. This study has three main objectives: (1) to evaluate visitors’ usage patterns of NFPs; (2) to explore the safety factors associated with visitors’ use of NFPs; and (3) to provide guidance for the future planning and design of NFPs, thereby enhancing their recreational value and promoting their sustainable development.
2. Materials and Methods
2.1. Study Site
Suqian is located in the north of Jiangsu Province and in the eastern part of the map of China (refer to Figure 1). The city experiences a warm temperate monsoon climate, located between 33°12′17″–34°24′38″ north latitude and 117°6′19″–119°12′50″ east longitude [24]. It includes 4603 square kilometers of arable land and 2198 square kilometers of water surface [24]. Santai Mountain NFP is located near the Lakeside New District of Suqian City, Jiangsu Province, on the shore of Luoma Lake. Situated 7 km north of the city center, the park covers an area of 1270 hectares and serves as the central city’s “oxygen bar” and “back garden,” with a forest coverage rate of 98% [25]. The forest park boasts a remarkable concentration of 20,000 negative oxygen ions per cubic centimeter and offers a comprehensive range of attractions, including forest landscapes, natural scenery, cultural and artistic experiences, and forest-based leisure and vacation activities (refer to Figure 2). According to the official website of the Suqian Municipal People’s Government [24], the park provides natural landscape tourism, cultural and artistic experiences, forest leisure and holiday activities, science education, and sports fitness (refer to Figure 3).
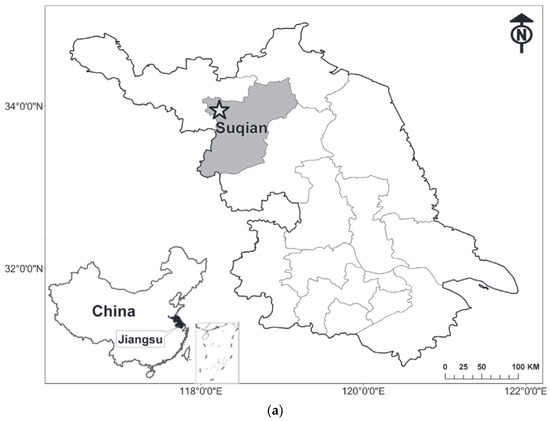
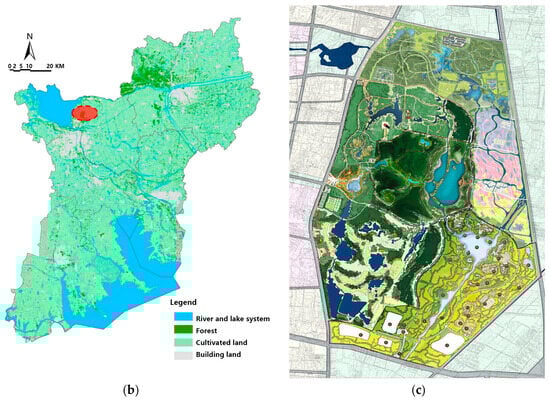
Figure 1.
Location of the study area and the NFP. The map depicts the location of the study area and the placement of the NFP. (a) shows the location of Suqian, Jiangsu Province, China; The red area indicates the location of Santai Mountain NFP. (b) indicates the specific location of Santai Mountain NFP in Suqian; and (c) focuses on Santai Mountain NFP. Source: Background map shows national boundaries as defined by China’s Department of Natural Resources. Base map of Suqian City from Jiangsu Provincial Department of Natural Resources Suqian City Political Area Map. Visit http://www.bigemap.com, accessed on 6 March 2023, for more information based on open-source data from BIGEMAP.
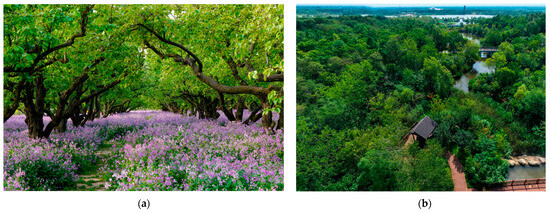
Figure 2.
The depictions of the Santai Mountain NFP in Jiangsu: (a) Flowers; (b) Woods; (c) Landscape Corridors; and (d) Water Features.
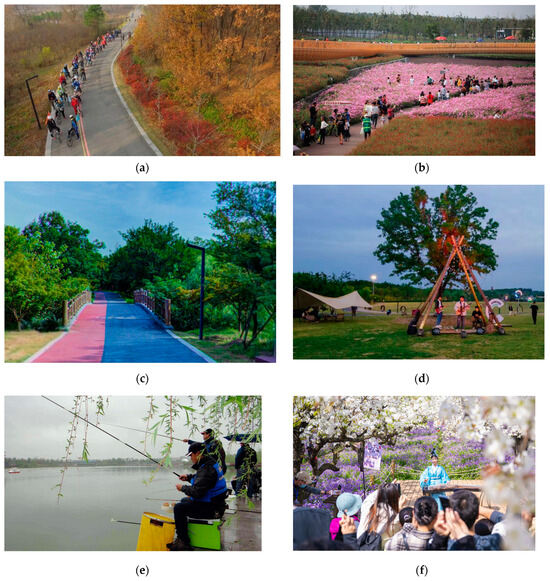
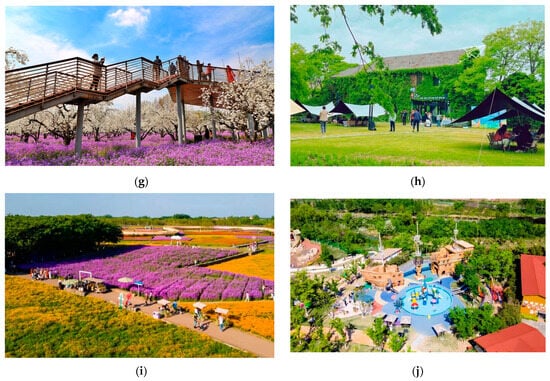
Figure 3.
User activities in the Santai Mountain NFP, Jiangsu: (a) cycling; (b) flower-viewing; (c) walking; (d) music appreciation; (e) fishing; (f) watching a performance; (g) viewing platform; (h) camping; (i) agricultural sales; (j) children’s playground.
2.2. The Conceptual Framework
Inspired by the work of Giles-Corti et al. (2005) [16] and Forsyth and Musacchio (2005) [26], a specific socio-ecological framework was developed for this study as a general conceptual model (refer to Figure 4). This framework adopts a socio-ecological approach and integrates the various multidisciplinary aspects of the issue under several key headings, aiming to understand how personal, environmental, and social attributes, as well as their interactions, influence the usage and safety perception experiences of national forest parks in urban green spaces.
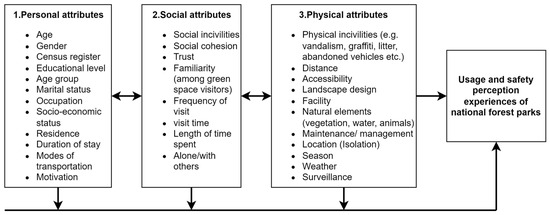
Figure 4.
A conceptual framework for analyzing the usage and safety perception experiences of national forest parks based on a socio-ecological approach.
2.3. Survey Instruments and Procedure
The survey employed a semi-structured questionnaire to collect data, including predefined standard answers and open-ended questions. The participants were residents and visitors who voluntarily took part in the overall utilization and safety assessment of Jiangsu Santai Mountain NFP. Since the study site and survey participants are in China, the questionnaire was administered in Chinese. This study confirms that all subjects provided informed consent. According to the methods outlined by Scheaffer et al. (2011) [27], convenience sampling was used to distribute the questionnaires throughout the park. To ensure effective data collection, surveyors first observed visitor flow in different areas of the forest park before starting the survey. Based on these observations, specific locations and time periods for on-site surveys were determined.
The on-site surveys focused on ten areas of the Santai Mountain NFP with high user activity and rest. Six surveyors assisted in conducting the surveys. Random sampling was employed to obtain a representative sample of NFP users, including adult users aged 18 and above. We conducted a pilot test with 30 visitors to eliminate any inappropriate wording. The survey was conducted from 28 March 2023 to 6 June 2024. The questionnaire combined on-site and online surveys. The survey was conducted through the “Wenjuanxing” online platform, which can generate QR codes and web links. Respondents could complete the on-site survey by scanning the QR code or filling out paper questionnaires, and they could also fill out the questionnaire online. This platform has a large population database and functions similarly to Amazon’s Mechanical Turk. Since our respondents were Chinese residents, the questionnaire was presented in Mandarin. Respondents answered by scanning the QR code on the surveyor’s iPad or mobile phone.
The on-site survey was conducted during residents’ leisure times: weekdays in the mornings (7:00–10:00), afternoons (12:00–15:00), and evenings (16:00–18:00), as well as all day on weekends (7:00–18:00). Based on the ecological psychology conceptual model [28], the questionnaire was divided into three parts: the first part involved demographic information of the respondents (including gender, household registration, education level, age, income, occupation, and marital status). In quantitative analysis, demographic questions help understand the personal attributes of respondents and their impact on visitor usability and safety. The second part focused on visitors’ usage patterns of the NFP (including visit frequency, time, distance, reasons for visiting, time spent, and companions). In the third part, a 4-point Likert scale was used to assess visitors’ perceptions of safety for data analysis purposes. As a token of appreciation, respondents who completed the questionnaire received a souvenir worth 2 yuan.
2.4. Data Analysis
The statistical software SPSS, version 26.0, was used for data analysis, with the confidence level set at 95%. The survey was conducted in three phases. The first phase involved a descriptive quantitative analysis of the respondents’ demographic information. In the second phase, descriptive statistics and chi-square tests were used to explore potential relationships between NFP usage patterns and sociodemographic variables. The chi-square test is a non-parametric test that primarily compares the association between two or more categorical variables [29]. In this study, the chi-square test was used to calculate the chi-square value (x2) and the corresponding p-value. The p-value indicates the probability that the observed differences between samples are due to sampling error. A larger chi-square value corresponds to a smaller p-value, indicating a significant difference between the samples [30]. Conversely, a smaller chi-square value corresponds to a larger p-value, indicating no significant difference between the samples.
In the third phase, an ordinal logistic regression model was used to examine the safety of NFP usage. Safety levels were measured using a 4-point Likert scale (1—very safe, 2—safe, 3—not very safe, 4—very unsafe). Since the responses are discrete and ordered variables, they do not meet the assumptions of general linear regression. Ordinal regression is suitable for analyzing dependent variables with ordinal responses [29]. Therefore, we employed an ordinal logistic regression model.
3. Results
3.1. Visitor Usage Patterns
3.1.1. Demographic Features
Social factors play a pivotal role in shaping visitors’ perceptions and experiences in national forest parks. These factors encompass a range of elements, including demographic characteristics, cultural background, social interactions, and previous experiences.
A total of 850 questionnaires were distributed, with 729 completed, resulting in an effective return rate of 85.76%. After excluding 41 invalid questionnaires, the final count of valid questionnaires was 688 (refer to Table 1). The statistical results indicate that males constitute 46.80% of the sample, while females make up 53.20%, showing a relatively even gender distribution. In terms of age, individuals aged 18–30 represent 35.47%, those aged 31–45 account for 54.80%, individuals aged 46–55 comprise 6.40%, those aged 56–65 constitute 2.33%, and individuals over 65 years old make up 1.02%. Regarding residency status, 78.20% have local household registration, while 21.80% are registered in other provinces and cities. Educational attainment reveals that 0.44% have an elementary education or below, 2.91% have a middle school education, 8.72% have a high school education, 73.11% have a college education, and 14.83% have a graduate education. This distribution is related to the improvement in the educational level in recent years in China. From the perspective of population structure, the respondents are predominantly young and middle-aged, a result of the continually improving education system in the country, leading to a high proportion of respondents with higher education levels. Regarding marital status, married individuals (64.68%) are approximately twice the number of unmarried individuals (33.72%). The occupations of residents are diverse, including employees of private enterprises (28.40%), government employees (36.09%), self-employed individuals (19.23%), unemployed individuals (7.10%), and students (7.69%). Monthly income distribution shows that 17.16% earn less than 3000 Yuan, 32.25% earn between 3001 and 6000 Yuan, 30.47% earn between 6001 and 10,000 Yuan, and 20.12% earn more than 10,000 Yuan.

Table 1.
Sociodemographic characteristics of respondents (descriptive analysis).
3.1.2. Visitor Patterns and Preferences in National Forest Parks
The analysis of visitor usage patterns in the National Forest Parks reveals a variety of behaviors and preferences that provide insights into how these natural spaces are utilized by the public. The data, summarized in Table 2, offers a detailed overview of the frequency of visits, preferred visiting times, and other relevant patterns.
Table 2.
Analysis of forest park usage patterns (descriptive analysis).
The analysis of visitor usage patterns in National Forest Parks reveals diverse behaviors and preferences. Most visitors (63.81%) frequent the parks only 1–2 times per year, with fewer visiting monthly (20.64%) or weekly (10.32%). Holidays are the most popular visiting days (35.32%), followed by spare time (26.45%) and weekends (24.85%), while mornings are preferred by 44.04% of visitors, and afternoons by 38.37%. Visitors typically stay for 1–2 h (38.52%) or 2–3 h (35.03%), with shorter and longer visits being less common. The majority drive to the park (65.84%), with fewer arriving on foot (11.77%) or by bicycle (5.52%). Travel time varies, with 51.74% taking 10–30 min and 31.25% taking 30–60 min to reach the park. Distances traveled also differ, with 44.33% traveling 5–10 km and 29.80% more than 10 km. Most visitors come with family (64.68%), while others visit with friends (26.31%) or alone (6.69%). These findings highlight the need to accommodate diverse visitor needs to enhance overall park experiences. The results of the data analysis, as summarized in Table 3, primarily examine the user behavior patterns of respondents at NFP.
Table 3.
User pattern by respondents at NFP (chi-square and Fisher’s exact test measure x2 and p-value).
3.2. Perception of Forest Park Safety
The perception of safety within National Forest Parks reflects a generally positive outlook among visitors, as indicated by the data presented in Table 4. A majority of respondents, 52.76%, perceive the parks as “safe,” while 36.92% consider them to be “very safe.” Only a small minority of visitors express concerns about safety, with 6.10% indicating that they feel “not very safe,” and an even smaller group, 0.87%, describing the parks as “very unsafe.” These findings suggest that the vast majority of visitors feel secure when visiting these parks, which is crucial for encouraging continued public use and enjoyment of these natural spaces. The respondents’ perception of safety when using the NFP was analyzed using an ordered logistic regression model to measure the odds ratio (OR) and p-value (refer to Table 5).
Table 4.
Perception of safety in urban forest parks of Suqian (descriptive analysis).
Table 5.
The respondents’ Perception of safety in using the NFP (ordered logistic regression model measure the odd ratio (OR) and p-value).
4. Discussion
4.1. Preferences for Usage Patterns of Forest Parks
Environmental factors are equally critical in determining the quality of visitor experiences and safety perceptions in national forest parks. These factors include the physical attributes of the park, maintenance, and the presence of facilities and amenities.
The usage patterns of NFPs are presented in Table 2. This study employs chi-square tests to compare the influence of demographic variables on preferences for usage patterns of forest parks (refer to Table 3). The majority of respondents in the study, comprising 63.81%, reported visiting the forest park only 1–2 times per year. This is hardly surprising given that 42.3% require driving more than 30 min to access the urban forest park. In China, many forest parks are far away from the city center. A study conducted in the United States found that when the distance between green spaces and residential areas is shortened by 100 m, the utilization rate of green spaces increases fourfold [31]; conversely, the utilization rate decreases as the distance increases. Therefore, we can hypothesize that the distance to NFPs plays a significant role in determining the frequency of their use. There are also statistically significant differences in terms of gender (p < 0.01), census register (p < 0.01), educational level (p < 0.01), age (p < 0.01), marital status (p < 0.01), occupation (p < 0.01), and monthly income (p < 0.01) (refer to Table 3).
The number of women visiting forest parks 1–2 times per month exceeds that of men, which contrasts with the research of Dai et al. [32]. Studies and surveys indicate that women need more time to care for and accompany their children, providing them with more opportunities to go out and enjoy nature. Simultaneously, we observe that residents with a college education visit forest parks much more frequently than those without a college education. This suggests that residents with higher educational levels frequent forest parks more often than those with lower educational levels, likely because higher education provides greater opportunities for stable employment and income. In terms of marital status, married residents visit forest parks significantly more frequently than single residents. Notably, the number of married residents who visit 3–4 times per week is seven times higher than that of unmarried residents. This finding indicates that companionship may positively influence the frequency of outdoor activities [18,33,34]. Previous studies have confirmed that companionship positively impacts mental health and actively promotes outdoor activities [35,36,37,38]. There are also significant differences among various occupations: employees of private enterprises and public sector workers visit forest parks more frequently. This may be because employees in the private sector have more opportunities for outdoor activities and team-building events organized by their companies.
Surveys indicate that most tourists prefer to visit NFPs on weekends (24.85%), holidays (35.32%), and during their spare time (26.45%). Clearly, visitors enjoy spending their leisure time in nature [34,39,40,41]. This preference is consistent with the findings of most studies on NFPs [3,5,21,42,43]. At the same time, it is worth noting that Wendel et al. [44] found similar results, explaining that people tend to visit urban parks or go on outings during weekends and holidays. Regarding demographic variables, education level (p < 0.001), age (p < 0.001), marital status (p < 0.05), occupation (p < 0.001), and income (p < 0.001) have significant impacts on visits to NFPs (Table 3). The results show that as age decreases, the proportion of respondents choosing to visit NFPs on weekdays significantly decreases, likely due to the busy schedules of younger residents [32]. This phenomenon is not limited to young adults; many children face similar issues. In China, children under the age of 12 account for 14.28% of the total population. Different educational policies and competitive mechanisms place greater pressure on these children, and the burden of homework and extra tutoring reduces their opportunities to visit urban green spaces on weekdays [45]. However, residents with university education tend to prefer visiting green spaces on weekends, holidays, and during their free time [46,47]. Additionally, there are differences among occupations; self-employed individuals are more likely to visit green spaces on weekdays compared to those in other professions because they have more control over their time.
Most residents prefer visiting NFPs in the morning (n = 303) and afternoon (n = 264) (Table 2), which also indicates a greater sense of safety during daylight hours [48,49,50]. According to data from the renowned American polling organization Gallup, China’s safety index ranks third globally [51]. The survey includes aspects such as residents’ trust in local police, perceptions of personal safety, and the incidence of theft, assault, or robbery in the past year [52]. The study found significant differences in preferences based on education level (p < 0.001), age (p < 0.001), marital status (p < 0.001), occupation (p < 0.01), and income (p < 0.001) (Table 3). Education level influences the preferred time of visit; residents with a university education tend to visit in the afternoon, while those with other education levels prefer evening visits. Younger respondents, having limited free time in the morning, prefer visiting NFPs in the afternoon. A survey revealed that this younger demographic is often in the prime of their careers, finding it challenging to maintain a healthy work-life balance [32]. Their fast-paced work schedule leads to insufficient sleep, and only after catching up on sleep during the weekends do they have the energy to engage with nature. In contrast, older visitors prefer morning visits. Single individuals tend to visit in the afternoon, while married individuals prefer morning visits to NFPs. Additionally, different occupations show varying time preferences; students and unemployed individuals prefer afternoon visits, while those in other professions prefer morning visits, aligning with their age-related preferences. Finally, higher-income visitors are more likely to choose morning visits, whereas lower-income visitors prefer afternoon visits.
A separate study reveals that the majority of Danes prefer to be in parks during the afternoon [53]. This tendency is consistent with cultural norms in Western nations, where it is typical to sunbathe or spend time in the sun, especially in the summertime. This insight also applies to Nordic nations like Finland, where temperatures are often cool and sunshine is greatly valued [54]. In contrast, urbanites in Singapore and Malaysia, both tropical countries, prefer to visit urban parks on vacations and weekdays, particularly in the morning and evening. This preference is influenced by the tropical climate of Malaysia, which is characterized by high humidity and temperature year-round. Spending time in parks, especially during the afternoon, can be uncomfortable due to these weather conditions. A similar observation was reported in a different investigation on urban greenery usage in Kuala Lumpur [55,56].
Visitors typically spend 1 to 2 h (n = 265) and 2 to 3 h (n = 241) in NFPs, with few staying over 4 h or less than 1 h (Table 2). This moderate duration allows for relaxation and reflects the vastness of NFPs, which are difficult to explore fully in a short time. This study found that only education level (p < 0.001), age (p < 0.001), marital status (p < 0.001), occupation (p < 0.001), and income (p < 0.001) significantly affect the duration of stay (Table 3). Visitors with high school and university education prefer to stay for 1–2 h, while those with postgraduate education are more inclined to stay for 2–3 h. Younger visitors aged 18–30 usually stay for 1–2 h, whereas middle-aged and older visitors prefer to spend more time. This might be because younger individuals have more energy to complete their visit quickly, while older visitors move at a slower pace and seek more time to connect with nature due to their busy work and life schedules [57,58]. Married individuals tend to stay longer in the parks, possibly because they accompany elderly family members and children who need fresh air [59,60]. Similarly, self-employed individuals and high-income groups, with their flexible schedules and financial independence, are able to extend their visits to the forest parks.
The primary mode of transportation for visitors to NFPs is cars (n = 453). Research indicates that gender (p < 0.05), household registration (p < 0.001), education level (p < 0.001), age (p < 0.001), marital status (p < 0.001), occupation (p < 0.001), and income (p < 0.001) significantly influence transportation choices. Women are more likely than men to use public transportation, possibly because men tend to have better directional skills and, therefore, prefer driving. Non-local visitors are more inclined to use public transportation compared to locals, who are more familiar with local routes. Very few visitors choose to travel by motorcycle, which contrasts sharply with the situation in Malaysia, possibly due to the unique traffic regulations in China [55,56]. Visitors with postgraduate education are more likely to ride electric bikes to NFPs than those with lower education levels, possibly due to greater environmental awareness. Younger visitors prefer to ride bicycles, which aligns with their youthfulness, energy, and enthusiasm for exercise. Married individuals are more likely to drive to the parks, as they often spend more time traveling with their families [55,56]. Unemployed individuals prefer public transportation to save on expenses, whereas higher-income visitors prefer driving and seldom choose public transportation. The reason for this is that NFP is on the outskirts, far from residential areas. This outcome was comparable to that of a study on the use of urban parks in Kuala Lumpur [61]. The primary explanations for why Malaysians drive to parks are shorter commute times, lower costs, and affordable gasoline [62]. Inadequate accessibility to public transportation and a lack of acceptable routes were two more concerns that discouraged Malaysians from using public transportation as their primary means of mobility [62]. Similar difficulties confront Italians in Bari, where insufficient transport options have forced residents to rely on vehicles or walk to reach greenery [63].
Overall, most visitors take between 10 min and 1 h to reach NFPs, with few arriving within 10 min (Table 2). This means visitors need more time to get to the NFPs. Research shows that household registration (p < 0.001), education level (p < 0.001), age (p < 0.001), marital status (p < 0.001), occupation (p < 0.001), and income (p < 0.001) significantly affect travel time (Table 3). Visitors without local household registration need more time to reach the parks, likely due to the greater distances they must travel. Those with junior high school education or lower also tend to take longer to arrive at NFPs. In terms of occupation, students, unemployed individuals, and pensioners spend more time traveling to the parks. Previous studies have extensively examined the relationship between park proximity and park use, with a predominant focus on research conducted in the Global North. However, there has been a relative lack of attention given to exploring the potential interactions between park proximity and park use, despite their significance within the socio-ecological frameworks that guide many studies [1]. A recent study involving nearly 8000 residents from eleven cities in 10 countries across Central and South America aimed to investigate the associations between perceived park proximity and park use. The findings of this study confirm positive correlations between perceived park proximity and park use [1,64,65]. Furthermore, additional studies have also offered supporting evidence in this regard. For example, a Canadian study revealed that park use was more closely related to the amenities and facilities available in the parks than their proximity [66]. Another study conducted in Canada by Lackey and Kaczynski (2009) [67] found no significant association between park-based physical activity and objective or perceived park proximity. However, it did indicate that such physical activity was more likely to occur when objective and perceived proximity were aligned. To gain a better understanding of these associations, further research in this region is warranted. Future studies should employ more sophisticated objective and perceived park measures that effectively capture the diverse features and attributes of parks.
The vast majority of visitors live far from the NFP, with distances of 5–10 km (n = 305) and over 10 km (n = 205) being the most common (Table 2). This is because NFPs are typically located in suburban or rural areas, far from residential zones. Research indicates that household registration (p < 0.001), education level (p < 0.001), age (p < 0.001), marital status (p < 0.001), occupation (p < 0.001), and monthly income (p < 0.001) significantly affect the distance from the NFP (Table 3). Visitors without local household registration live farther from NFPs, which corresponds with their longer travel times. Visitors with a bachelor’s degree or higher also tend to live farther from the parks, likely because they usually work in urban areas. Married individuals live farther from the parks, possibly due to their preference for settling in urban areas. Additionally, those with a monthly income exceeding 6000 yuan tend to live farther from NFPs.
As shown in Table 2, there is a significant difference between visitors who go to NFPs alone (6.69%) and those who go with companions (92.01%). Research indicates that gender (p < 0.001), household registration (p < 0.001), education level (p < 0.001), age (p < 0.001), marital status (p < 0.001), occupation (p < 0.001), and income (p < 0.001) significantly influence these preferences (Table 3). Compared to women, men are more likely to visit NFPs alone, possibly because women are more concerned about safety when traveling alone. Locals are more inclined to visit alone than non-locals due to their familiarity with the environment and a greater sense of security. Those with university degrees or higher prefer to visit the parks with their families. Young people aged 18–30 are more likely to visit with friends, while middle-aged and older visitors prefer to visit with family members. Single individuals are more likely to go with friends, whereas married individuals tend to visit with their families. Students prefer to go alone or with friends, whereas working individuals are more likely to visit with their families. Higher-income individuals tend to visit the parks with their families, while lower-income individuals are more likely to go alone or with friends.
The preference for visiting parks with family and friends rather than alone or with pets significantly influences visitor satisfaction and park usage patterns by fostering social engagement, which is often linked to higher levels of enjoyment and fulfillment [67,68,69]. Group interactions enhance the park experience through shared activities and emotional connections, potentially leading to increased satisfaction and higher rates of return visits [11,59]. Additionally, groups can support each other during difficulties or emergencies, further enhancing their experience. This trend may result in higher occupancy during weekends and holidays, potentially causing congestion in popular areas. Increased demand for group-friendly amenities, such as picnic areas, children’s playgrounds, multi-functional rest areas, and sports facilities, may guide the allocation of park resources and infrastructure development [11,59,67]. However, group activities also require more resources for management, maintenance, and safety measures, such as increased patrols and emergency services [11,55]. On the other hand, this preference could marginalize solitary visitors or those with pets, who might seek quieter spaces but find fewer areas suited to their needs, leading to varying satisfaction levels across visitor demographics [11,55,59]. To address this, parks may need to provide designated quiet zones or pet-friendly areas to ensure a fulfilling experience for all. Ultimately, these preferences can foster a sense of community, encourage repeat visits, and shape park design and management to optimize space utilization, enhance the visitor experience across different groups, and ensure equitable access to facilities, contributing to the park’s long-term sustainability and appeal.
The lower percentages for traveling alone or with pets may suggest that people prefer to have companionship or assistance during their travels, as they might require support or care along the way. This is comparable to previous research on the cultures of other nations and regions, especially the Italians [13], Malaysians [11], Rotterdam [70], Turks [71], Hispanics [72], and Latinos [12,44], where the majority of these residents like to attend urban parks in large groups with family, friends, or dogs. However, white Americans who use parks are different since 88% of them go alone or with only one other individual [73]. A similar pattern was observed among white park users in a Los Angeles survey, when more than half of them frequented parks individually [72]. This trend was also observed among Dutch park visitors, who preferred to go alone, in pairs, or in small groups [74]. Several studies have found that either the presence or lack of an accompanying person influences the enjoyment of various surroundings for psychological healing. People in urban areas often prefer the company of a friend for a variety of reasons, including safety [75]. However, when safety is not an issue, the lack of a companion also improves rehabilitation. This conclusion is reinforced by other studies, which also show that women, who often experience more fear than men, prefer to visit NFPs with family members or other people compared to going alone [55].
The interplay between social and environmental factors is fundamental to shaping visitor usage and safety perceptions in national forest parks. By comprehensively understanding these factors, park management can implement targeted strategies to improve visitor satisfaction, safety, and overall park utilization. This holistic approach ensures that national forest parks continue to serve as safe, enjoyable, and accessible spaces for all visitors.
4.2. Factors Influencing Safety Perceptions in NFPs
One of the elements impacting the use of urban green spaces is safety, notably the fear of crime [11,61]. The park safety components likely encompass several critical aspects, including the assessment of physical infrastructure such as trails, signage, and facilities, all of which contribute to visitor safety [59,76,77]. Additionally, the study may examine the effectiveness of safety communication strategies, such as the dissemination of information about park rules, wildlife, and potential hazards [59,78]. Visitor behavior, preparedness, and adherence to safety guidelines are also crucial components, alongside the evaluation of emergency response mechanisms and visitors’ perceptions of safety, all of which can significantly influence their overall experience and willingness to return [55]. Previous research has also indicated that women are less likely to attend urban parks than men due to concerns about safety [78]. According to a study conducted by Sanesi and Chiarello in 2006 [63], nearly 50% of the citizens of Bari, Italy, expressed a sense of insecurity while visiting their local urban parks. A further survey conducted in Atlanta and Philadelphia in the United States likewise revealed significant apprehension among locals over the safety of parks [63].
Respondents were questioned regarding their feelings of safety while using the NFP (refer to Table 4). It is noteworthy that approximately 90% of the respondents in this study expressed feeling safe in the NFP. This is due to the fact that a majority of the respondents frequent the parks in groups, either accompanied by their relatives or friends. This is in stark contrast to the findings of the forest park study in Malaysia. In Malaysia, park users at forest park had previously experienced or heard of unwanted incidents such as theft, vandalism, and abduction [11,59,79]. This makes the visitors feel unsafe. In addition, the condensed structure of cities and the high concentration of people have led to the extensive utilization of urban green areas as a response to safety concerns [13]. This study was conducted during the day, not at night, and different results might be obtained if conducted at night. Table 5 illustrates the differences in safety perceptions of visitors to NFPs among various demographic groups. The impact of gender and household registration on the perception of safety in NFPs is minimal (p > 0.05). Regarding educational attainment, visitors with primary education or below (B = −2.407, OR = 0.090, p < 0.05) and university students (B = −0.434, OR = 0.090, p < 0.01) exhibit greater concern for safety in NFPs and feel safer compared to those with postgraduate education. In terms of age group, visitors aged 18–30, 31–45, 46–55, and 56–65 years (OR = 27.201, p < 0.001; OR = 37.175, p < 0.001; OR = 55.472, p < 0.001; OR = 188.270, p < 0.001, respectively) report feeling safer than older visitors. This indicates that safety concerns increase with age when visiting forest parks. Younger to middle-aged visitors feel safer because they are generally healthier, more physically capable, and possibly more confident in dealing with any potential risks in forest parks, while older visitors feel less safe due to concerns about physical limitations and higher perceived vulnerability. At the same time, this is due to the wisdom and knowledge acquired over the passage of time. Several park visitors at that particular park have previously encountered or witnessed acts of theft, vandalism, and abduction. Individuals might undergo vicarious victimization, wherein they may feel the same emotions as if they were directly victimized when they learn about the criminal experiences of others [13,59].
Regarding occupations, those employed in occupations other than private sector positions (B = −0.831, OR = 0.435, p < 0.05) feel safer, whereas private sector employees might experience more stress and insecurity, affecting their overall sense of safety. In terms of occupation, unemployed individuals (B = 1.725, OR = 5.615, p < 0.05) are more concerned about safety and find it more difficult to feel secure in forest parks compared to those in other professions. Unemployed individuals might have heightened anxiety and stress due to financial instability, making them more sensitive to safety concerns. Finally, with respect to monthly income, visitors earning less than 3000 yuan (B = −0.620, OR = 0.538, p < 0.1) and those earning between 6001 and 10,000 yuan (B = −0.579, OR = 0.560, p < 0.05) are more concerned about safety and feel safer compared to visitors with an income exceeding 10,000 yuan. Lower-income visitors might be more cautious due to their daily challenges, leading to heightened awareness. In contrast, higher-income individuals might have higher expectations and feel more entitled to better safety standards. These explanations suggest that perceptions of safety in NFPs are influenced by a complex interplay of physical capabilities, life experiences, and socioeconomic factors.
In conclusion, the observed differences in safety perceptions among various demographic groups visiting NFPs can be attributed to several factors. The minimal impact of gender and household registration suggests universal safety concerns. Individuals with primary education or below, as well as university students, might feel safer due to lower expectations or better awareness of safety guidelines. Younger to middle-aged visitors generally feel safer due to better physical health and confidence, while older individuals may feel more vulnerable. Single visitors might experience heightened vulnerability compared to divorced individuals, who feel more resilient. Employment status influences perceptions, with those in stable occupations feeling safer than private sector employees. Unemployed individuals tend to be more anxious about safety due to financial instability. Lastly, lower-income visitors might be more vigilant and cautious, contributing to a heightened sense of safety, whereas higher-income visitors might have higher safety expectations and feel less secure when these are not met. These findings highlight the complex interplay of physical capabilities, life experiences, and socioeconomic factors in shaping safety perceptions.
5. Conclusions
NFPs play a crucial role in the construction of urban ecological environments, directly impacting residents’ quality of life by providing opportunities for leisure, recreation, and connection with nature. However, with societal progress, issues such as severe urbanization and the diminishing availability of urban green spaces are becoming increasingly prominent. This research uses a conceptual framework based on a socio-ecological approach to analyze the usage and safety perception experiences of national forest parks, comparing them with forest parks in other countries. The findings reveal significant differences between NFPs in different cultural contexts. Urban residents are the primary users of NFP green spaces. Residents tend to visit NFPs in the morning and midday, which differs from the usage patterns of forest parks in other regions. This behavior is mainly related to residents’ sense of security and climate conditions. Most visitors prefer nature, relaxation, and spending time with family, often traveling to NFPs by car. However, there is also a segment of young visitors who prefer to visit NFPs alone or with friends.
This survey suggests that park facilities should be diversified to meet varied visitor needs. Areas with high demand for family and group activities should include additional spaces like picnic areas, barbecue spots, and children’s playgrounds. Recreational facilities such as viewing platforms, trails, and sports venues should be added to cater to all age groups. For safety, the installation of emergency rescue facilities, including first aid stations, emergency telephones, and AEDs, along with clear signage, maps, and safety reminders, is recommended. Visitor service centers would further enhance safety and convenience. To manage visitor flow, a reservation system or timed entry could prevent overcrowding. Expanding natural education programs, such as guided tours, nature classes, and ecological lectures, would promote environmental awareness, while interactive experiences like ecological zones, animal and plant viewing areas, and outdoor adventures can boost engagement.
To minimize environmental impact, the park should include protected and ecological restoration areas, increase recycling facilities and eco-friendly restrooms, and promote sustainable behaviors. Efficient resource management, green energy promotion, and sustainable material use should be prioritized to reduce the park’s ecological footprint. Exploring the utilization of NFPs and improving park systems are essential for promoting urban development, enhancing the urban landscape, and preserving cultural heritage. Government departments should focus on the real needs of local residents and prioritize the creation of a forest park environment that fosters harmonious coexistence between humans and nature.
Author Contributions
Conceptualization, J.Z. and F.A.A.; methodology, J.Z. and Z.C.; software, Y.X., H.Z., Z.C. and M.S.; validation, M.S., N.U. and J.Z.; formal analysis, Z.C.; investigation, Y.X. and H.Z.; resources, J.Z.; data curation, Y.X.; writing—original draft preparation, J.Z.; writing—review and editing, J.Z., M.S. and F.A.A.; visualization, F.A.A., M.S. and H.Z.; supervision, N.U. and Z.C.; project administration, F.A.A. and J.Z.; funding acquisition, F.A.A. and Z.C. All authors have read and agreed to the published version of the manuscript.
Funding
The University of Manchester Open Access Fund.
Institutional Review Board Statement
All experimental protocols were approved by Universiti Putra Malaysia. A statement of informed consent was obtained from all subjects and/or their legal guardian(s). All methods were performed in accordance with the relevant guidelines and regulations.
Informed Consent Statement
Not Applicable.
Data Availability Statement
In this study, the data used were freely downloaded from Visit (http://www.bigemap.com, accessed on 6 March 2023) for more information based on the open-source data provided by BIGEMAP. The datasets used and/or analyzed during the current study are available from the corresponding author upon reasonable request.
Conflicts of Interest
The authors declare no conflicts of interest. The funders had no role in the design of the study, in the collection, analysis, or interpretation of data, in the writing of the manuscript, or in the decision to publish the results. This article was contributed by Universiti Putra Malaysia and the University of Manchester.
References
- Moran, M.R.; Rodríguez, D.A.; Cotinez-O’Ryan, A.; Miranda, J.J. Park Use, Perceived Park Proximity, and Neighborhood Characteristics: Evidence from 11 Cities in Latin America. Cities 2020, 105, 102817. [Google Scholar] [CrossRef] [PubMed]
- Veitch, J.; Ball, K.; Rivera, E.; Loh, V.; Deforche, B.; Best, K.; Timperio, A. What Entices Older Adults to Parks? Identification of Park Features That Encourage Park Visitation, Physical Activity, and Social Interaction. Landsc. Urban Plan. 2022, 217, 104254. [Google Scholar] [CrossRef]
- Zhang, J.; Cheng, Y.; Mao, Y.; Cai, W.; Zhao, B. What Are the Factors Influencing Recreational Visits to National Forest Parks in China? Experiments Using Crowdsourced Geospatial Data. Urban For. Urban Green. 2022, 72, 127570. [Google Scholar] [CrossRef]
- Calleja, A.; Díaz-Balteiro, L.; Iglesias-Merchan, C.; Soliño, M. Acoustic and Economic Valuation of Soundscape: An Application to the ‘Retiro’ Urban Forest Park. Urban For. Urban Green. 2017, 27, 272–278. [Google Scholar] [CrossRef]
- Lin, Y.-C.; Liu, W.-Y. Assessment of the Management Performance of a National Urban Forest Park in Taiwan. Urban For. Urban Green. 2021, 60, 127056. [Google Scholar] [CrossRef]
- Xing, Y.; Brimblecombe, P. Trees and Parks as “the Lungs of Cities”. Urban For. Urban Green. 2020, 48, 126552. [Google Scholar] [CrossRef]
- Xiao, Y.; Piao, Y.; Pan, C.; Lee, D.; Zhao, B. Using Buffer Analysis to Determine Urban Park Cooling Intensity: Five Estimation Methods for Nanjing, China. Sci. Total Environ. 2023, 868, 161463. [Google Scholar] [CrossRef]
- Tan, P.Y.; Samsudin, R. Effects of Spatial Scale on Assessment of Spatial Equity of Urban Park Provision. Landsc. Urban Plan. 2017, 158, 139–154. [Google Scholar] [CrossRef]
- Safaie Ghamsary, E.; Karimimoshaver, M.; Akhavan, A.; Afzali Goruh, Z.; Aram, F.; Mosavi, A. Locating Pocket Parks: Assessing the Effects of Land Use and Accessibility on the Public Presence. Environ. Sustain. Indic. 2023, 18, 100253. [Google Scholar] [CrossRef]
- Chuang, I.-T.; Benita, F.; Tunçer, B. Effects of Urban Park Spatial Characteristics on Visitor Density and Diversity: A Geolocated Social Media Approach. Landsc. Urban Plan. 2022, 226, 104514. [Google Scholar] [CrossRef]
- Balai Kerishnan, P.; Maruthaveeran, S.; Maulan, S. Investigating the Usability Pattern and Constraints of Pocket Parks in Kuala Lumpur, Malaysia. Urban For. Urban Green. 2020, 50, 126647. [Google Scholar] [CrossRef]
- Byrne, J.; Wolch, J. Nature, Race, and Parks: Past Research and Future Directions for Geographic Research. Prog. Hum. Geogr. 2009, 33, 743–765. [Google Scholar] [CrossRef]
- Jim, C.Y.; Chen, W.Y. Recreation–Amenity Use and Contingent Valuation of Urban Greenspaces in Guangzhou, China. Landsc. Urban Plan. 2006, 75, 81–96. [Google Scholar] [CrossRef]
- Huai, S.; Van de Voorde, T. Which Environmental Features Contribute to Positive and Negative Perceptions of Urban Parks? A Cross-Cultural Comparison Using Online Reviews and Natural Language Processing Methods. Landsc. Urban Plan. 2022, 218, 104307. [Google Scholar] [CrossRef]
- Xu, J.; Li, M.; Gu, Z. Audio-Visual Preferences for the Exercise-Oriented Population in Urban Forest Parks in China. Forests 2022, 13, 948. [Google Scholar] [CrossRef]
- Giles-Corti, B.; Broomhall, M.H.; Knuiman, M.; Collins, C.; Douglas, K.; Ng, K.; Lange, A.; Donovan, R.J. Increasing Walking. Am. J. Prev. Med. 2005, 28, 169–176. [Google Scholar] [CrossRef]
- Jay, J.; Heykoop, F.; Hwang, L.; Courtepatte, A.; de Jong, J.; Kondo, M. Use of Smartphone Mobility Data to Analyze City Park Visits during the COVID-19 Pandemic. Landsc. Urban Plan. 2022, 228, 104554. [Google Scholar] [CrossRef]
- Hui, L.-C.; Jim, C.-Y. Unraveling Visiting-Activity Patterns of Heterogeneous Communities for Urban-Park Planning and Design. Forests 2022, 13, 841. [Google Scholar] [CrossRef]
- Xu, J.; Chen, L.; Liu, T.; Wang, T.; Li, M.; Wu, Z. Multi-Sensory Experience and Preferences for Children in an Urban Forest Park: A Case Study of Maofeng Mountain Forest Park in Guangzhou, China. Forests 2022, 13, 1435. [Google Scholar] [CrossRef]
- Geng, D. (Christina); Innes, J.; Wu, W.; Wang, G. Impacts of COVID-19 Pandemic on Urban Park Visitation: A Global Analysis. J. For. Res. 2021, 32, 553–567. [Google Scholar] [CrossRef]
- Chen, B.; Qi, X. Protest Response and Contingent Valuation of an Urban Forest Park in Fuzhou City, China. Urban For. Urban Green. 2018, 29, 68–76. [Google Scholar] [CrossRef]
- Schröder, T.; Müller, V.; Preihs, M.; Borovička, J.; Gonzalez de Vega, R.; Kindness, A.; Feldmann, J. Fluorine Mass Balance Analysis in Wild Boar Organs from the Bohemian Forest National Park. Sci. Total Environ. 2024, 922, 171187. [Google Scholar] [CrossRef] [PubMed]
- Niziolek, D.; Harris, L.B.; Taylor, A.H. Forest Resilience and Post-Fire Conifer Regeneration in the Southern Cascades, Lassen Volcanic National Park California, USA. For. Ecol. Manag. 2024, 561, 121848. [Google Scholar] [CrossRef]
- Suqian Municipal People’s Government. Available online: https://www.suqian.gov.cn/ (accessed on 5 July 2024).
- Jiangsu Santai Mountain National Forest Park. Available online: http://jssantaishan.com/index1.aspx?lan=en (accessed on 5 July 2024).
- Forsyth, A.; Musacchio, L. Designing Small Parks: A Manual for Addressing Social and Ecological Concerns; John Wiley & Sons: Hoboken, NJ, USA, 2005; ISBN 978-0-471-73680-6. [Google Scholar]
- Scheaffer, R.L.; III, W.M.; Ott, R.L.; Gerow, K.G. Elementary Survey Sampling; Cengage Learning: Boston, MA, USA, 2011; ISBN 978-0-8400-5361-9. [Google Scholar]
- Gibson, J.J. The Ecological Approach to Visual Perception: Classic Edition; Psychology Press: Hove, UK, 2014; ISBN 978-1-317-57938-0. [Google Scholar]
- Creswell, J.W. Research Design: Qualitative & Quantitative Approaches; Sage Publications, Inc: Thousand Oaks, CA, USA, 1994; ISBN 978-0-8039-5254-6. [Google Scholar]
- Creswell, J.W. Research Design: Qualitative, Quantitative, and Mixed Methods Approaches; SAGE: Newcastle upon Tyne, UK, 2014; ISBN 978-1-4522-2610-1. [Google Scholar]
- Evenson, K.R.; Williamson, S.; Han, B.; McKenzie, T.L.; Cohen, D.A. United States’ Neighborhood Park Use and Physical Activity over Two Years: The National Study of Neighborhood Parks. Prev. Med. 2019, 123, 117–122. [Google Scholar] [CrossRef]
- Dai, C.; Maruthaveeran, S.; Shahidan, M.F.; Chu, Y. Usage of and Barriers to Green Spaces in Disadvantaged Neighborhoods: A Case Study in Shi Jiazhuang, Hebei Province, China. Forests 2023, 14, 435. [Google Scholar] [CrossRef]
- Iheanacho, O.N. Post-Occupancy Evaluation of Outdoor Spaces of Public Housing Eatates for Housing Satisfaction of Middle Income Residents in Enugu, Nigeria; University of Nigeria: Enugu, Nigeria, 2018. [Google Scholar]
- Ayodeji, A.; Amole, O. Open Spaces and Wellbeing: The Impact of Outdoor Environments in Promoting Health. Cities Health 2022, 6, 1–16. [Google Scholar] [CrossRef]
- Wang, S.; Yung, E.H.K.; Jayantha, W.M.; Chan, E.H.W. Elderly’s Intention and Use Behavior of Urban Parks: Planned Behavior Perspective. Habitat Int. 2023, 134, 102780. [Google Scholar] [CrossRef]
- Zhu, J.; Xu, C. Sina Microblog Sentiment in Beijing City Parks as Measure of Demand for Urban Green Space during the COVID-19. Urban For. Urban Green. 2021, 58, 126913. [Google Scholar] [CrossRef]
- Zhu, X.; Gao, M.; Zhang, R.; Zhang, B. Quantifying Emotional Differences in Urban Green Spaces Extracted from Photos on Social Networking Sites: A Study of 34 Parks in Three Cities in Northern China. Urban For. Urban Green. 2021, 62, 127133. [Google Scholar] [CrossRef]
- McIntire, R.K.; Halstead, T.; Dajee, D.; Buckley, M.; McGregor, K.; Larson, S. Disparities in Neighborhood Park Access among Adults in Philadelphia. Urban For. Urban Green. 2022, 78, 127790. [Google Scholar] [CrossRef]
- Cranz, G.; Young, C. The Role of Design in Inhibiting or Promoting Use of Common Open Space. J. Hous. Elder. 2006, 19, 71–93. [Google Scholar] [CrossRef]
- Göçer, Ö.; Göçer, K.; Başol, A.M.; Kıraç, M.F.; Özbil, A.; Bakovic, M.; Siddiqui, F.P.; Özcan, B. Introduction of a Spatio-Temporal Mapping Based POE Method for Outdoor Spaces: Suburban University Campus as a Case Study. Build. Environ. 2018, 145, 125–139. [Google Scholar] [CrossRef]
- Yung, E.H.K.; Wang, S.; Chau, C. Thermal Perceptions of the Elderly, Use Patterns and Satisfaction with Open Space. Landsc. Urban Plan. 2019, 185, 44–60. [Google Scholar] [CrossRef]
- Kang, N.; Wang, E.; Yu, Y.; Duan, Z. Valuing Recreational Services of the National Forest Parks Using a Tourist Satisfaction Method. Forests 2021, 12, 1688. [Google Scholar] [CrossRef]
- Cronan, M.K.; Shinew, K.J.; Schneider, I.; Wilhelm Stanis, S.A.; Chavez, D. Physical Activity Patterns and Preferences Among Latinos in Different Types of Public Parks. J. Phys. Act. Health 2008, 5, 894–908. [Google Scholar] [CrossRef]
- Wright Wendel, H.E.; Zarger, R.K.; Mihelcic, J.R. Accessibility and Usability: Green Space Preferences, Perceptions, and Barriers in a Rapidly Urbanizing City in Latin America. Landsc. Urban Plan. 2012, 107, 272–282. [Google Scholar] [CrossRef]
- Bai, J. Luodi·qibu: Shehuigongzuo Shijianyanjiu Anli [Down-to-Earth: Case Studies of Social Work Practice Research]. China J. Soc. Work. 2023. [Google Scholar]
- Ayala-Azcárraga, C.; Diaz, D.; Zambrano, L. Characteristics of Urban Parks and Their Relation to User Well-Being. Landsc. Urban Plan. 2019, 189, 27–35. [Google Scholar] [CrossRef]
- Cai, M.; Cui, C.; Lin, L.; Di, S.; Zhao, Z.; Wang, Y. Residents’ Spatial Preference for Urban Forest Park Route during Physical Activities. Int. J. Environ. Res. Public Health 2021, 18, 11756. [Google Scholar] [CrossRef]
- Bai, X.; Xie, Z.; Dewancker, B.J. Exploring the Factors Affecting User Satisfaction in Poverty Alleviation Relocation Housing for Minorities through Post-Occupancy Evaluation: A Case Study of Pu’er. Sustainability 2022, 14, 15167. [Google Scholar] [CrossRef]
- Lee, S. The Safety of Public Space: Urban Design Guidelines for Neighborhood Park Planning. J. Urban. Int. Res. Placemaking Urban Sustain. 2022, 15, 222–240. [Google Scholar] [CrossRef]
- Maniruzzaman, K.M.; Alqahtany, A.; Abou-Korin, A.; Al-Shihri, F.S. An Analysis of Residents’ Satisfaction with Attributes of Urban Parks in Dammam City, Saudi Arabia. Ain Shams Eng. J. 2021, 12, 3365–3374. [Google Scholar] [CrossRef]
- Global, T. China Ranks Third on Gallup’s Law & Order Index, Much Higher than US. Available online: https://www.globaltimes.cn/content/1204960.shtml (accessed on 12 July 2024).
- Inc, G. 2021 Global Law and Order Report. Available online: https://www.gallup.com/analytics/357173/2021-law-order-report.aspx (accessed on 4 July 2024).
- Peschardt, K.; Schipperijn, J.; Stigsdotter, U. Use of Small Public Urban Green Spaces (SPUGS). Urban For. Urban Green. 2012, 11, 235–244. [Google Scholar] [CrossRef]
- Tyrväinen, L.; Mäkinen, K.; Schipperijn, J. Tools for Mapping Social Values of Urban Woodlands and Other Green Areas. Landsc. Urban Plan. 2007, 79, 5–19. [Google Scholar] [CrossRef]
- Maruthaveeran, S. A Socio-Ecological Approach of Fear of Crime in Urban Green Spaces—A Case in Kuala Lumpur, Malaysia; Universiti Putra Malaysia: Selangor, Malaysia, 2015. [Google Scholar] [CrossRef]
- Sreetheran, M.; Van Den Bosch, C.C.K. A Socio-Ecological Exploration of Fear of Crime in Urban Green Spaces—A Systematic Review. Urban For. Urban Green. 2014, 13, 1–18. [Google Scholar] [CrossRef]
- van den Bogerd, N.; Elliott, L.R.; White, M.P.; Mishra, H.S.; Bell, S.; Porter, M.; Sydenham, Z.; Garrett, J.K.; Fleming, L.E. Urban Blue Space Renovation and Local Resident and Visitor Well-Being: A Case Study from Plymouth, UK. Landsc. Urban Plan. 2021, 215, 104232. [Google Scholar] [CrossRef]
- Yao, Y.; Xu, C.; Yin, H.; Shao, L.; Wang, R. More Visible Greenspace, Stronger Heart? Evidence from Ischaemic Heart Disease Emergency Department Visits by Middle-Aged and Older Adults in Hubei, China. Landsc. Urban Plan. 2022, 224, 104444. [Google Scholar] [CrossRef]
- Maruthaveeran Sreetheran Exploring the Urban Park Use, Preference and Behaviours among the Residents of Kuala Lumpur, Malaysia. Urban For. Urban Green. 2017, 25, 85–93. [CrossRef]
- Young, D.R.; Hong, B.D.; Lo, T.; Inzhakova, G.; Cohen, D.A.; Sidell, M.A. The Longitudinal Associations of Physical Activity, Time Spent Outdoors in Nature and Symptoms of Depression and Anxiety during COVID-19 Quarantine and Social Distancing in the United States. Prev. Med. 2022, 154, 106863. [Google Scholar] [CrossRef]
- Nath, T.K.; Zhe Han, S.S.; Lechner, A.M. Urban Green Space and Well-Being in Kuala Lumpur, Malaysia. Urban For. Urban Green. 2018, 36, 34–41. [Google Scholar] [CrossRef]
- Kamba, A.; Rahmat, R.; Ismail, A. Why Do People Use Their Cars: A Case Study In Malaysia. J. Soc. Sci. 2007, 3, 117–122. [Google Scholar] [CrossRef][Green Version]
- Sanesi, G.; Chiarello, F. Residents and Urban Green Spaces: The Case of Bari. Urban For. Urban Green. 2006, 4, 125–134. [Google Scholar] [CrossRef]
- Ma, Y.; Brindley, P.; Lange, E. The Influence of Socio-Demographic Factors on Preference and Park Usage in Guangzhou, China. Land 2022, 11, 1219. [Google Scholar] [CrossRef]
- Li, L.; Li, X.; Niu, N.; He, J. Uneven Impacts of COVID-19 on Residents’ Utilization of Urban Parks: A Case Study of Guangzhou, China. Appl. Geogr. 2023, 153, 102905. [Google Scholar] [CrossRef] [PubMed]
- Kaczynski, A.T.; Potwarka, L.R.; Smale, B.J.A.; Havitz, M.E. Association of Parkland Proximity with Neighborhood and Park-Based Physical Activity: Variations by Gender and Age. Leis. Sci. 2009, 31, 174–191. [Google Scholar] [CrossRef]
- Lackey, K.J.; Kaczynski, A.T. Correspondence of Perceived vs. Objective Proximity to Parks and Their Relationship to Park-Based Physical Activity. Int. J. Behav. Nutr. Phys. Act. 2009, 6. [Google Scholar] [CrossRef]
- Li, H.; Ta, N.; Yu, B.; Wu, J. Are the Accessibility and Facility Environment of Parks Associated with Mental Health? A Comparative Analysis Based on Residential Areas and Workplaces. Landsc. Urban Plan. 2023, 237, 104807. [Google Scholar] [CrossRef]
- Madge, C. Public Parks and the Geography of Fear. Tijdschr. Voor Econ. En Soc. Geogr. 1997, 88, 237–250. [Google Scholar] [CrossRef]
- Buchel, S.; Frantzeskaki, N. Citizens’ Voice: A Case Study about Perceived Ecosystem Services by Urban Park Users in Rotterdam, the Netherlands. Ecosyst. Serv. 2015, 12, 169–177. [Google Scholar] [CrossRef]
- Özgüner, H. Cultural Differences in Attitudes towards Urban Parks and Green Spaces. Landsc. Res. 2011, 36, 599–620. [Google Scholar] [CrossRef]
- Loukaitou-Sideris, A. Urban Form and Social Context: Cultural Differentiation in the Uses of Urban Parks. J. Plan. Educ. Res. 1995, 14, 89–102. [Google Scholar] [CrossRef]
- Rigolon, A.; Browning, M.H.E.M.; Lee, K.; Shin, S. Access to Urban Green Space in Cities of the Global South: A Systematic Literature Review. Urban Sci. 2018, 2, 67. [Google Scholar] [CrossRef]
- Peters, K.B.M.; Elands, B.H.M.; Buijs, A.E. Social Interactions in Urban Parks: Stimulating Social Cohesion? Urban For. Urban Green. 2010, 9, 93–100. [Google Scholar] [CrossRef]
- Staats, H.; Hartig, T. Alone or with a Friend: A Social Context for Psychological Restoration and Environmental Preferences. J. Environ. Psychol. 2004, 24, 199–211. [Google Scholar] [CrossRef]
- Zhang, R.; Zhang, C.-Q.; Lai, P.C.; Kwan, M.-P. Park and Neighbourhood Environmental Characteristics Associated with Park-Based Physical Activity among Children in a High-Density City. Urban For. Urban Green. 2022, 68, 127479. [Google Scholar] [CrossRef]
- Baran, P.K.; Tabrizian, P.; Zhai, Y.; Smith, J.W.; Floyd, M.F. An Exploratory Study of Perceived Safety in a Neighborhood Park Using Immersive Virtual Environments. Urban For. Urban Green. 2018, 35, 72–81. [Google Scholar] [CrossRef]
- Scott, D.; Jackson, E.L. Factors That Limit and Strategies That Might Encourage People’s Use of Public Parks. J. Park Recreat. Adm. 1996, 14. [Google Scholar]
- Balai Kerishnan, P.; Maruthaveeran, S. Factors Contributing to the Usage of Pocket parks―A Review of the Evidence. Urban For. Urban Green. 2021, 58, 126985. [Google Scholar] [CrossRef]


Disclaimer/Publisher’s Note: The statements, opinions and data contained in all publications are solely those of the individual author(s) and contributor(s) and not of MDPI and/or the editor(s). MDPI and/or the editor(s) disclaim responsibility for any injury to people or property resulting from any ideas, methods, instructions or products referred to in the content. |
© 2024 by the authors. Licensee MDPI, Basel, Switzerland. This article is an open access article distributed under the terms and conditions of the Creative Commons Attribution (CC BY) license (https://creativecommons.org/licenses/by/4.0/).