Article

Insights into Land-Use and Demographical Changes: Runoff and Erosion Modifications in the Highlands of Serbia

1
Geographical Institute “Jovan Cvijić” of the Serbian Academy of Sciences and Arts, Đure Jakšića 9, 11000 Belgrade, Serbia
2
Faculty of Geography, University of Belgrade, Studentski trg 3/3, 11000 Belgrade, Serbia
3
Faculty of Civil Engineering, University of Belgrade, Bulevar kralja Aleksandra 63, 11000 Belgrade, Serbia
*
Author to whom correspondence should be addressed.
Land 2024, 13(9), 1342; https://doi.org/10.3390/land13091342
Submission received: 19 July 2024 / Revised: 16 August 2024 / Accepted: 20 August 2024 / Published: 24 August 2024
(This article belongs to the Special Issue Land, Geosciences Research and Application)

Abstract

:
This research investigates the effects of land use/land cover (LULC) and demographical changes on runoff and erosion processes in the watersheds of border highlands in Serbia. It provides an interdisciplinary approach, linking demography (human geography) with physical geography (hydrology and geomorphology). (A) A predominant decrease in curve number (CN), a key hydrological indicator, is recorded in more than 20 watersheds in Eastern and Southeastern Serbia, largely due to continuous depopulation and abandonment of arable land over recent decades. In contrast, minor CN changes are dominant in over 10 watersheds in Western and Southwestern Serbia. (B) Through cluster analysis, four regions are spatially delineated by changes in four key indicators: runoff, soil erosion, agricultural land use, and rural population. Soil erosion change is correlated with the deagrarianisation and depopulation processes at a significance of p < 0.0001 with r = 0.580 and r = 0.629, respectively. The border watersheds are being studied for the first time using a complex approach that analyses the relationships between changes in demography, land use, surface runoff, and soil erosion. The study results contribute to a better understanding of sustainable land management and risk management in the hilly and mountainous border regions, which are particularly vulnerable to torrential flooding and soil erosion.

1. Introduction

The Republic of Serbia belongs to the Southeastern Europe (SEE) region, which is particularly susceptible to hydro-meteorological hazards [1]. Among these hazards, extreme local storms often trigger rapid surface runoff on slopes, leading to sudden maximum discharges in hilly and mountainous riverbeds. In this environment, natural and social factors are intricately interconnected over time, leading to dynamic changes in land use and their consequences [2,3]. Changes in rainfall patterns, which are characterised by more frequent intense episodes, coupled with unsustainable land-use practices are the primary drivers behind the heightened risk of soil erosion and excessive runoff [4]. Runoff on slopes, accompanied by soil erosion during rainfall events, represents interconnected degradation processes that can be either exacerbated or mitigated by human activities [5].
Land is an essential component of the environment and the hydrological cycle, defined by both natural features and human activities. Trends in population movements and activities over time lead to changes in land use/land cover (LULC). Continuous population movements between urban and rural areas bring about various environmental changes. For instance, the expansion of artificial land in urban settlements and the increase in agricultural activities in rural areas, often accompanied by deforestation, contribute to increased river flows and sediment production, which have severe effects on both the environment and society [6]. Long-term trends in land use can substantially alter watershed hydrological conditions. This is one of the reasons why LULC is a crucial starting point for hydrological studies. The land cover reflects the geological substrates and soil, which is why these factors, along with land use, are consistently included as parameters in empirical equations for estimating maximum discharge or assessing soil erosion intensity [7,8,9]. Human impact on the intensity and trends of natural processes is apparent and has been demonstrated in many studies worldwide [10,11,12]. For example, modelling studies showcase that forest cover loss in Eastern Africa increases surface runoff, annual discharges, and peak discharges [13].
Understanding the spatial and temporal patterns of land use and land cover (LULC) is crucial for understanding various global change phenomena [14]. In recent decades, demographic changes in most European countries have been characterised by population decline and rapid aging [15]. Depopulation, low birth rates, and an aging demographic profile are among the most important challenges affecting certain parts of the European continent [15,16]. This current demographic change is considered one of the main factors for future land-use development [15]. Due to industrialisation, the decline in rural areas has become a global phenomenon [17]. The abandonment of agricultural land and traditional farms [18] and the spontaneous expansion of forest areas is a recent widespread feature in rural European regions [19,20,21,22,23,24]. The research findings indicate that there are different trends in the world between demographic changes and changes in land use patterns. Rapid population growth is putting pressure on natural resources due to increasing food demand [25]. The concentration of intensive agriculture in the most fertile and accessible plains is the expected response to biophysical constraints [26]. This is particularly evident in underdeveloped countries, where the survival of millions of people depends on the functioning of soil resources. For example, agricultural overpopulation in the Ethiopian plateau led to dramatic changes in LULC [27,28,29]. On the other hand, in China, political and institutional factors played a key role in LULC, not demographic factors. A large volume of agricultural production, together with the largest population in the world, underscores the scarcity of agricultural resources per capita [30]. China’s land policy provides for a stabilisation and even an increase in arable land through the use of wild land in the northern and western provinces [30], with a simultaneous tendency to increase forest vegetation and pasture areas in areas threatened by extreme soil erosion [31,32]. In Germany, on the other hand, the analysis shows that the population decline in the core cities and rural areas of eastern Germany is not accompanied by a decline in LULC, as economic processes appear to be much more important for land-use changes here. The aging of the population has not yet had any discernible impact on land-use change [15]. The quantitative correlation of LULC and demographic factors in Slovenia has shown that land-use change processes are complex and do not depend only on individual demographic and socio-economic factors [33].
In developing countries like Serbia, the depopulation of villages in hilly mountainous regions is an active process that started in the second half of the last century [34]. This process is typical for higher lands in the border area due to difficult living conditions. The largest number of settlements with no population or with up to 20 residents were identified in Southeastern Serbia after the 2022 census [35]. The main components of the depopulation of villages in the border hilly–mountainous areas are mechanical, related to emigration, and biological, related to the aging population of the villages. As a direct result of the village depopulation, pressure on cities has been growing by increasing the built-up areas and their risk of flooding. This primarily means the abandonment of agricultural areas in higher lands that have turned to other land-use types (natural grassland, transitional woodland/shrub), impacting the patterns of surface runoff and erosion processes during extreme rainfall episodes.
Identification of the key drivers of the LULC change in recent decades in Serbia is presented by various studies [36,37]. Previous research on spatial patterns of demographic and agrarian–geographical processes has clearly demonstrated that Serbia is dominated by rural settlements with a high and medium depopulation index and deagrarianisation index [38]. The extreme reduction of agricultural land, spatially located primarily in Eastern and Southern Serbia, was positively correlated with the rural population decline. However, the complex dynamics of migration flows resulted in different spatial patterns of changes in agricultural areas. For example, rural settlements with high deagrarianisation in conditions where there was no demographic reduction of the rural population are identified as a peri-urban belt of larger city centres in the central areas of Serbia [39]. The causes of the different tendencies in the use of agricultural land arose under the influence of various economic activities, transport infrastructure, functional work zones, and markets [40], which brought about a change in the typology of agricultural production [41].
The influence of tourism development on land use over time in Western Serbia is explained in reference [42]. A spatio-temporal analysis of land-use change and its effects on soil erosion in the wine-producing area of the Šumadija Region, with a forecast for 2041, is presented in reference [43]. The authors [38] confirmed that land-use changes have direct effects on soil erosion intensity in the Velika Morava River Basin. However, most of the papers published by domestic researchers investigate the relationship between land-use change and change in soil erosion but do not measure demographic change as a possible key factor of these changes or exclude hydrological response.
The topic of land use and demographic change in border regions and their hydrological and geomorphological impact is the focus of our research, which has not been studied so far by researchers in Serbia. The study of land-use change and its causes is essential for understanding changes in the hydrological responses of watersheds and soil erosion over several decades. The main task of this research is to measure and explain the impact of land-use changes on surface runoff and soil erosion in watersheds with torrential regimes in highlands. This research aims to reveal mainly the runoff-reducing effects of the LULC changes and their patterns in the border areas of Central Serbia.
The findings obtained in this study may be applied to the sustainable management of river basins and the local and regional development Republic of Serbia.

2. Research Area

Due to the natural conditions of the hilly–mountainous regions—intensive rainfall, rapid snowmelt, steep slopes, shallow soils, and loose sediments—the area is highly susceptible to torrential floods, followed by debris floods, debris flows, and landslides. The area of interest is on the border regions of Central Serbia (south of the Sava and Danube Rivers), so the studied watersheds belong to the Drina River Basin in Western Serbia, the Timok and Danube River Basin in Eastern Serbia, and the Južna Morava River Basin and the Egej Basin in Southeastern Serbia. Note that the number of watersheds on the map in Figure 1 corresponds to the ID of watersheds in Table 1 in the Results Section. The observed watersheds are selected according to their physical–geographical characteristics as well as their recorded torrential flood events in the Inventory of torrential floods in Serbia [44]. The areas of selected watersheds are less than 500 km2 and range from 5.6 to 430.5 km2.
The research area has a moderate continental climate with annual precipitation in the range of 700–800 mm in hilly and lower mountainous areas of Southwestern and Southeastern Serbia, 800–900 mm in Eastern and Southeastern Serbia, and 1000–1100 mm and above fall annually in westernmost and Southwestern Serbia [45]. The researchers [45] defined the trend of an increase in annual precipitation in Western Serbia, while most of Eastern Serbia recorded a decrease.
The dominant geological and soil properties of the research area are presented according to the maps of a larger scale [46,47]. The predominant soils in selected watersheds in Eastern Serbia are predominantly acid, brown, and podzolic soils, covering about 80% of the area. The geology is characterised by flysch and other basin sediments from the Lower Cretaceous, metamorphosed sedimentary and igneous rocks from the Vendian period to the Cambrian, and plutonic rocks from the Paleozoic. In the Southeastern region, the watersheds are mainly covered by acid, brown, and podzolic soils (54%), along with rendzina, terra rosa, and brown soils (40%). The geological substrates contain metamorphosed sedimentary and igneous rocks from the Vendian period to the Cambrian, predominantly clastic rocks from the Permian, and metamorphosed sedimentary rocks from the Ordovician and Devonian.
In Western Serbia, the soil cover in selected watersheds primarily consists of acid, brown, and podzolic soils (67%) and includes ranker soils, brown soils, and lessive soils on serpentine rocks (23%). The geology is presented by an ophiolite sequence from the Jurassic period and predominantly clastic rocks from the Upper Paleozoic. In the Southwestern region, aside from the prevalent acid, brown, and podzolic soils and ranker soils (48%), there are significant areas of recent alluvial deposits. The geology of this region is defined by predominantly clastic rocks from the Upper Palaeozoic, ophiolite sequence from the Jurassic, and predominantly carbonate platform rocks from the Triassic.
According to the hydrological classes of soils of the Soil Conservation Service (SCS) [48] and the classification of soil types in Serbia by hydrological classes [49], the dominant soils (acid, brown, and podzolic soils; rendzina, terra rosa, and brown soils; ranker soils) in the research area belong to class B, which is characterised by moderate water infiltration and transmission rates, while the ranker soils, brown soils, and lessive soils on serpentine rocks (in Western Serbia) belong to class C, which has lower infiltration rates when thoroughly wetted.

3. Materials and Methods

The methodological approach adopted in this research has an interdisciplinary character. This research estimates the impact of the changes in land use/land cover in a time interval of the last almost three decades (1990–2018) on the runoff and erosion process in more than 40 watersheds with a torrential water regime.

3.1. Assessment of Runoff Process Modifications

The main hydrological indicator whose changes are examined in the period of 28 years is the curve number (CN), which is used for the assessment of the hydrological response of the ungauged watershed. The runoff curve number is a core parameter of the Soil Conservation Service [48] (SCS, today known as Natural Resources Conservation Service—NRCS) method whose value is in the defined range (0 < CN < 100). Its value is determined depending on land-use and hydrological classes of soils defined by soil type, and geological substrates as well as type and quality of vegetation cover. Hydrological characteristics of soils have a great impact on the share of effective rainfall, which drives the surface runoff generation in total rainfall quantity. The soils with a higher share of sand and gravel are permeable soils with high infiltration capacity. Contrary to the previous, the soils with a higher proportion of clay fraction are impermeable, conditioning high surface runoff. Furthermore, in the case of examination of small watersheds with arable lands, the CN has a different value depending on the technique of farming. The most favourable is terracing and contour farming, while straight row farming conditions the intensive soil erosion and surface runoff. The lower the CN, the lower the runoff, and the higher the CN, the higher the runoff.
In the physical–geographical observation of the studied watersheds, we considered all layers of the environment causing the surface runoff and built the dataset for this research in the QGIS environment [50]. We employed the data from topographic maps with a scale of 1:25,000, the EUDEM with 25 m resolution, and soil and geology data [46,47,51,52]. To explore LULC changes, we used open access raster datasets of the Coordination of Information on the Environment (CORINE) 1990 and 2018 for studied watersheds [53,54]. The reliability of land-use representation by CORINE is confirmed in many studies [55,56]. We used a raster-based approach of calculating and presenting the CN based on each cell’s land use, soil, and geology characteristics in studied watersheds. We obtained a raster map for the studied area with a size of a cell of 75 × 75 m.
The usage of curve numbers together with the watershed morphometric parameters (including rainfall data) for the synthetic unit hydrograph (SUH) enables the assessment of the maximal discharges of a certain probability of occurrence. In the references [57,58,59], this method is applied and explained in detail.
The annual runoff coefficient—RC, defined as the ratio of annual runoff to precipitation, was used as a metric to characterise changes in average annual runoff in Southeastern Serbia. The data on annual precipitation and runoff were obtained primarily from the Hydrometeorological data annex of the Water Resources Assessment of Serbia [60]. The mean annual change in RC is expressed as the linear regression coefficient of annual RCs for the available period 1961–2006.

3.2. Erosion Assessment

There are a number of studies that deal with empirical models, along with their advantages and disadvantages [61,62,63]. One of the pressing issues in this area is the assessment of uncertainty and the application of objective assessment criteria for soil erosion modelling [61]. For the purposes of this study, the intensity of the erosion process was calculated using the erosion potential model (EPM), also known as the Gavrilović method [64]. Various validation studies on the application of the EPM show a high degree of reliability and applicability in calculating the intensity of soil erosion. The comparative analysis of the results obtained with RUSLE and EPM showed that the two approaches simulated the phenomenon sufficiently well and had acceptable accuracy in the Venetikos catchment (Northern Greece). The results were first validated using the observed values for sediment input [65]. Studies in the Drenova catchment show similar results [66]. According to the latest research results on the application of the EPM on a global scale, the validation of this model is based on sediment yield data in more than 100 catchments in Africa, Asia, Australia with Oceania, Europe, North America, and South America. The selected catchments ranged from about 400 km2 to about 3.7 million km2. The best match was found for continental and temperate regions [67], where the watersheds of the study area are located. EPM can be applied to small areas where database layers are limited. The integration of EPM with GIS and remote sensing could be a useful technique for detecting soil loss and sedimentation in areas with insufficient sediment monitoring stations [68]. The over/under limits of the EPM simulations are within 13% of the measured values and are considered acceptable accuracy for soil loss simulations at the catchment scale [69]. Finally, the research results showed that of the 11 selected semi-quantitative methods, the EPM model was characterised as the most quantitative [70]. In recent decades, the EPM model has been applied in a wide range of geographical conditions, from arid areas [71,72] to tropical areas [73,74], including the Mediterranean region [75,76,77] and the high mountain regions [67,78]. The latest research confirms the application of this model at the global level [67].
Since the intense soil erosion accompanies the process of the generation of rapid surface runoff, we analysed the changes in soil erosion from 1990 to 2018. Most of the current knowledge on the spatial distribution of soil erosion and its temporal trends in Serbia is obtained through the EPM approach [64]. This enables not only the comparison of results from different spatial units [79,80,81] but also the continuous monitoring and comparison of the state of soil erosion over time within the same spatial units [82,83,84,85]. Average annual gross soil erosion (W—m3/yr) can be calculated as
W = T · H · π · Z 3 · A
where T—temperature coefficient, t—mean annual air temperature (°C), H—mean annual precipitation (mm), Z—erosion coefficient, A—the watershed area (km2). The temperature coefficient is calculated as follows:
T = t 10 + 0.1
and the erosion coefficient (Z) is calculated as
Z = Y · X · φ · I
where Y—coefficient of soil resistance, X—soil protection coefficient, φ—erosion and stream network development coefficient, and I—average slope (%).
Previous research has shown that the most important control factor in the intensity of soil erosion is land-use change, represented in the EPM model as the X coefficient [82]. According to the research objectives set in this paper, changes in the intensity of erosion will be considered using the Z coefficient [64]. Corine Land Cover database (published by the European Environment Agency) was used to calculate the X coefficient in 1990 and 2018 [53,54]. Corine Land Cover classes were identified in the selected watersheds, and each class was assigned a soil protection coefficient (X coefficient) according to the original EPM formula, ranging from 0.05 to 1. The highest coefficients (0.80–1.00) were assigned to vegetation-free areas dominated by severe erosion types, while the lowest coefficients (0.05–0.20) were assigned to mixed and dense forest areas.
Landsat 8 satellite images were used to calculate the ϕ coefficient (published by the Geological Topographic Institute of the United States) [86,87] using the BSI index (Bare Soil Index). The spatial resolution of the satellite images used in this study was 30 × 30 m. Research has demonstrated that the Bare Soil Index (BSI) facilitates an easier and more efficient calculation of erosion intensity [9,39,87]. The calculation of the BSI index was performed using several mathematical operations in the QGIS program:
B S I = B 6 + B 4 + B 5 + B 2 B 6 + B 4 + B 5 + B 2
where B6 (Band 6) is a shortwave infrared spectral channel (SWIR 1), B4 (Band 4) is a red spectral channel, B5 (Band 5) is a near-infrared spectral channel (NIR), and B2 (Band 2) is a blue spectral channel.
The terrain slope (I) was obtained from the 25 m digital elevation model over Europe (EUDEM) [52]. The spatial data on the geological rock types (coefficient Y) were obtained by digitizing the General Geological Map 1:100,000 [88]. QGIS 3.8.0. was used to calculate the degree of vulnerability to soil erosion and to visualize the results. In the first phase of the EPM application, to calculate the erosion coefficient Z, a rasterisation of the vector layers (coefficient X and coefficient Y) was performed. In the second phase of the calculation, all raster layers were mathematically related according to the formula for calculating erosion coefficient Z. This provided data on the erosion coefficient for each pixel, a spatial resolution of 25 × 25 m.

3.3. Change Indices

The focus of this study is to determine changes in the intensity of soil erosion from 1990 to 2018, as well as the main factors that control these changes, particularly the processes of deagrarianisation (land-use changes) and depopulation (demographic changes). In this context, three indices were used: Index Z represents changes in the intensity of soil erosion, Index AgL represents changes in agricultural land use, and Index RR represents changes in the rural population [82].
I n d e x Z = Z 2 Z 1 100
where Z2—erosion coefficient in 2018, and Z1—erosion coefficient in 1990.
I n d e x A g L = A g L 2 A g L 1 100
where AgL2—agriculture land use in 2012, and AgL1—agriculture land use in 1991.
I n d e x R P = R P 2 R P 1 100
where RP2—rural population in 2022; RP2—rural population in 1991.
The indices are classified according to the following scale: high index < 10, medium–high index = 10–30, medium index = 30–50, medium–low index = 50–70, low index > 70–100, and growth index > 100. The parameters as indicators of rural population changes were defined for the period from 1991 to 2022 and agriculture land use from 1991 to 2012 [89]. The demographic and agricultural data sets from 374 rural settlements were processed. Data on the rural population were used from the Statistical Yearbooks for 1961–2022 of the Republic Institute of Statistics (2022) [89]. Agricultural data were used from the Census of Agriculture for 1991 and 2011 of the Yearbooks of the Statistical Office of the Republic of Serbia (2012) [89].

3.4. Statistical Analysis

Statistical methods were employed to synthesise the results obtained in the study. The sequence of the most important steps in the statistical analysis is as follows:
  • The Pearson correlation coefficient (r) was used to quantify the degree of dependence between runoff and selected indicators. The results of this analysis revealed a statistically significant relationship between the selected indicators (α < 0.05).
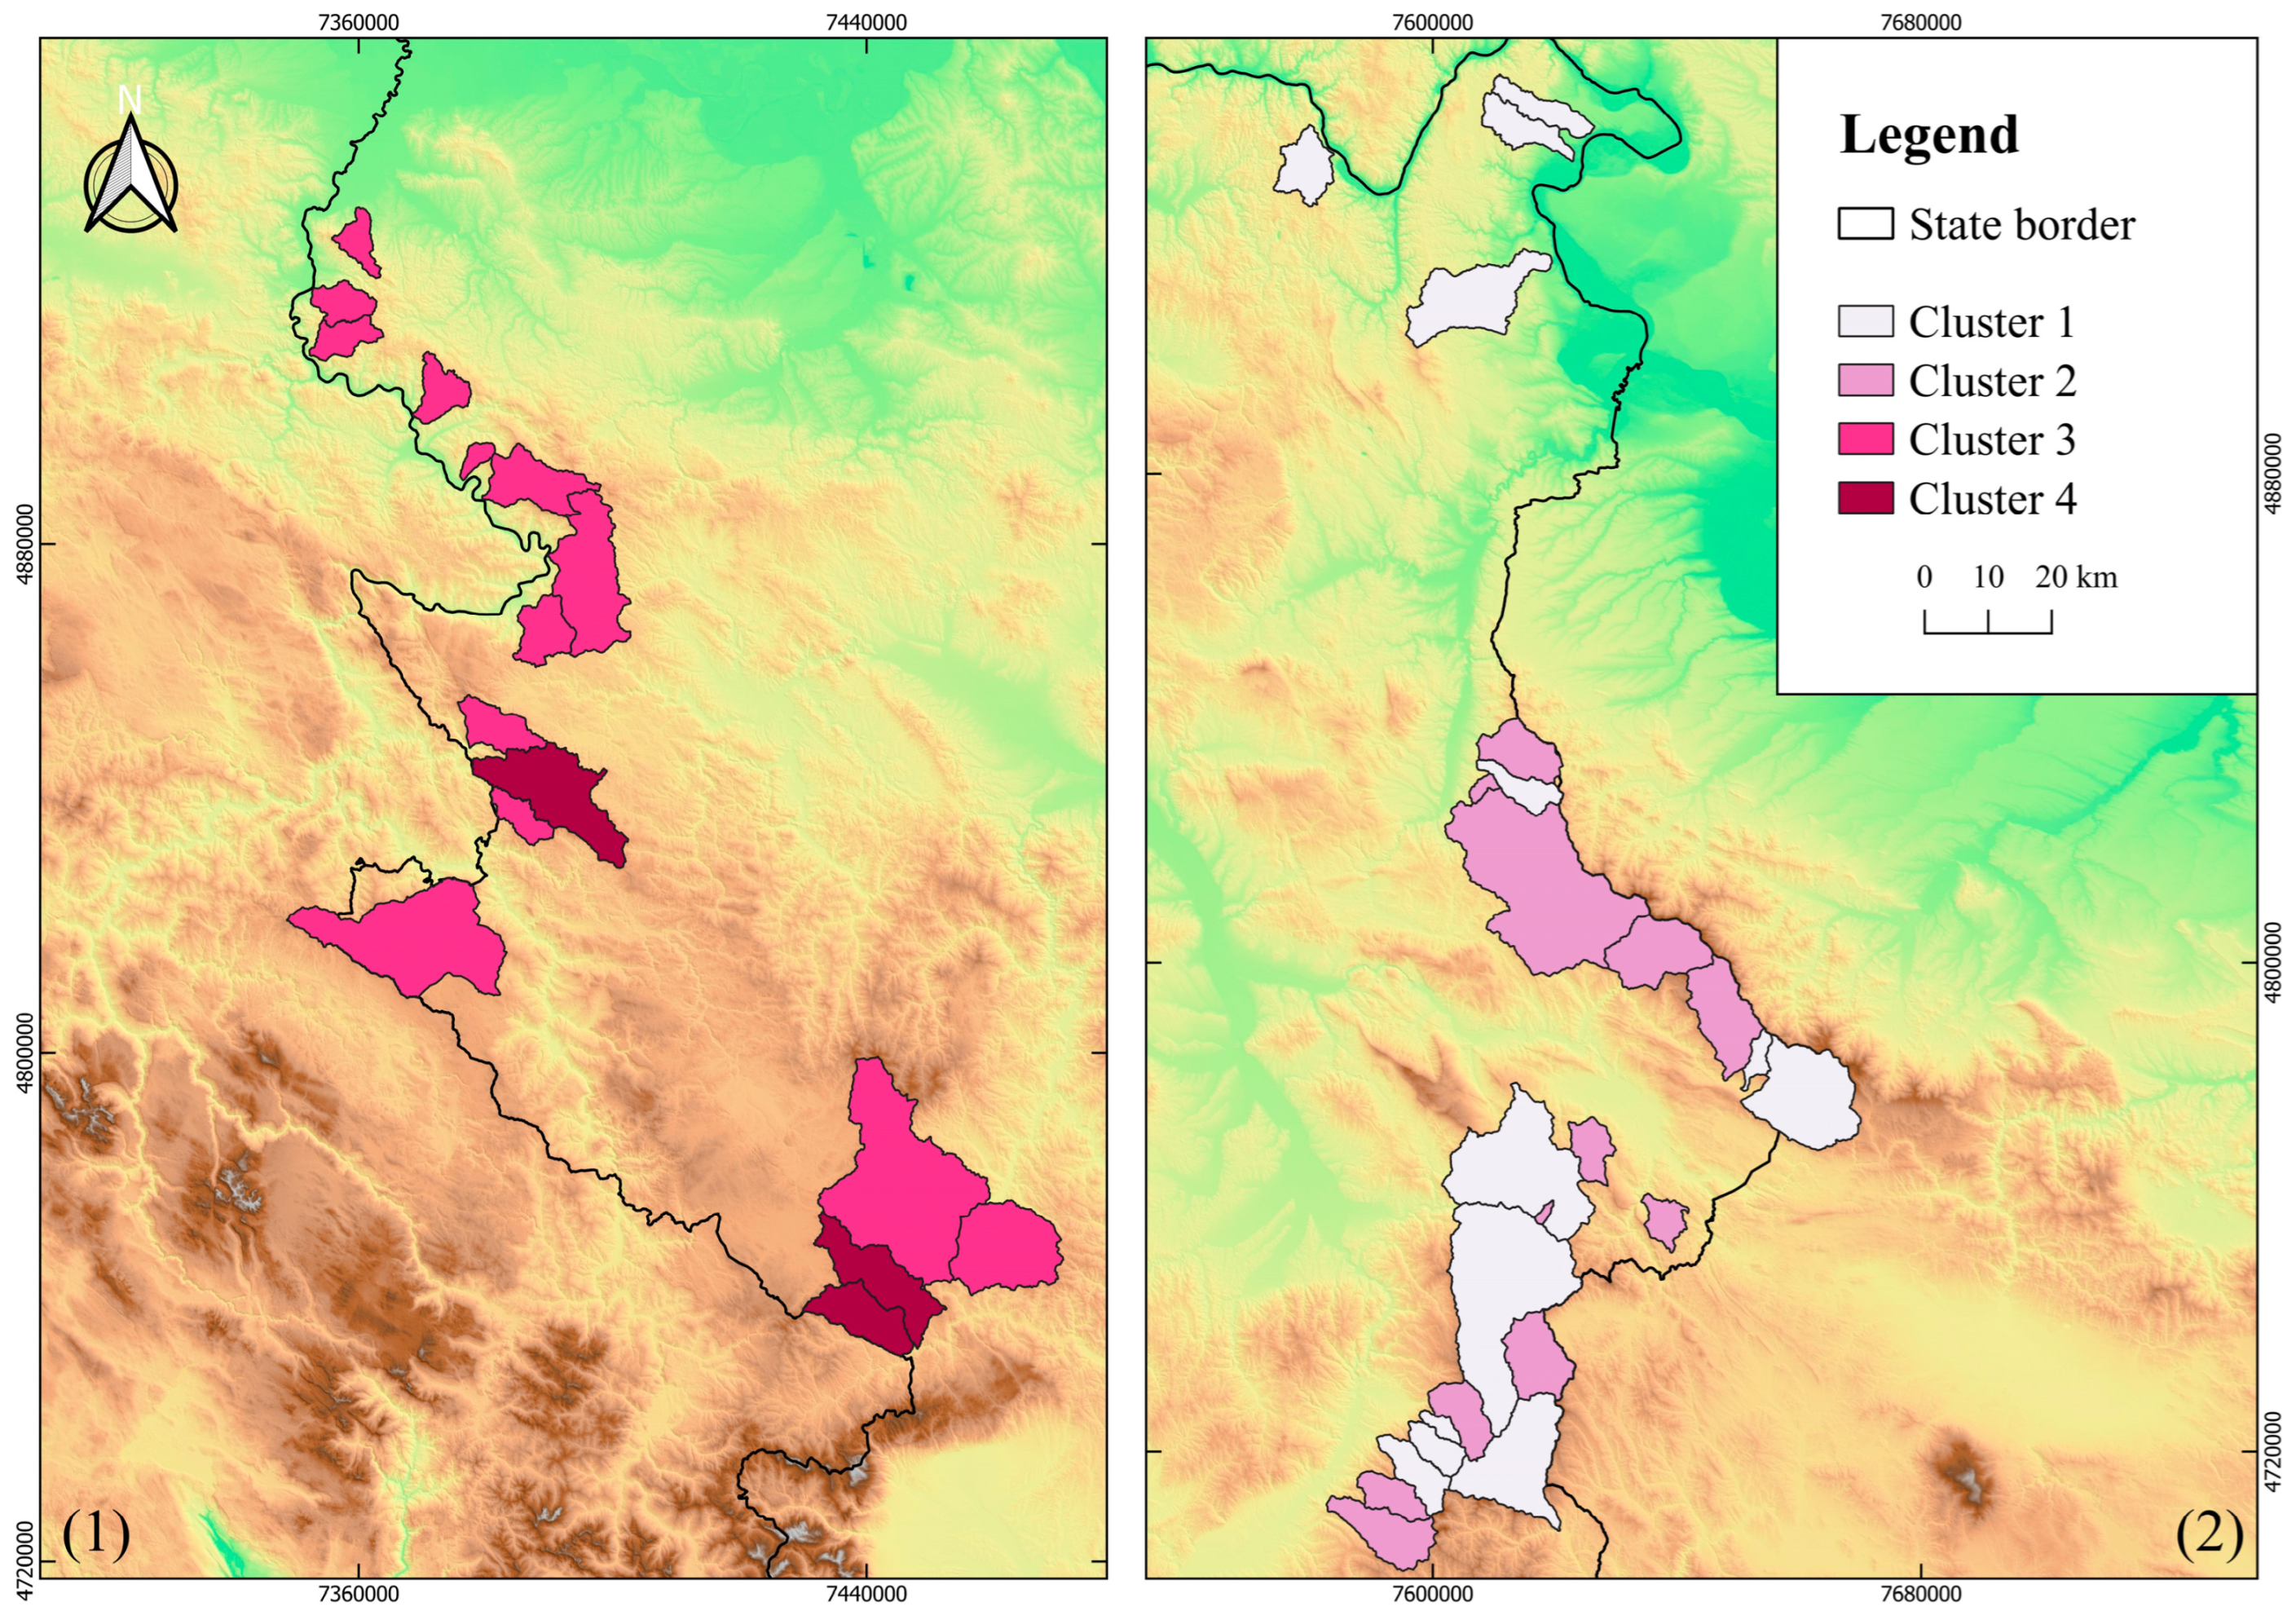
  • The next step involved the use of cluster analysis to differentiate the watersheds spatially based on four selected variables: CN change, Index Z, Index RP, and Index AgL). Cluster analysis (CA) is a multivariate statistical analysis method commonly used for management strategies in small catchment areas [90]. An agglomerative hierarchical method was applied, where each watershed initially stands alone as its group. The method aims to group different objects (watersheds). The method aims to maximize the similarity between watersheds within the same group [91]. As a result, watershed groups exhibit a high degree of internal (within-group) homogeneity and external (across-group) heterogeneity [92]. A hierarchical tree (dendrogram) visually represents these spatial similarities, showing the clusters determined by the analysis. The Ward method of hierarchical clustering with square Euclidean distance was employed [90].
  • Since it was unclear after cluster analysis which variables were decisive for grouping the watersheds, PCA was applied. PCA identifies a small number of derived variables from a larger set of original variables [93,94,95]. The goal is to determine the minimum number of factors that explain the largest proportion of the total variance. In PCA, input variables are replaced by principal components, with each cluster from the cluster analysis corresponding to a principal component. The Kaiser–Meyer–Olkin (KMO) measure of sampling adequacy and Bartlett’s test for sphericity [96,97] were used to assess the suitability of the data for PCA. Bartlett’s sphericity test with a significance level of 95% (p < 0.05) confirms the suitability for PCA [94]. Therefore, PCA was used to perform a more detailed analysis of the clustering factors, ultimately filtering out the most important variable for each cluster.

4. Results and Discussion

4.1. Runoff Changes

Observations of land use in selected watersheds in 1990 and 2018 revealed significant changes in land-use patterns. As an example of drastic changes, Figure 2a illustrates the Corine Land Cover (CLC) and the raster map of CN for the Sinja River watershed. The proportion of agricultural areas decreased markedly, from 20.6% in 1990 (land principally occupied by agriculture and complex cultivation patterns) to just 4.4% in 2018 (limited to pastures only). Conversely, the proportion of land covered by forest, including broadleaved, coniferous, and mixed forests, increased substantially from 38.3% to 65.8%.
In the Poganovska River watershed (Figure 2b), the share of land principally occupied by agriculture and complex cultivation patterns decreased from 27.2 to 14.8%, while the proportion of forests remained unchanged. During the same period, the area of pastures and natural grasslands diminished, while transitional woodland shrubs increased significantly from 5.2 to 23%. Consequently, the runoff curve number, which measures the hydrological response of the watershed to extreme rainfall events, decreased by 3.21 for the Sinja River between 1990 and 2018, indicating a reduction in peak flows.
Observing the entire study area, land-use modifications over 28 years led to changes in the curve numbers of watersheds, resulting in either a decline (CND) or growth (CNG), as shown in Table 1. The following spatial patterns were found concerning curve numbers as hydrological indicators of watersheds:
(A)
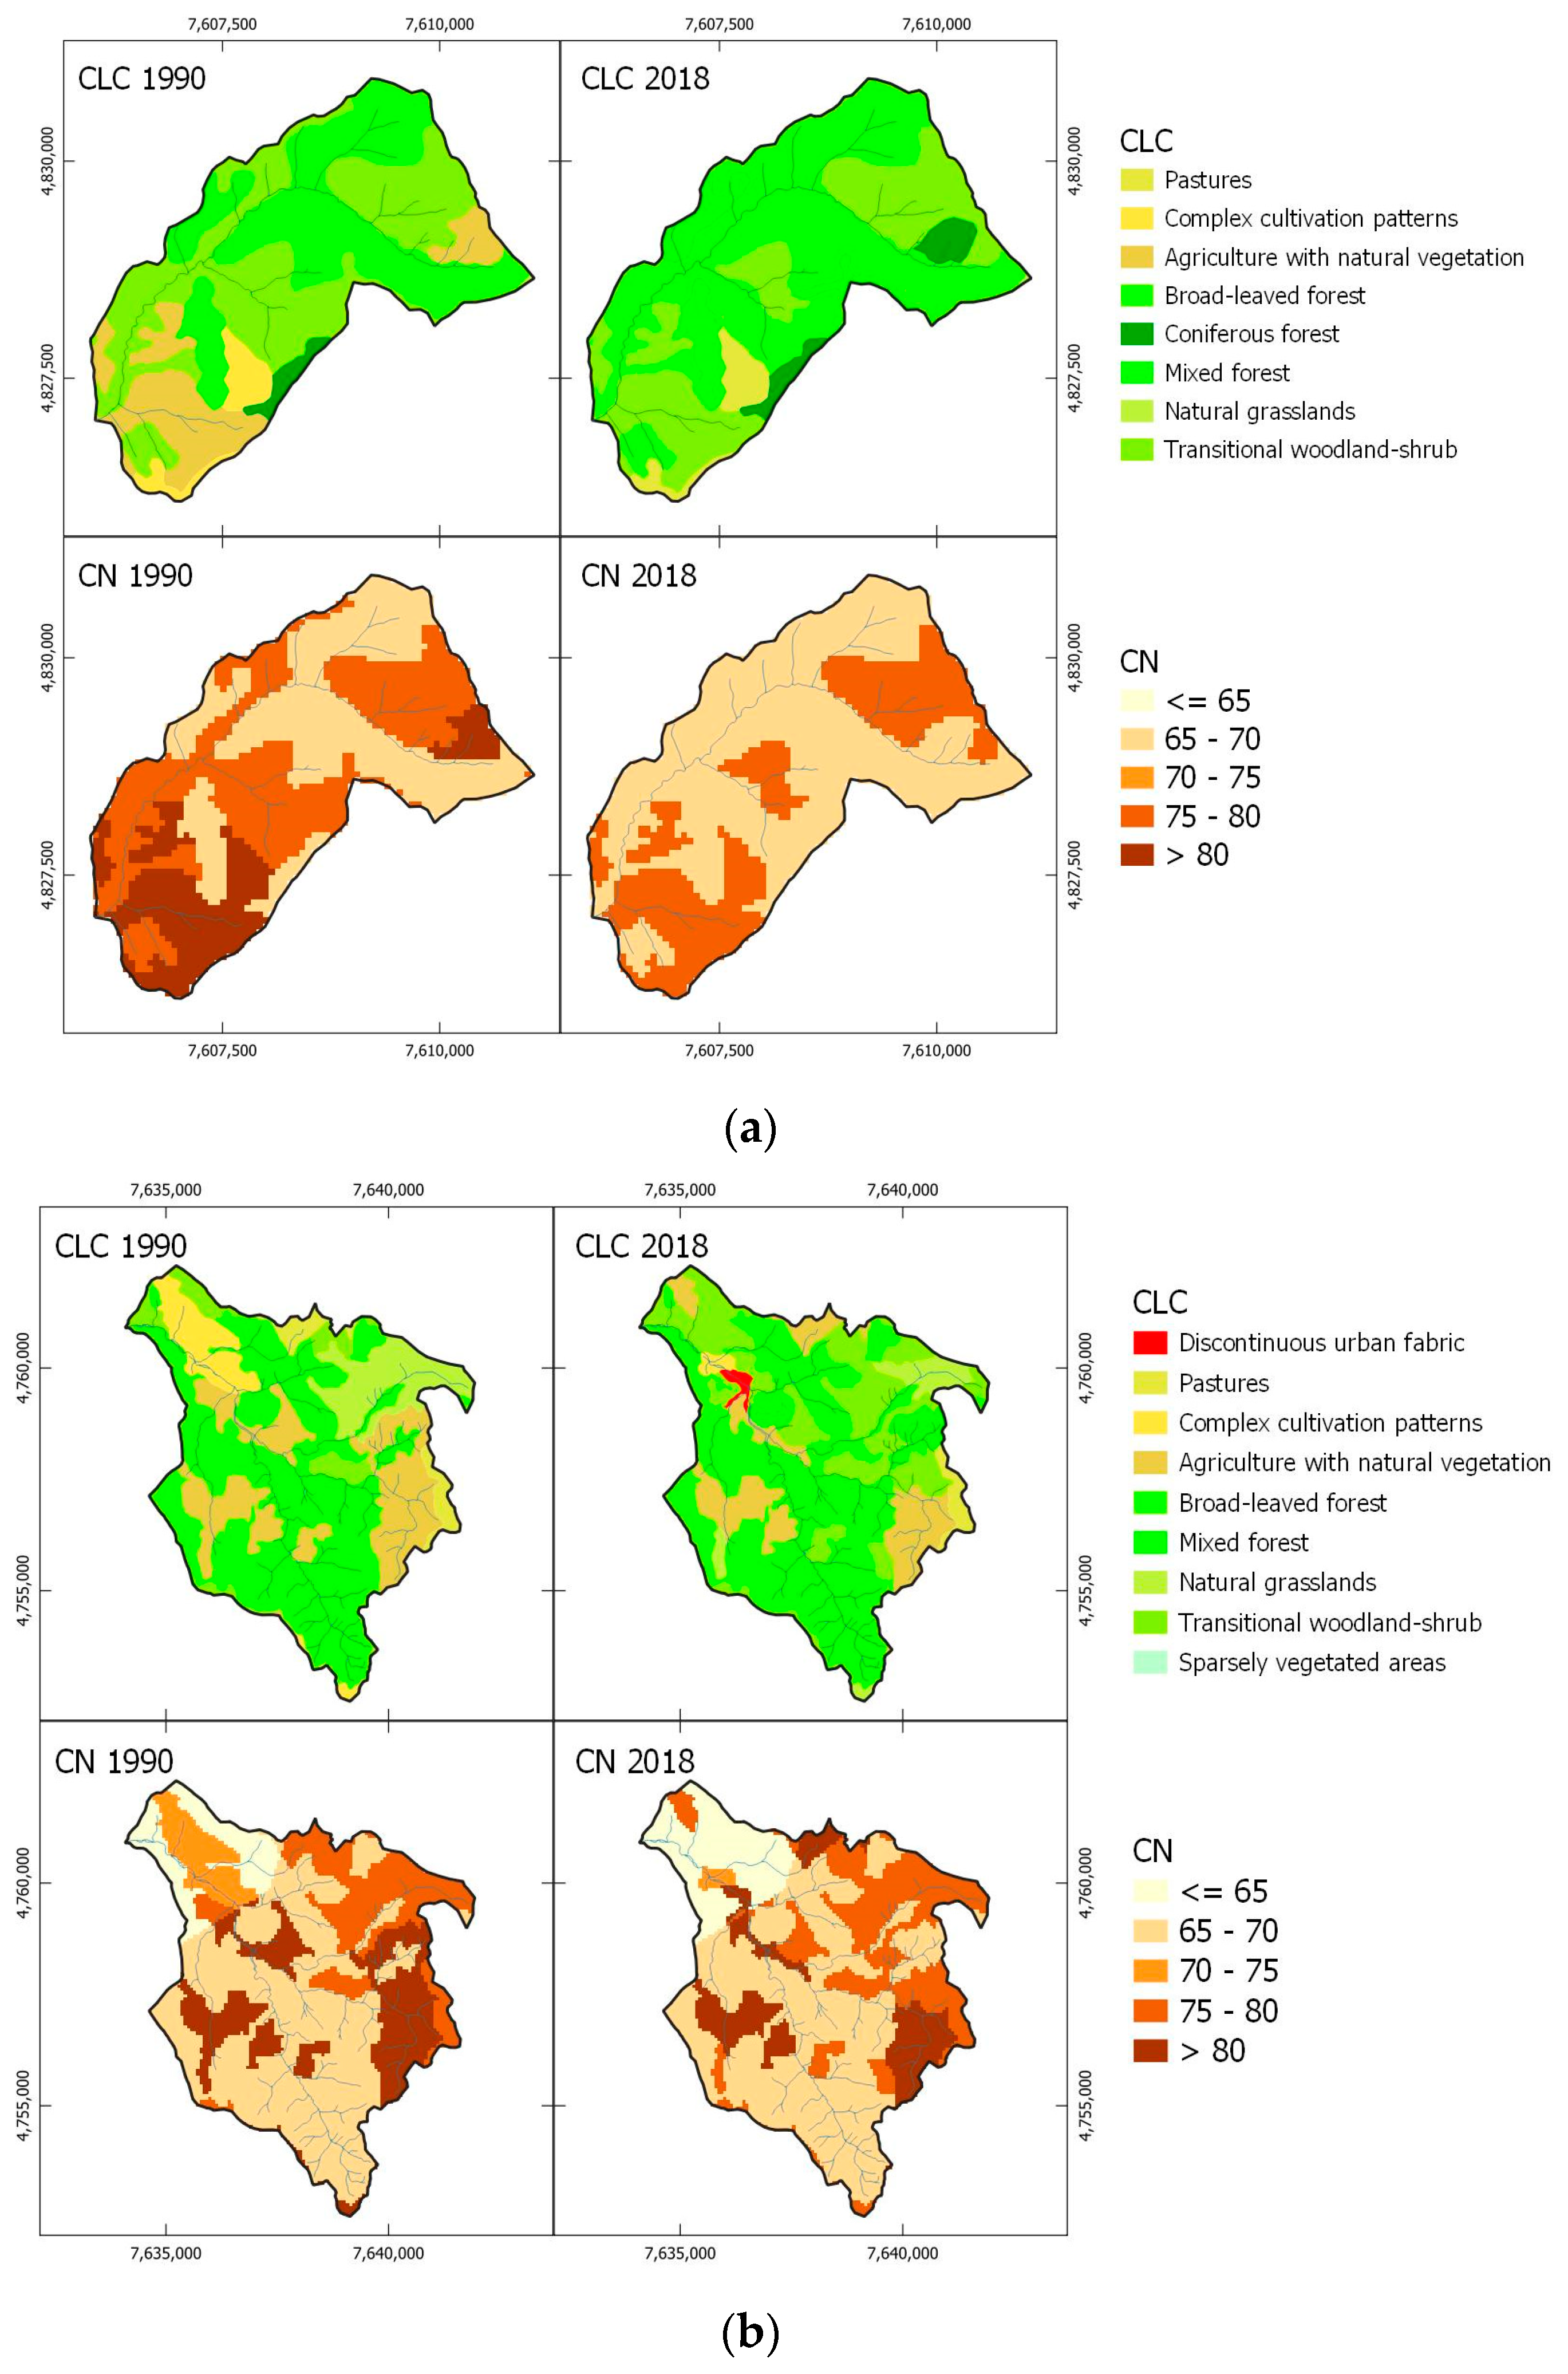
A dominant decline in curve numbers was obtained in more than 20 watersheds located in the border areas of Eastern and Southeastern Serbia (both with an average CNDav of −1.09). These regions have experienced continuous depopulation over the last several decades [34]. The most significant CN changes in Southeastern Serbia were recorded in the Toplodolska River (CND = −2.34) and the Korbevačka River (CND = −1.98). Generally, this decline was associated with the abandonment of arable lands, which over time transitioned into woodland shrub and forest areas, potentially contributing to a slight decrease in peak discharges.
(B)
Minor changes in curve numbers were, on average, dominant for more than 10 watersheds in the Drina River basin. Similarly, minor changes were obtained in watersheds in Southwestern Serbia. In particular, the watersheds of Crni Rzav, Štira, Pilica, Rogačica, and Raška showed no change in hydrological response between 1990 and 2018.
Table 1. Studied watersheds in border areas and their CN change for the period 1990–2018.
IdWatershedRiver BasinProfileWatershed Area (km2)CN Change
Eastern Serbia1BoljetinskaDanubeBoljetin75.94−0.70
2PodvrškaDanubeMilutinovac60.89−0.98
3Velika KameničkaDanubeVelesnica69.66−0.66
4ZamnaDanubeMihajlovac186.92−0.15
5KoritskaDanubePetruša87.05−1.21
6JelašničkaDanubeJelašnica51.08−0.94
7Sinja rekaDanubeBerčinovac11.84−3.21
8Trgoviški TimokDanubeDonja Kamenica361.28−0.84
Average CN change−1.09
Southeastern Serbia9Toplodolska Južna MoravaMrtvački most137.81−2.34
10DojkinačkaJužna MoravaV. Ržana137.43−1.60
11RosomačkaJužna MoravaSlavinja23.42−1.28
12VisočicaJužna MoravaBraćevci224.850.26
13Poganovska rekaJužna MoravaPoganovo41.17−1.16
14Prisjanska Južna MoravaRasnica52.48−1.48
15LužnicaJužna MoravaSvođe 323−0.13
16Ravna rekaJužna MoravaStrelac5.59−1.42
17VlasinaJužna MoravaSvođe 430.53−0.50
18Jerma Južna MoravaStrezimirovci110.85−0.72
19VrlaJužna MoravaSurdulica76.69−1.11
20RomanovskaJužna MoravaD. Romanovce17.44−0.61
21MasuričkaJužna MoravaMasurica46.15−0.59
22JelašnicaJužna MoravaJelašnica68.18−1.28
23KorbevačkaJužna MoravaKlisurica56.43−1.98
24BanjskaJužna MoravaVr. Banja108.37−1.21
25LjubatskaDragovištica Bosilegrad199.01−0.33
Average CN change−1.09
Southwest Serbia26JošanicaZapadna MoravaNovi Pazar191.71−0.07
27GoduljaZapadna MoravaŠpiljani99.71−0.33
28VidrenjakZapadna MoravaKrona137.880.40
29RaškaZapadna MoravaNovi Pazar471.680.02
Average CN change0.004
Western Serbia30PoblačnicaDrinaOlandići342.93−0.23
31JablanicaDrinaŽ. st. Jablanica41.890.15
32Crni RzavDrinaPanjak201.290.00
33KamišnaDrinaKotroman68.260.25
34PilicaDrinaBajina Bašta70.170.01
35RogačicaDrinaRogačica204.41−0.06
36TrešnjicaDrinaD. Trešnjica104.39−0.70
37Bukovička rekaDrinaVrhpolje16.11−0.43
38GračaničkaDrinaGračanica54.45−0.72
39Boranjska rekaDrinaAmajić46.230.23
40RadaljskaDrinaRadalj46.930.20
41ŠtiraDrinaLoznica37.10.00
Average CN change−0.11
Additionally, the annual runoff coefficient (RC), defined as the ratio of the annual runoff to precipitation, was employed as an indicator of changes in the average annual runoff in four of the studied watersheds with available data: Vlasina, Lužnica, Jerma, and Raška rivers. Two of the studied watersheds with available data were excluded—the Banjska River was dammed in the 1990s, resulting in a significant artificial reduction of the runoff coefficient, and for the Visočica River, there is a lack of rainfall data from the upstream part of the watershed located in Bulgaria, leading to an overestimation of the RC. The mean annual change in RC is expressed as a linear regression coefficient of the annual RCs.
The results indicate a significant decrease in the annual runoff coefficient in the Vlasina and Lužnica watersheds and, to a slightly lesser extent, in the analysed upstream part of the Jerma watershed. However, no apparent change is visible in the Raška River (Figure 3). For the analysed watersheds, the decrease in mean annual RC corresponds to a decrease in CN, although not proportionately. For the Raška River, both the CN and RC remain relatively unchanged during the analysed period.
Most of the studied watersheds are ungauged. Among the listed watersheds, only several have hydrological monitoring records longer than 20 years. There are only two hydrological stations with a long discharge time series, spanning around 60 years, but with occasional annual interruptions. In climatological studies in Serbia, data from two periods, 1961–1990 and 1991–2020, are utilized to analyse trends in temperature and rainfall data series. Changes in average annual maximum discharge were examined for the Vlasina and Lužnica Rivers for the periods 1961–1990 and 1991–2022. The average annual maximal discharge for the first period is 66.5 m3s−1, while for the second period it is 40.1 m3s−1. It is worth noting that the most extreme torrential flood event in this watershed, caused by an extreme rainfall event, occurred in June 1988, when a peak discharge of 488 m3s−1. The decrease in average annual maximal discharge is slightly lower for the Lužnica River, but the entire time series for both watersheds indicates a negative linear regression coefficient.
For a selected watershed with a decrease in CN, the change in maximal discharges for a 100-year return period is examined using the SCS-SUH methodological approach based on land use in 1990 and 2018 and available rainfall data. The floods with a 1% probability of occurrence (the “hundred-year flood”) are computed for the Podvrška River (CND = −0.94) located in Eastern Serbia. This river experienced a severe torrential flood event in September 2014, when a daily rainfall amount of over 100 mm was recorded [57]. The results indicate that the 100-year return period maximal discharge with land-use conditions from 2018 is 4.1% lower than with land-use patterns from 1990 (Figure 4).
Similar research in Serbia was performed for a small peri-urban watershed in the Belgrade region, observing land-use changes from 1953 to 2005 [98]. The authors explained that urbanisation and the degradation of forest and agricultural land shifted former discharges with a 100-year recurrence interval to events with a 20-year recurrence interval. Conversely, a longer period (1927–2010) was observed for land-use changes in a small rural watershed in the south, where extensive erosion control works were carried out, resulting in a decreased curve number [99]. Additionally, a decrease in the soil erosion coefficient after erosion control works was demonstrated for micro-watersheds in the Grdelička Gorge of the Južna Morava River [100].

4.2. Changes in the Erosion Processes

The intensity of the erosive process in selected watersheds was analysed for 1990 and 2018 (Figure 5). The mean erosion coefficient (Z) was determined for each watershed. Changes in the intensity of erosive processes are represented by Index Z. As presented in Figure 6, 8 (20%) of the total number of watersheds had a medium–strong Index Z, while 13 (32%) and 16 (39%) watersheds had a medium and medium–low Index Z, respectively. Finally, in only four (10%) watersheds, no decrease in the intensity of the erosion process was obtained. The mean erosion coefficients in 1990 and 2018 were in the following ranges: Z1 = 0.198–0.485 and Z2 = 0.115–0.307, with the Index Z ranging from 30 to 105.
The effects of land-use change on land cover on surface runoff and soil erosion processes are significant factors in changing the intensity of the above processes. For a detailed analysis in this study, we also focused on the spatiotemporal distribution of agricultural land-use changes, specifically the process of deagrarianisation (Index AgL) in rural areas. Since land-use changes are influenced by demographic processes, the paper considered a demographic indicator (depopulation process) presented as the Index RP. The analysis encompassed 374 rural settlements in the selected watersheds, and data on agricultural land and rural population was sourced from Statistical Yearbooks [53].
Statistical interactions between runoff and erosion parameters and anthropogenic indicators are described in Table 2. The correlations between variables were significant at α < 0.05. Overall, for all watersheds, the statistical analyses revealed a strong level of dependence between the CN change and Index Z (r = 0.847, p < 0.0001).
The changes in runoff and erosion intensity were directly related to the changes in agricultural land and rural population. Namely, the changes in the erosion coefficient, denoted by Index Z, are correlated with the deagrarianisation process (Index AgL) and the depopulation process (Index RP) in the rural settlements of the selected watersheds with r = 0.580 (p < 0.0001) and r = 0.629 (p < 0.0001), respectively. On the other hand, the correlation between runoff and anthropogenic indicators is slightly lower. The correlation coefficient between CN change and Index AgL amounts to r = 0.491 (p = 0.0011), and the correlation coefficient between CN change and Index RP is r = 0.520 (p = 0.0005).

4.3. Spatial Differentiation of Watersheds—The Interactive and Individual Impact of Selected Variables

In this study, the suitability of data for analysis was assessed using the Kaiser–Meyer–Olkin (KMO) and Bartlett’s test of sphericity. The KMO score was 0.724, and Bartlett’s test showed significance at α = 0.05 with a p-value of p < 0.0001, supporting the factorability of the cross-correlation.
There are two ways in which the spatial differentiation of watersheds was analysed: (1) according to cluster analysis (CA) and (2) according to Principal Component Analysis (PCA) for the dominant variable for each watershed. In the first case, four clusters can be distinguished on the dendrogram (Figure 7). The spatial distribution of the watersheds determined using the cluster analysis is shown in Figure 8. The first cluster (C1) and the second cluster (C2) (d: 18.3) are the largest and consist of 25 watersheds located in the northeastern and eastern parts of Serbia. The third (C3) and fourth clusters (C4) are located in the territory of Western and Southwestern Serbia and consist of 16 watersheds. In the second case, the dominant changes of selected (main) variables are identified within the selected watersheds. The contribution of the variables (%) is given in Table 3.
The dendrogram shows that the first cluster (d: 7.32) groups 13 watersheds from the Podvrška River to Visočica (Figure 7). The cluster is characterised by a negative value of CN change in all basins, with a mean CN value of −0.69. For most of the watersheds, a decrease in soil erosion is recorded, characterised as medium–low change (nine watersheds) and weak change in four watersheds (Figure 6). In general, the mean Index Z of 66 implies that the average reduction in erosion intensity from 1990 to 2018 was 34%. The obtained reduction of runoff and soil erosion occurred as a consequence of the reduction of the rural population and agricultural land (Figure 9 and Figure 10). The cluster is characterised by a medium intensity of depopulation (Index RP = 39) (Figure 10a). The negative factor scores after Varimax rotation show that the depopulation factor (D3) has the most significant change in the basins belonging to this cluster (Table 4). Specifically, this area recorded the largest absolute reduction of the rural population by 20,096 inhabitants over the last three decades (1991: 32,738 inhabitants; 2022: 12,642 inhabitants). The consequence of this rural exodus was the abandonment of 29,525 ha (60%) of agricultural land, which is defined as a medium level of deagrarianisation (Index AgL = 40) (Figure 10b).
The second cluster includes 12 watersheds, from the Korbevacka River to Jerma (Figure 6). The dendrogram shows this cluster is more homogeneous than the previous one (d: 5.03) (Figure 7). According to the factor scores after Varimax rotation (Table 4), this cluster includes the watersheds with the highest negative scores for factor D1 and factor D4, which describe changes for CN and Index Z, respectively. The main characteristic of this cluster is that it records the biggest changes in the reduction of runoff (average CN = −1.52) and reduction in the intensity of soil erosion (Index Z = 46). Reducing changes in erosion intensity are evident: moderate changes in the erosion intensity were noted in nine watersheds, and medium–weak changes were noted in three watersheds (Figure 6). The decrease in runoff and soil erosion intensity resulted from the extreme depopulation and deagrarianisation in the rural settlements within these watersheds. In 10 watersheds, a medium–high intensity of deagrarianisation and depopulation was detected (Index RP = 24, Index AgL = 22) (Figure 11). This indicates that the reduction of the rural population by 76% (1991: 13,808 inhabitants; 2022: 3305 inhabitants) also resulted in the reduction of agricultural land by 78% (1991: 34,328 ha; 2012: 8033 ha) (Figure 9 and Figure 10).
According to the dendrogram analysis, the third cluster exhibits high homogeneity (d: 4.35), including 13 watersheds located in the western and southwestern part of Serbia, extending from the Štira watershed to the Raška watershed (Figure 7). The factor scores for factors D1 and D4, which represent variations in runoff and the coefficient of the erosive process, respectively, show positive values (Table 4). In contrast to the two clusters in Eastern Serbia, the watersheds within this cluster are characterised by a minimal change in the runoff with an average CND of −0.10, ranging from −0.71 to 0.25. Eight watersheds within this cluster exhibit an increase in CN. Additionally, relatively small changes were also obtained in the intensity of soil erosion. The average value of Index Z for this cluster is 98 (Figure 6). A low change in the soil erosion intensity was obtained in 10 watersheds, with one basin showing changes in the medium range and two basins showing a small increase in the intensity of the erosive process. Relatively small changes in runoff and soil erosion intensity can be attributed to relatively smaller changes in the demographic and agricultural potential of these areas compared to the border rural areas of Eastern and Southeastern Serbia. Low depopulation process (Index RP = 75) and medium–low reduction in agricultural land (Index AgL = 60) are typical for the rural settlements within these watersheds (Figure 11). Despite trends in agricultural land abandonment (80,008 ha in 1991; 48,033 ha in 2012) and population migration from rural settlements to urban centres (70,460 inhabitants in 1991; 52,878 inhabitants in 2022), the agricultural pressure on land in this region is more pronounced than in Eastern Serbia (Figure 9 and Figure 10). The complex interactions between population and land use can lead to the survival and even intensification of agriculture in certain areas despite depopulation trends. Namely, although the process of depopulation and deagrarianisation in rural settlements is evident, in the studied period, there was a certain increase in the anthropogenic impact on agricultural land in the watersheds of this cluster. Agrarian population density in 1991 was 88 inhabitants per 100 ha of agricultural land, and in 2022, it increased to 110 inhabitants per 100 ha of agricultural land. Several different causes can be singled out that explain the changes mentioned in this case. Firstly, the relatively high intensity of soil erosion compared to the intensity of depopulation and deagrarianisation could be explained by the spatial positions of rural settlements. Remote areas tend to experience higher levels of abandonment than areas close to production centres and urban markets due to natural constraints such as altitude, slope, relief dissection, and climatic conditions [26,101]. In this context, more land tends to be abandoned in remote areas due to natural constraints than in areas close to production centres and urban markets [26]. Migration and agricultural land abandonment were primarily characteristic of rural settlements at higher altitudes in the mountainous regions of the studied watersheds, implying that unfavourable physical–geographical factors were primary in the initial stages of abandonment. Conversely, intensive agriculture tends to be concentrated in rural settlements at lower altitudes, which are more fertile and accessible. These rural settlements are generally positioned as peri-urban areas near urban centres such as Loznica, Bajina Bašta, and Mali Zvornik, where the influence of the agricultural market significantly drives agricultural intensification. While previous studies have shown that socio-economic transformations generally increase the demand for non-agricultural occupations near urban centres [102], in this case, certain rural settlements have not experienced significant changes in the typology of agriculture. As a result, the livelihoods of the rural population in these areas remain focused on agricultural production [103].
The fourth cluster comprises only three watersheds: Vidrenjak, Godulja, and Crni Rzav (d:1.27) (Figure 7). These watersheds exhibit relatively small changes in runoff and either stagnation or growth in soil erosion intensity. The high positive factor score for D2 (Table 4) indicates that the primary agrarian characteristic of these watersheds is an expansion of agricultural land (8847 ha in 1991; 10,113 ha in 2012) (Figure 10). Additionally, there is a noticeable increase in the rural population in the settlements associated with this cluster (12,829 inhabitants in 1991; 15,792 inhabitants in 2022) (Figure 9).
The main causes of spatial differences in changes in runoff and soil erosion stem from the varying dynamics of socio-historical processes over the past few decades, which have negatively impacted the demographic, population, and agricultural characteristics of rural areas of Serbia [103]. The expansion of depopulated areas and the concentration of the population in the largest urban centres are among the most significant features of regional development inequalities in Serbia [104,105]. Smaller urban centres that emerged during the rapid industrialisation of the 1960s and 1970s struggled to compete with larger industrial centres in attracting labour [106]. The decline in the functional capacity of urban centres and the gradual reduction of their territorial influence made it increasingly difficult for the population to meet their basic needs [35]. Most rural settlements in the study area are located in the hilly and mountainous parts of the watershed, where the differentiation of natural conditions, such as higher altitude, has influenced population flows and intensified the process of deagrarianisation and the fragmentation of agricultural land [107]. In the years immediately following the collapse of socialism, the land most suitable for agricultural activities was often the first to be abandoned [22]. A direct consequence of this transformation of the agricultural landscape has been a reduction in the intensity of soil erosion.
In studying the temporal component of soil erosion, there is a scientifically proven trend toward its reduction in Serbia [38,87,108]. However, the spatial aspect of soil erosion reveals that the most significant changes over time have occurred in rural areas exhibiting clear signs of depopulation and deagrarianisation [6,109]. While there are numerous similarities in morphometric, demographic, transportation, and agricultural characteristics across Serbia’s border regions, certain differences have led to the spatial differentiation of runoff and soil erosion between the eastern and western parts of the country.
The eastern areas of Serbia have had a border status for many years, as the borders with Romania and Bulgaria were established earlier in the past (so-called “old borderlands”) [110]. They are recognised in the literature as the first depopulation subregional entity in Serbia [34]. On the other hand, the rural area on the border with Bosnia and Herzegovina and Montenegro has better development potential, as they received border status in the 1990s and early 21st century [110]. According to the classification of rural settlements [111], the settlements in the eastern border area belong exclusively to the category of peripheral rural areas, which are characterised by extremely negative demographic trends. In the western border area, in addition to settlements in this category, there are also economically weaker rural areas with a positive demographic capacity. However, in the peri-urban belt of Novi Pazar and Tutin, some settlements belong to the category of sustainable rural areas [111]. These settlements follow the flows of urbanisation, and their development and dynamics are directly linked to the urban centres of Novi Pazar and Tutin [111]. Novi Pazar and Tutin are urban centres that have experienced continuous demographic growth since the 1960s [112].
The interdisciplinary approach used in this study enhanced the interpretation and understanding of the impact of land-use change and demographic processes on runoff and soil erosion in mountain border watersheds and its trends. Spatial differentiation of watersheds revealed varying trends in runoff and soil erosion, highlighting the importance of accurate and reliable estimates of these changes at different spatial and temporal scales, which depend on the methods and quality of input data [61,63,113].
Due to the lack of comprehensive hydrological monitoring in the studied mountain basins, exact validation of the model is not possible. However, cross-referencing with earlier observations from other studies increases confidence in the study’s outcomes. Previous research has established a functional relationship between land-use changes and soil erosion intensity, linking these processes to changes in suspended sediment transport over the long term. For instance, studies across a wider area have documented significant decreases in suspended sediment concentration and sediment load at stations on the Velika Morava River, the Južna Morava River, and their tributaries [12,38]. Specifically, in Southeastern Serbia, significant trends of suspended sediment reduction were recorded at α = 0.01 and α = 0.001, whereas Southwestern Serbia showed a decrease in suspended sediment without statistical significance [38]. The results of this study indicate that watersheds experiencing the highest changes in soil erosion and runoff are concentrated in the southeastern region, while the smallest changes are observed in the southwestern region. Previous research in Serbia [82] has shown that the most significant controlling factor, which is influencing soil erosion calculations, is the soil protection coefficient (X) in the EPM model.
The observed decrease in population and agricultural land is directly related to the decline in suspended sediment. Statistical analyses reveal a strong correlation (confidence level 0.95) between the reduction in rural population and agricultural land, and decreases in suspended sediment concentration and sediment load, with correlation coefficients (r) ranging from 0.94 to 0.99 [12]. These findings align with previous studies, suggesting that the soil erosion model developed in this study is reliable. Despite its scientific and applied significance, the study has some limitations. Runoff and erosion models are often used to make quantitative predictions and simulations of environmental interactions at various spatial and temporal scales. This study focuses on the period from 1990 to 2018, but due to the lack of adequate LULC input data, it was not possible to assess soil erosion and runoff intensity for earlier periods. The spatial aspect of the study did not include smaller areas within the studied watersheds, where the zones with the highest risk of soil erosion are located. The spatial aspect of the study did not account for microtopography within the watersheds, which may include zones at higher risk of soil erosion. Additionally, the model does not consider sources of sedimentation or initiation dynamics, and it lacks the ability to account for the seasonal variability of runoff and soil erosion, which are closely linked to vegetation dynamics.
Further efforts in this research can focus on developing a predictive model for the study regions to anticipate future trends in land-use changes and their consequences based on past changes. For instance, the CA–Markov model can be employed for this purpose [114]. To encompass all possible future changes, additional research could include demographic and climate projections as well.

5. Conclusions

This study examines the alterations in land use within watersheds located in the border areas of Central Serbia, which are crucial for comprehending their hydrological reactions to extreme rainfall events. The research delves into the spatiotemporal patterns of land-use modifications and their subsequent impact on runoff and erosion in the border highlands.
The study outcomes highlight the effects of population movements on changing land-use patterns, particularly the emigration from the border regions in Eastern and Southeastern Serbia in recent decades. These changes have led to a reduction in the runoff curve number of watersheds and a decrease in the intensity of soil erosion processes. The spatial differentiation of watersheds, based on CA and PCA, identified two distinct regions in terms of changes in runoff and soil erosion. The eastern and southeastern regions recorded a significant decrease in runoff and soil erosion intensity, as indicated by CN values, ranging from −3.21 to −0.13, and Index Z values, ranging from 30 to 84. These changes are linked to the rapid reduction of the rural population (average Index RP = 32) and agricultural land (average Index AgL = 34). In the watersheds of the western and southwestern regions, the rates of change in runoff and soil erosion are relatively small, with an average CN of −0.08 and an average Index Z of 98. This area demonstrates better development potential, with positive demographic capacity and a sustainable agricultural market.
The study identified significant statistical correlations among runoff, erosion, anthropogenic activities, and demographic factors. Consequently, the study provides results and insights that can serve as a foundation for enhanced strategies aimed at sustainable land management and risk mitigation in the border regions characterized by hilly–mountainous terrains vulnerable to torrential floods. The findings carry substantial social, economic (agricultural), and environmental implications.

Author Contributions

Conceptualization, A.M.P. and S.M.; methodology, A.M.P. and S.M.; validation, A.M.P. and S.M.; formal analysis, T.S. and N.Z.; investigation, T.S. and N.Z.; resources, A.M.P.; data curation, T.S., A.M.P., and N.Z.; writing—original draft preparation, A.M.P., S.M. and T.S.; writing—review and editing, A.M.P. and S.M.; visualization, T.S.; supervision, N.Z.; funding acquisition, A.M.P. All authors have read and agreed to the published version of the manuscript.

Funding

This work was supported by projects from the Ministry of Science, Technological Development and Innovations of the Republic of Serbia: No. 451-03-66/2024-03/200172 and No. 451-03-65/2024-03/200091. The costs for the publication of the article were partly covered by the Geographical Institute “Jovan Cvijić” SASA.

Data Availability Statement

The original contributions presented in the study are included in the article, further inquiries can be directed to the corresponding author.

Conflicts of Interest

The authors declare no conflicts of interest.

References

  1. Lukić, T.; Gavrilov, M.B.; Marković, S.B.; Komac, B.; Zorn, M.; Mlađan, D.; Đorđević, J.; Milanović, M.; Vasiljević, Đ.A.; Vujičić, M.D.; et al. Classification of the natural disasters between the legislation and application: Experience of the Republic of Serbia. Acta Geogr. Slov. 2013, 53, 149–164. [Google Scholar] [CrossRef]
  2. Suleymanov, R.; Kamalova, R.; Suleymanov, A.; Adelmurzina, I.; Nigmatullin, A.; Khamidullin, R.; Bakieva, E.; Yurkevich, M. Pedo-climatic changes of drained floodplain soils within the forest-steppe zone of the republic of Bashkortostan (Russia). J. Geogr. Inst. Cvijic 2023, 73, 295–309. [Google Scholar] [CrossRef]
  3. Shabani, M.; Darvishi, S.; Rabiei-Dastjerdi, H.; Ali Alavi, S.; Choudhury, T.; Solaimani, K. An Integrated Approach for Simulation and Prediction of Land Use and Land Cover Changes and Urban Growth (Case Study: Sanandaj City in Iran). J. Geogr. Inst. Cvijic 2022, 72, 273–289. [Google Scholar] [CrossRef]
  4. IPCC. Intergovernmental Panel on Climate Change IPCC (2014) Climate Change 2014: Synthesis report. In Contribution of Working Groups I, II and III to the Fifth Assessment Report of the Intergovernmental Panel on Climate Change; Core Writing Team, Pachauri, R.K., Meyer, L.A., Eds.; IPCC: Geneva, Switzerland, 2014; Available online: http://www.ipcc.ch/pdf/assessment-report/ar5/syr/SYR_AR5_FINAL_full_wcover.pdf (accessed on 15 April 2024).
  5. Lukić, T.; Micić Ponjiger, T.; Sakulski, D.; Gavrilov, M.; Markovic, S.; Zorn, M.; Komac, B.; Mlanović, M.; Pavić, D.; Mészáros, M.; et al. Rainfall erosivity in Vojvodina (North Serbia). Acta Geogr. Slov. 2021, 61, 123–153. [Google Scholar] [CrossRef]
  6. Kostadinov, S.; Zlatić, M.; Dragićević, S.; Novković, I.; Košanin, O.; Borisavljević, A.; Lakićević, M.; Mlađan, D. Antropogenic Influence on Erosion Intensity Changes in Rasina River Watershed Area upstream from “Ćelije” Water Reservoir, Central Serbia. Fresenius Environ. Bull. 2014, 23, 254–263. [Google Scholar]
  7. Smith, G. Development of a Flash Flood Potential Index Using Physiographic Data Sets within a Geographic Information System. Master’s Thesis, Department of Geography of the University of Utah, Salt Lake City, UT, USA, August 2010. Available online: https://collections.lib.utah.edu/details?id=192329 (accessed on 15 March 2024).
  8. Petrović, A.M.; Kostadinov, S.; Ristić, R.; Novković, I.; Radevski, I. The reconstruction of the great 2020 torrential flood in Western Serbia. Nat. Hazards 2023, 118, 1673–1688. [Google Scholar] [CrossRef]
  9. Durlević, U.; Novković, I.; Lukić, T.; Valjarević, A.; Samardžić, I.; Krstić, F.; Batoćanin, N.; Mijatov, M.; Ćurić, V. Multihazard susceptibility assessment: A case study – Municipality of Štrpce (Southern Serbia). Open Geosci. 2021, 13, 1414–1431. [Google Scholar] [CrossRef]
  10. Pereira, C.O.; Escanilla-Minchel, R.; González, A.C.; Alcayaga, H.; Aguayo, M.; Arias, M.A.; Flores, A.N. Assessment of Future Land Use/Land Cover Scenarios on the Hydrology of a Coastal Basin in South-Central Chile. Sustainability 2022, 14, 16363. [Google Scholar] [CrossRef]
  11. Prokešová, R.; Horáčková, Š.; Snopková, Z. Surface runoff response to long-term land use changes: Spatial rearrangement of runoff-generating areas reveals a shift in flash flood drivers. Sci. Total Environ. 2022, 815, 151591. [Google Scholar] [CrossRef]
  12. Manojlović, S.; Sibinović, M.; Srejić, T.; Hadud, A.; Sabri, I. Agriculture Land Use Change and Demographic Change in Response to Decline Suspended Sediment in Južna Morava River Basin (Serbia). Sustainability 2021, 13, 3130. [Google Scholar] [CrossRef]
  13. Guzha, A.C.; Rufino, M.C.; Okoth, S.; Jacobs, S.; Nóbrega, R.L.B. Impacts of land use and land cover change on surface runoff, discharge, and low flows: Evidence from East Africa. J. Hydrol. Reg. Stud. 2018, 15, 49–67. [Google Scholar] [CrossRef]
  14. Rajan, K.; Shibasaki, R. A GIS based integrated land use/cover change model to study human-land interactions. ISPRS Arch. 2000, 33, 1212–1219. [Google Scholar]
  15. Kroll, F.; Haase, D. Does demographic change affect land use patterns?: A case study from Germany. Land Use Policy 2010, 27, 726–737. [Google Scholar] [CrossRef]
  16. Battino, S.; Lampreu, S. The Role of the Sharing Economy for a Sustainable and Innovative Development of Rural Areas: A Case Study in Sardinia (Italy). Sustainability 2019, 11, 3004. [Google Scholar] [CrossRef]
  17. Diaz-Sarachaga, J.M. Combining Participatory Processes and Sustainable Development Goals to Revitalize a Rural Area in Cantabria (Spain). Land 2020, 9, 412. [Google Scholar] [CrossRef]
  18. Macdonald, D.; Ingersoll, C.G.; Berger, T. Development and Evaluation of Consensus-Based Sediment Quality Guidelines for Freshwater Systems. Arch. Environ. Contam. Toxicol. 2000, 39, 20–31. [Google Scholar] [CrossRef]
  19. Nikodemus, O.; Bell, S.; Grīne, I.; Liepiņš, I. The impact of economic, social and political factors on the landscape structure of the Vidzeme Uplands in Latvia. Landsc. Urban Plan. 2005, 70, 57–67. [Google Scholar] [CrossRef]
  20. Petek, F. Typology of Slovenia’s Alpine Region With Emphasis on Land Use and Changes in Land Use. AGS 2005, 45, 33–52. [Google Scholar] [CrossRef]
  21. Griffiths, P.; Müller, D.; Kuemmerle, T.; Hostert, P. Agricultural Land Change in the Carpathian Ecoregion after the Breakdown of Socialism and Expansion of the European Union. Environ. Res. Lett. 2013, 8, 045024. [Google Scholar] [CrossRef]
  22. Prishchepov, A.V.; Müller, D.; Dubinin, M.; Baumann, M.; Radeloff, V.C. Determinants of Agricultural Land Abandonment in post-Soviet European Russia. Land Use Policy 2013, 30, 873–884. [Google Scholar] [CrossRef]
  23. Golosov, V.; Yermolaev, O.; Litvin, L.; Chizhikova, N.; Kiryukhina, Z.; Safina, G. Influence of climate and land use changes on recent trends of soil erosion rates within the Russian Plain. Land Degrad. Dev. 2018, 29, 2658–2667. [Google Scholar] [CrossRef]
  24. Gatarić, D.; Đerčan, B.; Živković, M.B.; Ostojić, M.; Manojlović, S.; Sibinović, M.; Lukić, T.; Jeftić, M.; Lutovac, M.; Lutovac, M. Can Depopulation Stop Deforestation? The Impact of Demographic Movement on Forest Cover Changes in the Settlements of the South Banat District (Serbia). Front. Environ. Sci. 2022, 10, 897201. [Google Scholar] [CrossRef]
  25. Tsegaye, L.; Bharti, R. Assessment of the effects of agricultural management practices on soil erosion and sediment yield in Rib watershed, Ethiopia. IJEST 2023, 20, 503–520. [Google Scholar] [CrossRef]
  26. Hinojosa, L.; Napoléone, C.; Moulery, M.; Lambin, E.F. The “mountain effect” in the abandonment of grasslands: Insights from the French Southern Alps. Agric. Ecosyst. Environ. 2016, 221, 115–124. [Google Scholar] [CrossRef]
  27. Hurni, H.; Tato, K.; Zeleke, G. The implications of changes in population, land use, and land management for surface runoff in the upper Nile basin area of Ethiopia. Mt. Res. Dev. 2005, 25, 147–154. [Google Scholar] [CrossRef]
  28. Hurni, H.; Herweg, K.; Portner, B.; Liniger, H. Soil erosion and conservation in global agriculture. In Land Use Soil Resources; Braimoh, A.K., Vlek, P.L.G., Eds.; Springer: Dordrecht, The Netherlands, 2008; pp. 41–71. [Google Scholar] [CrossRef]
  29. Kidane, M.; Bezie, A.; Kesete, N.; Tolessa, T. The impact of land use and land cover (LULC) dynamics on soil erosion and sediment yield in Ethiopia. Heliyon 2019, 5, e02981. [Google Scholar] [CrossRef]
  30. Tianming, G.; Ivolga, A.; Erokhin, V. Sustainable Rural Development in Northern China: Caught in a Vice between Poverty, Urban Attractions, and Migration. Sustainability 2018, 10, 1467. [Google Scholar] [CrossRef]
  31. Yu, Q.; Feng, C.C.; Xu, N.; Guo, L.; Wang, D. Quantifying the Impact of Grain for Green Program on Ecosystem Service Management: A Case Study of Exibei Region, China. Int. J. Environ. Res. Public Health 2019, 16, 2311. [Google Scholar] [CrossRef] [PubMed]
  32. Zhong, X.; Jiang, X.; Li, L.; Xu, J.; Xu, H. The Impact of Socio-Economic Factors on Sediment Load: A Case Study of the Yanhe River Watershed. Sustainability 2020, 12, 2457. [Google Scholar] [CrossRef]
  33. Horvat, U.; Žiberna, I. The Correlation Between Demographic Development and Land-Use Changes in Slovenia. AGS 2020, 60, 33–55. [Google Scholar] [CrossRef]
  34. Nikitović, V. Approaching Regional Depopulation in Serbia. In Geography of Serbia; World Regional Geography Book Series; Manić, E., Nikitović, V., Djurović, P., Eds.; Springer: Cham, Germany, 2022; pp. 169–181. [Google Scholar] [CrossRef]
  35. Joksimović, M.; Golić, R.; Krstić, F.; Malinić, V.; Vujadinović, S.; Šabić, D.; Gajić, M.; Nikolić, O.; Momčilović Petronijević, A.; Nikolić, V. Depopulacioni klaster—naselja sa 20 i manje stanovnika u Srbiji [Depopulation cluster: Settlements with 20 or less inhabitants in Serbia]. Demografija 2023, 20, 99–118. [Google Scholar] [CrossRef]
  36. Dabović, T.; Pjanović, B.; Tošković, O.; Djordjević, D.; Lukić, B. Experts’ Perception of the Key Drivers of Land-Use/Land-Cover Changes in Serbia from 1990 to 2012. Sustainability 2021, 13, 7771. [Google Scholar] [CrossRef]
  37. Pjanović, B.; Dabović, T.; Tomić, T.; Đordjević, D. Assessment of the importance of the importance of the drivers of land-use/land-cover changes on the national level: The case of Serbia. Fresenius Environ. Bull. 2022, 31, 9741–9754. [Google Scholar]
  38. Manojlović, S.; Srejić, T.; Sibinović, M.; Milošević, M.; Bajat, B.; Kostadinov, K. Impact of precipitation and human activities on suspended sediment transport load in the Velika Morava River Basin (Serbia). Arab. J. Geosci. 2022, 15, 1209. [Google Scholar] [CrossRef]
  39. Srejić, T.; Manojlović, S.; Sibinović, M.; Bajat, B.; Novković, I.; Milošević, M.V.; Carević, I.; Todosijević, M.; Sedlak, M.G. Agricultural Land Use Changes as a Driving Force of Soil Erosion in the Velika Morava River Basin, Serbia. Agriculture 2023, 13, 778. [Google Scholar] [CrossRef]
  40. Malić Sibinović, A.; Sibinović, M.; Ratkaj, I.; Gatarić, D.; Budović, A.; Jocić, N. Functional typology of settlements in the Srem region, Serbia. Open Geosci. 2024, 16, 20220646. [Google Scholar] [CrossRef]
  41. Stojanović, Ž. Agriculture in Serbia. In The Geography of Serbia; Springer: Berlin/Heidelberg, Germany, 2022; pp. 199–206. [Google Scholar]
  42. Stankov, U.; Klaučo, M.; Dragićević, V.; Vujičić, M.D.; Solarević, M. Assessing land-use changes in tourism area on the example of Čajetina municipality (Serbia). Geogr. Pannonica 2016, 20, 105–113. [Google Scholar] [CrossRef]
  43. Perović, V.; Jakšić, D.; Jaramaz, D.; Koković, N.; Čakmak, D.; Mitrović, M.; Pavlović, P. Spatio-temporal analysis of land use/land cover change and its effects on soil erosion (Case study in the Oplenac wine-producing area, Serbia). Environ. Monit. Assess. 2018, 190, 675. [Google Scholar] [CrossRef]
  44. Petrović, A.M. Bujične Poplave u Srbiji [Torrential Floods in Serbia]; Serbian Geographical Society: Belgrade, Serbia, 2021; Available online: https://www.researchgate.net/publication/355646649_Bujicne_poplave_u_Srbiji_-_Torrential_floods_in_Serbia (accessed on 15 April 2024).
  45. Milovanović, B.; Schuster, P.; Radovanović, M.; Ristić Vkanjac, V.; Schneider, C. Spatial and temporal variability of precipitation in Serbia for the period 1961–2010. Theor. Appl. Climatol. 2017, 130, 687–700. [Google Scholar] [CrossRef]
  46. One Geology. Available online: https://data.europa.eu/data/datasets/geologija-srbije-1-500000-projekat-jedna-geologija-onegeology?locale=en (accessed on 12 January 2024).
  47. Yugoslav Society of Soil Science. Soil Map of Yugoslavia; Yugoslav Society of Soil Science: Belgrade, Serbia, 1959. [Google Scholar]
  48. Soil Conservation Service. Hydrology, National Engineering Handbook; Soil Conservation Service: Washington, DC, USA, 1956. [Google Scholar]
  49. Djorović, M. Determination of soil Hydrologic class. Vodoprivreda 1984, 87, 57–60. (In Serbian) [Google Scholar]
  50. QGIS Development Team. QGIS Geographic Information System, Version 3.16. Open Source Geospatial Foundation Project. 2020. Available online: http://qgis.osgeo.org (accessed on 15 January 2024).
  51. Military Geographic Institute. Topographic Maps (1:25000). Available online: https://www.vgi.mod.gov.rs/lat/35/topografske-karte-35 (accessed on 15 January 2024).
  52. European Environment Agency (2016) European Digital Elevation Model (EU-DEM 25 m, Version 1.1). Available online: https://land.copernicus.eu/imagery-in-situ/eu-dem/eu-dem-v1.1 (accessed on 18 May 2022).
  53. European Environment Agency, CORINE (Coordination of Information on the Environment) Land Cover 2018 (Version 2020, 20u1). Available online: https://land.copernicus.eu/en/products/corine-land-cover/clc2018 (accessed on 17 May 2022).
  54. European Environment Agency. CORINE (Coordination of Information on the Environment) Land Cover 1990 (Version 2020, 20u1). 2020. Available online: https://land.copernicus.eu/en/products/corine-land-cover/clc-1990 (accessed on 15 September 2023).
  55. Aune-Lundberg, L.; Strand, G.-H. The content and accuracy of the CORINE Land Cover dataset for Norway. Int. J. Appl. Earth Obs. Geoinf. 2020, 96, 102266. [Google Scholar] [CrossRef]
  56. Santos-Alamillos, F.; Pozo-Vazquez, D.; Ruiz-Arias, J.; Tovar-Pescador, J. Influence of land-use misrepresentation on the accuracy of WRF wind estimates: Evaluation of GLCC and CORINE land-use maps in southern Spain. Atmos. Res. 2015, 157, 17–28. [Google Scholar] [CrossRef]
  57. Sangin, E.; Mishra, S.K.; Patil, P.R. Analogy Between SCS-CN and Muskingum Methods. Water Resour. Manag. 2024, 38, 153–171. [Google Scholar] [CrossRef]
  58. Mrozik, K. Assessment of retention potential changes as an element of suburbanization monitoring on the example of an ungauged catchment in Poznań metropolitan area (Poland). Rocz. Ochrona Sr. 2016, 18, 188–200. [Google Scholar]
  59. Petrović, A.M.; Novković, I.; Kostadinov, S. Hydrological analysis of the September 2014 torrential floods of the Danube tributaries in Eastern Serbia. Nat. Hazards 2021, 108, 1373–1387. [Google Scholar] [CrossRef]
  60. Institute for the Development of Water Resources “Jaroslav Cerni” and Republic Hydrometeorologic Service of Serbia, Hydrometeorological Data, Water Resources Assessment of Serbia, 2009 (In Serbian). Available online: https://www.srbijavode.rs/images/dokumenti/vodoprivredna_osnova_republike_srbije.pdf (accessed on 15 March 2024).
  61. Alewell, C.; Borrelli, P.; Meusburger, K.; Panagos, P. Using the USLE: Chances, challenges and limitations of soil erosion modelling. Int. Soil Water Conserv. Res. 2019, 7, 203–225. [Google Scholar] [CrossRef]
  62. Borrelli, P.; Alewell, C.; Alvarez, P.; Anache, J.; Baartman, J.; Ballabio, C.; Bezak, N.; Biddoccu, M.; Cerda, A.; Chalise, D. Soil erosion modelling: A global review and statistical analysis. Sci. Total Environ. 2021, 780, 146494. [Google Scholar] [CrossRef]
  63. Batista, P.V.G.; Davies, J.; Silva, M.L.N.; Quinton, J.N. On the evaluation of soil erosion models: Are we doing enough? Earth-Sci. Rev. 2019, 197, 102898. [Google Scholar] [CrossRef]
  64. Gavrilović, S. Inženjering o bujičnim tokovima i eroziji [Engineering of torrents and erosion]. J. Constr. (Special Issue) 1972, 1–292. (In Serbian) [Google Scholar]
  65. Efthimiou, N.; Lykoudi, E.; Panagoulia, D.; Karavitis, C. Assessment of Soil Susceptibility to Erosion Using the EPM and RUSLE MODELS: The Case of Venetikos River Catchment. Glob. NEST J. 2016, 18, 164–179. [Google Scholar]
  66. Tošić, R. Sliv akumulacije Drenova (Erozioni Procesi i Zasipanje Akumulacija); [Drenova reservoir basin (Erosion processes and filling of reservoirs with sediment)]; Geografsko društvo Republike Srpske: Banja Luka, Bosnia and Herzegovina, 2012; Special Issue 27; pp. 1–356. [Google Scholar]
  67. Bezak, N.; Borrelli, P.; Mikoš, M.; Jemec Auflič, M.; Panagos, P. Towards multi-model soil erosion modelling: An evaluation of the erosion potential method (EPM) for global soil erosion assessments. CATENA 2024, 234, 107596. [Google Scholar] [CrossRef]
  68. Ali, S.; Al-Umary, F.A.; Salar, S.G.; Al-Ansari, N.; Knutsson, S. GIS-Based Soil Erosion Estimation Using EPM Method, Garmiyan Area, Kurdistan Region, Iraq. J. Civ. Eng. Archit. 2016, 10, 291–308. [Google Scholar]
  69. Raza, A.; Ahrends, H.; Habib-Ur-Rahman, M.; Gaiser, T. Modeling Approaches to Assess Soil Erosion by Water at the Field Scale with Special Emphasis on Heterogeneity of Soils and Crops. Land 2021, 10, 422. [Google Scholar] [CrossRef]
  70. De Vente, J.; Poesen, J. Predicting soil erosion and sediment yield at the basin scale: Scale issue and semiquantitative models. Earth-Sci. Rev. 2005, 71, 95–125. [Google Scholar] [CrossRef]
  71. Ouallali, A.; Aassoumi, H.; Moukhchane, M.; Moumou, A.; Houssni, M.; Spalević, V.; Keesstra, S. Sediment mobilization study on Cretaceous, Tertiary and Quaternary lithological formations of an external Rif catchment, Morocco. Hydrol. Sci. J. 2020, 65, 1568–1582. [Google Scholar] [CrossRef]
  72. Zeghmar, A.; Marouf, N.; Mokhtari, E. Assessment of soil erosion using the GIS-based erosion potential method in the Kebir Rhumel Watershed, Northeast Algeria. J. Water Land Dev. 2022, 52, 133–144. [Google Scholar] [CrossRef]
  73. Haghizadeh, A.; Shui, L.T.; Godarzi, E. Forecasting sediment with erosion potential method with emphasis on land use changes at the basin. Electron. J. Geotech. Eng. 2009, 14, 1–12. [Google Scholar]
  74. Tavares, A.S.; Spalević, V.; Avanzi, J.C.; Alves, D. Modeling of water erosion by the erosion potential method in a pilot subbasin in southern Minas Gerais. Semina Cienc. Agrar. 2019, 40, 555–572. [Google Scholar] [CrossRef]
  75. Dragičević, N.; Karleuša, B.; Ožanić, N. Erosion potential method (Gavrilović Method) sensitivity analysis. Soil Water Res. 2017, 12, 51–59. [Google Scholar] [CrossRef]
  76. Stefanidis, S.; Stathis, D. Effect of climate change on soil erosion in a mountainous Mediterranean catchment (Central Pindus, Greece). Water 2018, 10, 1469. [Google Scholar] [CrossRef]
  77. Spalević, V. Assessment of soil erosion processes by using the ‘IntErO’model: A case study of the Duboki Potok, Montenegro. J. Environ. Prot. Ecol. 2019, 20, 657–665. [Google Scholar]
  78. Chalise, D.; Kumar, L.; Spalevic, V.; Skataric, G. Estimation of sediment yield and maximum outflow using the IntErO model in the Sarada river basin of Nepal. Water 2019, 11, 952. [Google Scholar] [CrossRef]
  79. Lazarević, R. Erosion in Serbia; Želnid: Belgrade, Serbia, 2009; pp. 1–294. [Google Scholar]
  80. Veličković, N.; Todosijević, M.; Šulić, D. Erosion Map Reliability Using a Geographic Information System (GIS) and Erosion Potential Method (EPM): A Comparison of Mapping Methods, Belgrade Peri-Urban Area, Serbia. Land 2022, 11, 1096. [Google Scholar] [CrossRef]
  81. Krstić, F.; Paunović, S. Changes in Soil Erosion Intensity in Jablanica Region. Zbornik radova—Geografski fakultet Univerziteta u Beogradu 2022, 70, 83–93. [Google Scholar] [CrossRef]
  82. Manojlović, S.; Antić, M.; Sibinović, M.; Dragićević, S.; Novković, I. Soil erosion response to demographic and land use changes in the Nišava River basin, Serbia. Fresenius Environ. Bull. 2017, 26, 7547–7560. [Google Scholar]
  83. Polovina, S.; Radić, B.; Ristić, R.; Milčanović, V. Spatial and temporal analysis of natural resources degradation in the Likodra River watershed. Bull. Fac. Fore. 2016, 114, 169–188. [Google Scholar] [CrossRef]
  84. Stefanović, I.; Ristić, R.; Dragović, N.; Stefanović, M.; Živanović, N.; Čotrić, J. Effects of Erosion Control Works: Case Study–Reservoir Celije, Rasina River Basin, the Zapadna Morava River (Serbia). Water 2024, 16, 855. [Google Scholar] [CrossRef]
  85. Gocić, M.; Dragićević, S.; Živanović, S.; Ivanović, R.; Martić Bursać, N.; Stričević, L.; Radivojević, A.; Živković, J. Assessment of soil erosion intensity in the Kutinska River Basin in the period 1971-2016. Fresenius Environ. Bull. 2021, 30, 10890–10898. [Google Scholar]
  86. USGS-Science for a Changing World (EarthExplorer). Available online: https://earthexplorer.usgs.gov (accessed on 12 September 2023).
  87. Novković, I. Natural Conditions as Determinants of Geohazards on the Example of Ljig, Jošanička, and Vranjskobanjska River Basins. Ph.D. Thesis, University of Belgrade, Faculty of Geography, Belgrade, Serbia, 2016. [Google Scholar]
  88. Basic Geological Map of Former Yugoslavia 1:100000; Federal Geological Survey: Belgrade, Serbia, 1978.
  89. Statistical Office of the Republic of Serbia 1961–2022. Available online: http://www.stat.gov.rs (accessed on 25 January 2024).
  90. Raux, J.; Copard, Y.; Laignel, B.; Fournier, M.; Masseï, N. Classification of worldwide drainage basins through the multivariate analysis of variables controlling their hydrosedimentary response. Glob. Planet. Chang. 2011, 76, 117–127. [Google Scholar] [CrossRef]
  91. Andrade, E.M.; Palácio, H.A.Q.; Souza, I.H.; Leão, R.A.D.; Guerreiro, M.J. Land use effects in groundwater composition of an alluvial aquifer (Trussu River, Brazil) by multivariate techniques. Environ. Res. 2008, 106, 170–177. [Google Scholar] [CrossRef]
  92. Chen, J.; Li, F.; Fan, Z.; Wang, Y. Integrated Application of Multivariate Statistical Methods to Source Apportionment of Watercourses in the Liao River Basin, Northeast China. Int. J. Environ. Res. Public Health 2016, 13, 1035. [Google Scholar] [CrossRef] [PubMed]
  93. Landau, S.; Everitt, B.S. A Handbook of Statistical Analyses Using SPSS; Chapman and Hall/CRC: Boca Raton, FL, USA, 2003. [Google Scholar]
  94. Pallant, J. SPSS Survival Manual: A Step-by-Step Guide to Data Analysis Using SPSS; Allen & Unwin: Crows Nest, NSW, Australia, 2005. [Google Scholar]
  95. Wuttichaikitcharoen, P.; Babel, M.S. Principal component and multiple regression analyses for the estimation of suspended sediment yield in ungauged basins of northern Thailand. Water 2014, 6, 2412–2435. [Google Scholar] [CrossRef]
  96. Bartlett, M.S. A note on the multiplying factors for various chi square approximations. J. R. Statist. Soc. 1954, 16, 296–298. [Google Scholar] [CrossRef]
  97. Kaiser, H. An index of factorial simplicity. Psychometrika 1974, 39, 31–36. [Google Scholar] [CrossRef]
  98. Ristić, R.; Gavrilović, Z.; Stefanović, M.; Malušević, I.; Milovanović, I. Effects of urbanization on the appearance of floods. In Proceedings of the International Conference BALWOIS, Ohrid, Macedonia, 23–28 May 2006; p. 7. [Google Scholar]
  99. Ristić, R.; Radić, B.; Vasiljević, N.; Nikić, Z. Land use change for flood protection—A prospective study for the restoration of the river Jelašnica watershed. Bull. Fac. For. 2011, 103, 115–130. [Google Scholar] [CrossRef]
  100. Kostadinov, S.; Braunović, S.; Dragićević, S.; Zlatić, M.; Dragović, N.; Rakonjac, N. Effects of Erosion Control Works: Case Study—Grdelica Gorge, the South Morava River (Serbia). Water 2018, 10, 1094. [Google Scholar] [CrossRef]
  101. García-Ruiz, J.M.; Lana-Renault, N. Hydrological and erosive consequences of farmland abandonment in Europe, with special reference to the Mediterranean region—A review. Agric. Ecosyst. Environ. 2011, 140, 317–338. [Google Scholar] [CrossRef]
  102. Bański, J. Agriculture of Central Europe in the Period of Economic Transformation. J. Rural. Stud. 2008, 15, 9–22. [Google Scholar]
  103. Sibinović, M. Structural changes in the rural planting areas of Belgrade region. Bull. Serb. Geogr. Soc. 2012, 92, 112–132. [Google Scholar] [CrossRef]
  104. Kokotović Kanazir, V. Small Cities—Demographic Potential of Serbia; Geographical Institute “Jovan Cvijić”, SASA: Belgrade, Serbia, 2016; pp. 1–126. [Google Scholar]
  105. Remote Detection of (De)population Processes in Serbia. Available online: https://depopulacija.rs/ (accessed on 19 March 2024).
  106. Nikitović, V.; Bajat, B.; Blagojević, D. Spatial patterns of recent demographic trends in Serbia (1961–2010). Geografie 2016, 121, 521–543. [Google Scholar] [CrossRef]
  107. Bogdanov, N.; Vasiljević, Z. Role of agriculture and multifunctional rural development in Serbia. APSTRACT 2011, 5, 47–55. [Google Scholar] [CrossRef]
  108. Gocić, M.; Dragićević, S.; Radivojević, A.; Martić Bursać, N.; Stričević, L.; Ðordević, M. Changes in soil erosion intensity caused by land use and demographic changes in the Jablanica River Basin, Serbia. Agriculture 2020, 10, 345. [Google Scholar] [CrossRef]
  109. Manojlović, S.; Antić, M.; Šantić, D.; Sibinović, M.; Carević, I.; Srejić, T. Anthropogenic Impact on Erosion Intensity: Case Study of Rural Areas of Pirot and Dimitrovgrad Municipalities, Serbia. Sustainability 2018, 10, 826. [Google Scholar] [CrossRef]
  110. Andjelković Stoiljković, M. Representation of the demographic problem of the Serbian border region in public policy. Demography 2019, 16, 103–118. [Google Scholar] [CrossRef]
  111. Gajić, A.; Krunić, N.; Protić, B. Classification of Rural Areas in Serbia: Framework and Implications for Spatial Planning. Sustainability 2021, 13, 1596. [Google Scholar] [CrossRef]
  112. Djurkin, D.; Antić, M.; Djordjević, D.Ž. Demographic Aspects of Urban Shrinkage in Serbia: Trajectory, Variety, and Drivers of Shrinking Cities. Sustainability 2023, 15, 15961. [Google Scholar] [CrossRef]
  113. Wynants, M.; Solomon, H.; Ndakidemi, P.; Blake, W.H. Pinpointing areas of increased soil erosion risk following land cover change in the Lake Manyara catchment, Tanzania. Int. J. Appl. Earth Obs. Geoinf. 2018, 71, 1–8. [Google Scholar] [CrossRef]
  114. Nouri, J.; Gharagozlou, A.; Arjmandi, R.; Faryadi, S.; Adl, M. Predicting Urban Land Use Changes Using a CA–Markov Model. Arab. J. Sci. Eng. 2014, 39, 5565–5573. [Google Scholar] [CrossRef]
Figure 1. Research area.
Land 13 01342 g001
Figure 2. Changes in CLC from 1990 to 2018, along with the corresponding curve number (CN) values for the watersheds of Sinja River in Eastern (a) and Poganovska River in Southeastern Serbia (b).
Land 13 01342 g002
Figure 3. Trends of annual runoff coefficient for selected watersheds.
Land 13 01342 g003
Figure 4. Computed maximal discharges for the Podvrška River based on the state of land use in the years 1990 and 2018.
Land 13 01342 g004
Figure 5. Classification of the erosion classes based on the Z coefficient. The mean erosion coefficient (Z) in 1990 (a) and 2018 (b). Legend: very weak erosion—Category V (Z = 0.01–0.20); weak erosion—Category IV (Z = 0.21–0.40); medium erosion—Category III (Z = 0.41–0.70); intensive erosion—Category II (Z = 0.71–1.00); excessive erosion—Category I (Z > 1.01); (1) Western and Southwestern Serbia; (2) Eastern and Southeastern Serbia.
Land 13 01342 g005
Figure 6. Changes in erosion coefficient (Index Z) for the period 1990–2018. Legend: (1) Western and Southwestern Serbia; (2) Eastern and Southeastern Serbia.
Land 13 01342 g006
Figure 7. Dendrogram representing watershed classification by cluster analysis (CA). Algorithms: Dissimilarity—Euclidian distance; Agglomeration method—Ward’s method.
Land 13 01342 g007
Figure 8. The spatial distribution of the watersheds using cluster analysis (CA). Legend: (1) Western and Southwestern Serbia; (2) Eastern and Southeastern Serbia.
Land 13 01342 g008
Figure 9. Rural population (RP) in watersheds 1991 (a) and 2022 (b). Legend: (1) Western and Southwestern Serbia; (2) Eastern and Southeastern Serbia.
Land 13 01342 g009
Figure 10. Agricultural land (AgL, ha) in watersheds 1991 (a) and 2012 (b). Legend: (1) Western and Southwestern Serbia; (2) Eastern and Southeastern Serbia.
Land 13 01342 g010
Figure 11. Changes in rural population (Index RP) for the period 1991–2022 (a) and changes in agricultural land (Index AgL) for the period 1991–2012 (b). Legend: (1) Western and Southwestern Serbia; (2) Eastern and Southeastern Serbia.
Land 13 01342 g011
Table 2. Correlation matrix (Pearson (n)) and p-values for changes in runoff (CN), erosion coefficient (Index Z), deagrarianisation process (Index AgL), and depopulation process (index RP). Values in bold differ from 0 with a significance level α = 0.05.
VariablesCN ChangeIndex
Z
Index AgLIndex
RP
CN ChangeIndex
Z
Index AgLIndex
RP
CN change1 0
Index Z0.8471 <0.00010
Index AgL0.4910.5801 0.0011<0.00010
Index RP0.5200.6290.65010.0005<0.0001<0.00010
Table 3. Contribution of the variables (%) and squared cosines of the dominant variables (in bold) after Varimax rotation for selected watersheds.
VariableD1 (%)D2 (%)D3 (%)D4 (%)
CN change62.27 (0.878)4.044.386.86
Index Z29.886.848.9783.03 (0.414)
Index AgL3.5779.29 (0.833)9.054.42
Index RP4.299.8377.59 (0.808)5.69
Table 4. Factor scores after Varimax rotation for studied watersheds.
Cluster/IdWatershedD1D2D3D4
C1/1Boljetinska reka0.1999−0.15940.0977−0.9710
C1/3Velika Kamenička0.1732−1.78101.6028−0.4786
C1/4Zamna0.9864−0.2913−0.1682−0.5214
C1/2Podvrška−0.3161−0.61770.3585−0.1738
C1/6Jelašnička−0.20490.8880−0.6241−0.9903
C1/12Visočica−0.26872.5355−1.8966−0.4537
C1/11Rosomačka−0.66961.0370−1.1265−0.6820
C1/22Jelašnica−0.87710.34480.8865−1.1850
C1/15Lužnica1.0280−0.7158−0.49900.2680
C1/20Romanovska0.39190.5456−1.6456−0.0639
C1/21Masurička0.1433−0.11641.0036−0.9830
C1/17Vlasina0.50280.3690−1.0762−0.2909
C1/25Ljubatska0.8601−0.5686−0.7857−0.1617
C2/8Trgoviški Timok0.1974−0.7228−0.6420−0.4891
C2/5Koritska−0.4730−0.5756−0.65410.0799
C2/7Sinja reka−3.9914−0.68780.50832.2138
C2/9Toplodolska reka−2.2288−0.6507−0.24080.4043
C2/10Dojkinačka−1.1121−0.6349−0.58270.4792
C2/18Jerma0.6250−1.2654−0.4228−1.4356
C2/13Poganovska reka−0.1488−0.4114−0.4894−1.5743
C2/23Korbevačka−1.59080.1521−0.1043−1.2754
C2/14Prisjanska−0.5942−0.6965−0.6268−1.1568
C2/16Ravna reka−0.7003−0.6992−0.5904−0.2241
C2/24Banjska−0.3260−0.32190.2468−1.9888
C2/19Vrla−0.1653−0.7410−0.0723−1.2433
C3/29Raška0.54370.92400.68500.6120
C3/26Jošanica0.3800−0.91642.88680.2966
C3/35Rogačica0.76060.2832−0.52201.0425
C3/36Trešnjica−0.42150.7649−0.33001.6418
C3/40Radaljska1.2450−1.36260.89930.6618
C3/30Poblačnica0.52560.4652−1.04541.4050
C3/39Boranjska 1.3925−1.0518−0.03020.8595
C3/37Bukovička reka0.1068−0.23660.01391.6373
C3/38Gračanička reka−0.40840.3437−0.14371.6845
C3/31Jablanica1.2039−0.0557−0.78000.9921
C3/33Kamišna1.23750.4825−0.75680.9195
C3/34Pilica0.70530.48670.13650.8419
C3/41Štira 0.8148−1.01260.86961.0385
C4/28Vidrenjak0.74462.11801.8185−0.2965
C4/27Godulja−0.36992.33731.9070−0.2791
C4/32Crni Rzav0.09842.21551.9349−0.1603
Disclaimer/Publisher’s Note: The statements, opinions and data contained in all publications are solely those of the individual author(s) and contributor(s) and not of MDPI and/or the editor(s). MDPI and/or the editor(s) disclaim responsibility for any injury to people or property resulting from any ideas, methods, instructions or products referred to in the content.

