Article

Rediscovering Valley Hillslopes: Their Forms, Uses, and Considerations in Urban Planning Documents

1
Laplec (UR SPHERES), Department of Geography, University of Liège, 4000 Liège, Belgium
2
URA, Faculty of Architecture, University of Liège, 4000 Liège, Belgium
*
Author to whom correspondence should be addressed.
Land 2024, 13(9), 1353; https://doi.org/10.3390/land13091353
Submission received: 12 July 2024 / Revised: 21 August 2024 / Accepted: 23 August 2024 / Published: 25 August 2024
(This article belongs to the Special Issue Human–Nature Relations in Urban Landscape Planning)

Abstract

:
Re-considering the interactions between society and natural resources is fundamental in pursuing sustainability and adaptation to climate change in cities. The representation in urban planning instruments reveals an inadequate consideration of valley hillslopes as interface systems or as ‘places’ with possible multiple roles and meanings for populations. Beyond landslide and flooding considerations, valley hillslopes are scarcely identified as distinct entities from the valley and the plateau, investigated as sites of diverse possible uses, and analysed in terms of which variables related to the relief’s forms influence their use. Confronting urban planning instruments that reduce slopes to building spaces, this contribution advocates for a specific representation of valley hillslopes, highlighting the environment’s variety within which the system interacts, the diversity of uses, and the interrelationships between form and land cover. By combining GIS mapping and statistical analysis, this research proposes a multi-scalar approach based on identifying valley hillslopes delineated through minimum units (geochore), integrated with land cover clustering and an analysis of the potential relations between land cover and six explanatory variables. The research points out the singularity and complexity of valley hillslopes, which should be incorporated into urban planning policy as potential cultural, ecological, or recreational resources for populations.

1. Introduction

1.1. Valley Hillslopes’ Resources

Last century’s urbanisation has generally paid little attention to understanding landscape forms and resources. Valley hillslopes are little explored in the broader set of landform categories, especially in northern Europe. However, they frequently host the remaining green spaces, which are increasingly converted for new allotments while being sought for recreational activity and biodiversity and used as shelters by homeless people. The topic of valley hillslopes, and more generally of slopes in urban areas, receives little attention in the literature, apart from sectorial disciplinary considerations, aimed at an examination of the seasonal variation of land cover [1], the definition of tools to plan preventive actions for high-risk areas [2], the acquisition of information on the spatial distribution of mass movements in urban [3,4,5,6] or regional areas [7], and the study of the effects of urbanisation on hydrology and stream quality in hill catchments [8,9]. In the ‘History of the Italian agrarian landscape’, Sereni [10] recalls how the valley hillslope is an expression of an intermediate boundary dimension in the continuity of urban and peri-urban landscape that has always conditioned how the soil is used, modified and rewritten, both by human culture and by the transformations induced over time by natural agents. In analysing Western European landscapes, Steenbergen [11] shows how landscape design has always exerted a powerful influence on the development of urban sites by including hillslopes as a variable influencing urban structure. Often observed in oppositional terms, valley hillslopes are seen as a barrier. Nevertheless, the value of valley hillslopes is again being rediscovered, both as an opportunity to connect ecological networks through an interface system [12,13,14] and as a relevant factor in the distribution of land use, which is useful for revealing heritages, memories of past uses and patterns of activities, which should nourish future urban planning processes [15]. As a cultural and ecological resource, valley hillslopes can be a “place” where the search for a new balance between humans and the environment can unfold, with multiple roles and meanings for populations, beyond the sectorial and mono-functional consideration of slopes [16,17,18,19]. This research isolates this specific landscape feature, giving it the attention it lacks, before reintroducing its analysis into urban metabolism. The scarce analysis of valley hillslopes generally reveals a fragmented framework and, more specifically, inadequate attention to specific points, which this contribution and research questions aim to address, as follows:
  • Identifying—and consequently representing—the valley hillslope as an autonomous whole and, at the same time, interfacing with the valley and plateau areas;
  • Adopting a multi-scalar approach to investigate the possible multiplicity and co-presence of uses and, therefore, in perspective, the possible valley hillslopes’ roles and meanings in an urban context;
  • Questioning the valley hillslope—beyond landslide and flooding—to analyse which variables related to its forms influence its use.

1.2. Valley Hillslopes’ Representation in Urban Planning

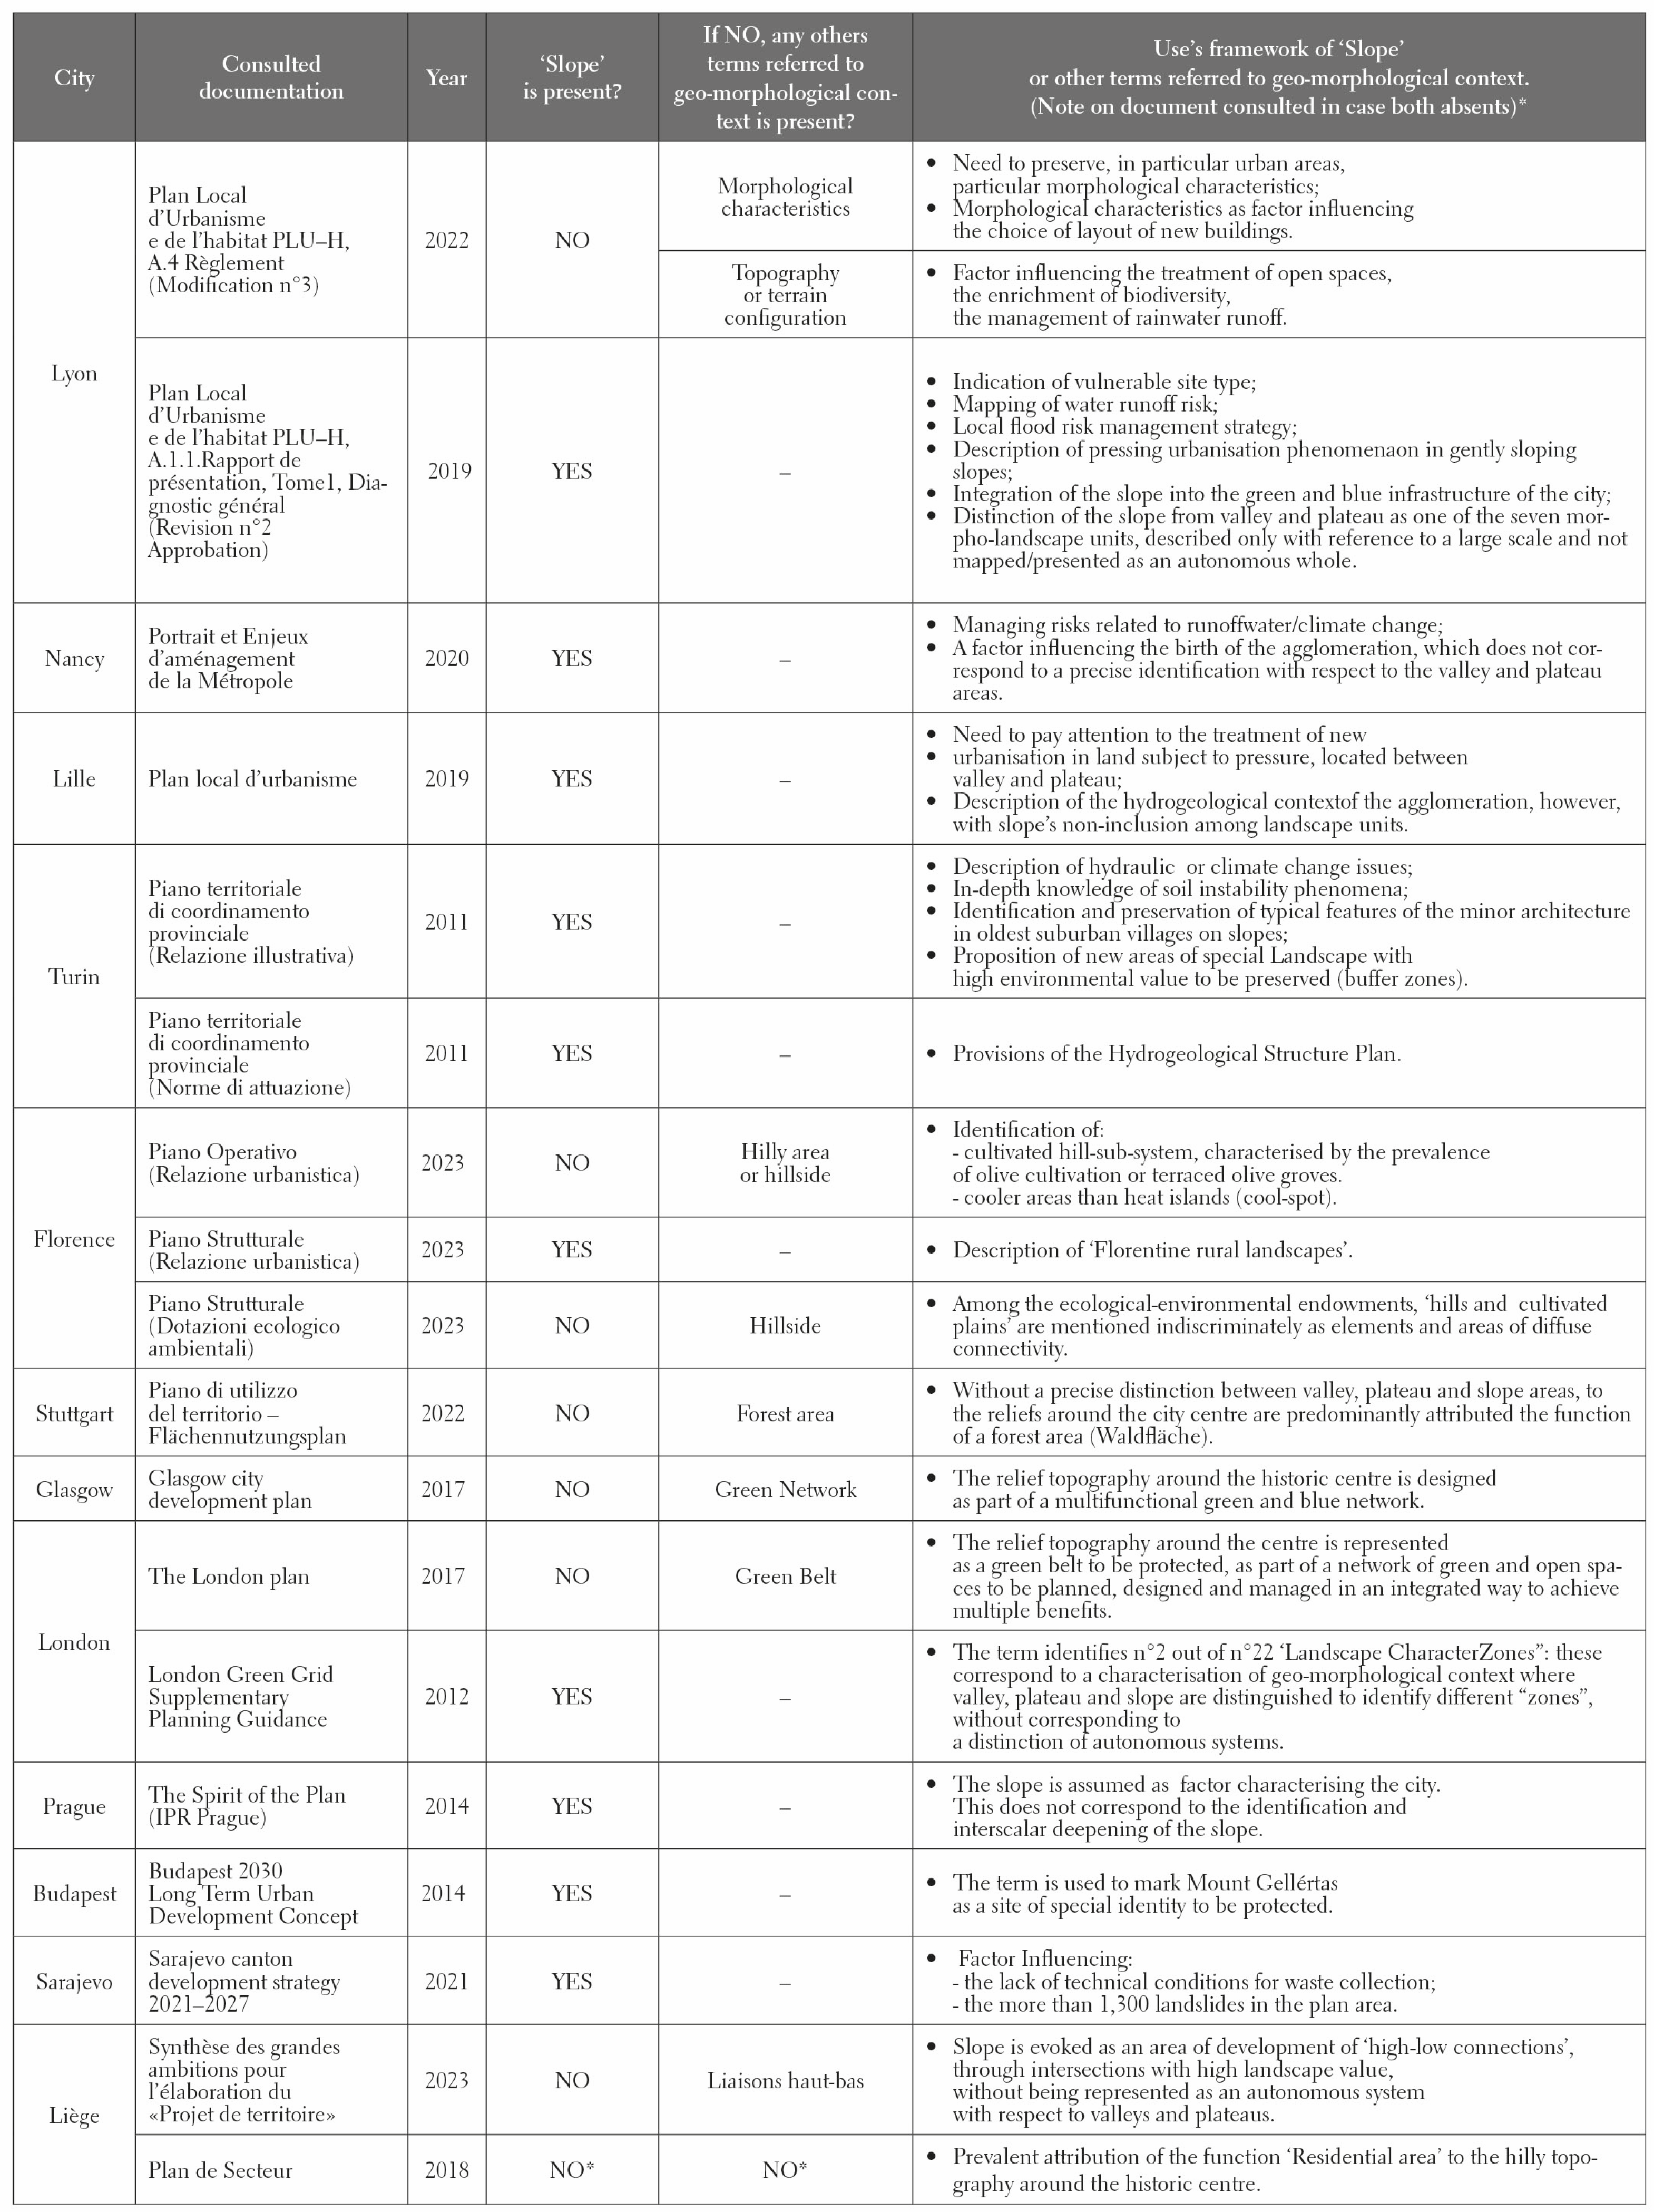
Focusing on the relationship between urban planning and the valley hillslope, we conducted a preliminary analysis by selecting European cities, using the characterising presence of a river and hilly relief morphologies as criteria for inclusion. Within this set, we analysed whether and how slopes are mentioned in existing urban planning documents or documents addressed to the construction of new urban planning visions and tools (see Appendix A). Slope is typically linked to the indication of vulnerable sites, local flood risk management strategies (Lyon, Nancy, Turin), or geological instability risks (Sarajevo, Turin). The same terms describe pressing urbanisation phenomena on gentle slopes (Lyon) or terrain subject to land pressure (Lille). They are assumed in some cases as factors influencing the lack of technical conditions for waste management (Sarajevo) or, in other cases, as valuable factors in signalling sites of particular identity importance to be protected (Florence, Budapest, Turin). In general, hillslopes are a factor that influences urban agglomeration as part of the green and blue infrastructure with which the city is equipped (Lyon, Nancy, Lille, London, Prague). However, a hillslope is not always distinct from the valley and plateau areas, and if distinct, it is not represented as an autonomous whole nor analysed according to an inter-scalar approach. The use of other terms in the description of the geomorphological context is aimed at emphasising the importance of morphological characteristics as a factor influencing the choice of the layout of new buildings or the treatment of open spaces (Lyon) to identify precise sub-systems of cultivated hills characterised by the prevalence of olive cultivation (Florence), the presence of forest areas around the centre of the agglomeration (Stuttgart), or the existence of a green and blue network to be preserved (Glasgow, London). In the particular case of Liège, there is a discrepancy between, on the one hand, the designation of development areas for “high-low links” through intersections with a high landscape value [20], and on the other, the prevailing attribution of the function “Residential area” for the topography around the historical centre in the old “Plan de Secteur” (1987), which is considered the primary urban planning tool organising Walloon territory and defining its various uses to ensure human activities’ harmonious development while avoiding excessive land consumption.

1.3. Theoretical Background

According to Selby [21], valley hillslopes are the sloping surfaces located between the interfluve crests and the valley floors. In defining a valley hillslope, it is necessary to observe how the topographical organisation’s logic—catchment basin, a network of valleys and slopes generally situated between a ridge line and a talweg—reproduces the hydrographic one and how what we call valley hillslope can also be decomposed into a system of secondary or derived slopes [22]. This identification method is analogous to the landscape character assessment approach, whereby landform and drainage information can be usefully combined to reveal distinct topographical areas, such as undulating hills, plateaus, wide valleys, narrow valleys or escarpments, which can then be mapped as landform units [23,24,25]. Geomorphologists have developed similar approaches to determine elementary relief forms [26]. Some suggested the concept of abiocomplex: “a relatively homogeneous area in terms of their geoecological conditions” [27]. A valley hillslope could be defined as a landform characterised by a derived sloping surface, i.e., resulting from the action of erosion of a primitive fault-generated relief. A dynamic—or moving—relief as it is modelled not only by internal forces but also by external ones, such as the secondary hydrographic reticulum’s flow towards the flat surface—or plain—at the same level as the primary watercourse draining it. A valley hillslope also generally lies between two main lines of varying altitudes. On the one hand, there is a summit or a slope break line towards the plateau’s edge; on the other hand, there is a slope break line towards the slope’s foot, leading to the flat surface at the same level as the primary watercourse draining it. Theoretical background thus allows first a valley hillslope’s identification, informed by the visual knowledge method suggested by Droeven et al. [28], whereby the landscape can be considered as an invariant structural representation and of this structure, we can identify lines, edges and main shapes, thus extracting geometric properties. As suggested in the last century by different authors [29,30,31,32], a first step could follow an inter-scalar logic of enchainment into taxonomic units—inferior, intermediate, and superior—whereby the whole is identified, decomposed and recomposed. The analysis starts from the smallest landscape units delimited by areal structures characteristics (geochore), then grouped considering both large-scale dimensional units resulting from the combination of different geomorphological, hydrological, and geological factors (agro-geographic regions), both intermediate-scale dimensional units resulting from the physiognomically homogeneous compartments within a unified whole (geofacies). This objective dimension coexists with a further link to the relief’s different uses or evaluations. Each slope is perceived as low or high depending on the use people make of it [22]: the hiker, the farmer mowing hay in the mountains, the road and bridge engineer, the real estate developer, all have different criteria for evaluating slopes. Considering those landscape reasons identified by Berque [33] (p. 36), while we can identify a valley hillslope as an object, we can also study it as a “relationship between a society and its environment”. Considering the relief’s different uses, a valley hillslope—as a landform capable of accommodating different evaluations and complementary expressions of a society’s interaction with natural resources—could then be investigated through land cover distribution.

1.4. Contribution Trajectories and Research Questions

Considering the emerging framework of the city as an ecosystem [34], urban sustainability cannot escape abiotic and biotic nature’s rules; as highlighted by Tjallingii [35] (p. 7), “guidelines for action will have to be geared to these rules”. Integrating the 21st century’s cities into the natural systems rather than inserting nature into the city [36], the urban landscape is thus a significant topic to discuss, considering that the world’s population will reach 9 billion in 2050 and more than half (54%) currently lives in an environment close to a city [37]. “Urban Metabolism”, “Sponge City” and “Urban Forestry” are some of the main metaphors adopted to focus on the interaction between the human species and natural resources as a fundamental principle to search for sustainability and climate change adaptation in cities; thus, it is important to reconsider soil’s and water’s structural functioning, as well as the interactions facilitated by soil and water, including the ecological and cultural benefits deriving from enriching plant communities and enhancing connections in urban environments. This contribution reflects on the possibility of understanding and integrating the valley hillslopes into the urban landscape, as a particular neglected category of landform, described as dynamic, being generated by water flowing; therefore, by its intrinsic nature, it is definable as both regenerating and regenerative, as well as being capable of stimulating the cultural identification with the living environment and interactions with the available resources. Valley hillslopes are thus a research object integrating urban landscape sustainability with urban morphology, as well as natural resource use in urban space readings [38,39,40]. Adopting the perspective suggested by the European Landscape Convention, valley hillslopes serve as a means of investigating the city as a process of interrelation between social and natural systems [41] and exploring the attribution of roles to the natural resources with which society interacts [42,43]. The contribution, beyond landslide and flooding considerations, intends to rediscover valley hillslopes in cities focusing on these potential natural resources through the following research questions:
  • How can we define valley hillslope forms within an urban agglomeration?
  • What uses and roles—linked to different land cover—do valley hillslopes have in today’s city?
  • How and what variables—related to their form—influence their use and role?
The contribution is developed in Section 2 by framing the discussion in the context of Liège’s agglomeration, describing the methods developed to identify valley hillslopes and certain recurring land cover types and analysing the relations between recurring land cover types and potential explanatory variables. Section 3 highlights the main results obtained. Section 4 discusses them according to current urban planning instruments and in the light of certain interaction principles between valley hillslope and society identified in Liège’s evolution. Section 5 ends the contribution by identifying the key learnings of the research.

2. Materials and Methods

2.1. Context of Research

Taking the Atlantic Europe bioregion as a reference within which the role of valley hillslopes is less explored than in southern European climatic zones, the investigation focuses on Liège’s urban agglomeration. A French-speaking city in Belgium, with a population of about 600,000 inhabitants, Liège is the first metropolitan area in Wallonia and the third in Belgium, after the conurbations of Brussels and Antwerp. The city is situated in the Meuse Valley—on the border between the discrete topography of Middle Belgium in the north and the more elevated and deeply incised landscapes of Upper Belgium in the south [44]. The Meuse valley separates the Hesbaye covers by a layer of Quaternary aeolian loess deposits above the permeable substrate of Tertiary sands and Cretaceous chalk, the Palaeozoic substrate of Condroz in the south, and the clayey Cretaceous Plateau of Herve in the east [45]. The research context is thus a relevant expression of the geomorphology of Belgium’s discontinuity (Figure 1A). Among the Walloon landscapes belonging to a domain characterised by a temperate maritime climate [46], the study area was identified based on the analysis of Belgian urban regions and agglomerations [47]. Liège’s agglomeration is positioned within three sub-basin units (Meuse Aval, Vesdre, Ourthe) (Figure 1B), characterised by a low-porosity rocky bed, rising water levels during heavy rainfall periods and, above all, by the presence of urbanised areas and agglomerations along the main watercourse, which is primarily managed to make it navigable [48]. Due to the importance of the relief as a condition for the first agglomeration’s birth [49], the geological nature of carboniferous soils favouring profound slope alteration, an impactful industrial revolution linked to the exploitation of particular local resources [50], and, finally, the more recent evolutionary trajectories of an agglomeration committed to developing a “Territorial Project”—within which the integration of ‘high-low links’ between valleys and plateaus is envisaged as qualitative transversal urban areas with a high landscape value [20]—Liège represents a privileged laboratory to rediscover valley hillslopes in cities.
As for other European medieval cities, the relationship between humans and valley hillslopes depends strongly on the historical context, as well as on the needs of the inhabitants and their technological capabilities. Through an exploration of bibliographic sources, certain principles of interaction—protection, sustenance, conquest, dissociation—emerge as recurring and identity-based elements in the evolution of an agglomeration, open today to the discussion of a multiplicity of values potentially present in the valley hillslopes. Concerning Liège, the valley hillslopes were first a protection. The presence—and the recognition of the existence—of a first urban agglomeration corresponds to the designation of “public mount”, which protects the first houses of the urban core, providing, as well, the materials for its construction [49]. Since the tenth century, the relief reinforced “the first circle of walls of the agglomeration” [51] (pp. 12–13). The valley also sheltered the first nucleus from the north winds [52].
A second evolutionary phase reached the first decade of the 19th century. The agglomeration expands by following the ridge or valley lines, delimiting the hillslopes and including parts in the successive wall circles. This evolutionary phase is characterised by the irregular growth of the original nucleus in all directions, still with tenuous urbanisation in the nearby and distant suburbs [53]. In these times, the valley hillslopes were increasingly cultivated, particularly those facing south and, therefore, attributing to the hillslopes a sustenance’ significance [51].
The third evolutionary phase, until the first decades of the 20th century, is characterised by the industrialisation and the progressive intensification of railway development [54]. The railway played a significant role in bringing the rural population closer to the city, effectively overcoming the barrier of the valley hillslopes. This phase marks a shift in the perception of the hillslopes, seen as a barrier to be overpassed.
The fourth evolutionary phase corresponds to the development of the agglomeration around the middle of the 20th century. This period is characterised by a progressive awareness of the problem of air pollution, leading wealthy people to build houses on the plateaus. This phase also marks a significant shift in the perception of the hillslopes, from a place of protection to an unsafe place [55] (p. 348).
The current condition of the urban agglomeration corresponds to a fifth evolutionary phase, which is open for discussion. This phase is characterised by the current elaboration of a territorial plan that includes the development of “high-low links” with a high landscape value between valleys and plateaus and the preservation of forests, natural areas, and agricultural land, specifying, however, that only half of these areas are to be protected from urbanization [20].

2.2. Methodological Process

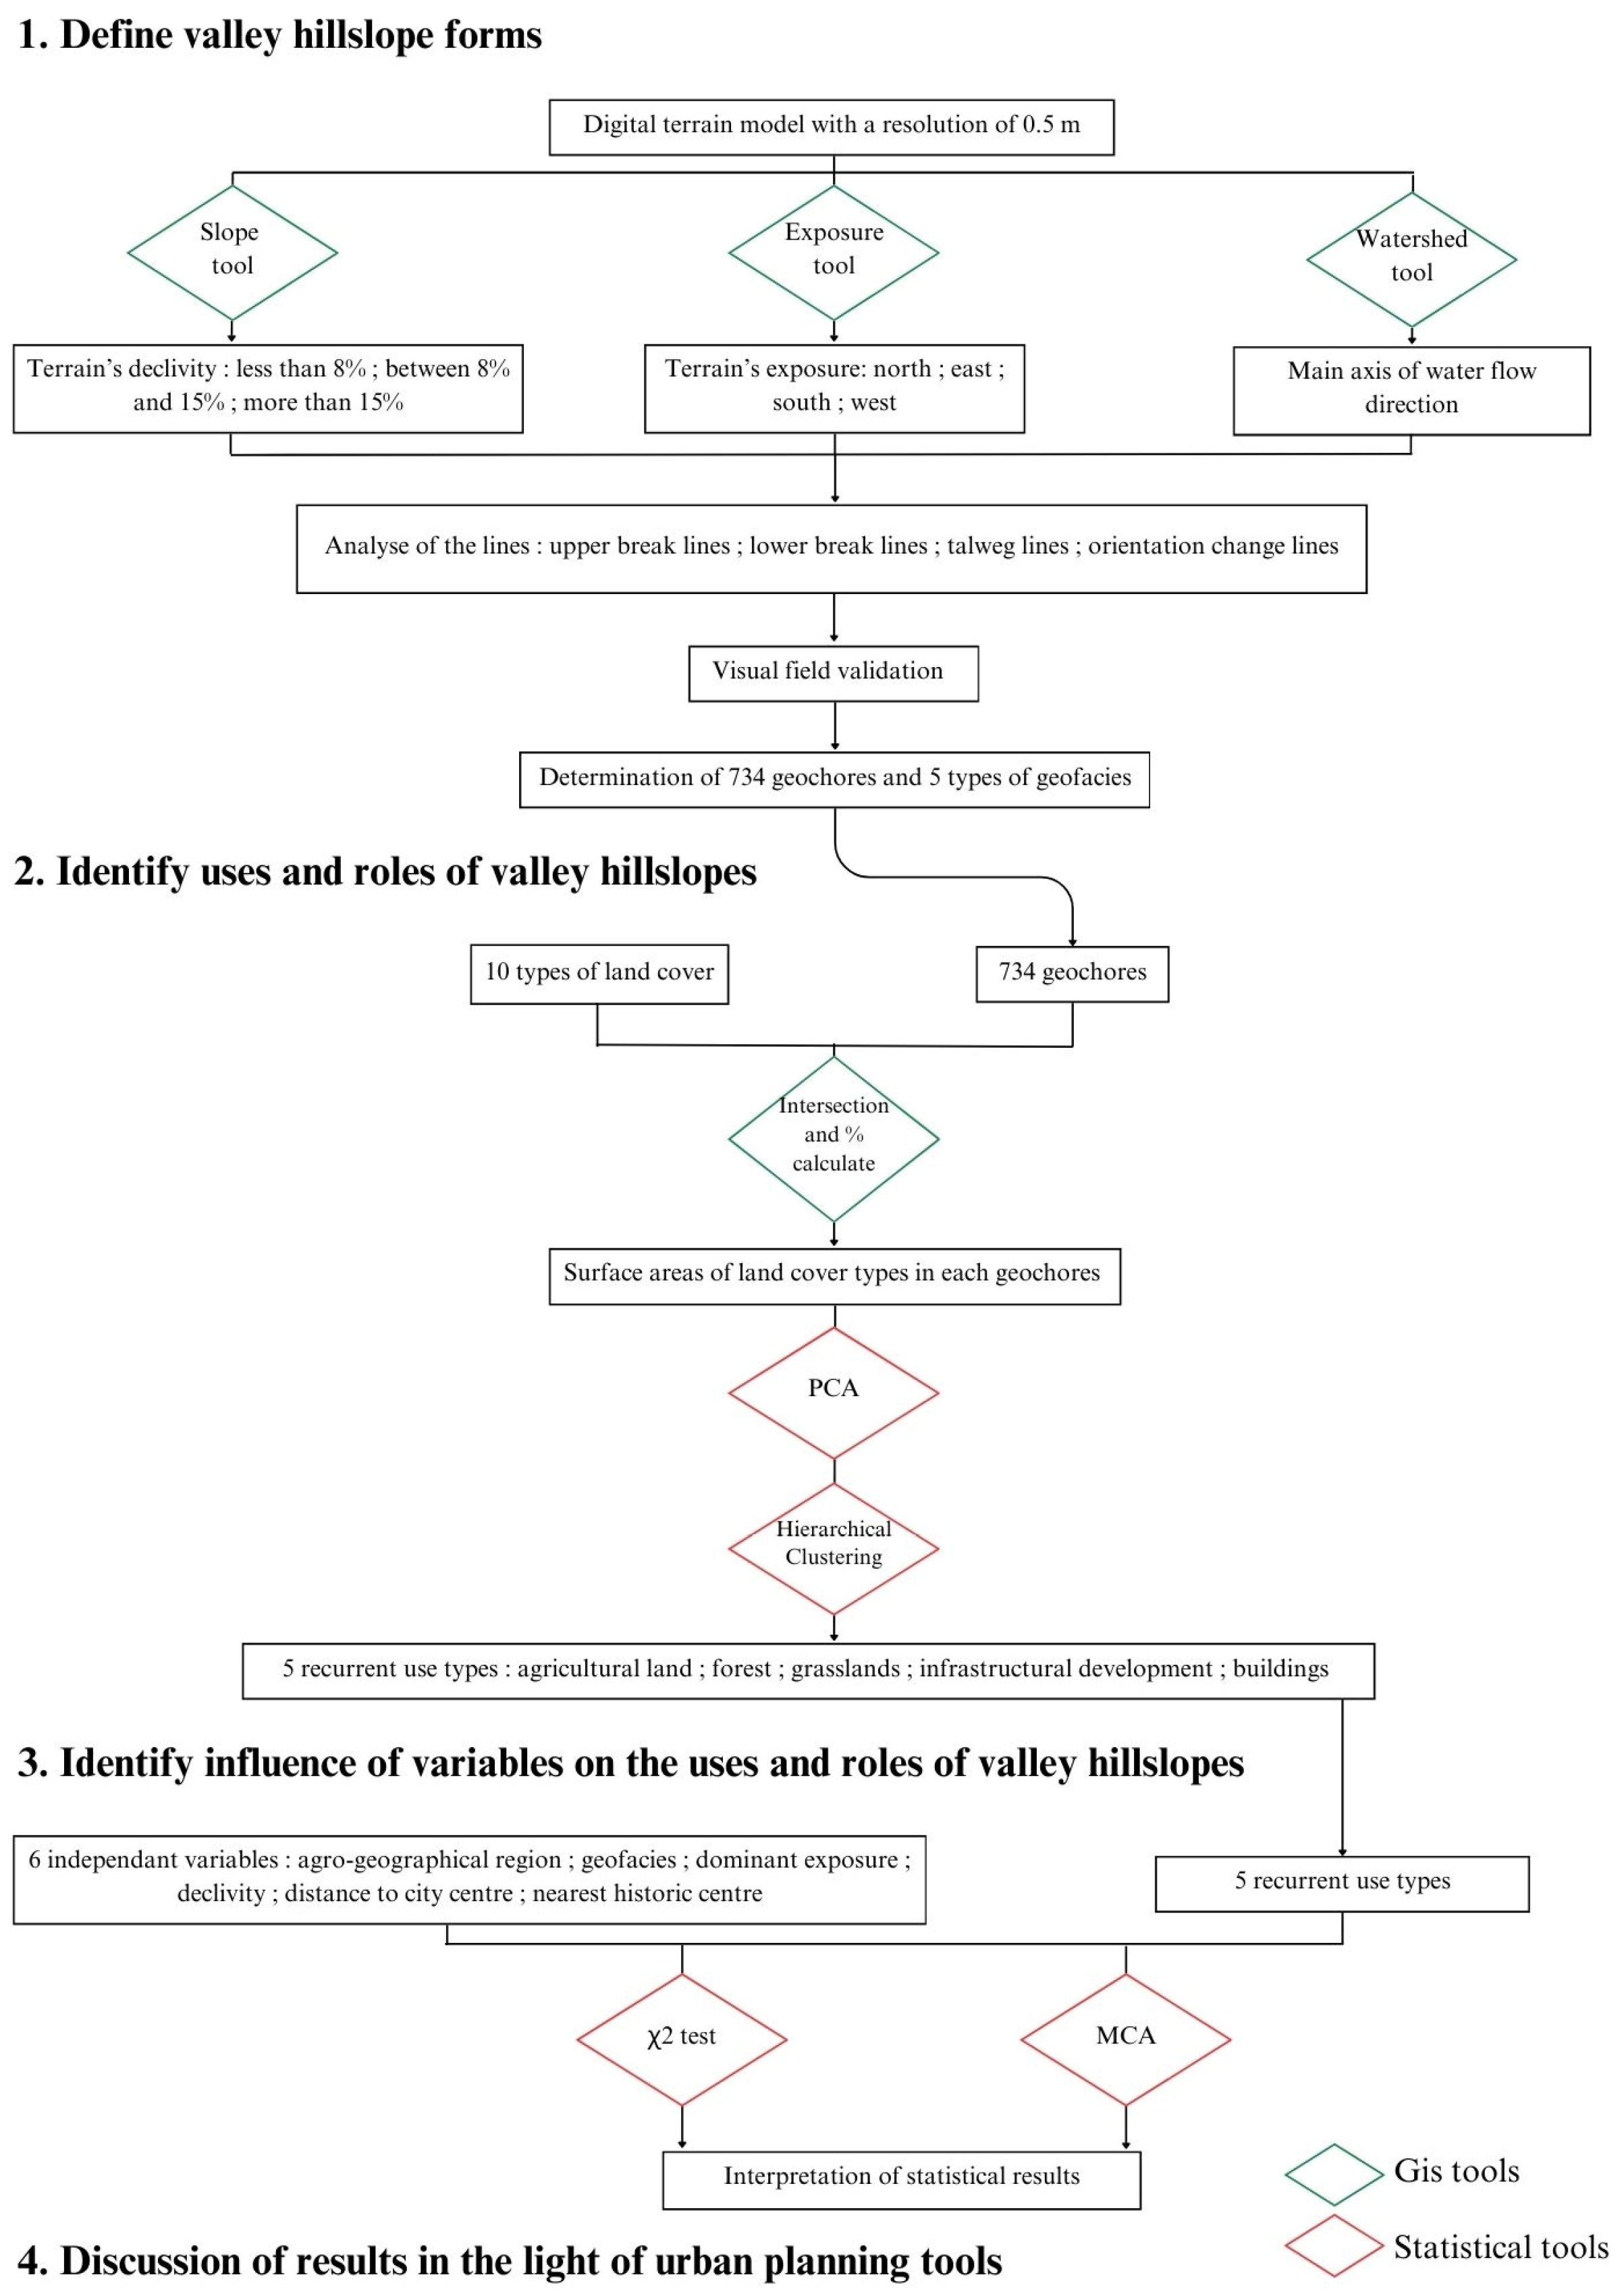
The research method follows three consecutive steps and is carried out using GIS software (Qgis) and statistical software (Rstudio). To respond to the first research question—“How can we define valley hillslope forms within an urban agglomeration?”—we suggested spatial analysis of the primary and secondary relief forms, which is useful for identifying a valley hillslope’s set gravitating around Liège’s urban agglomeration as an autonomous ensemble. To answer the second research question—“What uses and roles do valley hillslopes have in today’s city?”—the valley hillslopes land cover analysis is carried out in a second phase. Concerning the third research question—“How and what variables—related to their form—influence their use and role?”—potential relations between land cover and six explanatory variables were statistically measured in the third phase (Figure 2).

2.2.1. Method for Identifying Relief Forms

The valley hillslope’s identification process follows a logic of inter-scalar structuring into lower, intermediate, and higher taxonomic units, identifying the whole from the smallest geographical units laboratory distinction composing it (geochore), and then grouping them according to the interaction with higher dimensional units resulting from the combination of different geomorphological, hydrological, and geological factors (agro-geographic regions) and, at an intermediate scale, with respect to the presence of physiognomically homogeneous sectors within the same whole (geofacies). To distinguish the smallest geographical units in the laboratory (geochore), a digital terrain model (DTM), with a resolution of 0.5 m, from Lidar acquisitions in 2021 and 2022 was used. Concerning its schematisation, compared to the digital surface model (DSM), this model is considered more relevant for recognising the primary and secondary relief shapes’ structure. The DTM is analysed through an in-depth investigation of the terrain’s declivity, exposure, and water runoff. The “Slope” tool on Qgis measures the terrain’s declivity. To investigate terrain exposure, the model is given an exposure according to assigned cardinal coordinates with the “Exposure” tool. Conversely, water runoff is identified through the “Watershed” spatial tool. The valley hillslopes’ overall organisation can be identified through an understanding of the organisation of the hydro-topographic system. First, the starting DTM is analysed to identify the following:
(A) The upper break line: the break line of the slope towards the plateau. It identifies the upper limit of the water catchment area;
(B) The lower break line: the break line of the slope gradient towards the foot of the slope, towards the flat surface, and the level of the main watercourse draining it. It identifies the lower limit of the water catchment area;
(C) The talweg line: the line of impluvium, or the convergence of the water runoff. It identifies and separates contiguous slope areas within the articulation of a particular sub-unit of the water catchment area;
(D) The orientation change line: the separation line between contiguous slopes with different orientations (or exposures) according to the assigned cardinal coordinates. It identifies the separation between two or more contiguous catchment area sub-units.
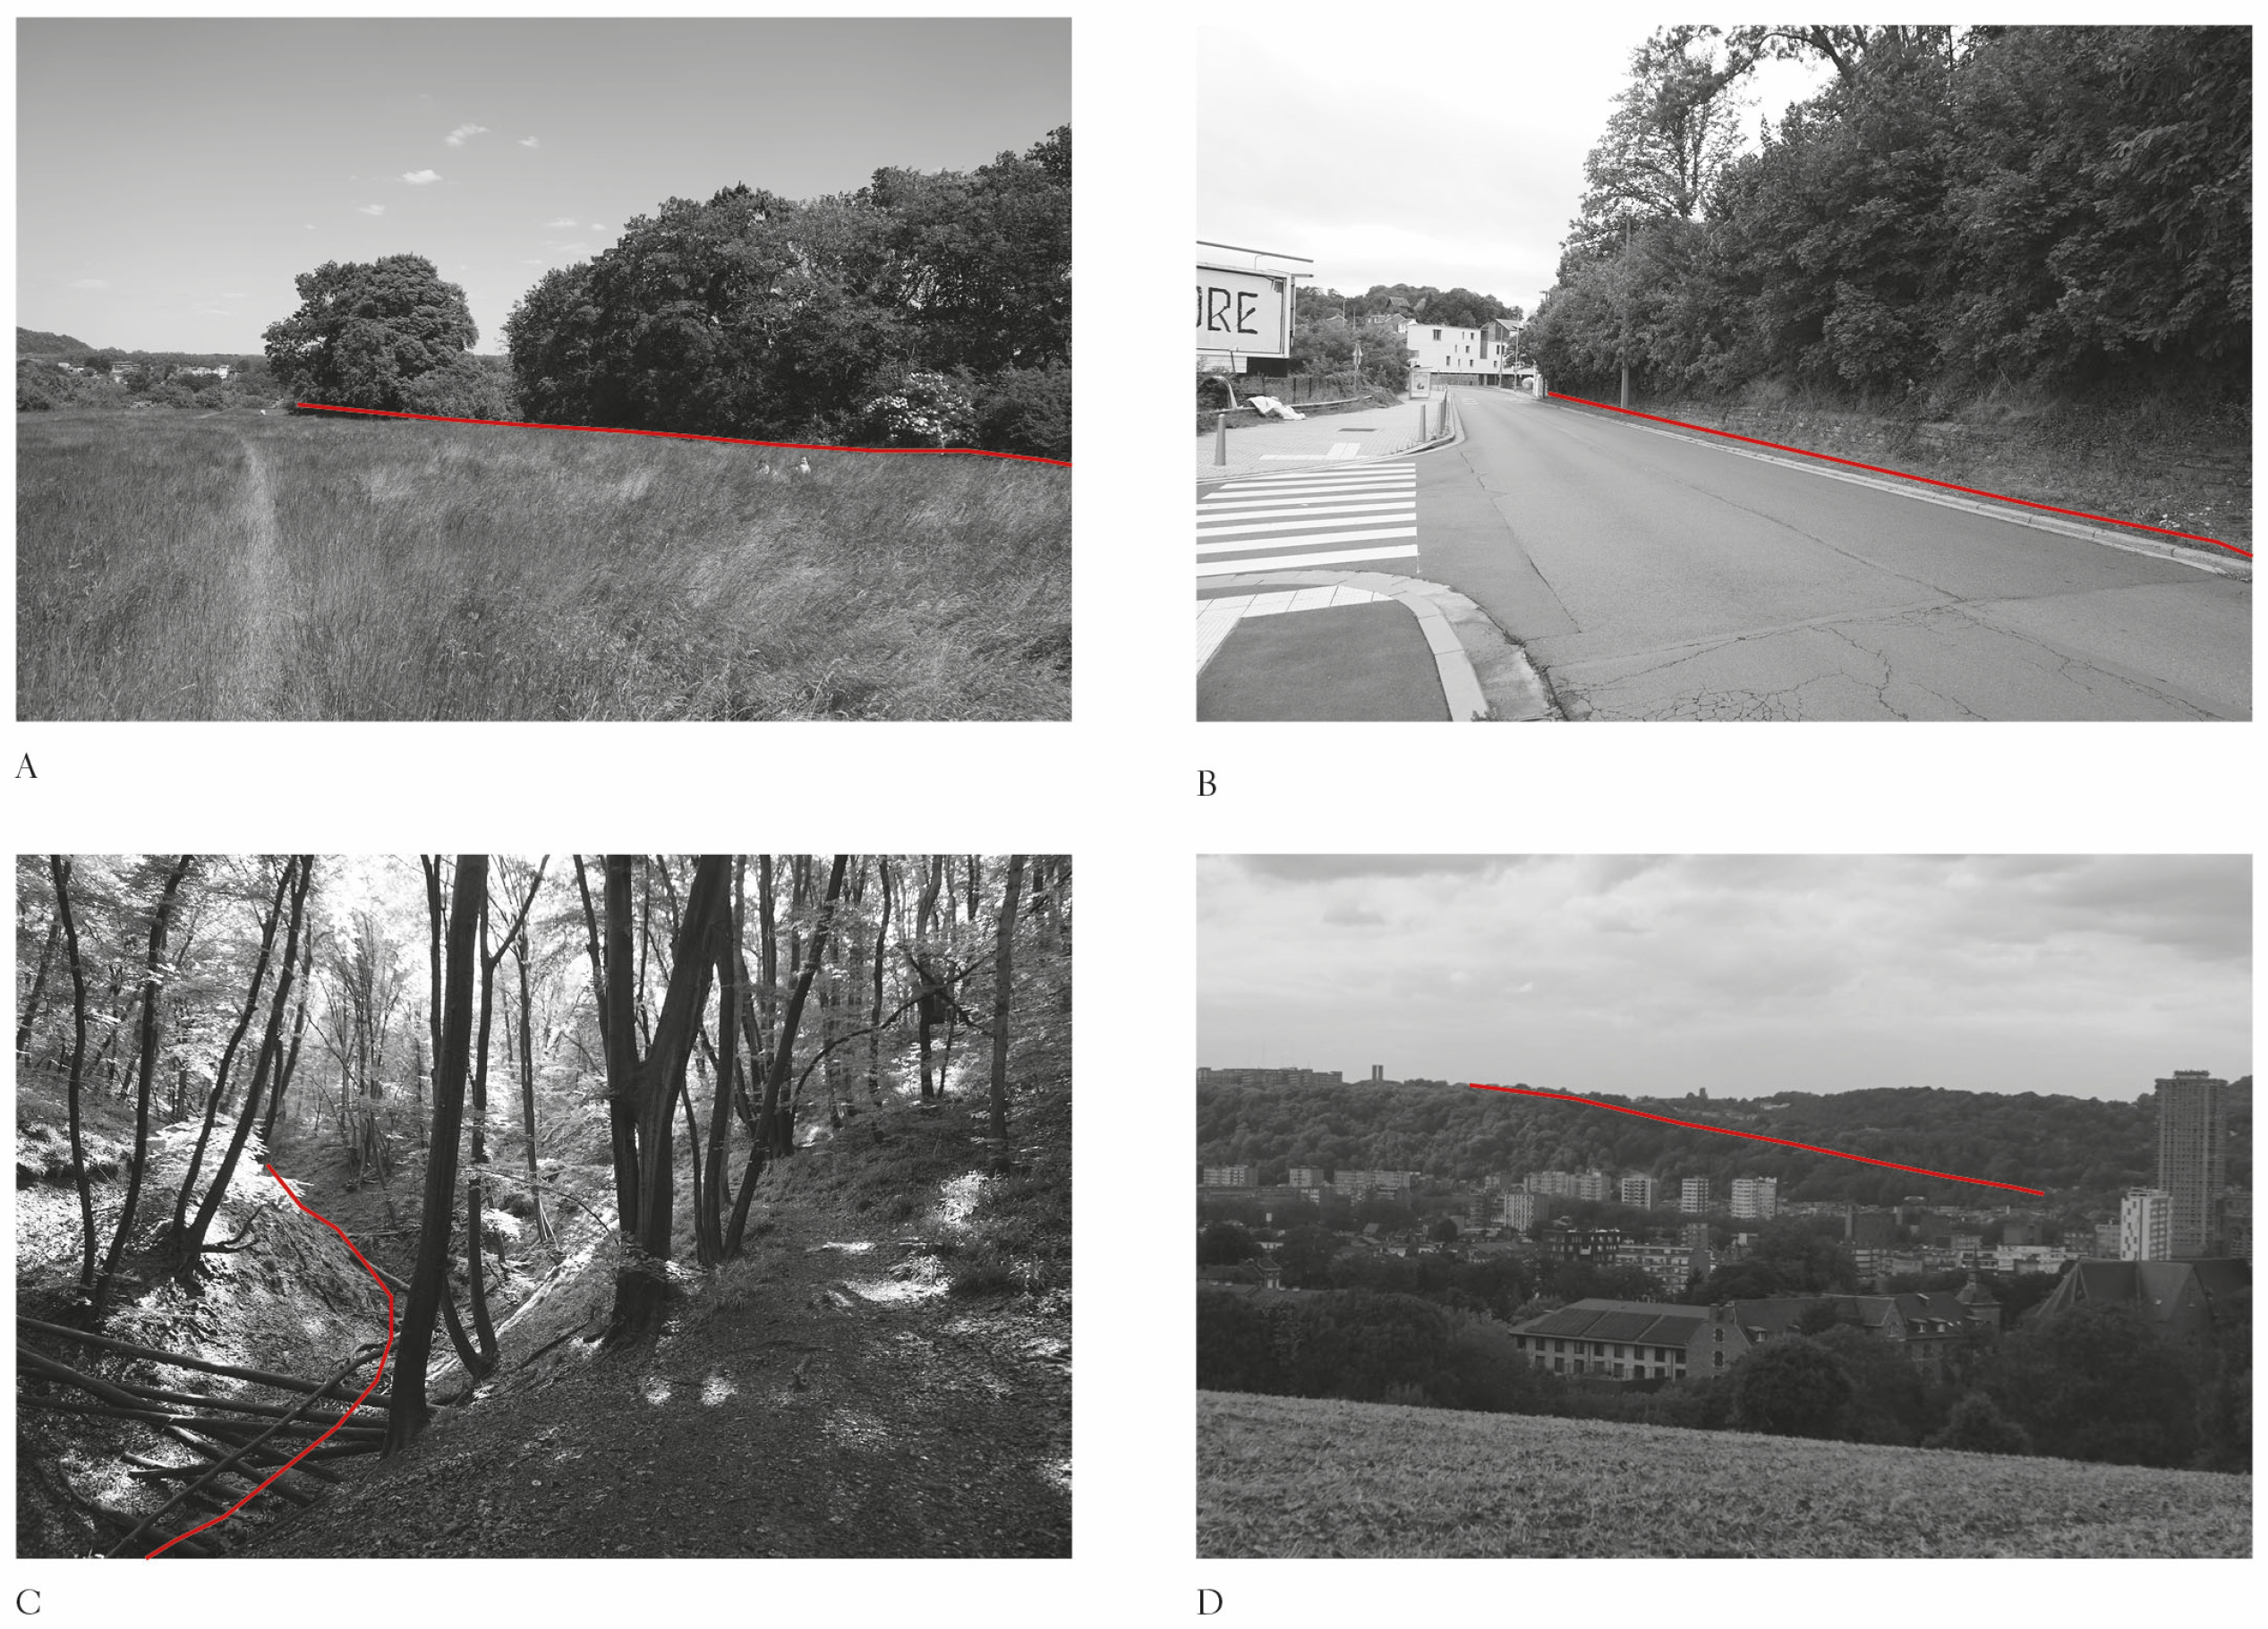
While remaining bound to a digital dimension, the model’s interpretation is filtered through definitions of characteristic lines, which are effectively perceived through in situ observation of the morphology around Liège’s conurbation (Figure 3). To investigate the terrain’s declivity, to each model’s pixel is assigned a declivity percentage (Figure 4A), then declivity is classified into three categories: terrain with declivity less than 8%, terrain with declivity between 8% and 15%, and terrain with declivity greater than 15% (Figure 4B). To investigate terrain’s exposure, the model is assigned orientation according to assigned cardinal coordinates. Specifically, to the north for an interval between 315° and 45°, to the east between 45° and 135°, to the south between 135° and 225°, to the west between 225° and 315° (Figure 4C). Finally, water runoff is identified through the Watershed function, which is useful for revealing the main axis of water flow direction (Figure 4D).

2.2.2. Method for Identifying Recurrent Use Types

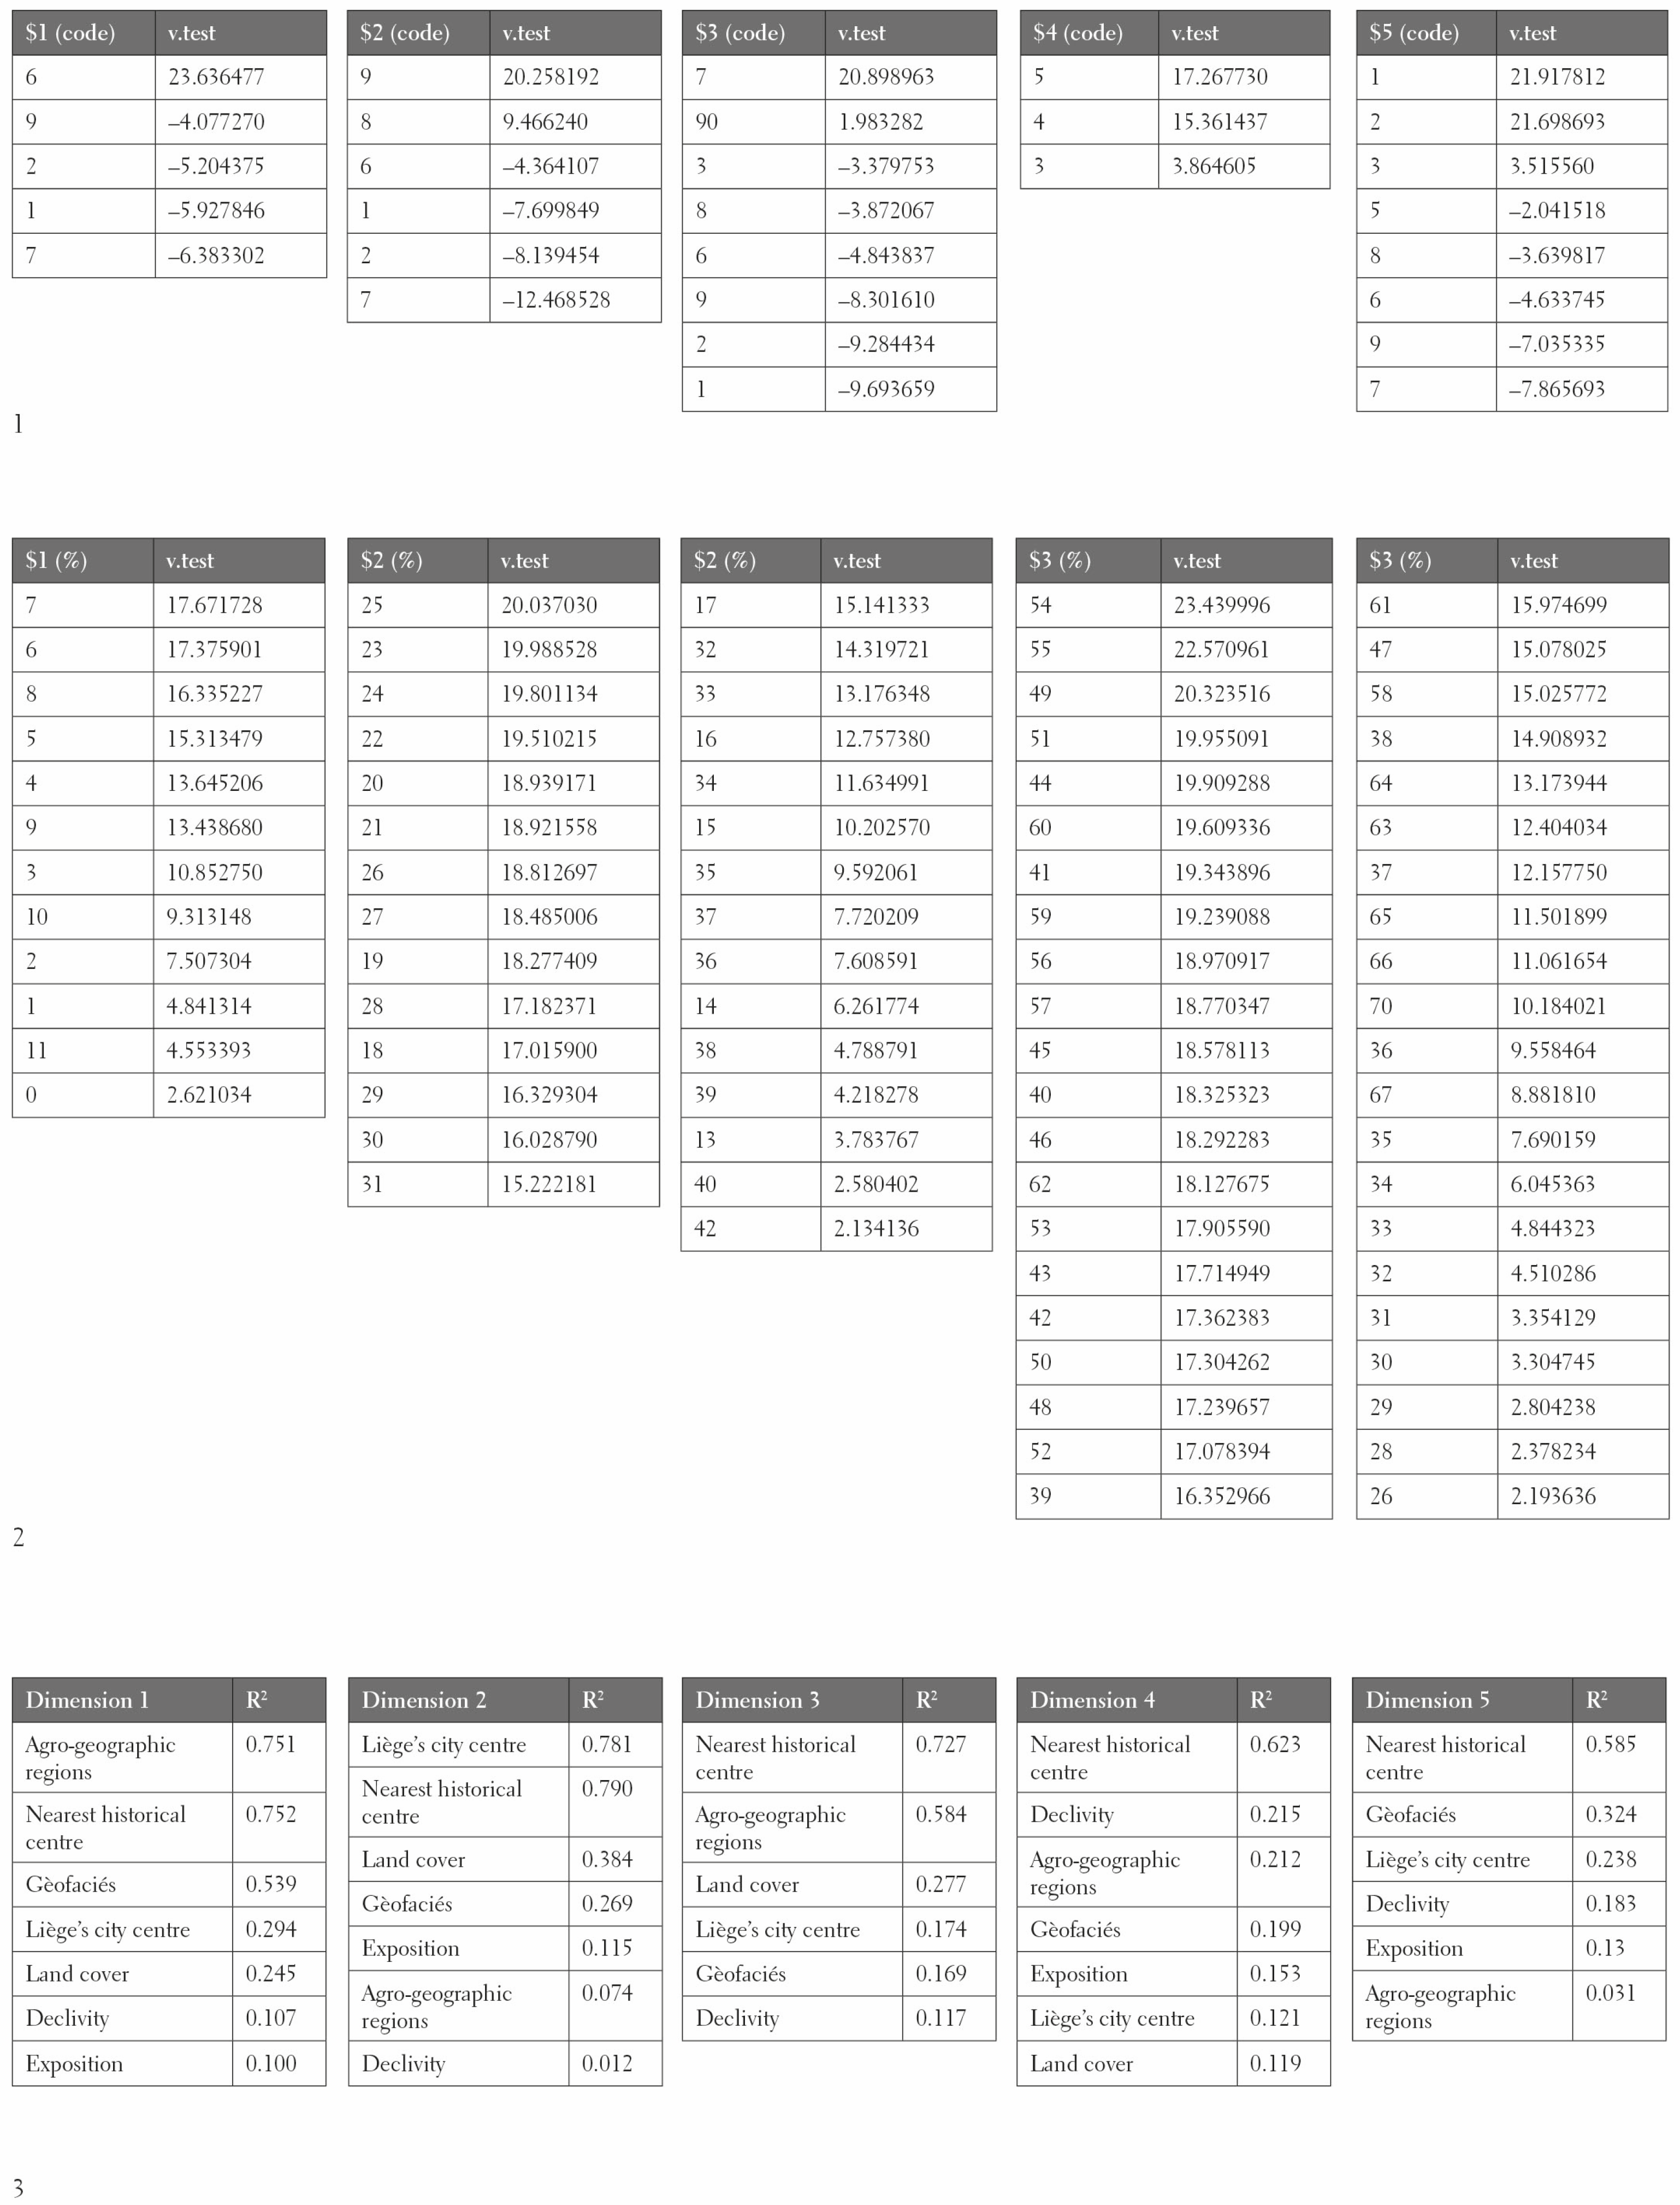
To identify the role of these valley hillslopes in the urban environment, it was decided to classify valley hillslopes according to their land cover. Land cover data are selected to facilitate the potential generalisation of results to other urban contexts and to enable easier replication of the analysis in future research following better availability of these data over time. The data used, dating from 2018 and with a resolution of 1 m, highlight ten types of land cover: rotating herbaceous cover, resinous trees, artificial ground cover, above-ground artificial construction, rotating herbaceous cover, resinous trees, bare soil, deciduous shrubs, railway network, and surface water. This classification is carried out in three successive stages. The first consists of calculating the surface areas of these ten land cover types. The second step is to perform a Principal Component Analysis (PCA) using these ten surface areas as active variables, expressed in relative values (percentages relative to the total area). By selecting the first dimensions, PCA is used to de-noise the information [56]. The final step is thus to select the first six dimensions of the PCA that represent 74% of total inertia (based on the Kaiser criterion) to perform hierarchical clustering with consolidation. Based on the low gain in inertia produced by creating a sixth cluster, we decided to limit the classification to five clusters. The characterisation of these five clusters was based on the “V-test” provided by the hierarchical classification [56]. The higher the “V-test” for a type of land cover, the more that cluster will be characterised by this land cover.

2.2.3. Method for Analysing Correspondences between Recurrent Use Types and Independent Variables

Six variables were studied in more detail to determine the variables influencing land cover: agro-geographical region, geofacies, dominant exposure, declivity, distance to Liège’s city centre, and nearest historic centre. Agro-geographic regions and geofacies refer to recognising higher and intermediate taxonomic units. The exposure is identified using a DTM and the QGIS “Exposure” tool. Once the exposures are measured, the dominant exposure present in each geochore is identified. An exposure was considered dominant if it covered more than 65% of the total area of the geochore. If a geochore has no dominant exposure, it is classified in the “mixte” category. Liège’s city centre and nearest historic centre are first identified by localising historical centres according to the Ferraris map (1770–1778). Then, the distance is measured using a distance matrix calculated with QGIS software. Once the distance to the city centre is calculated, geochores are classified into three categories: less than 5 km, between 5 and 10 km, and more than 10 km. Given the wide range of declivities within a single geochore, grouping geochores into declivity clusters was decided. Firstly, the surface areas occupied by each percentage of declivities within the geochores are calculated and used as active variables in a PCA. Then, the first four dimensions of this PCA (64% of total inertia) are used to perform a hierarchical clustering with consolidation. Additional chi-squared tests measure potential relationships between the geochore’s land cover and six explanatory variables. For significant tests (p < 0.05), Cramer’s V is calculated to highlight the intensity of relationships between these variables. A multiple correspondence analysis (MCA) is performed to complete these preliminary statistical results and highlight the potential multiple relationships between land cover and other variables. MCA is a method for the factorial analysis (exploratory) of qualitative variables [56]. Seven active variables are therefore introduced into this MCA: the land cover cluster assigned to each geochore, agro-geographic regions, geofacies, dominant exposure, the declivity cluster assigned to the geochore, the nearest historic centre, and the distance to Liège’s city centre.

3. Results

3.1. Relief Forms’ Description

Raster information’s vectorisation, obtained by querying the DTM model, allows for identifying lines and relief shapes characterising valley hillslopes. The subdivision into declivity classes makes it possible to identify upper and lower break lines, which are distinguished as more or less marked, depending on the distance or contiguity between declivity classes. The subdivision into exposure classes makes it possible to identify orientation change lines. Integrated with the other characteristic lines, redrawing talweg lines makes it possible to identify valley hillslopes through minimum units (geochore) in a single map (Figure 5).
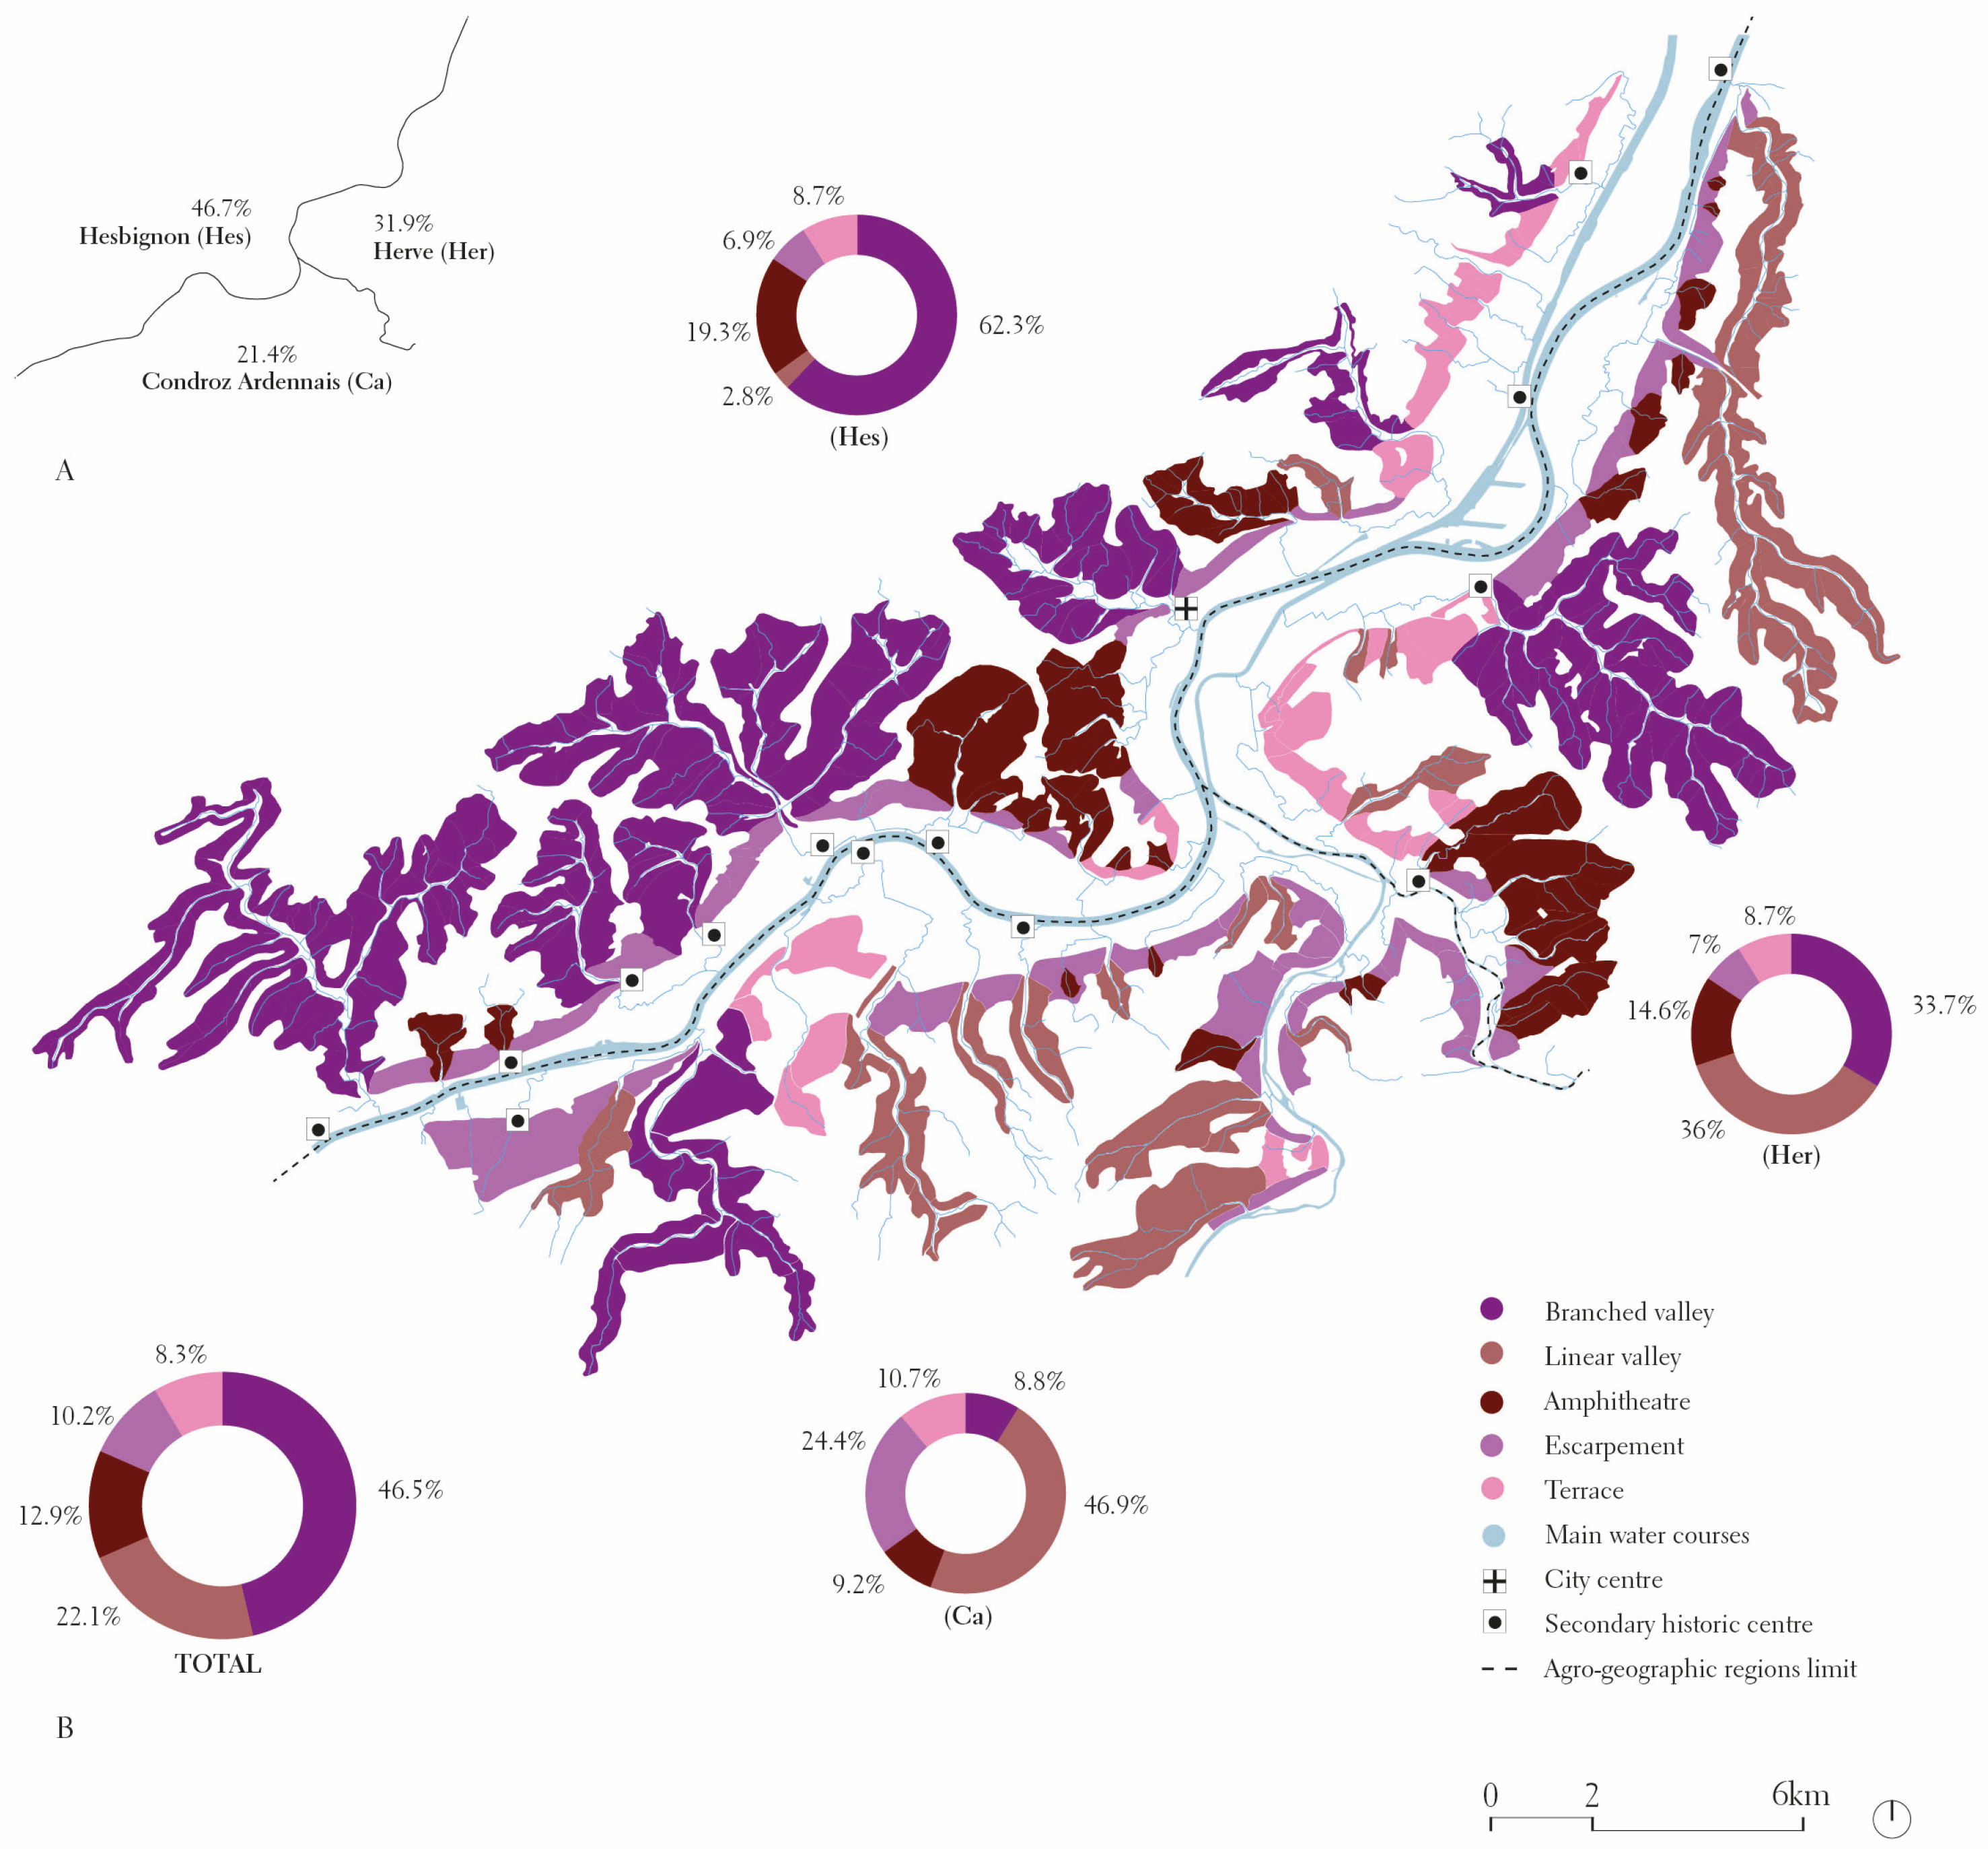
A geochore identified by overlapping characteristic lines can be grouped into further reference groups. According to exploration context’s characterisation [57,58] and with reference to the agro-geographical regions [59], the units interacting with the Condroz Ardennais are grouped, distinguishing them from those interfacing with Plateau de Herve and the Plateau Hesbignon (Figure 6A). To the north and the west, 46.7% of the geochores interact with a vast, gently undulating plateau dotted with dry valleys, whose altitude gradually decreases towards the north and northwest. Cultivated as far back as the Neolithic period thanks to its thick silt cover, Plateau Hesbignon is an agricultural region par excellence, with a characteristic landscape where traditional settlement is concentrated in large villages, with land stretching as far as the eye can see between inhabited areas and large square farms, testifying to the importance of agricultural activities. To the east, 31.9% of the geochores interact with Plateau de Herve, characterised by a clayey, impermeable soil, favouring the creation of rich pastures, once enclosed by a regular pattern of hedges—or bocage– which often supported orchards. Despite the removal of many hedges, it is still a region of pastures and pastoral economy, with scattered settlements. To the south, 21.4% of the geochores interact with the northern margin within which the Condroz folds are located. The name of this latter agro-geographic region—Condroz Ardennais—evokes its very character, as here, the conditions of the Ardennes are combined in areas where wet soils play no role in improving the terrain and where, consequently, the forest prevails. Liège, although predominantly developed on the northern slope towards Plateau Hesbignon, is in contact with different environments through the overall ensemble of geochores. Starting from Bertrand and Tricart’s [29] definition of geofacies—as physiognomically homogeneous compartments within the same whole—we also highlight the co-presence of different forms within the same valley’s hillslopes (Figure 6B).
Some forms are more introverted. To this group belong the following:
  • “branched valleys” resulting from the excavation of tertiary watercourses tributary to a secondary watercourse that flows into the main watercourse;
  • “linear valleys”, more elongated in shape, following the excavation of a secondary watercourse flowing into the main watercourse;
  • “amphitheatres”, also generated by the excavation of a secondary watercourse flowing into the main watercourse but characterised by a more accentuated lateral extension of the slopes, converging to a secondary watercourse’s axis.
Other forms are more extrovert, facing the main watercourse. To this group belong the following:
  • “escarpments”, resulting from the incision of the main watercourse;
  • “terraces”, differing from the ‘escarpments’ in that they are sub-units always situated between an upper and a lower flat surface or plain area but articulated within them in intermediate plateaus.
The percentage of geochores grouped in branched valleys is higher (46.5%), followed by geochores grouped in linear valleys (22.1%), amphitheatres (12.9%), escarpments (10.2%), and terraces (8.3%). When observing geofacies’ groupings into agro-geographic regions, these absolute percentages differ. This is mainly due to the distinct lithology. In particular, to the south (Condroz Ardennais), there is a relative prevalence of linear valleys (46.9%), followed by escarpments (24.4%) and terraces (10.7%); to the north (Hesbignon), there is a relative prevalence of branched valleys (62.3%), followed by amphitheatres (19.3%) and terraces (8.7%); to the east (Herve), there is a relative prevalence of linear valleys (36%), followed by branched valleys (33.7%) and amphitheatres (14.6%). More generally, in valley hillslopes’ representation through geofacies, a correspondence can be observed between the secondary watercourses towards the Meuse’s point of inflow and the position of urban centres, starting with the main city centre.

3.2. Recurring Types of Land Use Description

The hierarchical classification of geochores based on the land cover reveals five main clusters (see V-test in Appendix Figure A2(1)):
  • Cluster 1: agricultural land (“rotational herbaceous cover”, code 6);
  • Cluster 2: forest (“deciduous trees”, code 9; “coniferous trees”, code 8);
  • Cluster 3: grasslands (“continuous herbaceous cover”, code 7);
  • Cluster 4: soil modified by infrastructural development (“Surface water”, code 5; “Bare soil”, code 4; “Railway network”, code 3);
  • Cluster 5: soil predominantly covered by buildings (“Artificial ground cover”, code 1; “Artificial above-ground structures”, code 2).
Geochores are thus grouped into five clusters of recurring land cover types (Figure 7). A quarter of the geochore is predominantly occupied by construction. The remaining percentage is predominantly occupied by grassland (44%), followed by environments predominantly occupied by forests (22%) and, finally, by agricultural land (8%). It is also interesting to highlight the presence, albeit relatively unremarkable (1%), of a particular category linked to more recent infrastructural processes and soil modifications. Starting from the identified geochore, the criteria and outcomes of the proposed analyses can play an instrumental role in nurturing visions, plans, projects, and actions that require intentions in the future. First and foremost, this study allows us to better understand the forms of a particular geographic condition and act accordingly, starting with understanding the interactions that occur with them, and describing and interpreting the factors influencing them.

3.3. Correspondences between Recurrent Land Use Types and Independent Variables’ Description

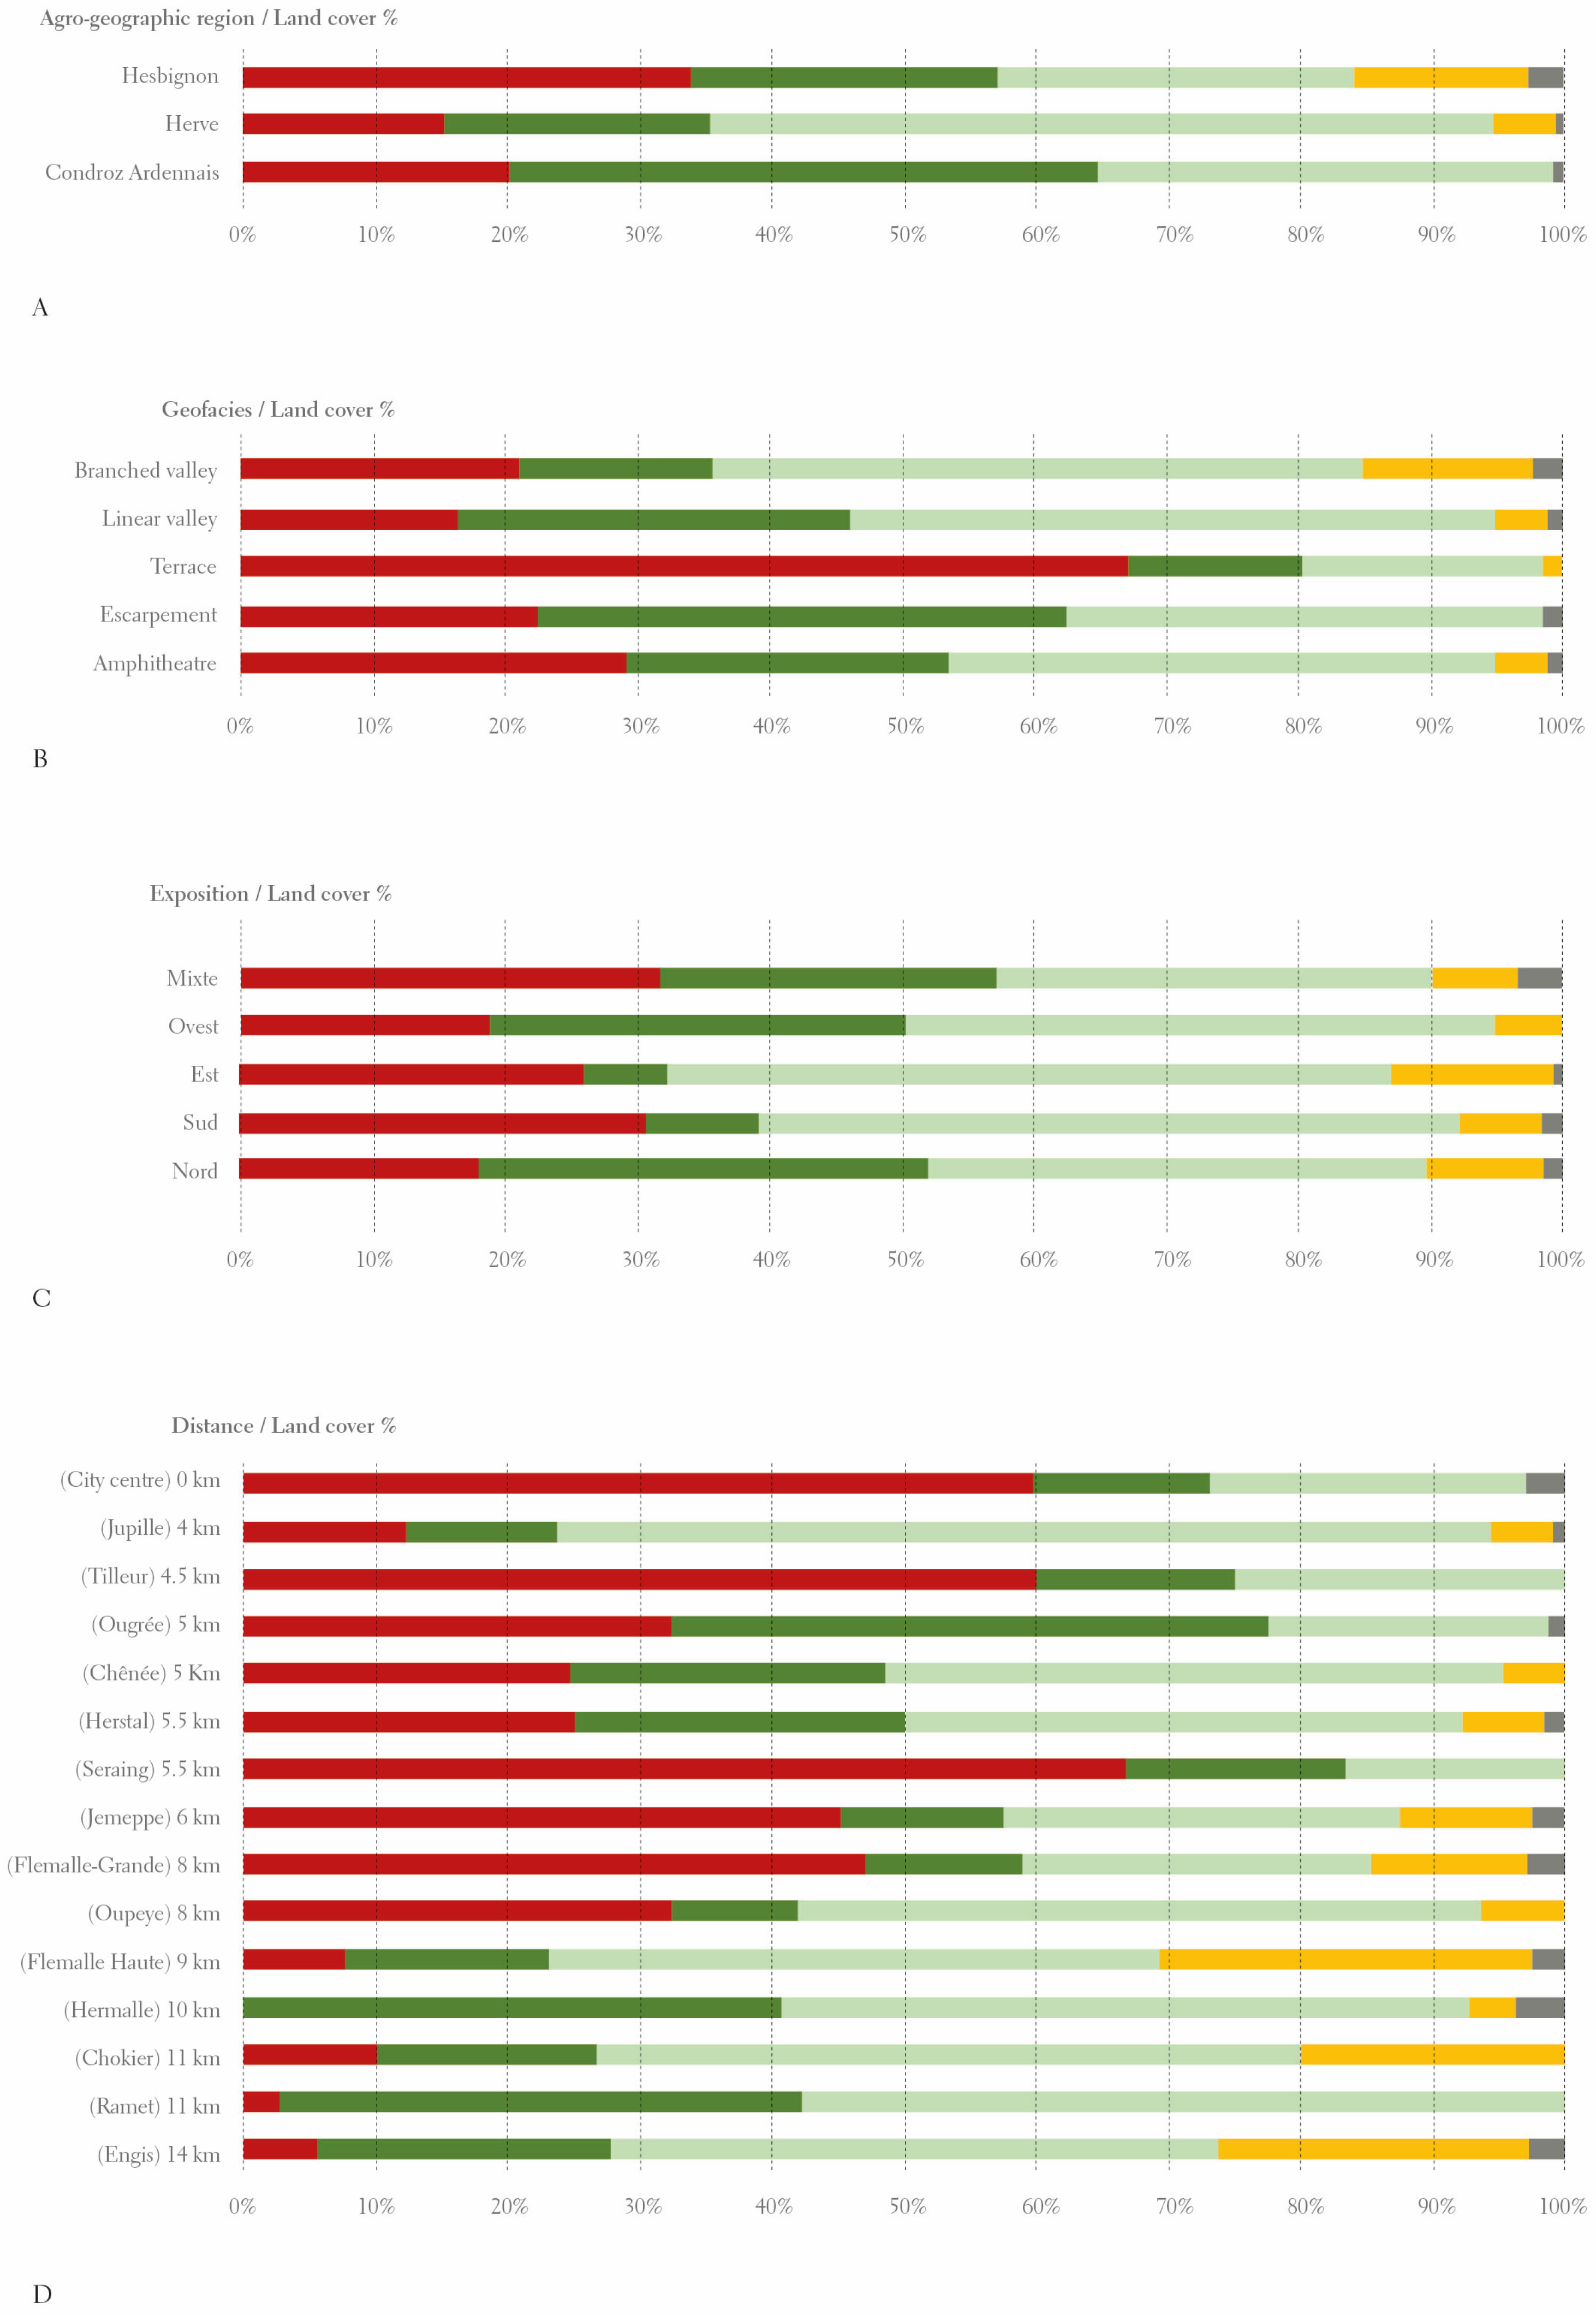
A moderate relation (χ2 = 120.21; df = 6; p-value = 2.2 × 10⁻¹⁶; Cramer V = 0.2883) between land cover and agro-geographic regions—thus corresponding to three agro-geographical regions—identifies three different tendencies. Regarding the three agro-geographic regions (Figure 8A), it is possible to distinguish a system predominantly occupied by forests (Condroz–Ardennais), a system predominantly occupied by grassland (Herve), and a system predominantly urbanised (Hesbignon). Despite a small percentage, most of the agricultural land’s geochores are found in Hesbignon’s agro-geographic region. A moderate relationship between geochore land cover and types of geofacies is also revealed (χ2 = 116.72; df = 12; p-value = 2.2 × 10⁻¹⁶; Cramer V = 0.232). Indeed, only terraces correspond to a percentage of geochore predominantly occupied by built spaces. Escarpments tend to be grouped as areas predominantly occupied by forests, while branching valleys, linear valleys, and amphitheatres are associated with grassland. The interaction between geochore and type of geofacies also highlights some discontinuities, such as the near absence of more recent soil changes in terraces and a predominant increase in agricultural land corresponding to branching valleys (Figure 8B). All the exposure classes (Figure 8C) show an urbanisation average percentage between 18% and 32%, a grassland percentage increase for east- and south-facing geochores, a forest percentage increase for north- and west-facing geochores, a grassland and forest average tendency in mixed-exposure geochores, and a homogeneous presence of agricultural land across each of the five exposure classes. Although there is a dependency between land cover and exposure, the interaction remains weak (χ2 =70.179; df = 12; p-value = 2.97 × 10⁻¹⁰; Cramer V = 0.1799). Exposure does not, therefore, correspond to evidence of any particular land use type over another. We highlight a moderate relationship between land cover and distance from Liège city centre (χ2 = 93.1; df = 6; p-value < 2.2 × 10⁻¹⁶; Cramer V = 0.2538). More specifically, the influence of the closest subsets centre (Figure 8D) is analysed according to the trend—whether prevalent or not—of geochores occupied by built spaces. There is a relatively strong interaction between the presence or absence of building-dominated geochores and the distance to the historic centre (χ2 = 136; df = 14; p-value = 2.2 × 10⁻¹⁶; Cramer V = 0.4337). In this sense, the interaction shows the existence of predominantly urbanised subsets, with percentages above 50% (the geochores closest to Liège city centre, Tilleur, Seraing), subsets with a medium-high urbanisation tendency, between 40% and 50% (the geochores closest to Jemeppe, Flemalle-Grande), or medium-low, between 20% and 35% (the geochores closest to Ougrée, Chênée, Herstal, Oupeye) and, finally, predominantly non-urbanised subsets, with percentages below 20% (the geochores closest to Jupille, Flemalle-Haute, Chokier, Ramen, Engis). The hierarchical classification of geochore declivity reveals three main clusters (see V-test in Appendix Figure A2(2) and Figure 9):
  • Cluster 1 groups geochores whose declivity distribution is considered homogeneous, and whose declivities are predominantly low (the declivities within the same geochore are more likely to be between 0% and 11%). This is particularly the case for geochore n°235, a dry valley north of Jemeppe;
  • Cluster 2 groups geochores whose declivity distribution is considered variable, and where declivity is predominantly high (declivities within the same geochore are more likely to be between 13% and 42%). This is particularly the case for geochore n°133, the escarpment of Coromeuse on the left bank of the Meuse;
  • Cluster 3 groups geochores whose declivity distribution is considered highly variable, and where declivities are generally very high (declivities within the same geochore are more likely to be between 26% and 70%). This is particularly the case for geochore n°433, the escarpment of the St Jacques wood on the left bank of the Ourthe.
As for the previous two variables, a moderate interaction is revealed between geochore’s land cover and declivity (χ2 = 135.97; df = 6; p-value = 2.2 × 10⁻¹⁶, Cramer V = 0.3066). Therefore, the distribution and type of declivity (Figure 9) make it possible to distinguish a geochore subset that is more urbanised and has a grassland prevalence (Cluster 1) from two other clusters that are characterised by forest prevalence and a tendency towards the absence of agricultural land. However, even if very few geochores are found in “highly variable distribution and very high declivity”, it is interesting to note that higher declivity does not correspond to a lower percentage of urbanization, and that the forest percentages are similar in Clusters 2 and 3.
An MCA is conducted to better understand the relationships between the different variables selected to characterise slopes. The results of this MCA focused on the first two dimensions, representing 16% of the total inertia of the dataset. Indeed, these two dimensions synthesise the strongest relationships within the greatest diversity of variables (Appendix Figure A2(3)). The first dimension is associated with the relief and is correlated with the variable agro-geographic regions and to a lesser extent, with the variable geofacies. It ranges from Hesbaye and branched valley to Condroz Ardennais, linear valleys, and escarpments, with terraces and amphitheatres in an intermediate position. The second dimension is linked to the variable distance from Liège’s city centre and has a weaker correlation with the variable land cover. For the other dimensions, it is generally the same variables that are predominantly linked, or the correlations remain relatively weak, thus not allowing the emergence of new trends complementary to the previous results. In the factorial plane constructed by the first two dimensions, the positioning of geochores with the most significant contribution to the construction of these dimensions highlights four main geochore groups: the first dimension (horizontal axis) distinguishes the geochores of Group 1 from those of Groups 2a and 2b, while the second dimension distinguishes the geochores of Groups 3a and 3b (Figure 10). Considering that proximity between geochores on the factorial plane reflects a similar profile, and a geochore will be close to the modalities it possesses, geochores belonging to the same group generally show similar characteristics [49]. Thus, based on the position of the modalities of the active variables in relation to these five geochore groups in the factorial plane (Figure 10), we can highlight several relationships between the variables and identify various geochore profiles. The geochores that tend to be occupied by agricultural lands are the farthest from the city centre of Liège and are located on the Plateau Hesbignon (with the nearest historical centres being Chokier and Engis). These take the form of a branched valley (Group 1). Geochores that tend to be occupied by forests or grassland are located between 5 and 10 km from the city centre of Liège and take the form of an escarpment or a linear valley. Specifically, these geochores are located either on the Plateau de Herve (the nearest historical centre being Hermalle-sous-Argenteau) (Group 2a) or in the Condroz Ardennais (the nearest historical centre being Ivoz-Ramet) (Group 2b). As for geochores, generally dominated by built-up soil, these are located close to the city centre of Liège, with the nearest historical centres being Place Saint-Lambert and Tilleur. These generally take the form of a branched valley or an amphitheatre on the Plateau Hesbignon (Group 3a) or a terrace on the Plateau de Herve (Group 3b). The position of the infrastructural development near the Plateau Hesbignon at a medium distance from the city should also be underlined.

4. Discussion

This research revisited the geochore approach developed in the last century by introducing GIS, factorial analysis, Lidar, and precise land cover information, which greatly facilitated the use of the concepts and approach. It provides and tests a method that focuses on valley hillslopes to analyse their diversities and uses, in order to question their role in the urban metabolism. The research premises show little consideration for the analysis of slopes from a planning perspective in the literature and existing planning documents.
However, valley hillslopes represent opportunities to respond to emerging issues, such as reconsidering reintroducing nature in the city and improving several regulations and cultural ecosystem services within the urban metabolism. Nonetheless, these spaces are coveted for new dwellings. Following an inter-scalar logic of enchainment into taxonomic units, this study analysed the valley hillslope as an autonomous unit between the valley and plateau to question its uses. Subsequently, at a large scale, the logic is broken down into agro-geographic regions as a tool for highlighting an environment variety within which the system interacts and. At an intermediate scale (geofacies) and at a minimal scale (geochore), it is used as a tool for highlighting a multiplicity of uses and interrelationships between form and use. In Liège’s context, this approach provides an interesting perspective when compared with the land use regulatory plan (“Plan de Secteur”).
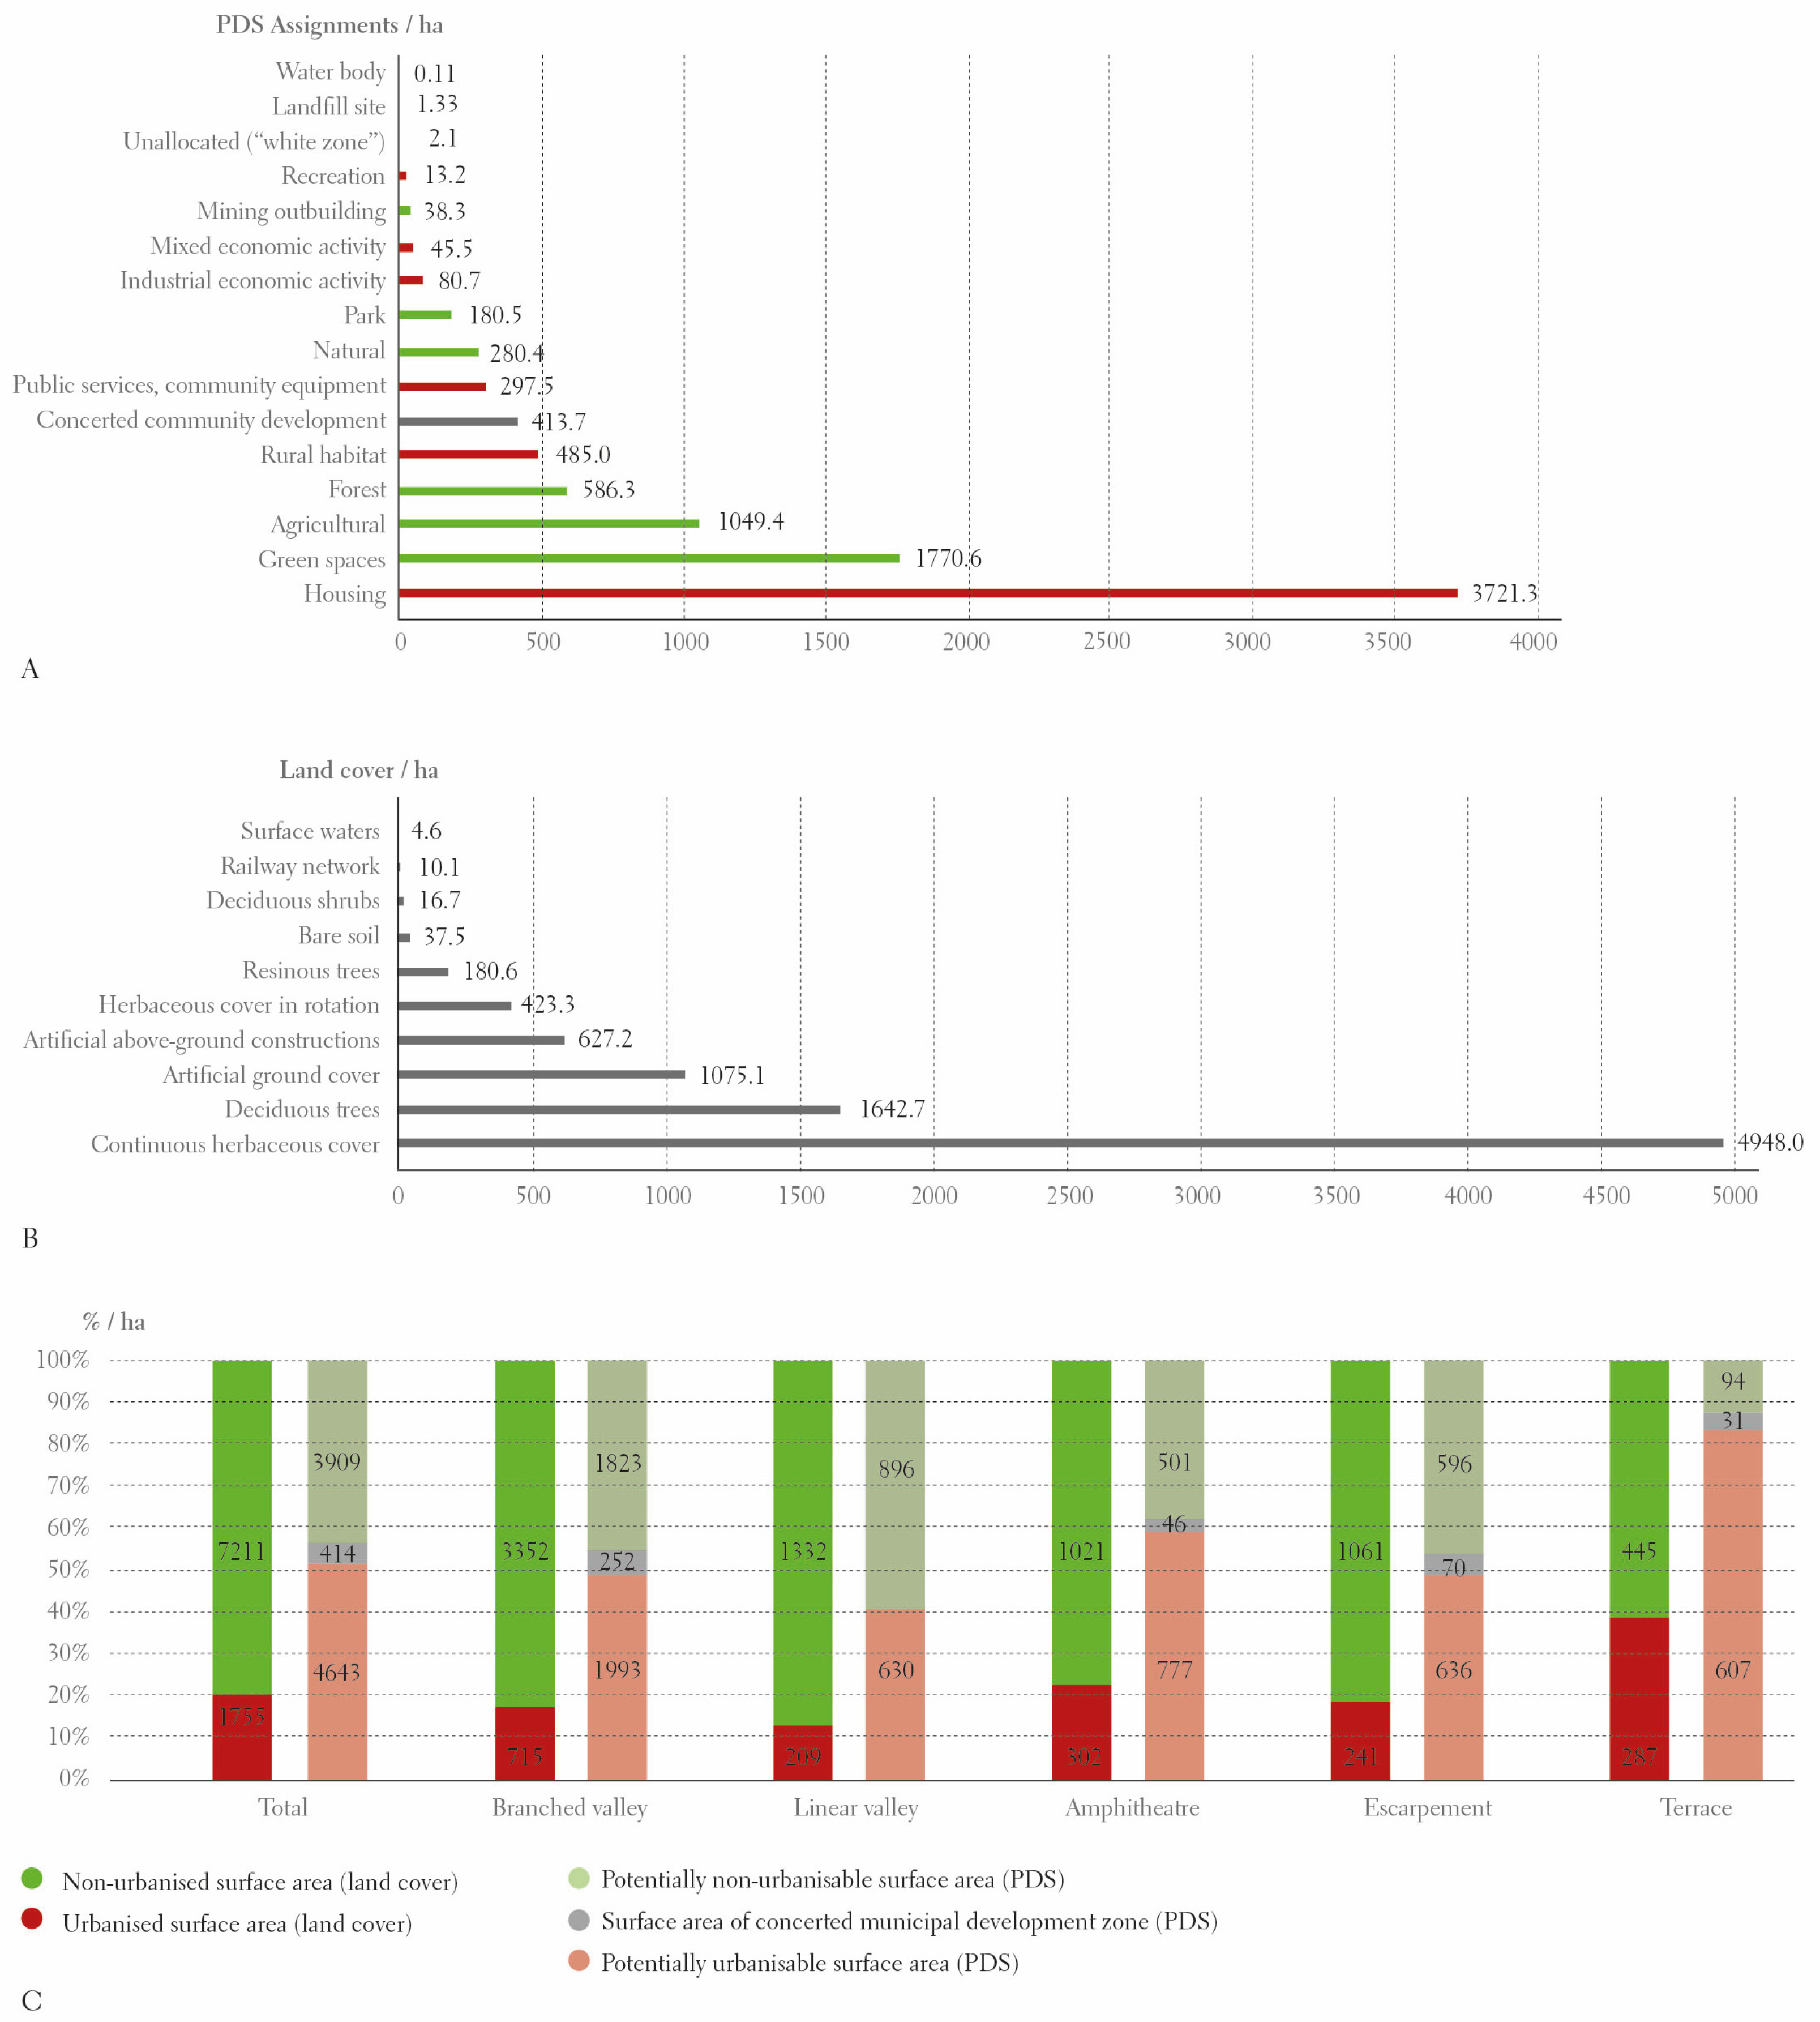
In particular, the intersection between the geochores’ surface area and the “Plan de Secteur” shows that more than half of the surface area (52%) is an urbanisable zone; therefore, in perspective, a greater percentage of geochores are potentially occupied by constructions. The percentage of 25% (Figure 7) is not properly comparable with 52%, as the first refers to geochores and the second to their surface. A closer investigation of the surface area, however, shows a real discrepancy between the plan’s indication and the actual valley hillslope’s use. According to “Plan de Secteur” (Figure 11A), the largest area corresponds to possible housing urbanisation (3721.3 ha), while according to the land cover (Figure 11B), it corresponds to continuous herbaceous cover (4948.0 ha). Furthermore, when summing up all the categories of plan indications referring to possible urbanisation, we reach a total area of 4643.2 ha. This amount does not correspond to the current area occupied by buildings or derived from urbanisation and infrastructural processes. According to the land cover—thus summing up the categories surface waters, railway network, bare soil, artificial ground cover, above-ground artificial construction—only 1754.5 ha is reached, which “Recreation”, “Mixed economic activity”, “Industrial economic activity”, “Public services, community equipment”, “Rural habitat”, “Housing” being less than half of the amount projected by “Plan de Secteur” (see total in Figure 11C).
Still referring to the sum of the previous categories, it is also possible to compare plan predictions with land cover and analyse the geofacies’ influence (see categories of geofacies in Figure 11C). Among the sectors presenting similar physiognomy within the same valley hillslope’s ensemble, it emerges that “Plan de Secteur” attributes a potential for urbanisation to 635.9 ha of escarpments, compared to 241.2 ha currently urbanised. This is followed by 777 ha, compared to 302.5 ha for amphitheatres, 606.5 ha, compared to 286.8 ha for terraces, 1993.3 ha, compared to 715.5 ha for branched valleys and, finally, 630.1 ha, compared to 208.5 ha for linear valleys. The demand or the availability of constructible lands is higher for escarpments and amphitheatres than for terraces and linear valleys. In this perspective, while there is undoubtedly a need for further investigation to determine the extent of areas for which urbanisation is planned but not currently realised, it is useful to highlight how the land use regulatory plan, “Plan de Secteur”, currently induces a possible simplification of the potential of valley hillslopes, generally reducing slope to constructible areas and excluding morphology’s influence or reference to other possible valley hillslope’s roles as planning tools.
It is also interesting to discuss that while the statistical analysis shows an analogy between progressive lower urbanisation, the increase in agricultural land, and the distance from Liège’s city centre, there are exceptions. MCA’s first two dimensions highlight multiple relationships between land cover, the agro-geographical region, geofacies, the nearest historical centre, and the distance to the city centre of Liège. However, considering the results, especially the distribution of geochores in the factorial plane, these relationships do not seem to follow a uniform trend for a large number of geochores, showing their distinct characteristics. Statistical analysis shows that geochores located more than 4 km from Liège’s city centre have predominantly less urbanisation compared to those within 8 km. Geochores located 4 km or 5.5 km from Liège’s city centre also have higher percentages of agricultural land compared to those located 10 km or 11 km away (Figure 8D). This intersection thus reveals specific, distinct characteristics in an urban agglomeration’s lack of compactness, highlighting the co-existence of more natural areas close to more urbanised ones, and suggesting further potential for exploration. From this perspective, it is important to include the temporal variable as a further potential influencing factor in the valley hillslope use, thus being valuable for addressing further possible attributions of meaning. It is also important to take into account both the traces of ancient rural landscape in the city of Liège, such as the presence of the south-facing geochore, today predominantly occupied by forests and once cultivated with vineyards [60]; the existence of particular industrial “calaminaires” sites in north-facing geochores, once characterised by the appearance of clearings due to polluting fumes and now re-colonised by chestnut, birch and oak trees [61]; the continuous changes in use characterising particular geochore once hosting fortified military structures [62], today predominantly occupied by forests and subject to pressing urbanisation phenomena.
The MCA showed two land cover sequences correlating, respectively, to relief and the distance from the city. When passing from terrasse to linear valley and escarpment, the sequence is as follows: agricultural lands, urbanised lands, grassland, and finally, forests, with a questioning position of the infrastructural land between agricultural lands and the urbanised lands. When the distance from the city centre increases, the sequence is as follows: urbanised lands, infrastructural lands, meadows, forests, and finally, agricultural lands. This analysis points out a weak presence of green spaces and agricultural lands near the city, which could be prioritized for future development.
Besides the need to analyse each geochore history to understand current land uses, this research highlights some land use change trajectories and questions how urban planning does or does not consider slopes as a constraint or an opportunity for different land uses. The present research focused mainly on the geomorphological characteristics of the valley hillslopes. Yet, the climatic, lithologic, economic, and political contexts of our case study are important factors to be considered in understanding how people and planners construct the city. For instance, land ownership is another pattern that should be considered in understanding past, present, and future land uses. Moreover, while characterising the geochore, mainly as an abiocomplex, little attention was paid to the soil covers, which drastically change the soil and hydrological conditions and, consequently, land use possibilities.

5. Conclusions

This contribution reveals the singularity and complexity of valley hillslopes, which are poorly considered in urban planning documents but should be integrated into urban policies as potential cultural, ecological, or recreational resources for populations.
This research, developed and applied in the context of a Belgian urban agglomeration, used a methodology based on a multi-scalar and statistical valuable approach for identifying and characterising valley hillslopes.
This methodology highlights the co-presence of five forms of hillslope valleys, due to their reshaping by tributaries, and evaluates how forms influence their uses. Within the Liège conurbation, valley hillslopes are mainly occupied by grasslands and forests, but a quarter is covered by urbanised soil. Terraces are predominantly occupied by built spaces, escarpments are predominantly occupied by forests, while the branching valleys, linear valleys, and amphitheatres are covered by grassland. Nevertheless, the escarpments and branched valleys are subject to higher urbanisation than other valley hillslope forms. The declivity factor has less influence on urbanisation compared to agricultural use.
The agro-geographic region, and therefore the lithology, also influences the use of valley hillslopes. In particular, the competition between agriculture and urbanisation is notably intense in the branched valleys of the Plateau Hesbignon.
Concerning the urbanisation of Liège’s valley hillslopes, there is a moderate relationship between land cover and the distance from Liège’s city centre. More specifically, there is a relatively strong interaction between the presence or absence of building-dominated geochores and the distance to the former historic centre. It is important to consider the city’s historical development, which has incorporated old settlements and land use patterns within a larger system.
The results of the MCA identify a large number of geochores with distinct characteristics. The links between land cover use and roles and the characterisation of the spatial relationships within and on the edge of the geochore could, therefore, be explored further. This tested method could be integrated with approaches and readings related to land use evolution. In this sense, valley hillslopes could be further rediscovered or characterised. Exploring geochores’ spatial complexity, including diachronic variables and a comparison with the value assigned by population, represents open research avenues for exploring their potential roles within urban metabolism.

Author Contributions

Conceptualization, S.S. and G.D.; methodology, S.S., G.D. and L.P.; formal analysis, G.D. and L.P.; investigation, G.D.; resources, G.D., data curation, G.D.; writing—original draft preparation, G.D, L.P. and S.S.; writing—review and editing, S.S.; visualization, G.D.; supervision, S.S.; project administration, G.D. and S.S.; funding acquisition, S.S. All authors have read and agreed to the published version of the manuscript.

Funding

This study is part of the Recherche transversale sur les rôles des Paysages-Versants dans le métabolisme Urbain, Projets Sectoriels de Recherche en Sciences Humaines (FSR 2022), University of Liège.

Data Availability Statement

New shapefiles and data are available upon request to Giacomo Dallatorre or Serge Schmitz.

Acknowledgments

We thank Rita Occhiuto and Marc Goossens for their collaboration within the framework of the PAVU project.

Conflicts of Interest

The authors declare no conflicts of interest.

Appendix A

Figure A1. List of planning instruments or documents consulted.
Land 13 01353 g0a1

Appendix B

Figure A2. Land cover clusters’ “V.test” values (1), declivity clusters’ “V.test” values (2), description of the five first dimensions of the MCA by active variables (p-value < 0.05) (3).
Land 13 01353 g0a2

References

  1. Chau, N.L.; Law, M.S.M. Impacts of seasonality and urbanisation on groundcover community: A case study on the soil slopes of Hong Kong. Urban Ecosyst. 2023, 26, 1113–1129. [Google Scholar] [CrossRef]
  2. Roncato, J.; Martins, M.M.; Silva, M.M.L. Remote sensing applied to geological, structural, and mass movements characterisation in the connection between curral homocline and moeda syncline, quadrilátero ferrífero region, brazil. Braz. J. Geol. 2023, 53, e20220040. [Google Scholar] [CrossRef]
  3. Zwoliniski, Z.; Jasiewicz, J.; Mazurek, M.; Hildebrandt-Radke, I.; Makohonienko, M. Geohazards and geomorphological setting in Poznan urban area, Poland. J. Maps 2021, 17, 202–214. [Google Scholar] [CrossRef]
  4. Shi, K.; Liu, G.; Zhou, L.; Cui, Y.; Liu, S.; Wu, Y. Satellite remote sensing data reveal increased slope climbing of urban land expansion worldwide. Landsc. Urban Plan. 2023, 235, e104755. [Google Scholar] [CrossRef]
  5. Eulilli, V.; Ferri, F.; Puzzilli, L.M. The Role of Geophysics in Urban Landslides Studies: Two Case Histories in Rome, Engineering Geology for Society and Territory, Urban Geology, Sustainable Planning and Landscape Exploitation; Springer: Cham, Switzerland, 2015; Volume 5, pp. 853–856. [Google Scholar] [CrossRef]
  6. Martín-Díaz, J.; Palma, P.; Golijanin, J.; Nofre, J.; Oliva, M.; Cerngic, N. The urbanisation on the slopes of Sarajevo and the rise of geomorphological hazards during the post-war period. Cities 2018, 72, 60–69. [Google Scholar] [CrossRef]
  7. Schoorl, J.M.; Veldkamp, A. Linking land use and landscape process modelling: A case study for the Álora region (south Spain). Agric. Ecosyst. Environ. 2001, 85, 281–292. [Google Scholar] [CrossRef]
  8. Sung, C.Y.; Li, M. The effect of urbanisation on stream hydrology in hillslope watersheds in central Texas. Hydrol. Process. 2010, 24, 3706–3717. [Google Scholar] [CrossRef]
  9. Yan, Z.; Li, P.; Li, Z.; Xu, Y.; Zhao, C.; Cui, Z. Effects of land use and slope on water quality at multi-spatial scales: A case study of the Weihe River Basin. Environ. Sci. Pollut. Res. 2023, 30, 57599–57616. [Google Scholar] [CrossRef]
  10. Sereni, E. Storia del Paesaggio Agrario Italiano; Laterza: Bari, Italy, 1961. [Google Scholar]
  11. Steenbergen, C. Architecture and Landscape: The Design Experiment of the Great European Gardens and Landscapes; Prestel Publishing: Munich, Germany, 1996. [Google Scholar]
  12. Astaburuaga, A.T. Towards the design of the valley-city through the case of the historic center of Valencia, Spain. Geocarrefour 2022, 96, 20263. [Google Scholar] [CrossRef]
  13. Hubert, I.; Reynard, E.; Carcaud, N. Make the geodiversity of the Grenoble region visible and overcome the urban / mountain divide through the prism of landscape and its representations. Geomorphologie 2019, 25, 233–252. [Google Scholar] [CrossRef]
  14. Ambrosino, C.; Buyck, J. The mountain metropolis’s land design project. Grenoble, from plain to slope. Rev. Geogr. Alp. 2018, 106, 4673. [Google Scholar] [CrossRef]
  15. Olarieta, J.R.; Rodríguez-Valle, F.L.; Tello, E. Preserving and destroying soils, transforming landscapes: Soils and land-use changes in the vallès county (Catalunya, Spain) 1853–2004. Land Use Policy 2008, 25, 474–484. [Google Scholar] [CrossRef]
  16. Claghorn, J.; Werthmann, C. Shifting ground: Landslide risk mitigation through community-based landscape interventions. J. Landsc. Archit. 2015, 10, 6–15. [Google Scholar] [CrossRef]
  17. Diedrich, L.; Cervera, M. Barcelona’s Tres Turons: Three hills and three cruelties. J. Landsc. Archit. 2020, 15, 56–73. [Google Scholar] [CrossRef]
  18. Franch, M. Drawing on site: Girona’s shores. J. Landsc. Archit. 2018, 13, 56–73. [Google Scholar] [CrossRef]
  19. Lambertini, A. Seminare un prato: Divagazioni teoriche e sperimentazioni pratiche nel “Bosco Cantastorie” di Villa Strozzi al Boschetto. In Manuale di Coltivazione Pratica e Poetica per la Cura dei Luoghi Storici e Archeologici nel Mediterraneo; Latini, L., Matteini, M., Eds.; Il Poligrafo: Padova, Italy, 2017; pp. 229–240. [Google Scholar]
  20. Ville de Liège. Manifeste. Synthèse des Grandes Ambitions Retenues par le Collège pour L’élaboration du «Projet de Territoire»; Ville de Liège: Liège, Belgium, 2023. [Google Scholar]
  21. Selby, M.J. Hillslope Materials and Processes; Oxford University Press: Oxford, UK, 1993. [Google Scholar]
  22. Pinchemel, P.; Pinchemel, G. La Face de la Terre; Armand Colin: Paris, France, 1988. [Google Scholar]
  23. Swanwick, C. Landscape Character Assessment: Guidance for England and Scotland; Countryside Agency and the Scottish Nature Heritage: Cheltenham, UK, 2002. [Google Scholar]
  24. Swanwick, C. The assessment of countryside and landscape character in England: An overview. In Countryside Planning; Kevin Bishop, K., Phillips, A., Eds.; Routledge: London, UK, 2003; pp. 109–124. [Google Scholar]
  25. Tudor, C. An Approach to Landscape Character Assessment; Natural England: York, UK, 2014. [Google Scholar]
  26. Minár, J.; Evans, I.S. Elementary forms for land surface segmentation: The theoretical basis of terrain analysis and geomorphological mapping. Geomorphology 2008, 95, 236–259. [Google Scholar] [CrossRef]
  27. Saks, M.; Minár, J. Assessing the natural hazard of gully erosion through a Geoecological Information System (GeIS): A case study from the Western Carpathians. Geografie 2012, 117, 152–169. [Google Scholar] [CrossRef]
  28. Droeven, E.; Feltz, C.; Nummert, M. Les Territoires Paysagers de Wallonie; Etudes et Documents, CPDT, 4: Namur, Belgium, 2004. [Google Scholar]
  29. Bertrand, G.; Tricart, J. Paysage et géographie physique globale. Esquisse méthodologique. Rev. Géographique Pyrénées Sud-Ouest 1968, 39, 249–272. [Google Scholar] [CrossRef]
  30. Demek, J. The landscape as a geosystem. Geoforum 1978, 9, 29–34. [Google Scholar] [CrossRef]
  31. Haase, G. Medium scale landscape classification in the German Democratic Republic. Landsc. Ecol. 1989, 3, 29–41. [Google Scholar] [CrossRef]
  32. Sotchava, V.B. O Estudo de Geossistemas; Métodos em Questão, 16; IG-USP: São Paulo, Brasil, 1977. [Google Scholar]
  33. Berque, A. Les Raisons du Paysage de la Chine Antique aux Environnements de Synthèse; Editions Hazan: Paris, France, 1995. [Google Scholar]
  34. Newman, P.W.G. Sustainability and cities: Extending the metabolism model. Landsc. Urban Plan. 1999, 44, 219–226. [Google Scholar] [CrossRef]
  35. Tjallingii, S.P. Ecopolis: Strategies for Ecologically Sound Urban Development; Backhuys Publishers: Leiden, The Netherlands, 1993. [Google Scholar]
  36. Balmori, D. A Landscape Manifesto; Yale University Press: New Haven, CT, USA, 2010. [Google Scholar]
  37. Guilland, C.; Maron, P.A.; Damas, O.; Ranjard, L. Biodiversity of urban soils for sustainable cities. Environ. Chem. Lett. 2018, 16, 1267–1282. [Google Scholar] [CrossRef]
  38. Juwet, G.; Ryckewaert, M. Energy Transition in the Nebular City: Connecting Transition Thinking, Metabolism Studies, and Urban Design. Sustainability 2018, 10, 955. [Google Scholar] [CrossRef]
  39. Barua, M.; Sinha, A. Cultivated, feral, wild: The urban as an ecological formation. Urban Geogr. 2023, 44, 2206–2227. [Google Scholar] [CrossRef]
  40. McDonald, G.W.; Patterson, M.G. Bridging the divide in urban sustainability: From human exemptionalism to the new ecological paradigm. Urban Ecosyst. 2007, 10, 169–192. [Google Scholar] [CrossRef]
  41. Subercaseaux, D.; Gastó, J.; Ibarra, J.T.; Arellano, E.C. Construction and Metabolism of Cultural Landscapes for Sustainability in the Anthropocene. Sustainability 2020, 12, 6301. [Google Scholar] [CrossRef]
  42. Dinarès, M. Urban Metabolism: A review of recent literature on the subject. Doc. d’Anàlisi Geogràfica 2014, 60, 551–571. [Google Scholar] [CrossRef]
  43. Pietta, A.; Tononi, M. Re-naturing the city: Linking urban political ecology and cultural ecosystem services. Sustainability 2021, 13, 1786. [Google Scholar] [CrossRef]
  44. Demoulin, A. Landscapes and Landforms of Belgium and Luxembourg; Springer International Publishing AG: Berlin/Heidelberg, Germany, 2018. [Google Scholar] [CrossRef]
  45. De Moor, G.; Pissart, A. Les formes du relief. In Géographie de la Belgique; Crédit Communal: Bruxelles, Belgium, 1992; pp. 130–216. [Google Scholar]
  46. European Environment Agency. Europe’s Biodiversity—Biogeographical Regions and Seas; European Environment Agency: Copenhagen, Denmark, 2002; Available online: https://www.eea.europa.eu/publications/report_2002_0524_154909 (accessed on 15 April 2024).
  47. Vanderstraeten, L.; Van Hecke, E. Les régions urbaines en Belgique. Belgeo 2019, 1, 32246. [Google Scholar] [CrossRef]
  48. International Meuse Commission. International River Basin District Meuse—Analysis, Roof Report; International Meuse Commission: Liège, Belgium, 2005. [Google Scholar]
  49. Kurth, G. Les origines de la ville de Liège; Société d’art et d’histoire du diocèse de Liège: Liège, Belgium, 1882. [Google Scholar]
  50. Hélin, E. Vie et mort des bassins industriels. In Bulletin du Département d’Histoire Économique; Université de Genève: Geneva, Switzerland, 1987; Volume 17. [Google Scholar]
  51. Kurth, G. La cité de Liège au moyen âge. Bibliothèque L’école Chartes 1910, 71, 375–376. Available online: https://www.persee.fr/doc/bec_0373-6237_1910_num_71_1_461002_t1_0375_0000_000 (accessed on 28 March 2024).
  52. Lejeune, J. Liege. De la Principaute a La Metropole; Mercator: Anvers, Belgium, 1967. [Google Scholar]
  53. Hélin, E. Le Paysage Urbain de Liège Avant la Révolution Industrielle; Éditions de la Commission communale de l’histoire de l’ancien Pays de Liège: Liege, Belgique, 1963. [Google Scholar]
  54. De Block, G. Designing the Nation the Belgian Railway Project, 1830—1837. Technol. Cult. 2011, 52, 703–732. [Google Scholar] [CrossRef]
  55. Firket, J.; Batta Castermans, M.; Desoignies, M.; Van Lancker, M.; Thomas, M. The Problem of Cancer of the Lung in the Industrial Area of Liège during Recent Years. J. R. Soc. Med. 1958, 51, 347–352. [Google Scholar] [CrossRef]
  56. Husson, F.; Josse, J.; Le, S.; Mazet, J.; Husson, M.F. Package ‘factominer’. R Package 2016, 96, 698. [Google Scholar]
  57. Baudot, Y.; Sporck, J.A.; Donnay, J.-P.; Gewelt, M. Liège Prépare son Avenir; E. Wahle: Liège, Belgium, 1980. [Google Scholar]
  58. Demoulin, B. Histoire de Liège, une Cité, une Capitale, une Métropole; Marot/Les Grandes Conférences Liégeoises: Bruxelles, Belgium; Liège, Belgium, 2017. [Google Scholar]
  59. Christians, C.; Daels, L. Belgium, a geographical introduction to its regional diversity and its human richness. Bull. Société Géographique Liège 1988, 24, 1–180. [Google Scholar]
  60. Hélin, E. Traces du paysage rural ancien sur le territoire de la ville de Liège. Bull. Société Géographique Liège 1996, 32, 293–297. [Google Scholar]
  61. Graitson, E. Inventaire et caractérisation des sites calaminaires en Région Wallonne. Nat. Mosana 2006, 58, 83–124. [Google Scholar]
  62. Meyers, R.; Balk, L. La Chartreuse. Couvent—Couvent fortifié—Fort—Caserne. Bull. Cent. Liégeois D’histoire D’archéologie Mil. 1982, 1, 6–33. [Google Scholar]
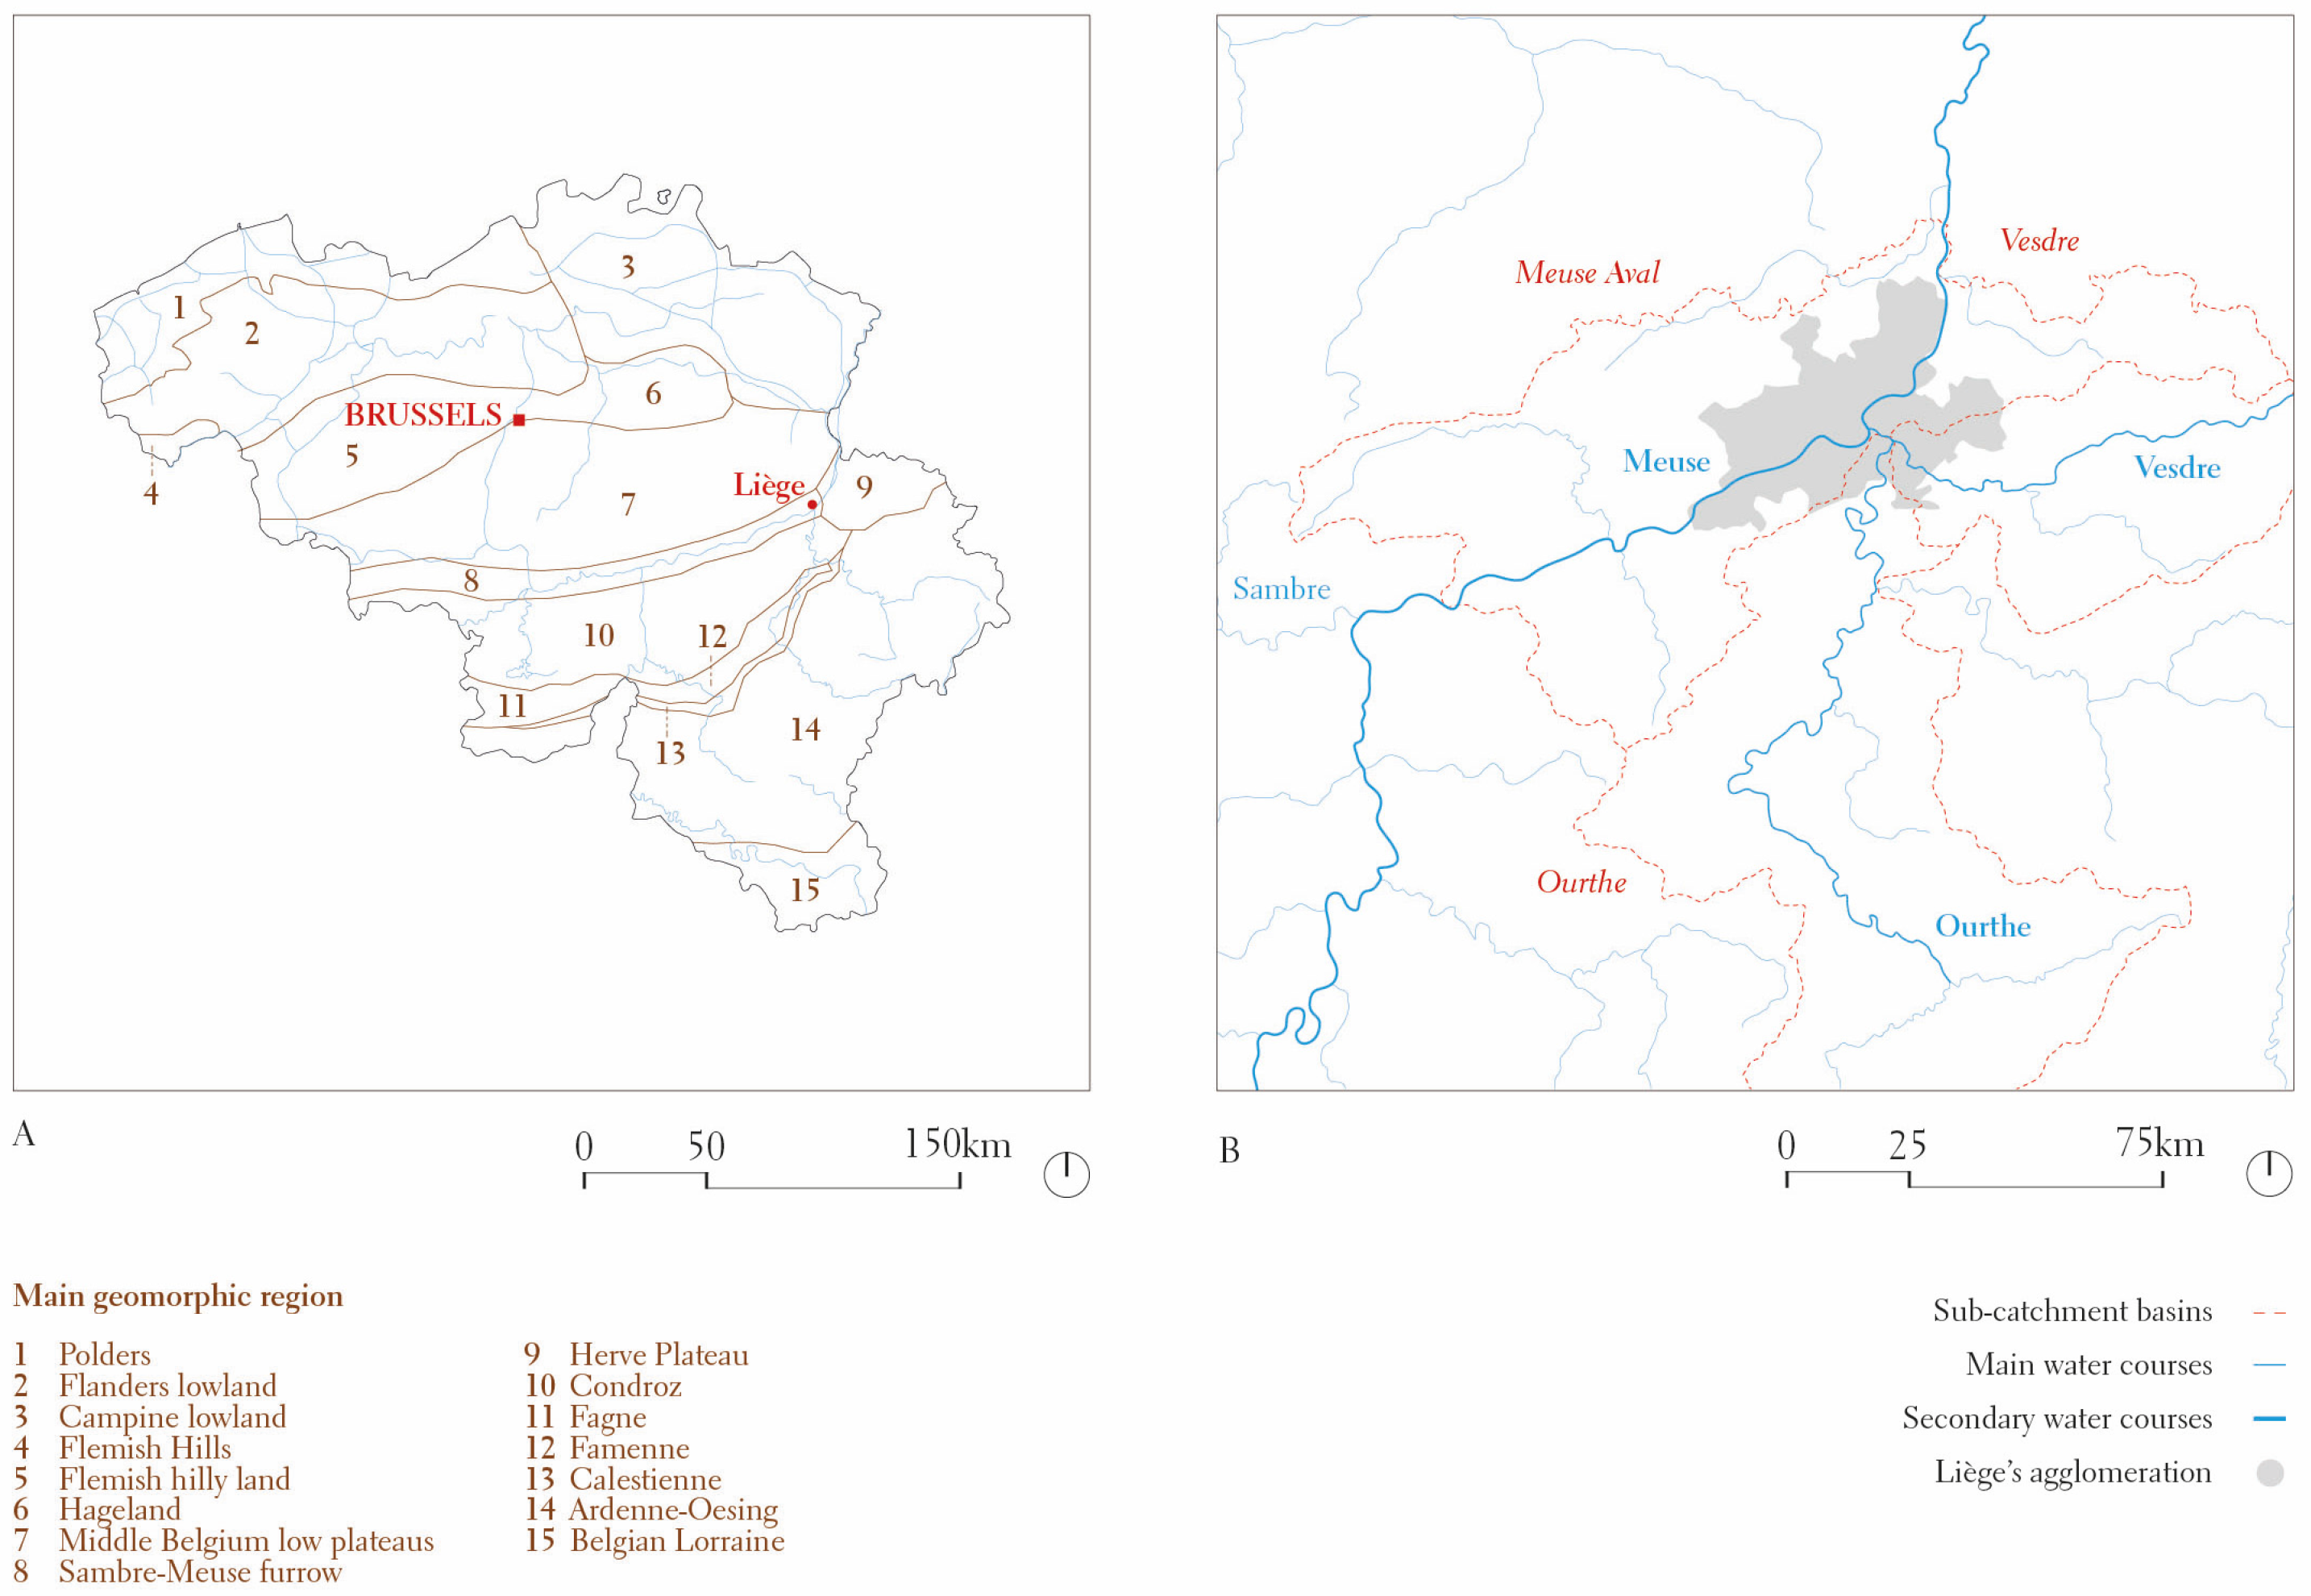
Figure 1. Liège’s position in relation to main geomorphic region of Belgium and Luxemburg (A) and in relation to the Meuse Aval, Ourthe, and Vesdre hydrographic sub-basins (B).
Land 13 01353 g001
Figure 2. Methodological framework.
Land 13 01353 g002
Figure 3. Examples of characteristic slope lines perceived during surveys around Liège’s conurbation. (A) Upper break line towards the top of the plateau; (B) lower break line towards the valley area; (C) talweg line; (D) line of change of exposure or orientation.
Land 13 01353 g003
Figure 4. DTM model with a declivity percentage assigned to each pixel (A), filtered with categorised declivity percentages (B), exposure classes (C), Watershead (D). Data: Wallonia’s Digital Terrain Model with a resolution of 0.5 m, from Lidar acquisitions, carried out in 2021 and 2022.
Land 13 01353 g004
Figure 5. Geochore’s identification method applied to Liège.
Land 13 01353 g005
Figure 6. Geochore percentages according to agro-geographic regions with which they interact (A), geochore grouping and percentages according to geofacies (B).
Land 13 01353 g006
Figure 7. Geochore grouping and percentages according to land cover clusters.
Land 13 01353 g007
Figure 8. Geochore land cover cluster percentages in relation to agro-geographic region (A), geofacies (B), exposition (C), secondary historic centre’s distance from city centre (Place St.Lambert) (D).
Land 13 01353 g008
Figure 9. Geochore land cover clusters percentages in relation to declivity.
Land 13 01353 g009
Figure 10. Factorial plane constructed from the first two dimensions of the MCA.
Land 13 01353 g010
Figure 11. Comparative analysis between Plan de Secteur and land cover. Geochores’ total surface area according to the Plan de Secteur (A), geochores’ total surface area by land cover (B), surface area urbanised and potentially urbanisable: comparison of geochores by geofacies (C).
Land 13 01353 g011
Disclaimer/Publisher’s Note: The statements, opinions and data contained in all publications are solely those of the individual author(s) and contributor(s) and not of MDPI and/or the editor(s). MDPI and/or the editor(s) disclaim responsibility for any injury to people or property resulting from any ideas, methods, instructions or products referred to in the content.