Article

Analysis of Spatial Divergence in Bird Diversity Driven by Built Environment Characteristics of Ecological Corridors in High-Density Urban Areas

1
College of Landscape Architecture, Nanjing Forestry University, Nanjing 210037, China
2
Shanghai Academy of Landscape Architecture Science and Planning, Shanghai 200232, China
3
College of Architecture and Urban Planning, Tongji University, Shanghai 200092, China
4
Landscaping Committee of the Science, Technology Commission of the Ministry of Housing and Urban-Rural Development, Beijing 100835, China
*
Authors to whom correspondence should be addressed.
Land 2024, 13(9), 1359; https://doi.org/10.3390/land13091359
Submission received: 10 July 2024 / Revised: 21 August 2024 / Accepted: 22 August 2024 / Published: 25 August 2024
(This article belongs to the Section Land, Biodiversity, and Human Wellbeing)

Abstract

:
Urban ecological corridors play an important role in facilitating bird migration and maintaining biodiversity in urban landscapes as key connections between habitat patches. However, the effects of built environment characteristics of urban ecological corridors on bird diversity have not been well understood. In this study, we used Minhang District, Shanghai, as an example to describe the built environment of urban ecological corridors through three dimensions (habitat characteristics, degree of surrounding urbanization, and degree of slow-traffic connectivity). We calculated species richness, abundance, Shannon–Wiener index, and Simpson Index to assess bird diversity based on the bird observation dataset from the Citizen Science Data Sharing Platform. The effects of built environment characteristics of urban ecological corridors on bird diversity were quantified by the Generalized Linear Model. The results showed that: (1) There were significant differences in the built environment characteristics of urban ecological corridors, which formed the spatial differentiation pattern of bird diversity. (2) Different built environment features of urban ecological corridors have different impacts on bird diversity. Habitat suitability of urban ecological corridors was positively correlated with bird diversity, with birds preferring to inhabit waters with an area of more than 1 ha. The degree of urbanization was negatively correlated with bird diversity, with distance to the center of the area proving to have the strongest positive effect. The degree of slow-traffic connectivity proved that low-intensity human activities in urban ecological corridors had a lower impact on bird diversity. The above findings can provide scientific reference for the construction of urban and regional ecological networks in the future.

1. Introduction

High-density urbanization development erodes natural habitat space, resulting in the absence of biohabitat systems in eco-city planning and construction, causing fragmentation of the landscape of the original habitat space, restricting the dispersal and reproduction of animals, and leading to a reduction in urban biodiversity [1,2]. The International Union for the Conservation of Nature (IUCN) and the European Community (EC) have identified in the Nature-Based Solution (Nb S) that the realization of multifunctional natural, semi-natural, and man-made green and blue spatial interconnections (i.e., urban ecological corridors) through green/blue infrastructure is a central means of supporting sustainable development while addressing the loss of urban biodiversity [3]. “Urban ecological corridor” refers to the spatial sum of natural or artificially formed ecological resources distributed in the form of linear corridors within the city and its sphere of influence for the purpose of providing dual functions of ecological and social services [4]. Different from the concept of traditional urban green space, urban ecological corridors emphasize urban biodiversity protection needs more, taking into account the needs of the public human habitat and ecological environment, improving the ecological quality of the human habitat environment, and emphasizing the creation, maintenance, and restoration of a diversified, hierarchical, and systematic urban ecological space network system. Urban ecological corridors can effectively connect isolated or dispersed ecological landscape units, promote the exchange of species between different habitats, and safeguard species diversity [5], and they can also enhance the functional connectivity of ecological landscapes, as well as provide urban residents with recreational environments and other comprehensive urban-oriented functions. Globally, most countries have recognized the importance of urban ecological corridors in restoring urban biodiversity and enhancing the well-being of their inhabitants [6,7,8]. Despite its growing importance, there is still a relative lack of research on the optimal configuration of the internal components of ecological corridors in high-density urban areas, as well as on the influence of the surrounding environmental matrix on the functioning of the corridors [9]. In-depth exploration in this area is crucial for guiding the science and effectiveness of corridor design, especially in terms of its application to promote biodiversity restoration and the well-being of residents. As the economic center of China, Shanghai is a typical high-density urban area, leading to further encroachment and fragmentation of the city’s already scarce ecological space, and the construction of urban ecological corridors has become an important means of ecological support for the city as it moves towards becoming an outstanding international metropolis. Therefore, there is a need for more research on ecological corridors in high-density urban areas in order to fully understand and enhance the ecological benefits and social values of urban ecological corridors.
Suitable indicator species should be able to reflect wider biodiversity changes and be sensitive to environmental stresses and ecological disturbances. The selection of representative species is therefore particularly important for understanding and assessing the health of urban ecosystems and their changes. Birds are increasingly recognized by scholars as an important component of urban ecosystems and urban biodiversity, and an important detector of their changes [10]. On the one hand, bird diversity is relatively easy to monitor and count in urban landscapes, and bird-specific survey methods are well established [11], moreover, birds are at the middle and upper levels of the food chain in urban ecosystems, and changes in their numbers and species can reflect changes in other species, which can be a good indicator of the suitability of urban habitats. On the other hand, birds are a species sensitive to changes in habitat patterns, highly responsive to changes in ecosystem dynamics and human disturbance, etc., and highly mobile and habitat-selective [12], therefore, they are often chosen as the most important bioindicator species in times of habitat change and ecosystem change. In summary, we took urban ecological corridors in the context of rapid urbanization as the research object and selected birds as an indicator species of urban biodiversity.
In historical studies, the effects of the urban built environment on bird diversity have often been explored at both landscape and habitat scales [13]. Under landscape-scale studies, parameters of neighboring land use types tend to have significant effects on bird diversity [14,15]—habitat quantity and landscape diversity are closely related to bird diversity [16]. Under the habitat-scale study, habitat size showed an overall positive effect on bird diversity [17,18]—multi-layered composite vegetation structure effectively enhances bird abundance and diversity in urban habitats [19], and human activities such as pedestrians, traffic, noise, and light environments often have significant negative impacts on bird abundance [20,21]. Compared to habitat-scale studies, which usually require extensive field surveys for data collection and quantification, it is possible to characterize the built environment of urban ecological corridors at the landscape scale by analyzing vegetation composition, building height, land use, population density, noise, and nighttime lighting, relying on remotely sensed imagery and urban big data [22]. The study of the impacts of multidimensional features on biodiversity will be a key focus for the future, and the results of landscape-scale studies will be more useful in providing guiding recommendations for urban planning and biodiversity conservation.
In summary, this study, at the landscape scale, aims to reveal that different built environmental factors will affect the biodiversity conservation function of ecological corridors to different degrees. It also constructs a quantitative model of the two, so as to identify the environmental factors that have significant effects on bird diversity. The study includes: (1) quantifying the distribution pattern of urban bird diversity and built environment features of urban ecological corridors based on GIS spatial analysis tools such as Kriging interpolation; (2) identifying the key factors of built environment features of urban ecological corridors affecting bird diversity based on the Generalized Linear Model; (3) based on the Geoda 2.1 platform, bivariate spatial autocorrelation analysis was conducted on the comprehensive characteristics of the built environment across various dimensions and the richness of bird species, in order to explore the impact of key factors of urban ecological corridor built environment characteristics on the spatial distribution of avian diversity.

2. Materials and Methods
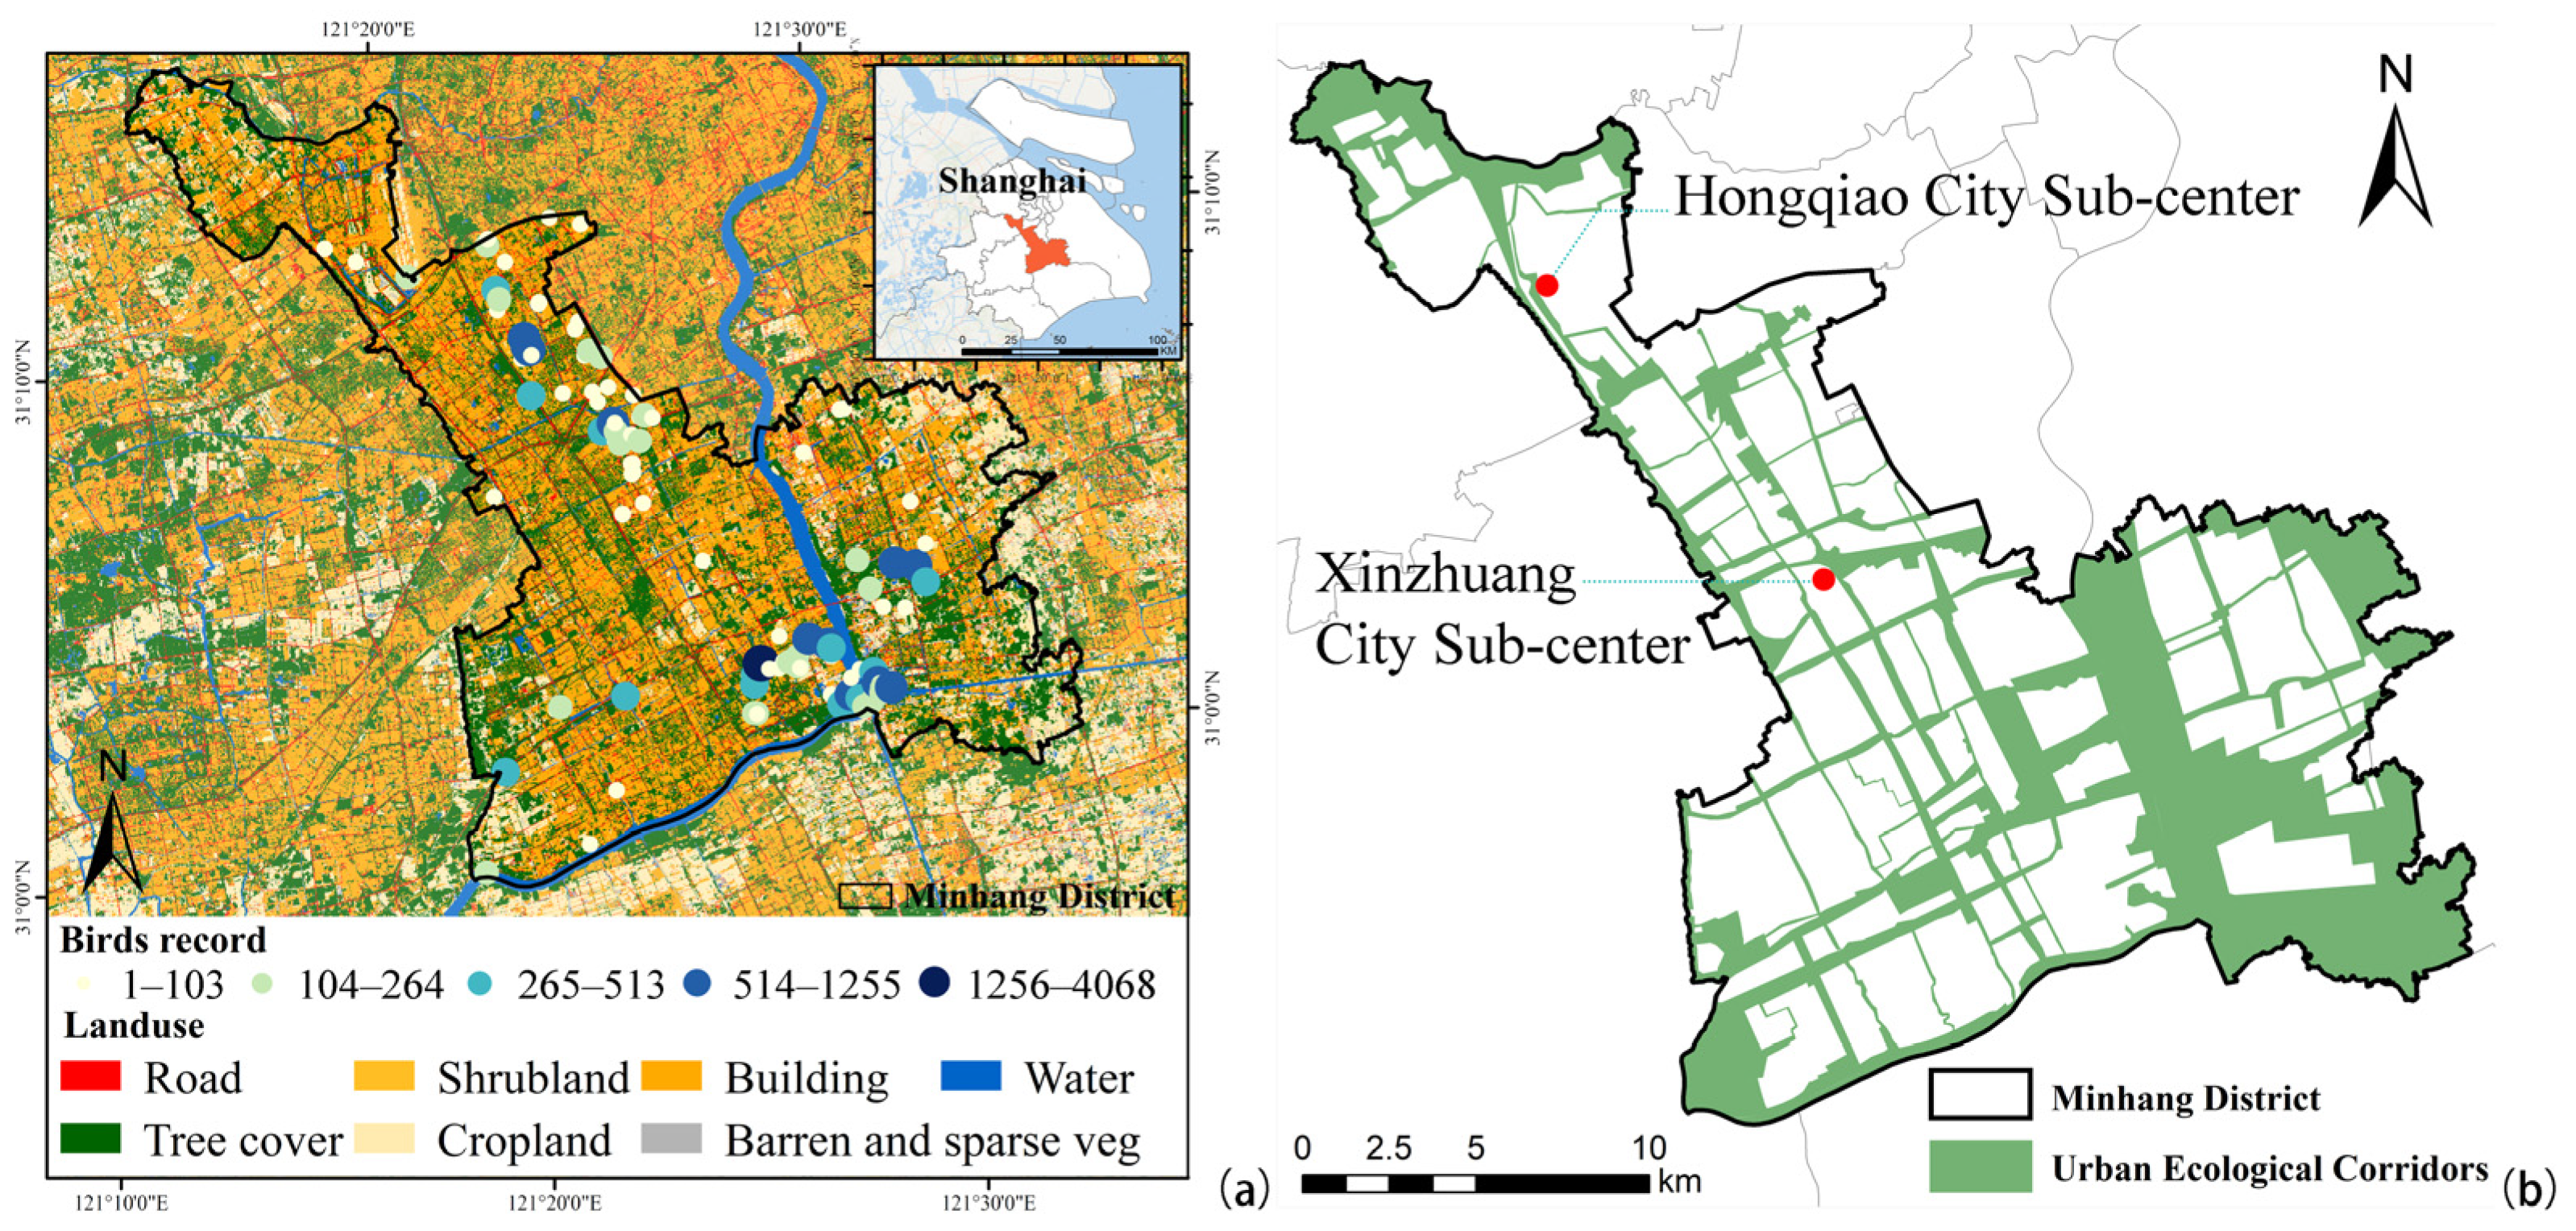
2.1. Study Area

The subject of this study was Minhang District, Shanghai, which is located in the south-western part of downtown Shanghai (30°59′ N–31°15′ N, 121°14′ E–121°34′ E). Minhang District is an important external transportation hub of Shanghai, and an important industrial base in the south-western part of the city. Minhang District, with a total area of 371.68 ha, is located in the transition zone extending from the center of Shanghai to the suburbs. It includes high-density built-up areas, cropland, and bare land in south-central Shanghai (Figure 1a). Minhang District encompasses almost all land-cover types, so it represents a complex urban habitat [23]. Meanwhile, Minhang District is a high-density urbanized area, and rapid urbanization will bring problems such as landscape fragmentation and biodiversity decline, and the reasonable construction of urban ecological corridors will help to enhance the diversity of urban birds. In addition, Minhang District, with both high-density economic activities in the main urban area of Shanghai, industrial land use, and urban-rural transition zones, is an ideal place to study the role of different types of urban built environment substrates on bird diversity. We selected two major urban sub-centers (Xinzhuang Urban Sub-center and Hongqiao Urban Sub-center) with built urban ecological corridors in Minhang District, Shanghai, according to the Public Center System and Ecological Spatial Planning of Minhang District Master Plan and Land Use Master Plan (2017–2035) (Figure 1b). In sum, the urban ecological corridor in Minhang District, Shanghai, was selected as the study area in this study.

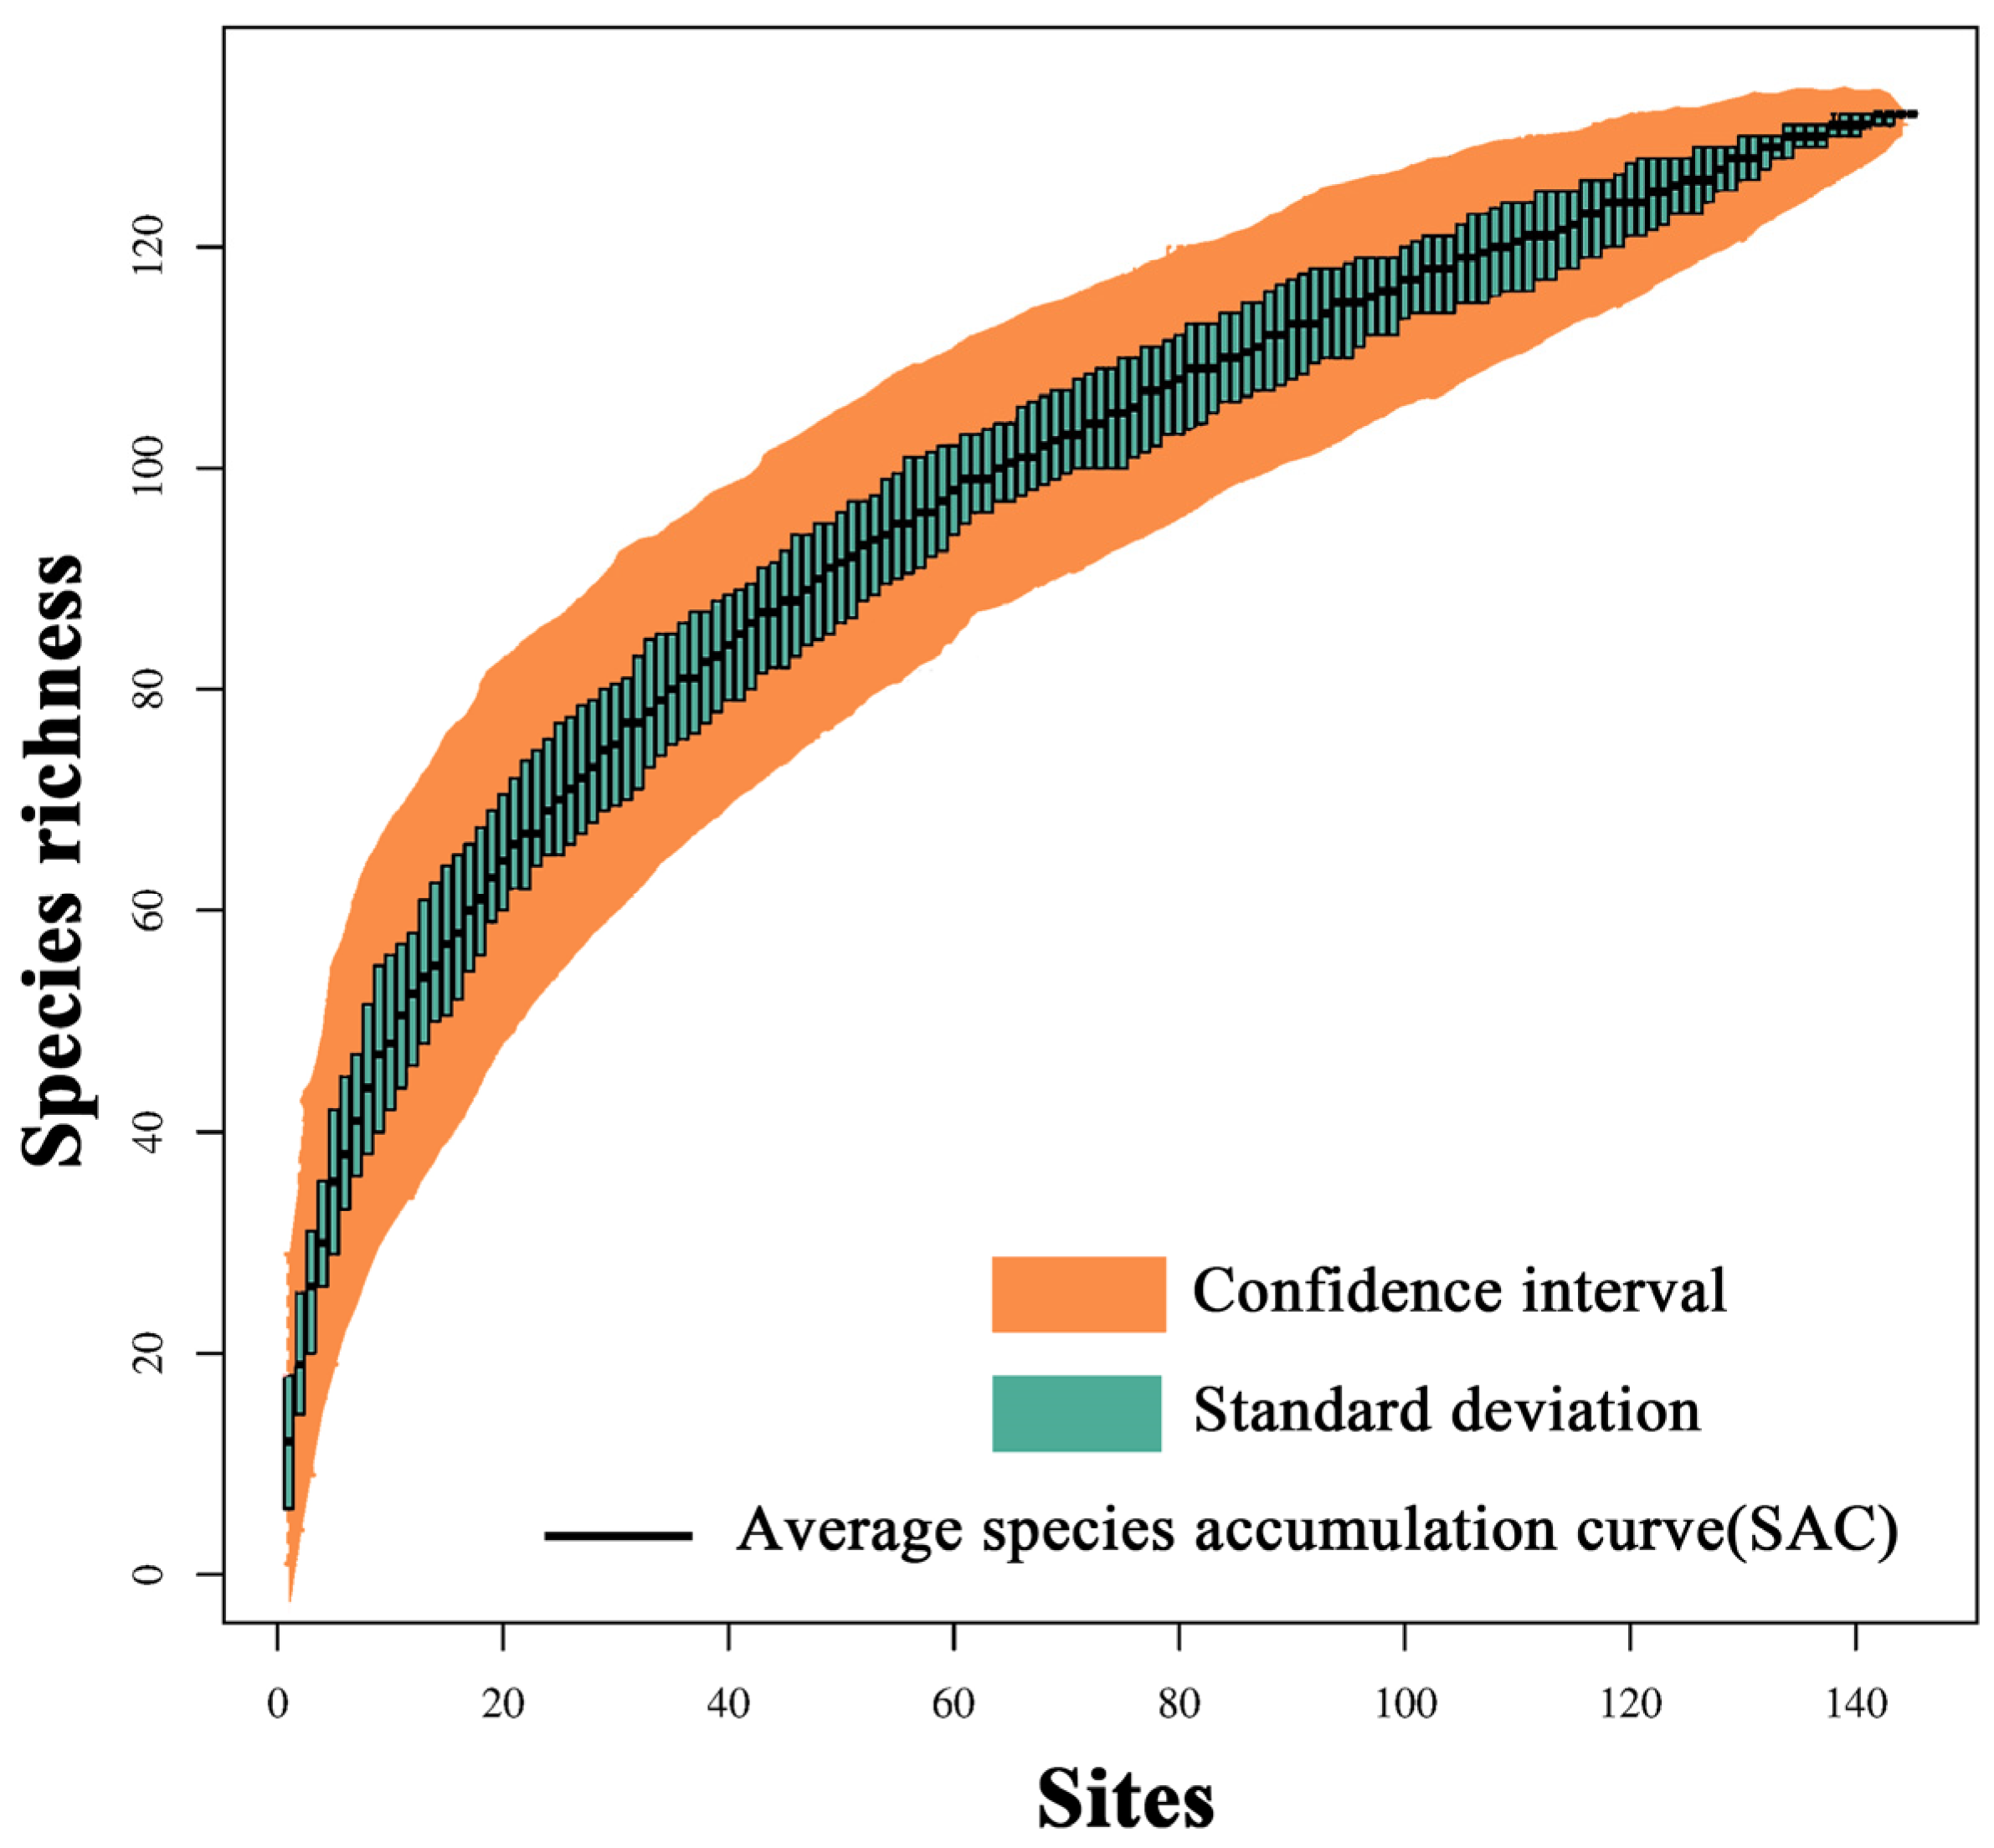
2.2. Bird Surveys and Diversity

In this study, we used the China Birdwatching Records Center (www.birdreport.cn, accessed on 2 February 2024), a citizen science data sharing platform, to download a huge number of bird location records in Shanghai in 2023, and after checking the data we deleted large deviations and duplicated records of the same location and species in the same period. Finally, a total of 1193 records were screened for all of Shanghai, of which 445 records were for Minhang District (Figure 1a). Each record included key information such as species name, number, survey co-ordinates, and observation time. By categorizing the birdwatching records according to the “List of Birds Classification and Distribution in China (Third Edition)” [24], a total of 132 bird species were counted in Minhang District (Table S1), based on the spatial correlation of urban bird distribution and following the principles of focal species selection: (1) ecologically important or valuable; (2) biologically representative and typical; (3) more sensitive to the living environment; (4) they are common birds in Shanghai (excluding migratory birds); and finally, 82 species of woodland birds were selected for further study. Because woodland birds are an ecologically sensitive group with low flight ability and are particularly dependent on urban green spaces for survival, they are often used as focal species in urban ecological network studies.
Species Accumulation Curve (SAC) is a useful tool for determining the validity and adequacy of sampling [25]. We used the R package “Vegan” [26] to plot the species accumulation curves of the bird communities in the study samples in Minhang District, and the species accumulation curves were close to an asymptote (Figure 2), suggesting that the level of completeness of bird inventories in the study area was high enough to allow for the next step in the study.
Richness, abundance, the Shannon–Wiener index, and the Simpson index are commonly used to measure bird diversity [6,27,28,29]. Richness and abundance quantify increases or decreases in species type and number of individuals, respectively; the Shannon–Wiener and Simpson indices include measures of community heterogeneity. They are combined indicators of richness and evenness that give a more systematic and clear picture of the structure of the biome. We used the R package “iNEXT” to calculate the Shannon Diversity index and Simpson Diversity index for birds [30]. In the case of the Shannon–Wiener index, two components: (i) the number of species, and (ii) the evenness of the distribution of individuals among species. The formula is as follows:
H = P i ln P i
where P i is the proportion of the number of individuals of this species to the total number of individuals, and H represents the Shannon–Wiener index, the higher the value of H , the higher the diversity of species in a particular community.
The Simpson index is calculated using the following formula:
D = 1 n / N 2
where n represents the number of individuals per species, N represents the total number of individuals of all species, and D represents the Simpson index, with values ranging from 0 to 1, with smaller values indicating higher species diversity.

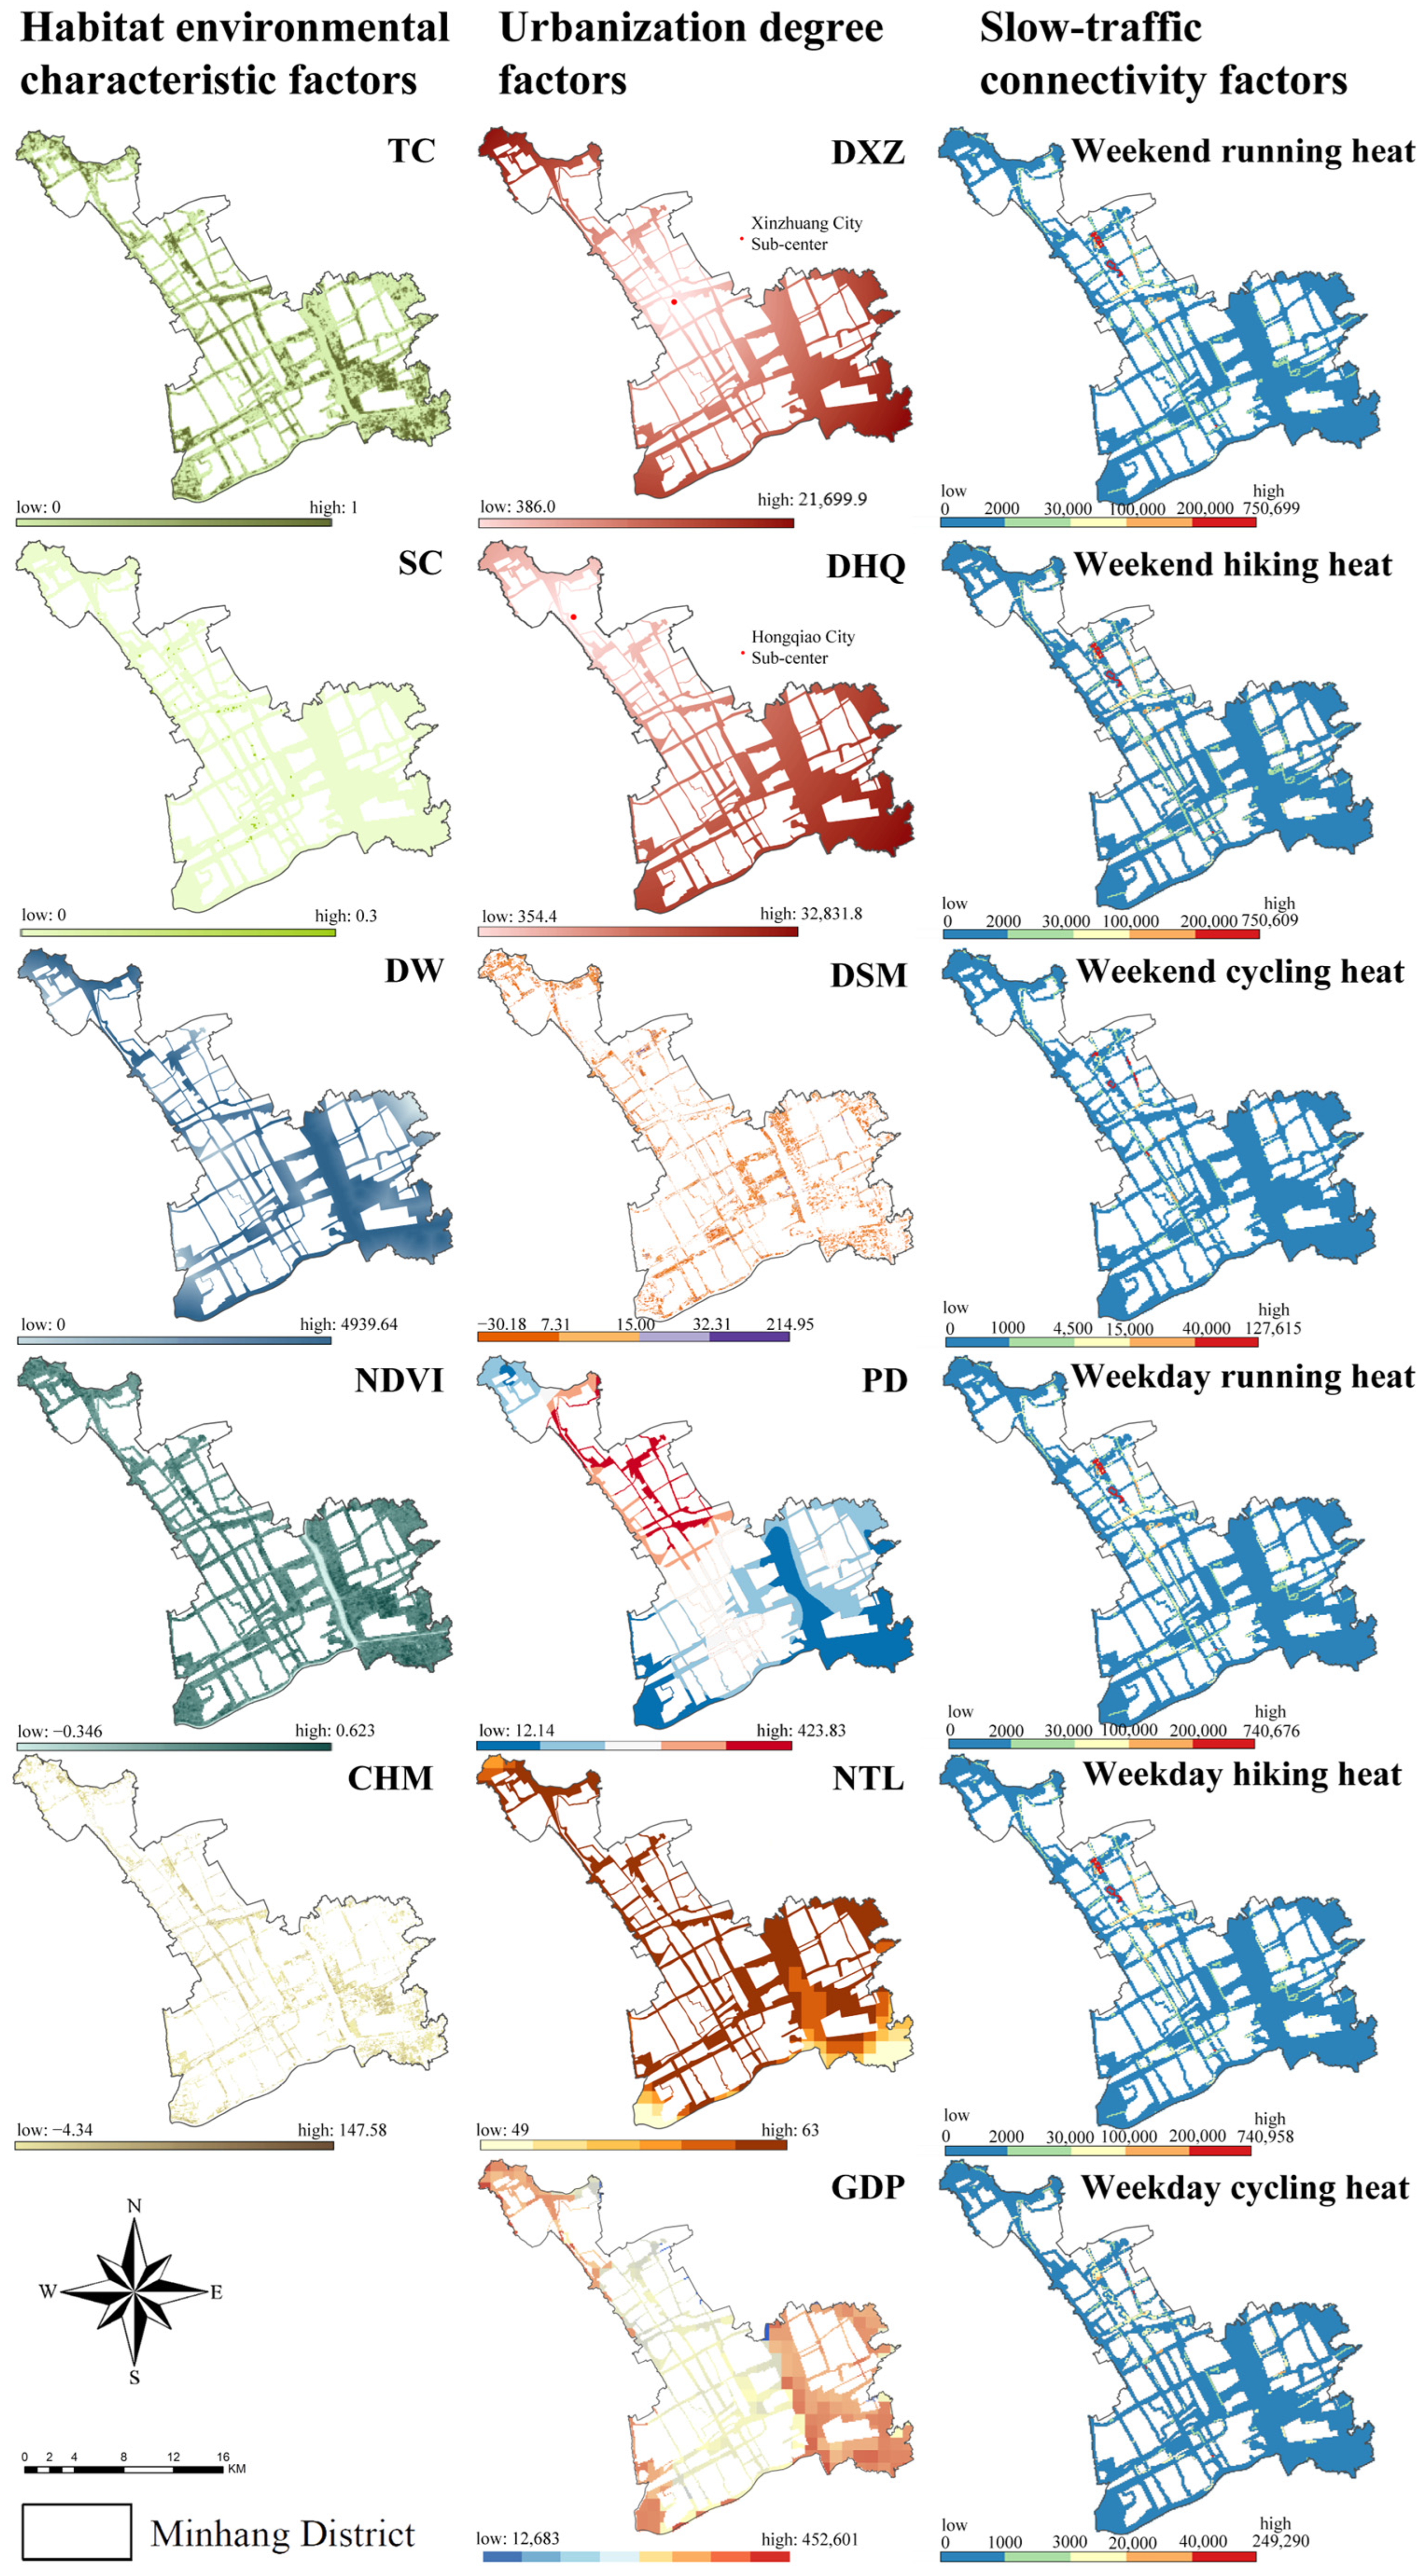
2.3. Built Environment Factors for Urban Ecological Corridors

In order to study how the built environment characteristics of urban ecological corridors affect bird diversity and its spatial distribution pattern, nine environmental characteristic factors were selected to represent the built environment characteristics on the basis of the existing research literature. The environmental characterization factors were classified into three dimensions: habitat environmental characteristics, degree of urbanization, and slow-traffic connectivity, which are considered integrated socio-ecological systems in three dimensions: natural, economic, and human activities (Table 1). Habitat environmental characteristics: focusing on the internal factors of the ecosystem, the percentage of area covered by woodland (TC), the percentage of area covered by shrubland (SC), the distance to water with an area > 1 ha (DW), the normalized difference vegetation index (NDVI), and the height of the vegetation canopy (CHM) were selected, which directly affect the living and breeding environments of the birds. Degree of urbanization: indicators covering the level of urban development, distance from regional centers (DXZ: Xinzhuang sub-city center and DHQ: Hongqiao sub-city center), building height (DSM), nighttime lighting index (NTL), gross domestic production (GDP), and population density (PD) were selected to reflect the impacts of human activities on bird habitats. Slow-traffic connectivity: quantify the impact of slow-traffic transportation functions specific to urban ecological corridors on bird diversity, considering that residents’ activities in urban ecological corridors are mainly slow-traffic activities. All spatial data were pre-processed and analyzed using ArcGis 10.5 software with a statistical raster resolution of 30 m and Krasovsky_1940_Albers co-ordinates (Figure 3).

2.4. Generalized Linear Model

Generalized linear modeling (GLM) is a statistical learning method for modeling based on generalized probability distributions to predict some continuous or discrete response variable. Unlike traditional linear regression models, GLMs can handle both continuous and discrete data, and have greater flexibility to fit various types of response variables, being able to model random dependent variables such as normal, binomial, Poisson, and Gamma distributions.
The dependent variable is assumed to be n independent observations obeying an exponential distribution, i.e., it has a density function:
f y i θ i , = e x p   ( y i θ i b ( θ i ) + c ( y i , ) )
where θ i and are parameters, and b(.) and c(.) are functions.
Suppose that x 1 , x 2 , . . . x n is an observation of the p-dimensional independent variable X corresponding to Y 1 , Y 2 , . . . Y n . The following is a summary of the observations of Y 1 , Y 2 , . . . Y n , denoted η i = x i T β , where β is a ρ × 1 vector of unknown parameters. Suppose E Y i = μ i , and that μ i has a relationship with η i .
η i = g μ i , i = 1,2 , 3 , , n
Call the model so defined a generalized linear model, where θ i is the natural parameter, is the discrete parameter, and g ( . ) is the link function (connection function).

2.5. Data Processing and Analysis

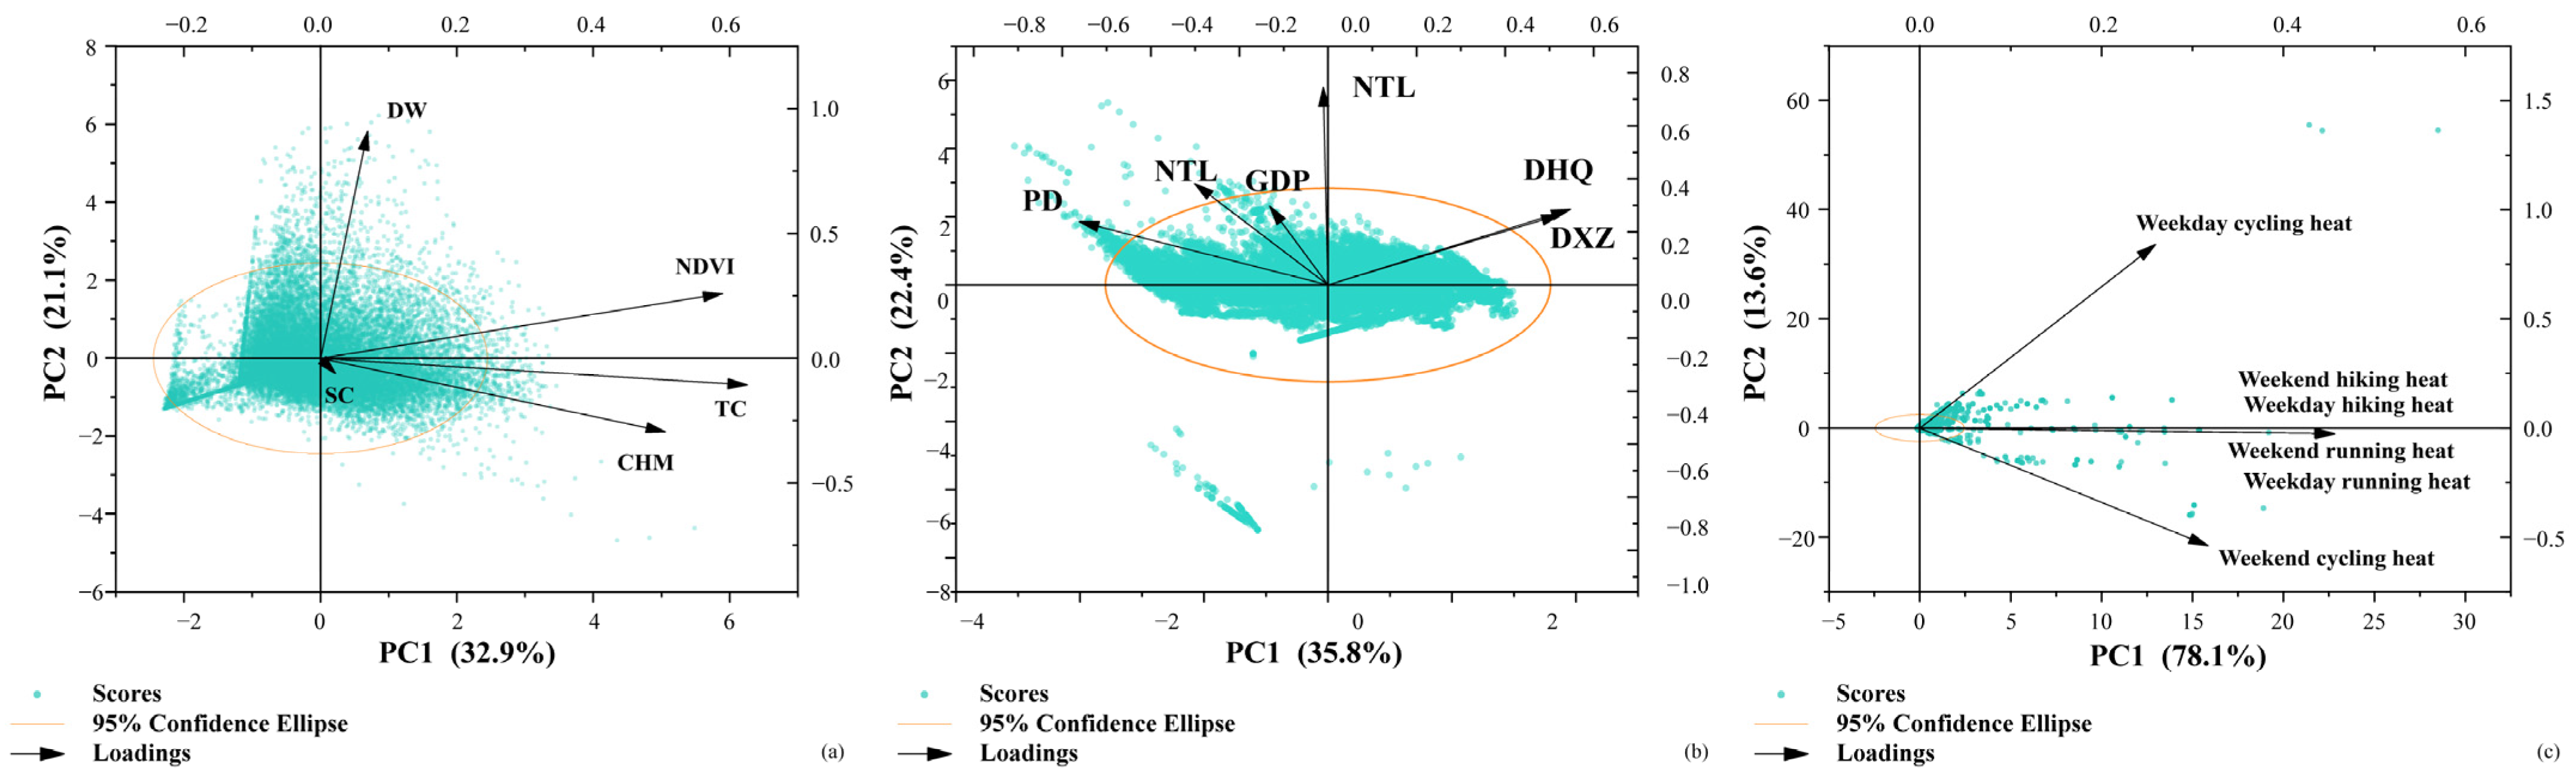
2.5.1. Characteristics of the Built Environment of Urban Ecological Corridors

We calculated and analyzed parameters such as TC, SC, CHM, and NDVI at every 100 m × 100 m scale using vegetation index, canopy height, and ground cover, and selected water surfaces with an area of 1 ha or more to calculate DW in order to characterize urban ecological corridor habitats. PD and NTL were calculated separately at every 100 m × 100 m site scale, and DSM was selected as an additional variable because building height is a representative indicator of urbanization degree. In addition, DXZ and DHQ were selected to describe the degree of urbanization of urban ecological corridors. In order to describe the degree of slow-traffic connectivity of urban ecological corridors, we selected the trajectory thermal values of the residents’ movement by walking, jogging, and cycling on weekends and weekdays. Considering that the factors are not independent of each other and have a certain correlation, we used principal component analysis to establish a method to measure the built environment characteristics of urban ecological corridors that organically integrated each group of variables (Table 2).
Since the first principal component of urban ecological corridor habitat characterization (PC1Hab) explained only 32.89% of the variance, the first two principal components (PC1Hab, PC2Hab) were retained for further analysis, and together they explained 53.97% of the variance and were used as the first measure of built environment characterization of urban ecological corridors (Figure 4a). Then the variance contributions of the first two principal components were used as weights to construct a composite characterization index (GHab) for urban ecological corridor habitat characteristics. Since the first principal component of the degree of urbanization of urban ecological corridors (PC1Urb) explained only 35.8% of the variance, the first two principal components (PC1Urb, PC2Urb) were retained for further analysis, which together explained 58.2% of the variance, and were used as the second measure of the built environment characteristics of urban ecological corridors (Figure 4b). The variance contributions of the first two principal components were then used as weights to construct a composite characterization index of the degree of urbanization of urban ecological corridors (GUrb). The first principal component of the degree of slow-traffic connectivity of urban ecological corridors explained 78.14% of the variance and was used as the third measure of the built environment characteristics of urban ecological corridors (Figure 4c). The variance contribution of the first principal component was then used as a weight to construct a composite characterization index of urban ecological corridor slow-traffic connectivity (GStc).

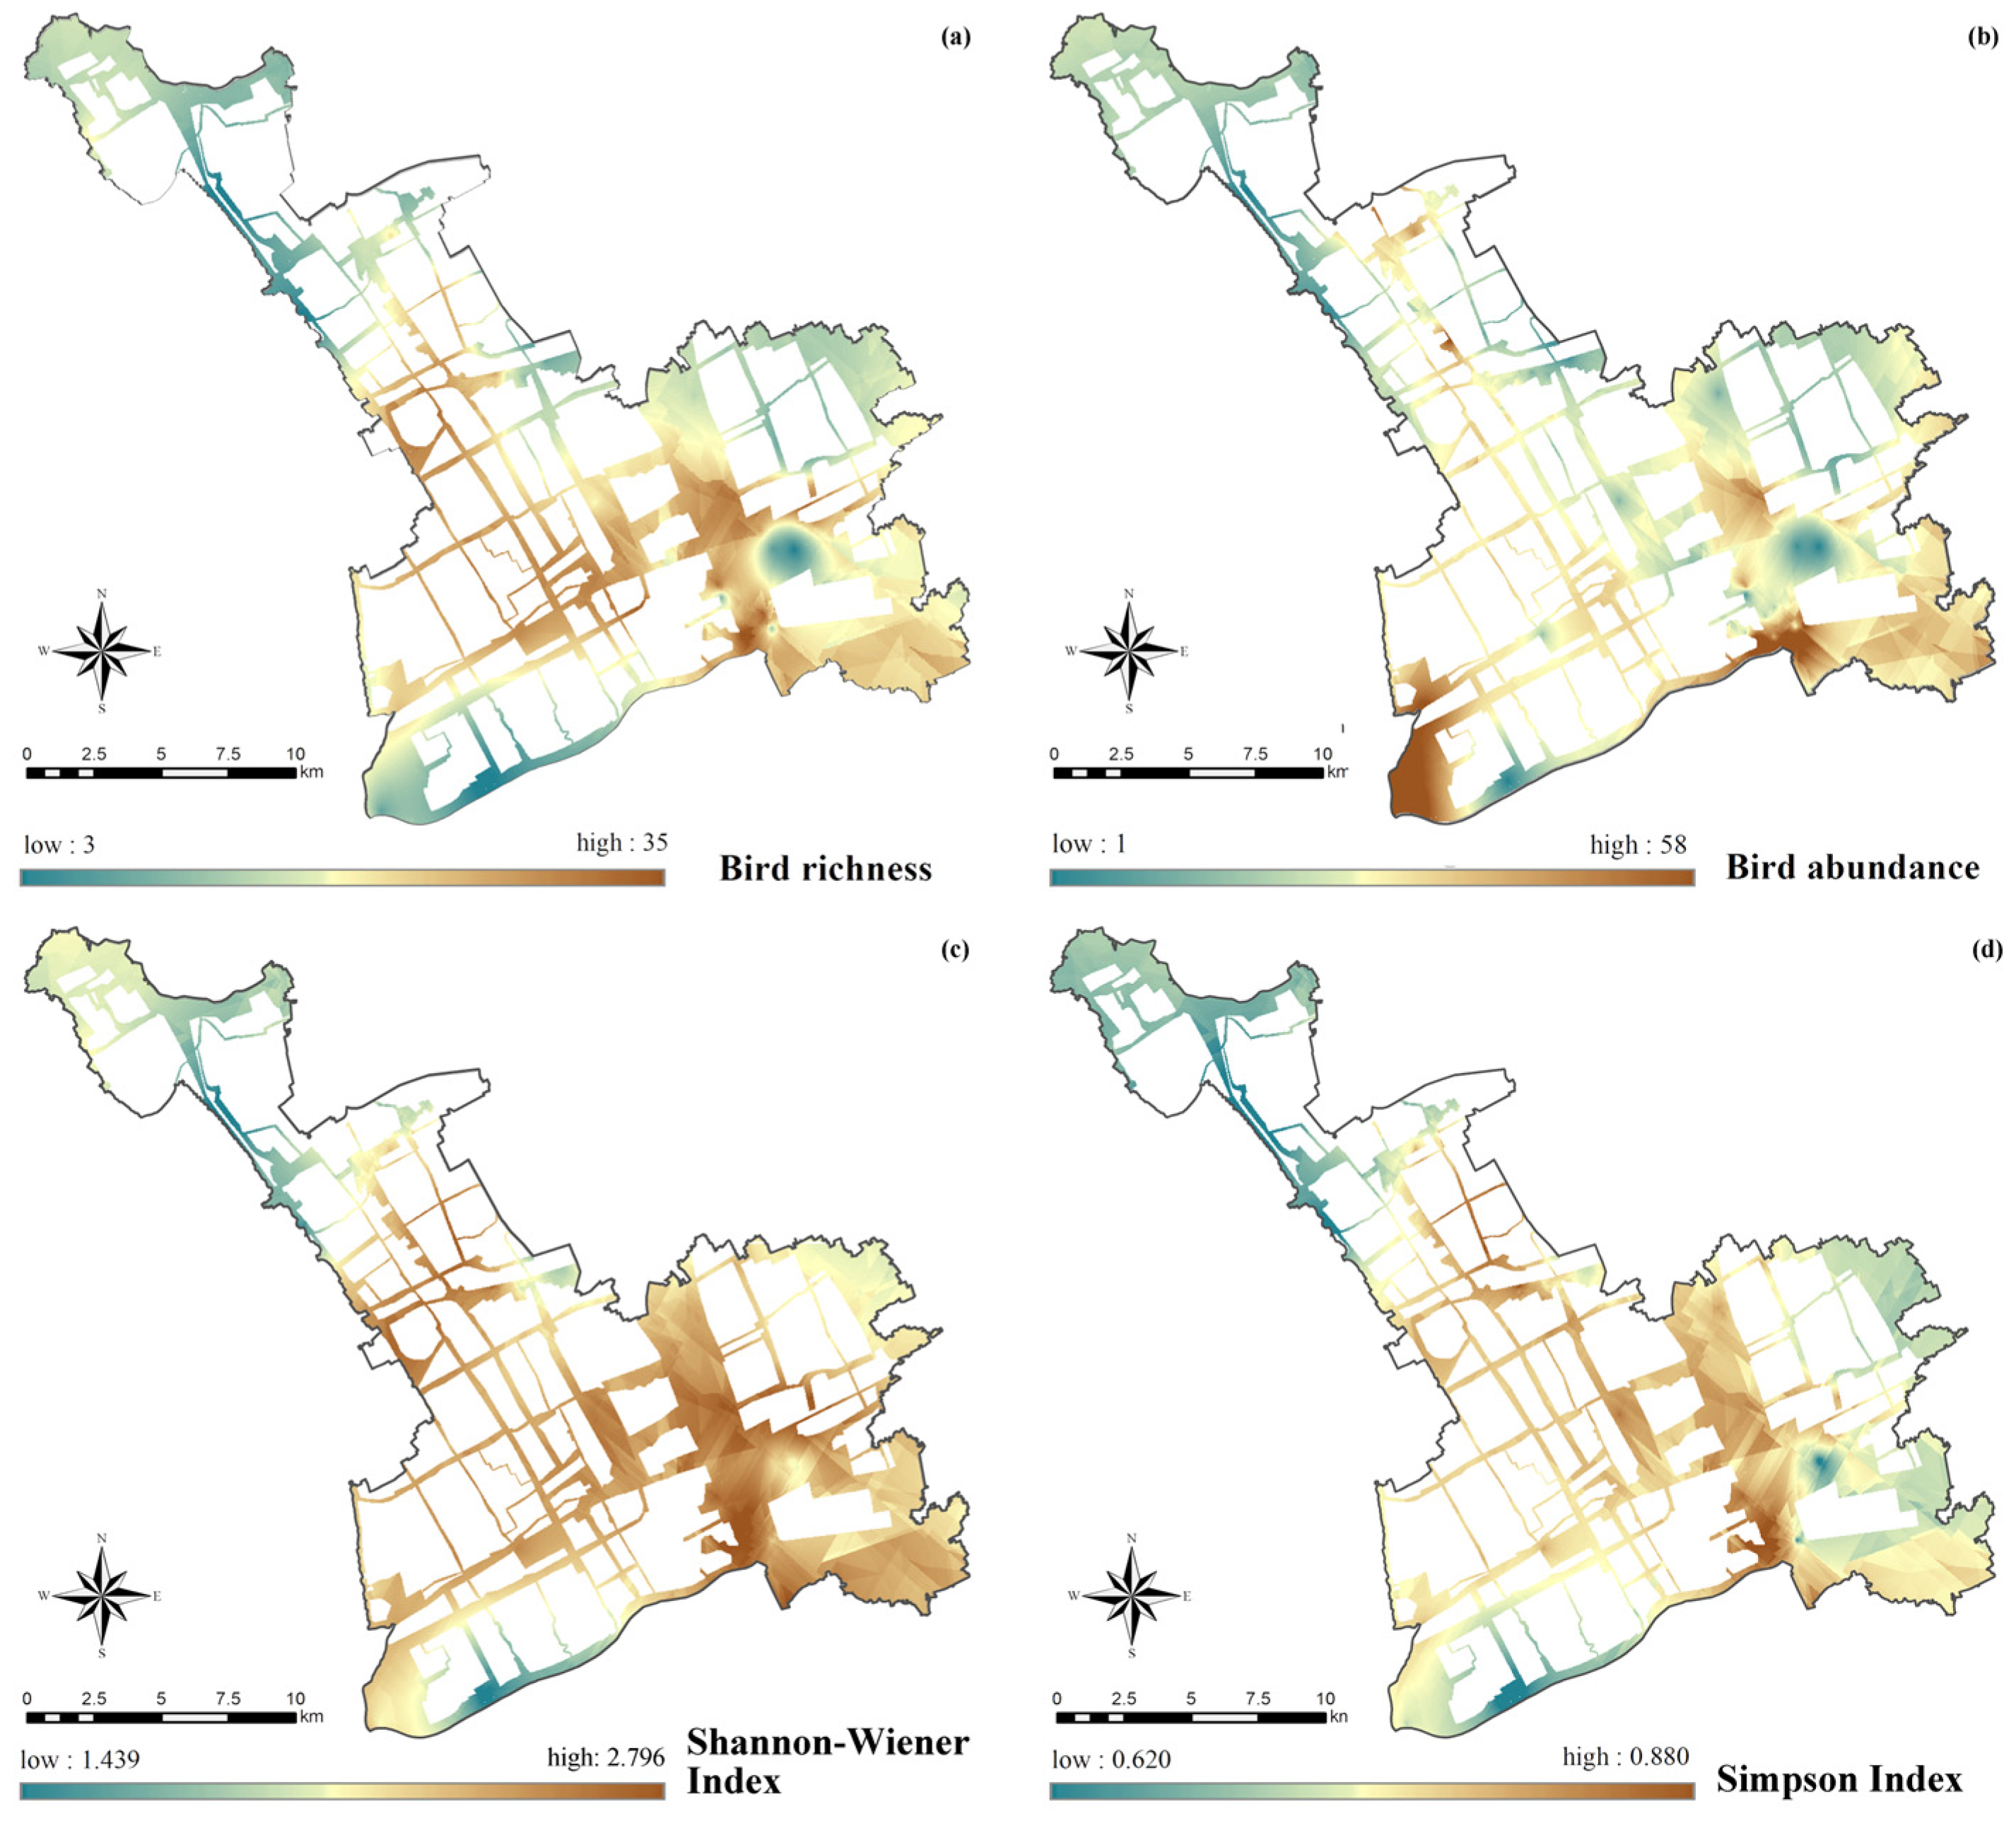
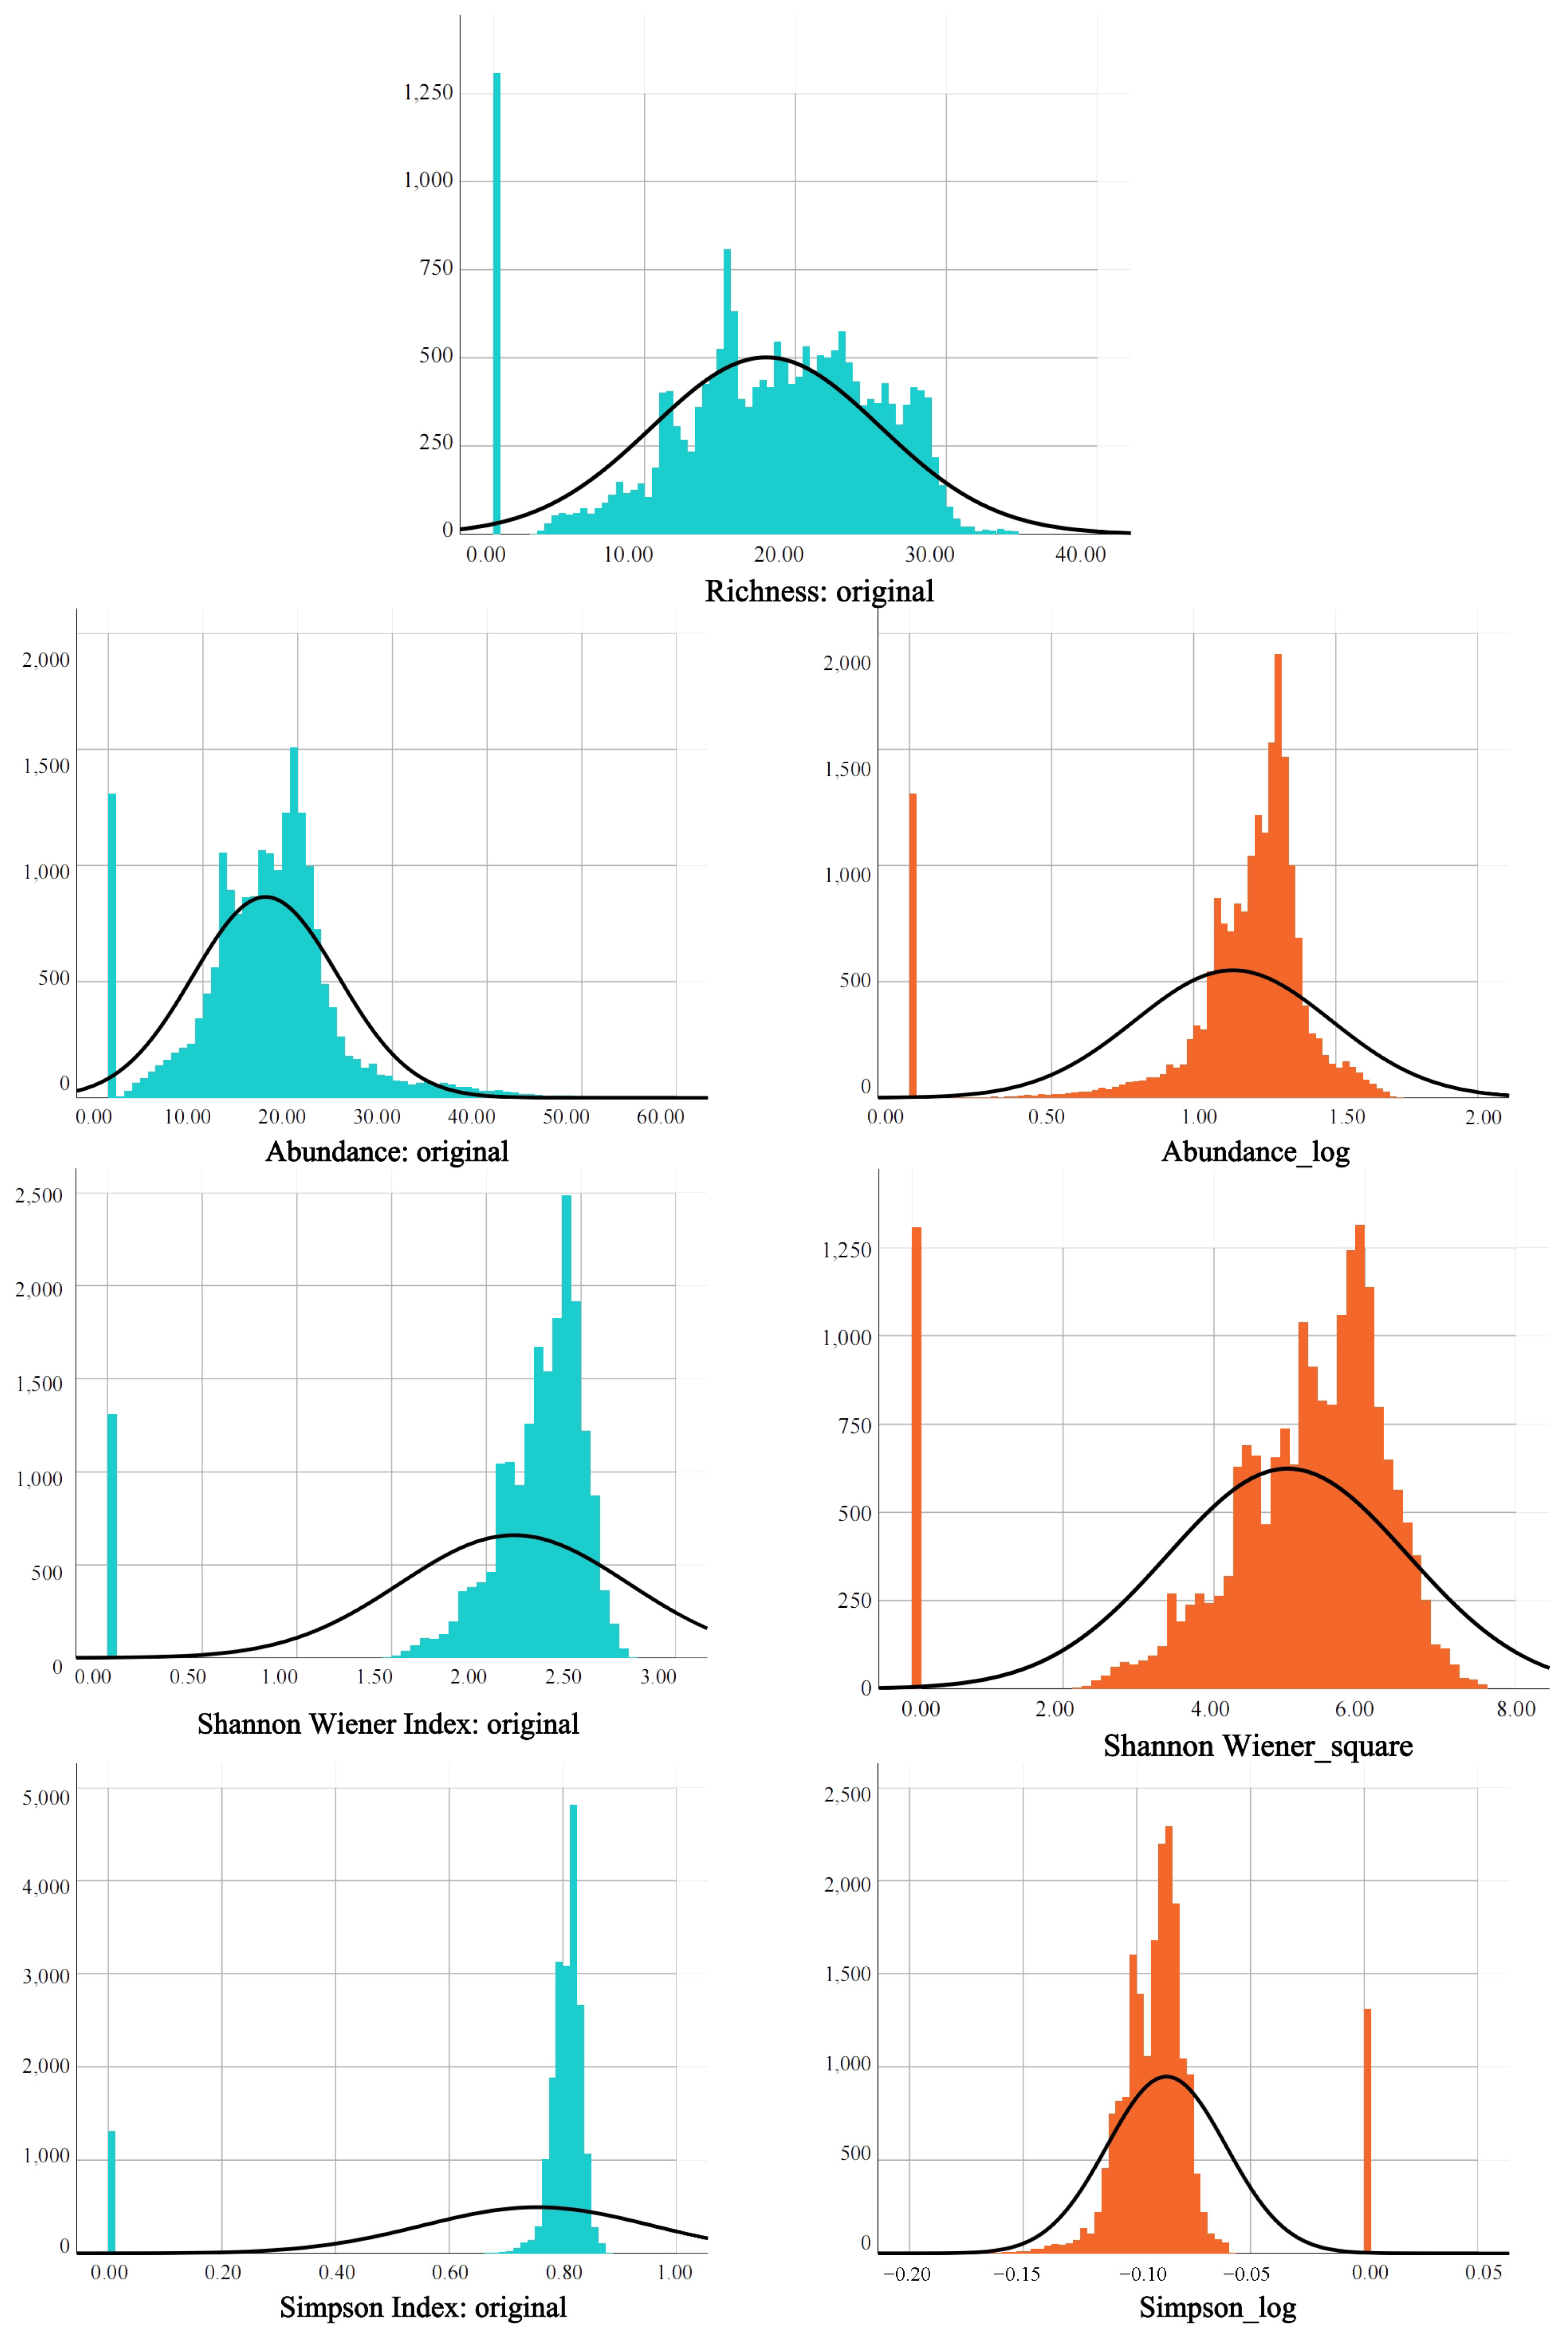
2.5.2. Bird Diversity Data

In order to spatially map the bird diversity indices, we chose the Kriging interpolation method [11], which takes into account the spatially correlated nature of the described objects in the process of data gridded to make the interpolation results more scientific and close to the actual situation, which resulted in the spatial distributions of bird abundance, abundance, Shannon–Wiener index, and Simpson index (Figure 5).
Before constructing the generalized linear model, in order to reduce the effect of extreme values, we pre-processed the bird diversity data, and after comparing multiple methods, logarithmic transformation was implemented for bird abundance and the Simpson index (Abundance_log, Simpson_log), and square transformation was implemented for the Shannon–Wiener index (Shannon Wiener_square), in order to correct for the distribution of left-skewed versus right-skewed data. Bird richness data were not processed as the frequencies themselves already conformed to a normal distribution (Figure 6). The data structure of bird abundance is characterized by discrete and more zero values, and belongs to count data, so a generalized linear model based on Poisson error was constructed for bird abundance, and the rest of the data structure errors conformed to a normal distribution, so a normal distribution of errors was constructed for the Shannon Wiener_square, Simpson_log, and Abundance_log generalized linear model to reveal the effects of each built environment feature of urban ecological corridors on bird diversity. On this basis, we tested the model with the distances of PD, DXZ, and DHQ as covariates in the original variables of urbanization degree characteristics to test the generalizability of the model.
All analyses and statistical tests were performed in R4.3.3. Maps were created in ArcGIS 10.5.

3. Results

3.1. Impacts of Built Environment Characteristics of Urban Ecological Corridors on Bird Diversity

All three groups of built environment characteristics had significant effects on all four groups of bird diversity characteristics (Table 3). Bird richness and abundance were positively correlated with GUrb and GStc, and negatively correlated with GHab, respectively.

3.1.1. Habitat Environment

As shown in Table 3, in the GLM, TC, SC, and CHM were negatively correlated with GHab (r = −0.500, r = −0.017, r = −0.036) and significantly positively correlated with DW (r = 0.964), so the environmental habitat suitability of the urban ecological corridors depended largely on DW and TC due to the small differences in the NDVI within the study area, and the correlation |r| = 0.115, which is much smaller than the dominant factor of DW, it is not used as a dominant factor to explain GHab. Therefore, low values of GHab can be interpreted as high environmental habitat suitability.
By constructing a GLM model of urban ecological corridor environmental habitat composite characteristic index (GHab) and bird diversity (Table 4), the model-adjusted R2 ranged from 0.319 to 0.654, and, in general, GHab was negatively correlated with each characteristic of bird diversity.

3.1.2. Degree of Urbanization

As shown in Table 3, in GLM, DSM, GDP, and PD are negatively correlated with GUrb (r = −0.140, r = −0.192, r = −0.553) and positively correlated with DXZ and DHQ (r = 0.817, r = 0.857), so the degree of urbanization in urban ecological corridors depends largely on DXZ, DHQ, and PD, and because the NTL variations within the study area are small and the correlation|r| = 0.011, it is not a dominant factor to explain GUrb. Therefore, low values of GUrb can be interpreted as highly urbanized.
By constructing a GLM model of urban ecological corridor urbanization degree composite characteristic index (GUrb) and bird diversity (Table 5), the model-adjusted R2 ranged from 0.345 to 0.715, and, in general, GUrb was positively correlated with each characteristic of bird diversity.

3.1.3. Slow-Traffic Connectivity

As shown in Table 3, the heat of cycling, walking, and running trajectories of urban residents on weekends and weekdays in the GLM is positively correlated with the GStc (r = 0.632, r = 0.998, r = 0.998, r = 0.503, r = 0.997, r = 0.997), and thus high values of the GStc can be interpreted as a higher degree of slow-traffic connectivity.
By constructing a GLM model of the composite characteristic index of slow-traffic connectivity and bird diversity in urban ecological corridors (Table 6), the model-adjusted R2 ranged from 0.314 to 0.638, and GStc was positively correlated with bird diversity, however, the correlation was low (r < 0.05), which implies that in urban ecological corridors, the strength of slow-traffic connectivity affects bird diversity at a lower level than that of human slow-traffic connectivity, which showed a low synergistic relationship, which may be related to the fact that human slow-traffic activities are lower-intensity human activities that cause less disturbance to urban bird diversity.

3.2. Characteristics of Built Environments in Urban Ecological Corridors and Spatial Differentiation Patterns of Bird Diversity

Based on the results of the statistical analysis, using ArcGis 10.5 software, with a pixel size of 100 m, spatial distribution pattern analysis was conducted on overlaying raster layers GHab, GUrb, and GStc. Furthermore, based on the Geoda 2.1 platform, a bivariate spatial autocorrelation analysis was performed between comprehensive features of built environments and bird species richness. The identification of synergies and conflicts in space is illustrated (Figure 7). To demonstrate the purpose, the values of GHab and GUrb are reversed to reflect the habitat suitability of urban ecological corridors and the degree of urbanization.

3.2.1. Habitat Suitability Index

As shown in Figure 7a,d, the distribution pattern of avian diversity is significantly correlated with the distribution of habitat suitability in urban ecological corridors. Within the study area, regions with higher habitat suitability also exhibit higher species richness of birds. This relationship accounts for 66.7% of the characteristics of avian diversity distribution (excluding areas where the correlation is not significant). Therefore, there is a positive correlation between the avian species and diversity in urban ecological corridors and the habitat suitability dominated by DW and TC. This implies that the improvement of habitat suitability in urban ecological corridors will, to some extent, enhance avian diversity and their distribution.

3.2.2. Degree of Urbanization

As shown in Figure 7b,e, the spatial differentiation pattern of avian diversity is significantly related to the distribution of urban ecological corridors and the level of urbanization. Within the study area, regions with high levels of urbanization exhibit lower species richness of birds, explaining 60.0% of the characteristics in the distribution of avian diversity (excluding regions with insignificant correlations). Therefore, there is a negative correlation between the diversity and species of birds in urban ecological corridors and the level of urbanization dominated by DXZ, DHQ, and PD. This implies that urbanization in urban ecological corridors will, to some extent, reduce avian diversity and its distribution.

3.2.3. Slow-Traffic Connectivity

As shown in Figure 7c,f, the distribution pattern of bird diversity was, to some extent, correlated with the distribution of slow-traffic connectivity in urban ecological corridors, and bird species richness was also higher in areas with very high slow-traffic connectivity, whereas the correlation between bird species richness and slow-traffic connectivity was not significant in areas with low slow-traffic connectivity. This may be related to the fact that the distribution of urban residents in the urban ecological corridor tends to be concentrated in the area of slow walking activities, and the slow walking connectivity is different from the urbanization of such high-intensity human activities—as it is a low-intensity human activity, the level of interference with the survival of birds is low. Moreover, it is mostly distributed in urban ecological corridors with high spatial connectivity, and the connectivity of urban ecological corridors is closely related to the migration, growth, and other ecological processes of birds, so the slow-traffic connectivity of urban ecological corridors will, to a certain extent, promote the diversity of birds and their distribution.

4. Discussion

4.1. Characterization of the Built Environment of Urban Ecological Corridors Drives Attribution of Spatial Divergence in Bird Diversity

In this study, we investigated the effects of built environment characteristics of urban ecological corridors on bird diversity, and quantified the effects of different built environment characteristics on bird diversity, as well as on the spatial distribution pattern of bird richness. We found that habitat suitability, degree of urbanization, and slow-traffic connectivity all affect bird diversity metrics to varying degrees. The results mainly confirm previous studies and also have some differences with existing studies.
The habitat suitability composite characteristic index (GHab) was positively correlated with bird diversity, indicating that the higher the environmental suitability of urban ecological corridor habitats, the more positive impact on bird diversity, and the results of this study are consistent with the results of historical studies. Our results indicate that DW is the most influential of the primitive factors on bird diversity, suggesting that the closer the water body, the more positive its effect on bird diversity. Within urban ecological corridors, larger water bodies are important for bird survival [34]. Urban water bodies can provide habitats for a large number of species in the city, including birds [35,36,37,38,39], and are hotspots for organisms to congregate and move around [15]; expanding the extent of water bodies can therefore be considered an important indicator of effective conservation of urban bird diversity. In addition, a higher ratio of woodland to shrubland cover provides more space for roosting and movement [9], which is equally positive for bird diversity [31,40,41].
Both the composite character index of urbanization level (GUrb) and the raw urbanization level factor included in it negatively affected bird diversity. In particular, the results of the study showed that the distance to the regional center was the most influential of the original factors on bird diversity. The reason for this is that, as the proportion of man-made surfaces in the city increases with the distance to the regional center, the degree of urbanization is higher, and thus the negative effect on bird diversity is higher, which is in line with the results of existing studies [6,42]. High GDP also has a negative impact on bird diversity—the higher the GDP, the higher the level of economicization of the region, which also implies high regional urbanization. In addition, we also found that building height has a negative impact on bird diversity, possibly due to the fact that taller buildings are often associated with higher pedestrian and automobile traffic [42], and both traffic and high-rise buildings have been reported to be major anthropogenic threats, often resulting in a range of negative impacts, such as a high frequency of bird strikes [6,43,44,45].
In high-density urbanized areas, there are also some results that are inconsistent with previous studies. Most studies have shown that artificial nighttime lighting poses a serious threat to bird diversity, and also negatively affects their growth and behavior [46,47,48]. However, in this study, we did not find a significant effect on bird diversity, probably because high-density urban areas are highly urbanized, and their nighttime lighting indices remain high throughout the region, thus not quantifying their effect on the spatial differentiation of bird diversity. In addition, human activities are often regarded as disturbances to wildlife [20,49], but our study found that slow-traffic activities carried out by urban residents in urban ecological corridors had low negative impacts on bird diversity, which may be related to the fact that residents’ slow-traffic activities are low-intensity human activities. This implies that urban birds are more adaptable to low-intensity human activity disturbance, and that with rapid urbanization, intensive human activity has contributed to a natural selection that allows species with some resistance to human interference to survive within cities. Still, excessive population density in urban ecological corridors continues to negatively affect bird diversity [50].
Overall, the higher the habitat suitability of urban ecological corridors and the lower the degree of urbanization, the more positive the impact on bird diversity. Moreover, urban ecological corridors can simultaneously satisfy the needs of residents’ slow-traffic activities and birds’ habitats.

4.2. Planning and Management of Urban Ecological Corridors Based on Biodiversity Conservation

The function of urban ecological corridors focuses on urban ecology, biodiversity conservation, and slow-traffic activities for urban residents [31,51], and the differences in their geographic locations, habitats, and urban environmental substrates have different roles in the conservation of avian diversity. For this reason, the planning and management of urban ecological corridors need to be integrated [52]. To enhance urban biodiversity, the habitat suitability of urban ecological corridors needs to be improved, for example, the area of water resources can be increased in urban green spaces, urban water bodies are hotspots for bird activities [53], and improving the water environment is also beneficial to the conservation of bird diversity [54]. This also increases vegetation cover with plant canopy height and improves vegetation quality. In urban ecological corridors close to urban or regional centers, it is necessary to strengthen the ecological maintenance of urban ecological corridors and reduce their peripheral urbanization effects. Consideration can be given to adding small habitat patches, such as streetside greens and strip greens near infrastructure, to weaken resistance and improve regional habitat quality, establish ecological buffer zones and ecological networks conducive to organism migration and connectivity, and improve the functional connectivity of urban ecological corridors [55,56]. For urban ecological corridors far away from urban or regional centers, the advantages of their lower urbanization can be taken advantage of by constructing habitat patches with large areas of high quality and structural connectivity, thus increasing the number of source sites and expanding the extent of urban ecological corridors [52,57,58].
The urban ecological corridor itself carries multiple attributes and functions, and the preference of urban residents for the “near-nature” leisure mode is also becoming more and more obvious through the planning and management of the urban ecological corridor. This can realize its “ecological–leisure” organic articulation, so as to ensure that through the planning and management of urban ecological corridors, the organic connection between “ecology and leisure” can be realized, so as to guarantee the normal performance of the corridor’s biological migration function and residents’ leisure function. According to the results of the low impact of urban residents’ slow-moving activities on bird diversity found in this study, a composite ecological network system in which humans and nature coexist harmoniously can be constructed with the help of the construction of slow-moving systems, park cities, and other green space systems in order to balance the contradiction between humans’ leisure needs and wildlife habitats. However, we believe that urban ecological corridors with composite functions should put their species protection and migration functions in the first place, and on this basis moderately integrate the slow-moving recreation function to realize the organic integration of ecological protection and recreation. It is also possible to identify areas of synergy between the slow-moving connectivity of the corridors and the protection of bird diversity as ecological buffer zones between humans and nature, to strengthen the functional connectivity of the urban ecological corridors [59], and to promote the adaptation of biological populations to changes in the surrounding environment. Buffer zones should be set based on meeting the needs of organisms for safe distances, which not only helps to conserve biodiversity, but also promotes recreational activities for urban residents and realizes the effective integration of ecological protection and social needs.

4.3. Shortcomings and Prospects

In this study, we assessed the built environment and bird diversity of urban ecological corridors with GLM, and selected nine environmental factors under three dimensions (habitat environmental characteristics, degree of urbanization, and slow-traffic connectivity) to indicate the built environment characteristics of urban ecological corridors, and four commonly used metrics (abundance, richness, the Shannon–Wiener index, and the Simpson index) to measure the diversity of urban bird species. These three dimensions for measuring the built environment characteristics of urban ecological corridors proved to be effective in distinguishing habitat characteristics and measuring the degree of urbanization and human slow-traffic activities. There are also some limitations to this study. The interpretation of the relationship between urban built environment characteristics and bird diversity requires a large dataset of built environment factors to validate. It may be affected by the selection of different environmental factors and the number of samples of built environment factors in urban ecological corridors. Future studies can further optimize the indicator measurements and improve the data quality, for example by adding indicators such as structural type of vegetation and deepening the understanding of the impact of built environment on bird diversity in urban ecological corridors by combining it with field monitoring, as well as the distinction between daytime and nighttime for the heat of urban residents’ slow-moving activities, so as to explore the effects of residents’ slow-moving activities on bird diversity in urban ecological corridors at different time periods.

5. Conclusions

In this study, we analyzed the spatial distribution pattern of built environment factors and bird species diversity in Minhang District, Shanghai, quantified the built environment factors, identified the key built environment factors affecting bird species diversity in urban ecological corridors, deepened our understanding of the built environment of urban ecological corridors and bird species diversity, and further explained the spatial perspective of the impacts of urban ecological corridors on bird species diversity.
The results of this study show that there are significant differences in the impacts of different built environment characteristics of urban ecological corridors on the diversity of bird species and their spatial distribution patterns. Habitat suitability of urban ecological corridors was positively correlated with bird diversity, and the distance to a water body with an area of >1 ha and vegetation cover were identified as the key factors influencing bird diversity; the degree of urbanization of urban ecological corridors was negatively correlated with bird diversity, and the distance to the center of the region and population density were identified as the key factors influencing bird diversity. Bird diversity was less sensitive to the effect of slow-traffic connectivity, suggesting that urban ecological corridors provide urban residents with the possibility of slow-traffic movement and symbiosis with bird diversity, and can balance the conflict between human recreational needs and wildlife habitat, which has a positive impact on human health and bird diversity conservation. Therefore, the study suggests that the planning and construction of urban ecological corridors can prioritize the improvement of connectivity, the increase of vegetation cover and structure, the protection of large areas and water resources, and the minimization of the impacts of the degree of urbanization within the corridor, in order to protect biodiversity.

Supplementary Materials

The following supporting information can be downloaded at: https://www.mdpi.com/article/10.3390/land13091359/s1, Table S1: List of birds in this study.

Author Contributions

Conceptualization, D.W.; Methodology, D.W.; Software, D.W.; Formal analysis, G.Z.; Investigation, G.Z.; Resources, Q.Z. (Qicheng Zhong); Data curation, D.W.; Writing—original draft, D.W.; Writing—review & editing, Q.Z. (Qicheng Zhong); Visualization, D.W. and X.C.; Supervision, Q.Z. (Qicheng Zhong); Project administration, L.Z. and Q.Z. (Qingping Zhang); Funding acquisition, L.Z. and Q.Z. (Qingping Zhang). All authors have read and agreed to the published version of the manuscript.

Funding

This research was funded by the National Natural Science Foundation of China, grant number No. 32171569 (funder: L.Z.); Jiangsu Province Key R&D Program Social Development Project, grant number No. BE2023822 (funder: Qingping Zhang); Priority Academic Program Development of Jiangsu Higher Education Institutions, grant number: PAPD (funder: Qingping Zhang); and the National Key Research and Development Program of China, grant number No. 2022YFC3802604 (funder: L.Z).

Data Availability Statement

The raw data supporting the conclusions of this article will be made available by the authors on request.

Conflicts of Interest

Having obtained permission from all the authors, I declare that: (1) This study has not been published in whole or in part elsewhere. (2) The paper is not currently being considered for publication elsewhere. (3) The publication is approved by all authors and tacitly or explicitly by the responsible authorities where the work was carried out.

References

  1. Ganaie, T.A.; Jamal, S.; Ahmad, W.S. Changing land use/land cover patterns and growing human population in Wular catchment of Kashmir Valley, India. GeoJournal 2021, 86, 1589–1606. [Google Scholar] [CrossRef]
  2. Afrifa, J.K.; Monney, K.A.; Deikumah, J.P. Effects of urban land-use types on avifauna assemblage in a rapidly developing urban settlement in Ghana. Urban Ecosyst. 2023, 26, 67–79. [Google Scholar] [CrossRef]
  3. Van den Bosch, M.; Sang, O. Urban natural environments as nature-based solutions for improved public health—A systematic review of reviews. Environ. Res. 2017, 158, 373–384. [Google Scholar] [CrossRef] [PubMed]
  4. Zhang, L.; Yu, H.; Zhong, Q.; Zhang, G.; Zhang, Q. Research on the Spatial Demarcation of Urban Ecological Corridors Based on Functional Connectivity. Chin. Landsc. Archit. 2024, 40, 6–14. (In Chinese) [Google Scholar]
  5. Jordán, F. A reliability-theory approach to corridor design. Ecol. Model. 2000, 128, 211–220. [Google Scholar] [CrossRef]
  6. Hastedt, A.; Tietze, D.T. The importance of unsealed areas in the urban core and periphery for bird diversity in a large central european city. Urban Ecosyst. 2023, 26, 1015–1028. [Google Scholar] [CrossRef]
  7. LaPoint, S.; Balkenhol, N.; Hale, J.; Sadler, J.; van der Ree, R.; Evans, K. Ecological connectivity research in urban areas. Funct. Ecol. 2015, 29, 868–878. [Google Scholar] [CrossRef]
  8. Zhang, Z.; Meerow, S.; Newell, J.P.; Lindquist, M. Enhancing landscape connectivity through multifunctional green infrastructure corridor modeling and design. Urban For. Urban Green. 2019, 38, 305–317. [Google Scholar] [CrossRef]
  9. Muderere, T.; Murwira, A.; Kativu, S.; Tagwireyi, P.; Chiweshe, N. The influence of landscape structure on the diversity of avifauna species in tropical urban areas of Northeastern Zimbabwe. Biodiversity 2020, 21, 182–197. [Google Scholar] [CrossRef]
  10. Hedblom, M.; Knez, I.; Gunnarsson, B. Bird Diversity Improves the Well-Being of City Residents. Ecol. Conserv. Birds Urban Environ. 2017, 287–306. [Google Scholar] [CrossRef]
  11. Brodie, J.F.; Mohd-Azlan, J.; Chen, C.; Wearn, O.R.; Deith, M.C.; Ball, J.G.; Luskin, M.S. Landscape-scale benefits of protected areas for tropical biodiversity. Nature 2023, 620, 807–812. [Google Scholar] [CrossRef] [PubMed]
  12. Herrando, S.; Weiserbs, A.; Quesada, J.; Ferrer, X.; Paquet, J.-Y. Development of urban bird indicators using data from monitoring schemes in two large European cities. Anim. Biodivers. Conserv. 2012, 35, 141–150. [Google Scholar] [CrossRef]
  13. McDonald, R.I.; Forman, R.T.T.; Kareiva, P.; Neugarten, R.; Salzer, D.; Fisher, J. Urban effects, distance, and protected areas in an urbanizing world. Landsc. Urban Plan. 2009, 93, 63–75. [Google Scholar] [CrossRef]
  14. Gan, J.; Breuste, J. Relationship Between Built Environment and Biodiversity in High-Density Metropolitan Areas: The Case of Shanghai, China. In Making Green Cities; Springer: Cham, Switzerland, 2023; pp. 377–400. [Google Scholar] [CrossRef]
  15. Hernández-Dávila, O.A.; Sosa, V.J.; Laborde, J. Effects of landscape context and vegetation attributes on understorey bird communities of cloud forest riparian belts. Ecol. Eng. 2021, 167, 106269. [Google Scholar] [CrossRef]
  16. Souza, F.L.; Valente-Neto, F.; Severo-Neto, F.; Bueno, B.; Ochoa-Quintero, J.M.; Laps, R.R.; de Oliveira Roque, F. Impervious surface and heterogeneity are opposite drivers to maintain bird richness in a Cerrado cit. Landsc. Urban Plan. 2019, 192, 103643. [Google Scholar] [CrossRef]
  17. Latta, S.C.; Musher, L.J.; Latta, K.N.; Katzner, T.E. Influence of human population size and the built environment on avian assemblages in urban green spaces. Urban Ecosyst. 2013, 16, 463–479. [Google Scholar] [CrossRef]
  18. Matsuba, M.; Nishijima, S.; Katoh, K. Effectiveness of corridor vegetation depends on urbanization tolerance of forest birds in central Tokyo, Japan. Urban For. Urban Green. 2016, 18, 173–181. [Google Scholar] [CrossRef]
  19. Threlfall, C.G.; Williams, N.S.G.; Hahs, A.K.; Livesley, S.J. Approaches to urban vegetation management and the impacts on urban bird and bat assemblages. Landsc. Urban Plan. 2016, 153, 28–39. [Google Scholar] [CrossRef]
  20. Cristaldi, M.A.; Giraudo, A.R.; Arzamendia, V.; Bellini, G.P.; Claus, J. Urbanization impacts on the trophic guild composition of bird communities. J. Nat. Hist. 2017, 51, 2385–2404. [Google Scholar] [CrossRef]
  21. Opoku, A. Biodiversity and the built environment: Implications for the Sustainable Development Goals (SDGs). Resour. Conserv. Recycl. 2019, 141, 1–7. [Google Scholar] [CrossRef]
  22. Petit, M.; Celis, C.; Weideman, C.; Gouin, N.; Bertin, A. Effects of land cover and habitat condition on the bird community along a gradient of agricultural development within an arid watershed of Chile. Agric. Ecosyst. Environ. 2023, 356, 108635. [Google Scholar] [CrossRef]
  23. Zhang, R.; Zhang, L.; Zhong, Q.; Zhang, Q.; Ji, Y.; Song, P.; Wang, Q. An optimized evaluation method of an urban ecological network: The case of the Minhang District of Shanghai. Urban For. Urban Green. 2021, 62, 127158. [Google Scholar] [CrossRef]
  24. Zheng, G. (Ed.) A List of the Classification and Distribution of Birds in China, 3rd ed.; China Science Publishing & Media Ltd.: Beijing, China, 2017. (In Chinese) [Google Scholar]
  25. Bevilacqua, S.; Ugland, K.I.; Plicanti, A.; Scuderi, D.; Terlizzi, A. An approach based on the total-species accumulation curve and higher taxon richness to estimate realistic upper limits in regional species richness. Ecol. Evol. 2018, 8, 405–415. [Google Scholar] [CrossRef]
  26. Dixon, P. VEGAN, a package of R functions for community ecology. J. Veg. Sci. 2003, 14, 927–930. [Google Scholar] [CrossRef]
  27. Sun, B.; Lu, Y.; Yang, Y.; Yu, M.; Yuan, J.; Yu, R.; Bullock, J.M.; Stenseth, N.C.; Li, X.; Cao, Z.; et al. Urbanization affects spatial variation and species similarity of bird diversity distribution. Sci. Adv. 2022, 8, eade3061. [Google Scholar] [CrossRef]
  28. Mahmoudi, S.; Ilanloo, S.S.; Shahrestanaki, A.K.; Valizadegan, N.; Yousefi, M. Effect of human-induced forest edges on the understory bird community in Hyrcanian forests in Iran: Implication for conservation and management. For. Ecol. Manag. 2016, 382, 120–128. [Google Scholar] [CrossRef]
  29. Zhang, W.; Zhou, Y.; Fang, X.; Zhao, S.; Wu, Y.; Zhang, H.; Cui, L.; Cui, P. Effects of Environmental Factors on Bird Communities in Different Urbanization Grades: An Empirical Study in Lishui, a Mountainous Area of Eastern China. Animals 2023, 13, 882. [Google Scholar] [CrossRef]
  30. Hsieh, T.; Ma, K.; Chao, A. iNEXT: An R package for rarefaction and extrapolation of species diversity (Hill numbers). Methods Ecol. Evol. 2016, 7, 1451–1456. [Google Scholar] [CrossRef]
  31. Liu, Z.; Zhou, Y.; Yang, H.; Liu, Z. Urban green infrastructure affects bird biodiversity in the coastal megalopolis region of Shenzhen city. Appl. Geogr. 2023, 151, 102860. [Google Scholar] [CrossRef]
  32. Wu, W.-B. A first Chinese building height estimate at 10 m resolution (CNBH-10 m) using multi-source earth observations and machine learning. Remote Sens. Environ. 2023, 291, 113578. [Google Scholar] [CrossRef]
  33. Dai, S.; Zhao, W.; Wang, Y.; Huang, X.; Chen, Z.; Lei, J.; Stein, A.; Jia, P. Assessing spatiotemporal bikeability using multi-source geospatial big data: A case study of Xiamen, China. Int. J. Appl. Earth Obs. Geoinf. 2023, 125, 103539. [Google Scholar] [CrossRef]
  34. Powell, B.F.; Steidl, R.J. Influence of vegetation on montane riparian bird communities in the Sky Islands of Arizona, USA. Southwest. Nat. 2015, 60, 65–71. [Google Scholar] [CrossRef]
  35. Cantonati, M.; Poikane, S.; Pringle, C.M.; Stevens, L.E.; Turak, E.; Heino, J.; Richardson, J.S.; Bolpagni, R.; Borrini, A.; Cid, N.; et al. Characteristics, Main Impacts, and Stewardship of Natural and Artificial Freshwater Environments: Consequences for Biodiversity Conservation. Water 2020, 12, 260. [Google Scholar] [CrossRef]
  36. Fahrig, L. Rethinking patch size and isolation effects: The habitat amount hypothesis. J. Biogeogr. 2013, 40, 1649–1663. [Google Scholar] [CrossRef]
  37. Ferenc, M.; Sedláček, O.; Fuchs, R. How to improve urban greenspace for woodland birds: Site and local-scale determinants of bird species richness. Urban Ecosyst. 2014, 17, 625–640. [Google Scholar] [CrossRef]
  38. Jasmani, Z.; Ravn, H.; Bosch, C. The influence of small urban parks characteristics on bird diversity: A case study of Petaling Jaya, Malaysia. Urban Ecosyst. 2017, 20, 227–243. [Google Scholar] [CrossRef]
  39. Zhenhuan, L.; Qiandu, H.; Tang, G. Identification of urban flight corridors for migratory birds in the coastal regions of Shenzhen city based on three-dimensional landscapes. Landsc. Ecol. 2021, 36, 2043–2057. [Google Scholar] [CrossRef]
  40. de Groot, M.; Flajšman, K.; Mihelič, T.; Vilhar, U.; Simončič, P.; Verlič, A. Green space area and type affect bird communities in a South-eastern European city. Urban For. Urban Green. 2021, 63, 127212. [Google Scholar] [CrossRef]
  41. James Barth, B.; Ian FitzGibbon, S.; Stuart Wilson, R. New urban developments that retain more remnant trees have greater bird diversity. Landsc. Urban Plan. 2015, 136, 122–129. [Google Scholar] [CrossRef]
  42. Leveau, L.M.; Leveau, C.M. Does urbanization affect the seasonal dynamics of bird communities in urban parks? Urban Ecosyst. 2016, 19, 631–647. [Google Scholar] [CrossRef]
  43. Van Doren, B.M.; Willard, D.E.; Hennen, M.; Horton, K.G.; Stuber, E.F.; Sheldon, D.; Sivakumar, A.H.; Wang, J.; Farnsworth, A.; Winger, B.M. Drivers of fatal bird collisions in an urban center. Proc. Natl. Acad. Sci. USA 2021, 118, e2101666118. [Google Scholar] [CrossRef] [PubMed]
  44. Lao, S.; Robertson, B.A.; Anderson, A.W.; Blair, R.B.; Eckles, J.W.; Turner, R.J.; Loss, S.R. The influence of artificial night at night and polarized light on bird-building collisions. Biol. Conserv. 2020, 241, 108358. [Google Scholar] [CrossRef]
  45. Loss, S.R.s.l.o.e.; Will, T.; Loss, S.S.; Marra, P.P. Bird-building collisions in the United States: Estimates of annual mortality and species vulnerability. Condor 2014, 116, 8–23. [Google Scholar] [CrossRef]
  46. Adams, C.A.; Fernández-Juricic, E.; Bayne, E.M.; Clair, C.C.S. Effects of artificial light on bird movement and distribution: A systematic map. Environ. Evid. 2021, 10, 37. [Google Scholar] [CrossRef]
  47. Evans, B.S.; Reitsma, R.; Hurlbert, A.H.; Marra, P.P. Environmental filtering of avian communities along a rural_to_urban gradient in Greater Washington, D.C., USA. Ecosphere 2018, 9, 1. [Google Scholar] [CrossRef]
  48. Shaffer, J.A.; Loesch, C.R.; Buhl, D.A. Estimating offsets for avian displacement effects of anthropogenic impacts. Ecol. Appl. 2019, 29, e01983. [Google Scholar] [CrossRef]
  49. Jameson, F.; Chace, J.J.W. Urban effects on native avifauna: A review. Landsc. Urban Plan. 2004, 74, 46–69. [Google Scholar] [CrossRef]
  50. Zhang, Z.; Xia, F.; Yang, D.; Huo, J.; Wang, G.; Chen, H. Spatiotemporal characteristics in ecosystem service value and its interaction with human activities in Xinjiang, China. Ecol. Indic. 2020, 110, 105826. [Google Scholar] [CrossRef]
  51. Rico-Silva, J.F.; Cruz-Trujillo, E.J.; Colorado, Z.G.J. Influence of environmental factors on bird diversity in greenspaces in an Amazonian city. Urban Ecosyst. 2020, 24, 365–374. [Google Scholar] [CrossRef]
  52. Tellez-Hernandez, E.; Dominguez-Vega, H.; Zuria, I.; Marin-Togo, M.C.; Gomez-Ortiz, Y. Functional and ecological diversity of urban birds: Conservation and redesign of biocultural landscapes. J. Nat. Conserv. 2023, 73, 126395. [Google Scholar] [CrossRef]
  53. Puan, C.L.; Yeong, K.L.; Ong, K.W.; Fauzi, M.I.A.; Yahya, M.S.; Khoo, S.S. Influence of landscape matrix on urban bird abundance: Evidence from Malaysian citizen science data. J. Asia-Pac. Biodivers. 2019, 12, 369–375. [Google Scholar] [CrossRef]
  54. Xie, S.; Marzluff, J.M.; Su, Y.; Wang, Y.; Meng, N.; Wu, T.; Ouyang, Z. The role of urban waterbodies in maintaining bird species diversity within built area of Beijing. Sci. Total Environ. 2022, 806, 150430. [Google Scholar] [CrossRef] [PubMed]
  55. Kang, W.; Minor, E.; Park, C.-R.; Lee, D. Effects of habitat structure, human disturbance, and habitat connectivity on urban forest bird communities. Urban Ecosyst. 2015, 18, 857–870. [Google Scholar] [CrossRef]
  56. Wang, Y.; Qu, Z.; Zhong, Q.; Zhang, Q.; Zhang, L.; Zhang, R.; Yi, Y.; Zhang, G.; Li, X.; Liu, J. Delimitation of ecological corridors in a highly urbanizing region based on circuit theory and MSPA. Ecol. Indic. 2022, 142, 109258. [Google Scholar] [CrossRef]
  57. Radford, J.Q.; Bennett, A.F.; Cheers, G.J. Landscape-level thresholds of habitat cover for woodland-dependent birds. Biol. Conserv. 2005, 124, 317–337. [Google Scholar] [CrossRef]
  58. Shih, W.-Y. Bird diversity of greenspaces in the densely developed city centre of Taipei. Urban Ecosyst. 2017, 21, 379–393. [Google Scholar] [CrossRef]
  59. Zhang, R. Impact of spatial structure on the functional connectivity of urban ecological corridors based on quantitative analysis. Urban For. Urban Green. 2023, 89, 128121. [Google Scholar] [CrossRef]
Figure 1. Location of the study area. (a) Land–use map of Minhang District, Shanghai, China, and the space recorded by bird monitoring data; (b) built urban ecological corridor of Minhang District, Shanghai, China.
Land 13 01359 g001
Figure 2. Species accumulation profiles of bird survey samples.
Land 13 01359 g002
Figure 3. Spatial distribution pattern of factors characterizing the built environment in urban ecological corridors.
Land 13 01359 g003
Figure 4. (a) PCA distribution of each factor of habitat characteristics; (b) PCA distribution of each factor of degree of urbanization; (c) PCA distribution of each factor of slow-traffic connectivity.
Land 13 01359 g004
Figure 5. Spatial pattern of bird diversity: (a) bird richness; (b) bird abundance; (c) Shannon–Wiener Index; (d) Simpson Index.
Land 13 01359 g005
Figure 6. Histogram of frequency distribution of bird diversity data before and after processing.
Land 13 01359 g006
Figure 7. Distribution pattern of built environment characteristics of urban ecological corridors and their bivariate LISA clustering with bird richness (ac): distribution pattern of habitat suitability, urbanization degree, and slow-traffic connectivity; (df): habitat suitability–bird richness LISA plot, urbanization degree–bird richness LISA map, slow-traffic connectivity–bird richness LISA map.
Land 13 01359 g007
Table 1. Environmental indices used in this study.
FactorsIndices (Abbreviation)Data SourceCitation
Habitat environmental characteristics
Land use typeProportion of area covered by tree (TC)SinoLC-1 (https://doi.org/10.5281/zenodo.7707461, accessed on 2 February 2024)[31]
Proportion of area covered by shrubland (SC)
Mean Normalized Difference Vegetation IndexNDVICopernicus Sentinel-2 at a spatial resolution of 10 m
Vegetation canopy heightCHMhttps://glad.umd.edu/dataset/gedi/, accessed on 2 February 2024
Distance to water Distance to waters >1 ha in size (DW)SinoLC-1 (https://doi.org/10.5281/zenodo.7707461, accessed on 2 February 2024)
Degree of urbanization
Distance to regional centersDistance to Hongqiao City Sub-center
(DHQ)
NGCC, https://www.ngcc.cn, accessed on 2 February 2024[27]
Distance to Xinzhuang City Sub-center
(DXZ)
Building heightDSM[32]
Nighttime Lighting IndexNTLLuojia-1 image (http://59.175.109.173:8888/app/login.html, accessed on 2 February 2024)
Population densityPDhttp://www.pbl.nl/hyde, accessed on 2 February 2024
Economic developmentgross domestic production (GDP)Resourse and environment science data platform (http://www.resdc.cn, accessed on 2 February 2024)
Slow-traffic connectivity
Heat of slow-traffic movement trajectories of urban residentsWeekend cycling heatExercise trajectories of urban residents in Minhang District, Shanghai, China, in 2023 in the Keep app.[33]
Weekend hiking heat
Weekend running heat
Weekday cycling heat
Weekday running heat
Weekday hiking heat
Table 2. Loading and summary for the principal component for the PCA of the characteristics of the built environment of ecological corridors.
PC1HabPC2Hab PC1UrbPC2Urb PCStc
TC0.49−0.096DXZ0.5260.266Weekend cycling heat0.146
SC0.017−0.301DHQ0.5480.286Weekend hiking heat0.211
DW0.0190.864DSM−0.3010.383Weekend running heat0.211
CHM0.398−0.199NTL−0.0100.746Weekday cycling heat0.12
NDVI0.4560.252PD−0.5610.238Weekday running heat0.21
Propertion of variance32.8921.08GDP−0.1310.297Weekday hiking heat0.21
Cumualative proportion32.8943.342Propertion of variance35.822.4Standard deviation4.688
Cumualative proportion35.858.2Cumualative proportion78.14
Table 3. The correlation coefficient r is derived from the Pearson correlation between all covariates included in GLM, the characteristics of the built environment between the three groups of bird diversity characteristics and habitat characteristics GHab, urbanization GUrb, and slow-traffic connectivity GStc, and the correlation between the original variables used in PCAs for PCHab, PCUrb, and PCStc.
TCSCDWCHMNDVIPDDXZDHQNTLDSM
Richness0.214 ***0.0120.113 ***0.117 ***0.099 ***0.065 ***0.0040.375 ***0.326 ***0.096 ***
Abundance_log0.222 ***0.0040.048 ***0.078 ***0.0810.083 ***0.253 ***0.407 ***0.416 ***0.078 ***
Simpson_log0.223 ***0.016 *0.045 ***0.125 ***0.084 ***0.281 ***0.136 ***0.272 ***0.427 ***0.150 ***
Shannon Wiener _square0.237 ***0.0110.088 ***0.125 ***0.113 ***0.138 ***0.068 ***0.398 ***0.514 ***0.112 ***
GHab−0.5 ***−0.017 ***0.964 ***0.036 ***0.115 ***0.029 ***0.037 ***0.014 ***0.010−0.003
GUrb0.091 ***−0.054 ***0.016 ***−0.128 ***0.113 ***−0.553 ***0.817 ***0.857 ***0.011 ***−0.140 ***
GStc0.143 ***0.031 ***−0.0030.083 ***0.045 ***0.207 ***−0.144 ***−0.120 ***0.037 ***0.002
Weekend cyclingWeekend hikingWeekend runningWeekday cyclingWeekday hikingWeekday runningGDPGHabGUrbGStc
Richness0.031 ***0.031 ***0.031 ***0.023 ***0.032 ***0.032 ***−0.109 ***−0.113 ***0.272 ***0.032 ***
Abundance_log0.0120.034 ***0.018 ***0.034 ***0.034 ***0.033 ***−0.117 ***−0.048 ***0.419 ***0.034 ***
Simpson_log0.030 ***0.040 ***0.040 ***0.031 ***0.040 ***0.040 ***−0.147 ***−0.087 ***0.328 ***0.041 ***
Shannon Wiener _square0.031 ***0.038 ***0.038 ***0.031 ***0.039 ***0.039 ***−0.130 ***−0.045 ***0.300 ***0.039 ***
GHab−0.009−0.003−0.003−0.012−0.002−0.002−0.049 *** 0.107 ***−0.003
GUrb−0.106 ***−0.143 ***−0.143 ***−0.032 ***−0.143 ***−0.143 ***−0.192 ***0.107 *** −0.146 ***
GStc0.632 ***0.998 ***0.998 ***0.503 ***0.997 ***0.997 ***0.048 ***−0.003−0.146 ***
Note. * p < 0.05, *** p < 0.001. The correlation was significant.
Table 4. Results of the final GLMs for the diversity parameters: richness, Abundance_log, Shannon Wiener_square and Simpson_log, GHab and covariates. Significant p-values are represented by bold font.
RichnessAbundance_log
EstimatesCIpEstimatesCIp
Intercept2.170[2.153; 2.187]<0.0010.418[0.401; 0.435]<0.001
GHab−0.036[−0.000; −0.000]<0.001−0.001[−0.001; −0.000]<0.001
PD0.002[0.002; 0.002]<0.0010.002[0.002; 0.002]<0.001
DXZ−0.000[−0.000; −0.000]<0.0010.000[0.000; 0.000]<0.001
DHQ0.000[0.000; 0.000]<0.0010.000[0.000; 0.000]<0.001
Num. obs.19,959 19,959
R20.654 0.319
Shannon Wiener_squareSimpson_log
EstimatesCIpEstimatesCIp
Intercept2.066[1.991; 2.141]<0.0010.250[0.242; 0.258]<0.001
GHab−0.001[−0.001; −0.001]<0.001−0.001[−0.001; −0.000]<0.001
PD0.009[0.008; 0.009]<0.0010.001[0.001; 0.001]<0.001
DXZ−0.000[−0.000; −0.000]<0.0010.000[0.000; 0.000]<0.001
DHQ0.000[0.000; 0.000]<0.0010.000[0.000; 0.000]<0.001
Num. obs.19,959 19,959
R20.354 0.352
Table 5. Results of the final GLMs for the diversity parameters: richness, Abundance_log, Shannon Wiener_square and Simpson_log, GUrb and covariates. Significant p-values are represented by bold font.
RichnessAbundance_log
EstimatesCIpEstimatesCIp
Intercept0.391[3.528; 3.625]<0.0010.948[0.909; 0.986]<0.001
GUrb1.412[1.364; 1.460]<0.0010.436[0.408; 0.463]<0.001
PD1.517[1.481; 1.553]<0.0010.855[0.832; 0.878]<0.001
DXZ−1.901[−1.952; −1.850]<0.001−0.295[−0.334; −0.257]<0.001
DHQ−0.221[−0.275; −0.166]<0.001−0.226[−0.266; −0.186]<0.001
Num. obs.19,959 19,959
R20.715 0.345
Shannon Wiener_squareSimpson_log
EstimatesCIpEstimatesCIp
Intercept4.872[4.699; 5.044]0.0300.610[0.592; 0.627]0.011
GUrb2.330[2.206; 2.453]<0.0010.292[0.280; 0.305]<0.001
PD4.138[4.035; 4.241]<0.0010.562[0.552; 0.573]<0.001
DSZ−3.385[−3.556; −3.214]<0.001−0.257[−0.275; −0.240]<0.001
DHQ−1.458[−1.637; −1.279]<0.001−0.016[−0.034; −0.002]<0.001
Num. obs.19,959 19,959
R20.386 0.409
Table 6. Results of the final GLMs for the diversity parameters: richness, Abundance_log, Shannon Wiener_square and Simpson_log, GStc and covariates. Significant p-values are represented by bold font.
RichnessAbundance_log
EstimatesCIpEstimatesCIp
Intercept2.131[2.115; 2.148]<0.0010.396[0.380; 0.413]<0.001
GStc0.001[0.000; 0.000]<0.0010.000[0.000; 0.000]<0.001
PD0.002[0.002; 0.002]<0.0010.002[0.002; 0.002]<0.001
DXZ−0.000[−0.000; −0.000]<0.0010.000[0.000; 0.000]<0.001
DHQ0.000[−0.000; −0.000]<0.0010.000[0.000; 0.000]<0.001
Num. obs.19,959 19,959
R20.638 0.314
Shannon Wiener_squareSimpson_log
EstimatesCIpEstimatesCIp
Intercept1.923[1.848; 1.997]<0.0010.240[0.232; 0.247]<0.001
GStc0.000[−0.000; 0.000]0.060−0.000[−0.000; 0.000]0.005
PD0.008[0.008; 0.009]<0.0010.001[0.001; 0.001]<0.001
DXZ−0.000[−0.000; −0.000]<0.0010.000[0.000; 0.000]<0.001
DHQ0.000[0.000; 0.000]<0.0010.000[0.000; 0.000]<0.001
Num. obs.19,959 19,959
R20.343 0.346
Disclaimer/Publisher’s Note: The statements, opinions and data contained in all publications are solely those of the individual author(s) and contributor(s) and not of MDPI and/or the editor(s). MDPI and/or the editor(s) disclaim responsibility for any injury to people or property resulting from any ideas, methods, instructions or products referred to in the content.

