


Reconstructing the Silk Road Network: Insights from Spatiotemporal Patterning of UNESCO World Heritage Sites

Abstract
:1. Introduction
- The SRN, the system of interactions among Eurasia and Africa, is an enclosed and stable system.
- Heritage sites that once existed and prospered can reflect the prosperity of the aforementioned interaction system.
- The network density between heritage sites reflects the network density of the SRN.
2. Materials and Methods
2.1. Material Collection
2.2. Research Methods
2.2.1. Spatial Distribution Analysis
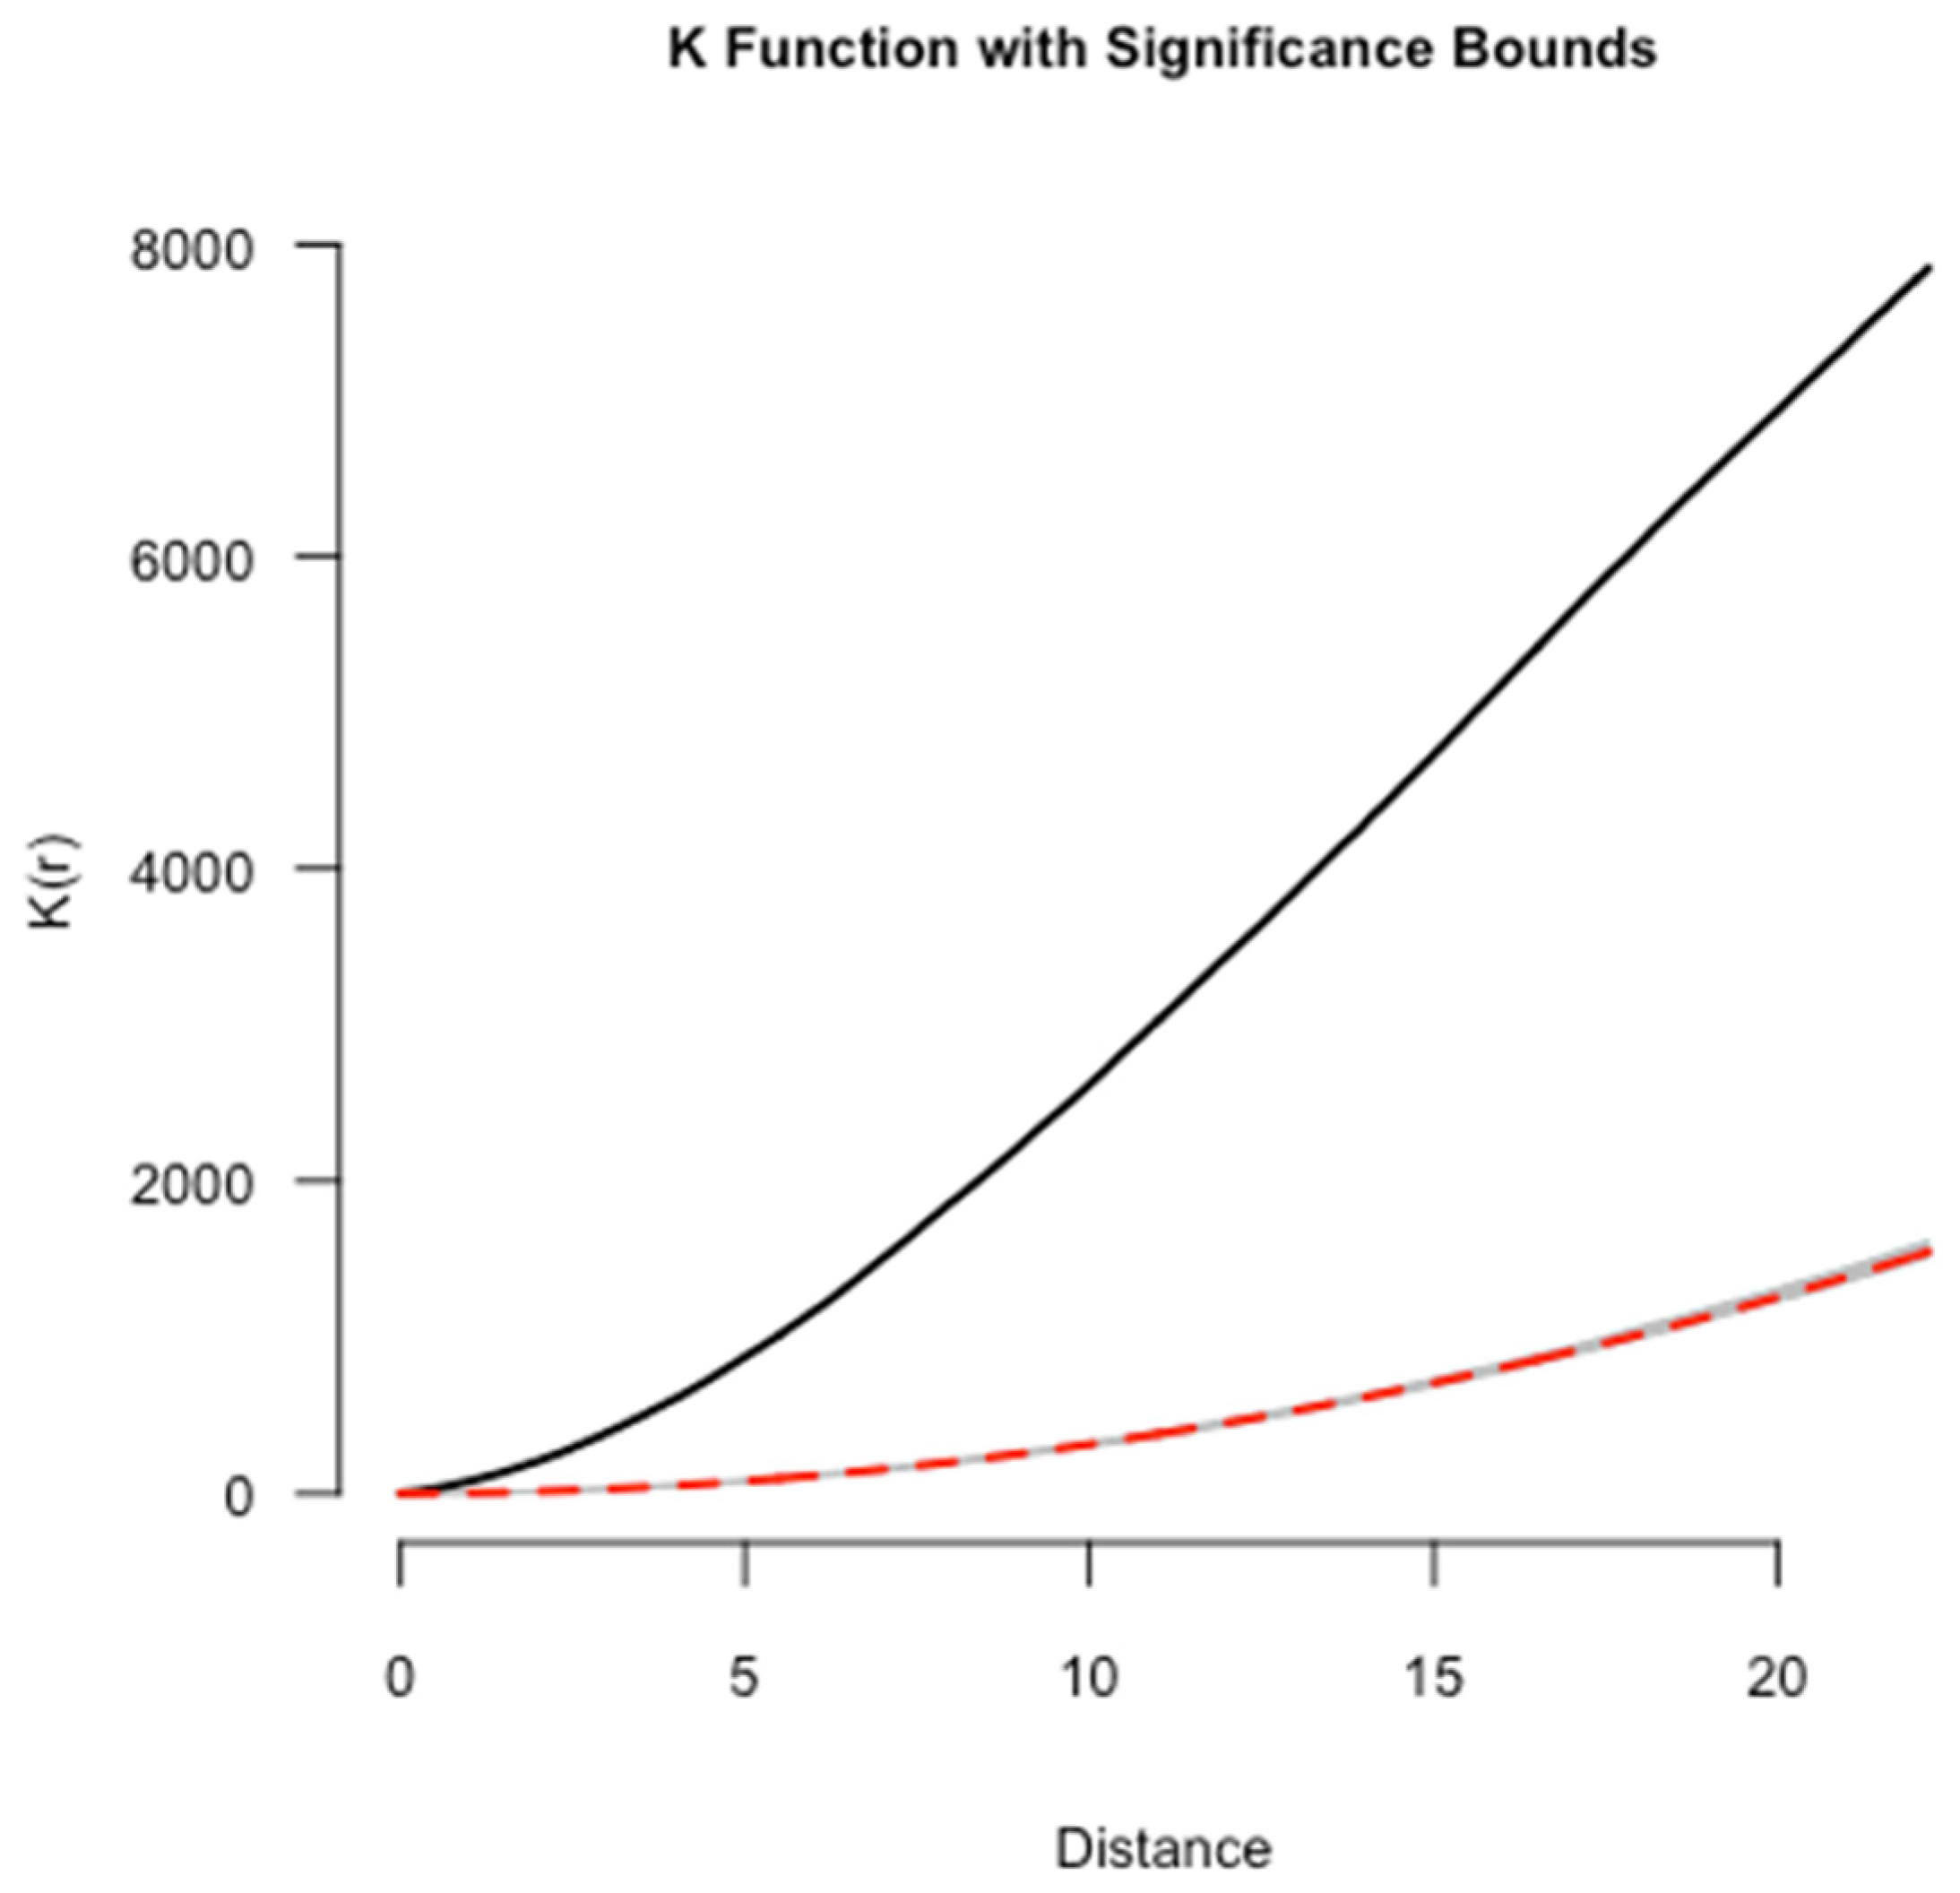
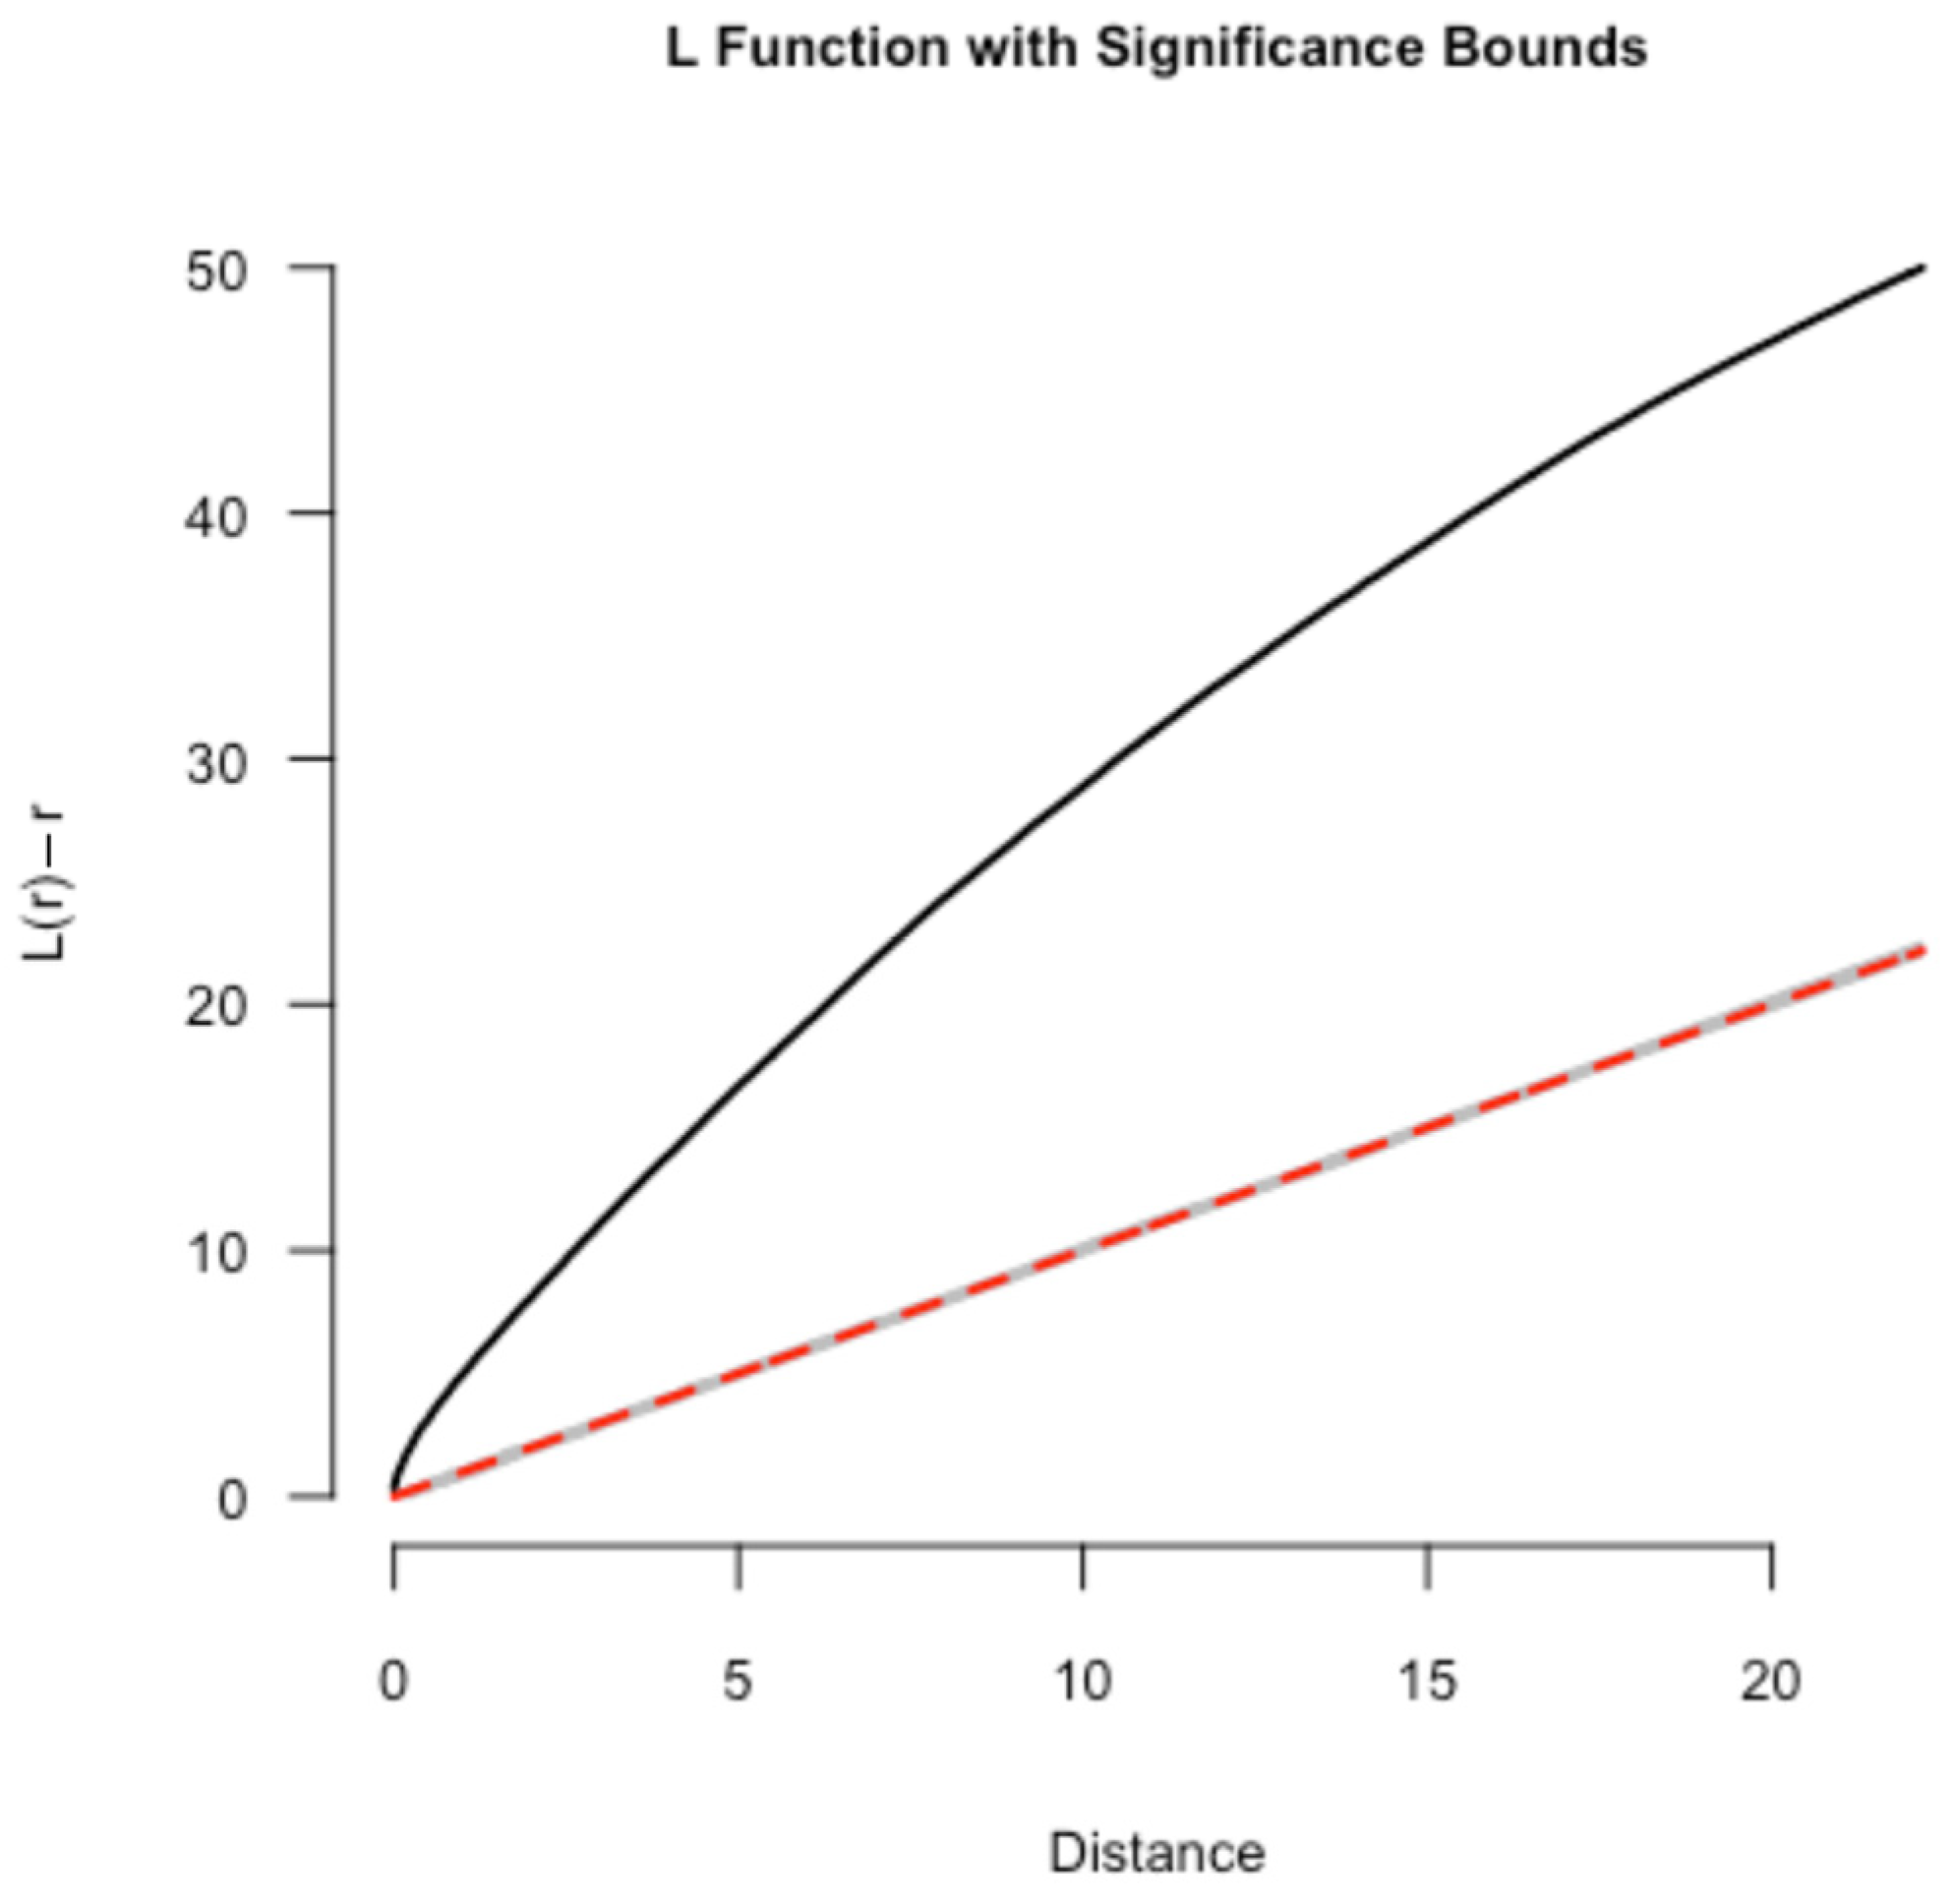
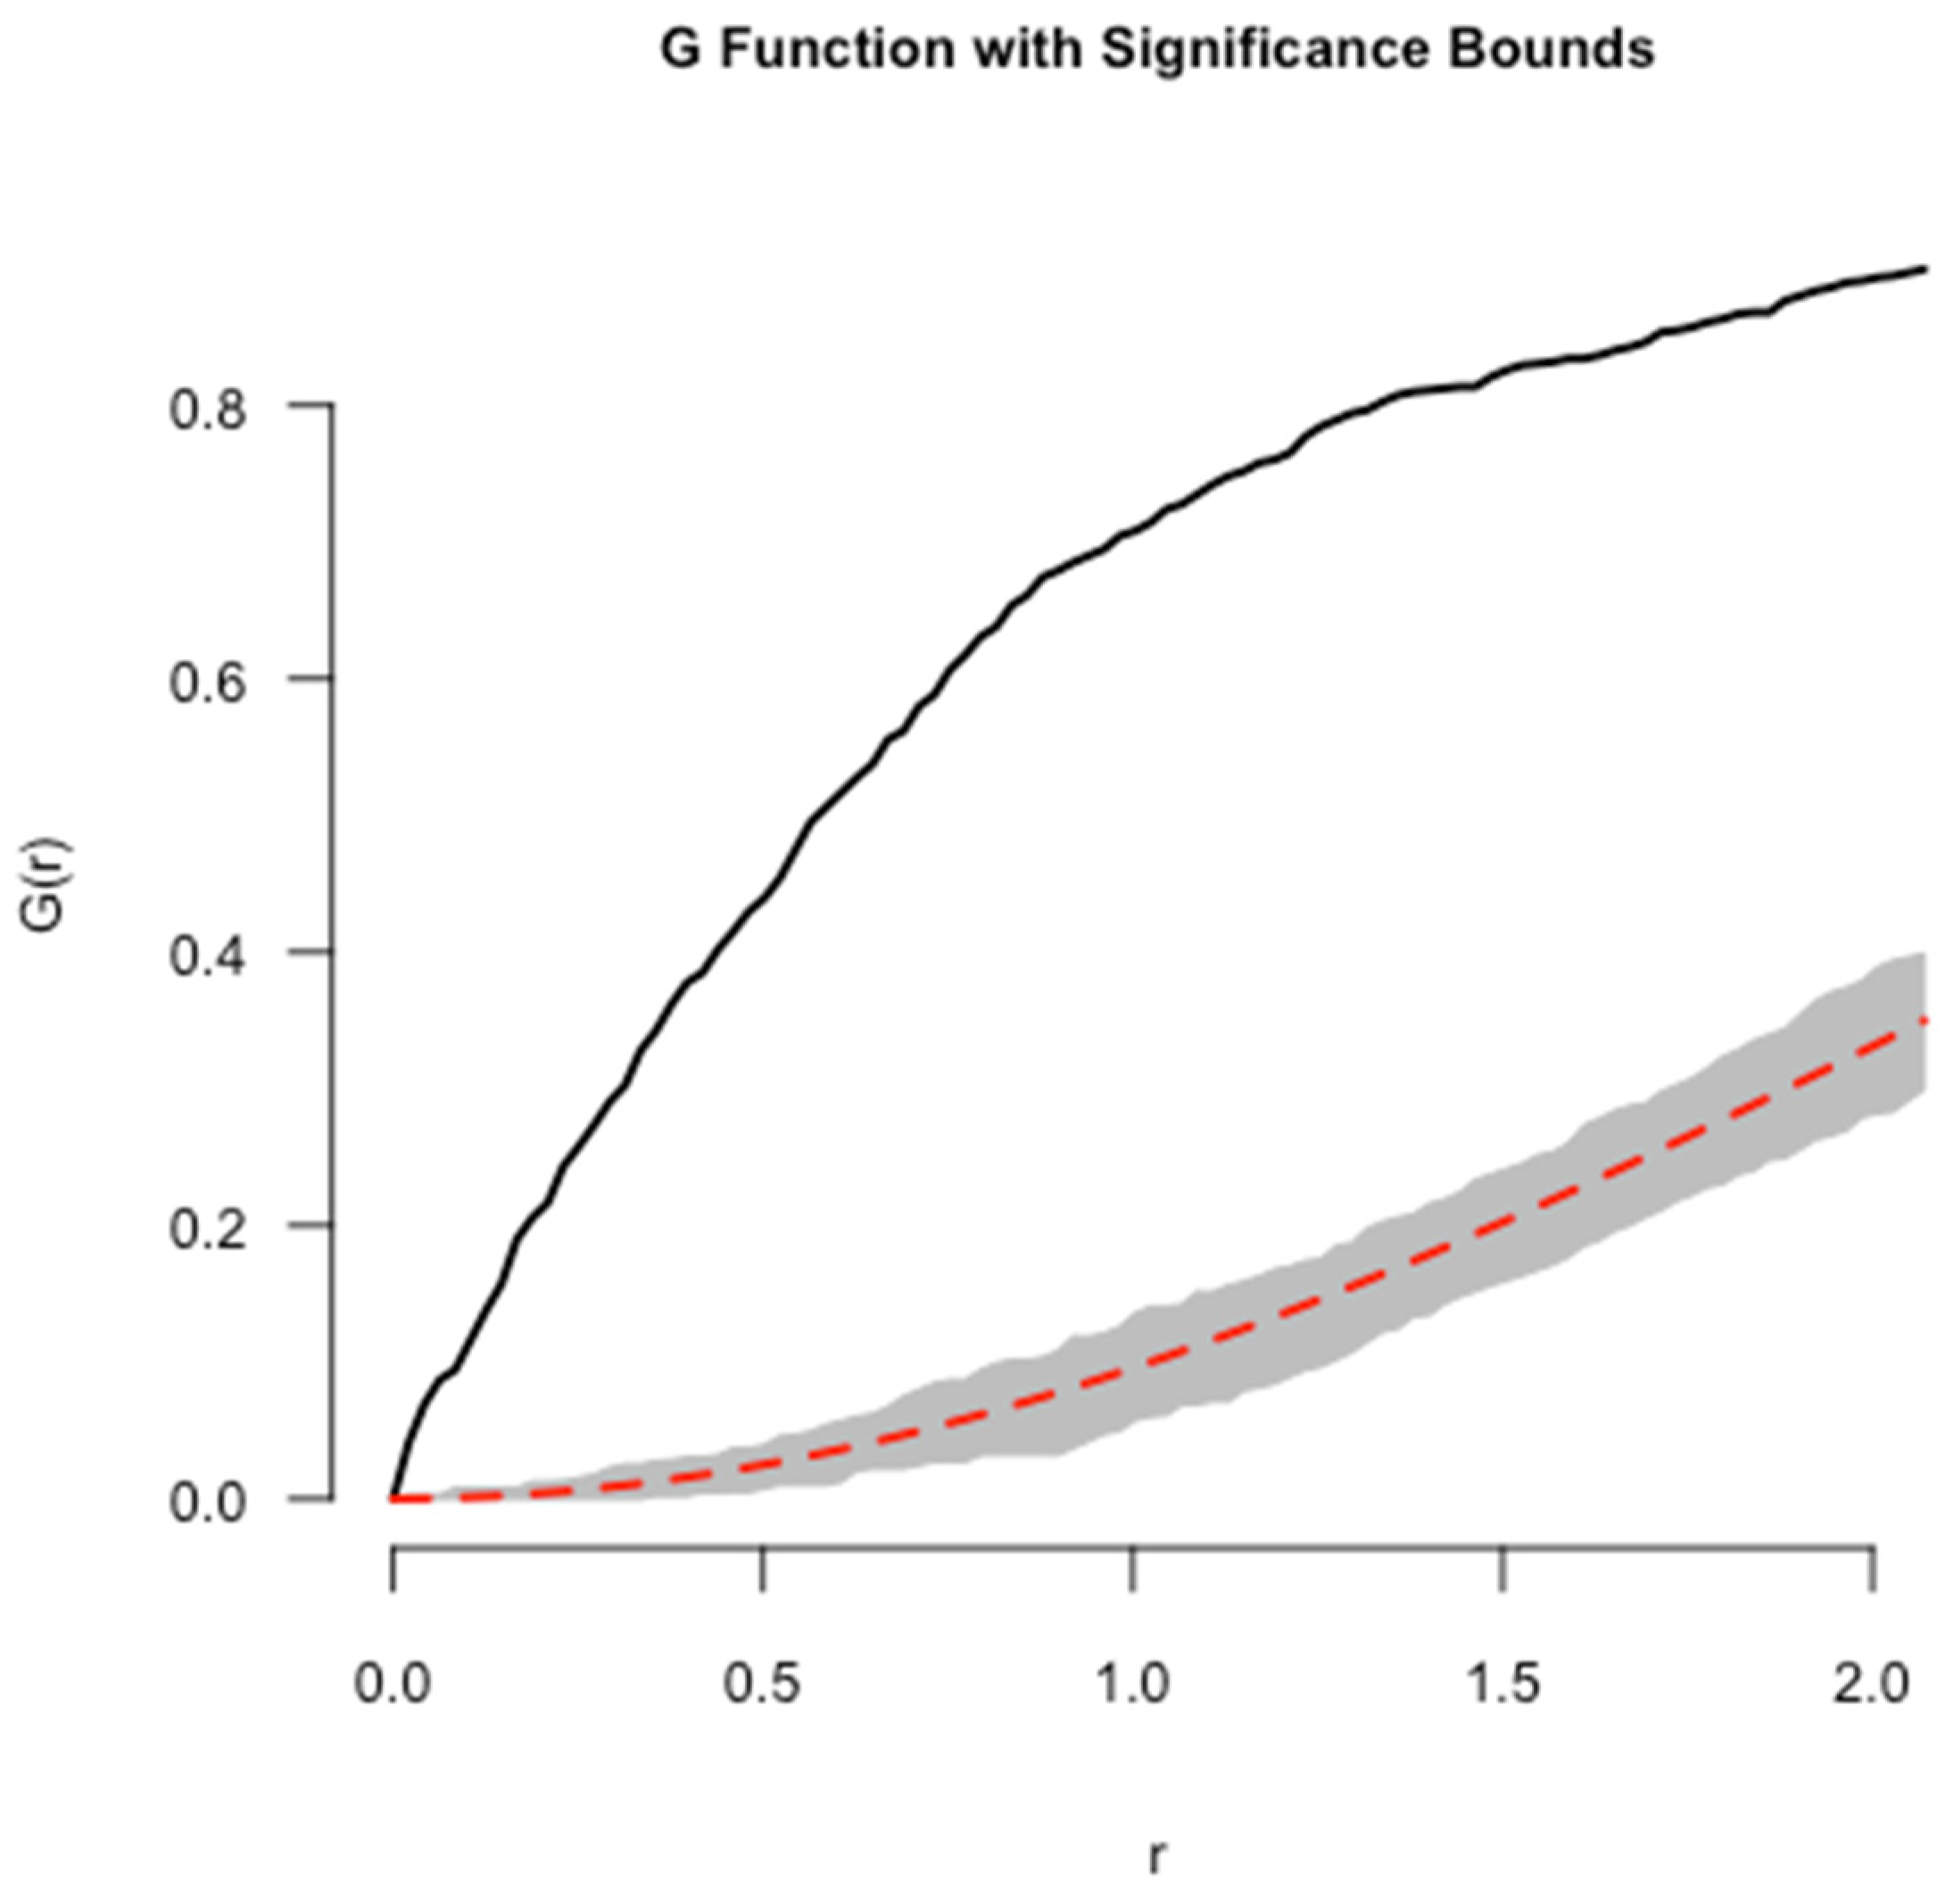
2.2.2. Proximity Analysis
2.2.3. Kernel Density Estimation
3. Results
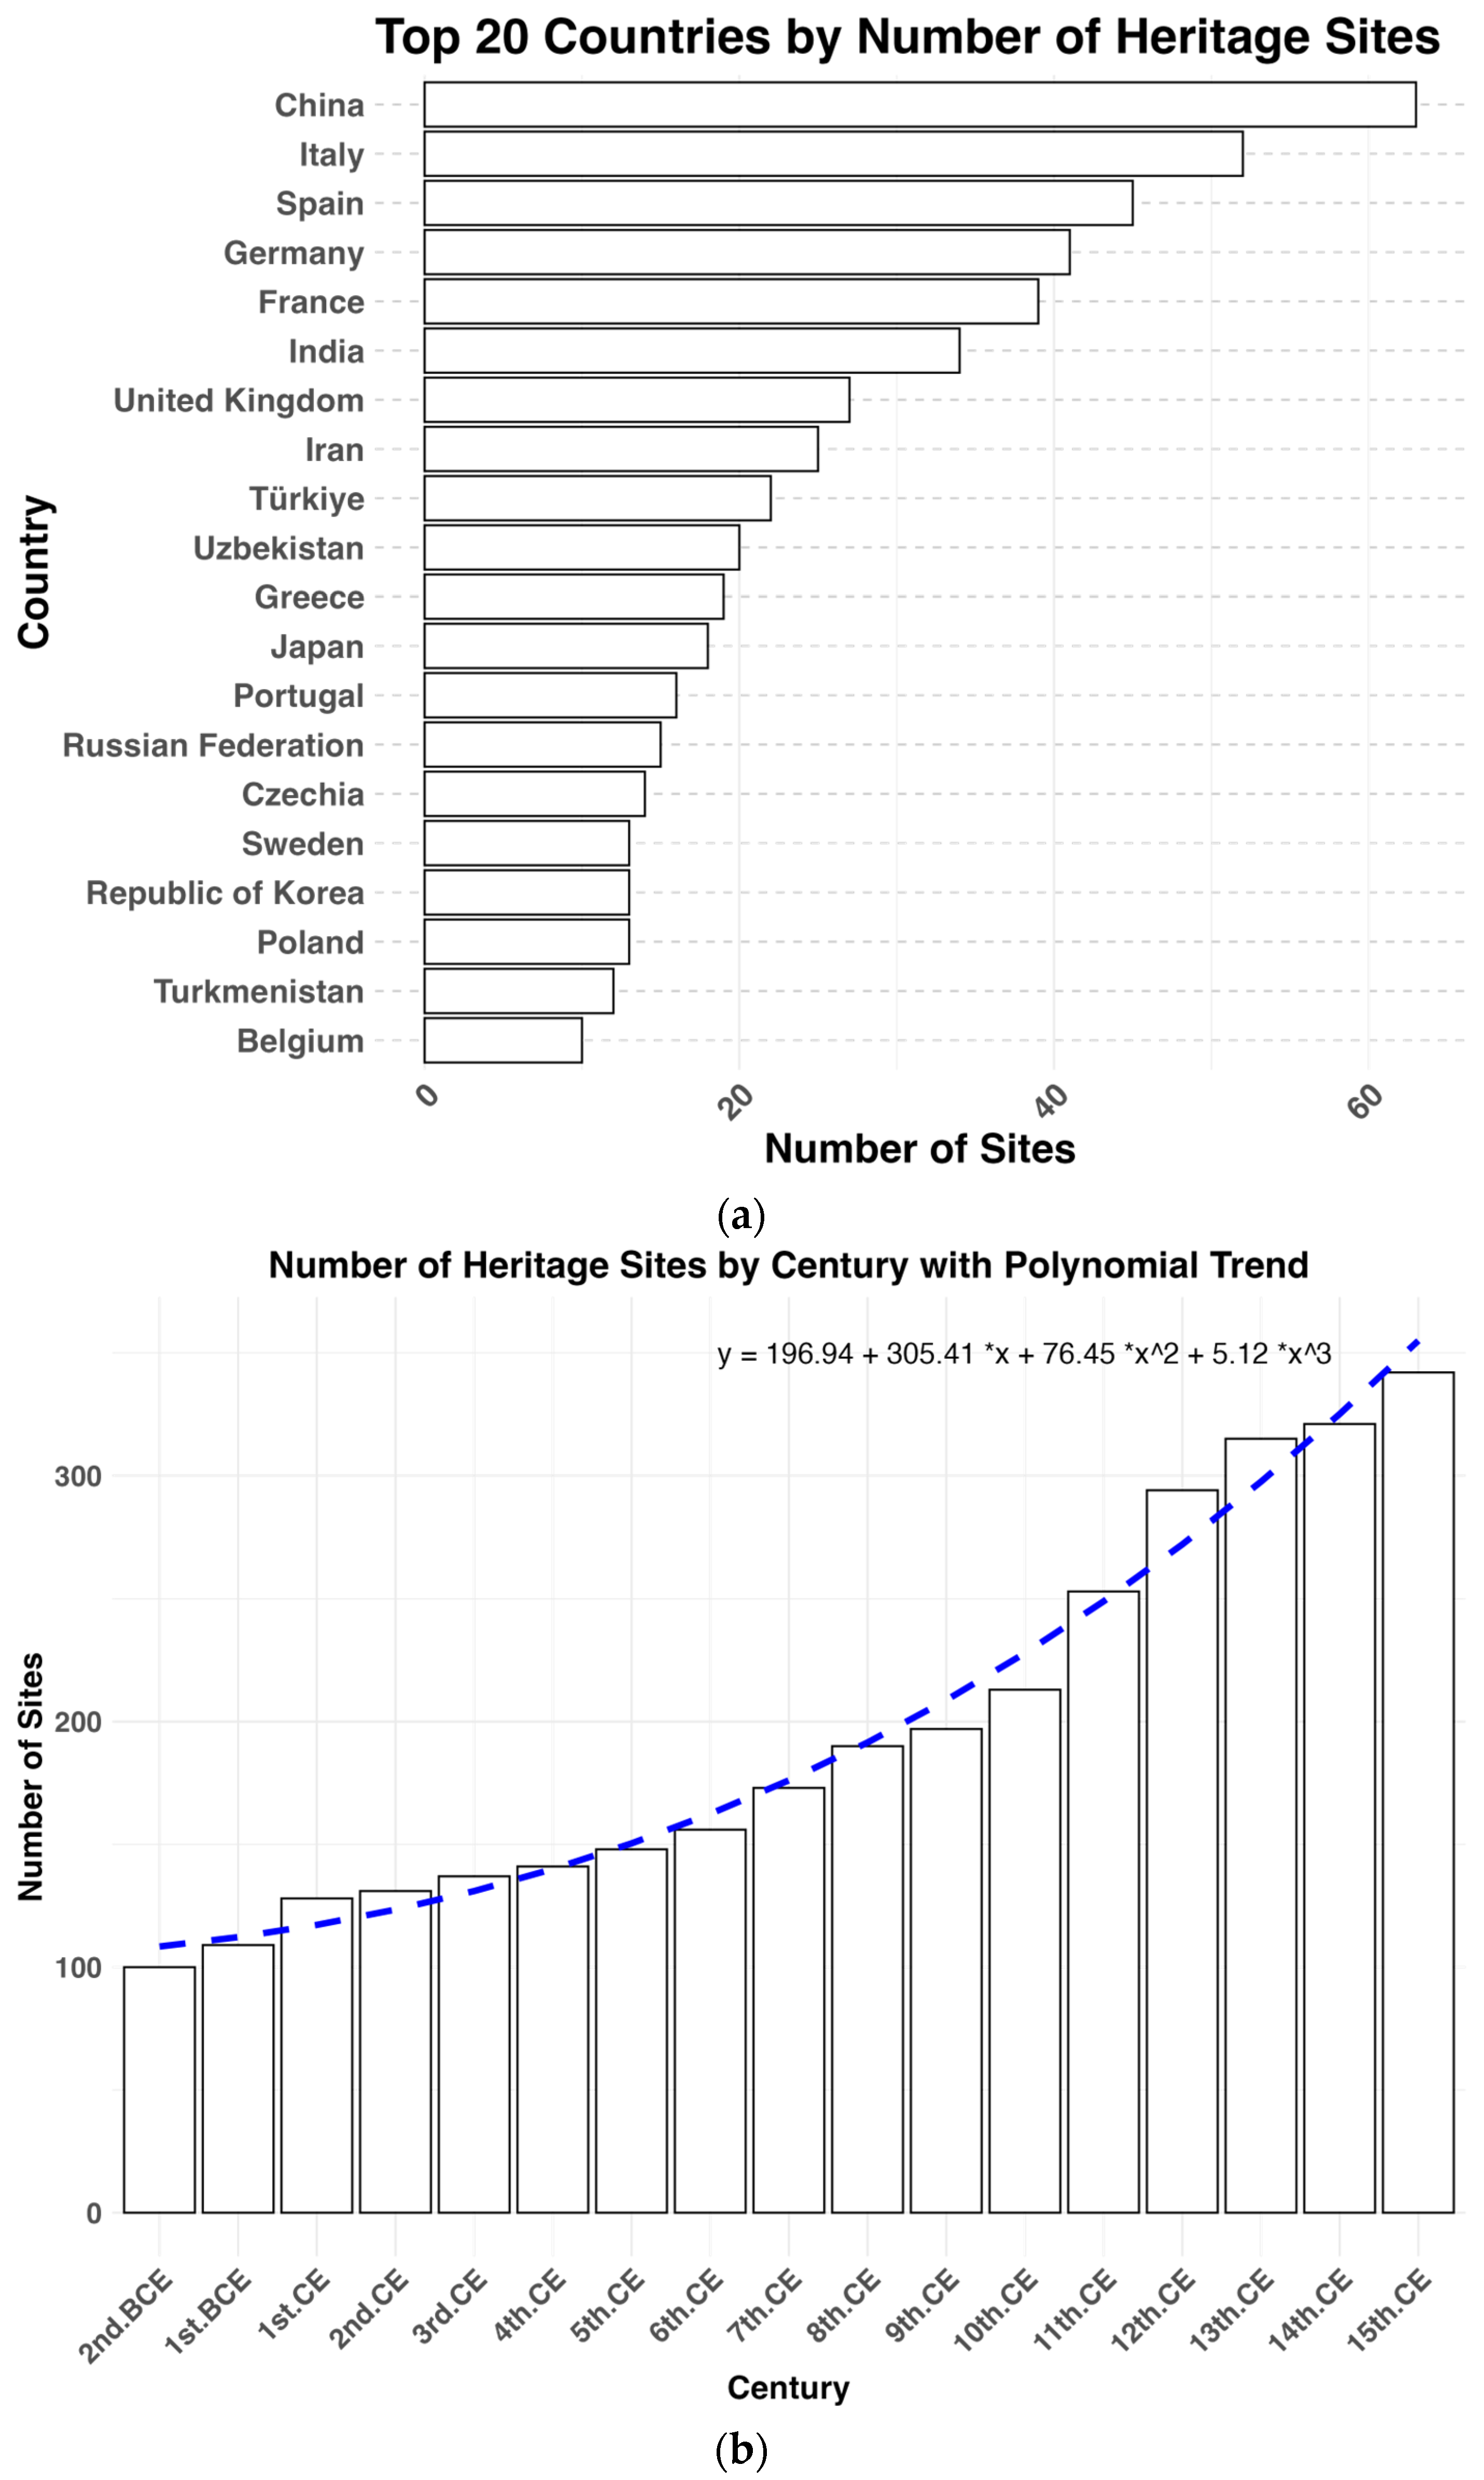
3.1. Statistical Analysis
3.2. Spatial Clustering Analysis across Centuries
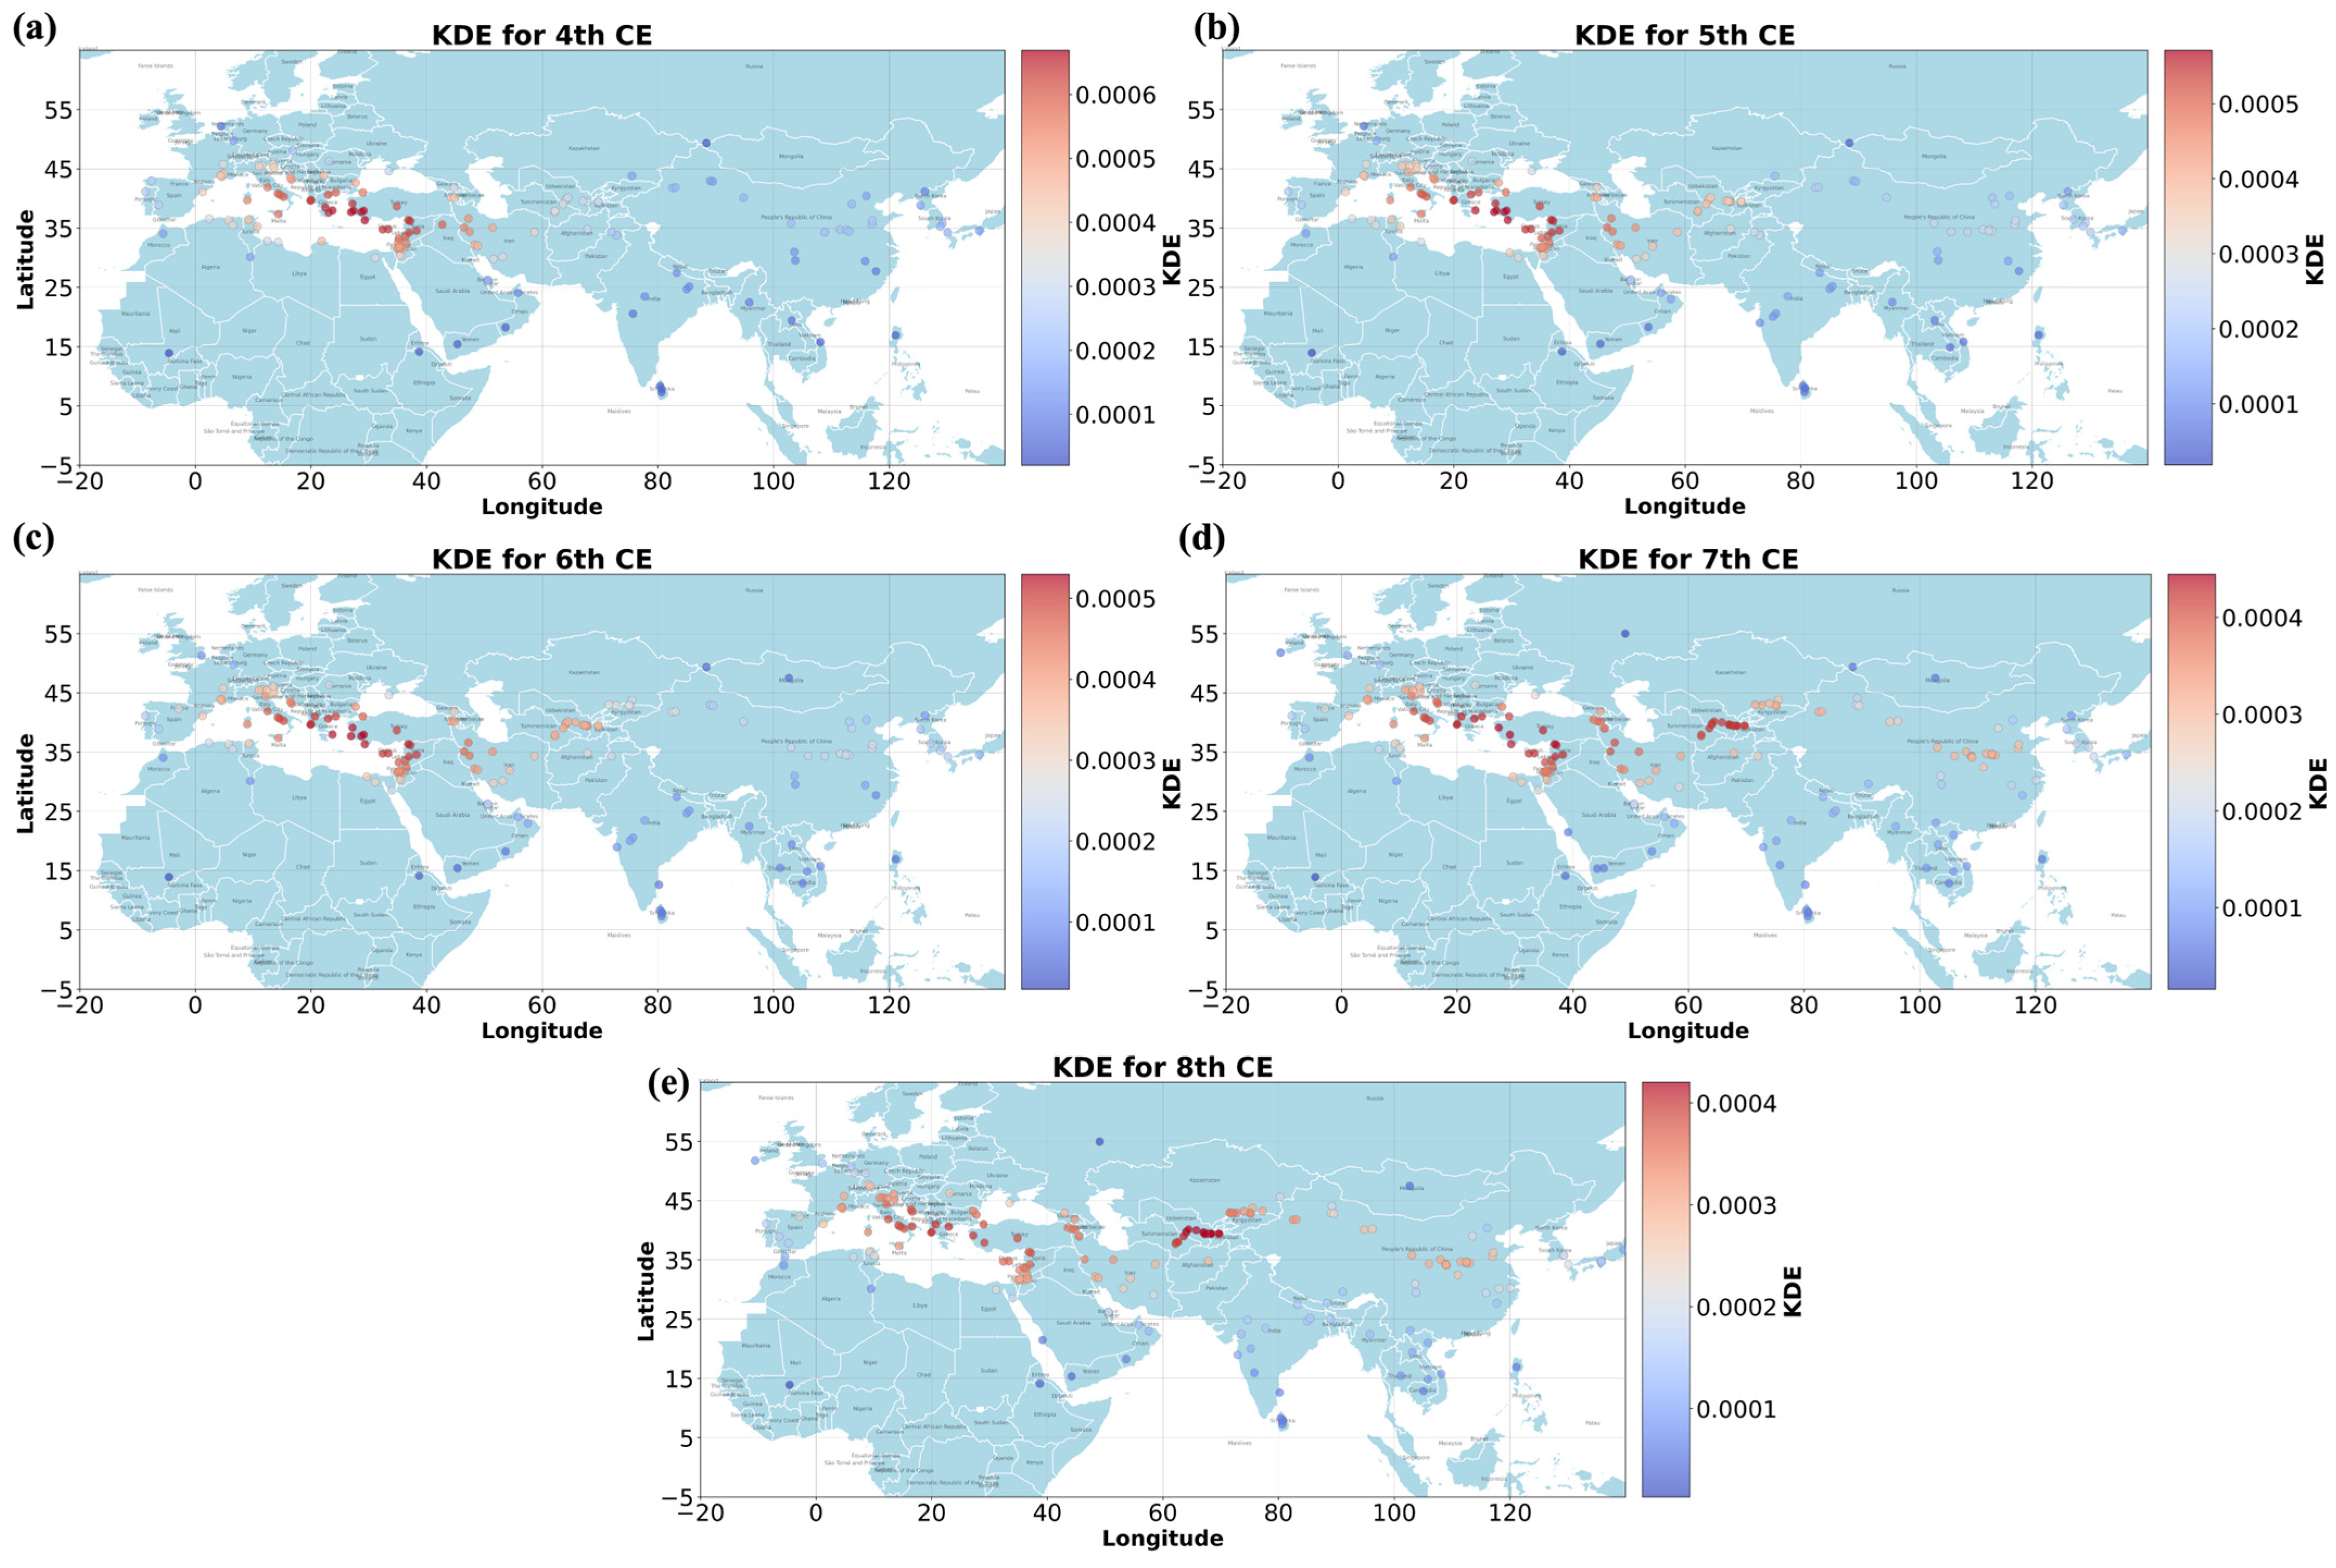
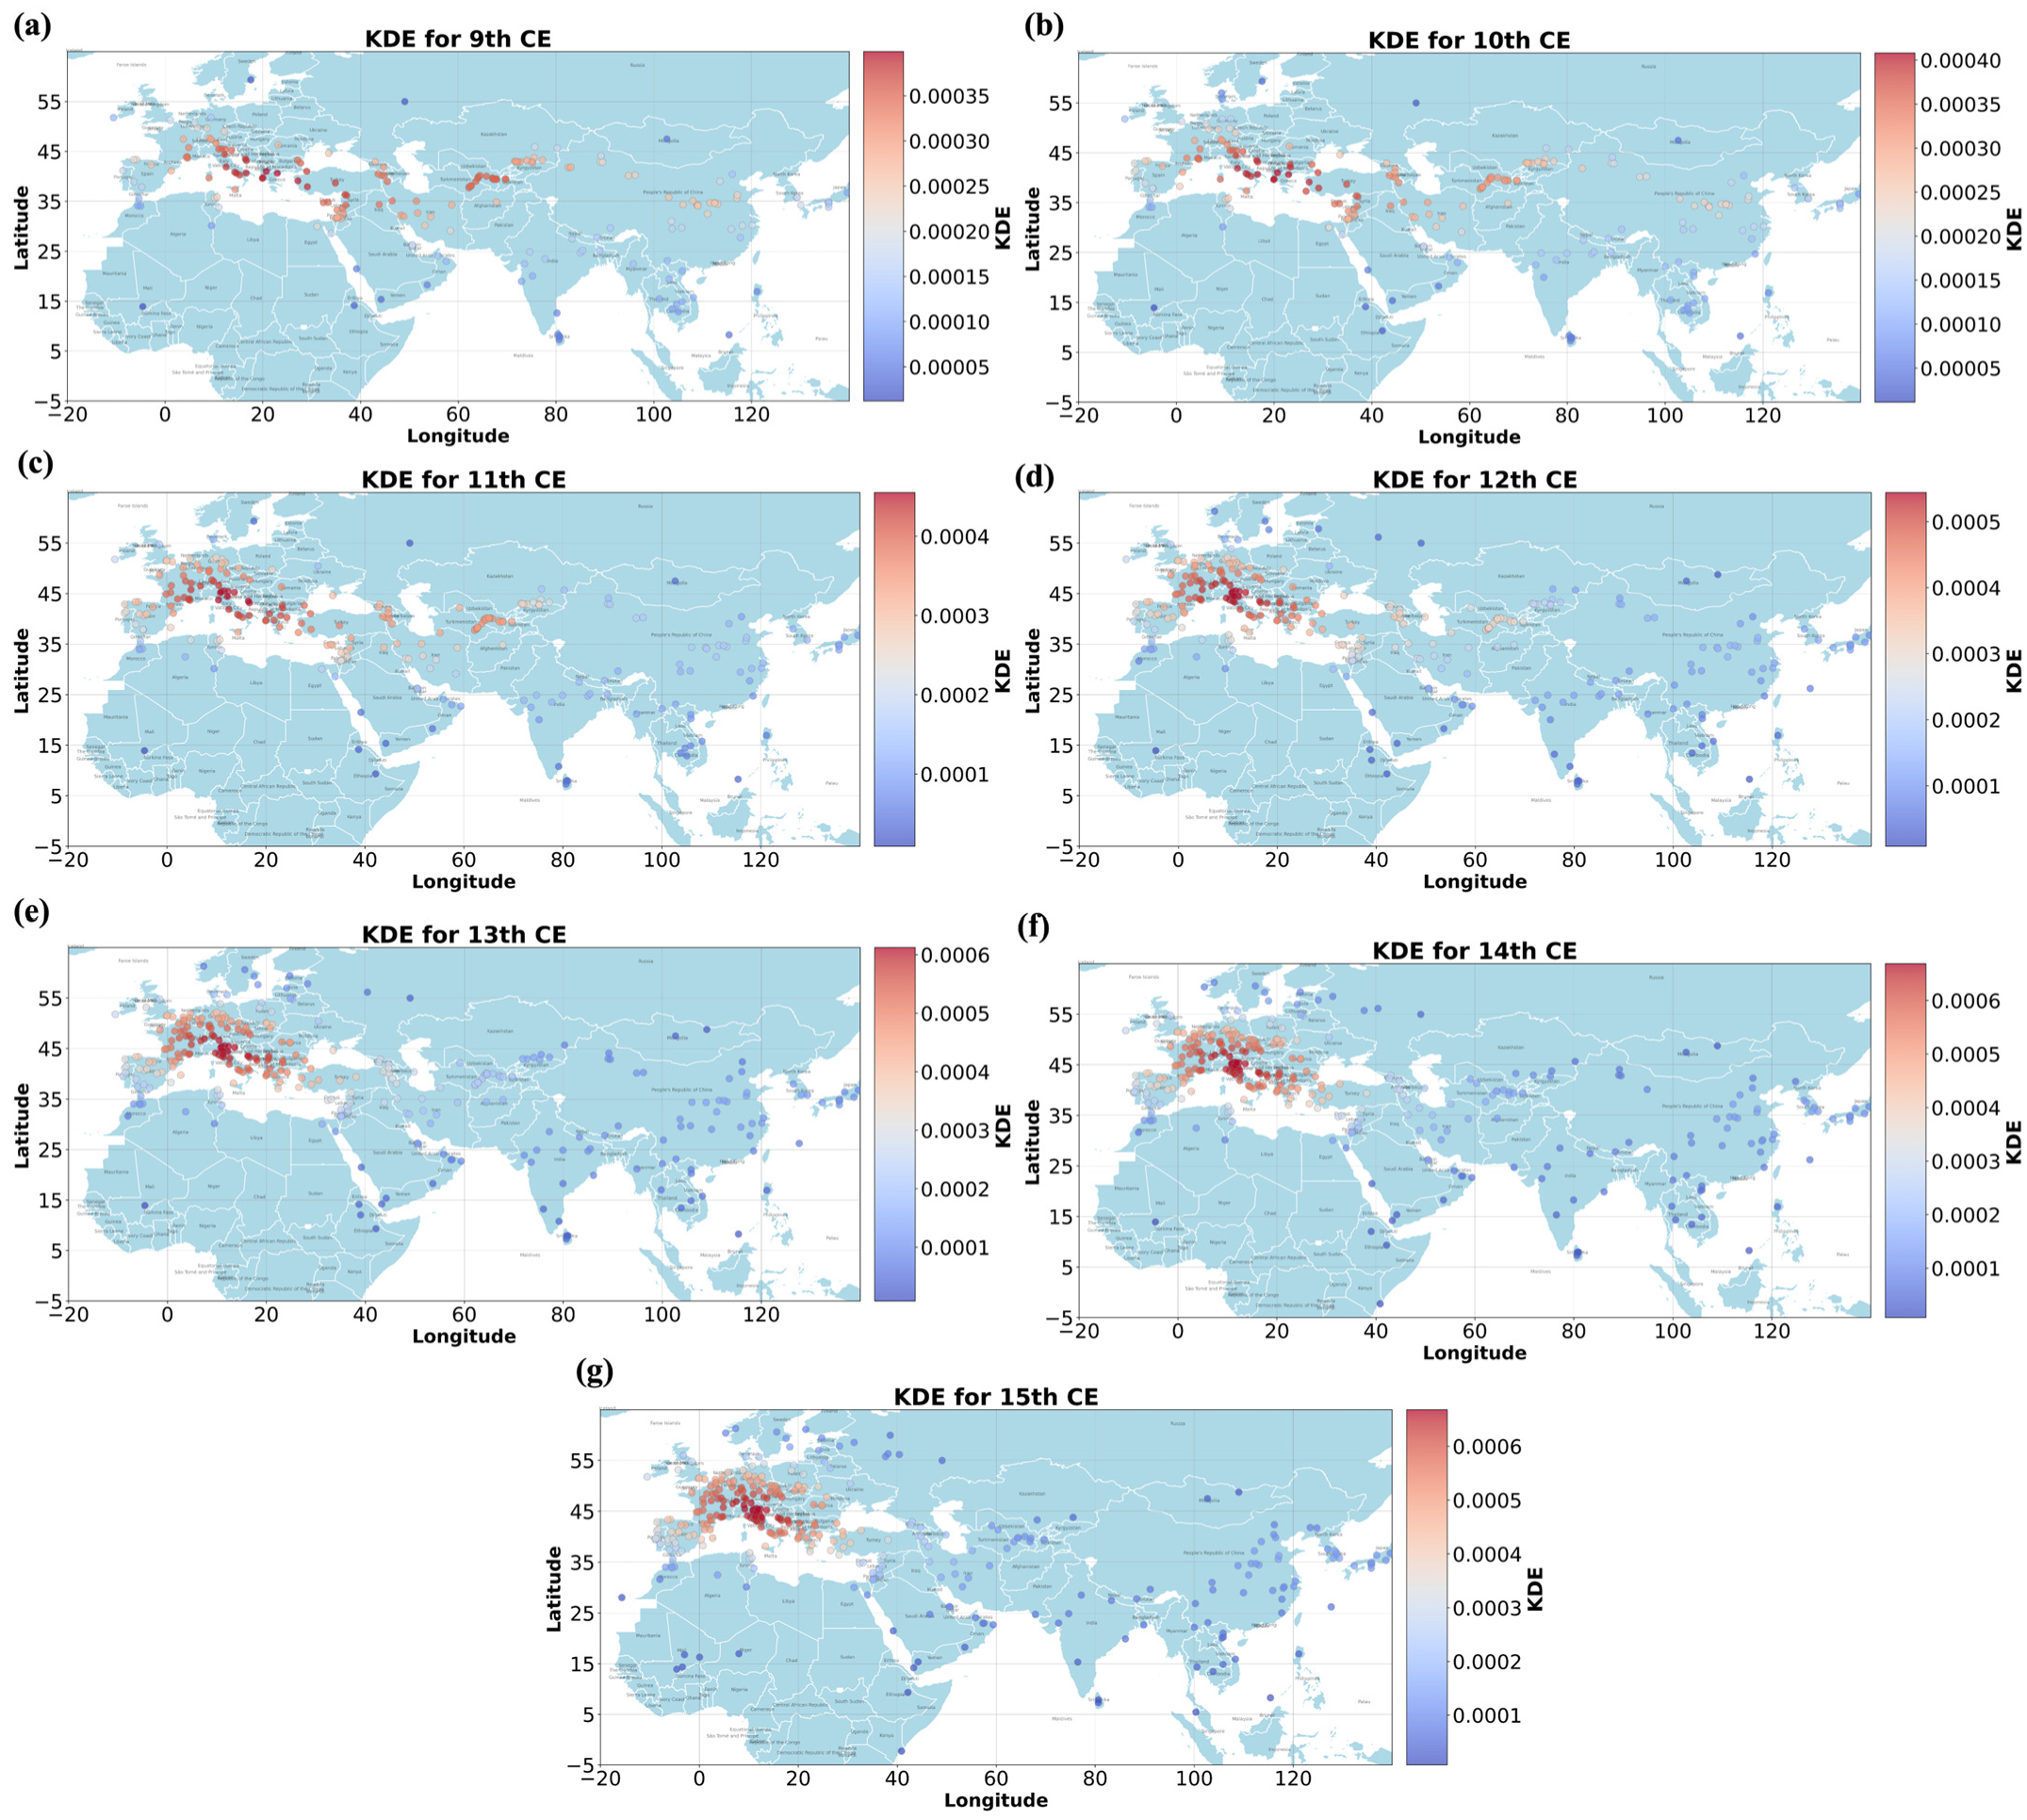
3.3. Kernel Density Estimation Visualization
3.3.1. Heatmap Visualization and Interpretation
3.3.2. Scatter Plot Visualization and Interpretation
4. Discussion
4.1. Analysis of Assumptions in the SRN Study
4.2. Analysis of Relevant Elements on SRN Heritage Sites
4.2.1. Climate Change on the SRN
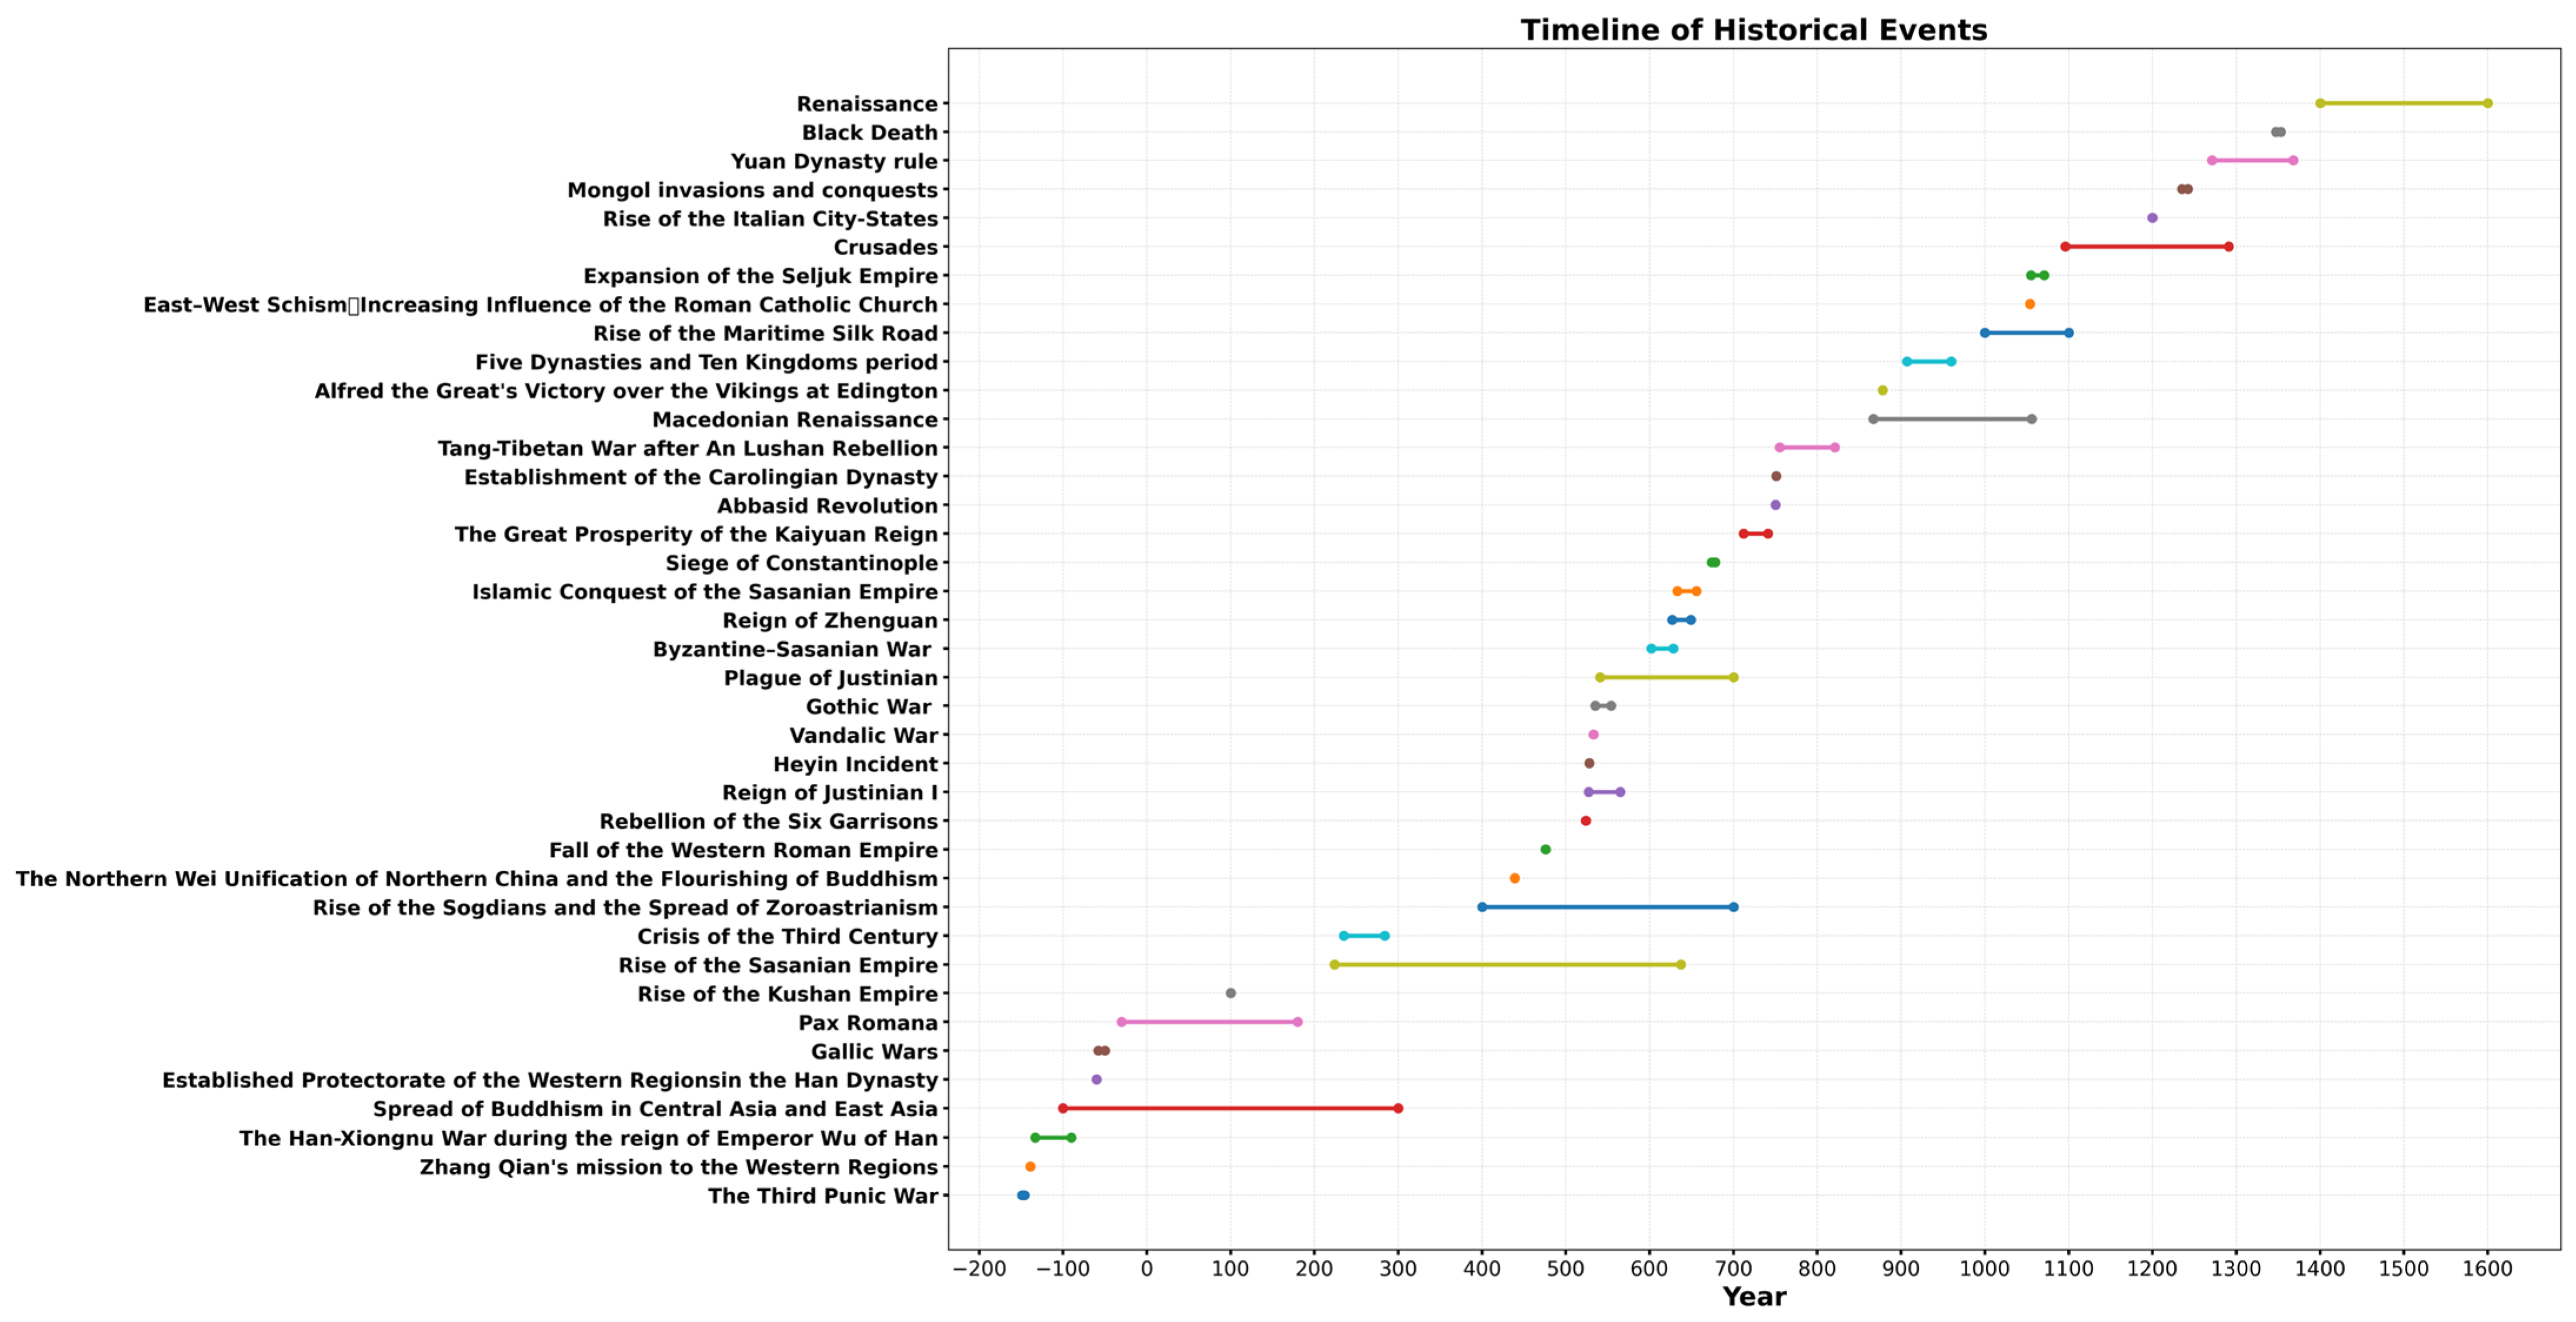
4.2.2. Historical Events and Heritage Site Dynamics on the SRN
4.3. Limitations
4.4. Recommendations for Enhanced Conservation and Management
- Prioritize Conservation Based on Spatial Clustering: Prioritizing conservation efforts using spatial clustering is vital for managing heritage landscapes along the SRN. This method preserves not only the physical integrity of sites but also the continuity of the heritage landscape and its historical narrative. Spatial clustering analysis allows for a transition from protecting isolated sites to adopting a more comprehensive strategy that safeguards entire clusters of heritage sites. By concentrating on clusters of significant cultural and economic activity, conservation efforts can more effectively preserve historically interconnected sites, thus maintaining the network’s overall integrity.
- Enhance and Protect Regional Connectivity: Regional connectivity is crucial to the formation and sustainability of the Silk Road network. Preserving connections between historical sites is not only essential for individual site protection but also for maintaining the coherence of the entire network. This helps in comprehensively understanding the cultural and historical significance of the heritage. To enhance protection, establishing buffer zones around high-density clusters may be necessary. These zones act as safeguards, preventing modern developments from disrupting the historical context and spatial relationships critical to the evolution of these heritage landscapes.
- Foster Transnational Collaboration: Beyond these protective measures, strategies to maintain and strengthen linkages between heritage sites are crucial. Notably, transnational linkages, such as the bid for the Routes Network of the Chang’an–Tianshan Corridor, highlight the importance of multinational cultural heritage and cooperation [79]. Preserving historic routes and preventing modern infrastructure from disrupting these connections is vital to maintaining the Silk Road network’s historical and cultural integrity. Such strategies are integral to a holistic approach to heritage conservation, ensuring that both the tangible and intangible aspects of the Silk Road’s cultural heritage are preserved for future generations.
5. Conclusions
Author Contributions
Funding
Data Availability Statement
Acknowledgments
Conflicts of Interest
Appendix A
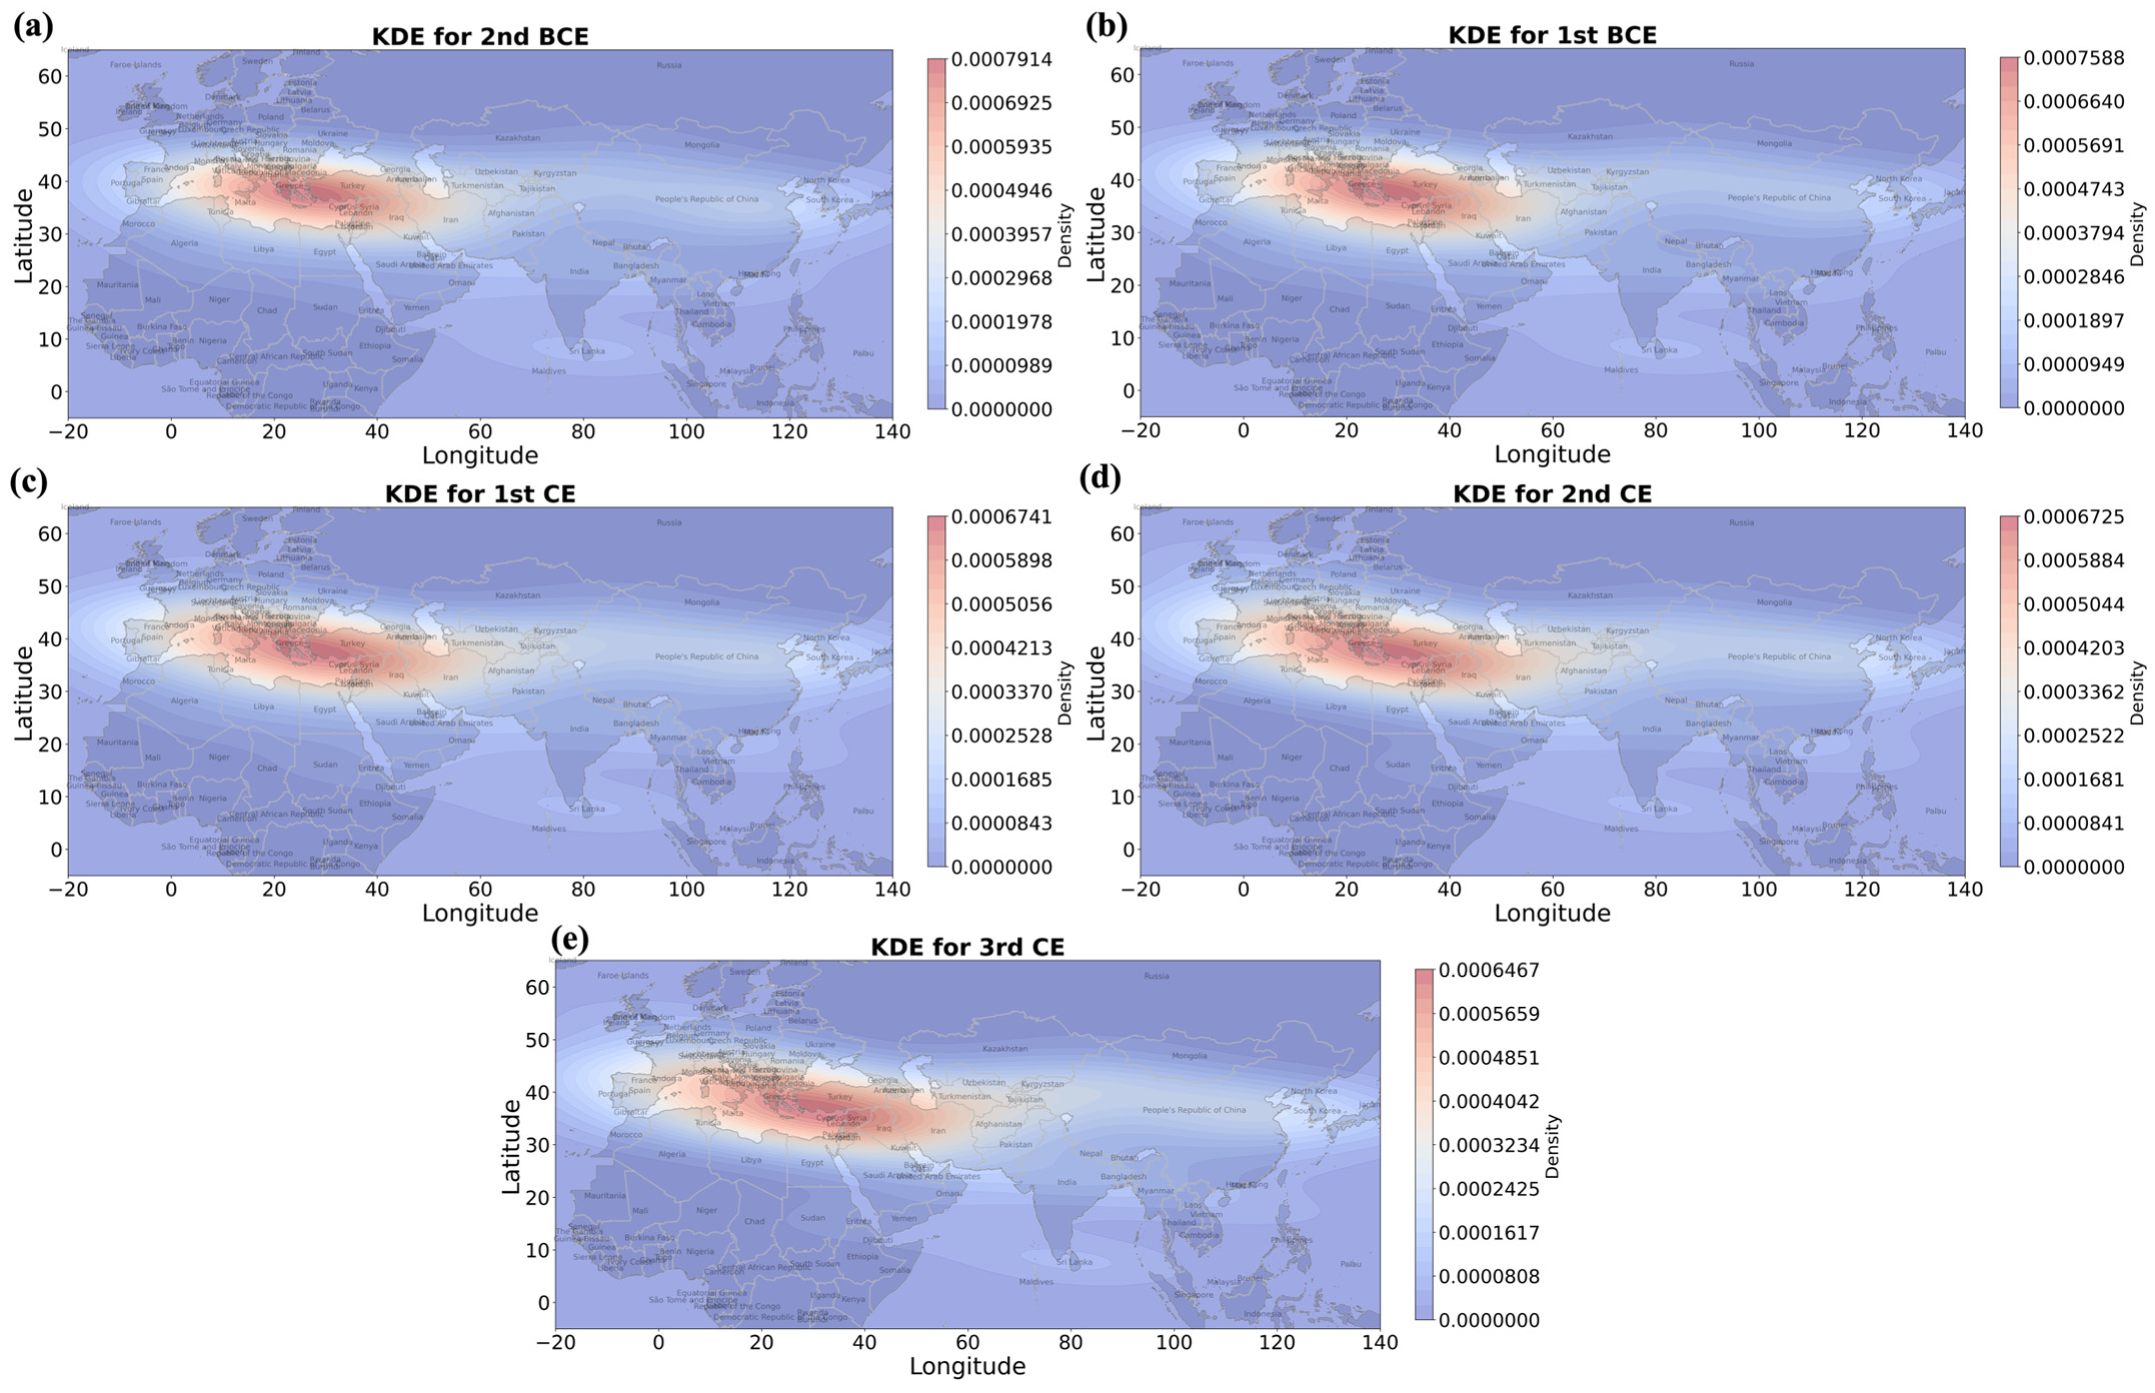
- 2nd Century B.C.E. to 3rd Century
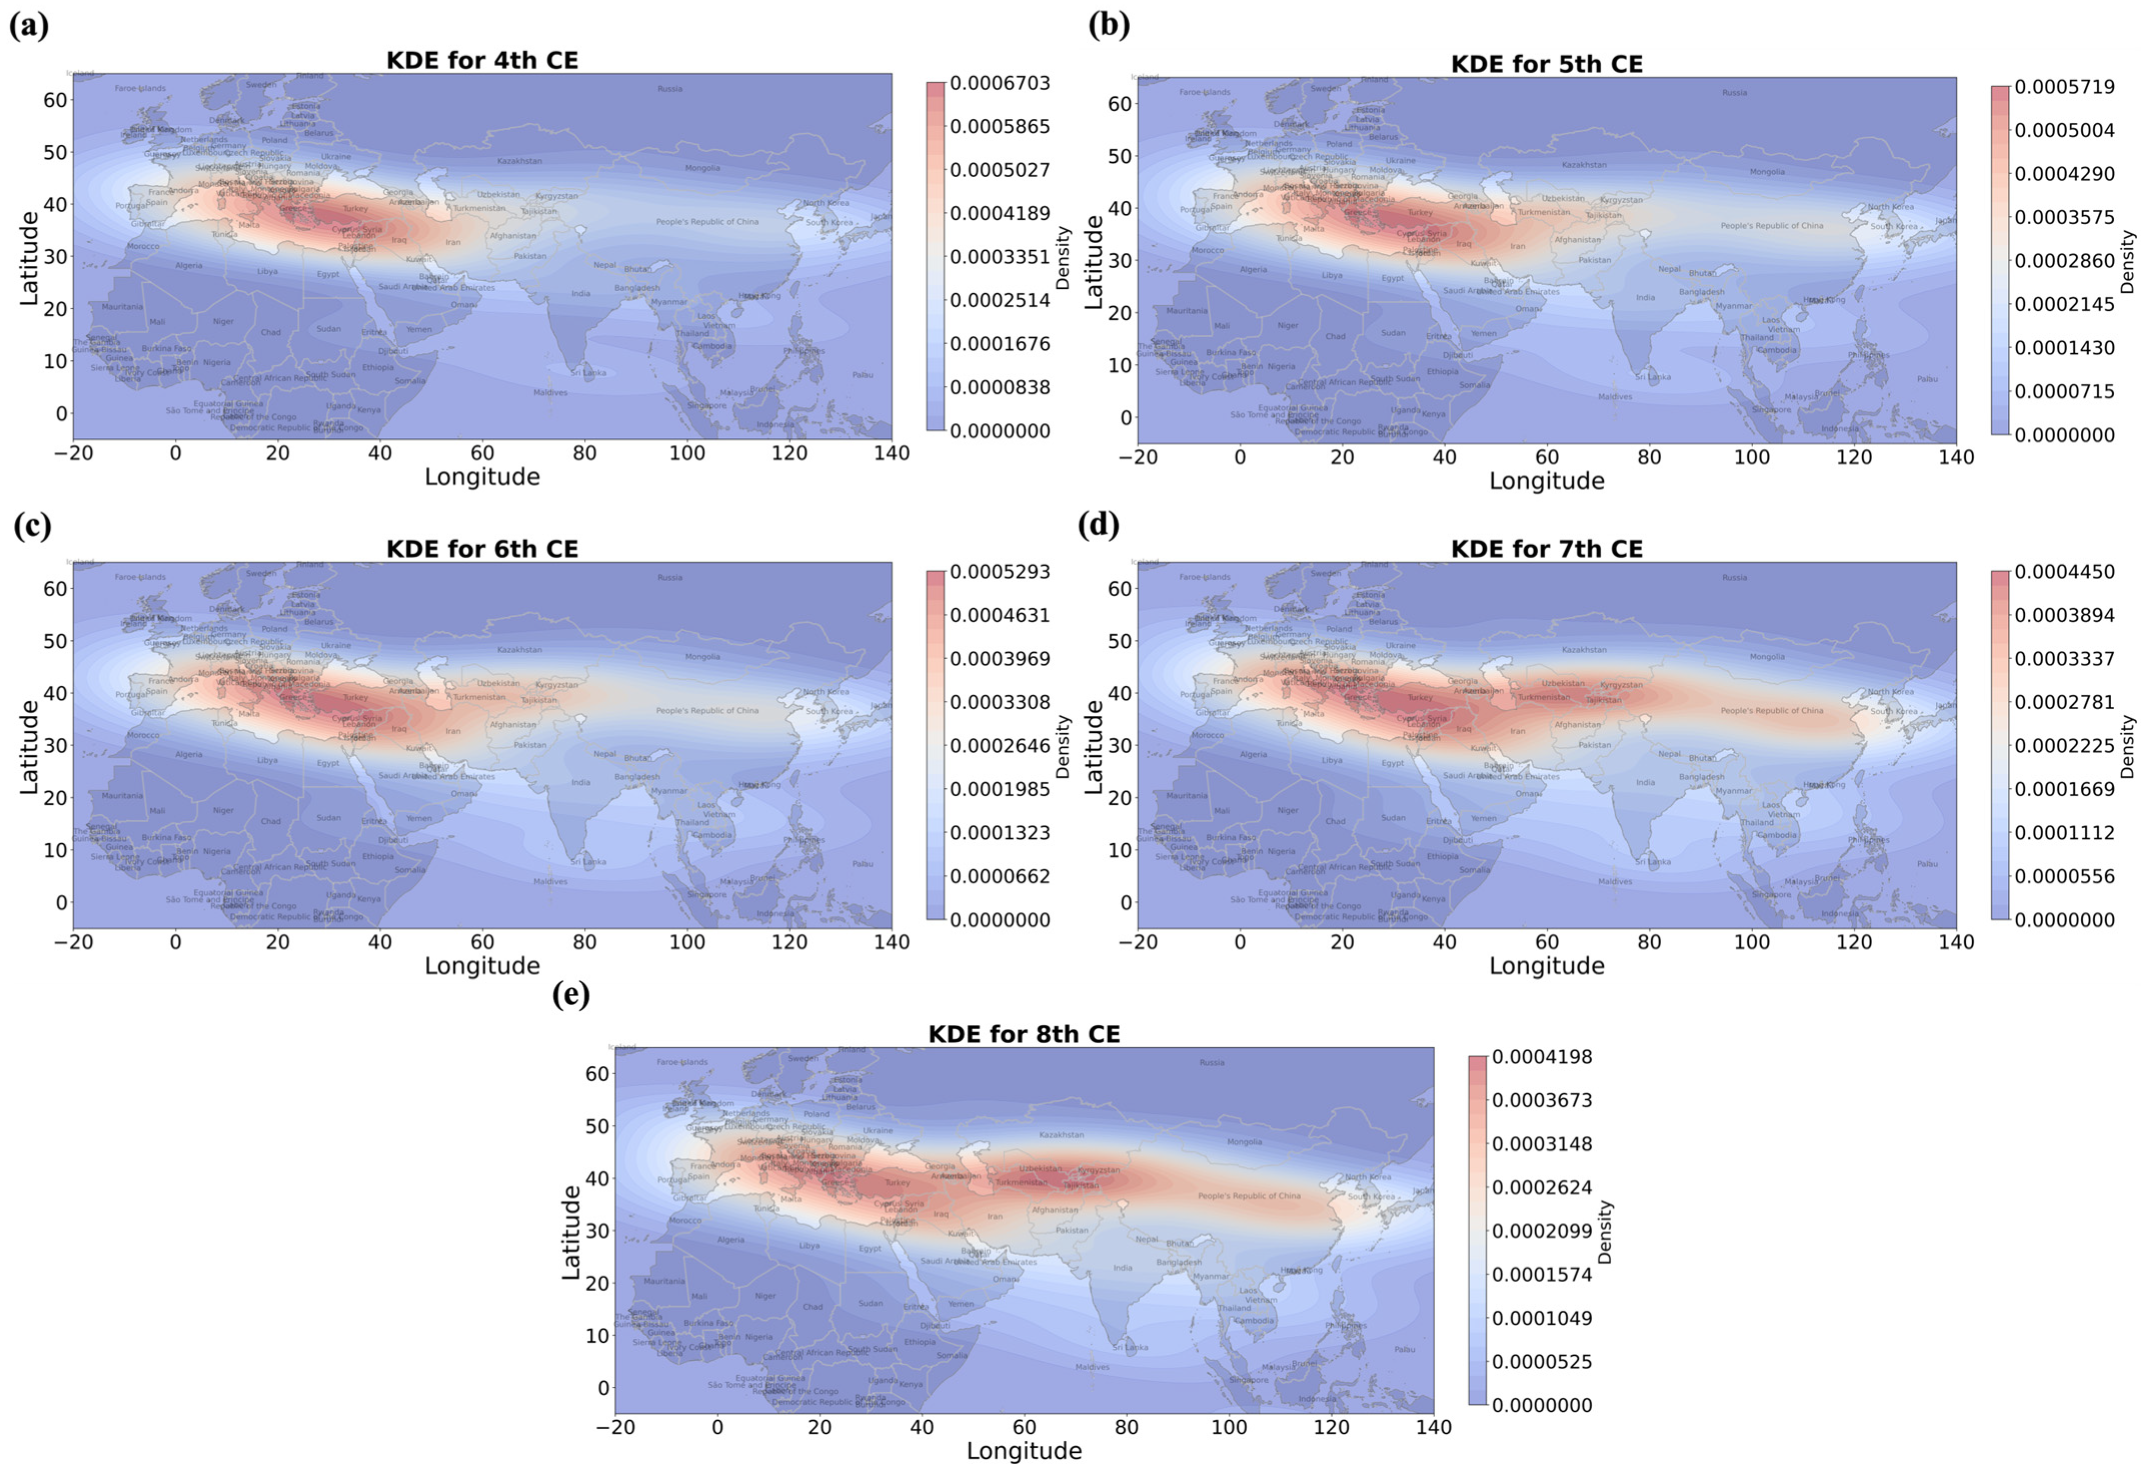
- 4th to 8th Century
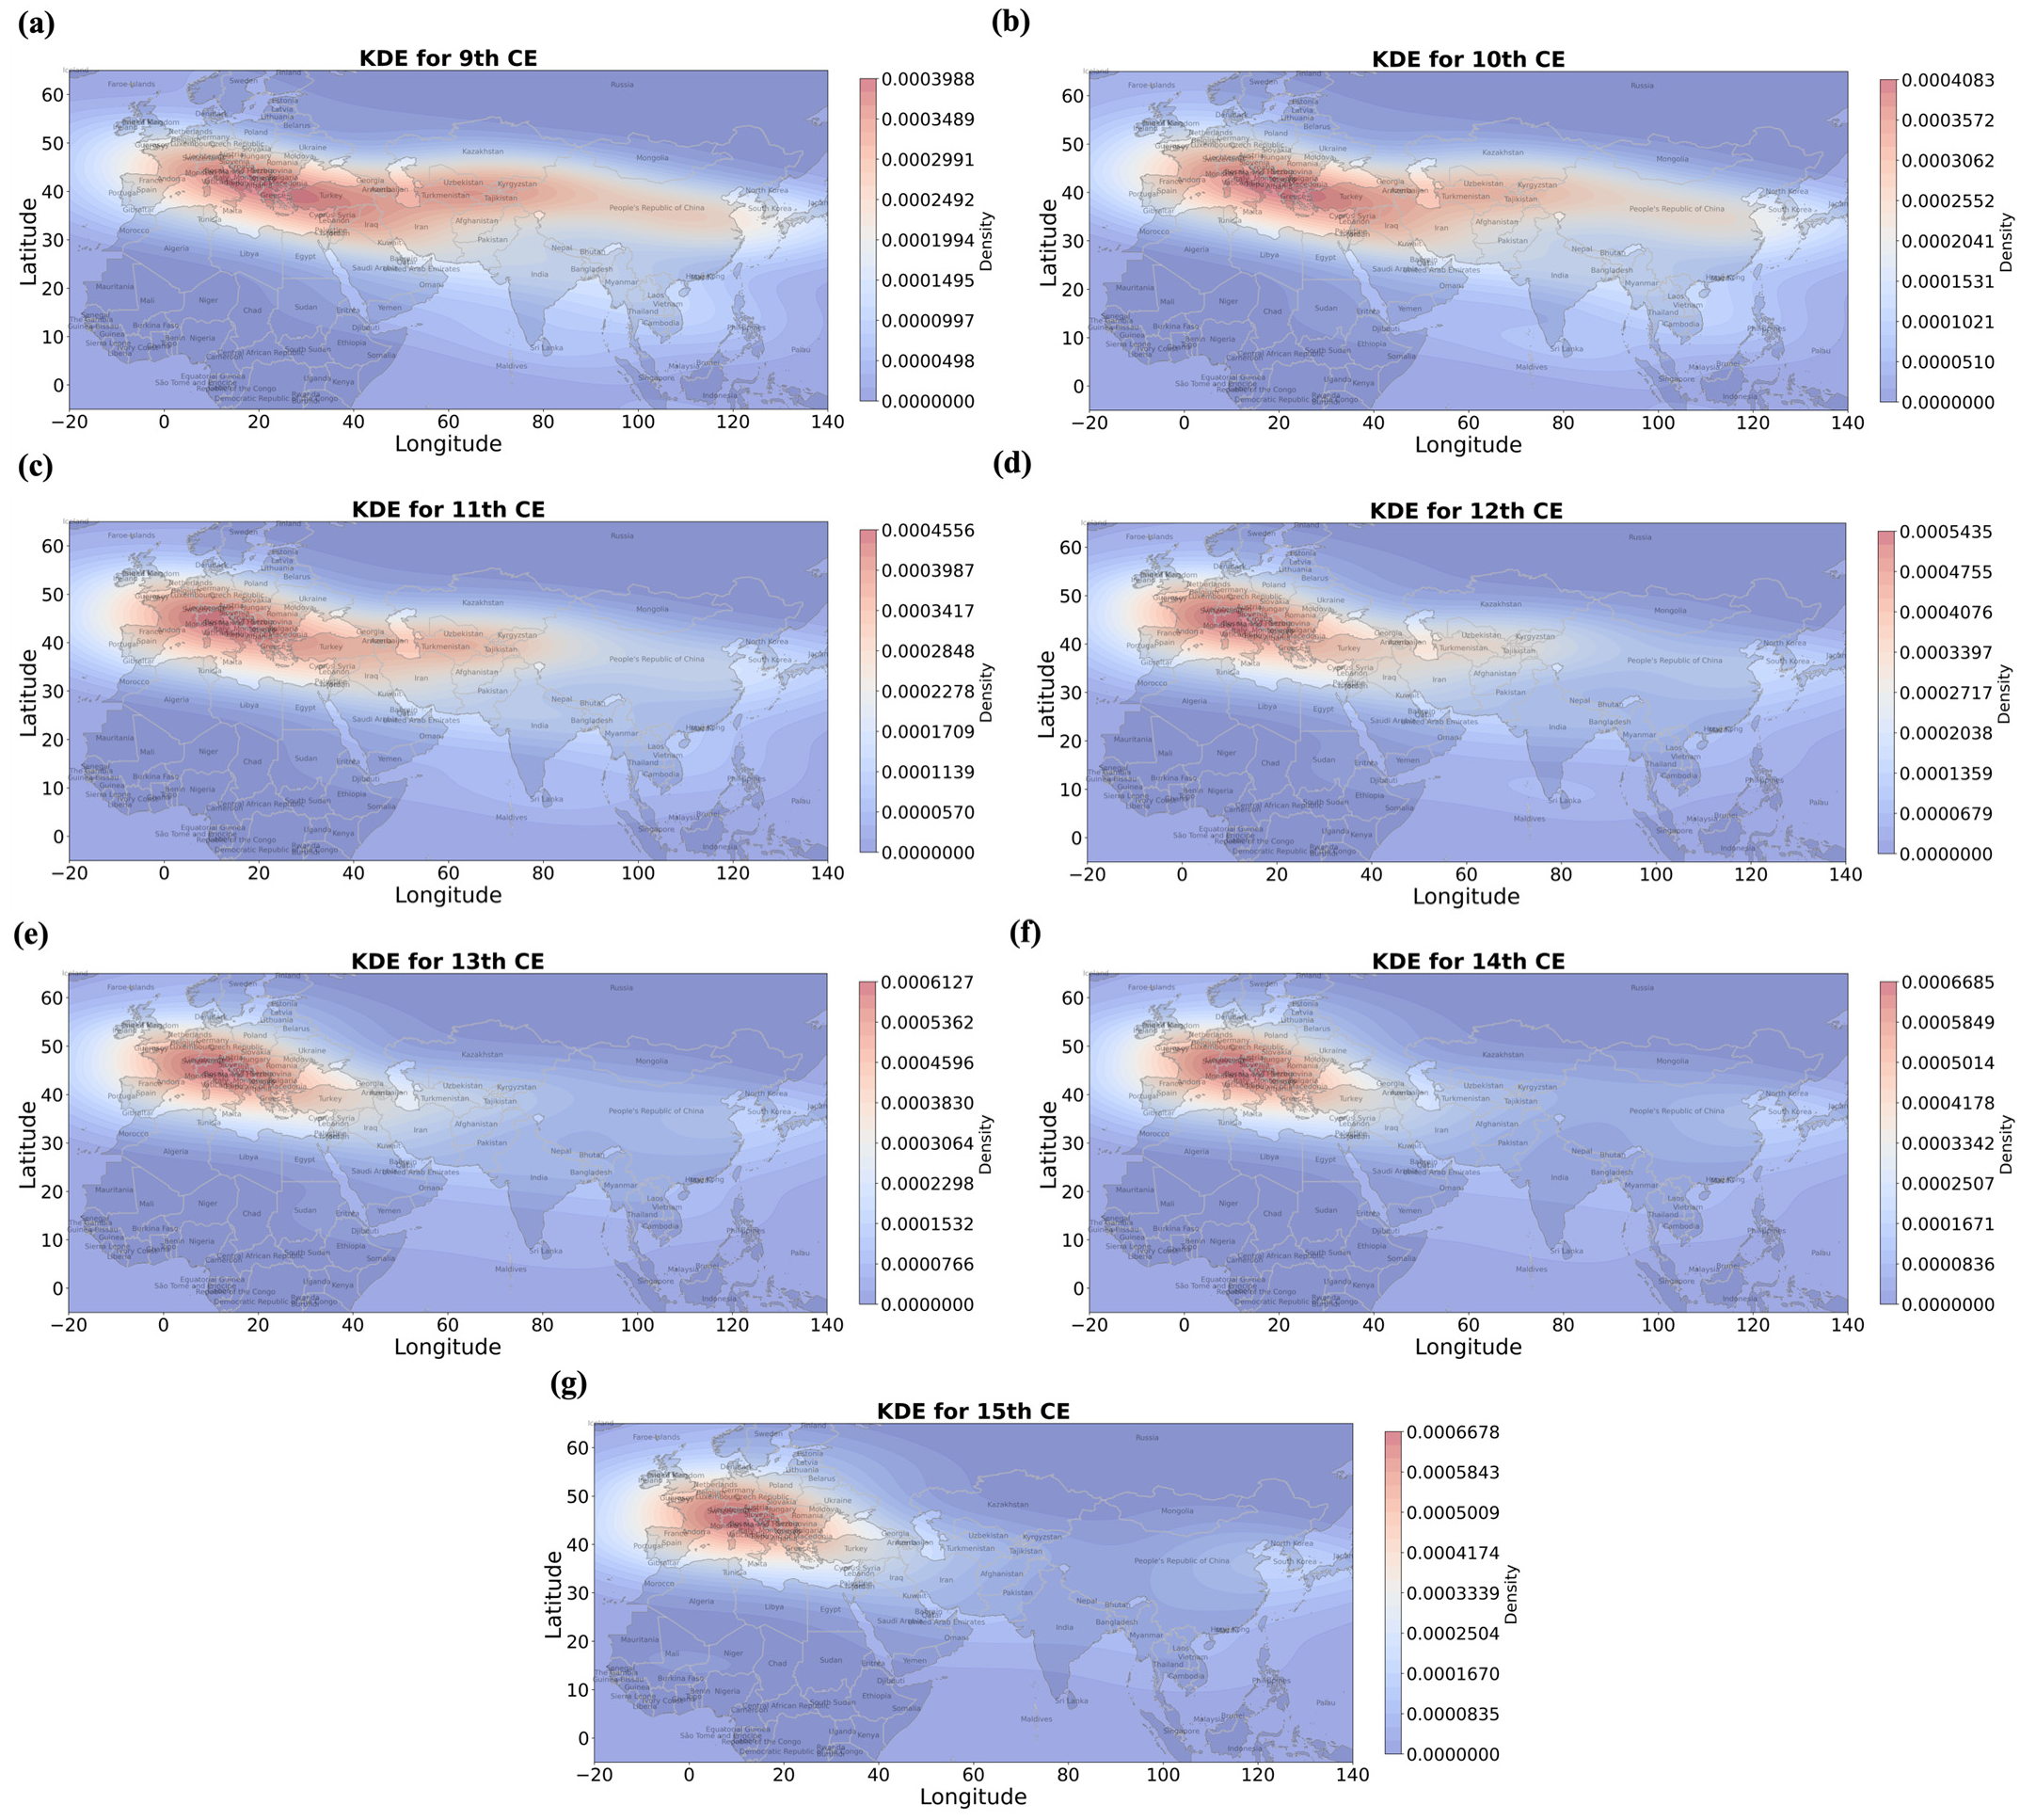
- 9th to 15th Century
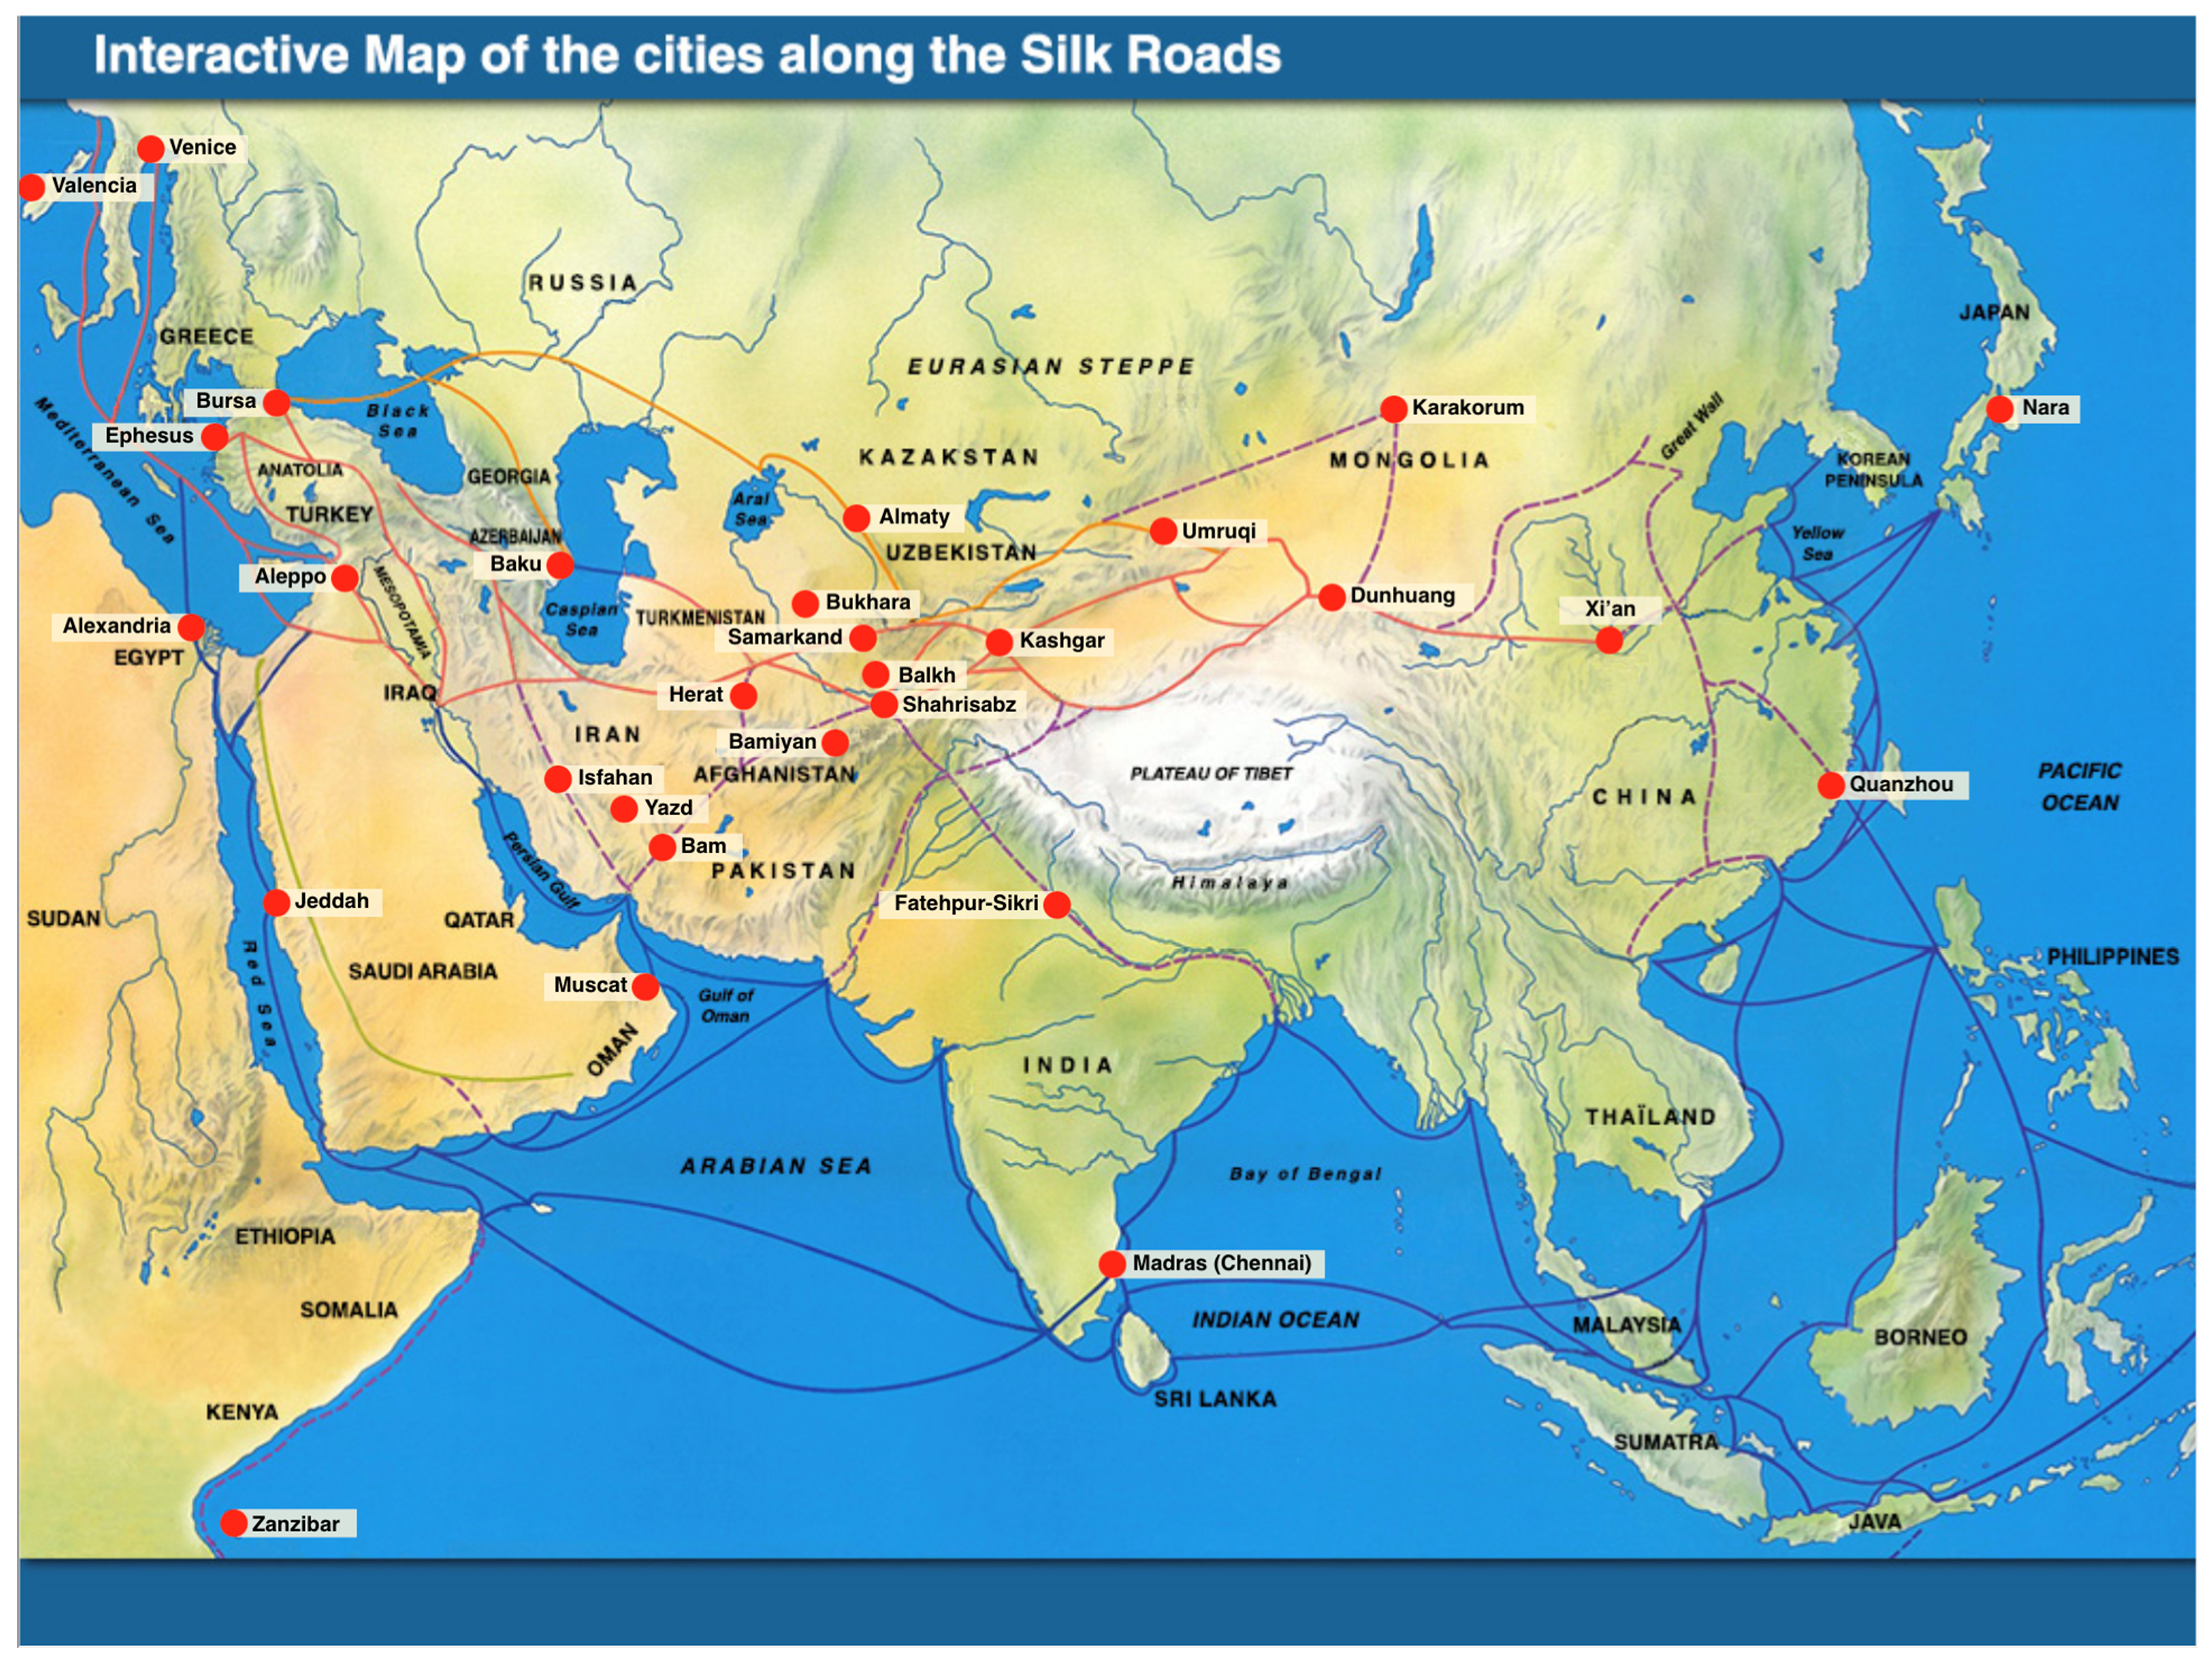
Appendix B. A Summary Presentation of the Major Cities in Figure 3
| City | Latitude | Longitude |
| Karakorum | 47.1922 | 102.8193 |
| Nara | 34.5666 | 135.7666 |
| Quanzhou | 24.9139 | 118.5858 |
| Xi’an | 34.2666 | 108.9333 |
| Dunhuang | 40.0999 | 94.6499 |
| Urumqi | 43.8009 | 87.6004 |
| Madras (Chennai) | 13.0878 | 80.2784 |
| Fatehpur-Sikri | 27.0937 | 77.66 |
| Kashgar | 39.4707 | 75.9895 |
| Almaty | 43.2566 | 76.9286 |
| Samarkand | 39.6542 | 66.9597 |
| Balkh | 36.7564 | 66.8972 |
| Shahrisabz | 39.0537 | 66.8201 |
| Bamiyan | 34.8216 | 67.8273 |
| Herat | 34.3481 | 62.1996 |
| Bam | 29.106 | 58.357 |
| Yazd | 31.8972 | 54.3675 |
| Isfahan | 32.6524 | 51.6746 |
| Baku | 40.3776 | 49.892 |
| Muskat | 23.6138 | 58.5922 |
| Aleppo | 36.2166 | 37.1666 |
| Jeddah | 21.5423 | 39.1979 |
| Zanzibar | −6.1333 | 39.3167 |
| Alexandria | 31.2156 | 29.9553 |
| Ephesus | 37.9372 | 27.3378 |
| Bursa | 40.1955 | 29.0601 |
| Venice | 45.4371 | 12.3326 |
| Valencia | 39.4698 | −0.3374 |
References
- Mertens, M. Did Richthofen Really Coin “the Silk Road”. Silk Road 2019, 17, 1–9. [Google Scholar]
- Herrmann, A. Die Alten Seidenstrassen Zwischen China Und Syrien: Beiträge Zur Alten Geographie Asiens; Weidmann: Vienna, Austria, 1910; Volume 1. [Google Scholar]
- Hedin, S. The Silk Road: Ten Thousand Miles through Central Asia; Bloomsbury: New York, NY, USA, 2009; ISBN 978-1-84511-898-3. [Google Scholar]
- Boulnois, L. Loveday, H., Translator; Silk Road: Monks, Warriors & Merchants on The Silk Road; Odyssey Books & Guides: Hongkong, China, 2005. [Google Scholar]
- Wood, F. The Silk Road: Two Thousand Years in the Heart of Asia; Univ of California Press: Berkeley, CA, USA, 2002. [Google Scholar]
- Waugh, D.C. Richthofen’s ‘Silk Roads’: Toward the Archaeology of a Concept. Silk Road 2007, 5, 1–10. [Google Scholar]
- Hansen, V. The Silk Road. A New Histor; Oxford University Press: New York, NY, USA, 2012. [Google Scholar]
- Chin, T. The Invention of the Silk Road, 1877. Crit. Inq. 2013, 40, 194–219. [Google Scholar] [CrossRef]
- Hoshmand, A.R. Eurasian Connection via the Silk Road: The Spread of Islam. In Silk Road to Belt Road; Islam, M.N., Ed.; Springer Nature: Singapore, 2019; pp. 95–104. ISBN 9789811329975. [Google Scholar]
- Khan, K.A.; Doszhanova, A.I. Religion and the Great Silk Road: Means of Communication, Contours of Interaction, Trade; Academic Council: Cambridge, MA, USA, 2022; pp. 231–238. [Google Scholar] [CrossRef]
- Hansen, V. The Classical Silk Road: Trade and Connectivity across Central Asia, 100 BCE–1200 CE. In Oxford Research Encyclopedia of Asian History; Oxford University Press: Oxford, UK, 2021; ISBN 978-0-19-027772-7. [Google Scholar]
- Høisæter, T.L. Polities and Nomads: The Emergence of the Silk Road Exchange in the Tarim Basin Region during Late Prehistory (2000–400 BCE). Bull. Sch. Orient. Afr. Stud. 2017, 80, 339–363. [Google Scholar] [CrossRef]
- Andrea, A.J. The Silk Road in World History: A Review Essay. Asian Rev. World Hist. 2014, 2, 105–127. [Google Scholar] [CrossRef]
- Xin, N.; Liao, J. History of the Silk Road. Chronos 2018, 36, 167–195. [Google Scholar] [CrossRef]
- Eğrï, S. The Silk Road Impressions in Hitây Sefâretnâmesi and Kanunnâme-i China u Hitây. J. Turk. Stud. 2012, 7, 411–422. [Google Scholar] [CrossRef]
- Whitfield, S. Life along the Silk Road; University of California Press: Berkeley, CA, USA, 1999. [Google Scholar]
- Tosheva, D. Qarakhanid Roads to China: A History of Sino-Turkic Relations: By Dilnoza Duturaeva, Leiden, Brill, 2022, 278 pp, US$119.00 (Hbk), ISBN: 978-90-04-50852-1. Cent. Asian Surv. 2023, 42, 211–213. [Google Scholar] [CrossRef]
- UNESCO. World Heritage Global Strategy. Available online: https://whc.unesco.org/en/globalstrategy/ (accessed on 28 July 2024).
- Williams, T. Final Technical Report on the Results of the UNESCO/Japanese Funds-in-Trust Project: Support for Silk Roads World Heritage Sites in Central Asia (Phase II), April 2015—November 2019; Williams, T., Lin Chih-Hung, R., Jorayev, G., Eds.; UCL Institute of Archaeology: London, UK, 2020. [Google Scholar]
- Vileikis, O. Monitoring Serial Transnational World Heritage—The Central Asian Silk Roads Experience. Hist. Environ. Policy Pract. 2016, 7, 260–273. [Google Scholar] [CrossRef]
- Williams, T. Final Technical Report on the Results of the UNESCO/Korean Funds-in-Trust Project: Support for the Preparation for the World Heritage Serial Nomination of the Silk Roads in South Asia, 2013–2016; UCL Institute of Archaeology: London, UK, 2016. [Google Scholar]
- Zhan, G. Nomination of the Silk Road to the World Heritage List. Hist. Environ. 2014, 26, 88–100. [Google Scholar]
- Vileikis, O.; Dumont, B.; Serruys, E.; Van Balen, K.; Tigny, V.; De Maeyer, P. Connecting world heritage nominations and monitoring with the support of the silk roads cultural heritage resource information system. ISPRS Ann. Photogramm. Remote Sens. Spatial Inf. Sci. 2013, II-5/W1, 319–324. [Google Scholar] [CrossRef]
- Sima, Q. Records of the Grand Historian of China; Columbia University Press: New York, NY, USA, 1971; Volume 2, ISBN 978-0-231-08167-2. [Google Scholar]
- Peck, D.T. The Empirical Reconstruction of Columbus’ Navigational Log and Track of His 1492–1493 Discovery Voyage. J. Navig. 2011, 64, 193–205. [Google Scholar] [CrossRef]
- Byars, J. The Venetian Discovery of America: Geographic Imagination and Print Culture in the Age of Encounters. J. Early Mod. Hist. 2020, 24, 571–572. [Google Scholar] [CrossRef]
- Wilson, G. Multifunctional “quality” and Rural Community Resilience. Trans. Inst. Br. Geogr. 2010, 35, 364–381. [Google Scholar] [CrossRef]
- Thacher, D.; Milne, S.; Park, R. Applying GIS and Statistical Analysis to Assess the Correlation of Human Behaviour and Ephemeral Architectural Features among Palaeo-Eskimo Sites on Southern Baffin Island, Nunavut. J. Archaeol. Sci. Rep. 2017, 14, 21–30. [Google Scholar] [CrossRef]
- Lang, G.; Marcon, E. Testing Randomness of Spatial Point Patterns with the Ripley Statistic. Esaim Probab. Stat. 2010, 17, 767–788. [Google Scholar] [CrossRef]
- Haase, P. Spatial Pattern Analysis in Ecology Based on Ripley’s K-Function: Introduction and Methods of Edge Correction. J. Veg. Sci. 1995, 6, 575–582. [Google Scholar] [CrossRef]
- Díaz-Rodríguez, M.; Fábregas-Valcarce, R. Evaluating the Effectiveness of Three Spatial Cluster Analysis Methods on Palaeolithic Site Location Distributions in Galicia, NW Iberian Peninsula. J. Archaeol. Sci. Rep. 2022, 41, 103323. [Google Scholar] [CrossRef]
- UNESCO. Silkroad Interactive Map. Available online: https://en.unesco.org/silkroad/silkroad-interactive-map (accessed on 26 July 2024).
- Spengler, R.N.; Maksudov, F.; Bullion, E.; Merkle, A.; Hermes, T.; Frachetti, M. Arboreal Crops on the Medieval Silk Road: Archaeobotanical Studies at Tashbulak. PLoS ONE 2018, 13, e0201409. [Google Scholar] [CrossRef]
- Daryaee, T. The Persian Gulf in Late Antiquity. J. World Hist. 2003, 14, 1–16. [Google Scholar] [CrossRef]
- Golden, P. Central Asia in World History; Oxford University Press: Oxford, UK, 2011. [Google Scholar] [CrossRef]
- Chen, F.; Chen, J.; Dong, G.; Huang, W.; Hou, J.; Wang, T. Climate Change and Silk Road Civilization in the Arid Central Asia. 2020. Available online: https://meetingorganizer.copernicus.org/EGU2020/EGU2020-7335.html (accessed on 28 July 2024).
- Hao, Z.; Zheng, J.; Yu, Y.; Xiong, D.; Liu, Y.; Ge, Q. Climatic Changes during the Past Two Millennia along the Ancient Silk Road. Prog. Phys. Geogr. Earth Environ. 2020, 44, 605–623. [Google Scholar] [CrossRef]
- Babajanyan, A.; Franklin, K. Everyday Life on the Medieval Silk Road: VDSRS Excavations at Arpa, Armenia. Aram. Armen. J. Near East. Stud. 2018, 12, 155–184. [Google Scholar] [CrossRef]
- Tan, L.; Dong, G.; An, Z.; Lawrence Edwards, R.; Li, H.; Li, D.; Spengler, R.; Cai, Y.; Cheng, H.; Lan, J.; et al. Megadrought and Cultural Exchange along the Proto-Silk Road. Sci. Bull. 2021, 66, 603–611. [Google Scholar] [CrossRef]
- Yao, Y.-F.; Wang, X.; Guo, W.; Jiang, H.-E.; Li, M.; Ferguson, D.K.; Wang, Y.-F.; Li, C.-S. Archaeobotanical Evidence Reveals the Human–Environment Interactions during the 9th–13th Centuries at Turpan, Xinjiang on the Ancient Silk Road. Vege. Hist. Archaeobot. 2020, 29, 539–552. [Google Scholar] [CrossRef]
- Nunn, N.; Qian, N. The Columbian Exchange: A History of Disease, Food, and Ideas. J. Econ. Perspect. 2010, 24, 163–188. [Google Scholar] [CrossRef]
- Knutson, S.A. Archaeology and the Silk Road Model. World Archaeol. 2020, 52, 619–638. [Google Scholar] [CrossRef]
- Meng, X.; Wu, J.; Zhu, Q.; Hu, S.; Zhu, L. Analytical Method to Determine the Environmental Impact on the Stability Safety of a Bulk Carrier Navigating in the Maritime Silk Road. J. Tsinghua Univ. (Sci. Technol.) 2024, 64, 1060–1069. [Google Scholar] [CrossRef]
- Gu, H. Frustrated Relations?: China with Central and Eastern Europe; Contributions to International Relations; Springer Nature: Singapore, 2023; ISBN 978-981-9937-29-5. [Google Scholar]
- Brunn, S.D. Geography of Time, Place, Movement and Networks, Volume 3: Mapping Time Journeys in Music, Art and Spirituality; Springer Nature: Singapore, 2024; ISBN 978-3-031-58033-8. [Google Scholar]
- Agnew, N. Conservation of Ancient Sites on the Silk Road: Proceedings of an International Conference on the Conservation of Grotto Sites; Getty Conservation Institute: Los Angeles, CA, USA, 1997. [Google Scholar]
- Yao, Y.; Wang, X.; Lu, L.; Liu, C.; Wu, Q.; Ren, H.; Yang, S.; Sun, R.; Luo, L.; Wu, K. Proportionated Distributions in Spatiotemporal Structure of the World Cultural Heritage Sites: Analysis and Countermeasures. Sustainability 2021, 13, 2148. [Google Scholar] [CrossRef]
- Che, P.; Lan, J. Climate Change along the Silk Road and Its Influence on Scythian Cultural Expansion and Rise of the Mongol Empire. Sustainability 2021, 13, 2530. [Google Scholar] [CrossRef]
- Skaff, J.K. The Sogdian Trade Diaspora in East Turkestan during the Seventh and Eighth Centuries. J. Econ. Soc. Hist. Orient 2003, 46, 475–524. [Google Scholar] [CrossRef]
- Peng, Q.; Moradi, H. Studies on the History and Culture along the Continental Silk Road. Eurasian Geogr. Econ. 2024, 203, 1–3. [Google Scholar] [CrossRef]
- Hill, D.J. Climate Change and the Rise of the Central Asian Silk Roads. In Socio-Environmental Dynamics along the Historical Silk Road; Yang, L., Bork, H.R., Fang, X., Mischke, S., Eds.; Springer: Cham, Switzerland, 2019; pp. 247–259. [Google Scholar] [CrossRef]
- Ge, Q.; Hua, Z.; Zheng, J.; Fang, X.; Xiao, L.; Liu, J.; Yang, B. Forcing and impacts of warm periods in the past 2000 years. Chin. Sci. Bull. 2015, 60, 1728–1735. [Google Scholar] [CrossRef]
- Giannakopoulos, C.; Sager, P.; Bindi, M.; Moriondo, M.; Kostopoulou, E.; Goodess, C. Climatic Changes and Associated Impacts in the Mediterranean Resulting from a 2 °C Global Warming. Glob. Planet. Chang. 2009, 68, 209–224. [Google Scholar] [CrossRef]
- Maracchi, G.; Sirotenko, O.; Bindi, M. Impacts of Present and Future Climate Variability on Agriculture and Forestry in the Temperate Regions: Europe. Clim. Chang. 2005, 70, 117–135. [Google Scholar] [CrossRef]
- Erdkamp, P. War, Food, Climate Change, and the Decline of the Roman Empire. J. Late Antiq. 2019, 12, 422–465. [Google Scholar] [CrossRef]
- Zhang, H.; Werner, J.; García-Bustamante, E.; González-Rouco, F.; Wagner, S.; Zorita, E.; Fraedrich, K.; Jungclaus, J.; Ljungqvist, F.; Zhu, X.; et al. East Asian Warm Season Temperature Variations over the Past Two Millennia. Sci. Rep. 2018, 8, 7702. [Google Scholar] [CrossRef]
- Wang, L.; Chen, W.; Huang, G.; Zeng, G. Changes of the Transitional Climate Zone in East Asia: Past and Future. Clim. Dyn. 2017, 49, 1463–1477. [Google Scholar] [CrossRef]
- He, S.; Gao, Y.; Li, F.; Wang, H.; He, Y. Impact of Arctic Oscillation on the East Asian Climate: A Review. Earth-Sci. Rev. 2017, 164, 48–62. [Google Scholar] [CrossRef]
- Trouet, V.; Esper, J.; Graham, N.; Baker, A.; Scourse, J.; Frank, D. Persistent Positive North Atlantic Oscillation Mode Dominated the Medieval Climate Anomaly. Science 2009, 324, 78–80. [Google Scholar] [CrossRef]
- Gronenborn, D.; Strien, H.-C.; Dietrich, S.; Sirocko, F. ‘Adaptive Cycles’ and Climate Fluctuations: A Case Study from Linear Pottery Culture in Western Central Europe. J. Archaeol. Sci. 2014, 51, 73–83. [Google Scholar] [CrossRef]
- Zhang, S.; Liu, H.; Li, G.; Zhang, Z.; Chen, X.; Shi, Z.; Zhou, A.; Dong, G. Warfare Impact Overtakes Climate-Controlled Fires in the Eastern Silk Roads since 2000 B.P. Proc. Natl. Acad. Sci. USA 2023, 2, pgad408. [Google Scholar] [CrossRef]
- Yu, J.; Safarov, B.; Yi, L.; Buzrukova, M.; Janzakov, B. The Adaptive Evolution of Cultural Ecosystems along the Silk Road and Cultural Tourism Heritage: A Case Study of 22 Cultural Sites on the Chinese Section of the Silk Road World Heritage. Sustainability 2023, 15, 2465. [Google Scholar] [CrossRef]
- Zandi, S. Revival of the Silk Road Using the Applications of AR/VR and Its Role on Cultural Tourism. arXiv 2023, arXiv:bs/2304.10545. [Google Scholar] [CrossRef]
- Allaberganov, A.; Catterall, P. Using Social Exchange Theory to Examine Residents’ Responses to Heritage Tourism: Case Studies of Samarqand and Bukhara in Uzbekistan. J. Herit. Tour. 2023, 18, 846–863. [Google Scholar] [CrossRef]
- Ban, G. The Book of Han-Biography of Zhang Qian; Zhonghua Book Company: Beijing, China, 2012. [Google Scholar]
- Scullard, H.H. A History of the Roman World: 753 to 146 B, 4th ed.; Routledge Classics; Routledge: Abingdon, UK; Oxon, UK; New York, NY, USA, 2013; ISBN 978-0-415-52227-4. [Google Scholar]
- Caesar, J.; Handford, S.A.; Stanley, A.; Gardner, J.F. The Conquest of Gaul; Penguin Books: London, UK; New York, NY, USA, 1982; ISBN 978-0-14-044433-9. [Google Scholar]
- Gibbon, E.; Milman, H.H. The Decline and Fall of the Roman Empire; Modern Library: New York, NY, USA, 2003; Volume 3. [Google Scholar]
- Fisher, W.B. (Ed.) The Cambridge History of Iran: Volume 1: The Land of Iran; The Cambridge History of Iran; Cambridge University Press: Cambridge, UK, 1968; Volume 1, ISBN 978-0-521-06935-9. [Google Scholar]
- Boyle, J.A. (Ed.) The Cambridge History of Iran: Volume 5: The Saljuq and Mongol Periods; The Cambridge History of Iran; Cambridge University Press: Cambridge, UK, 1968; Volume 5, ISBN 978-0-521-06936-6. [Google Scholar]
- UNESCO. History of Civilizations of Central Asia; UNESCO Publications: Paris, France, 1992. [Google Scholar]
- Jackson, P.; Lockhart, L. (Eds.) The Cambridge History of Iran: Volume 6: The Timurid and Safavid Periods; The Cambridge History of Iran; Cambridge University Press: Cambridge, UK, 1986; Volume 6, ISBN 978-0-521-20094-3. [Google Scholar]
- Ouyang, X. New Book of Tang; Song, Q., Ed.; Zhonghua Book Company: Beijing, China, 1997. [Google Scholar]
- Saunders, J.J. The History of the Mongol Conquests; University of Pennsylvania Press: Philadelphia, PA, USA, 2001. [Google Scholar]
- Song, L. History of the Yuan Dynasty; National Library Press: Beijing, China, 2014. [Google Scholar]
- Frith, J. The History of Plague-Part 1: The Three Great Pandemics. J. Mil. Veterans Health 2012, 20, 11–16. [Google Scholar]
- Burckhardt, J. The Civilization of the Renaissance in Italy; Penguin classics; Penguin Books: London, UK ; New York, NY, USA, 1928; ISBN 978-0-14-044534-3. [Google Scholar]
- Li, L.; Shao, M.; Wang, S.; Li, Z. Preservation of Earthen Heritage Sites on the Silk Road, Northwest China from the Impact of the Environment. Environ. Earth Sci. 2011, 64, 1625–1639. [Google Scholar] [CrossRef]
- Sciorati, G. ‘Constructing’ Heritage Diplomacy in Central Asia: China’s Sinocentric Historicisation of Transnational World Heritage Sites. Int. J. Cult. Policy 2022, 29, 94–112. [Google Scholar] [CrossRef]
- Si Ma, Q. Shi Ji; Zhong Hua Shu Ju: Beiing, China, 2004; ISBN 978-7-101-00304-8. [Google Scholar]
- Beckwith, C.I. Empires of the Silk Road: A History of Central Eurasia from the Bronze Age to the Present. In Empires of the Silk Road; Princeton University Press: Princeton, NJ, USA, 2009. [Google Scholar]
- Fan, Y. Book of the Later Han; Zhonghua Book Company: Beijing, China, 2012. [Google Scholar]
- Brown, P. The World of Late Antiquity: AD 150-750; Thames and Hudson: London, UK, 2024. [Google Scholar]
- Wei, S. Book of Wei; Zhonghua Book Company: Beijing, China, 2017. [Google Scholar]
- Liu, X. Old Book of Tang; Zhonghua Book Company: Beijing, China, 1997. [Google Scholar]
- Dignas, B.; Winter, E. Rome and Persia in Late Antiquity: Neighbours and Rivals; Cambridge University Press: Cambridge, UK, 2007. [Google Scholar]
- Davis, J.R. Charlemagne’s Practice of Empire; Cambridge University Press: Cambridge, UK, 2015. [Google Scholar]
- Bentley, J.H.; Ziegler, H.F.; Streets-Salter, H. Traditions & Encounters: A Brief Global History; McGraw-Hill Education: New York, NY, USA, 2008. [Google Scholar]
- Stavrianos, L.S. A Global History: From Prehistory to the 21st Century; Prentice Hall: Upper Saddle River, NJ, USA, 1999. [Google Scholar]
- Bryce, J. The Holy Roman Empire; Macmillan and Co.: London, UK; New York, NY, USA, 1889; Available online: https://archive.org/details/cu31924019888258/page/n7/mode/2up (accessed on 29 July 2024).
- Riley Smith, J. The Oxford History of the Crusades; Oxford University Press: New York, NY, USA, 2002. [Google Scholar]


Disclaimer/Publisher’s Note: The statements, opinions and data contained in all publications are solely those of the individual author(s) and contributor(s) and not of MDPI and/or the editor(s). MDPI and/or the editor(s) disclaim responsibility for any injury to people or property resulting from any ideas, methods, instructions or products referred to in the content. |
© 2024 by the authors. Licensee MDPI, Basel, Switzerland. This article is an open access article distributed under the terms and conditions of the Creative Commons Attribution (CC BY) license (https://creativecommons.org/licenses/by/4.0/).
Share and Cite
Shen, Y.; Liu, J.; Han, J.; Wan, X. Reconstructing the Silk Road Network: Insights from Spatiotemporal Patterning of UNESCO World Heritage Sites. Land 2024, 13, 1401. https://doi.org/10.3390/land13091401
Shen Y, Liu J, Han J, Wan X. Reconstructing the Silk Road Network: Insights from Spatiotemporal Patterning of UNESCO World Heritage Sites. Land. 2024; 13(9):1401. https://doi.org/10.3390/land13091401
Chicago/Turabian StyleShen, Yingning, Junmin Liu, Jianan Han, and Xiang Wan. 2024. "Reconstructing the Silk Road Network: Insights from Spatiotemporal Patterning of UNESCO World Heritage Sites" Land 13, no. 9: 1401. https://doi.org/10.3390/land13091401