Article

Reconstructing the Silk Road Network: Insights from Spatiotemporal Patterning of UNESCO World Heritage Sites

1
School of Cultural Heritage, Northwest University, Xi’an 710127, China
2
Institute of Silk Road Studies, Northwest University, Xi’an 710127, China
3
Collaborative Research Centre for Archaeology of the Silk Roads, Northwest University, Xi’an 710127, China
*
Author to whom correspondence should be addressed.
These authors contributed equally to this work.
Land 2024, 13(9), 1401; https://doi.org/10.3390/land13091401
Submission received: 31 July 2024 / Revised: 18 August 2024 / Accepted: 27 August 2024 / Published: 30 August 2024

Abstract

:
Building on the observation of gaps in current research, this study provides a comprehensive analysis of the spatial patterns of heritage sites along the Silk Road, focusing on how historical trade routes shaped what are now recognized as heritage sites. Using data from the United Nations Educational, Scientific and Cultural Organization (UNESCO) World Heritage List, the research examines heritage sites across Eurasia and North Africa, with a specific emphasis on the Silk Road corridors. This study employs a spatiotemporal approach, categorizing sites into northern overland routes and southern maritime routes to highlight regional variations in network development. The key findings of this study reveal the significant influence of historical trade routes on the development of settlements, cities, and cultural landmarks along the Silk Road. These findings identify clear trends in the Silk Road network’s evolution over time, illustrating a shift in its spatial focus across different historical periods. Initially, the network was centered in the eastern Mediterranean during the Classical Period. In the medieval period, this focus expanded to include a dual core area in both the eastern Mediterranean and Central Asia. By the late Medieval period, the network had shifted again, with a new core emerging in Europe. This chronological and spatial analysis allows for a detailed examination of the Silk Road network’s heritage landscape evolution. The study underscores the interconnectedness of heritage sites across these regions, contributing to a deeper understanding of how landscape connectivity and trade network dynamics evolved over time. Furthermore, by identifying patterns of network development and shifts in centrality and density, this research offers valuable insights for the conservation and management of heritage landscapes. These findings are particularly crucial for preserving the historical and cultural integrity of Silk Road heritage sites.

1. Introduction

Systematic efforts are required for precise a definition and understanding of the vicissitudes of the Silk Road for researchers on this concept. The earliest definition of the Silk Road comes from the German geographer Ferdinand von Richthofen in 1877, although evidence shows that the concept was already emerging in the works of the German geographer Carl Ritter as early as 1838. It was first employed to refer to the ancient routes of transportation and trade between the three continents of the Eastern Hemisphere, particularly between Europe and Asia, and from the beginning, it included both the overland and maritime Silk Roads [1]. Richthofen’s description of the Silk Road marks the establishment of official interactions between China and the West in the 2nd century B.C.E., and his research made the concept widely known. Subsequent scholars further refined the description of the Silk Road, defining its eastern starting point in the middle and lower reaches of the Yellow River in China, while the western starting point extended from the eastern Mediterranean to Italy. They also proposed various perspectives on the trade patterns and historical significance of the Silk Road [2,3,4,5,6,7,8].
Based on the intuitive impressions formed by existing research on the Silk Road, the official description provided by the United Nations Educational, Scientific and Cultural Organization (UNESCO) offers a reference for the definition in this study. Here, the Silk Roads (sic) are described as “a diversity of routes and cargos” and “routes of dialogue”, acknowledging them as not only a trade network but also a network of culture, knowledge, and religion [9,10]. This provides a basis for defining the Silk Road beyond just trade. The Silk Road network (hereafter SRN) can be defined as the total network of routes connecting most cultural areas of the Old World, including the continents of Africa, Asia, and Europe. Precisely speaking, after the historically attested opening of the Silk Road by General Zhang Qian in the latter half of the 2nd century B.C.E., the SRN began to function as a system of contact, communication, and exchange across the three continents [11]. This network remained systematically integrated and consistent until Christopher Columbus’s first navigation to the Americas in 1492 [12]. Columbus’s navigation to the Americas initiated a new open system of contact among the five continents, and subsequent navigation of the Oceanic islands extended the reach of European culture into the Americas and Oceania. Since then, the route network has no longer been enclosed, thus incorporating a large portion of the global population and resources into the global route network (hereafter GRN) of communication and exchange. The marked difference in the range between the SRN and the GRN leads us to conclude that the study of the SRN as a synchronic system must end in the 15th century, as diachronically, this system evolved into a completely different GRN.
In fact, studies of the SRN based on documentary sources can be so precise that most of the connecting routes between major cities can be illustrated on maps. However, such studies face several issues. Firstly, the recorded distances in historical texts are not always accurate. The distance measurement units used by ancient civilizations often differ significantly from today’s precise units, and historical texts do not provide conversions between these ancient and modern units [13]. Furthermore, the locations mentioned in historical texts may differ from those of the same name today, due to differences in site selection [14]. Additionally, historical texts may mention many specific routes of interaction, but the extent to which these routes were used varies greatly [15]. Some routes were rarely used but received greater attention in SRN research due to their reference in texts [16]. In the absence of precise statistical data on ancient city populations and trade volumes, the weights of various routes and relevant nodes can only be estimated based on experience [17].
The challenges associated with documentary-based studies underscore the need for alternative methods to reflect the SRN more accurately. Recognizing the importance of comprehensive approaches to understanding the SRN, international organizations have taken significant steps to address these challenges. Recognizing the importance of diverse cultural exchanges along the Silk Roads, UNESCO in 1994 launched the “Global Strategy for a Representative, Balanced and Credible World Heritage List” [18]. This initiative aimed to ensure that the world’s cultural and natural diversity was fully represented. Central Asia, identified as one of the most under-represented regions, became a focal point for efforts to fill this gap in global heritage representation. UNESCO had earlier acknowledged the significance of the Silk Roads for intercultural exchange and the wealth of cultural heritage sites it encompassed. Consequently, UNESCO proposed a trans-national nomination project for the Silk Roads as part of their strategy, fostering international collaboration and addressing the lack of representation on the World Heritage List, such as the UNESCO/Japanese Funds-in-Trust project: Support for Silk Roads World Heritage Sites in Central Asia (Phase II) [19].
Given the existing issues in estimating the SRN based on documentary sources and these international efforts, a supplementary method is proposed: using the heritage site databases of the three continents to estimate and reconstruct SRN routes. The most concentrated and comprehensive information on World Heritage Sites (hereafter, WHSs) comes from the UNESCO’s World Heritage List. The downloadable WHS database provides the latitude and longitude information of heritage sites, and the UNESCO WHS List website provides detailed information on the establishment and abandonment dates of these sites [20,21,22]. By logging these heritage sites, this study has established a geographic information database reflecting the emergence, prosperity, and abandonment of heritage sites over different periods [23].
Using the geographic information database of heritage sites to reflect the evolution of the SRN is based on the following assumptions:
  • The SRN, the system of interactions among Eurasia and Africa, is an enclosed and stable system.
  • Heritage sites that once existed and prospered can reflect the prosperity of the aforementioned interaction system.
  • The network density between heritage sites reflects the network density of the SRN.
Using heritage sites to reflect the SRN offers greater precision compared to documentary sources, as the geographic locations of the archeological sites and cultural landscapes represented by these heritage sites are accurate and do not require textual verification. The distances between heritage sites are precise. The issues of distance, location, and unit conversion that reduce precision in the textual verification of documentary sources do not arise when using heritage sites to reflect the SRN. Due to the lack of exact route markings, only straight-line measurements can be calculated. Thus, this study adopts spatial clustering methods.
Based on this assumption, this study first introduces the research methods and then demonstrate how heritage sites reflect the SRN. The network relationships between heritage sites indicate the network density of the SRN. The resulting network will exhibit varying levels of route usage. In areas with high network density between heritage sites, the density will be significantly higher than in areas with low density, forming a heterogeneous network in terms of usage levels. This situation contrasts with the uniform recording of multiple routes based on textual verification of documentary sources. Both methods have distinct focuses: faithfully maintaining textual records maximizes the representation of all possible routes in the SRN. All possible routes are uniformly recorded based on historical records. Routes formed between heritage sites give higher weight to those with higher network density, accurately reflecting the weights of various network parts and nodes, though influenced by existing heritage site registrations. This study integrates both methods to construct an evolution map of the SRN based on documented routes and heritage site weights, offering a comprehensive research framework. Finally, the study analyzes and discusses related factors influencing the changes in the SRN. Based on these, the study provides recommendations for the future preservation of Silk Road cultural heritage.

2. Materials and Methods

This study analyses the distribution of the UNESCO World Heritage Site Database heritage sites along the SRN. As a foundational step, our methodological framework, depicted in Figure 1, outlines the comprehensive approach taken from data collection through to spatial analysis. More specific, to achieve the aim and objectives of this research, which involves using heritage site databases from three continents to estimate and reconstruct SRN routes, three primary analytical methods are employed: spatial distribution analysis, proximity analysis, and Kernel Density Estimation. Firstly, spatial distribution analysis integrates multiple methods to examine the geographical patterns and spatial structures of heritage sites along the Silk Road. Spatial cluster analysis is employed to detect clusters of heritage sites, revealing areas of significant cultural and economic activity. This analysis is complemented by the chi-square test, which assesses the distribution of heritage sites along the northern and southern routes of the SRN, identifying periods of significant transformation in regional connectivity and land use. Additionally, the study utilizes spatial autocorrelation functions (Ripley’s K, L, and G) to quantify the degree of clustering or dispersion within the distribution of heritage sites. Ripley’s K function is particularly useful for identifying the extent of clustering compared to a random distribution, while Ripley’s L and G functions offer more detailed insights into the spatial processes influencing site distribution. Secondly, proximity analysis, primarily through the nearest neighbor distance (NND) method, provides critical insights into the spatial relationships between heritage sites over time. By calculating the distance between each site and its nearest neighbor, this method evaluates the concentration and dispersion of heritage sites along the SRN. The study also incorporates the DBSCAN (Density-Based Spatial Clustering of Applications with Noise) algorithm, which identifies clusters based on density and effectively manages noise and outliers. DBSCAN is particularly valuable in archeological research because it does not require a predetermined number of clusters, allowing for the identification of geographically significant differences between sites. Moreover, the silhouette coefficient is calculated to assess the quality of clusters identified by DBSCAN, providing a measure of cohesion within clusters and separation between different clusters. Finally, Kernel Density Estimation (KDE) is used to analyze the spatial distribution of heritage sites across various centuries, providing both statistical and visual representations of site density. KDE smooths spatial data to produce a continuous surface that highlights areas of high cultural and economic activity along the Silk Road. This method effectively demonstrates how the distribution of heritage sites evolved over time, reflecting changes in settlement patterns and land use. The KDE analysis is complemented by distance matrix construction and proximity analysis, which further explore the spatial relationships between sites. The results from KDE, combined with these other methods, provide a detailed understanding of the spatial dynamics and the role of the SRN in shaping connectivity and landscape evolution across Eurasia and North Africa.

2.1. Material Collection

The cultural heritage data used in this study were sourced from the UNESCO World Heritage site (www.unesco.org) official platform of the United Nations Educational, Scientific and Cultural Organization. The data and information provided are sourced from UNESCO and its partner organizations, and are subject to authoritative verification and approval, exerting a significant influence in the field of cultural heritage. Details such as the name of the heritage site, the country it is in, its coordinates, the region, and the dates of establishment and abandonment were obtained by accessing the descriptive pages of cultural heritage entries across Asia, Europe, and North Africa. The names of the heritage sites are derived from the entries themselves, while the country and coordinates are from the basic information section, and the region along with the dates are from the descriptive section of the entries.
The data are categorized chronologically, sorted by the date of establishment, and recorded in centuries from the time of their establishment to their abandonment. The temporal scope for the cultural heritage sites in this study is designated from the 2nd century B.C.E. to the 15th century. This timeframe was specifically chosen to align with research on the SRN, beginning with the historical mission of Zhang Qian to the Western Regions. Zhang Qian’s journey not only opened up routes to these regions but also marked the beginning of cultural and commercial exchanges between the East and the West, as detailed in the Records of the Grand Historian: Treatise on the Dayuan [24]. Over time, the prominence of the terrestrial Silk Road gradually diminished, supplanted by the maritime periods, particularly by the 15th century—a period notable for the Age of Discovery in Europe. During this era, European explorers, emboldened by advancements in Portuguese navigational techniques that refined traditional Mediterranean maritime skills to meet the demands of oceanic voyages, ventured into the New World, establishing new sea routes. This period is marked by the navigational achievements of explorers, most notably Christopher Columbus, whose voyages from 1492 to 1493 were meticulously planned and executed based on his exceptional navigational skills as documented in his logs [25], with the achievement of the discovery of maritime routes to the Americas. Italian navigators also played a significant role in these maritime explorations, though it was undoubtedly the golden age of Iberian power that first propelled European maritime expansion [26]. Concurrently, the overland Silk Road began to decline as these new sea routes emerged, allowing Europe to trade directly with Asia and the Americas via the newly discovered maritime routes, thereby reducing reliance on the traditional Silk Road, the nexus of the Old World [27]. The selected period from the 2nd century B.C.E. to the 15th century effectively reflects the changes in the Silk Road’s cultural heritage sites over its historical phases, thereby providing robust support for further analysis. Once the timeframe was established, the data were then systematically categorized by century.
In terms of data preprocessing for this study, cultural heritage information was entered in the sequence of heritage name, country, latitude, longitude, region, time of establishment, and time of abandonment. During the selection process, entries without specific establishment dates were removed, and smaller sub-entries under major entries were included to better highlight the Silk Road’s evolutionary process. For data transformation, the original geographical coordinates, originally in degrees, minutes, and seconds, were converted to decimal degrees format. This conversion facilitates the eventual integration of the data into illustrations produced by JupyterLab platform of Python (3.11.5) language and Rstudio platform of R (4.3.3) language. For heritage sites that remain to this day without a recorded date of abandonment, no abandonment time was entered; however, these sites are included in the dataset up to the 15th century, placed within the time frame from the 2nd century B.C.E. to the 15th century.

2.2. Research Methods

2.2.1. Spatial Distribution Analysis

In pursuit of clarifying the spatial clusters of SRN sites through 2nd century B.C.E. to the 15th century mentioned in the previous section, this study advances into the second pivotal phase: spatial cluster analysis. This analysis aims to unearth the underlying spatial structures and tendencies inherent within the geographic distribution of the sites. To achieve this objective, this study embarks on an application of spatial statistical techniques. To investigate the relationship between the establishment centuries of SRN sites and their geographical coordinates, this study implements the chi-square test, a statistical assay for its efficacy in discerning and comparing the distributions of categorical variables across distinct groups. The chi-square test is defined by the following formula:
χ 2 = O i E i 2 E i
where O i represents the observed frequency of heritage sites in each period, and E i is the expected frequency assuming no change over periods. This test enables us to quantitatively determine the homogeneity or heterogeneity in the geographical spread of sites through time. Meanwhile, this test serves to ascertain whether the distribution of heritage sites exhibits significant variation across several centuries, thereby permitting a quantified assessment of distributional homogeneity or disparity [28].
Complementing the chi-square analysis, this study invokes the use of spatial autocorrelation functions—namely Ripley’s K, L, and G. These functions are instrumental in dissecting the spatial clustering of sites, providing a spectrum of scales at which any agglomeration might manifest. Ripley’s K function is particularly adept at identifying the degree of clustering within a given radius compared to a random distribution. It is computed as
K t = 1 λ i j I d i j t
where λ is the intensity of points (number of points per unit area), dij is the distance between points i and j, and I is an indicator function that equals 1 if dijt and 0 otherwise. This function allows us to quantify the extent to which heritage sites are more clustered than would be expected in a random distribution.
In extension, Ripley’s L function, a transformation of the K function, affords an expected distance metric that is intuitively more interpretable, delineating clustering or dispersion phenomena in relation to complete spatial randomness. It can be used as
L t = K t π t
The G function further enhances research analysis by offering an empirical distribution function of the distances from a randomly selected site to its nearest neighbor, thereby allowing an evaluation of the spatial processes influencing the point patterns [29,30]. It is given by
G t = 1 n i = 1 n   I d i , n e a r e s t t
where di,nearest is the distance from point i to its nearest neighbor. This metric provides insights into the intensity of clustering by looking at the proximity of each site to its closest neighbor.

2.2.2. Proximity Analysis

In the Proximity Analysis section, this study constructs a distance matrix for various sites to assess their spatial relationships and interactions over different historical periods. The nearest neighbor distance (NND) method, essential for evaluating the concentration of archeological sites, is widely employed in the statistical analysis of archeological and historical studies. This method calculates the distance between a site and its nearest neighbor to deduce the spatial distribution characteristics of these sites.
In applying this method to this research, the first step involves identifying archeological sites that existed from the 2nd century B.C.E through the 15th century. Subsequently, the NNDs for each site are calculated. Assuming each site is denoted as i , the distance di to its closest heritage site is computed using the following formula:
d i = m i n j i d s i , s j
In this analysis, d ( s i , s j ) represents the distance between heritage site s i and heritage site s j , where j i to ensure that the site does not measure the distance to itself.
Subsequently, this study calculates the average nearest neighbor distance for all heritage sites across various centuries. The formula is as follows:
d ¯ = 1 n i = 1 n d i
n represents the total number of heritage sites within a given century, while d i refers to the nearest neighbor distance for the i th heritage site.
The spatial distribution characteristics across different historical periods can be revealed by calculating the average NND coefficient for each century. This approach enhances the understanding of the evolving spatial patterns over time and provides a comprehensive perspective on the spatial layout trends of each period. This exploration of both relative distances and statistical measures of spatial distribution enables a thorough understanding of how cultural and historical influences may have shaped the placement and significance of heritage sites.
This study utilized DBSCAN (Density-Based Spatial Clustering of Applications with Noise), a popular clustering algorithm for density-based grouping of points that can identify clusters of arbitrary shapes while managing noise and outliers [31]. DBSCAN’s primary parameters are ‘eps’, which defines the neighborhood radius, and ‘minPts’, which specifies the minimum number of neighboring points required for a point to be considered a core point.
The analysis commenced with the computation of the k-distance for each heritage site. This k-distance, defined as the Euclidean distance to a site’s kth nearest neighbor, is crucial for ‘eps’ for the DBSCAN algorithm. The systematic calculation of these distances for each site within the dataset is performed as follows:
k - distance p = p N k p
where p denotes an individual heritage site, N k p signifies its kth nearest neighbor, and p N k p represents the Euclidean distance between them. The selection of a k-value, often predicated on the dataset’s intrinsic characteristics and the clustering objectives, leads to a collection of k-distances which, when ordered and visualized, elucidate a discernible ‘elbow’ or inflection point in their progression.
This study computed the k-distance to facilitate DBSCAN clustering. Unlike other clustering algorithms such as K-means, DBSCAN does not rely on a predetermined number of clusters but instead bases clustering on the density and proximity of points. This makes DBSCAN particularly sensitive to geographic differences between sites, a feature that is especially valuable in archeological research [31].
Subsequently, this study calculates the silhouette coefficient, a metric used to assess the quality of clustering. This coefficient integrates both cohesion—measured as the average distance of a point to others within the same cluster—and separation, or the average distance to points in the nearest different cluster. Each point is assigned a score ranging from −1 to 1. A silhouette coefficient close to 1 indicates well-defined clustering; a coefficient near −1 suggests poor clustering quality; and a score approaching 0 may indicate overlapping or randomly distributed clusters.
For each heritage site as one point i , the calculation of the silhouette coefficient includes two crucial distances: a i , the mean distance to other points within the same cluster, reflecting the cluster’s cohesion, and b i , the mean distance to points in the nearest different cluster, indicating the degree of separation. These distances are essential for determining the silhouette coefficient for each point, calculated as follows:
s i = b i a i max a i , b i
After calculating the silhouette values for each point, it is necessary to compute the average values for each century. This allows the degree of clustering for different centuries to be presented and determines whether the results are similar across these periods.

2.2.3. Kernel Density Estimation

This study conducts a Kernel Density Estimation (KDE) to analyze the distribution of archeological sites across various centuries. KDE is a method extensively used in archeological research to examine spatial point distributions. Mathematically, KDE can be represented as follows:
f ^ x , y = 1 n h 2 i = 1 n K x x i h , y y i h
x , y represents the coordinates of the point on the evaluation grid. ( x i , y i ) represents the longitude and latitude coordinates of the i -th data point. n is the number of site data points. ℎ is the bandwidth. K is the Gaussian kernel function.
KDE could assess the density of heritage sites along the Silk Road, demonstrating KDE’s recognized effectiveness in spatial analysis. This study utilized the ‘scipy.stats’ module in Python 3.11.5, which automatically selects the bandwidth h and applies kernel smoothing to the data points, generating a smoothed density estimate across the spatial region. Visualizing these density estimates on a map provides an intuitive understanding of the distribution density of heritage sites for each century.

3. Results

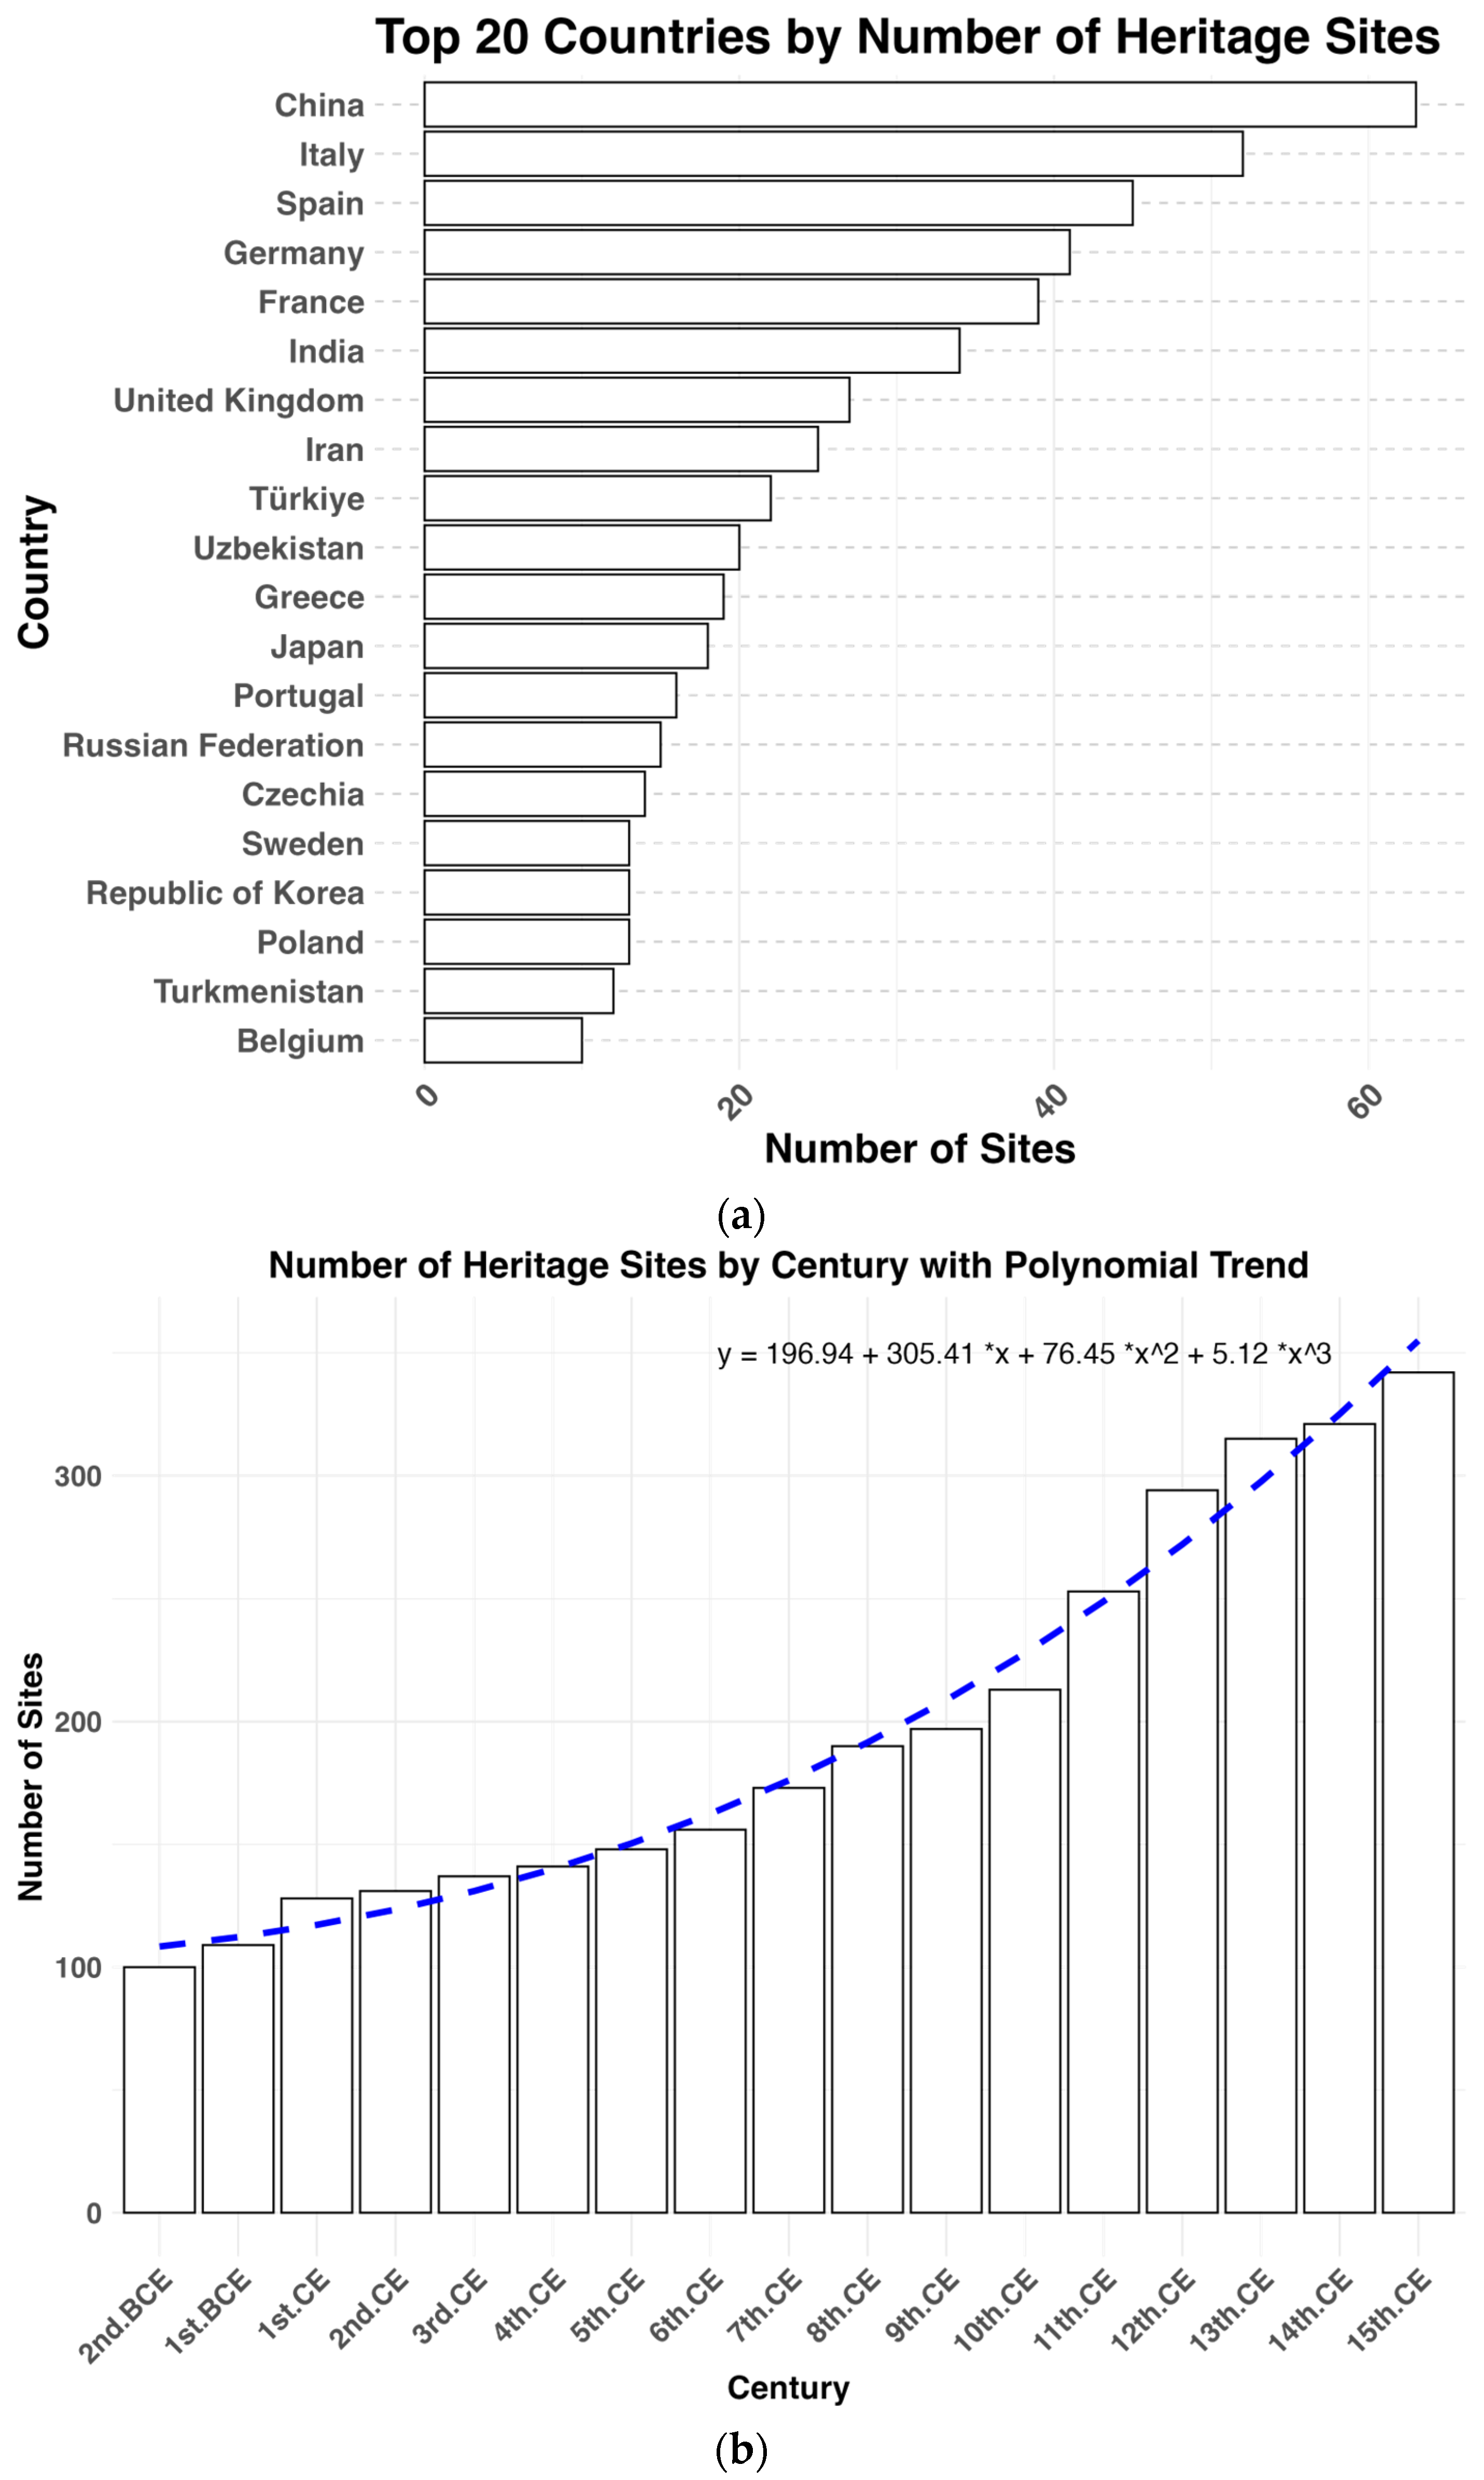
This section applies the above method and divides into three sections to show the findings. Before delving into the specific analysis, a statistical examination of the WHS data was conducted. Figure 2a presents the ranking of the top 20 countries or regions by the number of heritage sites. China ranks first with the most heritage sites, followed by Italy and Spain. Germany, France, and India also rank prominently. The number of heritage sites in these countries underscores their importance in global cultural heritage preservation. This figure indicates that Asian and European countries dominate in heritage site numbers, reflecting their rich historical and cultural legacy. Figure 2b illustrates changes in the number of heritage sites over various periods, with a polynomial trend line highlighting the overall trend. The horizontal axis represents centuries, from the 2nd century BCE to the 15th century CE, while the vertical axis shows the number of heritage sites. The number of heritage sites has gradually increased over time. The polynomial trend line further shows that this growth has become more pronounced in recent centuries, particularly after the 10th century CE. This suggests a continued increase in the number of cultural heritage sites over time.

3.1. Statistical Analysis

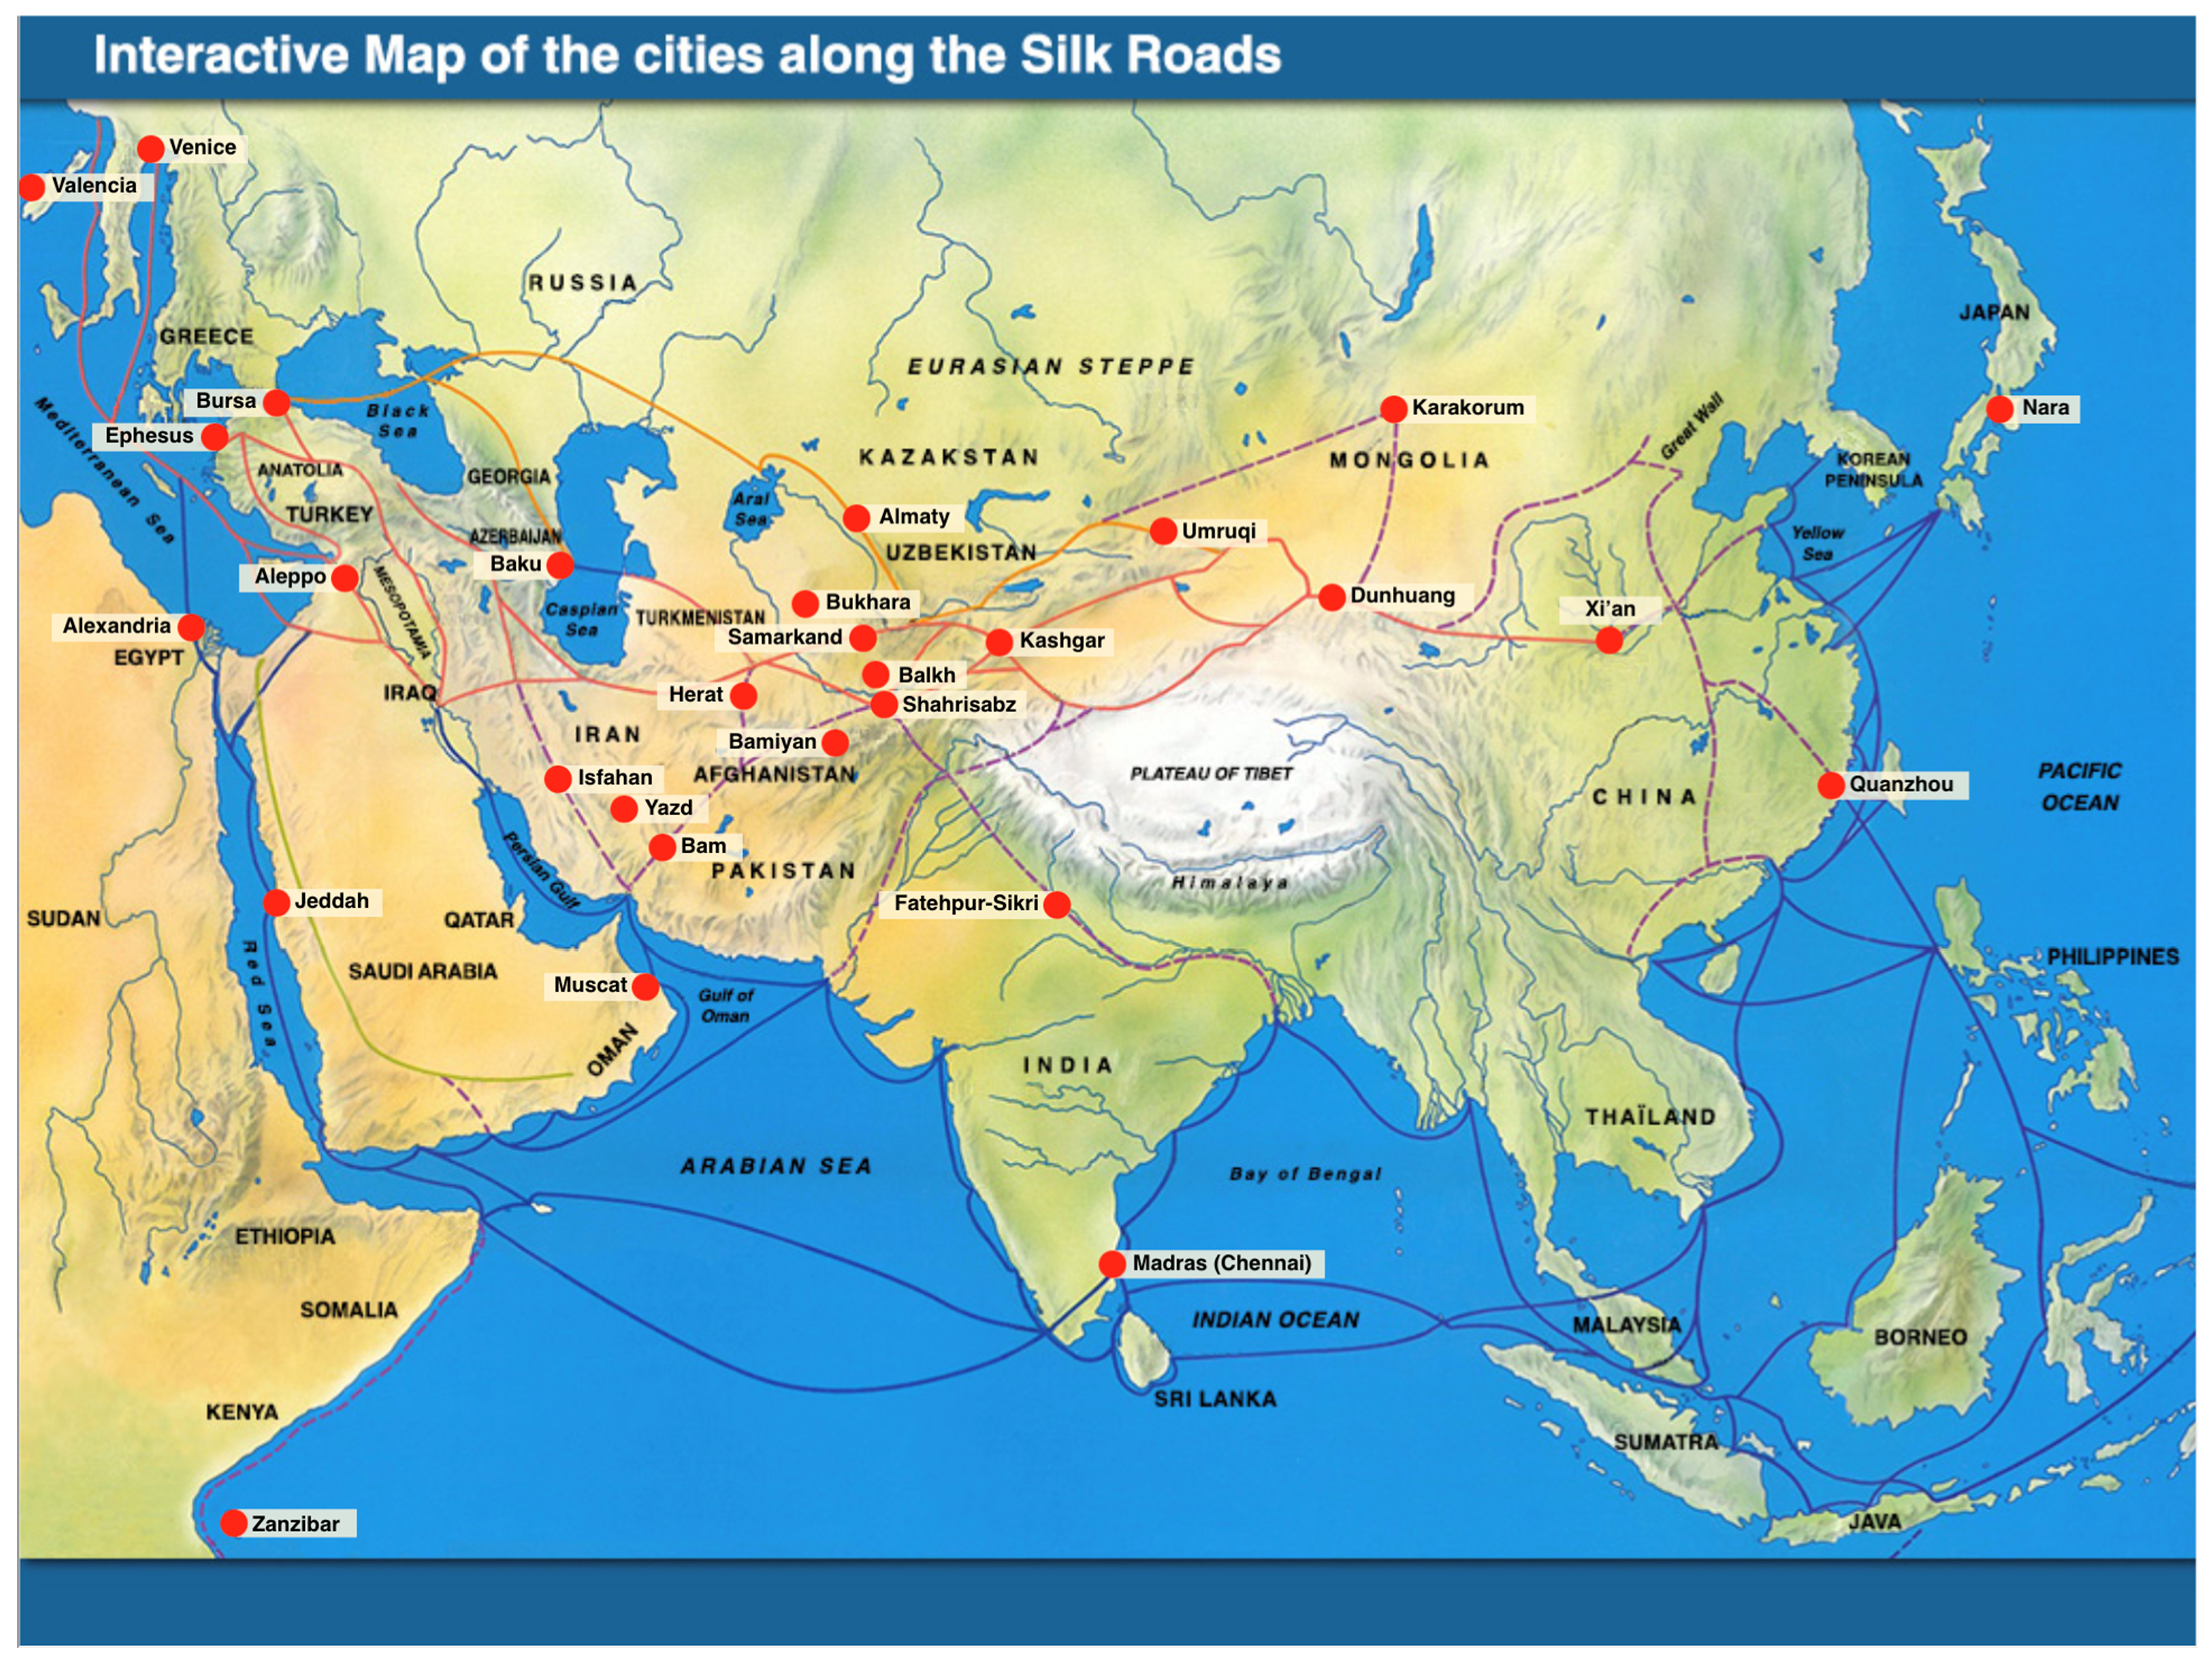
The chi-square test was employed to examine the association between the distribution of heritage sites along the terrestrial and maritime Silk Roads and their respective historical periods (shown in Figure 3). Using the average latitude of 33.4253° N, derived from cities on the UNESCO interactive map of the Silk Road, the SRN sites were divided into northern and southern regions. A contingency table was constructed to tally the number of sites across different centuries within these regions. The chi-square test yielded a value of 26.9515 with 16 degrees of freedom and a p-value of 0.04203. Since the p-value is below the significance level of 0.05, the results indicate a statistically significant association between the location of sites and their temporal classification. This suggests a notable, non-random pattern in the geographical placement of sites corresponding to their historical periods.
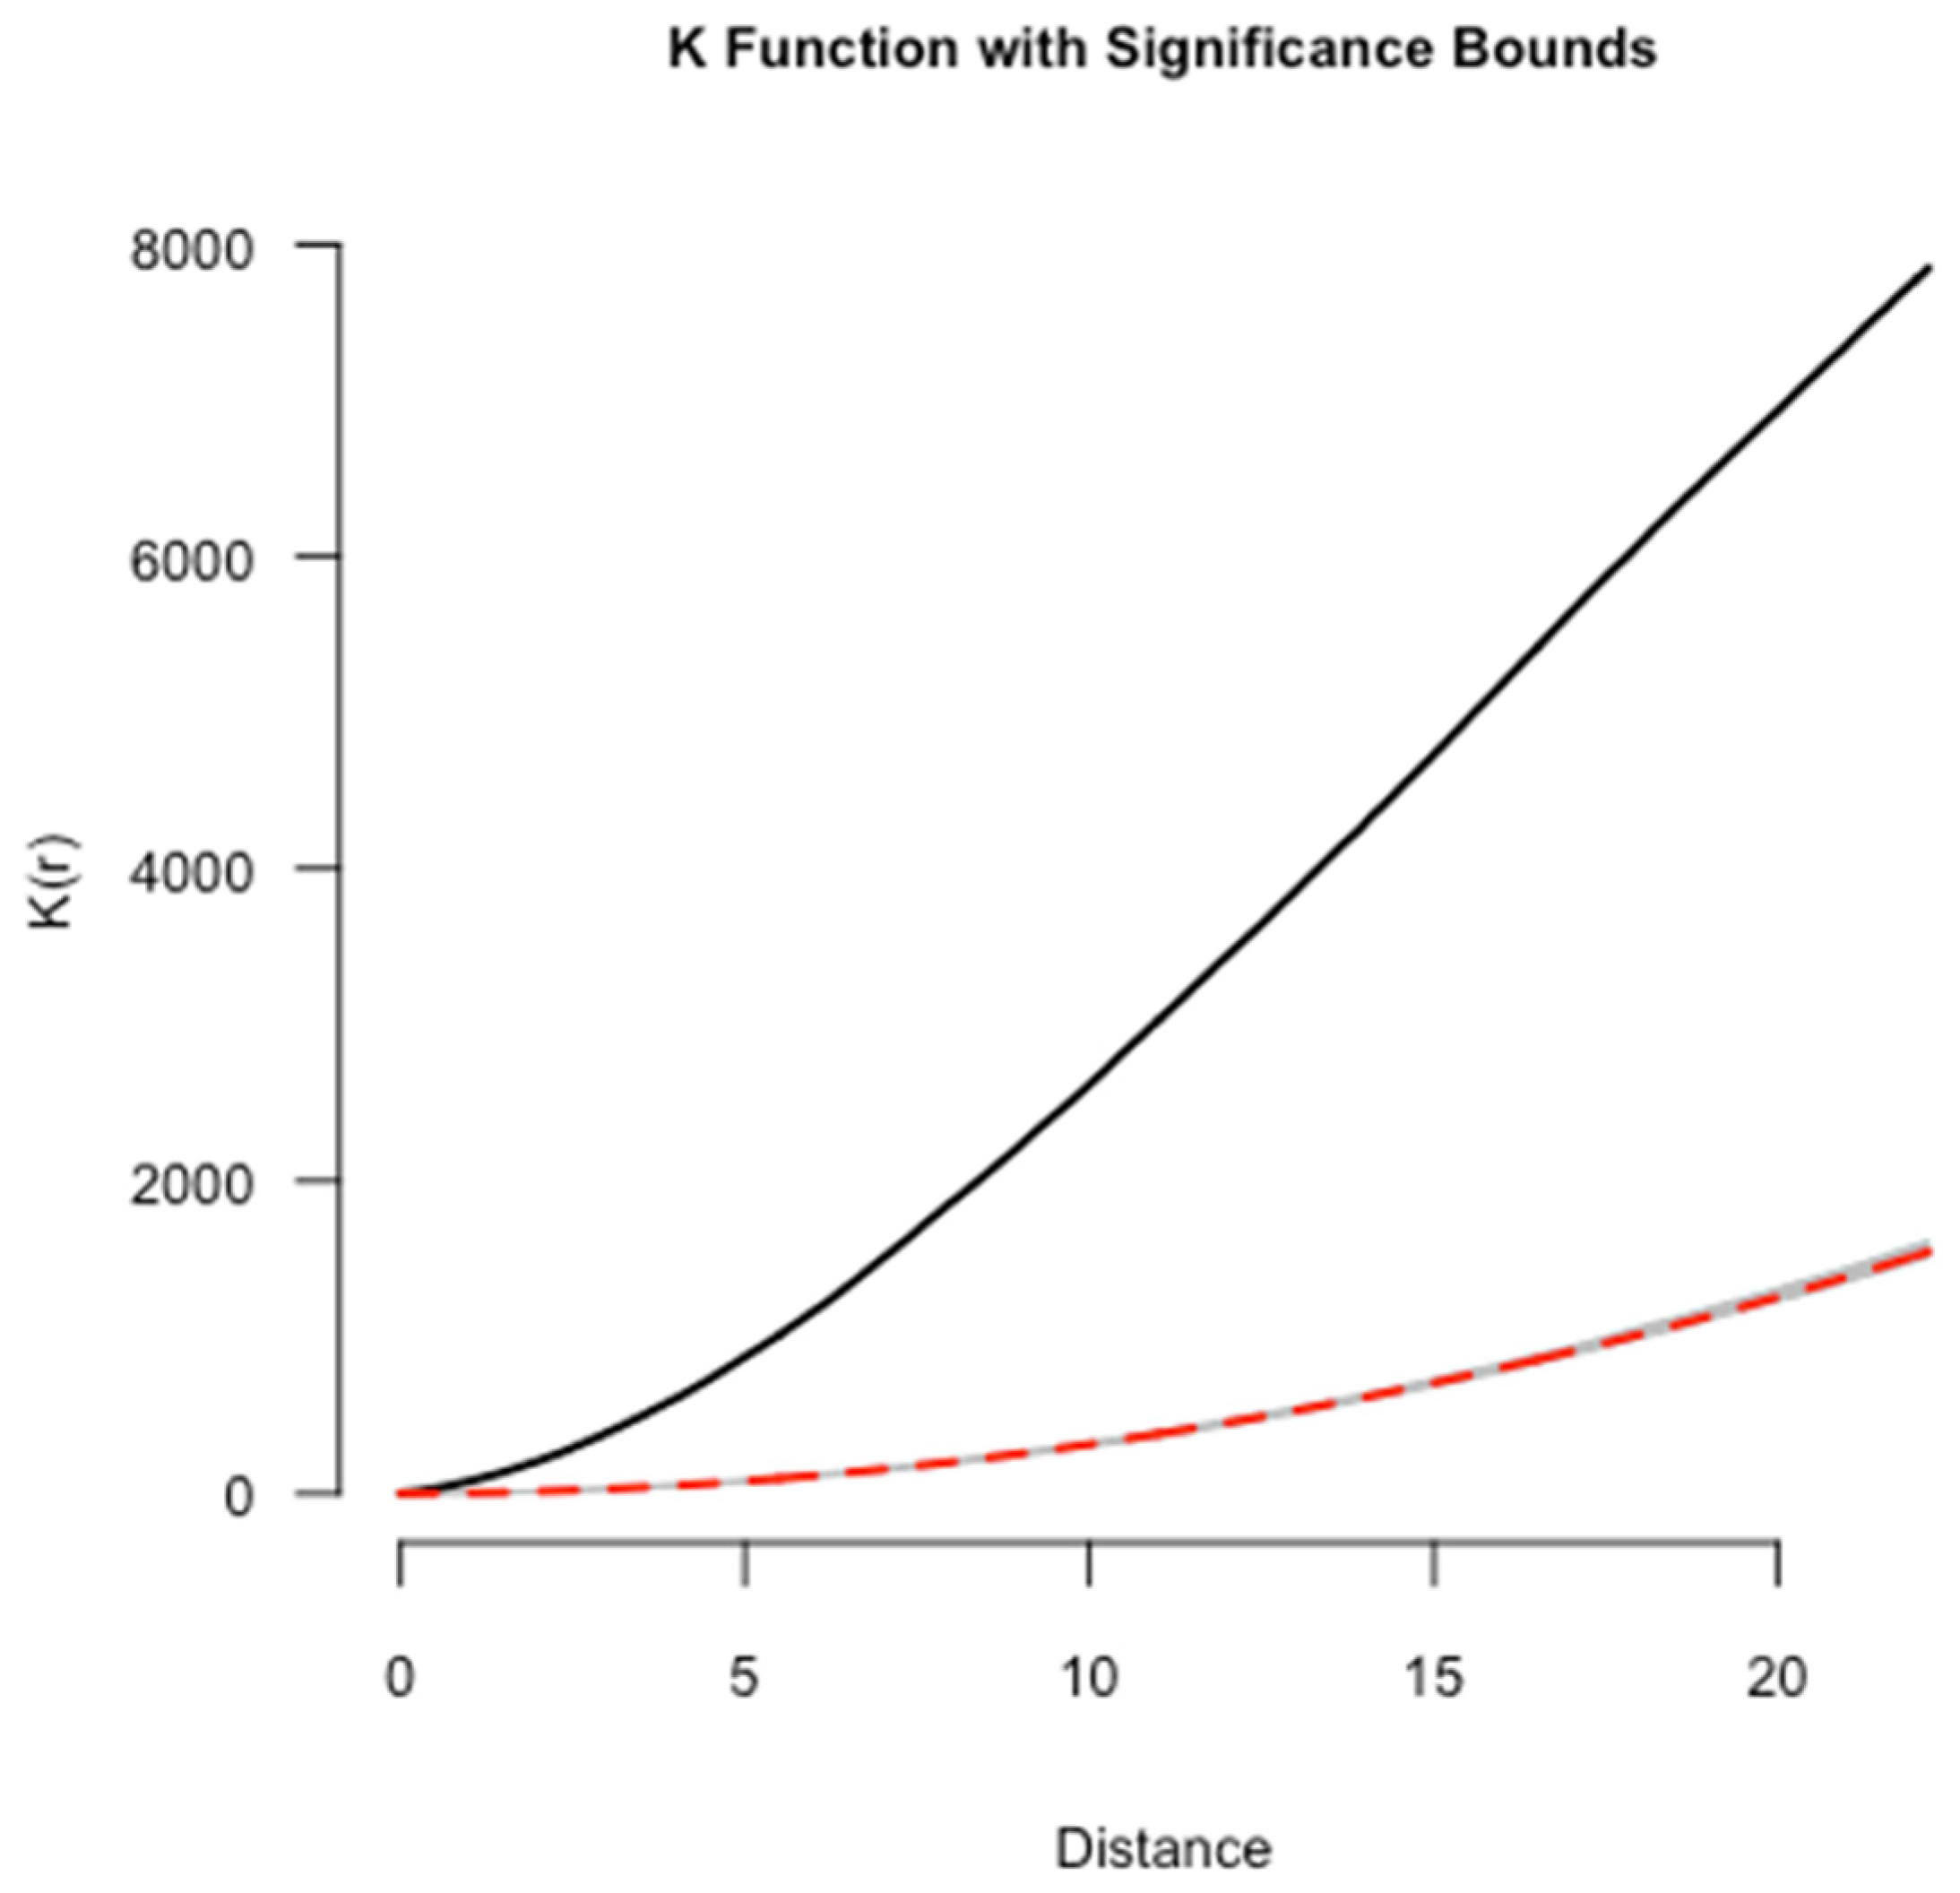
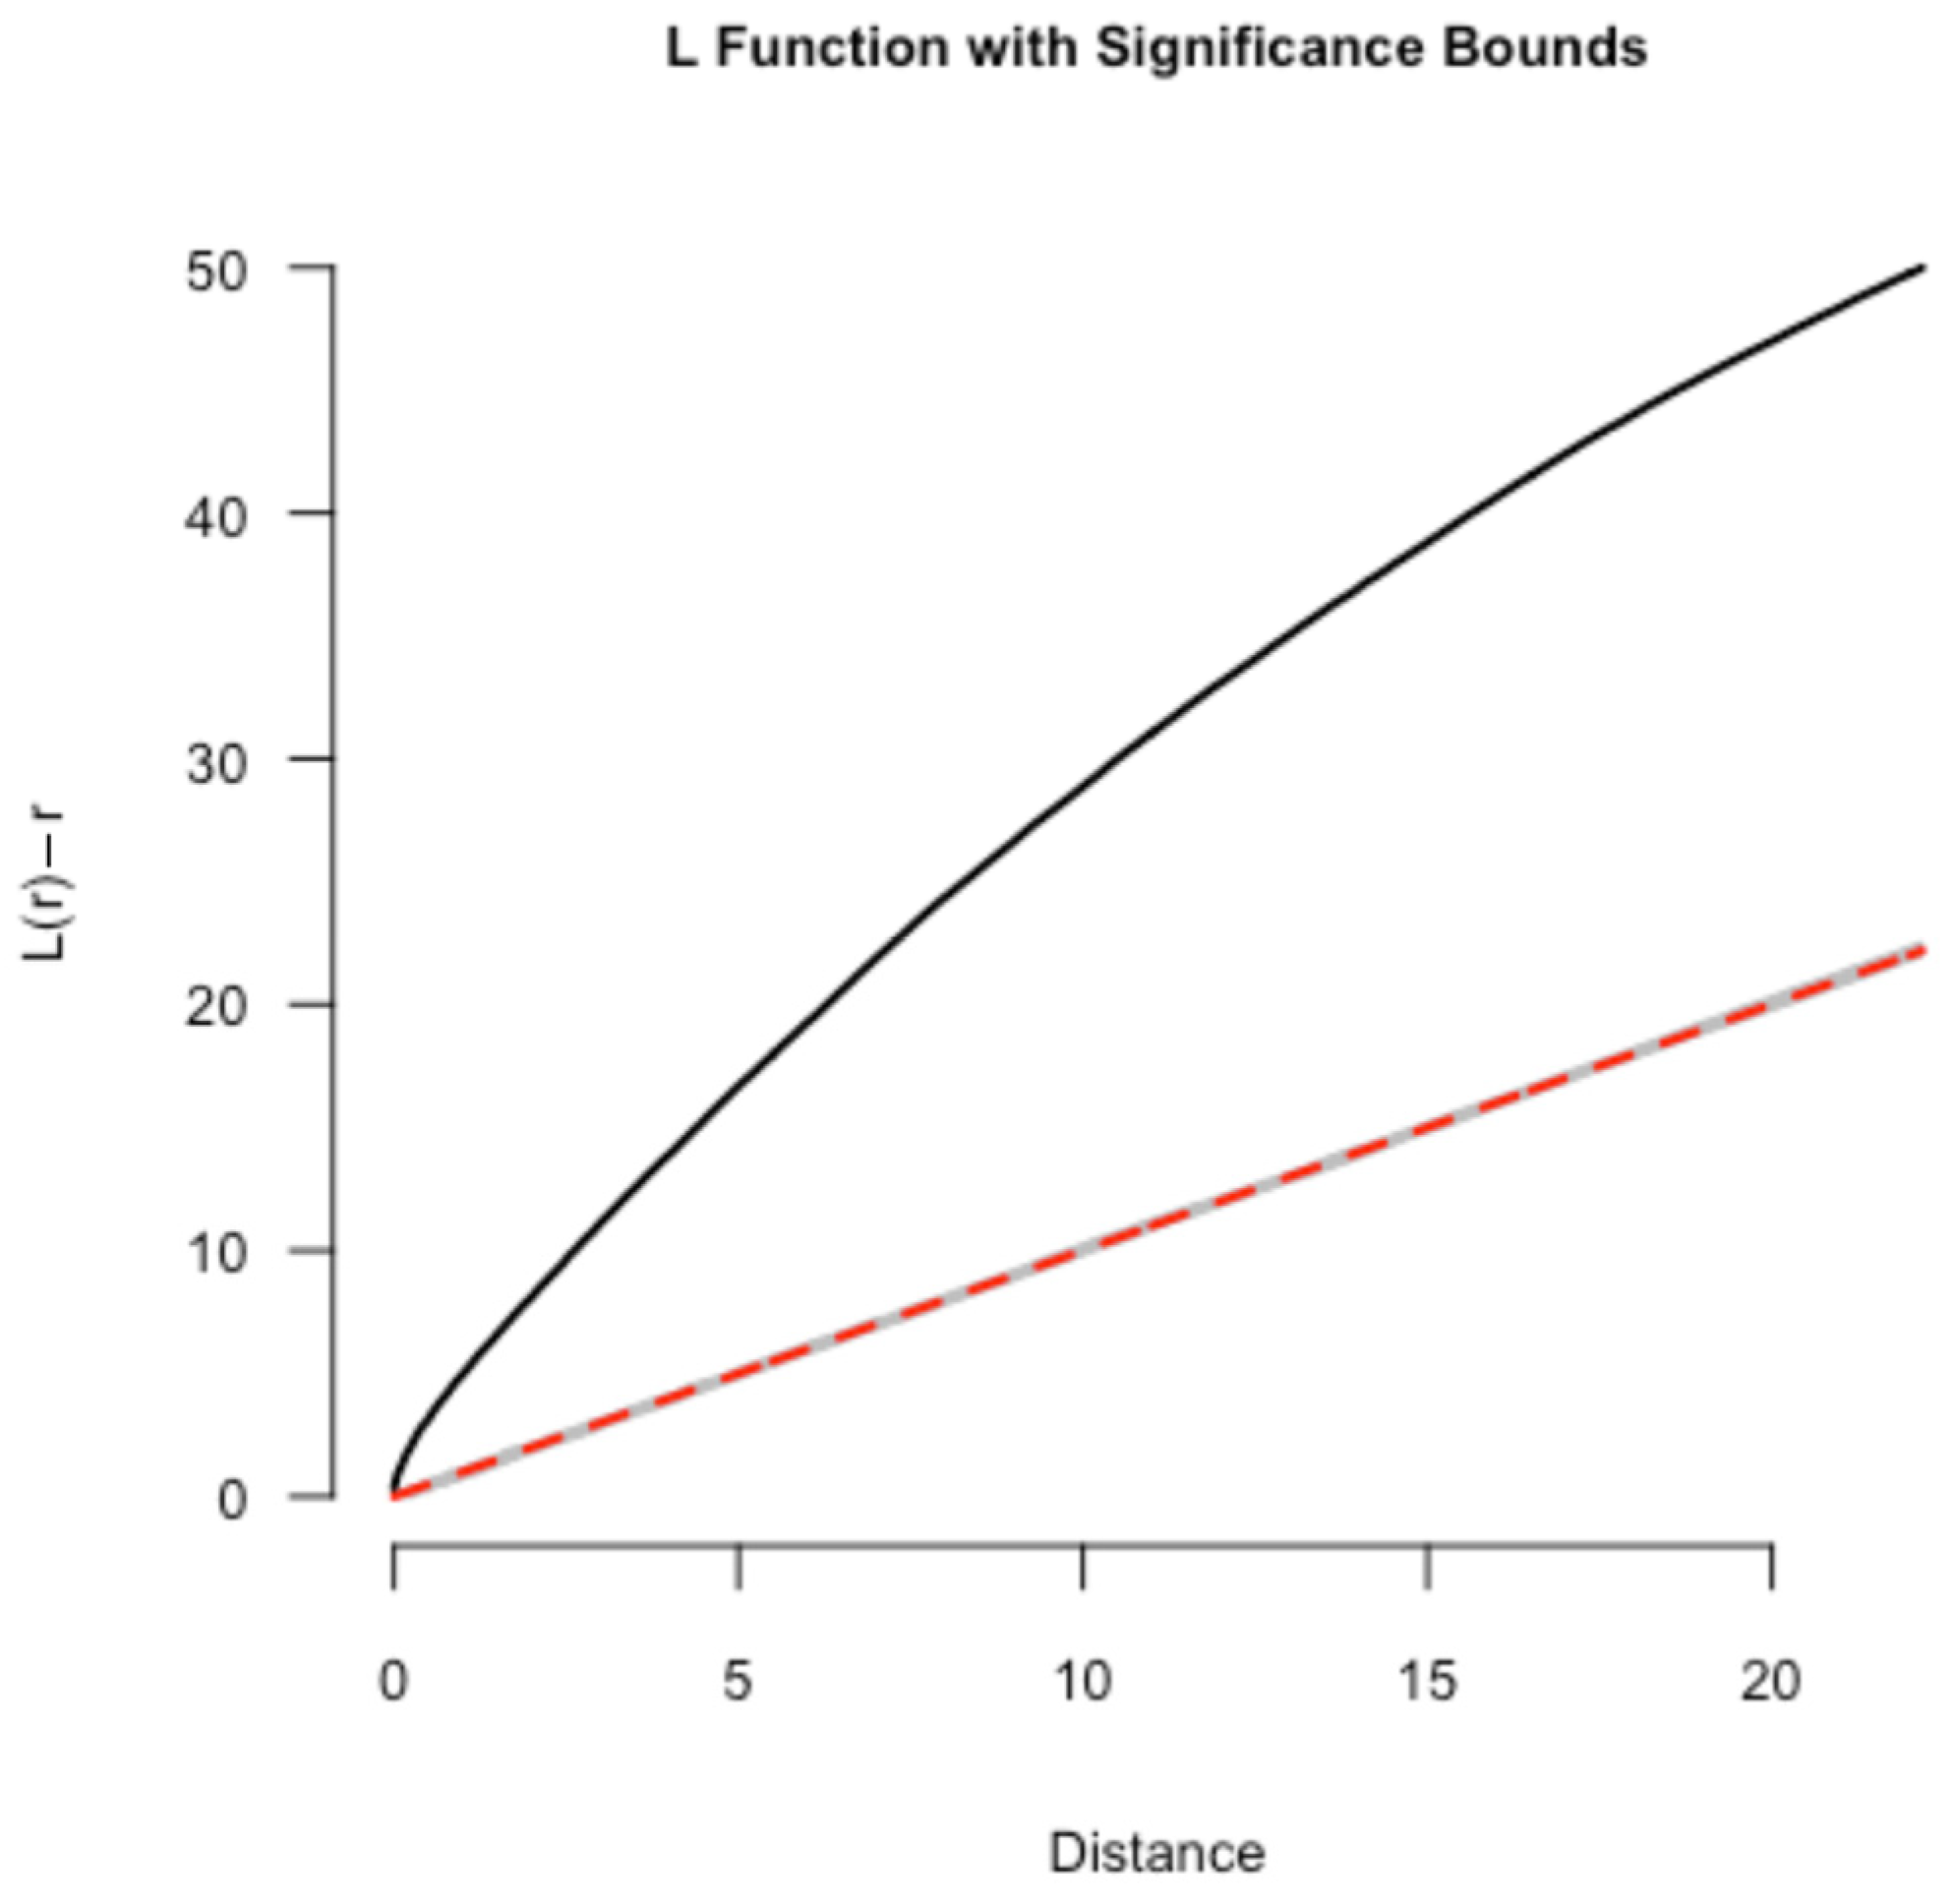
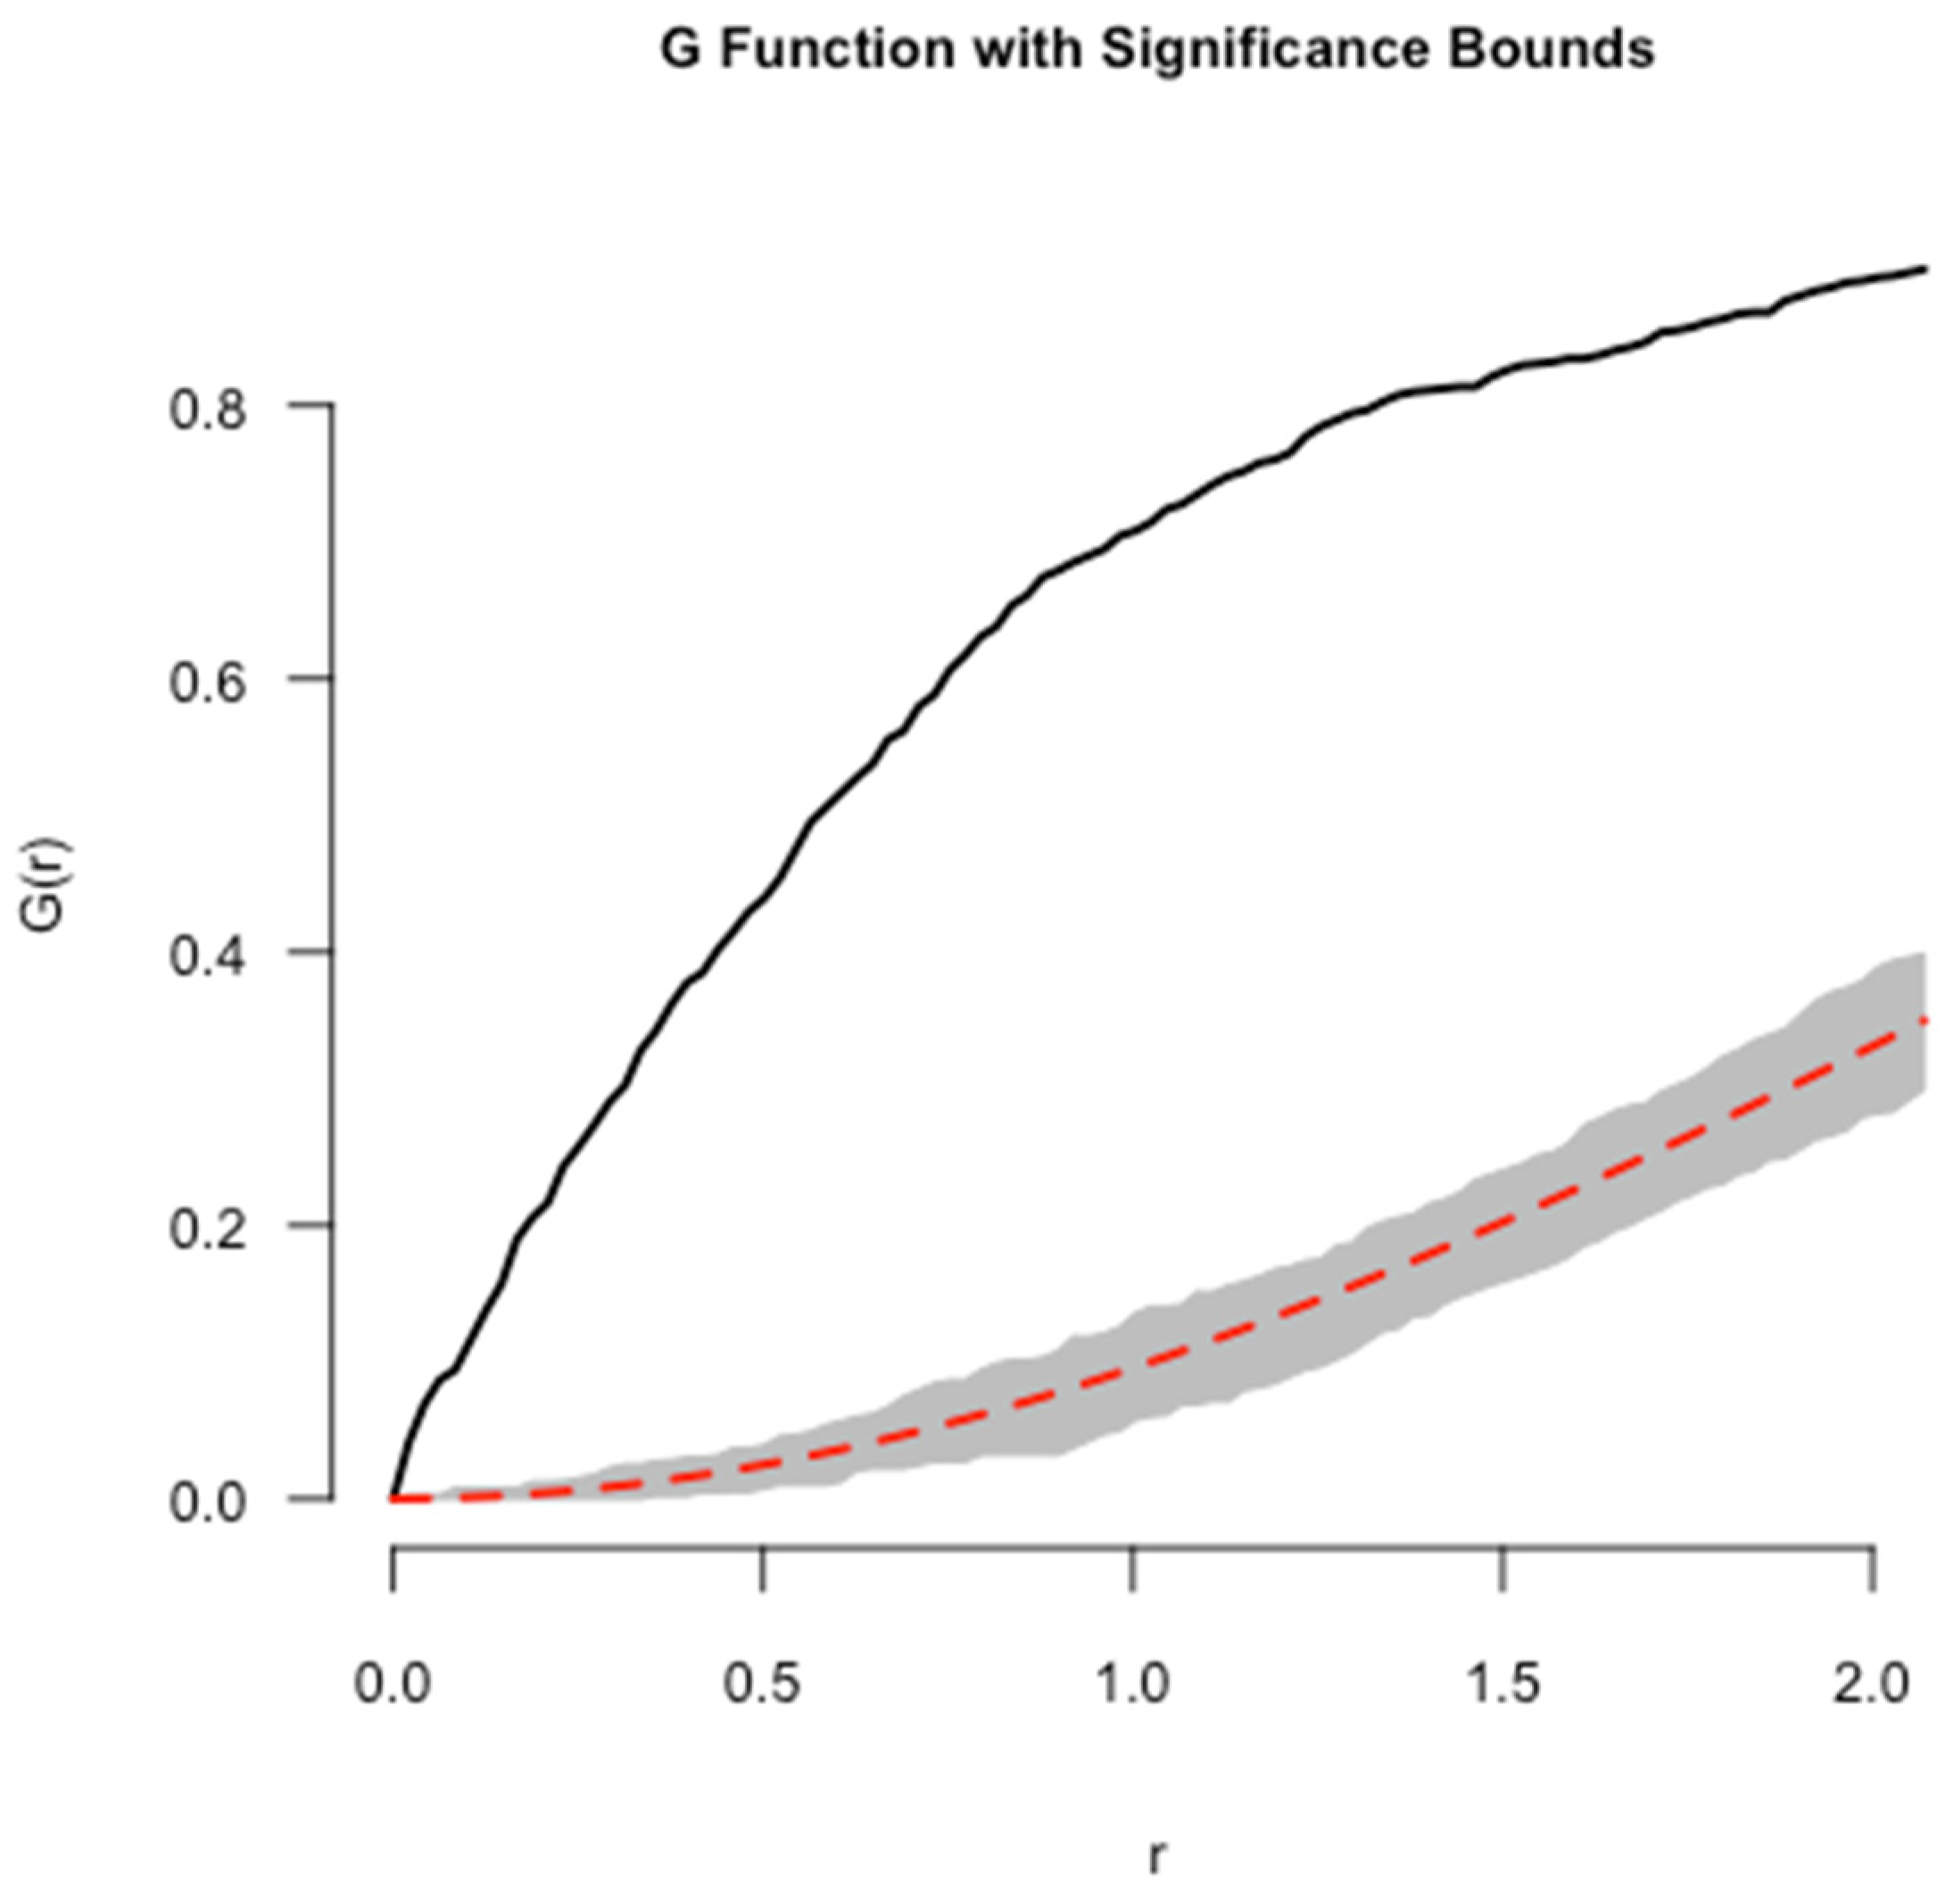
This does not, however, imply a causal relationship between the two variables. The following figures illustrate the spatial point patterns of a dataset as analyzed by Ripley’s K, L, and G functions within the context of their respective significance bounds. The analysis using Ripley’s K, L, and G functions reveals a clear pattern of non-randomness in the spatial distribution of the points studied. The consistent positioning of the observed functions above the theoretical lines and outside the significance envelopes for all three tests indicates a significant tendency towards clustering rather than randomness or regularity. These results should be interpreted as evidence of an underlying spatial process or interaction influencing the distribution of the points, which could be crucial for further research into the causative factors or mechanisms responsible for this pattern.
Figure 4 shows that the observed K function, represented by the solid black line, lies above the theoretical K function, indicated by the red dashed line, across the range of distances. This consistently higher value outside the grey confidence envelope suggests a significant clustering of points over the distance scale analyzed. This finding indicates that points are more densely located around each other than would be expected if they were randomly distributed, pointing to a potential underlying process that causes aggregation.
In Figure 5, the observed L-function, shown by the solid black line, is above the theoretical expectation (red dashed line) for all distances measured. Since the L-function is designed to have an expected value of zero under a random distribution, the observed positive values suggest clustering. The deviation of the L-function from zero beyond the grey significance bounds reinforces the evidence of spatial clustering at various scales.
Figure 6 depicts the G function. Here, the solid black line of the observed G function rises above the theoretical line (red dashed line), particularly at smaller distances, and remains outside the grey significance envelope. This pattern suggests that the nearest neighbor distances are generally shorter than expected under a random distribution, indicating a tendency toward clustering.

3.2. Spatial Clustering Analysis across Centuries

From the 2nd century B.C.E. to the 3rd century, the distribution of nearest neighbor coefficients (see Figure 7a) indicates that SRN sites were primarily concentrated in lower value ranges. The lighter color and smaller size of the bubbles indicate that the data points were closely spaced and relatively clustered. The silhouette scores (see Figure 7c) remained low and relatively stable at around 0.2, suggesting poor clustering performance with data points spatially dispersed or lacking significant aggregation. The clusters identified through the DBSCAN algorithm (see Figure 7b) show that most data points lie outside the red contour area, indicating they are relatively dispersed and likely classified as noise points or independent clusters. According to Figure 7d, from the 2nd to 1st century B.C.E., the clusters were relatively dispersed. This indicates that the sites did not form significant high-density aggregation areas, suggesting dispersed social activities or limited records. It also shows that during the 2nd and 3rd centuries CE, the clusters became more pronounced, indicating increased social activities or more the establishment of more heritage sites during this period.
From the 4th to the 8th century, the nearest neighbor coefficients gradually increased (see Figure 7a), with bubbles becoming darker and larger, indicating a more dispersed spatial distribution of data points. The silhouette scores (see Figure 7c) began to rise from the 6th century onwards, showing improved clustering performance and suggesting the emergence of spatial aggregation among sites. The DBSCAN-identified clusters (see Figure 7b) also became more distinct, with some data points located within high-density areas (inside the contour), while others remained more dispersed (outside the contour), indicating an increasing tendency toward clustering. According to Figure 7d, from the 4th to the 9th centuries, several clusters evenly appeared across these periods, indicating that sites had a certain degree of spatial aggregation.
From the 9th to the 13th century, the nearest neighbor coefficients significantly increased (see Figure 7a), especially during the 11th to 13th centuries, when some data points reached the highest values. The bubbles became darker and larger, indicating a highly dispersed spatial distribution of data points. The silhouette scores (see Figure 7c) rose sharply in the 10th century, reaching a peak, indicating significantly improved clustering performance. From the 11th century onwards, the silhouette scores remained high, close to 1.0, indicating very distinct clustering characteristics. The clusters identified through the DBSCAN algorithm (see Figure 7b) showed a marked increase in number and diversity, with several forming high-density areas, particularly during the 11th and 12th centuries. This indicates significant social, cultural, or environmental changes that led to concentrated site distributions. According to Figure 7d, from the 10th to the 15th century, the number and diversity of clusters significantly increased, indicating that the spatial distribution of sites became more complex and diverse. Particularly during the 11th and 12th centuries, several clusters occupied a large proportion, indicating significant social, cultural, or environmental changes that led to concentrated site distributions.
These findings illustrate the changes in the aggregation and dispersion of sites from the 2nd B.C.E. to the 13th century. During the early period (2nd B.C.E. to 9th century), site distribution was relatively dispersed with no significant high-density aggregation areas, possibly reflecting the dispersed nature of early societies or incomplete archeological records. During the middle period (10th to 12th century), site aggregation significantly increased, with multiple clusters forming high-density areas, possibly indicating a peak in social and cultural activities. During the late period (13th to 15th century), site distribution became complex and diverse again, with multiple clusters appearing at different times. This indicates diverse social activities and regional development, possibly reflecting significant social changes and environmental shifts.
This study presents intriguing findings where some areas exhibit low nearest neighbor coefficients but high clustering. This indicates that while the overall distribution may appear dispersed, certain localized areas have a dense concentration of heritage sites. The low nearest neighbor coefficients suggest that data points are closely spaced within these local regions, highlighting significant clustering at a smaller scale. Furthermore, high clustering observed at larger scales implies that within a broad area, several smaller regions have high point density, but the distances between these smaller regions are relatively large. This results in an overall low nearest neighbor coefficient. Archeological findings often concentrate in specific hotspot regions, likely centers of ancient civilization activities. Consequently, even though the distribution appears dispersed at a macro scale, the density of points within these hotspot regions is extremely high at a micro scale.

3.3. Kernel Density Estimation Visualization

To better explore the relationships between heritage site locations, the results of the Kernel Density Estimation (KDE) analysis are presented below.

3.3.1. Heatmap Visualization and Interpretation

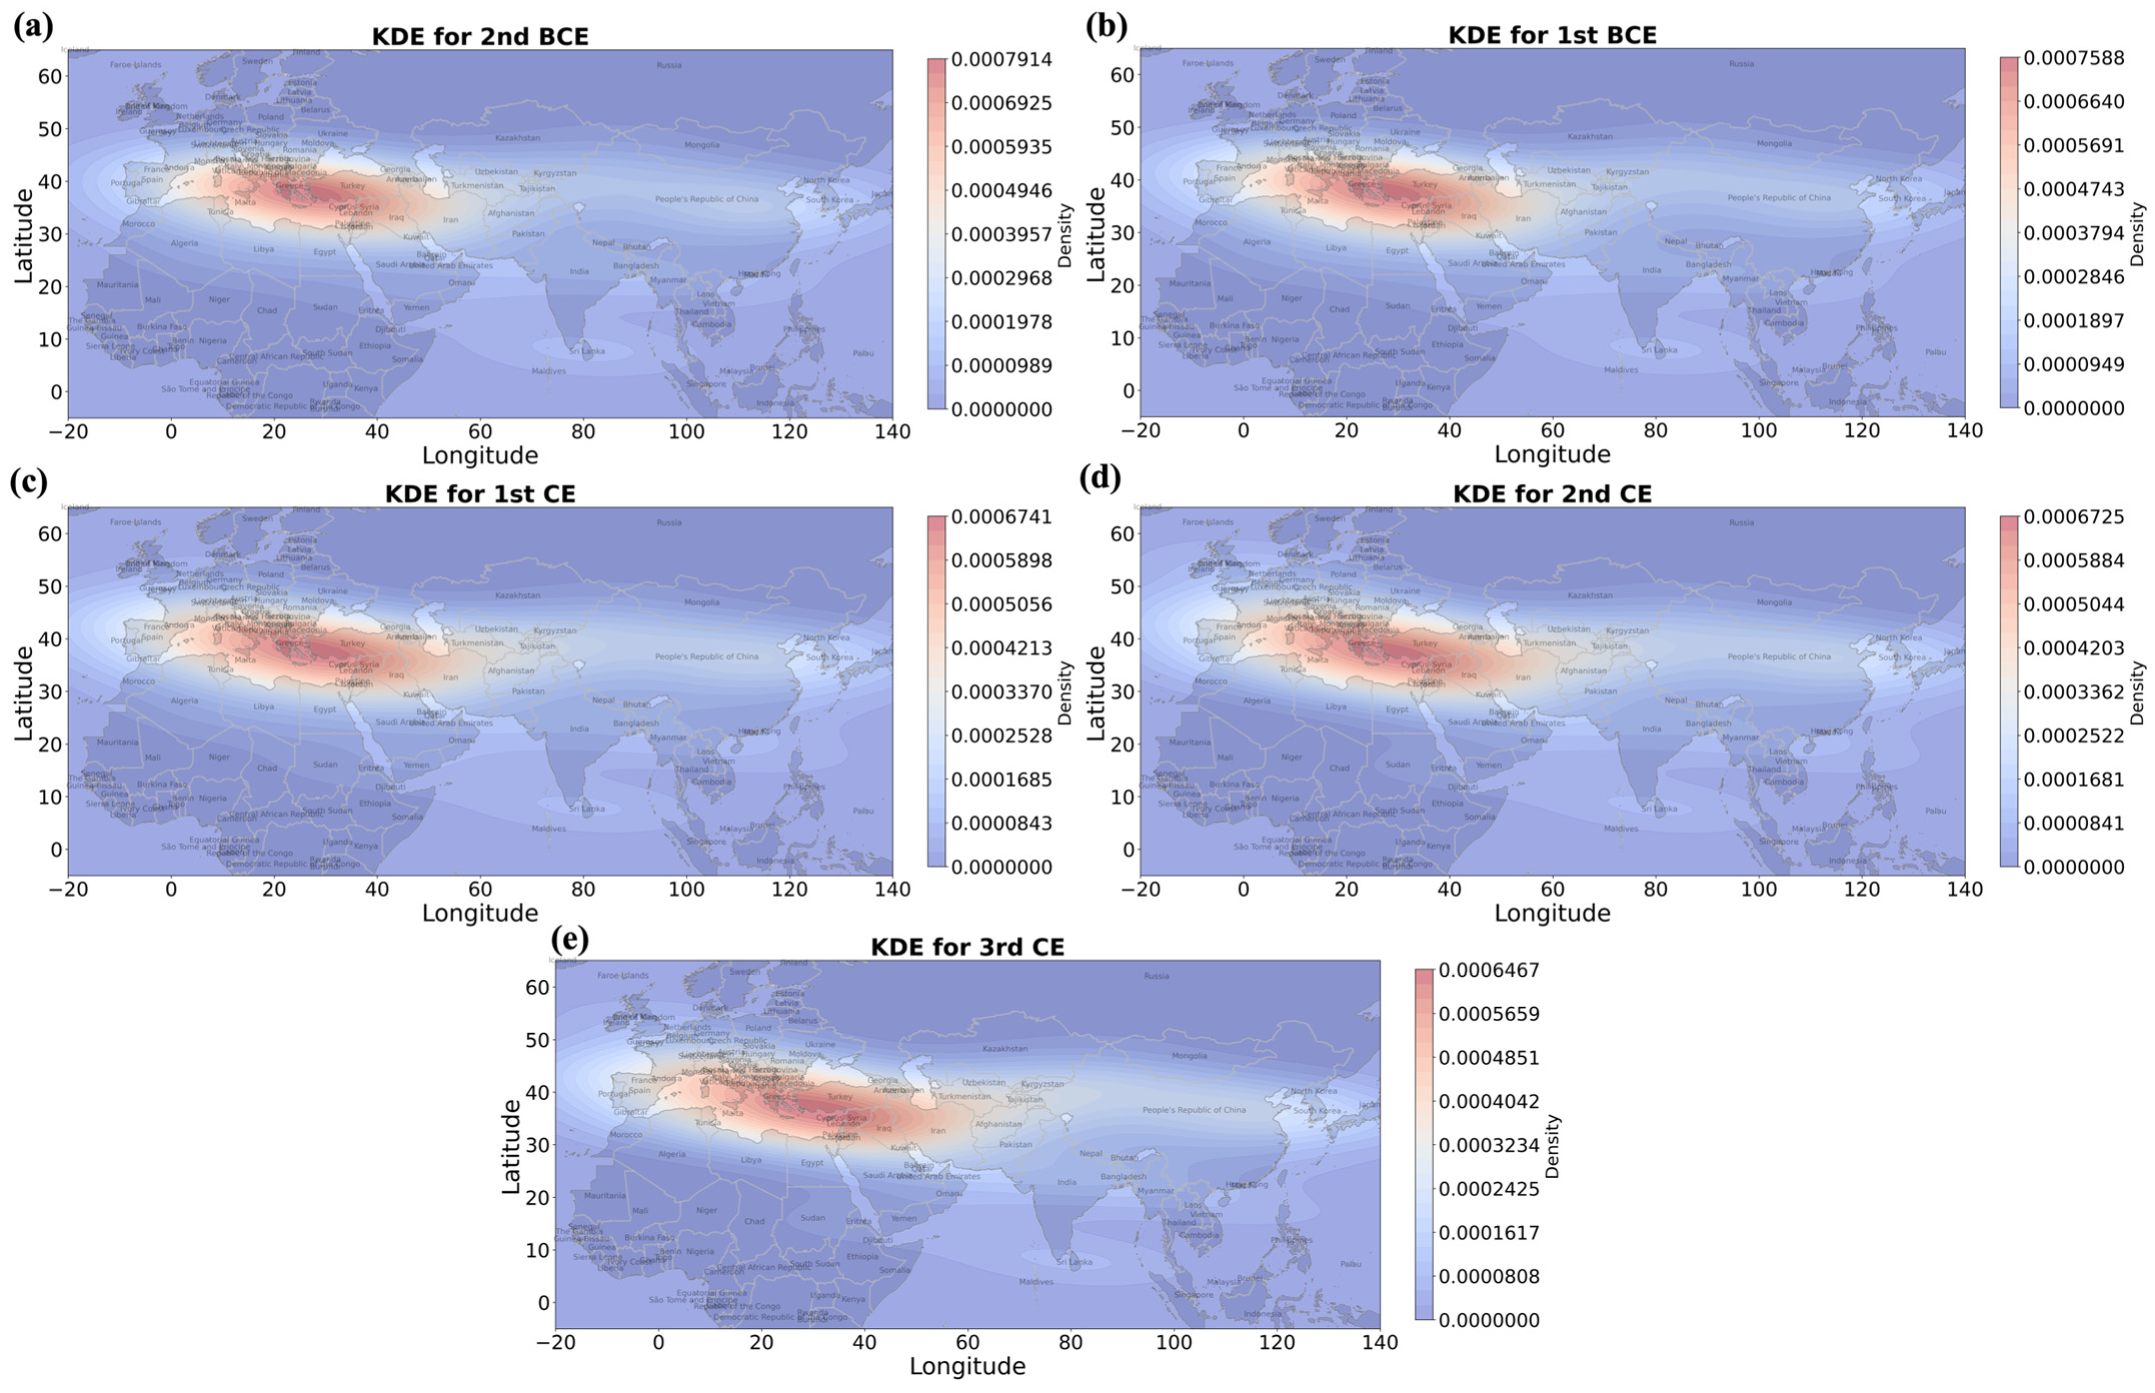
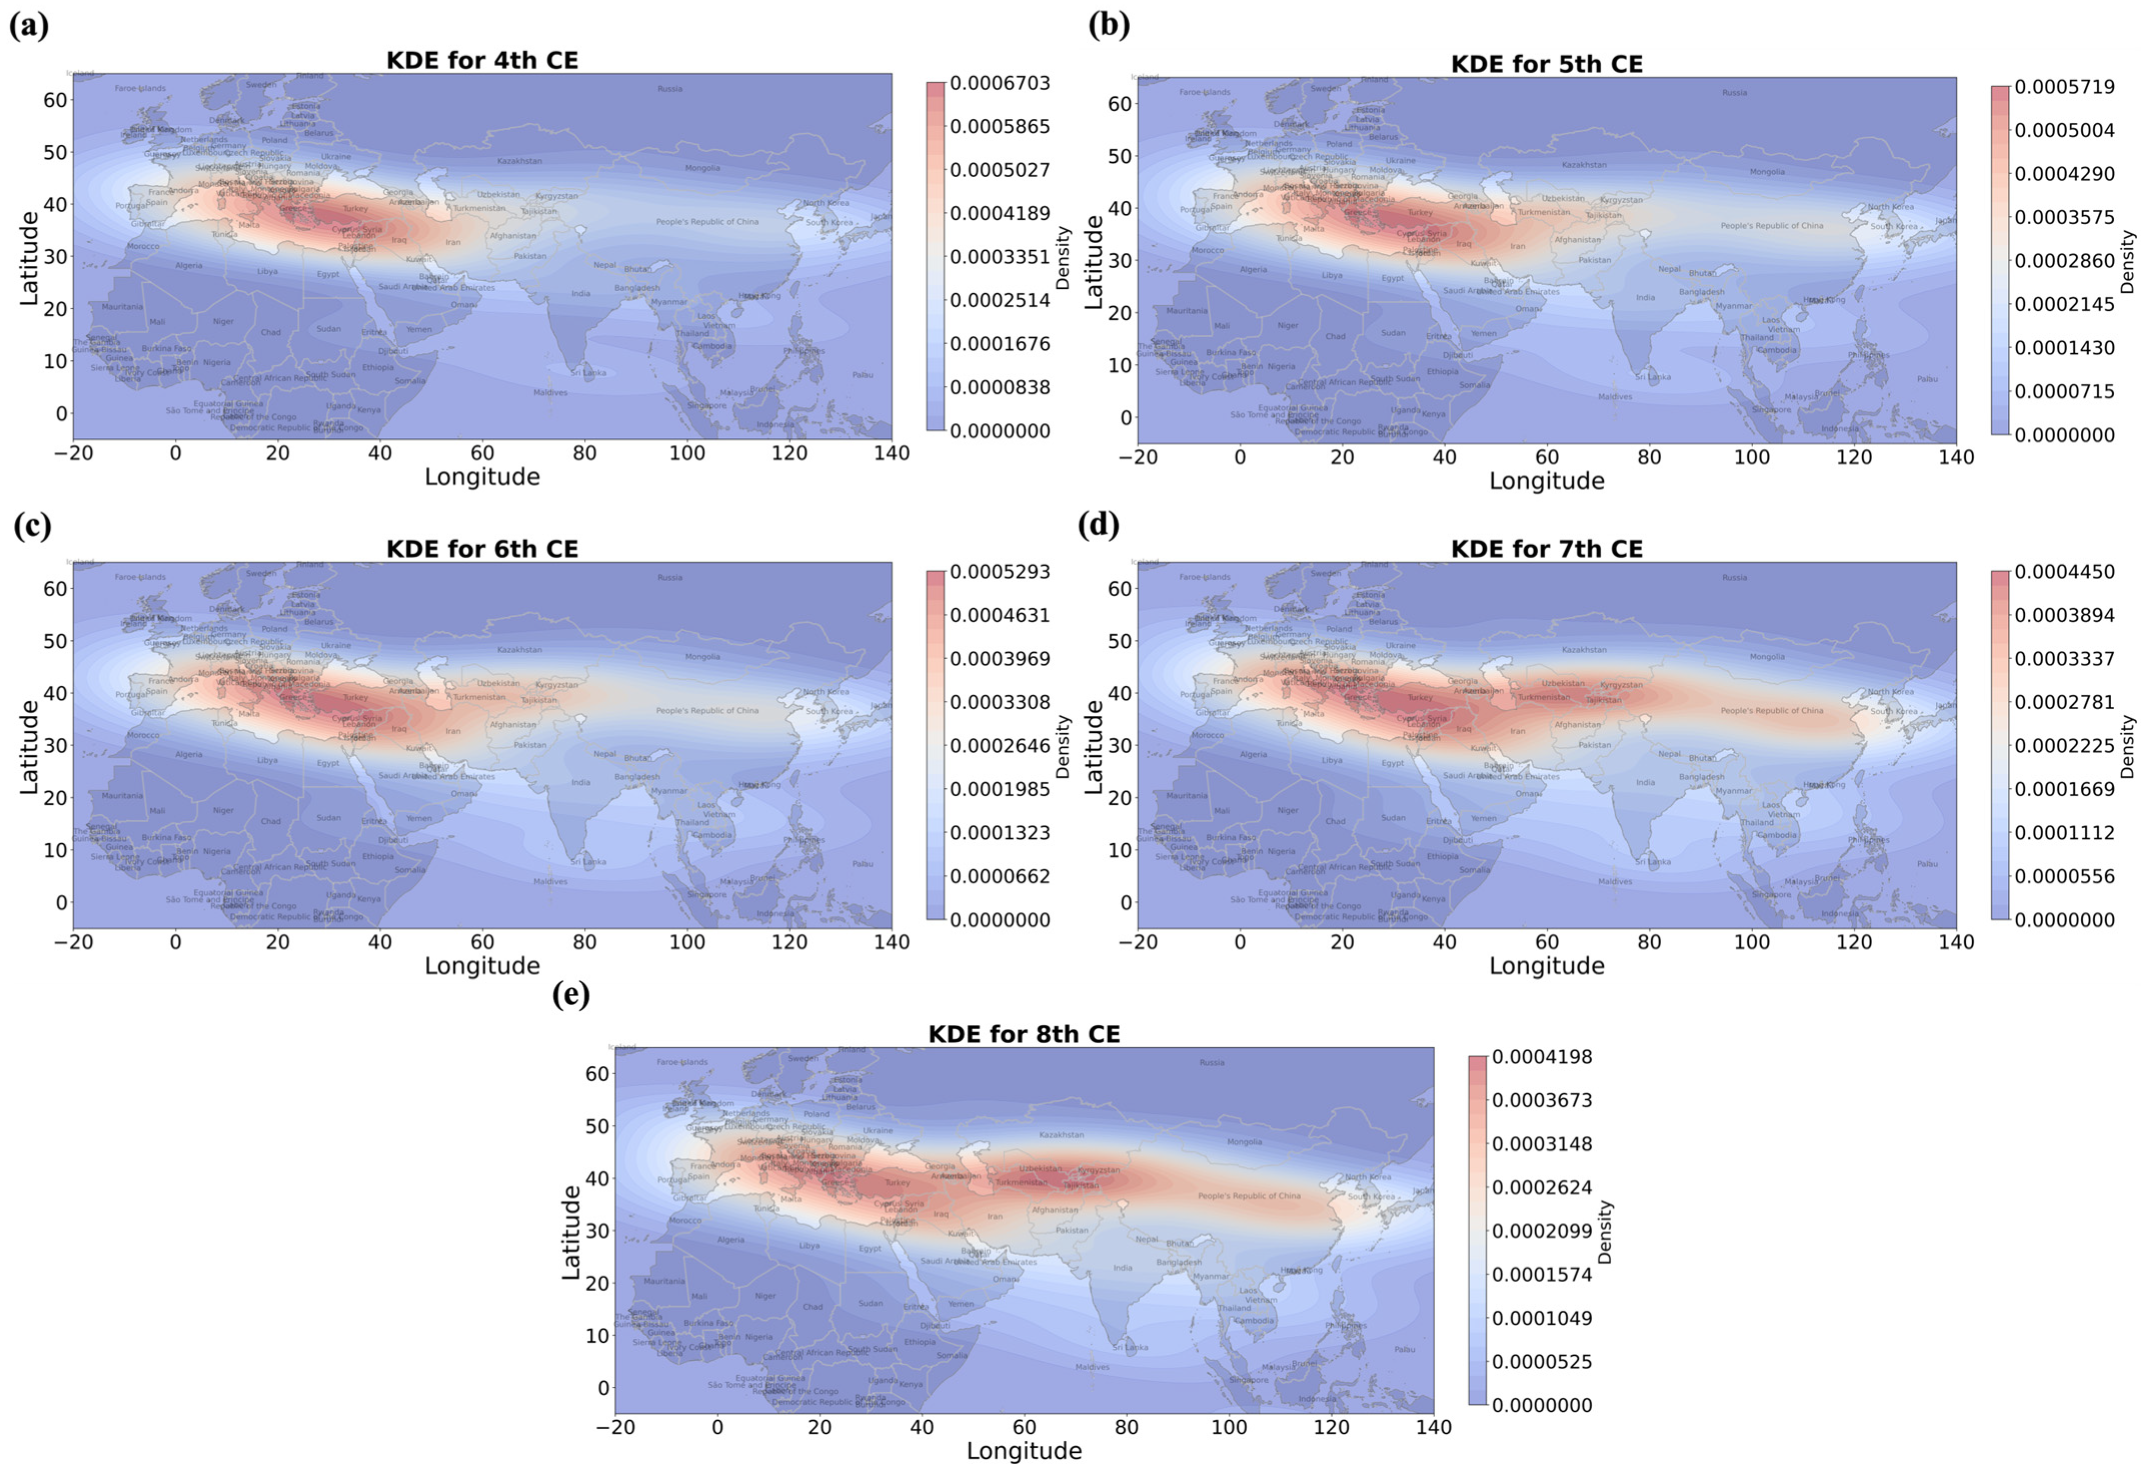
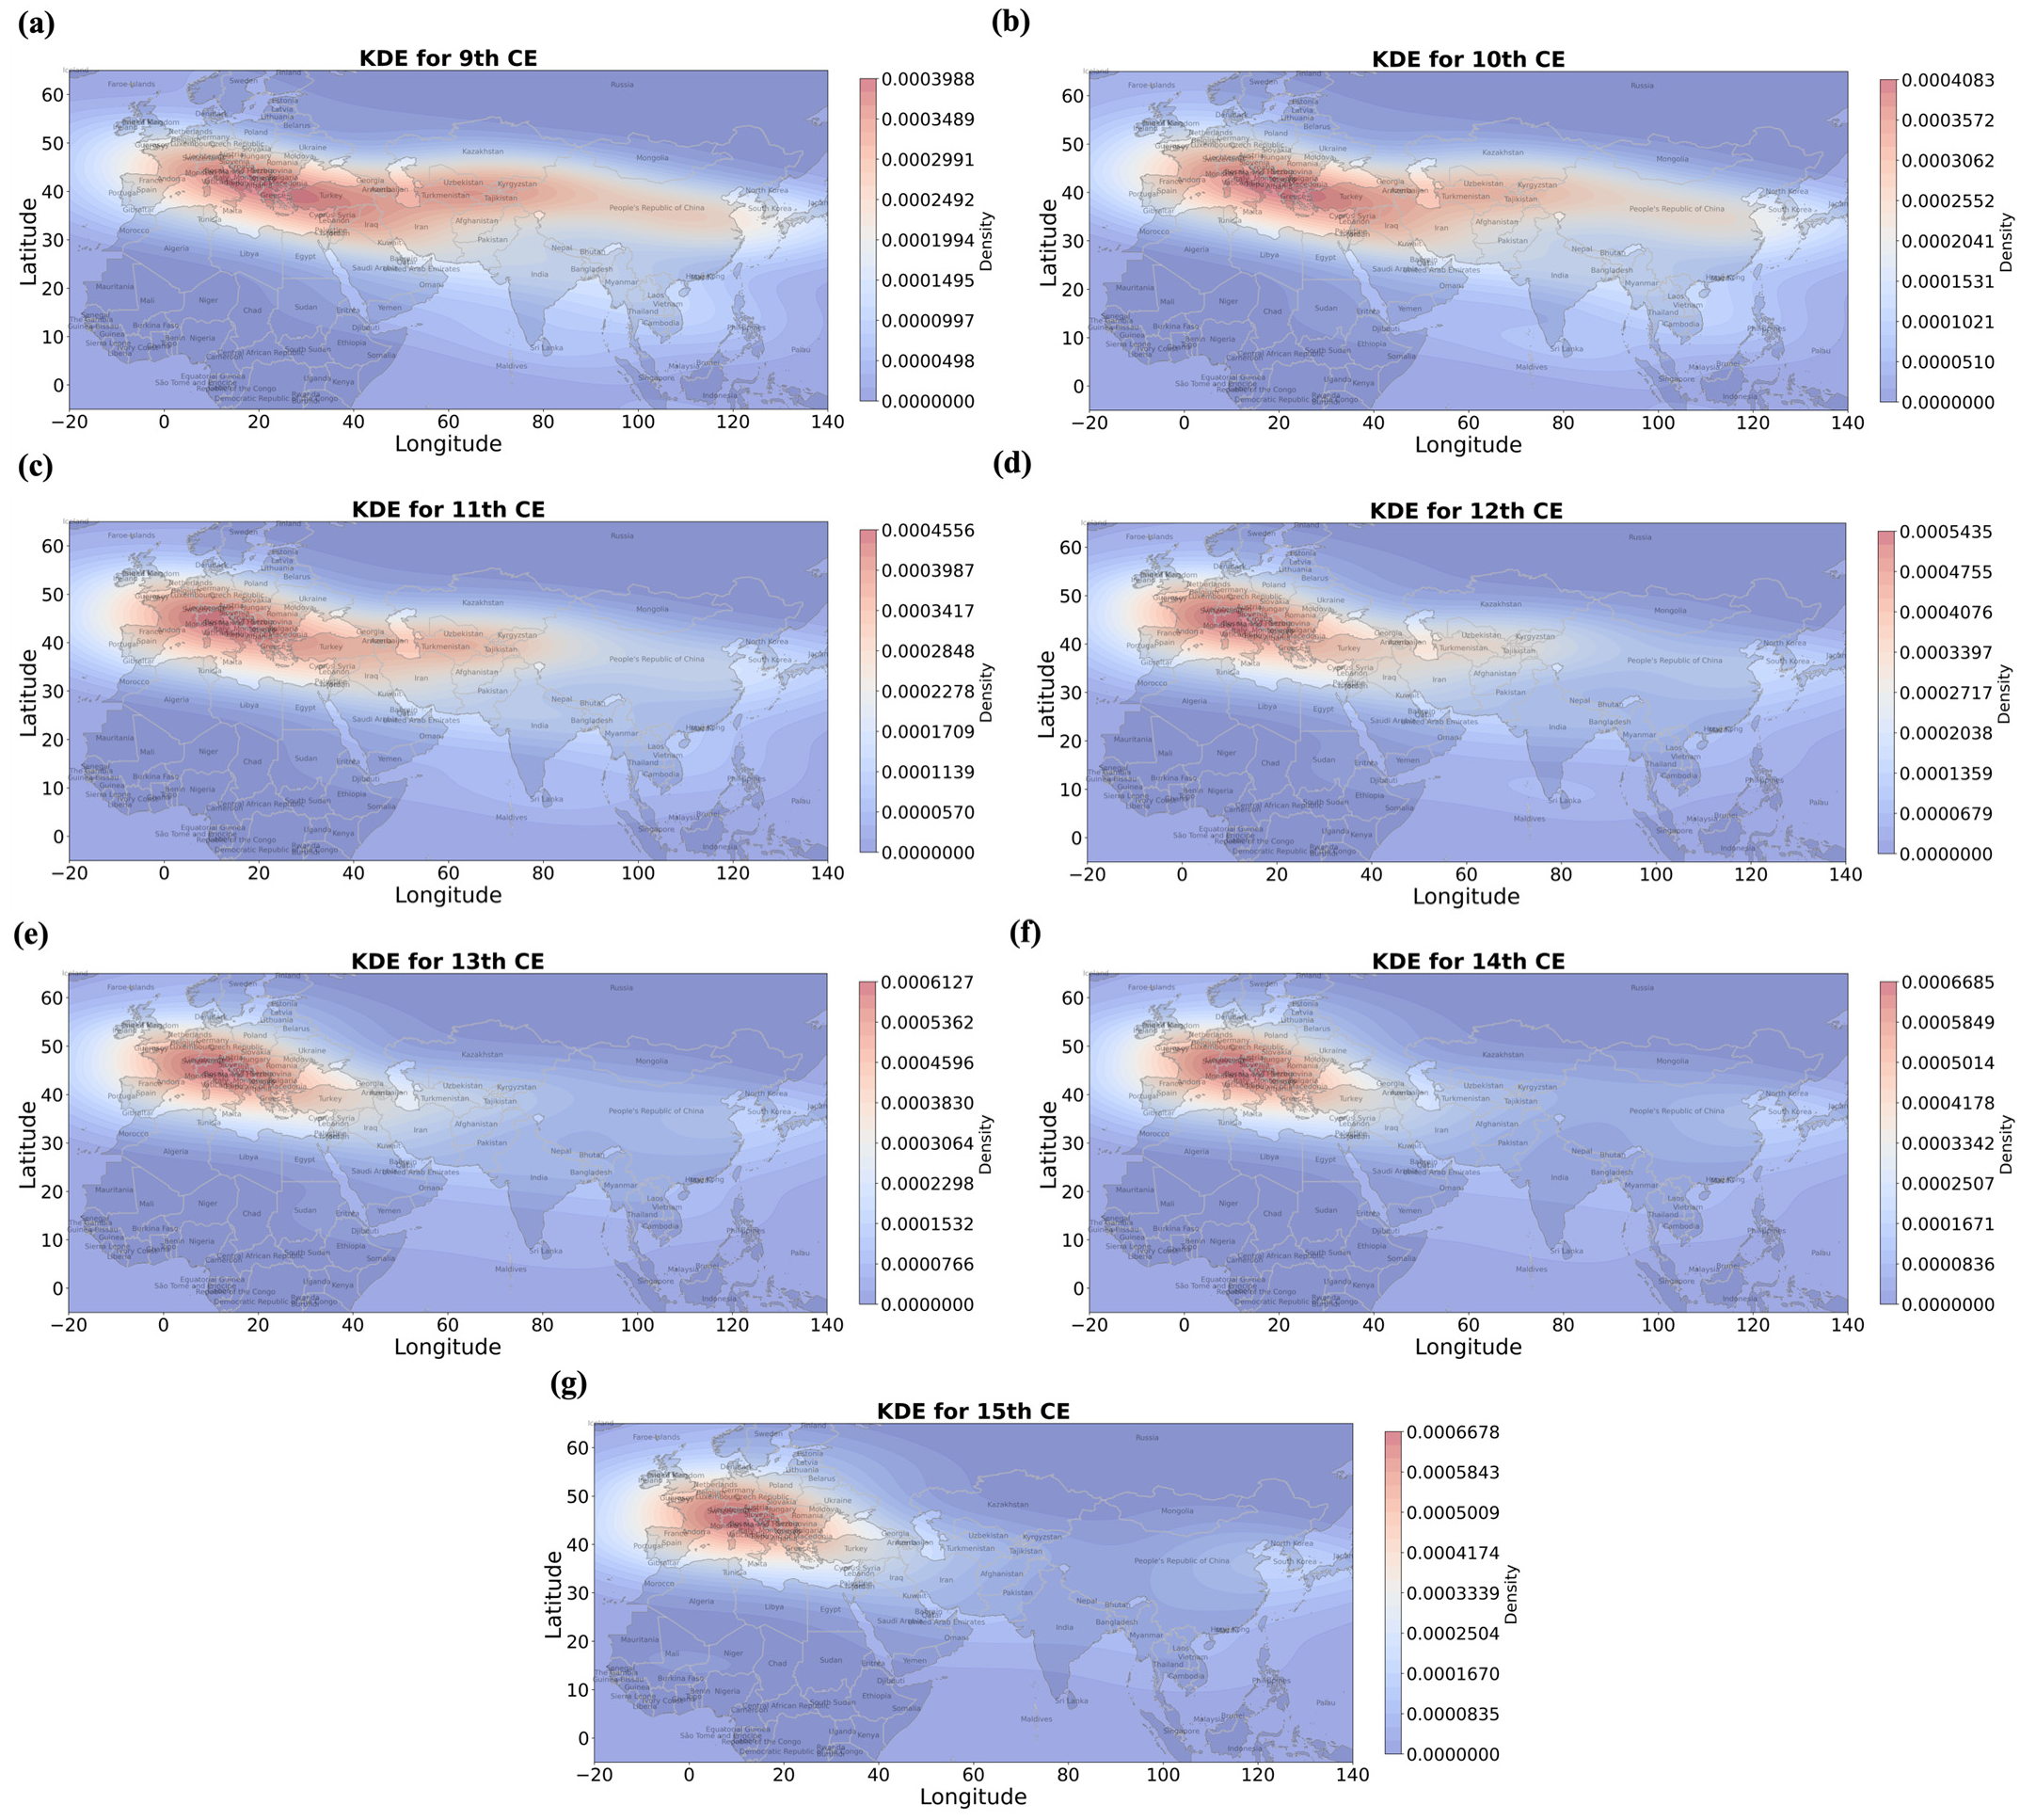
This section uses heatmap visualization to present the spatial clustering of heritage sites across different centuries. KDE heatmaps are employed to estimate the probability density function of a random variable in continuous space. In the context of geographic data, the heatmaps visualize the density of data points (such as settlements or events) across a geographic area, highlighting where these points are concentrated. The heatmaps use color gradients to represent point density across different regions of the map, with warmer colors (e.g., red) indicating higher densities (more data points in each area) and cooler colors (e.g., blue) indicating lower densities. KDE heatmaps provide an intuitive visual summary of data point clustering within a geographical area.
From analyzing the Kernel Density heatmap, a consistent trend is identified. In the time span from the 2nd century B.C.E. to the 3rd century (shown in Figure 8), the heatmap displays a core concentration situated in the eastern Mediterranean region, expanding continuously in both eastern and western directions. The influence extends eastward through the Iranian Plateau into the Central Asian Transoxiana region, linking with the Yellow River Basin in China, and westward along the Mediterranean to the western Mediterranean region. Examining the cultural landscape depicted by the heatmap, the Greek–Roman cultural sphere, focalized in the eastern Mediterranean, demonstrated robust external connections during this era, notably interacting with the cultural zones of the Mesopotamian region and Central Asia [33]. Furthermore, the cultural realm of the distant Chinese region, positioned in the east, was impacted by this cultural interchange centered on the eastern Mediterranean, marking the nascent stages of cross-cultural exchanges among major empires.
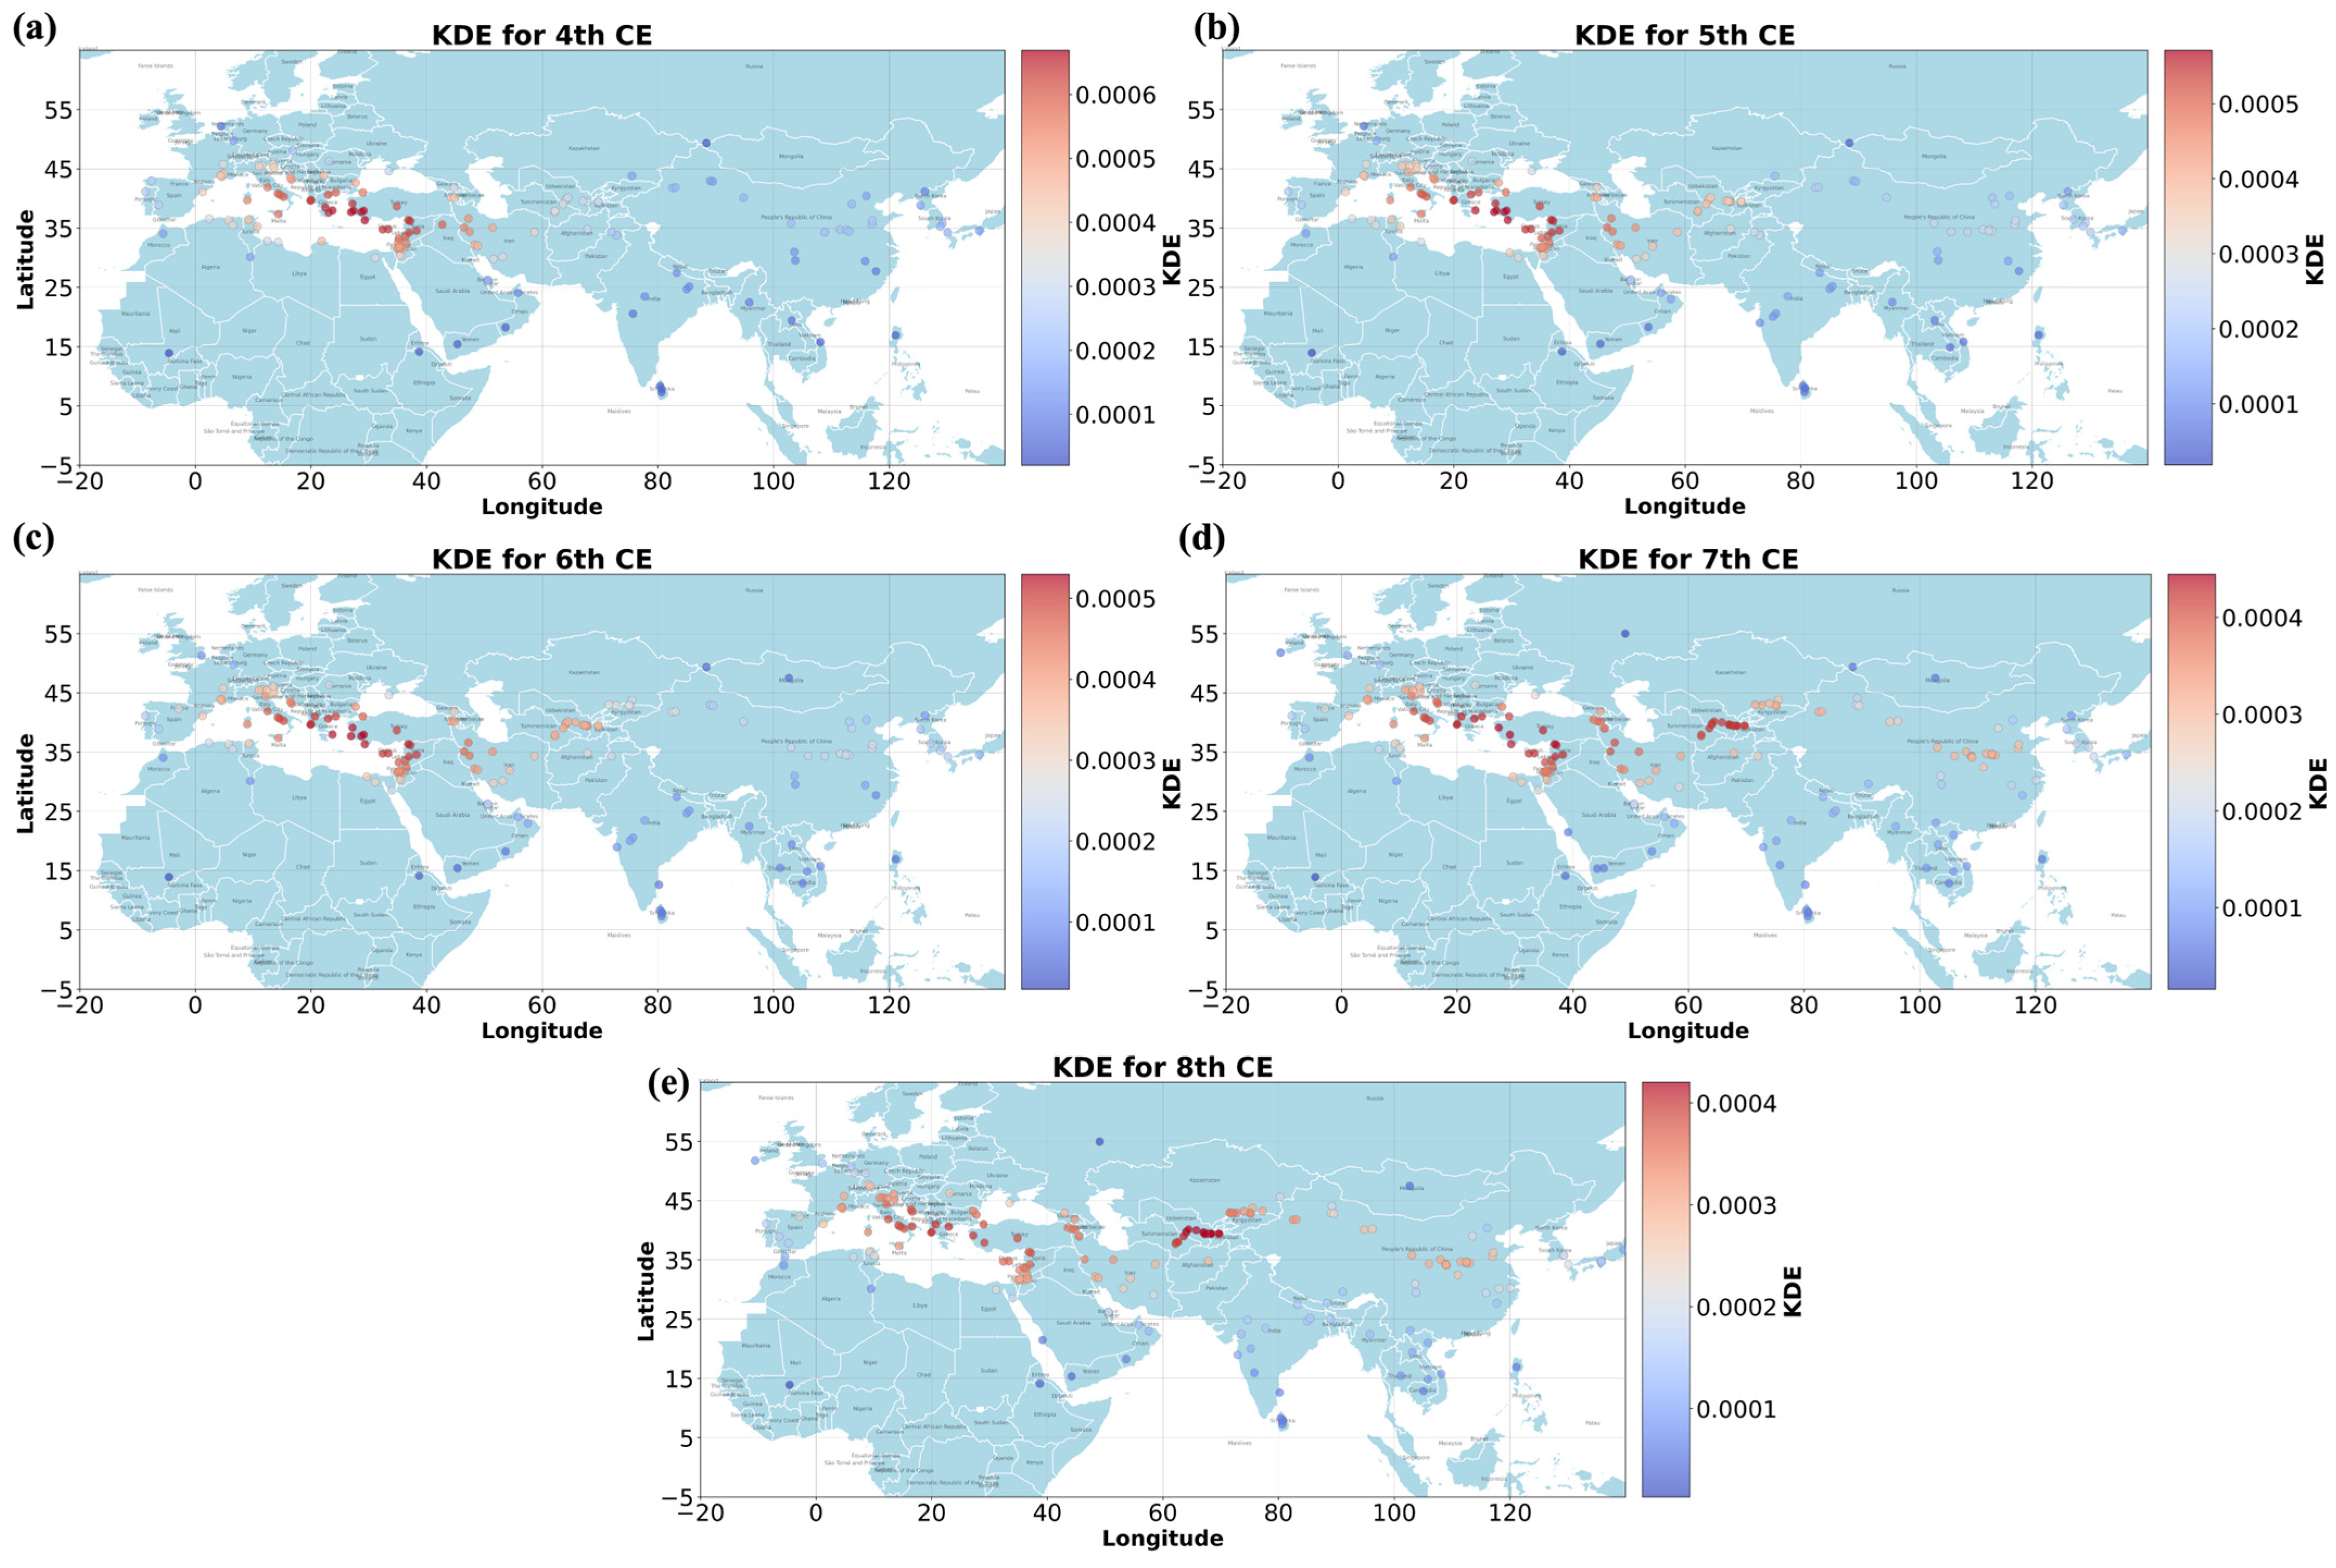
The Kernel Density heatmaps (shown in Figure 9) from the 4th to 8th centuries illustrate a transformative shift from a singular core initially centered on the eastern Mediterranean region to an extensive expansion in both easterly and westerly directions. This reconfiguration establishes a dual-core pattern encompassing the eastern Mediterranean–Mesopotamian region, and the Central Asian Transoxiana region, along with the Yellow River Basin in China emerging as a focal point, signifying a general shift towards the east. The former epitomizes the Near Eastern cultural realm, focusing on the eastern provinces of the Roman Empire and later the Byzantine Empire, situated amidst the Black Sea, Caspian Sea, Persian Gulf, Red Sea, and the Mediterranean—historically, a thriving hub and a key cultural center along the Silk Road network in classical antiquity [34]. The latter symbolizes the Central Asian cultural sphere, demonstrating remarkable prosperity and emphasizing the evolution of urban civilizations in the Central Asian Transoxiana region along the early medieval Silk Road, highlighting the crucial role of the Sogdian merchant network in facilitating East–West exchanges [35]. Notable bright areas in the heatmap extend eastward into the core of East Asia, establishing local hubs in the lower Yellow River region of China, showcasing the prosperity of Chinese culture and its interactions and amalgamations with other significant cultural spheres across the Eurasian continent [36].
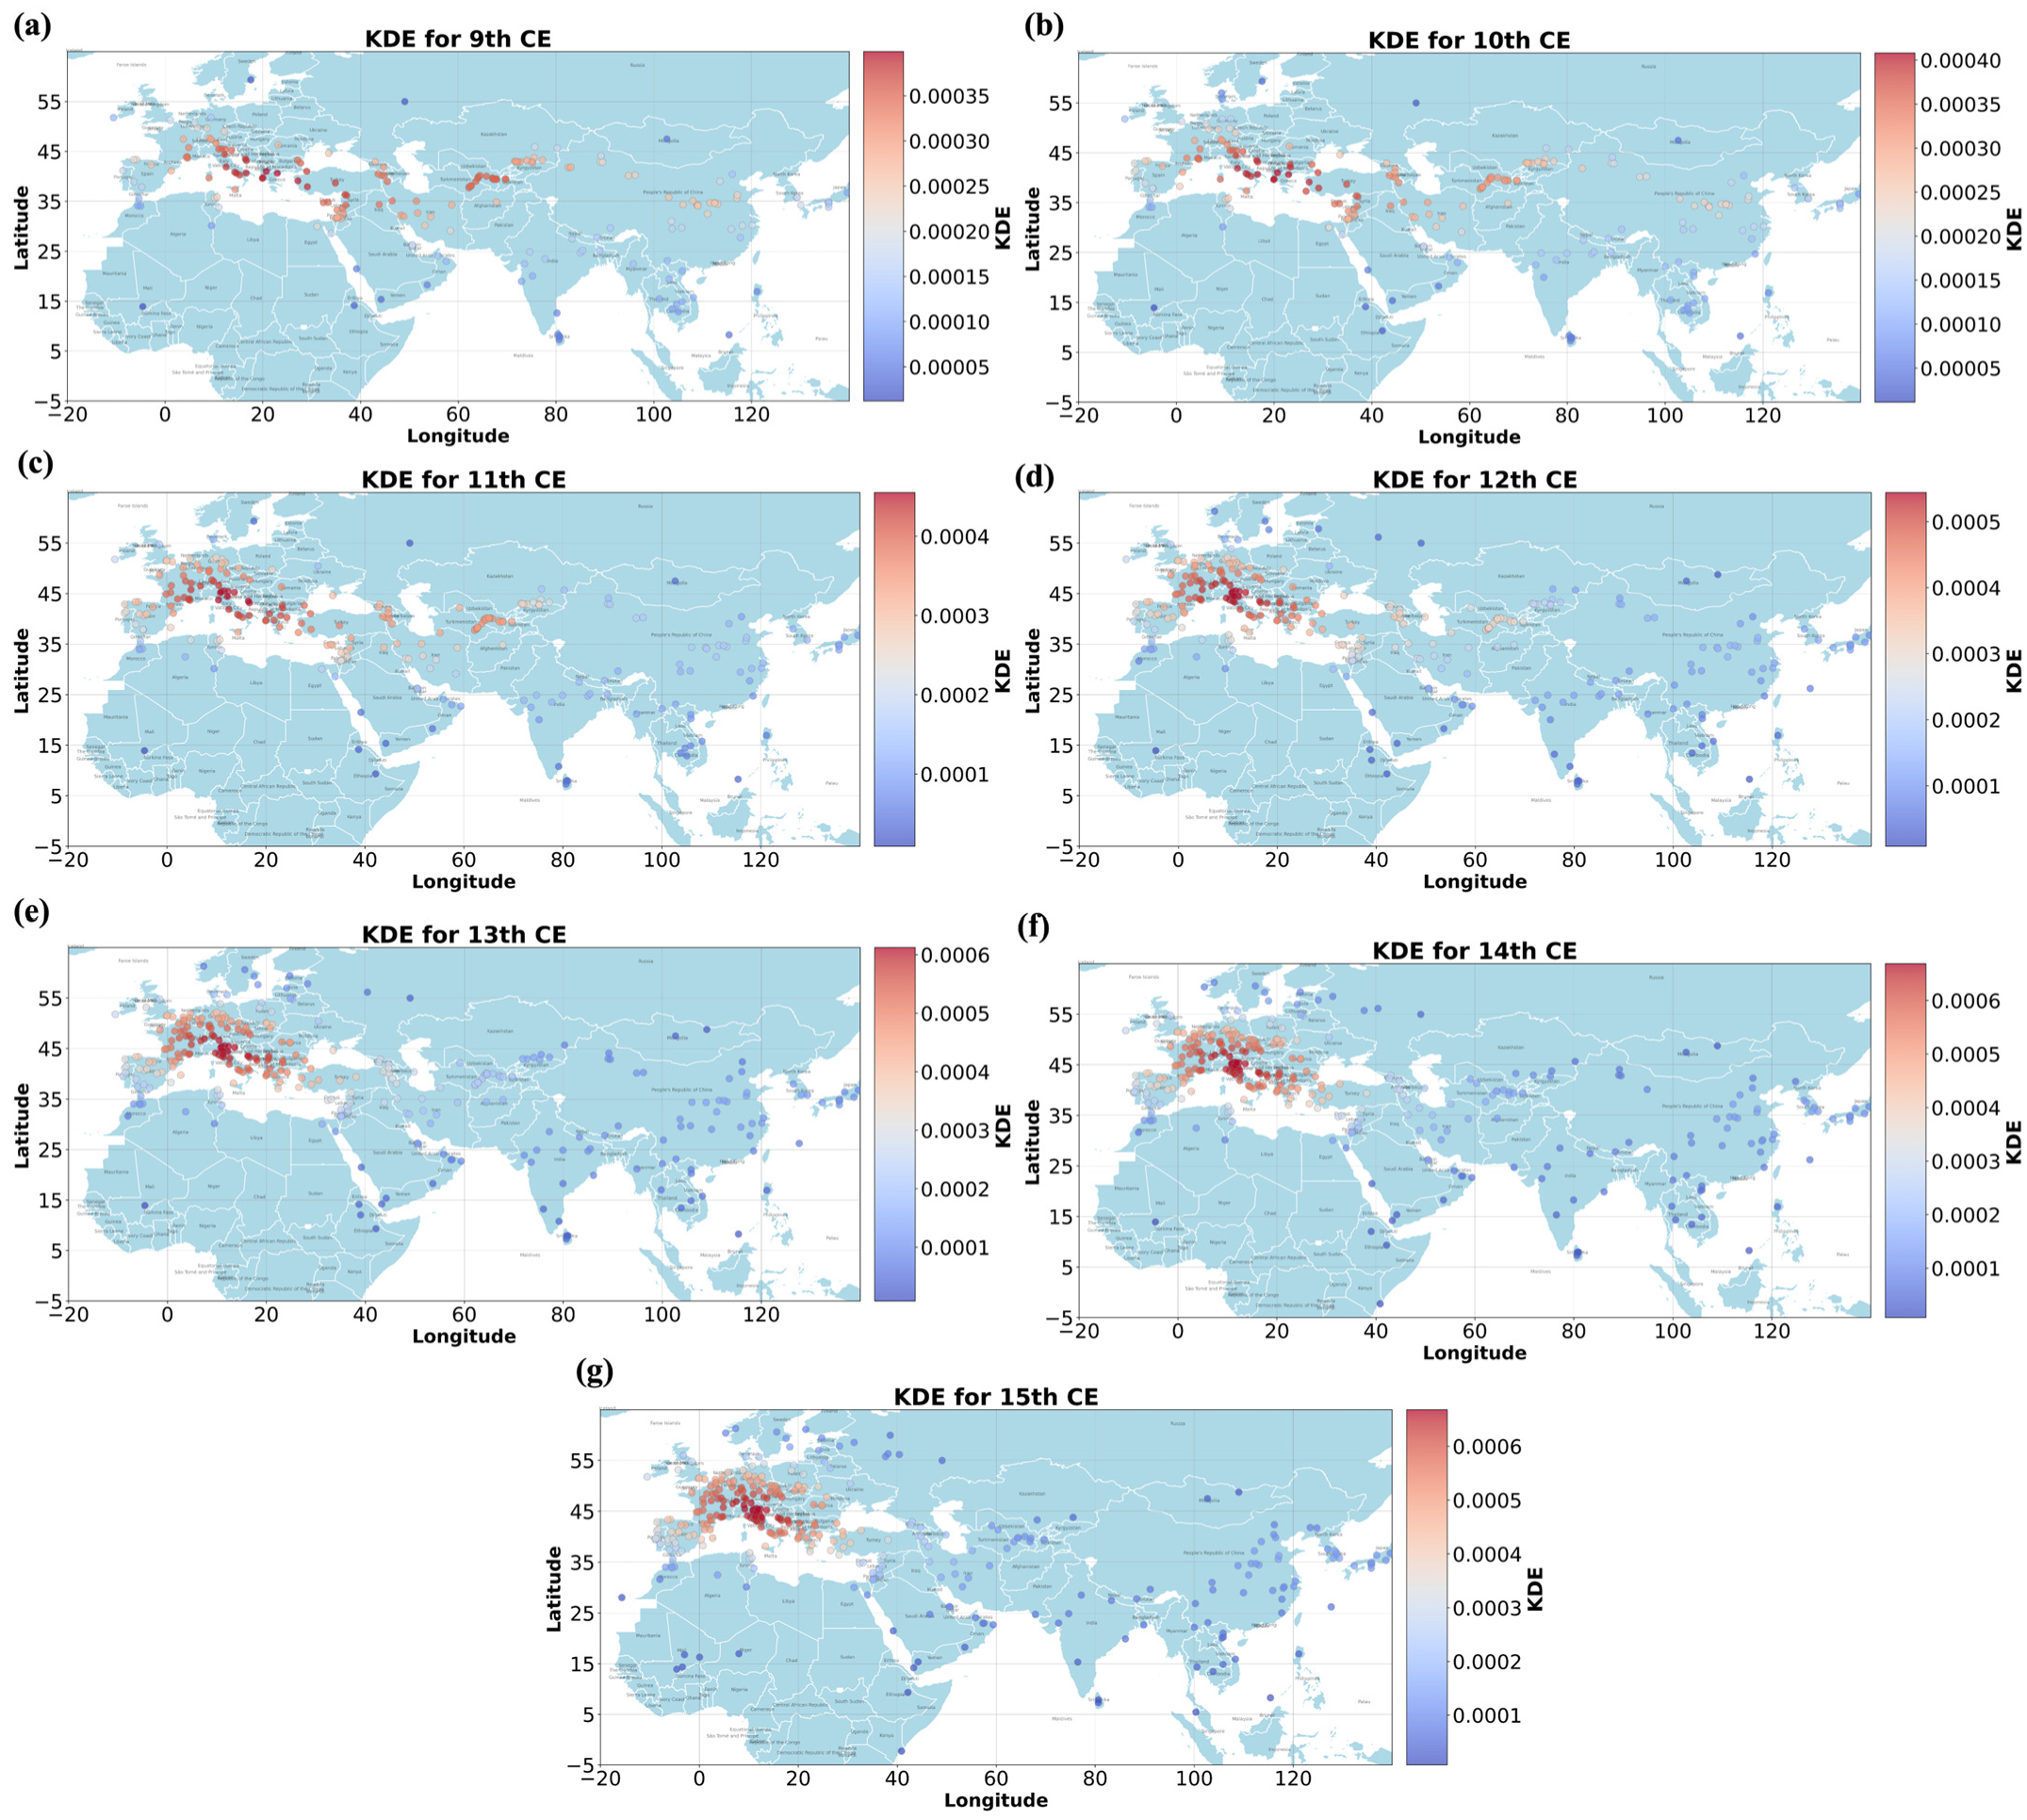
The trend from the 9th to the 15th centuries indicates a notable decline in the Kernel Density heatmap of Central Asia and China (shown in Figure 10). This period can be segmented into two phases. Between the 9th and 11th centuries, the Silk Road continued its exchange patterns, showing cycles of prosperity and decline. The heat centers steadily shifted westward, with the focus in the Yellow River Basin of China weakening and shifting towards the southeast. Notably, during this time, the once significant heat centers in Syria and Iraq, along with the Central Asian Transoxiana region, experienced diminishing intensity and a westward shift, no longer maintaining distinct independent heat centers. Key historical events in Central Asia during this era included the Arab conquests and the unrest of the late Tang and Five Dynasties, which replaced eastern influences with those of the Arab Empire in the west [37]. In contrast, the Kernel Density heatmap from the 12th to the 15th century depicts a dual-center pattern with Europe and East Asia emerging as focal points on the Eurasian continent’s eastern and western sides. These centers operate largely independently, with Europe exhibiting a higher clustering level compared to East Asia. This era marked the rise of the Italian Renaissance and foreshadowed the Age of Discovery, originating from Western Europe. The economic prosperity of the Renaissance was fueled by the ascent of Italian city-states in the late 12th century, potentially planting the seeds of modern capitalist systems [38]. Conversely, the eastern and central regions of the Eurasian continent were besieged by conflicts linked to the Crusades, Mongol conquests, and the Timurid era wars [39]. Economic trade flourished primarily in East Asia and Southeast Asia, bolstering the prosperity of the East Asian cultural sphere (Confucian cultural circle). The disruption of the Silk Road trade severed connections running along the 40th parallel to Central Asia, hindering east–west interactions at the Tibetan Plateau along the 30th parallel. Trade from the Western regions to the expansive Indian trading zone had to navigate the low latitude waters of Southeast Asia to engage with East Asia, depicting a distinct trading pattern from earlier epochs [40].
With the discovery of the Americas in 1492, the conventional SRN eventually evolved from a closed system to a global exchange network. Europe assumed a central role in this emerging global structure. It is anticipated that extending the research methodology of this study to encompass investigations of the Americas and Oceania post-1492 would require evaluating heritage sites in these regions, contributing to conclusions that reinforce Europe’s pivotal position in global exchanges [41].

3.3.2. Scatter Plot Visualization and Interpretation

This section uses scatter plots to visualize changes in heritage sites, providing a clear representation of individual data points and their exact locations on the map. This method is typically used to study the relationships between variables or to understand the spatial distribution of individual observations. In a scatter plot, each data point is represented by a dot on the graph. The position of the dot corresponds to the exact coordinates of the observation. In this study, the red dots represent denser locations, while the blue dots indicate more dispersed area. This section provides a more detailed description of the SRN’s heritage site compared to previous section.
The density analysis map of World Heritage Sites along the SRN from the 2nd century B.C.E. to the 3rd century (shown in Figure 11) reveals a significant emergence of new heritage sites in the eastern Mediterranean region, including the Greek city-states of Asia Minor along the Aegean Coast and the Levant region on the eastern Mediterranean coast, compared to other regions. Additionally, there is a notable increase in the density of heritage sites eastward from the Central Asian Transoxiana region between the 2nd century B.C.E and the 3rd century, marking the eastern path of the ancient Silk Road extending to East Asia. The connections among high-density sites exhibit an east–west alignment, stretching from the Western Mediterranean to East Asia [42]. The 3rd to 4th centuries mark a transitional period [43]. During this time, the density of heritage sites in the Western Mediterranean declined, while it continued to grow in the Aegean Sea, the Levant, Iran, and Central Asia [44]. Consequently, the fluctuations in the number of heritage sites from the 4th to the 8th centuries indicate a new trend: a reduction in heritage sites in Western Europe, continuous growth in the eastern Mediterranean, and the emergence of new areas of heritage site growth in Central Asia and Western China.
From the 4th to the 8th centuries, the analysis of the increase and decrease in the number of World Heritage Sites within the Silk Road network presents an intriguing scenario (shown in Figure 12). This period reveals noticeable transformations: a substantial decline in heritage site number is observed in the eastern Mediterranean, particularly around the Aegean Sea, North Africa, the Levant, and the Mesopotamian region. In contrast, there is a notable increase in heritage site number in the Central Asian Transoxiana region, East Asia, and Southeast Asia. The reasons for this change may lie in the fact that during this historical period, the fragmentation and fall of the Roman Empire led to prolonged periods of conflict and disunity in the Mediterranean region [45]. The collapse of the Western Roman Empire in 476 C.E. required the establishment of the Carolingian Empire by the Franks (771–814 C.E.) for stability to return to Western Europe. In the eastern Mediterranean, the Byzantine Empire engaged in protracted conflicts with the Sassanian Persians and the Arab Empire in the Levant and North Africa [46]. Climatically, the primary regions of the Silk Road network encountered cooling events during the 3rd to 6th centuries. A distinctive trend in climate change from lower to higher annual average temperature with notable fluctuations had a notable impact on North Africa, resulting in a continual decrease in heritage sites from the 4th to the 8th centuries [47,48]. Consequently, there was a reduction in the number of Roman heritage sites in the western region. Despite the upheavals in East Asia during the Six Dynasties, factors such as the introduction of Buddhism, the flourishing Sui and Tang dynasties, and the growth of thriving Sogdian merchant communities significantly bolstered trade and cultural exchange in the area [49]. The connections among high-density points formed a spindle-shaped pattern extending from northeast to southwest, with primary concentrations in the eastern Mediterranean and Central Asian Transoxiana region.
The 8th to 9th centuries signify yet another transitional period [50]. During this time, the increase in heritage sites in Central Asia and Western China stagnated, while the number of sites in Eastern China further declined. As a result, the SRN centered around the eastern Mediterranean, Iran, and Central Asia experienced an interruption in the trends of increasing and decreasing heritage sites observed from the 4th to the 8th centuries in various regions of the Silk Road. Meanwhile, the number of heritage sites in Western Europe, including present-day France, Germany, and Northern Italy, significantly increased. Consequently, the Silk Road underwent a historical decline from prosperity between the 9th and 15th centuries, a significant transformation that can be further divided into two stages: the 9th to 11th centuries and the 12th to 15th centuries.
From the 9th to the 15th century, there was a steady rise in the number of heritage sites rooted in medieval Europe (shown in Figure 13). The pace of growth accelerated notably, surpassing all other regions by the 12th century. Compared to Europe, the number of heritage sites in the Levant, Mesopotamia, Central Asia, and Western China did increase during this era, but the density gap widened significantly. The interaction patterns of the Silk Road network persisted between the 9th and 11th centuries, characterized by fluctuations. While the Silk Road’s path remains visible on maps, the eastern segment from Central Asia through Xinjiang to East Asia progressively diminishes between the 12th and 15th centuries until its eventual disappearance [7].

4. Discussion

4.1. Analysis of Assumptions in the SRN Study

The study on the SRN comprehensively addresses the hypotheses that frame its investigation into the historical development and dynamics of the SRN. Firstly, the SRN is confirmed to have functioned as an enclosed and stable system from its formation after General Zhang Qian’s visit to Central Asia in the 2nd century B.C.E. until the end of the 15th century, when the advent of Christopher Columbus’s navigation to the Americas in 1492 transformed it into the GRN. This transition integrated a significant portion of the global population and resources, marking the evolution from a closed to an open system. Secondly, the study utilizes heritage sites listed by UNESCO as precise indicators of the SRN’s prosperity and historical significance. By creating a geographic information database of these SRN sites, the study reconstructs the SRN routes with a higher degree of accuracy than documentary sources. This approach assumes that heritage sites, which once existed and flourished, effectively reflect the prosperity of the SRN’s interaction system. Lastly, the network density between these heritage sites is used to mirror the network density of the SRN itself. By employing spatial analysis, the study illustrates the distribution and evolution of heritage sites, revealing varying levels of route usage and significant historical interactions. This method highlights how different regions within the SRN experienced distinct impacts during periods of climate change, reinforcing the study’s assumptions. Overall, the research methodically validates the hypotheses that the SRN was an enclosed and stable system, that heritage sites reflect its prosperity, and that their network density accurately represents the SRN’s network density.

4.2. Analysis of Relevant Elements on SRN Heritage Sites

By comparing the evolution of the Silk Road network (SRN) across three major historical periods following its establishment in the 2nd century B.C.E., this study analyzes the intrinsic factors driving SRN changes.

4.2.1. Climate Change on the SRN

Based on the findings, significant spatial changes in many heritage sites are revealed. The heritage sites mentioned in this study can also be understood as traces of past human habitation, such as settlements. Climate change is a major natural factor influencing the evolution of the SRN. The alternation of warm and cold periods, driven by global climate fluctuations, has had a significant impact on SRN regions, particularly in the mid- to low-latitude areas of the Eurasian continent and the Mediterranean coast. Research indicates that climate fluctuations, particularly in precipitation and temperature, significantly influenced the rise and fall of civilizations in the arid regions of Central Asia. Warm and humid climates contributed to the rise of empires, while deteriorating climates led to the decline of civilizations and the abandonment of cities [36]. Moreover, fluctuations in precipitation levels also affected the rise and fall of trade routes and urban centers along the Silk Road in Central Asia. Wet periods promoted urban expansion, while dry periods hindered the development of these networks [51]. Further research reveals that long-term climate changes, such as mega-droughts, delayed or altered patterns of human settlement and cultural exchange along these routes [39]. However, the effects of climate on human activities may display a temporal lag. Furthermore, the effects of short-term climate changes on SRN alterations may not be immediately apparent. Therefore, the timing of climate change does not necessarily align with changes in the SRN. According to the three historical periods delineated in this study, the following general trends emerge [52]:
Classical Period Warming (2nd century B.C.E to 3rd century): During this period, the main SRN regions experienced higher average temperatures compared to the modern climate (represented by 1950). Until the 3rd century, the overall climate trend gradually shifted from warm to cold.
Post-Classical and Early Medieval Climate Fluctuation (4th to 10th century): After experiencing cooling during the 3rd to 4th centuries, the main SRN regions had average temperatures lower than those of modern climate. During these periods, the general trend was a temperature increase from a lower average, accompanied by significant fluctuations. This trend continued until a sudden rise in the latter half of the 8th century, which exceeded modern climate levels and persisted until the 10th century.
Late Medieval Cooling (11th to 15th century): This period was characterized by several major temperature drops (12th, 14th, and 15th centuries), leading to a slow cooling process. Temperatures declined from a peak around 1000 C.E. to a low around 1300 C.E., followed by a gradual increase, with more dramatic fluctuations compared to the first period.
This analysis highlights how climate change significantly influenced the development and shifts in the SRN, with different regions experiencing varied impacts during cooling and fluctuation periods.
Analysis using Kernel Density heatmaps reveals that during the warm period of the Classical Era, the SRN exhibited dominance in the eastern Mediterranean dominance and extended both east and west. This period was characterized by a high density of heritage sites centered in the eastern Mediterranean. During the Late Medieval Cooling, the SRN exhibited western dominance, with a high density of heritage sites in Europe. Conversely, during the climate fluctuation periods, the SRN showed a “dual-core” characteristic, with significant centers in the Near East and Transoxiana (Central Asia).
Considering the movement of the network’s central points, it is evident that during the first and third periods, the central points shifted westward, while during the second period, they shifted eastward. This indicates the substantial impact of climate change on different civilization regions within the Eurasian continent.
If the historical periods of the Eurasian continent are classified into the warm period, the cooling period, and the climate fluctuation period, the former corresponds to continuous temperature changes, while the latter corresponds to the fluctuation period. These periods impacted the main regions of the SRN, namely the eastern, central, and western parts of the mid- to low-latitude Eurasian continent and the Mediterranean coast. Notably, during the warm periods, both the eastern and western parts of the Eurasian continent experienced sustained development. However, Western Europe, being closer to the eastern Mediterranean, progressed at a faster rate, and the central points were westward [53]. During the prolonged cooling period, major civilization regions primarily faced significant challenges due to persistent cooling trends. In the western part of the Eurasian continent, characterized by maritime and Mediterranean climates, temperature drops could lead to reduced agricultural production, a shift towards more cold-resistant crops, and the exploitation of marine resources like fish [54]. In the temperate monsoon climate zone of the eastern Eurasian continent, the prolonged cooling period could cause severe cold, threatening agriculture and population, and the central points were also westward. This examination underscores how warm, cooling, and fluctuation periods had distinct and significant impacts on the historical development of the SRN and its regions.
Comparatively, the continental climate of central Eurasia was more severely affected by cooling periods, whether in the context of long-term or short-term cooling, potentially leading to interruptions in agricultural production or shifts to alternative livelihoods [48]. However, the inhabitants of this region were likely better adapted to cold climates than those in other climatic zones. During the cooling phases, they could change their livelihoods or migrate to cope with climate changes. Following the significant temperature drop at the end of the Classical Period, nomadic groups from the inland continental climate zones moved south, threatening the agricultural civilizations of East Asia and the Mediterranean world.
The Near Eastern civilization regions at the junction of Eurasia and Africa, and the Indian subcontinent, fall under subtropical desert climates and tropical monsoon climates, respectively. Cooling periods facilitated cultural development in these regions. Consequently, during the cooling period of the Classical Era, these areas were interconnected via the maritime Silk Road, becoming significant regions within the SRN.
During climate fluctuation periods, the greatest challenge faced by major civilizations was sudden cooling. There are records of abrupt cooling in the post-Classical and early Medieval periods, often linked to significant historical events. The severe impact of climate fluctuations during these periods frequently led to cross-civilization interactions. Compared to Western Europe and the Mediterranean, East Asia and Central Asia may have exhibited a greater adaptive capacity to sudden climate fluctuations. For example, during the severe cooling of the 3rd to 4th centuries, the Western Roman Empire completely collapsed, leading to significant decline in Western Europe and North Africa [55]. These areas gradually recovered with the arrival of another prolonged warm period in the 8th century. In contrast, while East Asia also experienced political crises due to the cooling in the 3rd to 4th centuries, the region’s greater longitudinal extent, crossing multiple climate zones, allowed for the preservation of governance and civilization in the southern regions, enabling rapid recovery in the next warm period [56].
During climate fluctuation periods, the short durations of each warming and cooling phase meant that East Asian states, benefiting from a larger north–south expanse, were not uniformly affected by climate changes across all zones [57]. The variability in climate impact allowed some regions within East Asia to adapt better to changes, leading to a more resilient response to these fluctuations [58]. Consequently, they exhibited greater adaptability to climatic variations than Western Europe and the Mediterranean. If the period surrounding the climate fluctuation period (the second period) was characterized by a gradual rise in average temperatures, the most significant difference between the two 800-year-apart continuous temperature-changing periods is the substantial climate fluctuations in the latter. The combined effects of warming, prolonged cooling, and significant climate fluctuations could lead to paradigm shifts in historical development. This period facilitated the transformation of the SRN into the GRN, establishing Europe’s central role within the SRN.
During the two continuous temperature changing periods, especially the late medieval period with significant climate fluctuations, Europe emerged as the SRN hub. This reflects the resilience of the maritime and Mediterranean climates in Western Eurasia to climate change. This resilience is due to several factors: First, Europe’s proximity to the North Atlantic Drift brings a stable, warm, and humid climate, making it milder than other regions at similar latitudes, thus maintaining stability during long lasting periods [59]. Second, the main characteristics of a maritime climate are warm winters and cool summers. The ocean’s high heat capacity moderate’s temperature changes, allowing Europe to remain stable during sudden cooling [60]. Lastly, the Mediterranean climate features wet winters and dry summers, providing the region with abundant agricultural and natural resources. These resources can be stored, helping society and the economy better withstand adverse climate impacts.

4.2.2. Historical Events and Heritage Site Dynamics on the SRN

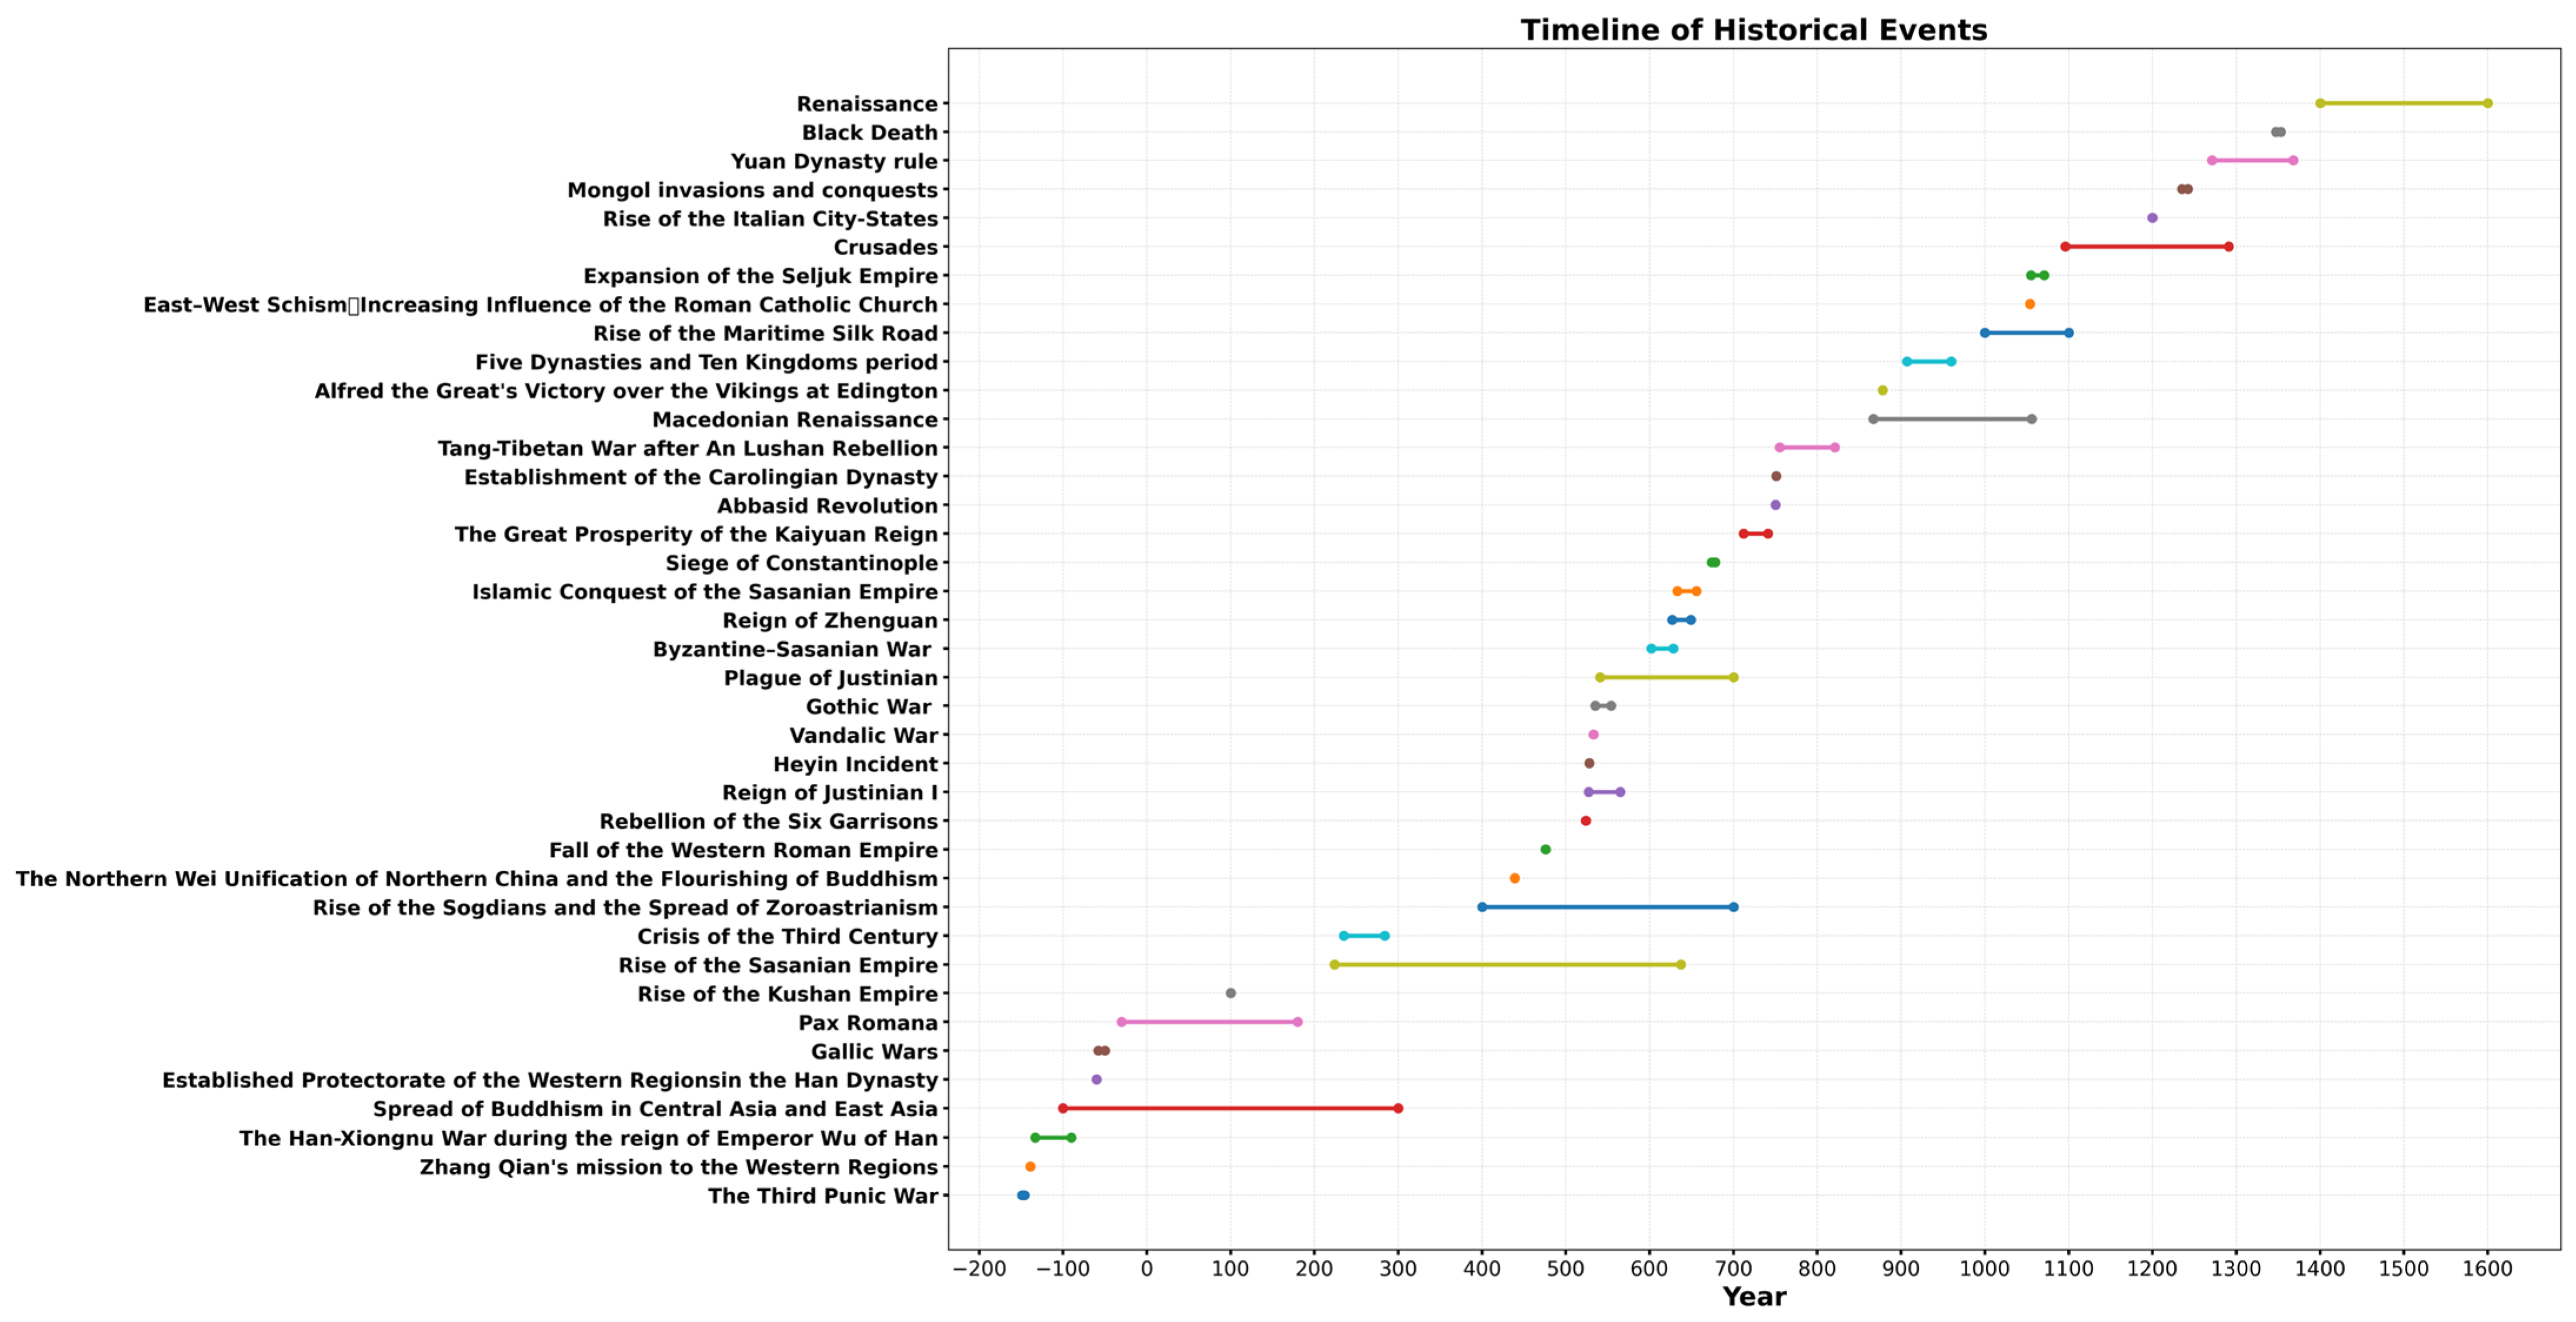
Human activities had a profound impact on the changes in the SRN and heritage site locations [61]. Key driving factors included trade, the spread of religion, war, and political changes [62]. This study organizes these factors into a table and uses visualizations to display the timelines of different events (as seen in Figure 14), aiming to connect these with the developments of SRN heritage sites, particularly with the findings discussed in the previous section. Special attention is given to political events: the rise and fall of various civilizations and empires continually altered the main routes and nodes of the Silk Road. For example, the expansion of the Arabian Empire and the prosperity of the Tang Dynasty facilitated exchanges between Central Asia and China, while the unification under the Mongol Empire further strengthened East–West links [63]. These activities caused the rise and fall of cities and sites along the route, exemplified by the prosperity of Samarkand and Balkh during different periods [64].
From the 2nd century B.C.E. to the 3rd century, key historical events significantly influenced the establishment and consolidation of the SRN. Zhang Qian’s mission to the Western Regions (139 B.C.E.) marked Han China’s direct involvement in the Silk Road trade, promoting East–West exchange of goods and culture [65]. The Han Dynasty’s establishment of the Protectorate of the Western Regions (60 B.C.E.) further secured and facilitated Central Asian trade routes [65].
The Roman Republic’s expansion, through the Third Punic War (149–146 B.C.E.) and the conquest of Gaul (58–50 B.C.E.), established Roman dominance in the western Mediterranean [66,67]. This period also witnessed the spread of Buddhism into Central Asia and China, enhancing cultural exchanges along the Silk Road.
Heritage sites from this period are concentrated in the eastern Mediterranean, Central Asia, and China, reflecting vibrant trade and cultural interactions facilitated by these significant events.
From the 4th to the 8th century, SRN site density fluctuated due to climate changes and political upheavals. The decline of the Roman Empire and the rise of the Byzantine Empire marked significant shifts in the SRN’s western regions. The Justinian Plague (541 C.E.) and prolonged Byzantine–Sassanian conflicts disrupted stability, reducing heritage site density in the eastern Mediterranean [68].
In contrast, the stability of the Sassanian Empire in Iran and the flourishing Sogdian trade network in Central Asia contributed to the persistence and growth of heritage sites in these regions [69,70]. The spread of Buddhism continued to influence the establishment of religious sites along the SRN [71].
From the 9th to the 15th century, significant transformations in the SRN occurred due to the rise and fall of various empires and the impact of pandemics. Arab conquests and the establishment of trade routes under Islamic rule enhanced connectivity between the Mediterranean, Central Asia, and China [72]. The reunification of China by the Tang Dynasty and the establishment of the Silk Road as a major trade route promoted the growth of heritage sites in East Asia [73]. Interactions between the Byzantine Empire, Islamic Caliphates, and Tang Dynasty facilitated the exchange of goods, ideas, and culture, resulting in a high density of heritage sites in the Near East, Central Asia, and China.
From the 11th century onwards, significant transformations occurred in the SRN. The rise of the Mongol Empire under Genghis Khan and his successors created a vast, unified territory, enhancing the safety and efficiency of the Silk Road trade routes [74]. The Pax Mongolica (13th to 14th Century) increased commercial and cultural exchanges across Eurasia, reflected in the high density of heritage sites in Central Asia and China [75]. The decline of the Mongol Empire and the onset of the Black Death (1346–1353) caused trade disruptions and shifted the SRN center towards Western Europe [76]. The Renaissance in Italy and the Age of Discovery marked the decline of the overland Silk Road and the rise of maritime trade routes [77].
The evolution of the SRN’s sites is closely linked to significant human activities and specific historical events. From the expansion of empires and the spread of religions to climatic changes and pandemics, these factors shaped the spatial patterns and density of heritage sites along the SRN. Understanding these relationships provides valuable insights into the long-term impact of the Silk Road on cultural and economic exchanges between the East and the West [7].

4.3. Limitations

While this study provides a comprehensive analysis of the Silk Road network (SRN) using UNESCO World Heritage sites to reconstruct SRN routes, it has notable limitations. One significant limitation is the uneven distribution of heritage sites across different regions. Europe has a disproportionately high number of heritage sites compared to regions like Central Asia, the Near East, and East Asia. This imbalance could introduce bias, leading to an overrepresentation of European sites and potentially skewing the interpretation of the SRN’s historical significance and network density. Consequently, the heritage site density in Europe might not accurately reflect the actual historical network density of the SRN across all regions.
Despite valuable insights into the clustering and dispersion patterns of sites from the 2nd century B.C.E. to the 15th century, several limitations persist. The sensitivity of the DBSCAN algorithm to parameter settings can yield different clustering outcomes based on the chosen parameters. Interpreting silhouette scores is challenging, as low scores may reflect the intrinsic nature of spatial distributions rather than poor clustering quality. Furthermore, variations in data collection methods and preservation conditions may introduce biases, and the complexity of environmental and social factors is difficult to fully capture, leading to potential interpretative biases.
Future research might consider incorporating additional data sources or applying normalization techniques to address discrepancies, ensuring a more balanced and representative analysis of the SRN’s historical development and interactions. Additionally, future studies should integrate finer temporal and spatial data, ensure data quality and consistency, and employ multiple methods to validate results. This approach will enhance the reliability and accuracy of clustering analysis.

4.4. Recommendations for Enhanced Conservation and Management

This study analyzes SRN heritage distribution across centuries, revealing changes in clustering patterns over time. Using multiple methods, the research mapped the spatiotemporal evolution of settlements and identified areas of significant historical activity. The discussion links these findings to relevant historical events, hypothesizing reasons behind the observed changes in settlement patterns. These findings highlight the significant impact of historical trade routes on settlement development and land use patterns. Analysis of site clustering reveals that these clusters are not merely geographic concentrations but represent key nodes in the historical Silk Road network. The connections between these nodes form a crucial network structure for trade and cultural exchange. Based on the identified settlement clusters, recommendations are made to preserve and enhance the connectivity of cultural landscape heritage. The proposed conservation strategies focus not only on preserving individual sites but also on maintaining the integrity of the entire SRN [78]. Here are three recommendations:
  • Prioritize Conservation Based on Spatial Clustering: Prioritizing conservation efforts using spatial clustering is vital for managing heritage landscapes along the SRN. This method preserves not only the physical integrity of sites but also the continuity of the heritage landscape and its historical narrative. Spatial clustering analysis allows for a transition from protecting isolated sites to adopting a more comprehensive strategy that safeguards entire clusters of heritage sites. By concentrating on clusters of significant cultural and economic activity, conservation efforts can more effectively preserve historically interconnected sites, thus maintaining the network’s overall integrity.
  • Enhance and Protect Regional Connectivity: Regional connectivity is crucial to the formation and sustainability of the Silk Road network. Preserving connections between historical sites is not only essential for individual site protection but also for maintaining the coherence of the entire network. This helps in comprehensively understanding the cultural and historical significance of the heritage. To enhance protection, establishing buffer zones around high-density clusters may be necessary. These zones act as safeguards, preventing modern developments from disrupting the historical context and spatial relationships critical to the evolution of these heritage landscapes.
  • Foster Transnational Collaboration: Beyond these protective measures, strategies to maintain and strengthen linkages between heritage sites are crucial. Notably, transnational linkages, such as the bid for the Routes Network of the Chang’an–Tianshan Corridor, highlight the importance of multinational cultural heritage and cooperation [79]. Preserving historic routes and preventing modern infrastructure from disrupting these connections is vital to maintaining the Silk Road network’s historical and cultural integrity. Such strategies are integral to a holistic approach to heritage conservation, ensuring that both the tangible and intangible aspects of the Silk Road’s cultural heritage are preserved for future generations.

5. Conclusions

This study provides a detailed analysis of the Silk Road network (SRN) by utilizing data from the UNESCO’s World Heritage Sites to reconstruct its historical routes and understand its evolution. The research demonstrates the SRN’s function as a closed and stable system from its establishment in the 2nd century BCE until the 15th century when it transformed into a global network. The use of heritage sites offers a precise reflection of the SRN’s prosperity and historical significance, and the network density between these sites effectively mirrors the network density of the SRN itself. The understanding of the SRN’s historical development and its role in facilitating cross-cultural exchanges is significantly enhanced by these findings.
The study utilizes spatial and statistical analyses, including Kernel Density heatmaps and spatial clustering, to draw its conclusions. The study reveals the spatial distribution of site clusters, offering an in-depth understanding of their key role in the Silk Road’s cultural network. The main findings validate previous assumptions and identify key factors driving changes in SRN heritage sites across different centuries, particularly climate change and human activities. It identifies trends in the evolution of the SRN over time, along with its changing spatial characteristics. These changes are characterized by a core area in the eastern Mediterranean during the Classical Period, a shift to a dual core in the eastern Mediterranean and Central Asia during the medieval period, and a subsequent transition to a European core in the late medieval period.
Preserving this network is crucial for maintaining its historical value; hence, the proposed conservation strategy emphasizes this aspect. Specifically, conservation efforts should focus on clusters of heritage sites with significant cultural and economic activity to preserve historically interconnected sites and maintain the integrity of the entire Silk Road network. Additionally, we should preserve and strengthen connections between heritage sites by implementing buffer zones around high-density clusters, safeguarding the network’s coherence, and preventing modern developments from disrupting historical routes and spatial relationships. Finally, we should encourage and support transnational linkages, such as multinational cultural heritage initiatives, to ensure the continued protection of the Silk Road’s historical and cultural integrity through cooperative efforts.
Overall, the practical value lies in providing a more accurate representation of the SRN compared to traditional documentary sources, thanks to the precise geographic and historical data of the heritage sites. The innovative insights include demonstrating how different regions within the SRN experienced distinct impacts during periods of climate change, and how the network density between heritage sites reflects the SRN’s overall network density. This research addresses the practical problem of reconstructing historical trade routes and has potential applications in historical geography, archeology, and cultural heritage preservation.

Author Contributions

Conceptualization, X.W.; methodology, Y.S.; software, Y.S.; validation, Y.S., J.L., J.H. and X.W.; formal analysis, J.L. and J.H.; investigation, J.H.; resources, J.H.; data curation, J.L. and J.H.; writing—original draft preparation, Y.S. and J.H.; writing—review and editing, X.W. and J.L.; visualization, Y.S.; supervision, X.W.; project administration, X.W.; funding acquisition, X.W. All authors have read and agreed to the published version of the manuscript.

Funding

This research was funded by the 2023 Shaanxi Provincial Cultural Relics Protection and Utilization Major Issues (2023HZ1519).

Data Availability Statement

The original contributions presented in the study are included in the article; further inquiries can be directed to the corresponding author.

Acknowledgments

We would like to express our sincere gratitude to all those who have contributed to this research. Special thanks to the Shaanxi Provincial Government for their financial support. We also extend our heartfelt appreciation to every friend and professors who has assisted us. Lastly, we thank our families and friends for their unwavering support and encouragement during this study.

Conflicts of Interest

The authors declare no conflicts of interest.

Appendix A

This section illustrates the changes in the scatter plot for different years in detail.
  • 2nd Century B.C.E. to 3rd Century
From the 2nd century B.C.E. to the 1st century B.C.E., a notable increase in World Heritage Sites is evident at both the eastern and western ends, particularly in the western regions of China and along the western Mediterranean coast. This trend reflects the eastward expansion of the ha network into China’s heartland and westward to the coastal Mediterranean regions. Such transformations likely stem from significant historical events during that era, for instance, Zhang Qian’s mission to the Western Regions in 139 B.C.E. [80], and the Han Dynasty’s establishment of the Protectorate of the Western Regions in 60 B.C.E. solidified control [65], enhanced security, and promoted trade and cultural interactions. These efforts resulted in the development of new trade routes and urban centers.
Concurrently, the Roman Republic asserted its influence in the Mediterranean region from the 2nd century B.C.E. to the 1st century B.C.E. The decisive victory of Rome over Carthage in the Third Punic War (149–146 B.C.E.) led to Roman control over areas that include present-day Algeria, Tunisia, and the Iberian Peninsula. Subsequently, from 58 to 50 B.C.E., Gaul was conquered by Rome, the latter establishing dominance over the entire western Mediterranean region [59,60]. This period of Roman governance in the western Mediterranean not only enhanced security and facilitated urban growth but also integrated these regions into the trade network later known as the Silk Road.
During the period from the 1st century B.C.E to the 2nd century, there is a noticeable increase in World Heritage Sites, with the eastern Mediterranean remaining a central focus, expanding towards both the east and the west. The Silk Road network expanded eastward into present-day Afghanistan, Pakistan, and northern India, leading to a sustained rise in the concentration of heritage sites in China and Central Asia. This growth can be attributed to the Han Dynasty’s maintenance of East–West trade routes following internal upheavals, especially after the establishment of the Eastern Han Dynasty, which ensured control over the Western Regions [65]. Furthermore, the founding of the Kushan Empire in the early 1st century resolved tumult in Central Asia, especially in the Transoxiana region [81]. The number of heritage sites in the western Mediterranean region significantly increased, notably in southern France and the Iberian Peninsula. This expansion may be associated with the establishment of the Roman Empire in 27 CE, heralding a period of “Pax Romana” across the Mediterranean region [68]. This era of intercontinental tranquility witnessed substantial economic and cultural advancements, with unity and peace supporting the safeguarding and upkeep of trade routes.
During the 2nd to 3rd centuries, the eastern Mediterranean region, encompassing the Greek city-states of Asia Minor along the Aegean coast and the Levant region on the eastern Mediterranean coast, remained pivotal in the Silk Road network. A notable shift occurred as heritage sites expanded eastward towards East Asia, leading to an increase in heritage density along the eastern Silk Road, spanning the Central Asian Transoxiana region, India, and China. Simultaneously, an increase in heritage sites is noted in central and eastern Europe. The primary drive behind the eastward expansion of heritage sites can be linked to the rapid spread of Hinduism and Buddhism across the Indian subcontinent, extending to East Asia [71]. Buddhism initially penetrated Central Asia via the Silk Road in the 1st century B.C.E. and thrived in East Asia from the 2nd to 3rd centuries, most notably in China. Influential Buddhist missionaries during the late Eastern Han Dynasty, including An Shigao and Zhu Ḍaosheng, emerged as key historical figures [82]. The growth of heritage sites in central and eastern Europe may be linked to the political challenges faced by the Roman Empire in the late 2nd and 3rd centuries, prompting Emperors Septimius Severus and Marcus Aurelius to bolster military activities in the Danube region and establish new military outposts [83].
  • 4th to 8th Century
The analysis of data from the 4th to 5th centuries provides insights into the changes in heritage sites along the Silk Road network. While the overall number of heritage sites in the Mediterranean region shows minimal alterations, a significant decline in sites in regions like Greece, Libya, and the Iberian Peninsula can be seen from the map. In contrast, a notable increase in core site density in northern and western China, Iran, and especially in the Central Asian Transoxiana region is well attested. This indicates a considerable enhancement in the significance of the eastern part of the Silk Road network during this era. The transformations in heritage sites in the Mediterranean region are likely due to the fragmentation and collapse of the Western Roman Empire during the 4th and 5th centuries, leading to extended periods of political and economic instability [68]. Concurrently, the European domains of the Byzantine Empire experienced invasions by nomadic groups, potentially resulting in the destruction or desertion of certain heritage sites. Nonetheless, the Byzantine Empire maintained a relatively serene presence in Asia Minor and the Levant region, preserving high-density heritage sites and playing an essential role in the Silk Road network. In China, the uptick in heritage sites in the northern and western regions can be associated with the consolidation of northern China by the Northern Wei dynasty in the early 5th century, facilitating stability [84]. Regarding religion, the dissemination of Buddhist art along the Silk Road reached new heights, exemplified by locations like the Yungang Grottoes established in northern and western China from the 4th to the 5th century. The surge in heritage sites in Iran and Central Asia, particularly in the Transoxiana region, may be attributed to the ascendancy of the Sasanian Empire (224–651 C.E.) and the emergence of the Sogdians (4th to 7th centuries) [69,70]. In contrast to the tumult experienced by the Roman Empire and China during nomadic incursions, Central Asia witnessed the emergence of a series of political entities with nomadic features, such as the Parthians, Kushans, and Hephthalites, blending with classical Persian and Central Asian civilizations to evolve amidst the influx of nomadic groups [71].
During the 5th to 6th centuries, the growth trajectory of significant heritage sites was predominantly focused along the eastern Mediterranean coast, Iran, and the Central Asian Transoxiana region, with emerging growth centers in southern India and Southeast Asia. While minor fluctuations in heritage site density were observed in Western Europe, North Africa, and the Yellow River Basin in China, the magnitude of these changes was not substantial. The Silk Road network gradually demonstrated a pattern centered with the eastern Mediterranean and Iran–Central Asian regions. The uptick in heritage sites along the eastern Mediterranean coast can be associated with the reign of Byzantine Emperor Justinian I from 527 to 565 C.E., which triggered economic and political revitalization [67]. The expansion of Byzantine territories led to the reintegration of some coastal urban centers, fostering a phase of relative calm in the eastern Mediterranean and facilitating the founding of new heritage sites and the restoration of existing ones. In the Iranian plateau, the rise in heritage site density may be linked to the political stability under the Sassanian Empire, characterized by centralized governance and efficient administrative practices that strengthened fiscal stability [71]. Religious advancements during this era positioned Iran as the nucleus of Zoroastrianism, with the official establishment of Zoroastrianism as the state religion under the Sassanian Empire, fostering its prosperity in Iran and the Sogdian-administered zones of Central Asia. The emergence of new religious establishments and artistic productions aligned with the Sassanian Empire’s focus on commerce, playing a pivotal role in Silk Road trade and stimulating the ascension of commercial hubs along the Silk Road. In North Africa, heritage sites continued to decline due to the ravages of warfare and climatic shifts. Western Europe encountered political instability during the Vandals’ War in 533 C.E. and the Gothic Wars spanning from 535 to 554 C.E. during the reign of Justinian I [68]. The Yellow River Basin in China grappled with tumult and fragmentation at the end of the Northern Wei dynasty in the early 6th century, resulting in social stagnation [24,85].
During the 6th to 7th centuries, remarkable shifts in heritage sites along the Silk Road network indicate a gradual eastward movement. The quantity of heritage sites in the western Mediterranean remains stable with no significant alterations, whereas the density of heritage sites in the eastern Mediterranean diminishes, showing a continual decline in North Africa, particularly present-day Tunisia and Algeria. Concurrently, the density of heritage sites in the eastern sections of the Silk Road network, encompassing Iran, Central Asia, East Asia, and Southeast Asia, undergoes a substantial increase. Throughout this period, the trend of the Silk Road network’s central regions shifting eastward remains prominent, leading to the emergence of a new localized central hub in the Yellow River Basin of China. The decline in heritage site density in the eastern Mediterranean region can be traced back to the 6th and 7th centuries, characterized by the initial decline of the Byzantine Empire. The outbreak of the “Justinian Plague” in 541 C.E. affected the Byzantine Empire for over 70 years, followed by more than two decades of Byzantine–Sassanian Wars (602–628 C.E.) [86]. Subsequently, in the mid-7th century, the rise of the Arab Caliphate initiated prolonged conflicts with the Byzantine Empire, culminating in the siege of Constantinople in 678 C.E., resulting in renewed turmoil in the eastern Mediterranean region [71,86]. The increase in the number of heritage sites in Iran may be attributed to the rapid spread of Islam following the Arab conquest of the Sassanian Empire in 638 C.E., leading to the introduction of new religious structures and enriching the cultural landscape of the region. The rise in heritage site density in the Central Asian Transoxiana region can be credited to the political stability under the governance of the Western Turkic Khaganate, with the Sogdians forming alliances with the Turks to safeguard commercial trade along the Silk Road, fostering economic prosperity in Central Asia. The gradual establishment of a new localized central hub in East Asia can be linked back to the reunification of China in the 6th and 7th centuries. The unification of China under the Sui Dynasty in 589 C.E. and the establishment of the Tang Dynasty in 618 C.E. ushered in a prosperous era, especially during the “Reign of Zhenguan” from 627 to 649 C.E. This period is regarded as the heyday in Chinese culture and Buddhist art, marked by political stability, economic affluence, and cultural openness that facilitated the construction of numerous temples, imperial mausoleums, and palaces, consolidating the eastern section of the Silk Road network and establishing a new localized central hub within China [73,85].
During the 7th and 8th centuries, changes in heritage sites along the Silk Road network became apparent. There was a notable increase in the number of heritage sites in the western Mediterranean and Western Europe, particularly in regions such as France and Italy. In contrast, the density of heritage sites in the eastern Mediterranean did not show significant growth during the 8th century, with some areas experiencing a decline along the Aegean coast, the Levant, and Egypt. While the number of heritage sites in North Africa stabilized, there was a slight decline in heritage site density in Western Asia and Iran. Concurrently, the density of heritage sites in the Central Asian Transoxiana region near western China continued to rise, alongside with an overall increase in heritage site density in South Asia, East Asia, and Southeast Asia. The alterations in heritage site distribution along the Silk Road illustrate a shift of the central focus from the eastern Mediterranean towards Italy and France, while the core region of the Silk Road network expanded further eastward. The Yellow River Basin in China, serving as a core area, initiated the extension of the Silk Road towards Southeast Asia, Korea, and Japan, marking the early development of the maritime Silk Road in this era. The upsurge in heritage sites in the western Mediterranean and Western Europe can be linked to the expansion of the Frankish Kingdom. During the 7th and 8th centuries, this kingdom underwent significant growth, eventually unifying Western Europe following the establishment of the Carolingian dynasty in 751 C.E., ushering in stability to a previously turbulent region [87]. The decline in heritage site density in the eastern Mediterranean region may be attributed to political instability, conflicts, and the impact of epidemics on the Byzantine Empire. Ongoing confrontations with the Arab Caliphate and the Eastern Epidemic of 746 C.E. further destabilized the empire. The decrease in heritage site density in Western Asia and Iran may be linked to the destruction of heritage sites due to the Arab conquest of the Sassanian Empire in the mid-7th century and the Abbasid Revolution in the 8th century, leading to prolonged conflicts [72]. The increase in heritage site density in the Central Asian Transoxiana region adjacent to western China and within the Chinese territory may be a result of the “Golden Age of the Tang Dynasty” in the early 8th century and the expansion of the maritime Silk Road towards Southeast Asia and Japan [73,85,88].
  • 9th to 15th Century
During the 9th and 10th centuries, heritage site density significantly increased in the Italian Peninsula and the British Isles, with a slight upsurge along the Aegean coast and in northern Iran. In contrast, heritage density declined in Central Asia (especially territories of Kazakhstan and Uzbekistan) and the northern Yellow River Basin area in China. This shift indicates a movement of the central hub of the Silk Road network westward, contributing to the gradual decline of the eastern focal points in the Yellow River Basin of China and the Central Asian Transoxiana region. The substantial rise in heritage density in the Italian Peninsula may be attributed to the foundation of the Holy Roman Empire. Similarly, the growth in heritage density in the British Isles could be connected to King Alfred’s actions that compelled the Vikings to retreat in the late 9th to 10th centuries, fostering a relatively stable political environment, enhancing Christian influence, and facilitating the establishment or expansion of notable institutions such as the Canterbury Cathedral [88,89]. The escalation of heritage site density along the Aegean coast may be linked to the Byzantine Empire’s revival under the Macedonian dynasty, symbolizing a period of resurgence as the empire reclaimed control over the eastern Mediterranean, regained territories, and maintained stability [68]. The rise in heritage density in northern Iran correlates with the emergence and consolidation of kingdoms in specific regions of Georgia and Armenia, exemplified by the Bagratuni Kingdom of Armenia, resulting in significant cultural and architectural advancements in the area [88,89]. The decline in heritage site density in Central Asia (including Kazakhstan and Uzbekistan) may be ascribed to the upheaval in China during the late Tang and Five Dynasties period, reduced trade activities, and the closure of trade routes by nomadic regimes between the Central Plains and the Western Regions. This led to diminished trade flow along the eastern part of the Silk Road and a decline in the significance of cities in Central Asia, such as Samarkand and Bukhara [71,73,85].
During the 10th and 11th centuries, the Silk Road network underwent significant development: the center shifted westward, leading to the emergence of independent hubs in East Asia that were originally part of a connected network. Italy and Greece experienced a notable increase in heritage site density, while Western Europe, particularly in France and Germany, saw significant growth in density. Changes in heritage sites in western China, Central Asia, and Iran were less prominent, contrasting with the concentration of heritage sites in East Asia along the eastern coast, the middle-lower reaches of the Yangtze River, Japan, and Southeast Asia. The number of heritage sites along the eastern routes of the Silk Road network in Central Asia and western China remained relatively stable, indicating a declining trend compared to the rapid growth in other regions. The maritime Silk Road saw swift progress, resulting in a southward shift in the Silk Road network and the emergence of independent centers in East Asia [88,89]. The upsurge in heritage density in Western Europe and the eastern Mediterranean coast can be attributed to the urban development in Italy, Germany, and France, aided by the influence of the Roman Catholic Church, leading to the construction of momentous religious edifices like St. Mark’s Basilica in Venice [90]. In the early 11th century, the Byzantine Empire enjoyed a revival, exemplified by Emperor Basil II’s expansion into southern Italy and northern Syria [68]. The increase in heritage sites in Central Asia (specifically present-day Uzbekistan and Turkmenistan) may be linked to the westward expansion of the Seljuk Empire during the 11th century [71]. The rise in heritage density along the eastern coast of China, Japan, and Southeast Asia could be associated with the thriving commercial economy of the period, leading to increased maritime trade and interactions with neighboring regions [73].
During the 11th to 12th centuries, the focus of the Silk Road network shifted towards Western Europe, while independent hubs in East Asia began to emerge. This era witnessed significant growth in northern and central Italy, northern France, and England, with only partial increases in heritage sites in Central Asia. Conversely, there was a decrease in heritage numbers in the Middle East and North Africa, while East Asia saw little significant change in heritage site density. The European side displayed extensive clustering and growth rates that surpassed those of other regions. These transformations can be attributed to various factors: the expansion in Europe was fueled by economic and urban population growth in the 11th to 12th centuries, notably flourishing Italian cities in the 12th century [90]. The decline in heritage in the Middle East and North Africa could be attributed to the substantial destruction caused by the Crusades beginning in 1096, impacting societies of the Islamic cultural zone along the eastern Mediterranean coast and the Byzantine Empire [91]. The rise of coastal city-states in Italy and the consolidation of papal authority in Europe led to the demise of existing urban centers and settlements. In East Asia, internal conflicts within the Song Dynasty disrupted connections with the Western Regions, while frequent conflicts between the Seljuk Empire and the Kara Khitay Khanate in Central Asia contributed to a period of stagnation in development [71].
During the 12th to 13th centuries, the focal point of the Silk Road network continued its westward shift, resulting in a gradual decline in activities along the eastern segment of the Silk Road. Growth was prominently centered in Western Europe, notably in France, the central–western regions of Germany, and northern and central Italy, accompanied by a slight rise in heritage density in the Byzantine territory. In contrast, heritage density in Central Asia and East Asia remained relatively stable, with a minor increase observed in East Asia where the establishment of autonomous centers progressed at a slow pace. The influence of the Mongol expansion towards the West on heritage sites in Central and East Asia during the 13th century did not have a significant impact [74]. The total number of heritage sites in Central Asia remained static, particularly in China under Mongol governance, where a modest increase in heritage sites occurred during a period of relative tranquility [75]. The Mongol conquests resulted in a net reduction rather than an annexation of territories, slowing the rate of development in these regions. Simultaneously, Europe stood at the threshold of the flourishing Italian Renaissance and the Age of Discovery. The economic prosperity of the Renaissance was rooted in the prosperity of Italian city-states in the late Middle Ages, a trend originating in the 12th century, believed to mark the initial emergence of modern global trade systems [77]. Furthermore, temporary prosperity was brought by the new settlements established during the Crusades in Anatolia and the Levant region [91].
During the 13th to 14th centuries, minor fluctuations in overall heritage density occurred across the Silk Road network, with slight increases in heritage density noted in northern Italy, southern Germany, and the eastern coastal regions of China, while heritage numbers in North Africa saw a slight decline. The deceleration of heritage site growth in Europe during this period can be attributed to the outbreak of the Black Death from 1346 to 1353 [76]. This devastating bubonic plague originated in Europe and ravaged the continent for eight years, resulting in the deaths of almost half the population. Under the governance of the Yuan Dynasty, in contrast, China enjoyed a relatively stable era during the 13th to 14th centuries, experiencing prosperity in trade, particularly in maritime Silk Road commerce. Port cities like Quanzhou (Zayton) thrived during this prosperous period [75].
During the 14th to 15th centuries, Europe became the central hub of the Silk Road network, resulting in the fading depiction of the original overland Silk Road on maps. The rise in heritage density in this period was predominantly focused on central Europe, notably in the German territories, northern and central Italy, and the northern Iberian Peninsula, accompanied by the emergence of new heritage sites in Eastern Europe. While there was a minor uptick in heritage density observed in areas like the eastern coastal regions of China in East Asia, the growth rate was modest. Throughout this period, the high-density heritage sites formed an elongated pattern stretching from the northwest to the southeast [88,89].

Appendix B. A Summary Presentation of the Major Cities in Figure 3

CityLatitudeLongitude
Karakorum47.1922102.8193
Nara34.5666135.7666
Quanzhou24.9139118.5858
Xi’an34.2666108.9333
Dunhuang40.099994.6499
Urumqi43.800987.6004
Madras (Chennai)13.087880.2784
Fatehpur-Sikri27.093777.66
Kashgar39.470775.9895
Almaty43.256676.9286
Samarkand39.654266.9597
Balkh36.756466.8972
Shahrisabz39.053766.8201
Bamiyan34.821667.8273
Herat34.348162.1996
Bam29.10658.357
Yazd31.897254.3675
Isfahan32.652451.6746
Baku40.377649.892
Muskat23.613858.5922
Aleppo36.216637.1666
Jeddah21.542339.1979
Zanzibar−6.133339.3167
Alexandria31.215629.9553
Ephesus37.937227.3378
Bursa40.195529.0601
Venice45.437112.3326
Valencia39.4698−0.3374

References

  1. Mertens, M. Did Richthofen Really Coin “the Silk Road”. Silk Road 2019, 17, 1–9. [Google Scholar]
  2. Herrmann, A. Die Alten Seidenstrassen Zwischen China Und Syrien: Beiträge Zur Alten Geographie Asiens; Weidmann: Vienna, Austria, 1910; Volume 1. [Google Scholar]
  3. Hedin, S. The Silk Road: Ten Thousand Miles through Central Asia; Bloomsbury: New York, NY, USA, 2009; ISBN 978-1-84511-898-3. [Google Scholar]
  4. Boulnois, L. Loveday, H., Translator; Silk Road: Monks, Warriors & Merchants on The Silk Road; Odyssey Books & Guides: Hongkong, China, 2005. [Google Scholar]
  5. Wood, F. The Silk Road: Two Thousand Years in the Heart of Asia; Univ of California Press: Berkeley, CA, USA, 2002. [Google Scholar]
  6. Waugh, D.C. Richthofen’s ‘Silk Roads’: Toward the Archaeology of a Concept. Silk Road 2007, 5, 1–10. [Google Scholar]
  7. Hansen, V. The Silk Road. A New Histor; Oxford University Press: New York, NY, USA, 2012. [Google Scholar]
  8. Chin, T. The Invention of the Silk Road, 1877. Crit. Inq. 2013, 40, 194–219. [Google Scholar] [CrossRef]
  9. Hoshmand, A.R. Eurasian Connection via the Silk Road: The Spread of Islam. In Silk Road to Belt Road; Islam, M.N., Ed.; Springer Nature: Singapore, 2019; pp. 95–104. ISBN 9789811329975. [Google Scholar]
  10. Khan, K.A.; Doszhanova, A.I. Religion and the Great Silk Road: Means of Communication, Contours of Interaction, Trade; Academic Council: Cambridge, MA, USA, 2022; pp. 231–238. [Google Scholar] [CrossRef]
  11. Hansen, V. The Classical Silk Road: Trade and Connectivity across Central Asia, 100 BCE–1200 CE. In Oxford Research Encyclopedia of Asian History; Oxford University Press: Oxford, UK, 2021; ISBN 978-0-19-027772-7. [Google Scholar]
  12. Høisæter, T.L. Polities and Nomads: The Emergence of the Silk Road Exchange in the Tarim Basin Region during Late Prehistory (2000–400 BCE). Bull. Sch. Orient. Afr. Stud. 2017, 80, 339–363. [Google Scholar] [CrossRef]
  13. Andrea, A.J. The Silk Road in World History: A Review Essay. Asian Rev. World Hist. 2014, 2, 105–127. [Google Scholar] [CrossRef]
  14. Xin, N.; Liao, J. History of the Silk Road. Chronos 2018, 36, 167–195. [Google Scholar] [CrossRef]
  15. Eğrï, S. The Silk Road Impressions in Hitây Sefâretnâmesi and Kanunnâme-i China u Hitây. J. Turk. Stud. 2012, 7, 411–422. [Google Scholar] [CrossRef]
  16. Whitfield, S. Life along the Silk Road; University of California Press: Berkeley, CA, USA, 1999. [Google Scholar]
  17. Tosheva, D. Qarakhanid Roads to China: A History of Sino-Turkic Relations: By Dilnoza Duturaeva, Leiden, Brill, 2022, 278 pp, US$119.00 (Hbk), ISBN: 978-90-04-50852-1. Cent. Asian Surv. 2023, 42, 211–213. [Google Scholar] [CrossRef]
  18. UNESCO. World Heritage Global Strategy. Available online: https://whc.unesco.org/en/globalstrategy/ (accessed on 28 July 2024).
  19. Williams, T. Final Technical Report on the Results of the UNESCO/Japanese Funds-in-Trust Project: Support for Silk Roads World Heritage Sites in Central Asia (Phase II), April 2015—November 2019; Williams, T., Lin Chih-Hung, R., Jorayev, G., Eds.; UCL Institute of Archaeology: London, UK, 2020. [Google Scholar]
  20. Vileikis, O. Monitoring Serial Transnational World Heritage—The Central Asian Silk Roads Experience. Hist. Environ. Policy Pract. 2016, 7, 260–273. [Google Scholar] [CrossRef]
  21. Williams, T. Final Technical Report on the Results of the UNESCO/Korean Funds-in-Trust Project: Support for the Preparation for the World Heritage Serial Nomination of the Silk Roads in South Asia, 2013–2016; UCL Institute of Archaeology: London, UK, 2016. [Google Scholar]
  22. Zhan, G. Nomination of the Silk Road to the World Heritage List. Hist. Environ. 2014, 26, 88–100. [Google Scholar]
  23. Vileikis, O.; Dumont, B.; Serruys, E.; Van Balen, K.; Tigny, V.; De Maeyer, P. Connecting world heritage nominations and monitoring with the support of the silk roads cultural heritage resource information system. ISPRS Ann. Photogramm. Remote Sens. Spatial Inf. Sci. 2013, II-5/W1, 319–324. [Google Scholar] [CrossRef]
  24. Sima, Q. Records of the Grand Historian of China; Columbia University Press: New York, NY, USA, 1971; Volume 2, ISBN 978-0-231-08167-2. [Google Scholar]
  25. Peck, D.T. The Empirical Reconstruction of Columbus’ Navigational Log and Track of His 1492–1493 Discovery Voyage. J. Navig. 2011, 64, 193–205. [Google Scholar] [CrossRef]
  26. Byars, J. The Venetian Discovery of America: Geographic Imagination and Print Culture in the Age of Encounters. J. Early Mod. Hist. 2020, 24, 571–572. [Google Scholar] [CrossRef]
  27. Wilson, G. Multifunctional “quality” and Rural Community Resilience. Trans. Inst. Br. Geogr. 2010, 35, 364–381. [Google Scholar] [CrossRef]
  28. Thacher, D.; Milne, S.; Park, R. Applying GIS and Statistical Analysis to Assess the Correlation of Human Behaviour and Ephemeral Architectural Features among Palaeo-Eskimo Sites on Southern Baffin Island, Nunavut. J. Archaeol. Sci. Rep. 2017, 14, 21–30. [Google Scholar] [CrossRef]
  29. Lang, G.; Marcon, E. Testing Randomness of Spatial Point Patterns with the Ripley Statistic. Esaim Probab. Stat. 2010, 17, 767–788. [Google Scholar] [CrossRef]
  30. Haase, P. Spatial Pattern Analysis in Ecology Based on Ripley’s K-Function: Introduction and Methods of Edge Correction. J. Veg. Sci. 1995, 6, 575–582. [Google Scholar] [CrossRef]
  31. Díaz-Rodríguez, M.; Fábregas-Valcarce, R. Evaluating the Effectiveness of Three Spatial Cluster Analysis Methods on Palaeolithic Site Location Distributions in Galicia, NW Iberian Peninsula. J. Archaeol. Sci. Rep. 2022, 41, 103323. [Google Scholar] [CrossRef]
  32. UNESCO. Silkroad Interactive Map. Available online: https://en.unesco.org/silkroad/silkroad-interactive-map (accessed on 26 July 2024).
  33. Spengler, R.N.; Maksudov, F.; Bullion, E.; Merkle, A.; Hermes, T.; Frachetti, M. Arboreal Crops on the Medieval Silk Road: Archaeobotanical Studies at Tashbulak. PLoS ONE 2018, 13, e0201409. [Google Scholar] [CrossRef]
  34. Daryaee, T. The Persian Gulf in Late Antiquity. J. World Hist. 2003, 14, 1–16. [Google Scholar] [CrossRef]
  35. Golden, P. Central Asia in World History; Oxford University Press: Oxford, UK, 2011. [Google Scholar] [CrossRef]
  36. Chen, F.; Chen, J.; Dong, G.; Huang, W.; Hou, J.; Wang, T. Climate Change and Silk Road Civilization in the Arid Central Asia. 2020. Available online: https://meetingorganizer.copernicus.org/EGU2020/EGU2020-7335.html (accessed on 28 July 2024).
  37. Hao, Z.; Zheng, J.; Yu, Y.; Xiong, D.; Liu, Y.; Ge, Q. Climatic Changes during the Past Two Millennia along the Ancient Silk Road. Prog. Phys. Geogr. Earth Environ. 2020, 44, 605–623. [Google Scholar] [CrossRef]
  38. Babajanyan, A.; Franklin, K. Everyday Life on the Medieval Silk Road: VDSRS Excavations at Arpa, Armenia. Aram. Armen. J. Near East. Stud. 2018, 12, 155–184. [Google Scholar] [CrossRef]
  39. Tan, L.; Dong, G.; An, Z.; Lawrence Edwards, R.; Li, H.; Li, D.; Spengler, R.; Cai, Y.; Cheng, H.; Lan, J.; et al. Megadrought and Cultural Exchange along the Proto-Silk Road. Sci. Bull. 2021, 66, 603–611. [Google Scholar] [CrossRef]
  40. Yao, Y.-F.; Wang, X.; Guo, W.; Jiang, H.-E.; Li, M.; Ferguson, D.K.; Wang, Y.-F.; Li, C.-S. Archaeobotanical Evidence Reveals the Human–Environment Interactions during the 9th–13th Centuries at Turpan, Xinjiang on the Ancient Silk Road. Vege. Hist. Archaeobot. 2020, 29, 539–552. [Google Scholar] [CrossRef]
  41. Nunn, N.; Qian, N. The Columbian Exchange: A History of Disease, Food, and Ideas. J. Econ. Perspect. 2010, 24, 163–188. [Google Scholar] [CrossRef]
  42. Knutson, S.A. Archaeology and the Silk Road Model. World Archaeol. 2020, 52, 619–638. [Google Scholar] [CrossRef]
  43. Meng, X.; Wu, J.; Zhu, Q.; Hu, S.; Zhu, L. Analytical Method to Determine the Environmental Impact on the Stability Safety of a Bulk Carrier Navigating in the Maritime Silk Road. J. Tsinghua Univ. (Sci. Technol.) 2024, 64, 1060–1069. [Google Scholar] [CrossRef]
  44. Gu, H. Frustrated Relations?: China with Central and Eastern Europe; Contributions to International Relations; Springer Nature: Singapore, 2023; ISBN 978-981-9937-29-5. [Google Scholar]
  45. Brunn, S.D. Geography of Time, Place, Movement and Networks, Volume 3: Mapping Time Journeys in Music, Art and Spirituality; Springer Nature: Singapore, 2024; ISBN 978-3-031-58033-8. [Google Scholar]
  46. Agnew, N. Conservation of Ancient Sites on the Silk Road: Proceedings of an International Conference on the Conservation of Grotto Sites; Getty Conservation Institute: Los Angeles, CA, USA, 1997. [Google Scholar]
  47. Yao, Y.; Wang, X.; Lu, L.; Liu, C.; Wu, Q.; Ren, H.; Yang, S.; Sun, R.; Luo, L.; Wu, K. Proportionated Distributions in Spatiotemporal Structure of the World Cultural Heritage Sites: Analysis and Countermeasures. Sustainability 2021, 13, 2148. [Google Scholar] [CrossRef]
  48. Che, P.; Lan, J. Climate Change along the Silk Road and Its Influence on Scythian Cultural Expansion and Rise of the Mongol Empire. Sustainability 2021, 13, 2530. [Google Scholar] [CrossRef]
  49. Skaff, J.K. The Sogdian Trade Diaspora in East Turkestan during the Seventh and Eighth Centuries. J. Econ. Soc. Hist. Orient 2003, 46, 475–524. [Google Scholar] [CrossRef]
  50. Peng, Q.; Moradi, H. Studies on the History and Culture along the Continental Silk Road. Eurasian Geogr. Econ. 2024, 203, 1–3. [Google Scholar] [CrossRef]
  51. Hill, D.J. Climate Change and the Rise of the Central Asian Silk Roads. In Socio-Environmental Dynamics along the Historical Silk Road; Yang, L., Bork, H.R., Fang, X., Mischke, S., Eds.; Springer: Cham, Switzerland, 2019; pp. 247–259. [Google Scholar] [CrossRef]
  52. Ge, Q.; Hua, Z.; Zheng, J.; Fang, X.; Xiao, L.; Liu, J.; Yang, B. Forcing and impacts of warm periods in the past 2000 years. Chin. Sci. Bull. 2015, 60, 1728–1735. [Google Scholar] [CrossRef]
  53. Giannakopoulos, C.; Sager, P.; Bindi, M.; Moriondo, M.; Kostopoulou, E.; Goodess, C. Climatic Changes and Associated Impacts in the Mediterranean Resulting from a 2 °C Global Warming. Glob. Planet. Chang. 2009, 68, 209–224. [Google Scholar] [CrossRef]
  54. Maracchi, G.; Sirotenko, O.; Bindi, M. Impacts of Present and Future Climate Variability on Agriculture and Forestry in the Temperate Regions: Europe. Clim. Chang. 2005, 70, 117–135. [Google Scholar] [CrossRef]
  55. Erdkamp, P. War, Food, Climate Change, and the Decline of the Roman Empire. J. Late Antiq. 2019, 12, 422–465. [Google Scholar] [CrossRef]
  56. Zhang, H.; Werner, J.; García-Bustamante, E.; González-Rouco, F.; Wagner, S.; Zorita, E.; Fraedrich, K.; Jungclaus, J.; Ljungqvist, F.; Zhu, X.; et al. East Asian Warm Season Temperature Variations over the Past Two Millennia. Sci. Rep. 2018, 8, 7702. [Google Scholar] [CrossRef]
  57. Wang, L.; Chen, W.; Huang, G.; Zeng, G. Changes of the Transitional Climate Zone in East Asia: Past and Future. Clim. Dyn. 2017, 49, 1463–1477. [Google Scholar] [CrossRef]
  58. He, S.; Gao, Y.; Li, F.; Wang, H.; He, Y. Impact of Arctic Oscillation on the East Asian Climate: A Review. Earth-Sci. Rev. 2017, 164, 48–62. [Google Scholar] [CrossRef]
  59. Trouet, V.; Esper, J.; Graham, N.; Baker, A.; Scourse, J.; Frank, D. Persistent Positive North Atlantic Oscillation Mode Dominated the Medieval Climate Anomaly. Science 2009, 324, 78–80. [Google Scholar] [CrossRef]
  60. Gronenborn, D.; Strien, H.-C.; Dietrich, S.; Sirocko, F. ‘Adaptive Cycles’ and Climate Fluctuations: A Case Study from Linear Pottery Culture in Western Central Europe. J. Archaeol. Sci. 2014, 51, 73–83. [Google Scholar] [CrossRef]
  61. Zhang, S.; Liu, H.; Li, G.; Zhang, Z.; Chen, X.; Shi, Z.; Zhou, A.; Dong, G. Warfare Impact Overtakes Climate-Controlled Fires in the Eastern Silk Roads since 2000 B.P. Proc. Natl. Acad. Sci. USA 2023, 2, pgad408. [Google Scholar] [CrossRef]
  62. Yu, J.; Safarov, B.; Yi, L.; Buzrukova, M.; Janzakov, B. The Adaptive Evolution of Cultural Ecosystems along the Silk Road and Cultural Tourism Heritage: A Case Study of 22 Cultural Sites on the Chinese Section of the Silk Road World Heritage. Sustainability 2023, 15, 2465. [Google Scholar] [CrossRef]
  63. Zandi, S. Revival of the Silk Road Using the Applications of AR/VR and Its Role on Cultural Tourism. arXiv 2023, arXiv:bs/2304.10545. [Google Scholar] [CrossRef]
  64. Allaberganov, A.; Catterall, P. Using Social Exchange Theory to Examine Residents’ Responses to Heritage Tourism: Case Studies of Samarqand and Bukhara in Uzbekistan. J. Herit. Tour. 2023, 18, 846–863. [Google Scholar] [CrossRef]
  65. Ban, G. The Book of Han-Biography of Zhang Qian; Zhonghua Book Company: Beijing, China, 2012. [Google Scholar]
  66. Scullard, H.H. A History of the Roman World: 753 to 146 B, 4th ed.; Routledge Classics; Routledge: Abingdon, UK; Oxon, UK; New York, NY, USA, 2013; ISBN 978-0-415-52227-4. [Google Scholar]
  67. Caesar, J.; Handford, S.A.; Stanley, A.; Gardner, J.F. The Conquest of Gaul; Penguin Books: London, UK; New York, NY, USA, 1982; ISBN 978-0-14-044433-9. [Google Scholar]
  68. Gibbon, E.; Milman, H.H. The Decline and Fall of the Roman Empire; Modern Library: New York, NY, USA, 2003; Volume 3. [Google Scholar]
  69. Fisher, W.B. (Ed.) The Cambridge History of Iran: Volume 1: The Land of Iran; The Cambridge History of Iran; Cambridge University Press: Cambridge, UK, 1968; Volume 1, ISBN 978-0-521-06935-9. [Google Scholar]
  70. Boyle, J.A. (Ed.) The Cambridge History of Iran: Volume 5: The Saljuq and Mongol Periods; The Cambridge History of Iran; Cambridge University Press: Cambridge, UK, 1968; Volume 5, ISBN 978-0-521-06936-6. [Google Scholar]
  71. UNESCO. History of Civilizations of Central Asia; UNESCO Publications: Paris, France, 1992. [Google Scholar]
  72. Jackson, P.; Lockhart, L. (Eds.) The Cambridge History of Iran: Volume 6: The Timurid and Safavid Periods; The Cambridge History of Iran; Cambridge University Press: Cambridge, UK, 1986; Volume 6, ISBN 978-0-521-20094-3. [Google Scholar]
  73. Ouyang, X. New Book of Tang; Song, Q., Ed.; Zhonghua Book Company: Beijing, China, 1997. [Google Scholar]
  74. Saunders, J.J. The History of the Mongol Conquests; University of Pennsylvania Press: Philadelphia, PA, USA, 2001. [Google Scholar]
  75. Song, L. History of the Yuan Dynasty; National Library Press: Beijing, China, 2014. [Google Scholar]
  76. Frith, J. The History of Plague-Part 1: The Three Great Pandemics. J. Mil. Veterans Health 2012, 20, 11–16. [Google Scholar]
  77. Burckhardt, J. The Civilization of the Renaissance in Italy; Penguin classics; Penguin Books: London, UK ; New York, NY, USA, 1928; ISBN 978-0-14-044534-3. [Google Scholar]
  78. Li, L.; Shao, M.; Wang, S.; Li, Z. Preservation of Earthen Heritage Sites on the Silk Road, Northwest China from the Impact of the Environment. Environ. Earth Sci. 2011, 64, 1625–1639. [Google Scholar] [CrossRef]
  79. Sciorati, G. ‘Constructing’ Heritage Diplomacy in Central Asia: China’s Sinocentric Historicisation of Transnational World Heritage Sites. Int. J. Cult. Policy 2022, 29, 94–112. [Google Scholar] [CrossRef]
  80. Si Ma, Q. Shi Ji; Zhong Hua Shu Ju: Beiing, China, 2004; ISBN 978-7-101-00304-8. [Google Scholar]
  81. Beckwith, C.I. Empires of the Silk Road: A History of Central Eurasia from the Bronze Age to the Present. In Empires of the Silk Road; Princeton University Press: Princeton, NJ, USA, 2009. [Google Scholar]
  82. Fan, Y. Book of the Later Han; Zhonghua Book Company: Beijing, China, 2012. [Google Scholar]
  83. Brown, P. The World of Late Antiquity: AD 150-750; Thames and Hudson: London, UK, 2024. [Google Scholar]
  84. Wei, S. Book of Wei; Zhonghua Book Company: Beijing, China, 2017. [Google Scholar]
  85. Liu, X. Old Book of Tang; Zhonghua Book Company: Beijing, China, 1997. [Google Scholar]
  86. Dignas, B.; Winter, E. Rome and Persia in Late Antiquity: Neighbours and Rivals; Cambridge University Press: Cambridge, UK, 2007. [Google Scholar]
  87. Davis, J.R. Charlemagne’s Practice of Empire; Cambridge University Press: Cambridge, UK, 2015. [Google Scholar]
  88. Bentley, J.H.; Ziegler, H.F.; Streets-Salter, H. Traditions & Encounters: A Brief Global History; McGraw-Hill Education: New York, NY, USA, 2008. [Google Scholar]
  89. Stavrianos, L.S. A Global History: From Prehistory to the 21st Century; Prentice Hall: Upper Saddle River, NJ, USA, 1999. [Google Scholar]
  90. Bryce, J. The Holy Roman Empire; Macmillan and Co.: London, UK; New York, NY, USA, 1889; Available online: https://archive.org/details/cu31924019888258/page/n7/mode/2up (accessed on 29 July 2024).
  91. Riley Smith, J. The Oxford History of the Crusades; Oxford University Press: New York, NY, USA, 2002. [Google Scholar]
Figure 1. Methodological framework.
Land 13 01401 g001
Figure 2. This figure presents the statistical data visualization by country and time. The figure contains two panels: (a) the top 20 countries by number of SRN sites and (b) the number of heritage sites by century with a polynomial trend.
Land 13 01401 g002
Figure 3. Major cities along the Silk Roads [32]; see Appendix B for detailed cities.
Land 13 01401 g003
Figure 4. This figure displays the K function with significance bounds. The K function (represented by the solid black line) measures the degree of spatial clustering as a function of distance. The distance is plotted on the x-axis, while the K(r) values are on the y-axis. The red dashed line represents the significance bounds, providing a reference to assess whether the observed spatial clustering (black line) deviates significantly from a random distribution.
Land 13 01401 g004
Figure 5. This figure illustrates the L function with significance bounds. The L function, represented by the solid black line, is a transformation of the K function used to detect spatial clustering or dispersion over distance. The x-axis denotes distance, while the y-axis shows L(r) − r, adjusting the L function to a zero baseline for easier interpretation. The solid black line depicts the observed spatial pattern, while the red dashed line represents the significance bounds.
Land 13 01401 g005
Figure 6. The G function with significance bounds. The solid black line represents the observed spatial distribution of points, while the red dashed line indicates the expected distribution under randomness. The grey shaded area marks the significance bounds. The sharp rise in the G function above these bounds suggests significant spatial clustering at shorter distances.
Land 13 01401 g006
Figure 7. This is a figure illustrating the spatial and temporal analysis of heritage site distributions along the Silk Road network (SRN) using various statistical and clustering methods. The figure contains four panels: (a) the distribution of nearest neighbor coefficients (NNCs) over time; (b) the DBSCAN clustering results; (c) the silhouette scores over time; (d) the temporal distribution of clusters from the 2nd century B.C.E. to the 15th century C.E., showing the clusters’ relative density and diversity over different periods.
Land 13 01401 g007
Figure 8. This is a figure illustrating the heatmap of Kernel Density Estimation (KDE) results for heritage sites along the Silk Road network (SRN). The figure contains five panels, each representing a different time period: (a) KDE for 2nd century B.C.E.; (b) KDE for 1st century B.C.E.; (c) KDE for 1st century; (d) KDE for 2nd century; (e) KDE for 3rd century C.E.
Land 13 01401 g008
Figure 9. This is a figure illustrating the heatmap of Kernel Density Estimation (KDE) results for heritage sites along the Silk Road network (SRN) from 4th to 8th century. The figure contains five panels, each representing a different time period: (a) KDE for 4th century; (b) KDE for 5th century; (c) KDE for 6th century; (d) KDE for 7th century; (e) KDE for 8th century.
Land 13 01401 g009
Figure 10. This is a figure illustrating the heatmap of Kernel Density Estimation (KDE) results for heritage sites along the Silk Road network (SRN) from the 9th to 15th Century. The figure contains seven panels, each representing a different time period: (a) KDE for 9th century; (b) KDE for 10th century; (c) KDE for 11th century; (d) KDE for 12th century; (e) KDE for 13th century; (f) KDE for 14th century; (g) KDE for 15th century.
Land 13 01401 g010
Figure 11. This is a figure illustrating the scatter plot of Kernel Density Estimation (KDE) results for heritage sites along the Silk Road network (SRN) from 2nd century B.C.E. to 3rd century. The figure contains seven panels, each representing a different time period: (a) KDE for 2nd century B.C.E.; (b) KDE for 1st century B.C.E.; (c) KDE for 1st century; (d) KDE for 2nd century; (e) KDE for 3rd century.
Land 13 01401 g011
Figure 12. This is a figure illustrating the scatter plot of Kernel Density Estimation (KDE) results for heritage sites along the Silk Road network (SRN) from the 4th to 8th century. The figure contains five panels, each representing a different time period: (a) KDE for 4th century; (b) KDE for 5th century; (c) KDE for 6th century; (d) KDE for 7th century; (e) KDE for 8th century.
Land 13 01401 g012
Figure 13. This is a figure illustrating the scatter plot Kernel Density Estimation (KDE) results for heritage sites along the Silk Road network (SRN) from the 9th to 15th century. The figure contains seven panels, each representing a different time period: (a) KDE for 9th century; (b) KDE for 10th century; (c) KDE for 11th century; (d) KDE for 12th century; (e) KDE for 13th century; (f) KDE for 14th century; (g) KDE for 15th century.
Land 13 01401 g013
Figure 14. Timeline of historical events along the SRN.
Land 13 01401 g014
Disclaimer/Publisher’s Note: The statements, opinions and data contained in all publications are solely those of the individual author(s) and contributor(s) and not of MDPI and/or the editor(s). MDPI and/or the editor(s) disclaim responsibility for any injury to people or property resulting from any ideas, methods, instructions or products referred to in the content.