Article

Quantifying the Cumulative Effects of Large-Scale Reclamation on Coastal Wetland Degradation

1
College of Science, Shihezi University, Shihezi 832000, China
2
Key Laboratory of Land Surface Pattern and Simulation, Institute of Geographic Sciences and Natural Resources Research, Chinese Academy of Sciences, Beijing 100101, China
3
College of Resources and Environment, Chengdu University of Information Technology, Chengdu 610225, China
*
Author to whom correspondence should be addressed.
Land 2024, 13(9), 1404; https://doi.org/10.3390/land13091404
Submission received: 18 July 2024 / Revised: 29 August 2024 / Accepted: 30 August 2024 / Published: 31 August 2024
(This article belongs to the Section Land Environmental and Policy Impact Assessment)

Abstract

:
Considering the importance of coastal wetlands as key land resources and the ecological degradation caused by large-scale and multi-stage reclamation, as well as the significant synergistic and superimposed effects of reclamation on wetland degradation in temporal and spatial dimensions, it is vital to conduct in-depth research on the impact mechanisms and cumulative effects of reclamation on wetland degradation. However, the existing methods for evaluating these cumulative effects still have some shortcomings in characterizing the spatiotemporal scale. Consequently, it is urgent to introduce or develop a cumulative effect evaluation method based on remote sensing. Taking the Jiangsu coastal wetland as a typical case study area, the present study constructed a cumulative effect evaluation method based on calculus theory combined with landscape succession modeling and statistical analysis. This method was then used to quantitatively analyze the impacts and cumulative effects of reclamation on wetland degradation in the Jiangsu coastal region from 1980 to 2024. The results show that degradation of the Jiangsu coastal wetlands over the last 45 years covered 2931.54 km2, accounting for 46.92% of the area in 1980. This degradation primarily reflects a shift from natural wetland to constructed wetland. In addition, the reclaimed area of 2119.61 km2 is mainly used for aquaculture and agricultural cultivation. The reclamation rate of Jiangsu showed insignificant fluctuations and significant spatial differences. The reclamation rate of the north counties and cities presented a downward trend, while that of the south counties and cities presented an upward trend. Reclamation has a significant impact on wetland degradation, with a contribution rate of 50.62%. The cumulative effect in the study area reached its maximum value in 2015, except for Nantong City. This study provides a new perspective for quantitatively analyzing the impacts and cumulative effects of coastal wetland reclamation and provides guidance for the effective management and sustainable utilization of coastal wetland resources.

1. Introduction

Coastal wetlands are a crucial landscape cover type and contain unique ecosystems that play a vital role in maintaining ecological balance and biodiversity [1]. Moreover, in such areas, marine–terrestrial interactions and human activity are intense. Large-scale reclamation activities alter the natural attributes of coastal wetlands and various environmental factors (such as tidal flat topography, hydrological conditions, dynamic characteristics, sedimentation features, and soil physicochemical properties), leading to changes in the quality of material cycles, energy flow, and information transmission. These changes affect ecosystem structures and functions at various levels, with a profound and complex impact on wetland degradation [2,3,4,5,6]. The cumulative impact of reclamation on wetland degradation has become one of the most pressing issues facing coastal areas [7].
Wetland degradation refers to the deviation of wetland ecosystems from their natural state over a certain spatial and temporal scale due to natural or anthropogenic disturbances exceeding the system’s adaptive capacity [8]. Scholars have conducted extensive research and achieved significant results regarding assessment methods for wetland degradation. The single-factor assessment method determines degradation by comparing changes over time based on individual ecological indicators (such as area, function, and diversity) [9,10], emphasizing the importance of selecting appropriate indicators to reflect the directionality of ecosystem succession. The multi-factor synthesis method assesses degradation through the weighted sum of multiple factors before and after degradation [11,12]. However, this method faces challenges in accurately reflecting the complexity and directional changes of ecosystems, sometimes leading to redundant or contradictory indicators. The landscape ecology method diagnoses wetland degradation through changes in landscape indices [13]. This method relies on statistical or topological calculations and is sometimes unable to reflect specific ecological processes and functions due to a lack of ecological significance. These methods all face the potential risk of misjudging wetland degradation due to insufficient consideration of the directionality in ecological succession [8]. Therefore, utilizing wetland degradation assessment methods based on the directionality of ecosystem succession (e.g., Spartina alterniflora invasion and the conversion of natural wetlands to artificial wetlands or non-wetlands) may be a better choice for diagnosing wetland degradation.
The impact of reclamation on wetland degradation is a complex and multi-dimensional problem mainly reflected in direct occupation, in which reclamation directly occupies the original wetland space, leading to a reduction in wetland area and the destruction of ecosystem structures; additionally, hydrological change occurs, which involves reclaiming changes in the hydrological conditions of surrounding waters, such as velocity and tidal law. In turn, the hydrological cycle and ecological function of the wetland will be affected, potentially leading to pollution of surrounding water bodies due to waste and chemical substances generated in the reclamation process and biodiversity loss, as reclamation will lead to a loss of biological habitat, affecting species diversity. The cumulative effects of reclamation refer to the aggregated impacts on the wetland environment caused by the development and utilization activities of tidal flat resources interacting with the ecosystem over time and space [14,15]. The assessment methods include ecological surveys, interaction matrixes, expert judgments, model simulations, and Geographic Information Systems [16]. The ecological survey method measures the impact of reclamation on wetlands by monitoring changes in environmental factors, biodiversity, species composition, and ecosystem functions in the field [17]. This method’s advantage lies in providing direct evidence of ecological change and degradation. However, this method is time-consuming, labor-intensive, and typically limited to specific areas or time periods. The interaction matrix method intuitively expresses the interrelations between environmental behavior and factors but does not fully consider cumulative time [18]. The expert judgment method mainly focuses on analyzing the cause–effect relationship of cumulative effects and is qualitative, lacking spatiotemporal analytical capabilities [16]. Model simulation uses mathematical models to analyze and predict the sources of impacts, the cumulative process, and spatiotemporal accumulation, with accuracy largely dependent on the quality and readability of data [19,20,21]. The GIS (Geographic Information System) can be used for effect analyses at different spatial scales and time points and to analyze spatial changes in effects at different time points. However, the GIS cannot be used to analyze the cumulative process and cause–effect relationships [22]. The effects of large-scale and multi-stage reclamation projects on wetland degradation are synergistic and superimposed in time and space, while existing methods are insufficient at the spatial and temporal scale of cumulative effects. Remote sensing provides strong technical support for dynamically monitoring wetland changes due to its uniquely large range, high frequency, and non-contact observations. Therefore, a cumulative effect evaluation method based on remote sensing may be a good choice.
The geology of Jiangsu coastal Wetland is dominated by chalky sandy silt deposits, which are susceptible to the influence of water currents and oceanic dynamics. At the same time, the climate is a monsoon transition zone, with concentrated precipitation and abundant light. However, extreme weather events (e.g., typhoons and torrential rains) occur frequently, posing challenges to the wetland ecosystem. At the same time, Jiangsu’s coastal development strategy is aligned with the “One Belt, One Road”, the Yangtze River Economic Belt, and the Yangtze River Delta Integration, and the large-scale reclamation of coastal wetlands will continue to be one of China’s socioeconomic development strategies. Therefore, wetland degradation is serious due to both natural and anthropogenic factors [8]. Although a series of reclamation control measures have been implemented in recent years to ensure that the ecological environment of coastal wetlands is effectively protected, the needs of social development must also be met. Consequently, there is no conflict between the reclamation of coastal wetlands and reclamation control measures, but a balance must still be achieved. Therefore, exploring the impact of large-scale reclamation on coastal wetland degradation is crucial for the coordinated development of global coastal wetland reclamation and regional ecological and environmental protection. In this context, the primary objectives of this study were as follows: (1) to explore the relationship between reclamation and coastal wetland degradation; (2) to quantify the relative contribution of different reclamation types to wetland degradation; and (3) to develop an assessment method for the cumulative effects of reclamation on wetland degradation by analyzing the cumulative impact of reclamation on wetland degradation and its spatial variability. The results of this study are important for achieving coordinated development between coastal wetland reclamation and ecological and environmental protection.

2. Materials and Methods
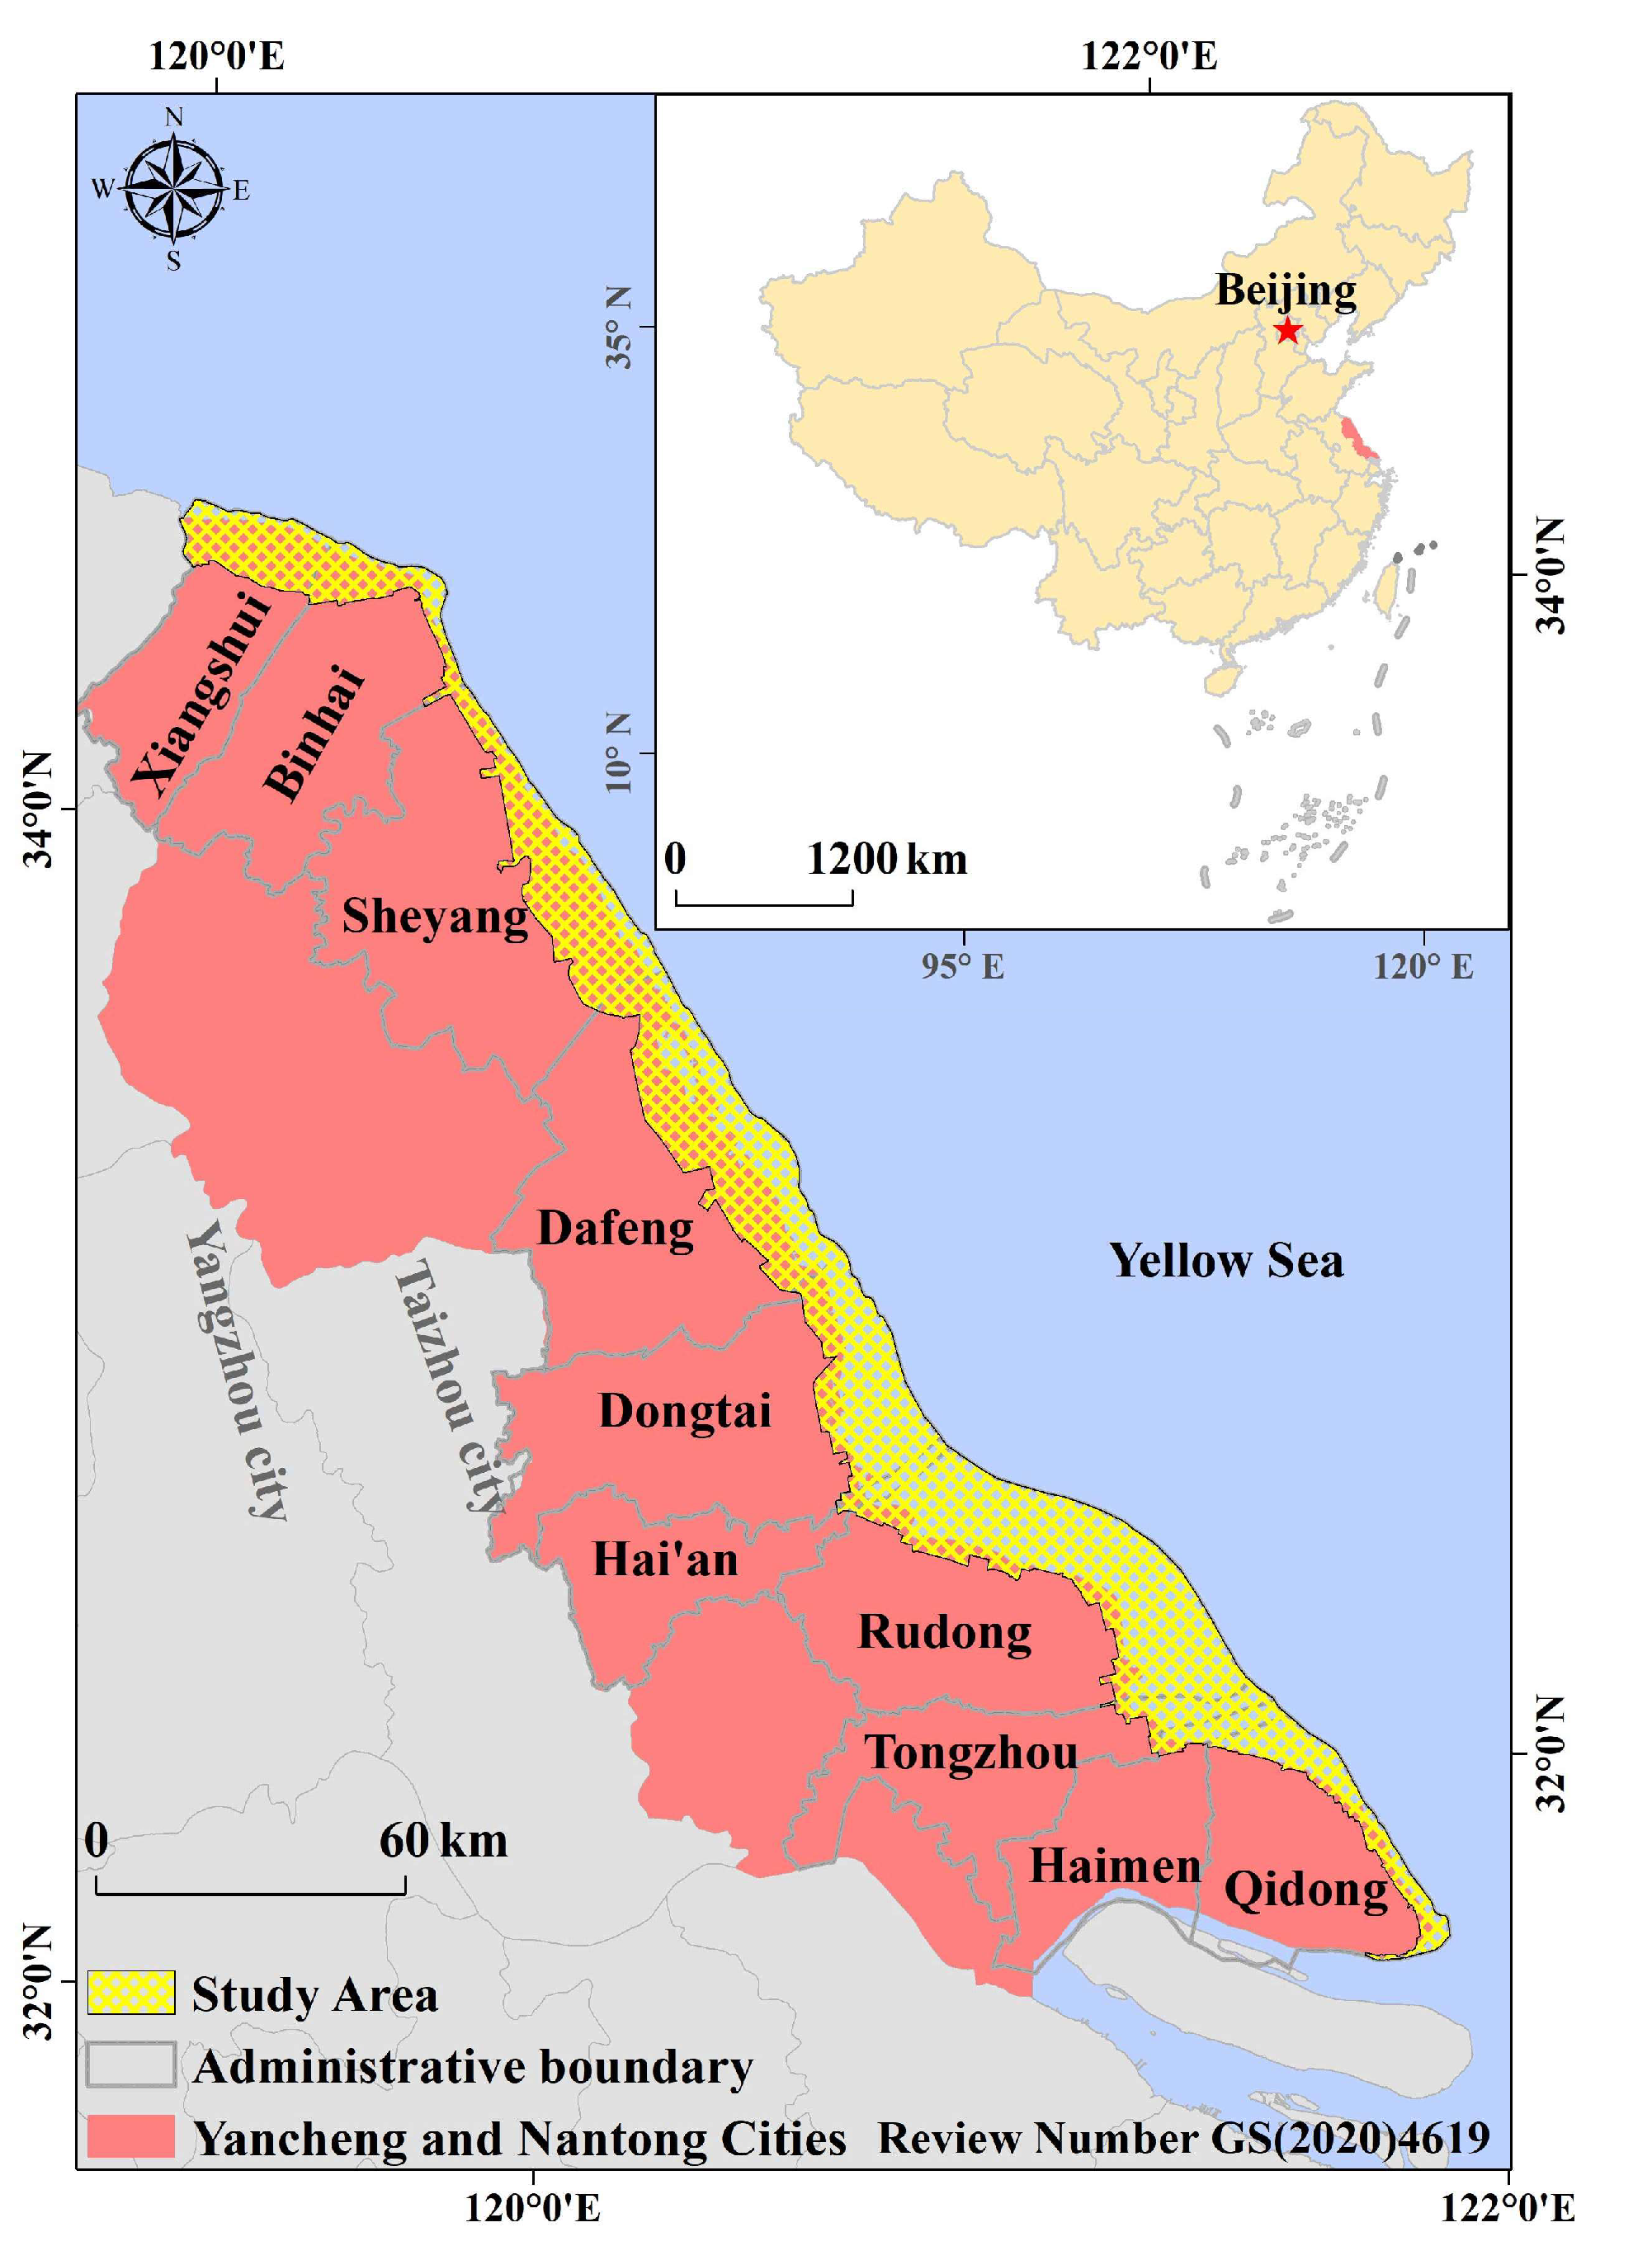
2.1. Study Area

The Jiangsu coastal wetlands extend from the Guanhe River mouth in the north to the Yangtze River mouth in the south and from the coastal highway in the west to the average multiple low tide lines in the east. This area encompasses the abandoned Yellow River Delta, Lixiahe Plain, and the northern wing of the Yangtze River Delta, covering the coastal regions of Yancheng and Nantong Cities in Jiangsu Province, China, with an area of approximately 7000 km2 (Figure 1). This region contains China’s largest coastal belt conservation area, the Yancheng National Nature Reserve, which serves as a stopover, breeding, and wintering site for millions of migratory birds along the “East Asia–Australasia” flyway. Since the founding of the People’s Republic of China, this area has undergone developments in sea salt production (salt field landscape), cotton cultivation (cotton field landscape), marine aquaculture (aquaculture landscape), port and waterway construction (port landscape), and the invasion of exotic species. Natural and anthropogenic disturbances significantly alter regional ecosystem structures and functions, leading to drastic landscape changes and severe wetland degradation [8]. Therefore, the Jiangsu coastal wetlands represent an ideal region for studying the impacts of large-scale reclamation on wetland degradation.

2.2. Data Sources

Based on 39 scenes of Landsat MSS/TM/OLI data downloaded from the EarthExplorer website of the United States Geological Survey (https://earthexplorer.usgs.gov/, accessed on 1 August 2024) (Table S1), landscape classification data for the years 1980, 1983, 1986, 1992, 1995, 2000, 2005, 2008, 2011, 2014, 2018, 2020, and 2024 were generated through visual interpretation methods using ArcGIS 10.6 (Figure S1). The MSS and TM data were preprocessed with geometric corrections, atmospheric corrections [23], and splicing, and the OLI data were preprocessed with atmospheric corrections and splicing only.
Additionally, an accuracy assessment of the interpreted data was conducted utilizing field survey data, high-resolution Google Earth imagery, and tidal flat resource survey data. The accuracy ranged from 87.69% to 92.93%, with Kappa coefficients varying between 0.81 and 0.92. Thus, these data fulfilled the research requirements. Seventeen landscape types were determined and classified into natural wetlands (grasslands, rivers, Phragmites australis, Suaeda glauca, Spartina alterniflora, and tidal flats), artificial wetlands (paddy fields, pools, salt fields, and aquafarms), and non-wetlands (drylands, woodlands, urban settlements, rural settlements, bare lands, levees, and other construction lands).
Dynamic reclamation monitoring forms the basis for studying the impact of coastal wetland resource development and utilization on regional ecological environment. In this context, “reclamation” primarily refers to the act of enclosing and utilizing coastal wetland resources for human activities. In the Jiangsu coastal areas, these activities primarily include industrial interventions (port construction, water conservancy projects, salt industry, etc.), aquaculture, and agriculture. Therefore, this paper categorizes “reclamation” into five coastal wetland utilization types: “agricultural planting” (natural wetlands transformed into farmland), “aquaculture” (natural wetlands transformed into aquafarms), “port construction” (natural wetlands transformed into construction land near ports), “water conservancy projects” (natural wetlands transformed into reservoir pits and dams), and “sea salt production” (natural wetlands transformed into salt fields).
This study also used administrative division data (http://bzdt.ch.mnr.gov.cn/ (accessed on 26 June 2024), Review number GS(2020)4619) and the Yancheng National Nature Reserve boundaries (https://www.resdc.cn/Default.aspx, accessed on 26 June 2024).

2.3. Methods

2.3.1. Wetland Degradation Diagnosis

Wetland degradation in the context of this paper refers to the reverse succession of wetland landscapes [24,25]. Figure 2 displays a method for identifying wetland degradation based on landscape directional successional patterns, including six wetland degradation successional sequences: (1) natural wetlands transforming into artificial wetlands or non-wetlands; (2) natural community succession involving soil dewatering; (3) natural community succession involving soil salinization; (4) the invasion of exotic species; (5) artificial wetlands transforming into non-wetland areas; and (6) a succession sequence of ecological service value reduction: paddy field → aquafarm → salt field → pool (e.g., paddy field → aquafarm indicates the conversion from paddy fields to aquafarms) [8,26]. Based on the landscape directional successional models and transition matrices, the percentage of degraded wetland area relative to the total regional or total wetland area was used as an indicator of wetland degradation.

2.3.2. Evaluation Method for Reclamation Impact on Wetland Degradation

The correlation between poldering and wetland degradation was quantified using the Pearson phase relationship based on the spatial and temporal characteristics of the two categories. To adapt to the nonlinear characteristics of the relationship and improve the fitting accuracy, we choose polynomial regression to quantitatively evaluate the impact of poldering on wetland degradation. Meanwhile, to avoid the risk of overfitting, the highest sub-square number was limited to 2. Given the unequal intervals between each time period, this study fitted curves using the reclamation rates of different spatial units (administrative region) across 10 different time periods as independent variables, with the degradation rate as the dependent variable. The significance test of the fitting equation and the coefficient of determination R2, respectively, indicate fitting model reliability and the percentage of variance in the degradation rate, which can be explained by the reclamation rate. Accordingly, a method was developed to evaluate the impacts of reclamation on coastal wetland degradation.
First, we assign the observed degradation rate y and reclamation amount x as y i and x i   ( i = 1 , 2 , , n ) , respectively. The polynomial fitting equations of y and x can then be expressed as
y ^ = a 0 + a 1 x + a 2 x 2 + + a n x n + ε
where y ^ is the estimated degradation rate; a 0 , a 1 , , a n is the coefficient to be determined; and ε is the random error.

2.3.3. Contribution Rate Calculations

To address the multicollinearity issue among independent variables, we employed a multivariate stepwise regression model to determine the contribution rates of different types of reclamation to wetland degradation. The rates for five types of reclamation served as independent variables: aquaculture ( x 1 ), agricultural planting ( x 2 ), port construction ( x 3 ), sea salt production ( x 4 ), and water conservancy projects ( x 5 ). The degradation rate is the dependent variable in the regression model:
y ^ = b 0 + b 1 x 1 + b 2 x 2 + b 3 x 3 + b 4 x 4 + b 5 x 5 + ε
where y ^ is the estimated degradation rate; b 0 , b 1 , b 2 , b 3 , b 4 , b 5 are the regression coefficients for each reclamation type; and ε is the random error.
Assuming that b 1 , b 2 , b 3 , b 4 , b 5 are the standardized regression coefficients of the model, the contribution rates of different reclamation types to wetland degradation were determined using the following equation [27]:
C R m = b m b 1 + b 2 + b 3 + b 4 + b 5 × 100 %   , 1 m 5
where C R m represents the relative contribution rate of the m t h type of reclamation, and b m is the absolute value of b m .

2.3.4. Cumulative Effect Evaluation Method

Introducing the calculus concept to study the cumulative effects of reclamation on wetland degradation leverages the distinction between differentiation and integration. Differentiation focuses on the local rate of change in a function and captures the instantaneous rate of wetland degradation per unit area of reclamation within a very small interval. Integration, conversely, sums up these incremental changes over a range, providing a measure of the total cumulative effect of degradation over a time period. Given the degradation occurring between time t 0 and time t 1 , we can divide this interval into n segments, with each segment starting at x i . Then, the cumulative degradation area D t 1 from time t 0 to t 1 can be represented as follows:
D t 1 D t 0 = lim n i = 0 n D V x i × t 1 t 0 n = D t 0 + lim n i = 0 n D V x i × Δ t
where D t 0 represents the area of degradation at time t 0 (km2), D V x i is the average degradation rate (km2/year) for each segment, and n is the number of intervals. As n approaches infinity, the sum of the incremental areas of degradation becomes the total increase in degraded area over the time period. Mathematically, D t is described as an integral part of D V t :
D t = t 0 t 1 D V t d t + D ( t 0 )
Given that D V t is a function of the reclamation rate, Equation (5) can be rewritten to explicitly express the relationship between the reclamation rate and the time interval. The specific formula is as follows:
D t = D V t Δ t + D ( t 0 ) = f D V w k v Δ t + D t 0
where Δ t is the time interval and D V t is the average degradation rate over this interval, which reflects the degraded area per unit time.
If the reclamation rate w k v t (reclamation area per unit time) is a function of time, integrating this relationship with the formulae for the cumulatively degraded area allows us to derive the cumulatively degraded area solely due to reclamation activity. In this way, we obtain a formula that explicitly accounts for the cumulative impact of reclamation over time:
D t = t 0 t 1 f D V ( f t ( t ) ) d t + D t 0 = t 0 t 1 f t d t + D t 0
where t 0 and t 1 represent the start and end times, respectively. For this study, we set the start time to 1980 and assume = 0  km2. By applying this formula, we can calculate the cumulative area of degradation attributable to reclamation activity at various points in time relative to 1980. This study used the MATLAB 2021b software for modeling.

3. Results

3.1. Reclamation Spatiotemporal Dynamic Variations

Between 1980 and 2024, 2119.61 km2 of coastal wetlands in Jiangsu were reclaimed, with an average annual reclamation rate of 48.17 km2 (Figure 3). The primary use of the reclaimed land was aquaculture, followed by agricultural planting, port construction, water conservancy projects, and sea salt production (Figure 3 and Figure S1). Spatially, reclamation intensity was stronger in the central regions of Jiangsu, with weaker activity in the northern and southern regions. The total reclamation area varied significantly among counties and cities. Dafeng City, Sheyang County, Rudong County, and Dongtai City each reclaimed more than 250 km2 of coastal wetlands between 1980 and 2018. In contrast, Hai’an City contained the smallest reclamation area of only 25.96 km2.
The reclamation rate in Jiangsu showed a non-significant fluctuating downward trend (Table 1), with land reclamation during 10 periods amounting to 168.99, 126.50, 97.54, 246.89, 295.22, 420.43, 79.03, 295.16, 173.04, 67.07, 61.03, and 87.72 km2, respectively. The most intense poldering was mainly concentrated during the years 1992–2014. Spatial variability was also observed in the trend in reclamation changes. The reclamation rate in Yancheng City showed a downward trend, whereas that in Nantong City exhibited an upward trend. Among the 10 counties and cities, the reclamation rate presented a downward trend in the northern counties of Xiangshui, Binhai, Sheyang, and Dafeng, while the other six counties experienced an upward trend. Additionally, the reclamation rates in Xiangshui, Binhai, Sheyang, and Dafeng peaked earlier than those in the six southern counties and cities, indicating a trend of mitigation in the northern counties and intensification in the southern counties. This result reveals regional variations in reclamation practices and trends over the study period, suggesting differing priorities and developmental pressures across the region. This information could inform future policies and strategies for coastal management, emphasizing the need for sustainable development practices that balance economic growth and ecological conservation.

3.2. Coastal Wetland Degradation Characteristics

Between 1980 and 2024, the degraded coastal wetland area in Jiangsu reached 2931.54 km2, accounting for 41.76% of the total coastal wetland area in Jiangsu (7020.52 km2) and 46.92% of the region’s wetland area at the beginning of the period (1980) (Table 2). Habitat loss accounted for the highest proportion of degradation type, with an area of 1661.05 km2, accounting for 56.66% of the total degraded wetland area in the region. Therefore, over the last 45 years, the primary form of wetland degradation in Jiangsu’s coastal areas has been the transformation of natural wetlands into artificial wetlands, followed by the absolute loss of natural wetlands, constituting 24.94% of the structural degradation area in the tidal flat wetland system.
Artificial wetland transformation into non-wetland areas and the decline in artificial wetland service functions accounted, respectively, for 8.95 and 0.66% of the degradation. These are smaller proportions among the wetland degradation types, indicating that the degradation processes in modern wetland ecology and the degree of degradation caused by artificial wetland types are relatively weak and not significantly impactful in the Jiangsu coastal wetland regions. This analysis highlights the critical issue of habitat loss as the leading cause of wetland degradation in Jiangsu, underscoring the need for targeted conservation and restoration efforts focused on preventing natural wetland conversion into artificial forms and addressing the absolute loss of wetlands. Moreover, the relatively minor role of artificial wetland transformation and service function decline in overall wetland degradation suggests that conservation strategies should prioritize maintaining and enhancing existing natural and artificial wetland ecological functions to mitigate further losses.

3.3. Reclamation Impact on Wetland Degradation

3.3.1. Correlation between Reclamation and Wetland Degradation

Over the last 45 years, the reclamation volume has shown a highly significantly positive correlation with the total area of wetland degradation, habitat loss, Spartina invasion, absolute loss, and progressive loss, with correlation coefficients of 0.82, 0.91, 0.61, 0.40, and 0.24, respectively (Figure S2). Additionally, the correlation coefficient between the reclamation volume and natural wetland transformation into degraded states (0.84) was higher than that for artificial wetland transformation into degraded states (0.27), both of which passed the relevant significance tests. This result indicates that coastal wetland reclamation significantly affects regional ecological degradation, with a greater effect on natural than artificial wetland transformation.
The total area of degradation also presented a significantly positive correlation with both natural and artificial wetland transformation into degraded states, with correlation coefficients of 0.94 and 0.53, respectively. Significant correlations were observed between the total degraded area and the transformation of natural into artificial wetlands and natural wetlands into non-wetlands, the internal degradation of natural wetlands, Spartina invasion, the transformation of artificial wetlands into non-wetlands, and the internal degradation of artificial wetlands, with correlation coefficients of 0.89, 0.47, 0.45, 0.69, 0.46, and 0.34, respectively. These results demonstrate that reclamation primarily affects the transformation of natural into artificial wetlands and Spartina invasions, both of which play dominant roles in landscape ecological degradation in the study area. These findings highlight the significant effects of reclamation on coastal wetland degradation, particularly through the conversion of natural into artificial wetlands and Spartina alterniflora invasion. These strong correlations highlight the need for management strategies that carefully consider the consequences of reclamation activity on wetland ecosystems, focusing on preserving natural wetlands and controlling invasive species to mitigate ecological degradation.

3.3.2. Reclamation Impact on Ecological Degradation in Coastal Wetland Areas

The optimal statistical relationship between the reclamation and wetland degradation rates (modeled in Figure 4) indicates that, for the entire coastal wetland area, Yancheng City coastal wetland area (study area northern region), and Nantong City coastal wetland area (study area southern region), the best-fit statistical models are polynomials, with all passing the necessary significance tests. The model equations explained 50.62, 52.74, and 57.40% of total variance in the degradation rates for the corresponding regions.
Based on the coefficients of the quadratic terms in the fitting equations, we observed that the wetland ecological degradation rates in the coastal wetland area and in Yancheng City initially increased and then decreased with increases in the reclamation rates. The reclamation rates corresponding to the extremal points of the fitted curves were 88.85 and 69.70 km2/year, respectively. In contrast, the wetland degradation rate in Nantong City exhibited a monotonically increasing trend with an increase in the reclamation rate. Additionally, based on the fitted equations, when the reclamation rate was >66.68 km2/year, the wetland degradation rate in Nantong City was greater than that in Yancheng City. When the reclamation rate was between 0 and 66.68 km2/year, the wetland degradation rate in Yancheng City exceeded that in Nantong City. These results demonstrate a clear relationship between reclamation and degradation in the Jiangsu coastal wetlands over the past 45 years. The polynomial nature of these relationships suggests that reclamation impacts on wetland degradation are complex and vary with the intensity of reclamation activities. This complexity underscores the need for nuanced and region-specific strategies to manage wetland conservation and reclamation projects and mitigate the adverse effects of reclamation on coastal wetland ecosystems.

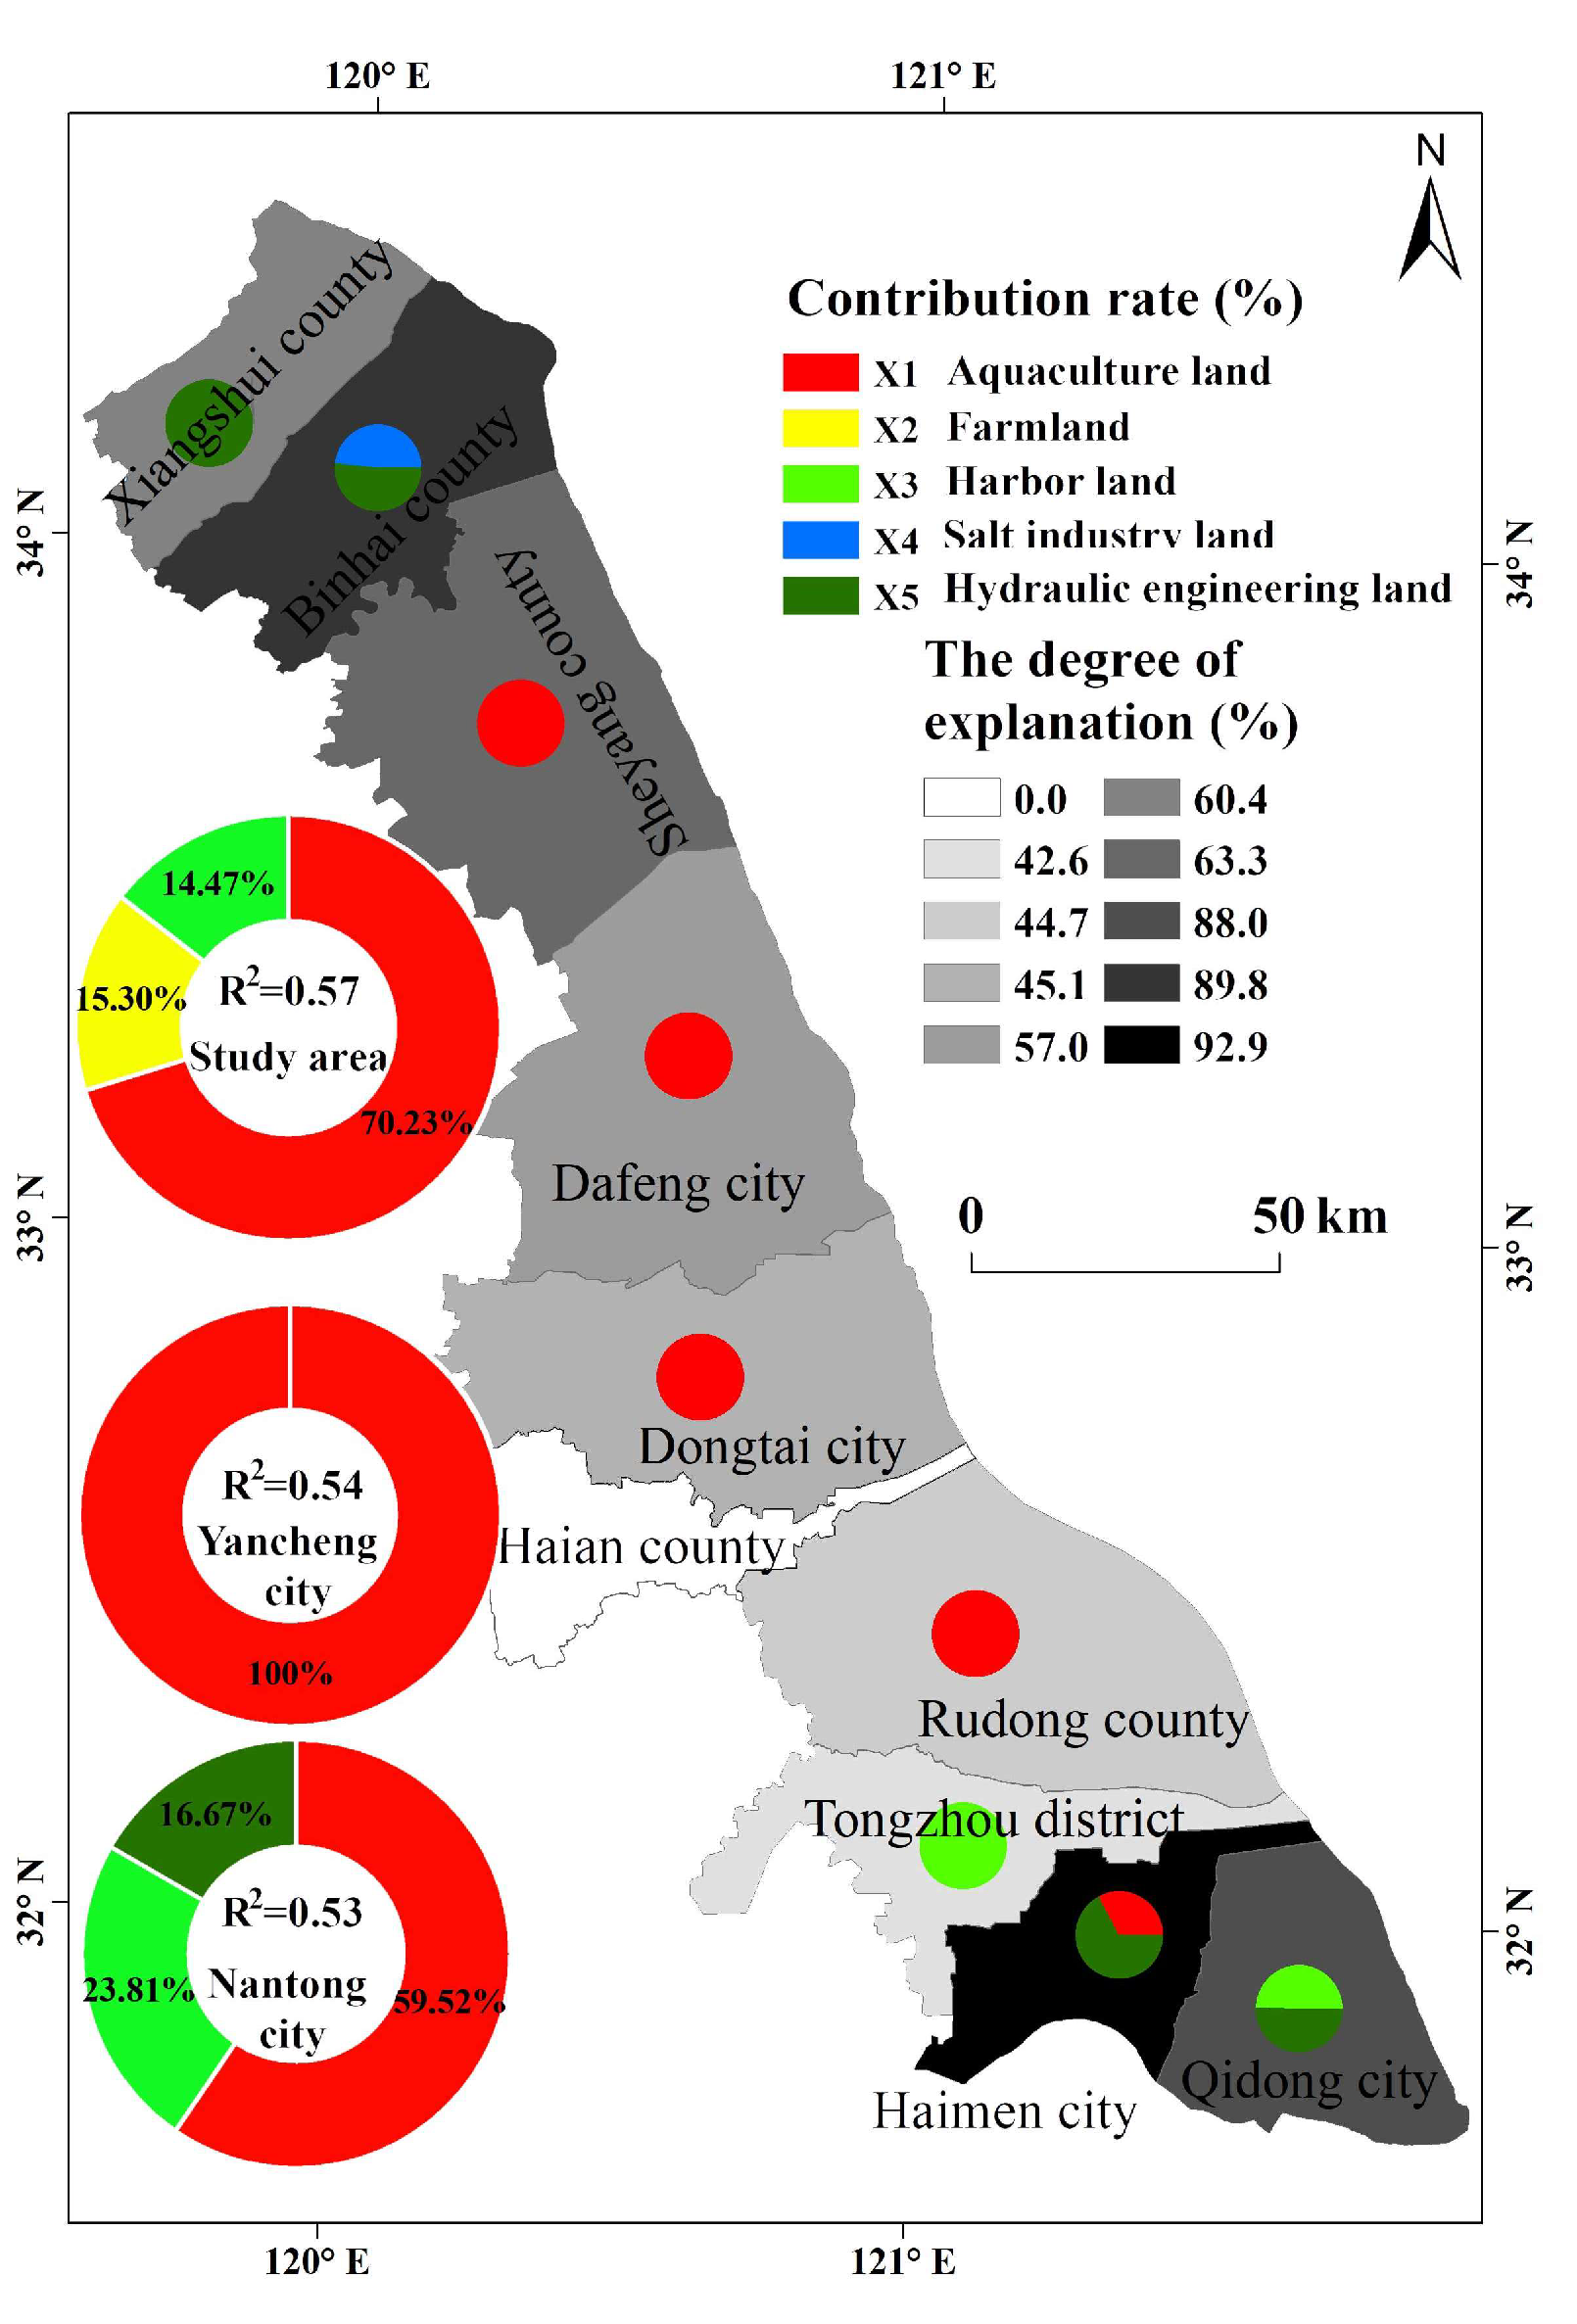
3.3.3. Different Reclamation Type Contributions to Wetland Degradation

Using the rates of five reclamation activity types as independent variables ( x 1 : aquaculture; x 2 : agricultural planting; x 3 : port construction; x 4 : sea salt production; x 5 : water conservancy projects) and the degradation rate as the dependent variable, we employed stepwise regression to construct regression equations analyzing the contribution of each reclamation type to wetland degradation in different regions, as shown in Figure 5. Except for Hai’an City, the stepwise regression equations for all other regions passed the significance tests, with R2 values > 0.4. This result suggests that the regression equations can adequately explain the contributions of different reclamation types to wetland degradation.
The contribution rates of the different reclamation types to wetland degradation varied by region. Across the entire coastal wetland area, aquaculture had the most significant impact on wetland degradation, followed by agricultural planting and port construction, whereas other reclamation types had the lowest impact. In Yancheng City, the primary reclamation type’s contribution rate and R2 equation were 100% (aquaculture) and 0.54, respectively, although aquaculture (59.52%), port construction (23.81%), and water conservancy projects (16.67%) also made significant contributions in Nantong City. Among the nine cities and counties with significant regression equations, the primary reclamation types were as follows: Xiangshui County (water conservancy projects), Binhai County (water conservancy projects and sea salt production), Tongzhou District (port construction), Haimen City (water conservancy projects), and Qidong City (water conservancy projects and port construction). The primary reclamation type for the remaining four counties and cities was aquaculture. Although the impacts of the different reclamation types in Hai’an City were not significant, aquaculture and port construction still contributed to local wetland degradation. This result highlights the varied impacts of reclamation activity on wetland degradation across different regions and emphasizes the dominant role of aquaculture in driving this process. These results underscore the need for targeted management and conservation strategies that consider specific reclamation practices and their ecological impacts in different areas to effectively address and mitigate wetland degradation.

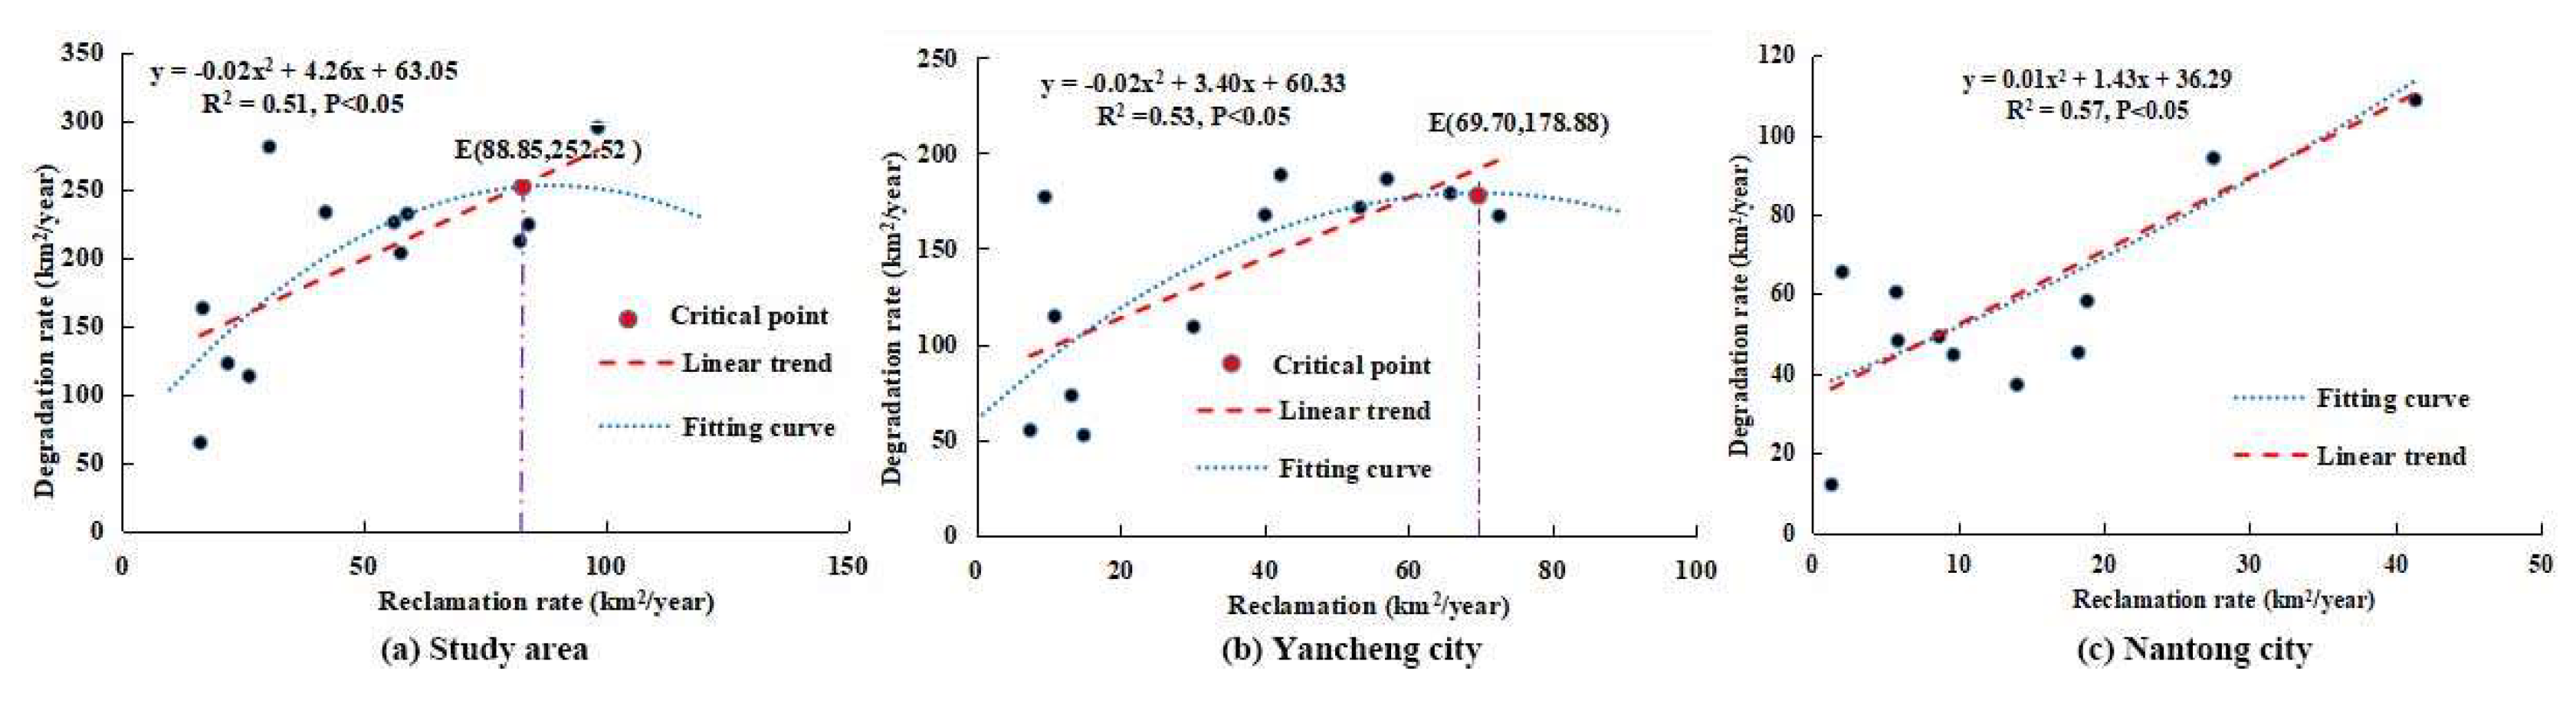
3.3.4. Reclamation Cumulative Effects on Wetland Degradation

Using the cumulative effect analysis method proposed in this study, we derived the cumulative effect curve for the impact of reclamation on wetland degradation in the Jiangsu coastal wetland area and identified the key threshold points of the cumulative effect changes through the first derivative (Figure 6). The overall cumulative effect in the study area was positive, indicating that reclamation has a cumulative effect on wetland degradation. Although there were minor fluctuations between 1985 and 1992, the trend from 1980 to 2015 increased significantly, followed by a decreasing trend after 2015. This result suggests that the cumulative impact of coastal reclamation on wetland degradation in Jiangsu was mitigated after 2015, which is likely related to increased governmental efforts to protect coastal wetlands during this period.
The cumulative effect curve of reclamation on wetland degradation in Yancheng City was similar to that for the entire study area, with only slight differences in the threshold point position, which occurred in 2013 in Yancheng City. In contrast, the cumulative effect in Nantong City showed a linearly increasing trend, with no recent turning points. This result indicates that the turning point for the cumulative effect in the Jiangsu coastal wetland area occurred in 2015; however, there was spatial variability in this outcome. The cumulative effect in Yancheng City presented a slowing trend after 2013, whereas Nantong City exhibited a gradually increasing trend. These findings highlight the importance of recognizing and addressing spatial and temporal differences in the cumulative effects of reclamation on wetland degradation. The identification of key threshold years could inform targeted management and conservation measures by indicating the periods during which the impact of reclamation activity on wetland degradation begins to shift, thereby enabling more effective planning and implementation of wetland protection strategies.

4. Discussion

4.1. Methodological Feasibility

The impact of reclamation on the ecological environments of estuaries and coasts is characterized by significant temporal persistence and spatial expansiveness. These effects accumulate over time, with potential for the impact area to expand both overtly and covertly, gradually accumulating and amplifying impacts over time and space. This phenomenon is known as the time–space cumulative effect [26,28]. Cumulative effects refer to the gradual accumulation of reclamation impacts on ecological degradation within a certain time and space. These effects lead to changes in ecologically degraded areas after reaching a certain threshold, which is an expression of the changes in the ecologically degraded area over time and an expansion in space. Therefore, the relationship between reclamation and ecologically degraded areas can be expressed using a statistical model. If the cumulative distribution function of the ecologically degraded area is denoted by F , we obtain the following:
F t j = f t 1 Δ t 1 + f t 2 Δ t 2 + + f t j Δ t j = i = 1 j f t i Δ t i = 1 t j f t d t
where F t j is the cumulatively degraded area over time t j , f t i is the degraded area in the i t h interval, and Δ t i is the duration of the i t h interval.
The degraded area of the wetlands during a specific period is equal to the product of the wetland degradation rate and the time interval for that period. By establishing a statistical model that links wetland degradation rates to reclamation rates, the cumulative distribution function for wetland degraded areas was used to calculate the cumulative effect of degradation caused by reclamation. Figure 6 shows a significant statistical relationship between the reclamation and degradation rates, which aligns with the findings of many past studies, indicating that reclamation is a primary cause of wetland degradation [29,30,31,32,33].
Thus, by using calculus theory to study the cumulative effects of reclamation on wetland degradation, we can not only elucidate the relationship between reclamation and wetland degradation but also obtain reasonable results. The proposed cumulative effect evaluation method is theoretically feasible, advanced, and reliable. This approach enables a detailed analysis of how reclamation activity contributes to the overall degradation of wetlands over time, providing a quantitative framework for assessing the extent of damage and informing mitigation strategies. By integrating the reclamation and degradation rates, policymakers and environmental managers can develop more effective conservation policies and restoration efforts tailored to the specific dynamics of wetland ecosystems under threat from reclamation activity.

4.2. Results Assessment and Explanation

4.2.1. Reclamation Characteristics

Our study demonstrates that coastal wetland loss in Jiangsu occurred due to reclamation activity. The reclamation rate in the study area from 2000 to 2018 was 57.49 km2/year, which is consistent with the findings of Wang et al. (2020) [34]. When examining Yancheng and Nantong, the reclamation rates for the different periods were consistent with the results of Wang et al. (2020) [34], Chen et al. (2016) [35], and Xu et al. (2022) [36], indicating that the reclamation data extracted in this study are reliable. Reclaimed land was primarily used for aquaculture and agricultural planting [37,38]. This trend is partly due to government policies guiding reclamation in the Jiangsu coastal wetlands, such as the aquaculture and grain–cotton production policies of the 1980s; the “Seafront Sundong” initiative of 1995; the development focus on “ports, towns, and coastal port industries” from 2006 to 2010; the construction of new portside industrial zones, modern agricultural bases, new energy bases, and coastal new towns from 2011 to 2015; and the push for the integrated development of “ports, industry, and towns” from 2016 to 2020 [8,26]. However, the high soil salinity of coastal wetlands is not conducive to crop growth, and aquaculture offers lower costs and higher benefits [8].
High reclamation intensity mainly occurred in 1992–2014, which is similar to the conclusions of Zhang and Pu (2017) [39], who reported that “reclamation intensity was higher in Jiangsu from 1995–2015”. The decreasing rate of reclamation in Yancheng City and the increasing rate of reclamation in Nantong City are consistent with the conclusions obtained by Guo et al. (2021) [40] and Yang et al. (2017) [41]. These spatial and temporal differences in coastal wetland reclamation are primarily influenced by natural conditions and socioeconomic development [34]. The coast from the Guanhe River mouth to the Sheyang River mouth (including Xiangshui and Binhai Counties and the northern region of Sheyang County) is erosive, with limited reclamation potential. The area stretching from the Sheyang River mouth to Dongzao Port (from the Sheyang County southern region to Haimen City) is a typically accretive coast with significant reclamation potential. The southernmost coast of Qidong City is relatively stable [26]. The economic development of Yancheng City was weaker than that of Nantong City, making reclamation a potential driver of local economic growth. Therefore, reclamation activity here exhibits a pattern of being “strong in the middle, and weak in the north and south”. However, as reclamation moves from land to sea, many reclaimed areas fall below the average sea level, which will gradually increase the difficulty of future reclamation efforts [36,42]. Concurrently, the government introduced a series of coastal wetland protection and restoration measures. Consequently, heavily reclaimed northern counties and cities are now experiencing a mitigation trend, while fewer reclaimed southern counties and cities are subject to intensified reclamation activity [43,44].
These policies and natural conditions have shaped the Jiangsu coastal wetland landscape, with reclamation for aquaculture and agriculture playing a significant role. This evolution reflects the complex interplay between policy-driven development goals, economic considerations, and the environmental characteristics of coastal wetland areas, underscoring the requirement for balanced approaches to land use that consider both economic development and wetland conservation. These dynamics also highlight the need for the careful planning and management of reclamation projects, balancing economic development demands with environmental conservation imperatives and resilience to rising sea levels. The evolving approach to coastal wetland management in Jiangsu is increasingly recognizing the value of these ecosystems, not only for their economic potential but also for their role in biodiversity conservation, flood mitigation, and climate-change adaptation.

4.2.2. Reclamation Impact Analysis of Wetland Degradation

Our results show that reclamation has a significant impact on wetland degradation, which also supports the conclusion of previous studies that “reclamation has a significant impact on ecosystem structure and function” [45,46]. More specifically, reclamation has a serious impact on the degradation transformation of natural wetlands (Figure 5). Wang and Gao (2005) [47] and Gómez-Baggethun et al. (2019) [48] obtained similar conclusions in Wanggang, Jiangsu Province, China, and the Danube Delta, respectively. This result is primarily due to the impact of reclamation on wetland degradation becoming directly manifested in landscape transformation from natural to non-natural wetlands but having an indirect impact on artificial wetlands and the internal succession of natural wetlands [49,50]. This impact also exhibits spatial variability (Figure 4 and Figure 6). Yan et al. (2019), moreover, noted the presence of significant differences in bird species and abundance between reclaimed areas and un-reclaimed areas, mainly because reclamation caused changes in land use types [51]. This also demonstrates the impact of reclamation on wetland degradation. Cao et al. (2019) demonstrated that reclamation has the smallest impact on the core area and the largest impact on the experimental area based on the distribution of red-crowned cranes [52]. This result further supports the validity of our findings. The integrity and functions of wetland ecosystems could be protected by more strictly controlling reclamation, especially in places close to the core sections of protected areas. These measures are critical to maintaining biodiversity, ensuring the provision of ecosystem services, and supporting the resilience of coastal ecosystems to environmental change.
The inflection point for the cumulative effect of coastal wetland reclamation in Jiangsu was 2015, which may be related to government policies and ecological restoration. Since China joined the Convention on Wetlands in 1992, the protection of wetlands in China has progressed through the stages of mapping and consolidating the foundation from 1992 to 2003, the rescue and protection stage from 2004 to 2015, and the comprehensive protection stage from 2016 to the present. Overall, the wetland protection in Jiangsu Province is almost in line with national protection. In 2013, the Jiangsu Province Wetland Protection Plan (2015–2030) was issued, which defined the objectives and measures of wetland protection, including curbing the trend of wetland area reduction, increasing the wetland protection rate, and improving wetland ecological quality. In 2017, the General Office of the Jiangsu Provincial Government issued the Implementation Plan of Jiangsu Wetland Protection and Restoration System, which further detailed the specific measures for wetland protection, including the implementation of comprehensive wetland protection, the implementation of total wetland area control, and the strict supervision of wetland use [53]. The Wetland Protection Law of the People’s Republic of China, implemented in 2022, strictly controls the reclamation of wetlands [37]. In December 2022, the State Forestry and Grass Administration, the Ministry of Natural Resources, the Ministry of Ecology and Environment, the Ministry of Water Resources, and the Ministry of Agriculture and Rural Affairs jointly issued the “Special Action Plan for the Prevention and Control of Spartina Alterniflora (2022–2025)”, which seeks to effectively control Spartina Alterniflora nationwide by 2025. To date, the clearance rate has reached more than 90% in all provinces [54]. Therefore, the changing trends related to policies and ecological restoration indicate that the impact of Jiangsu reclamation on wetland degradation has weakened since 2015. Although the overall impact of reclamation on wetland degradation has weakened since 2015, differentiated management measures should be implemented due to the spatial differences in relevant impacts. Such measures could include maintaining the reclamation status quo in Yancheng City and strictly controlling reclamation in Nantong City to ensure the health and stability of the wetland ecosystem.

4.3. Study Uncertainties and Limitations

Evaluation methods and data are the principal sources of uncertainty in studies related to wetland degradation, resulting from both natural and anthropogenic factors [55]. Reclamation is one of the major drivers of wetland degradation, and disentangling the impact of reclamation from other factors is a key step in studying its cumulative effects. This study evaluated the relevant impacts using statistical relationships between reclamation and degradation rates, rather than mechanistic models, which can introduce uncertainties. Future research will require improved methods to isolate reclamation effects, analyze degradation drivers, and understand the corresponding impact mechanisms.
Data uncertainty arises primarily from data processing [56]. The landscape and reclamation data in this study were derived from historical remote-sensing data through visual interpretation, which inevitably led to uncertainty when interpreting the results. Additionally, this study focused only on the utilization modes of coastal wetland resources (“agricultural planting”, “aquaculture”, “port construction”, “water conservancy projects”, and “sea salt production”) and did not consider other reclamation behaviors (enclosed but not reclaimed) due to human activity. As these behaviors are less frequent and semi-open, with weaker interpretability using remote sensing, such data uncertainty was deemed acceptable.
This study has some limitations. First, the impact of reclamation generally transcends administrative boundaries, and natural geographic units may be more conducive to exploring the characteristics of reclamation impacts on wetland degradation. Furthermore, the spatial representation of reclamation impacts and their cumulative effects, as well as methods for determining the reclamation threshold, require further research. Addressing these uncertainties and limitations in future studies will enhance our understanding of the intricate relationship between wetland reclamation and degradation. This area of research also supports the development of more nuanced and effective strategies for wetland conservation, balancing the importance of economic development with the need for ecological preservation.

5. Conclusions

In this study, we proposed a cumulative effect assessment method based on calculus theory, discussed the spatiotemporal evolution characteristics of the reclamation and degradation of Jiangsu coastal wetland, and quantified the impact of reclamation on wetland degradation and its cumulative effects based on the landscape classification data of Jiangsu coastal wetland from 1980 to 2024. The results show that about 47% of wetlands are degraded compared to the 1980s. In the last 45 years, the reclamation area of the Jiangsu coastal wetlands reached 2119.61 km2. The reclamation rate presented a downward trend overall but retained spatial differences in the region. Reclamation had a significant impact on wetland degradation, accounting for 50.62% of wetland degradation and significantly affecting wetland health in the region. Of the five types of reclamation activities, aquaculture and agricultural cultivation contributed the most to wetland degradation. With the continuous progress of large-scale reclamation, the impact of reclamation on wetland degradation reached an inflection point in 2015, and the cumulative effect was alleviated. However, this effect varied spatially. The cumulative effect in Yancheng City was similar to that in the whole study area, but there was no recent slowing trend in Nantong City. Ultimately, this study demonstrates the effectiveness of the proposed cumulative effect evaluation method and could provide a reference for relevant studies in other areas. In addition, the government and relevant departments should seriously consider the impact of reclamation, implement differentiated control measures, and strive to achieve a balance between the utilization of coastal wetland resources and ecological protection to promote sustainable social and economic development in the coastal region.

Supplementary Materials

The following supporting information can be downloaded at: https://www.mdpi.com/article/10.3390/land13091404/s1, Figure S1. Landscape classification maps. Figure S2. Different reclamation type areas by time period. Figure S3. Correlation analysis results. Table S1. The list of Landsat images in this study between 1980 and 2024.

Author Contributions

L.C.: conceptualization, methodology, formal analysis, funding acquisition, writing—original draft preparation. G.L.: formal analysis, funding acquisition, writing—review and editing. M.Z.: software, validation, investigation, data curation, supervision. Z.Z.: data curation, writing—review and editing. All authors have read and agreed to the published version of the manuscript.

Funding

This work was supported by the National Key Research and Development Program of China (grand no. 2022YFC3204301 and 2018YFC0407502), China Postdoctoral Science Foundation (grand no. 2019M660780), and Natural Science Foundation of Sichuan Province (grand no. 2023NSFSC0250).

Data Availability Statement

The raw data supporting the conclusions of this article will be made available by the authors on request.

Acknowledgments

We thank anonymous reviewers for their constructive comments and suggestions, which improved the quality of this paper.

Conflicts of Interest

The authors declare that they have no known competing financial interests or personal relationships that could have appeared to influence the work reported in this paper.

References

  1. Osland, M.J.; Chivoiu, B.; Enwright, N.M.; Thorne, K.M.; Guntenspergen, G.R.; Grace, J.B.; Dale, L.L.; Brooks, W.; Herold, N.; Day, J.W.; et al. Migration and transformation of coastal wetlands in response to rising seas. Sci. Adv. 2022, 8, eabo5174. [Google Scholar] [CrossRef] [PubMed]
  2. Ewers Lewis, C.J.; Baldock, J.A.; Hawke, B.; Gadd, P.S.; Zawadzki, A.; Heijnis, H.; Jacobsen, G.E.; Roger, K.; Macreadie, P.I. Impacts of land reclamation on tidal marsh ‘blue carbon’ stocks. Sci. Total Environ. 2019, 672, 427–437. [Google Scholar] [CrossRef] [PubMed]
  3. Murray, N.J.; Phinn, S.R.; Dewitt, M.; Ferrari, R.; Johnston, R.; Lyons, M.B.; Clinton, N.; Thau, D.; Fuller, R.A. The global distribution and trajectory of tidal flats. Nature 2019, 565, 222–225. [Google Scholar] [CrossRef] [PubMed]
  4. Wang, X.; Xiao, X.; Zhang, X.; Wu, J.; Li, B. Rapid and large changes in coastal wetland structure in China’s four major river deltas. Glob. Chang. Biol. 2023, 29, 2286–2300. [Google Scholar] [CrossRef]
  5. Zainal, K.; Al-Madany, I.; Al-Sayed, H.; Khamis, A.; Al Shuhaby, S.; Al Hisaby, A.; Elhoussiny, W.; Khalaf, E. The cumulative impacts of reclamation and dredging on the marine ecology and land-use in the kingdom of Bahrain. Mar. Pollut. Bull. 2012, 64, 1452–1458. [Google Scholar] [CrossRef]
  6. Zhang, T.; Song, B.; Han, G.; Zhao, H.; Hu, Q.; Zhao, Y.; Liu, H. Effects of coastal wetland reclamation on soil organic carbon, total nitrogen, and total phosphorus in China: A meta-analysis. Land Degrad. Dev. 2023, 34, 3340–3349. [Google Scholar] [CrossRef]
  7. Foley, M.M.; Mease, L.A.; Martone, R.G.; Prahler, E.E.; Morrison, T.H.; Murray, C.C.; Wojcik, D. The challenges and opportunities in cumulative effects assessment. Environ. Impact Assess. Rev. 2017, 62, 122–134. [Google Scholar] [CrossRef]
  8. Cui, L.; Li, G.; Liao, H.; Ouyang, N.; Li, X.; Liu, D. Remote sensing of coastal wetland degradation using the landscape directional succession model. Remote Sens. 2022, 14, 5273. [Google Scholar] [CrossRef]
  9. Zhang, Y.; Chen, J.; Zhang, J.; Zhang, Z.; Zhang, M. Novel indicator for assessing wetland degradation based on the index of hydrological connectivity and its correlation with the root-soil interface. Ecol. Indic. 2021, 133, 108392. [Google Scholar] [CrossRef]
  10. Zhou, X.; Lei, K.; Meng, W. An approach of habitat degradation assessment for characterization on coastal habitat conservation tendency. Sci. Total Environ. 2017, 593–594, 618–623. [Google Scholar] [CrossRef]
  11. Chen, K.; Cong, P.; Qu, L.; Liang, S.; Sun, Z. Wetland degradation diagnosis and zoning based on the integrated degradation index method. Ocean Coast. Manag. 2022, 222, 106135. [Google Scholar] [CrossRef]
  12. Zhao, R.; Wang, J.; Li, L.; Zhang, L.; Lu, H.; Jiang, X.; Chen, X.; Han, Z.; Dang-Zhi, C.; Wang, H.; et al. Evaluation of alpine wetland ecological degradation based on alpine wetland degradation index: A case study in the first meander of the yellow river. Ecol. Indic. 2024, 158, 111414. [Google Scholar] [CrossRef]
  13. Wu, X.; Dong, W.; Lin, X.; Liang, Y.; Meng, Y.; Xie, W. Evolution of wetland in Honghe national nature reserve from the view of hydrogeology. Sci. Total Environ. 2017, 609, 1370–1380. [Google Scholar] [CrossRef]
  14. Liu, H.; Lv, X.; Zhang, S. Progress on the study of process of wetland landscape changes and cumulative environmental effects. Prog. Geogr. 2003, 22, 60–70. [Google Scholar]
  15. Tollefson, C.; Wipond, K. Cumulative environmental impacts and aboriginal rights. Environ. Impact Assess. Rev. 1998, 18, 371–390. [Google Scholar] [CrossRef]
  16. Smit, B.; Spaling, H. Methods for cumulative effects assessment. Environ. Impact Assess. Rev. 1995, 15, 81–106. [Google Scholar] [CrossRef]
  17. Cao, Z.; Wang, L.; Yang, L.; Yu, J.; Lv, J.; Meng, M.; Li, G. Heavy metal pollution and the risk from tidal flat reclamation in coastal areas of Jiangsu, China. Mar. Pollut. Bull. 2020, 158, 111427. [Google Scholar] [CrossRef]
  18. Hague, E.L.; Sparling, C.E.; Morris, C.; Vaughan, D.; Walker, R.; Culloch, R.M.; Lyndon, A.R.; Fernandes, T.F.; McWhinnie, L.H. Same space, different standards: A review of cumulative effects assessment practice for marine mammals. Front. Mar. Sci. 2022, 9, 822467. [Google Scholar] [CrossRef]
  19. Cao, D.; Shen, Y.; Su, M.; Yu, C. Numerical simulation of hydrodynamic environment effects of the reclamation project of Nanhui tidal flat in Yangtze estuary. J. Hydrodyn. 2019, 31, 603–613. [Google Scholar] [CrossRef]
  20. Sampath, D.M.R.; Boski, T. Key parameters of the sediment surface morphodynamics in an estuary—An assessment of model solutions. Geomorphology 2018, 308, 142–160. [Google Scholar] [CrossRef]
  21. Shen, Y.; Jia, H.; Li, C.; Tang, J. Numerical simulation of saltwater intrusion and storm surge effects of reclamation in pearl river estuary, China. Appl. Ocean Res. 2018, 79, 101–112. [Google Scholar] [CrossRef]
  22. Stelzenmüller, V.; Coll, M.; Mazaris, A.D.; Giakoumi, S.; Katsanevakis, S.; Portman, M.E.; Degen, R.; Mackelworth, P.; Gimpel, A.; Albano, P.G.; et al. A risk-based approach to cumulative effect assessments for marine management. Sci. Total Environ. 2018, 612, 1132–1140. [Google Scholar] [CrossRef] [PubMed]
  23. Cui, L.; Li, G.; Ren, H.; He, L.; Liao, H.; Ouyang, N.; Zhang, Y. Assessment of atmospheric correction methods for historical Landsat TM images in the coastal zone: A case study in Jiangsu, China. Eur. J. Remote Sens. 2014, 47, 701–716. [Google Scholar] [CrossRef]
  24. Cui, L.; Li, G.; Liao, H.; Ouyang, N.; Zhang, Y. Integrated Approach Based on a Regional Habitat Succession Model to Assess Wetland Landscape Ecological Degradation. Wetlands 2015, 35, 281–289. [Google Scholar] [CrossRef]
  25. Muller, F.; Schrautzer, J.; Reiche, E.; Rinker, A. Ecosystem based indicators in retrogressive successions of an agricultural landscape. Ecol. Indic. 2006, 6, 63–82. [Google Scholar] [CrossRef]
  26. Cui, L.; Li, G.; Chen, Y.; Li, L. Response of landscape evolution to human disturbances in the coastal wetlands in northern Jiangsu province, China. Remote Sens. 2021, 13, 2030. [Google Scholar] [CrossRef]
  27. Xu, J. Response of erosion and sediment producing process to soil and water conservation measures in the Wudinghe river basin. Acta Geogr. Sin. 2004, 59, 972–981. [Google Scholar]
  28. Shen, C.; Shi, H.; Zheng, W.; Li, F.; Peng, S.; Ding, D. Study on the cumulative impact of reclamation activities on ecosystem health in coastal waters. Mar. Pollut. Bull. 2016, 103, 144–150. [Google Scholar] [CrossRef]
  29. Chen, L.; Ren, C.; Zhang, B.; Li, L.; Wang, Z.; Song, K. Spatiotemporal dynamics of coastal wetlands and reclamation in the Yangtze estuary during past 50 years (1960s–2015). Chin. Geogr. Sci. 2018, 28, 386–399. [Google Scholar] [CrossRef]
  30. Huang, Y.; Zhang, T.; Wu, W.; Zhou, Y.; Tian, B. Rapid risk assessment of wetland degradation and loss in low-lying coastal zone of shanghai, China. Hum. Ecol. Risk Assess. 2017, 23, 82–97. [Google Scholar] [CrossRef]
  31. Jiang, S.; Xu, N.; Li, Z.; Huang, C. Satellite derived coastal reclamation expansion in China since the 21st century. Glob. Ecol. Conserv. 2021, 30, e1797. [Google Scholar] [CrossRef]
  32. Yu, S.; Cui, B.; Xie, C.; Ma, X.; Man, Y.; Yan, J.; Fu, J. A quantitative approach for offsetting the coastal reclamation impacts on multiple ecosystem services in the yellow river delta. Ecosyst. Serv. 2021, 52, 101382. [Google Scholar] [CrossRef]
  33. Zhou, Y.; Tian, B.; Huang, Y.; Wu, W.; Qi, X.; Shu, M.; Xu, W.; Ge, F.; Wei, W.; Huang, G.; et al. Degradation of coastal wetland ecosystem in China: Drivers, impacts, and strategies. Bull. Chin. Acad. Sci. 2016, 31, 1157–1166. [Google Scholar]
  34. Wang, G.; Xu, C.; Huang, R.; Han, X.; Zhao, J.; She, D. Research on driving forces of reclamation dynamics and land use change in coastal areas of Jiangsu province. J. Hohai Univ. (Nat. Sci.) 2020, 48, 163–170. [Google Scholar]
  35. Chen, X.; Chen, J.; Zhang, C. Evaluation of large-scale development and utilization of coastal tidal flats in Yancheng city. Adv. Sci. Technol. Water Resour. 2016, 36, 53–58. [Google Scholar]
  36. Xu, N.; Wang, Y.; Huang, C.; Jiang, S.; Jia, M.; Ma, Y. Monitoring coastal reclamation changes across Jiangsu province during 1984–2019 using landsat data. Mar. Policy 2022, 136, 104887. [Google Scholar] [CrossRef]
  37. Mao, D.; Yang, H.; Wang, Z.; Song, K.; Thompson, J.R.; Flower, R.J. Reverse the hidden loss of China’s wetlands. Science 2022, 376, 1061. [Google Scholar] [CrossRef]
  38. Wang, X.; Xiao, X.; Xu, X.; Zou, Z.; Chen, B.; Qin, Y.; Zhang, X.; Dong, J.; Liu, D.; Pan, L.; et al. Rebound in China’s coastal wetlands following conservation and restoration. Nat. Sustain. 2021, 4, 1076–1083. [Google Scholar] [CrossRef]
  39. Zhang, M.; Pu, L. The Changing Process of Coastal Wetlands and the Effects of Reclamation in Jiangsu Province in Recent 30 Years. Wetl. Sci. Manag. 2017, 13, 56–60. [Google Scholar]
  40. Guo, Z.; Wang, G.; Wu, Y.; Chen, H.; Li, Y.; Liu, H. Impact of Human Activities on Yancheng Coastline and Coastal Wetlands. J. Ecol. Rural Environ. 2021, 37, 295–304. [Google Scholar]
  41. Yang, H.; Luo, F.; Chang, M.; Zhang, Y.; Song, X. Status and effects of coastal beach reclamation development in Nantong. Port Waterw. Eng. 2017, S1, 33–36. [Google Scholar]
  42. Zhang, X.; Yan, C.; Xu, P.; Dai, Y.; Yan, W.; Ding, X.; Zhu, C.; Mei, D. Historical evolution of tidal flat reclamation in the Jiangsu coastal areas. Acta Geogr. Sin. 2013, 68, 1549–1558. [Google Scholar]
  43. Jin, Y.; Gao, J.; Zhou, K.; Mu, S. Dynamic of land use/cover changes under reclamation and Spartina alterniflora invasion in Jiangsu central coastal wetlands. Geogr. Res. 2017, 36, 1478–1488. [Google Scholar]
  44. Zhang, X.; Wang, W.; Yan, C.; Yan, W.; Dai, Y.; Xu, P.; Zhu, C. Historical coastline spatio-temporal evolution analysis in Jiangsu coastal area during the past 1000 years. Sci. Geogr. Sin. 2014, 34, 344–351. [Google Scholar]
  45. Ouyang, Y.; Wu, L.; Dai, J.; Wu, Y.; Cai, L.; Li, Q.; Wu, J.; Jiang, S. Technical methodologies for the assessment of the impacts of reclamation projects on marine ecology. Environ. Sci. Pollut. Res. 2022, 29, 7595–7603. [Google Scholar] [CrossRef] [PubMed]
  46. Liu, C.; Yan, X.; Han, Z.; Liu, Y.; Li, X.Z.; Li, X.Y.; Zhong, J. Guiding and constraining reclamation for coastal zone through identification of response thresholds for ecosystem services supply-demand relationships. Land Degrad. Dev. 2024, 35, 1804–1817. [Google Scholar] [CrossRef]
  47. Wang, A.; Gao, S. Reclamation of coastal wetlands and sustainable utilization of wetland resources: A case study from Wanggang, Jiangsu Province. J. Nat. Resour. 2005, 20, 822–829. [Google Scholar]
  48. Gómez-Baggethun, E.; Tudor, M.; Doroftei, M.; Covaliov, S.; Năstase, A.; Onără, D.; Mierlă, M.; Marinov, M.; Doroșencu, A.; Lupu, G.; et al. Changes in ecosystem services from wetland loss and restoration: An ecosystem assessment of the Danube Delta (1960–2010). Ecosyst. Serv. 2019, 39, 100965. [Google Scholar] [CrossRef]
  49. Huang, Y.; Li, Y.; Chen, Q.; Huang, Y.; Tian, J.; Cai, M.; Huang, Y.; Jiao, Y.; Yang, Y.; Du, X.; et al. Effects of reclamation methods and habitats on macrobenthic communities and ecological health in estuarine coastal wetlands. Mar. Pollut. Bull. 2021, 168, 112420. [Google Scholar] [CrossRef]
  50. Naser, H.A. Effects of reclamation on macrobenthic assemblages in the coastline of the Arabian gulf: A microcosm experimental approach. Mar. Pollut. Bull. 2011, 62, 520–524. [Google Scholar] [CrossRef]
  51. Yan, F.; Liu, B.; Qiao, Y.; An, S.; Su, A. Effects of reclamation on the community and spatial distribution of wintering waterbirds in Yancheng Nature Reserve. Ecol. Sci. 2018, 37, 20–29. [Google Scholar]
  52. Cao, M.; Liu, W.; Liu, B.; Sun, X. Yancheng coastal wetland and waterfowls’ habitat protection. Environ. Ecol. 2019, 1, 74–79. [Google Scholar]
  53. Liu, R.; Pu, L.; Zhu, M.; Qie, L.; Zhou, Y. Spatio-temporal evolution and influence mechanism of shorelines and tidal flat reclamation during 2000–2020 in Rudong, Jiangsu province. Geogr. Res. 2021, 40, 2367–2379. [Google Scholar]
  54. Jiang, C.; Jia, J.; Yang, Y.; Sheng, R.; Ren, L.; Ji, H.; Ye, S. Forty years of Spartina alterniflora in China: Cognitive evolution and governance strategies. Acta Ecol. Sin. 2024, 44, 1–13. [Google Scholar]
  55. Fluet-Chouinard, E.; Stocker, B.D.; Zhang, Z.; Malhotra, A.; Melton, J.R.; Poulter, B.; Kaplan, J.O.; Goldewijk, K.K.; Siebert, S.; Minayeva, T.; et al. Extensive global wetland loss over the past three centuries. Nature 2023, 614, 281–286. [Google Scholar] [CrossRef] [PubMed]
  56. Halpern, B.S.; Longo, C.; Hardy, D.; Mcleod, K.L.; Samhouri, J.F.; Katona, S.K.; Kleisner, K.; Lester, S.E.; O’Leary, J.; Ranelletti, M.; et al. An index to assess the health and benefits of the global ocean. Nature 2012, 488, 615–620. [Google Scholar] [CrossRef]
Figure 1. Study area location.
Land 13 01404 g001
Figure 2. Directional successional pattern of Jiangsu coastal wetland landscape [8,26].
Land 13 01404 g002
Figure 3. Reclamation types and areas.
Land 13 01404 g003
Figure 4. Relationship between reclamation and degradation rates.
Land 13 01404 g004
Figure 5. Reclamation type contributions to wetland degradation in different regions.
Land 13 01404 g005
Figure 6. Cumulative reclamation effect on coastal wetland degradation.
Land 13 01404 g006
Table 1. Reclamation rates and their trends in different regions and time periods.
Region1980–19831983–19861986–19921992–19951995–20002000–20052005–20082008–20112011–20142014–20182018–20202020–2024AverageTrendlineTrend
XS7.777.232.740.170.300.500.170.690.010.330.480.001.70 Land 13 01404 i001Decrease with fluctuations
BH5.622.360.150.810.060.020.100.200.092.700.000.001.01 Land 13 01404 i002
SY18.8024.769.1919.7422.2711.300.638.432.010.510.600.599.90 Land 13 01404 i003
DF6.651.852.2651.4528.6449.362.3421.539.081.803.136.5115.38 Land 13 01404 i004
DT3.443.890.570.431.994.654.2426.1718.975.865.066.366.80 Land 13 01404 i005Increase with fluctuations
HA0.020.000.721.370.000.210.070.043.870.240.000.000.59 Land 13 01404 i006
RD12.341.850.034.564.289.278.4829.1218.763.382.376.638.42 Land 13 01404 i007
TZ0.300.070.020.080.001.421.120.240.000.007.091.911.02 Land 13 01404 i008
HM0.190.000.200.120.010.822.904.110.000.000.430.000.73 Land 13 01404 i009
QD1.200.150.373.571.496.556.307.854.891.9511.110.183.80 Land 13 01404 i010
YC42.28 40.09 14.91 72.60 53.26 65.83 7.48 57.02 30.15 11.20 9.5113.2134.80 Land 13 01404 i011Decrease with fluctuations
NT14.05 2.07 1.34 9.69 5.78 18.26 18.87 41.36 27.52 5.57 21.008.7214.52Land 13 01404 i012Increase with fluctuations
SA56.33 42.17 16.26 82.30 59.04 84.09 26.34 98.39 57.68 16.77 30.5221.9349.32 Land 13 01404 i013Decrease with fluctuations
Note: the x-axis of the trendline is time (year) and the y-axis is the rate of reclamation (km2/year). XS refers to Xiangshui county; BH refers to Binhai county; SY refers to Sheyang county; DF refers to Dafeng city; DT refers to Dongtai city; HA refers to Hai’an city; RD: refers to Rudong county; TZ refers to Tongzhou district; HM refers to Haimen city; QD refers to Qidong city; YC refers to Yancheng city; NT refers to Nantong city; SA refers to the study area. In the trendline, the Y-axis is the reclamation rate km2/year, x represents the time period, the red point represents the maximum reclamation rate, and the blue point represents the minimum reclamation rate.
Table 2. Jiangsu coastal mudflat area wetland degradation status over the past 45 years.
TypeArea (km2)Percentage of Degraded Area (%)
Absolute lossNatural wetlands → non-wetlands731.0524.94
Artificial wetlands → non-wetlands262.348.95
Gradual lossNatural wetland inter-degradation84.132.87
Artificial wetland inter-degradation19.350.66
Habitat lossNatural wetlands → Artificial wetlands1661.0556.66
Species invasionSpartina alterniflora invasion173.635.92
Total degradation area (km2)2931.54
Percentage of regional area (%)41.76%
Percentage of pre-existing wetland area (%)46.92%
Disclaimer/Publisher’s Note: The statements, opinions and data contained in all publications are solely those of the individual author(s) and contributor(s) and not of MDPI and/or the editor(s). MDPI and/or the editor(s) disclaim responsibility for any injury to people or property resulting from any ideas, methods, instructions or products referred to in the content.

