Abstract
Permafrost-affected regions in the Russian Arctic are a critical study area for studying the sources of metal elements (MEs) in soils originating from geological/pedogenic processes or from anthropogenic sources via atmospheric transport. In the Nadym region of the Yamalo-Nenets Autonomous District, we investigated the contents of soil organic carbon (SOC), total nitrogen (TN), and MEs across different soil types and horizons, explored the source apportionment of MEs, and assessed local ecological risks of potentially toxic elements (PTEs). The results showed that (1) the contents of SOC and TN in Histic Cryosols (8.59% and 0.27%) were significantly higher than in Plaggic Podzols (Arenic, Gelic, and Turbic) (2.28% and 0.15%) and in Ekranic Technosols (Umbric) (1.32% and 0.09%); (2) the concentrations of MEs in the Nadym region were lower than in other Arctic regions; (3) the primary sources of MEs were identified as geological processes (36%), atmospheric transport (23%), agricultural activities (21%), and transportation (20%); and (4) the permafrost-affected soils in the Nadym region exhibited low ecological risks from PTEs. These results underscore the critical role of geological and anthropogenic factors in shaping soil conditions and highlight the relatively low ecological risk from PTEs, providing a valuable benchmark for future environmental assessments and policy development in Yamal permafrost regions.
1. Introduction
The Russian Arctic is characterized by its permafrost-affected environment and sparse population [1,2]. However, in recent years, the extraction industries of oil and gas in the Russian Arctic have increased local environmental pollution [2,3,4,5]. Meanwhile, the Arctic is warming twice as fast as other regions of the world [6,7]. Pronounced climate change in permafrost regions may lead to permafrost degradation [8,9], further stimulating the loss of soil organic carbon (SOC), promoting the transformation of total nitrogen (TN), and accelerating the release of metal elements (MEs) [9,10,11]. Both anthropogenic activities and climate change may impact the biogeochemical processes of SOC, TN, and MEs in the Arctic ecosystem.
Most heavy metals and metalloids (e.g., As) with densities greater than 4 ± 1 g/cm3 or relative atomic masses exceeding 50 are considered potentially toxic elements (PTEs) [12]. These PTEs can migrate into various environmental media [13]. Many studies have shown that pollutants, including PTEs, are transported to polar regions far from urban areas through long-distance atmospheric transport, potentially polluting the local environment [1,13,14,15,16]. At present, PTEs from anthropogenic sources have been found in the Arctic [17,18,19]. Therefore, it is crucial to calculate pollution indexes and assess contamination levels in the Arctic [5].
Approximately 65% of Russia’s territory is located in permafrost regions [20]. More than 70% of gas reserves (accounting for 18% of the global total) in Russia are concentrated in the Yamalo-Nenets Autonomous District [21]. Among them, Nadym is predominantly characterized by tundra and forest-tundra landscapes with discontinuous permafrost [22,23]. During the Soviet era, in addition to traditional reindeer herding, polar agriculture was developed in the Nadym region [24], and oil and gas condensate fields were also operated [25]. Therefore, it is necessary to assess the ecological status of the permafrost-affected soils in the Nadym region to guide future land use and environmental management policies in the Yamal regions.
The objectives of this study are to (i) analyze SOC, TN, and MEs in different soil types and genetic horizons in permafrost-affected soils of the Nadym region, (ii) explore potential sources of MEs in the Nadym region, particularly focusing on four factors: geological processes, atmospheric transport, agricultural activities, and transportation, and (iii) assess ecological status of MEs in permafrost-affected soils of the Nadym region.
2. Materials and Methods
2.1. Study Area
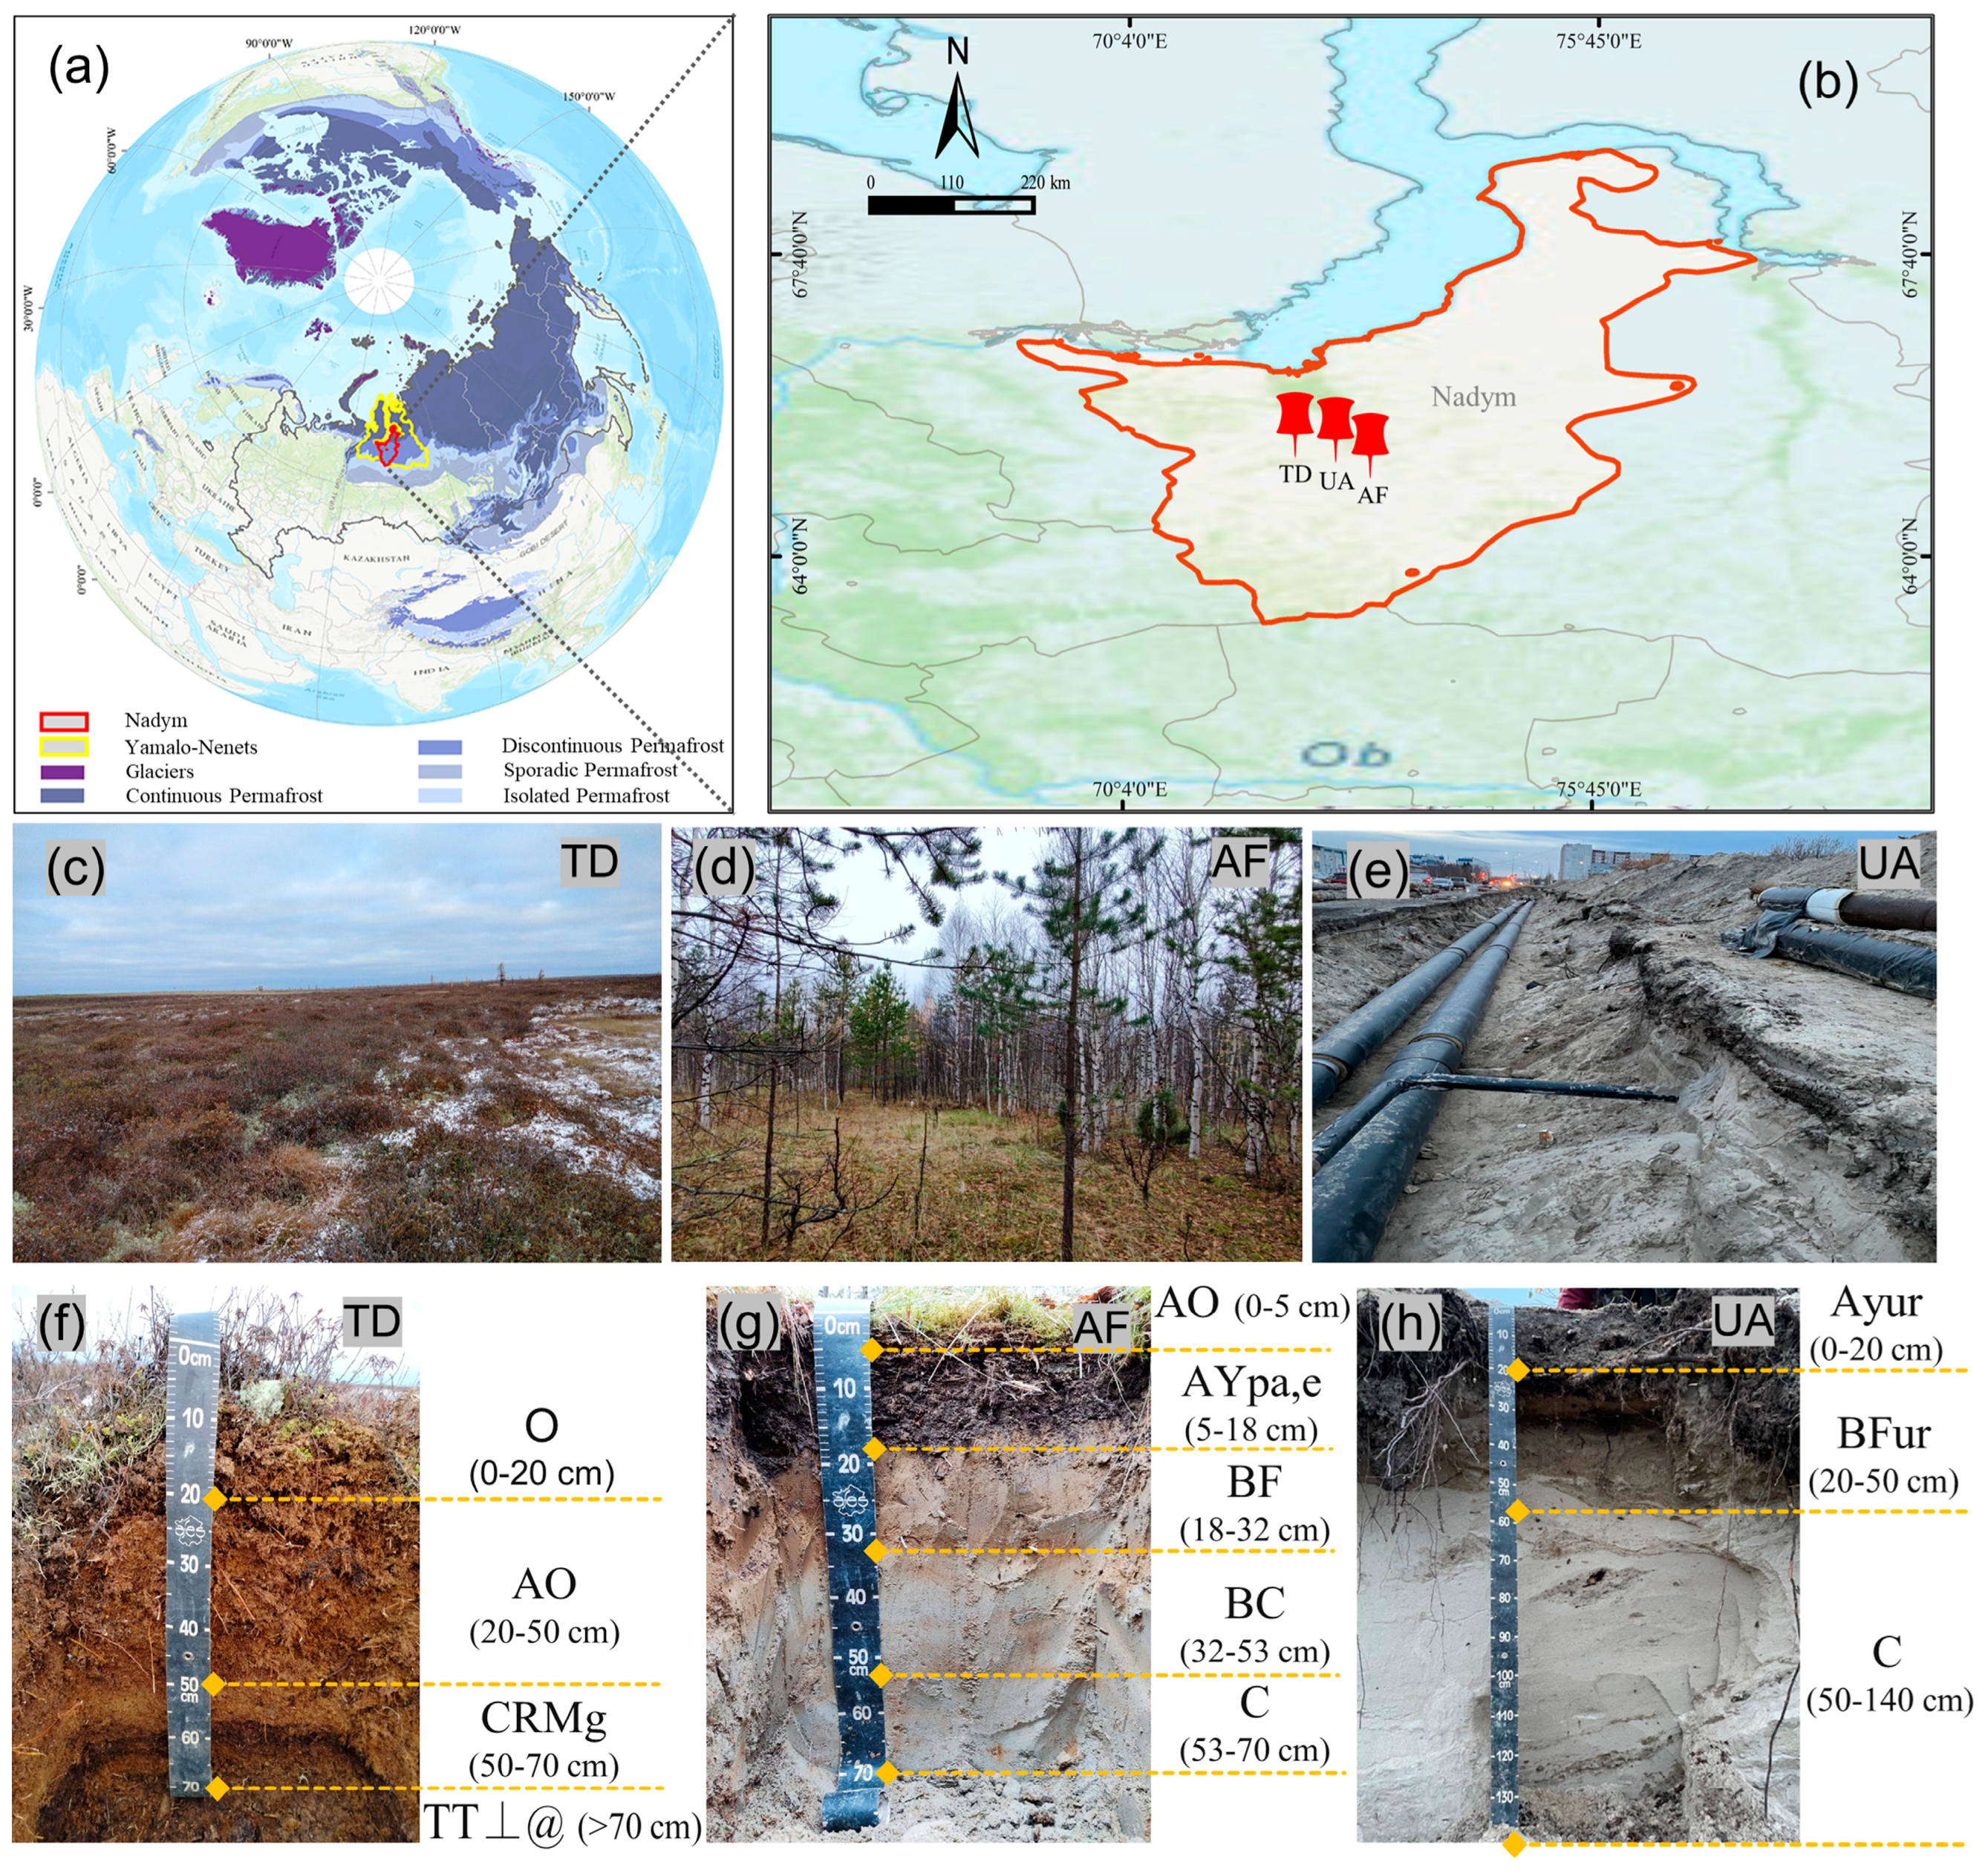
The study areas are in the Nadym region, Yamalo-Nenets Autonomous District, Russian Arctic (Figure 1 and Table 1). Nadym is in western Siberia, 100 km from the Arctic Circle [26]. According to the meteorological station in Nadym, the average annual air temperature and precipitation in 2023 were −5.5 °C and 510 mm, respectively. Nadym has a continental subarctic climate, with extreme temperature variations [25]. Winters can be extremely cold, with monthly mean air temperatures ranging from −20 °C to −30 °C [23]. The parent rocks in this region originate from Quaternary deposits, comprising Pleistocene-Holocene sediments of alluvial genesis [5]. Vegetation in the Nadym region is mainly composed of sparse spruce–larch (Larix sibirica and Picea obovata) and larch-pine forests, as well as tundra communities dominated by dwarf birch (Betula nana L.), mosses (Sphagnum spp.), and lichens [26].
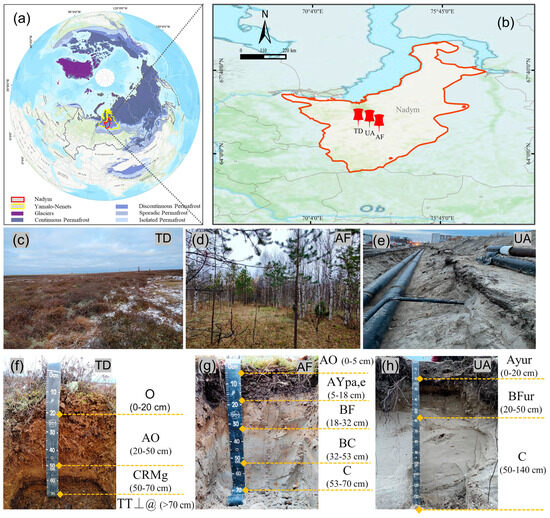
Figure 1.
The location of the study areas. (a) Global map highlighting the study region. (b) Detailed map of the Nadym region in the Yamalo-Nenets Autonomous District. (c–e) Photographs of the three sampling sites in the Nadym region (TD-tundra, AF-abandoned farmland, and UA-urban area). (f–h) Soil profiles from the sampling sites in the Nadym region.

Table 1.
Geographical characteristics of the study areas.
2.2. Soil Sampling
Soil samples were taken from each genetic horizon in the thawing layer of three soil profiles in the Nadym region in October 2022 (Figure 1). The sampling sites, which included tundra (TD), abandoned farmland (AF), and urban area (UA), covered a latitude range from 65.34 to 65.59° N, a longitude range from 72.07 to 72.98° E, and an altitude range from 10 to 38 m (Figure 1 and Table 1). Soil samples were collected in triplicate from each site and then mixed into one composite sample. Sterile polyethylene bags were used to store soil samples, which were subsequently delivered to the laboratory of the Department of Applied Ecology at St. Petersburg State University. The soil types were classified according to the Word Reference Base for Soil Resources (WRB), specially as Histic Cryosols, Plaggic Podzols (Arenic, Gelic, and Turbic), and Ekranic Technosols (Umbric) [27]. Soil genesis and formation of three soil profiles in the Nadym region are described in Table 2.
Table 2.
Soil profiles of sampling sites in the Nadym region of Yamalo-Nenets Autonomous District.
2.3. Laboratory Experiments
Before instrumental analysis, the soil sample were air-dried, ground, and sieved (0.25 mm) for subsequent determination. The contents of SOC were determined using the indirect wet oxidation method, which included volumetric measurement of the oxidant according to the Tyurin (Walkley–Black) method [28]. The contents of TN were determined using the Kjeldahl method. The pH values were measured using a pH-150 MA meter (Belarus) in a soil suspension prepared in a ratio of 1:2.5 with distilled water. Soil texture was determined by a sediment deposition based on Stokes’ law [29].
The concentrations of MEs were determined by the atomic absorption spectrophotometry method using a spectrophotometer Kvant 2 M. Before instrumental analysis, soil samples (0.2–0.3 g) were initially dissolved in 10 mL of hydrochloric acid (HCl, concentrated) at 90–100 °C in a digestion microwave and heated to 3 mL. The solution was digested in 9 mL of nitric acid (HNO3, concentrated) and heated continually until no particulate matter. Then, the solution was extracted with 5–8 mL of hydrofluoric acid (HF, concentrated) and heated at 120 °C for 30 min. The cooled solution was added to 1–2 mL of perchloric acid (HClO4, concentrated) and heated at 150–170 °C to ensure the disappearance of the black carbide. When the solution was nearly dry, 3 mL of HNO3 (concentrated) was added to the residue. As soon as the sample cooled down, the digestion solution was diluted with HNO3 (1%) to a final volume of exactly 25 mL for analyses. The detection limits for the analyzed MEs were Fe—1.50 mg kg−1, Mn—0.40 mg kg−1, Zn—1 mg kg−1, Cr—0.10 mg kg−1, Cu—0.60 mg kg−1, Ni—1 mg kg−1, Pb—0.10 mg kg−1, and As—0.01 mg kg−1.
2.4. Data Analysis
The Positive Matrix Factorization (PMF) model and Pearson correlation coefficient were conducted to determine source apportionment of MEs. The geoaccumulation index (Igeo), enrichment factor (EF), pollution load index (PLI), modified contamination degree (mCd), and potential ecological risk index (RI) were used to fully assess the pollution status of PTEs (Zn, As, Cr, Ni, Cu, and Pb) in the Nadym region of Russian Arctic.
The PMF model proposed by the USEPA was used for the identification and apportionment of MEs [30]. The model’s calculation is represented in Equation (1), as follows:
where xij is the concentration of the j-th MEs in the i-th sample, p is the number of the contributing factors, gik is the contribution of k-th source factor to the i-th sample, fkj is the concentration of the j-th MEs in the i-th sample, and eij is the residual for the i-th sample and j-th MEs.
The minimum objective function Q represents a crucial parameter for the PMF model Equation (2):
where n is the number of MEs, m is the number of soil samples, is the residual for the i-th sample and j-th MEs, and represents the uncertainty of j-th MEs in the i-th sample.
Two input files are required by the PMF model: (1) the concentrations of the measured sample and (2) the corresponding uncertainties. These values are calculated using Equations (3)–(6) [31,32].
For concentrations values of MEs below the detection limits
For determined values of MEs beyond the detection limits
where is the concentration of the j-th MEs in the i-th sample, is the detection limit, is the uncertainty of concentration, and is the measured concentration of MEs.
The formulas and classifications of Igeo, EF, PLI, mCd, and RI can be found in our previous paper [33]. Considering the stability of Ti, it was used as a background element in the formulas of EF [33,34]. Background values of PTEs and Ti in the Nadym region were Zn—31 mg kg−1, As—4.04 mg kg−1, Cr—42 mg kg−1, Ni—6.34 mg kg−1, Cu—8.70 mg kg−1, Pb—9.90 mg kg−1, and Ti—0.33 mg kg−1 [21,34].
3. Results
3.1. Physicochemical Properties of Permafrost-Affected Soils in the Nadym Region
The physicochemical properties of soil samples in permafrost-affected soils of the Nadym region are presented in Table 3. SOC contents at the three sampling sites ranged from 0.03–16.85% and TN contents varied from 0.01–0.66%. The C/N ratios were between 0.99 and 29.90. The pH values were 5.20–6.70, indicating slightly acidic conditions. Soil samples from three sites contained a large proportion of sand particles, with an average of 64.81 ± 20.92%.
Table 3.
Physicochemical properties (mean ± SD and min–max) of soil samples in the Nadym region of the Yamalo-Nenets Autonomous District.
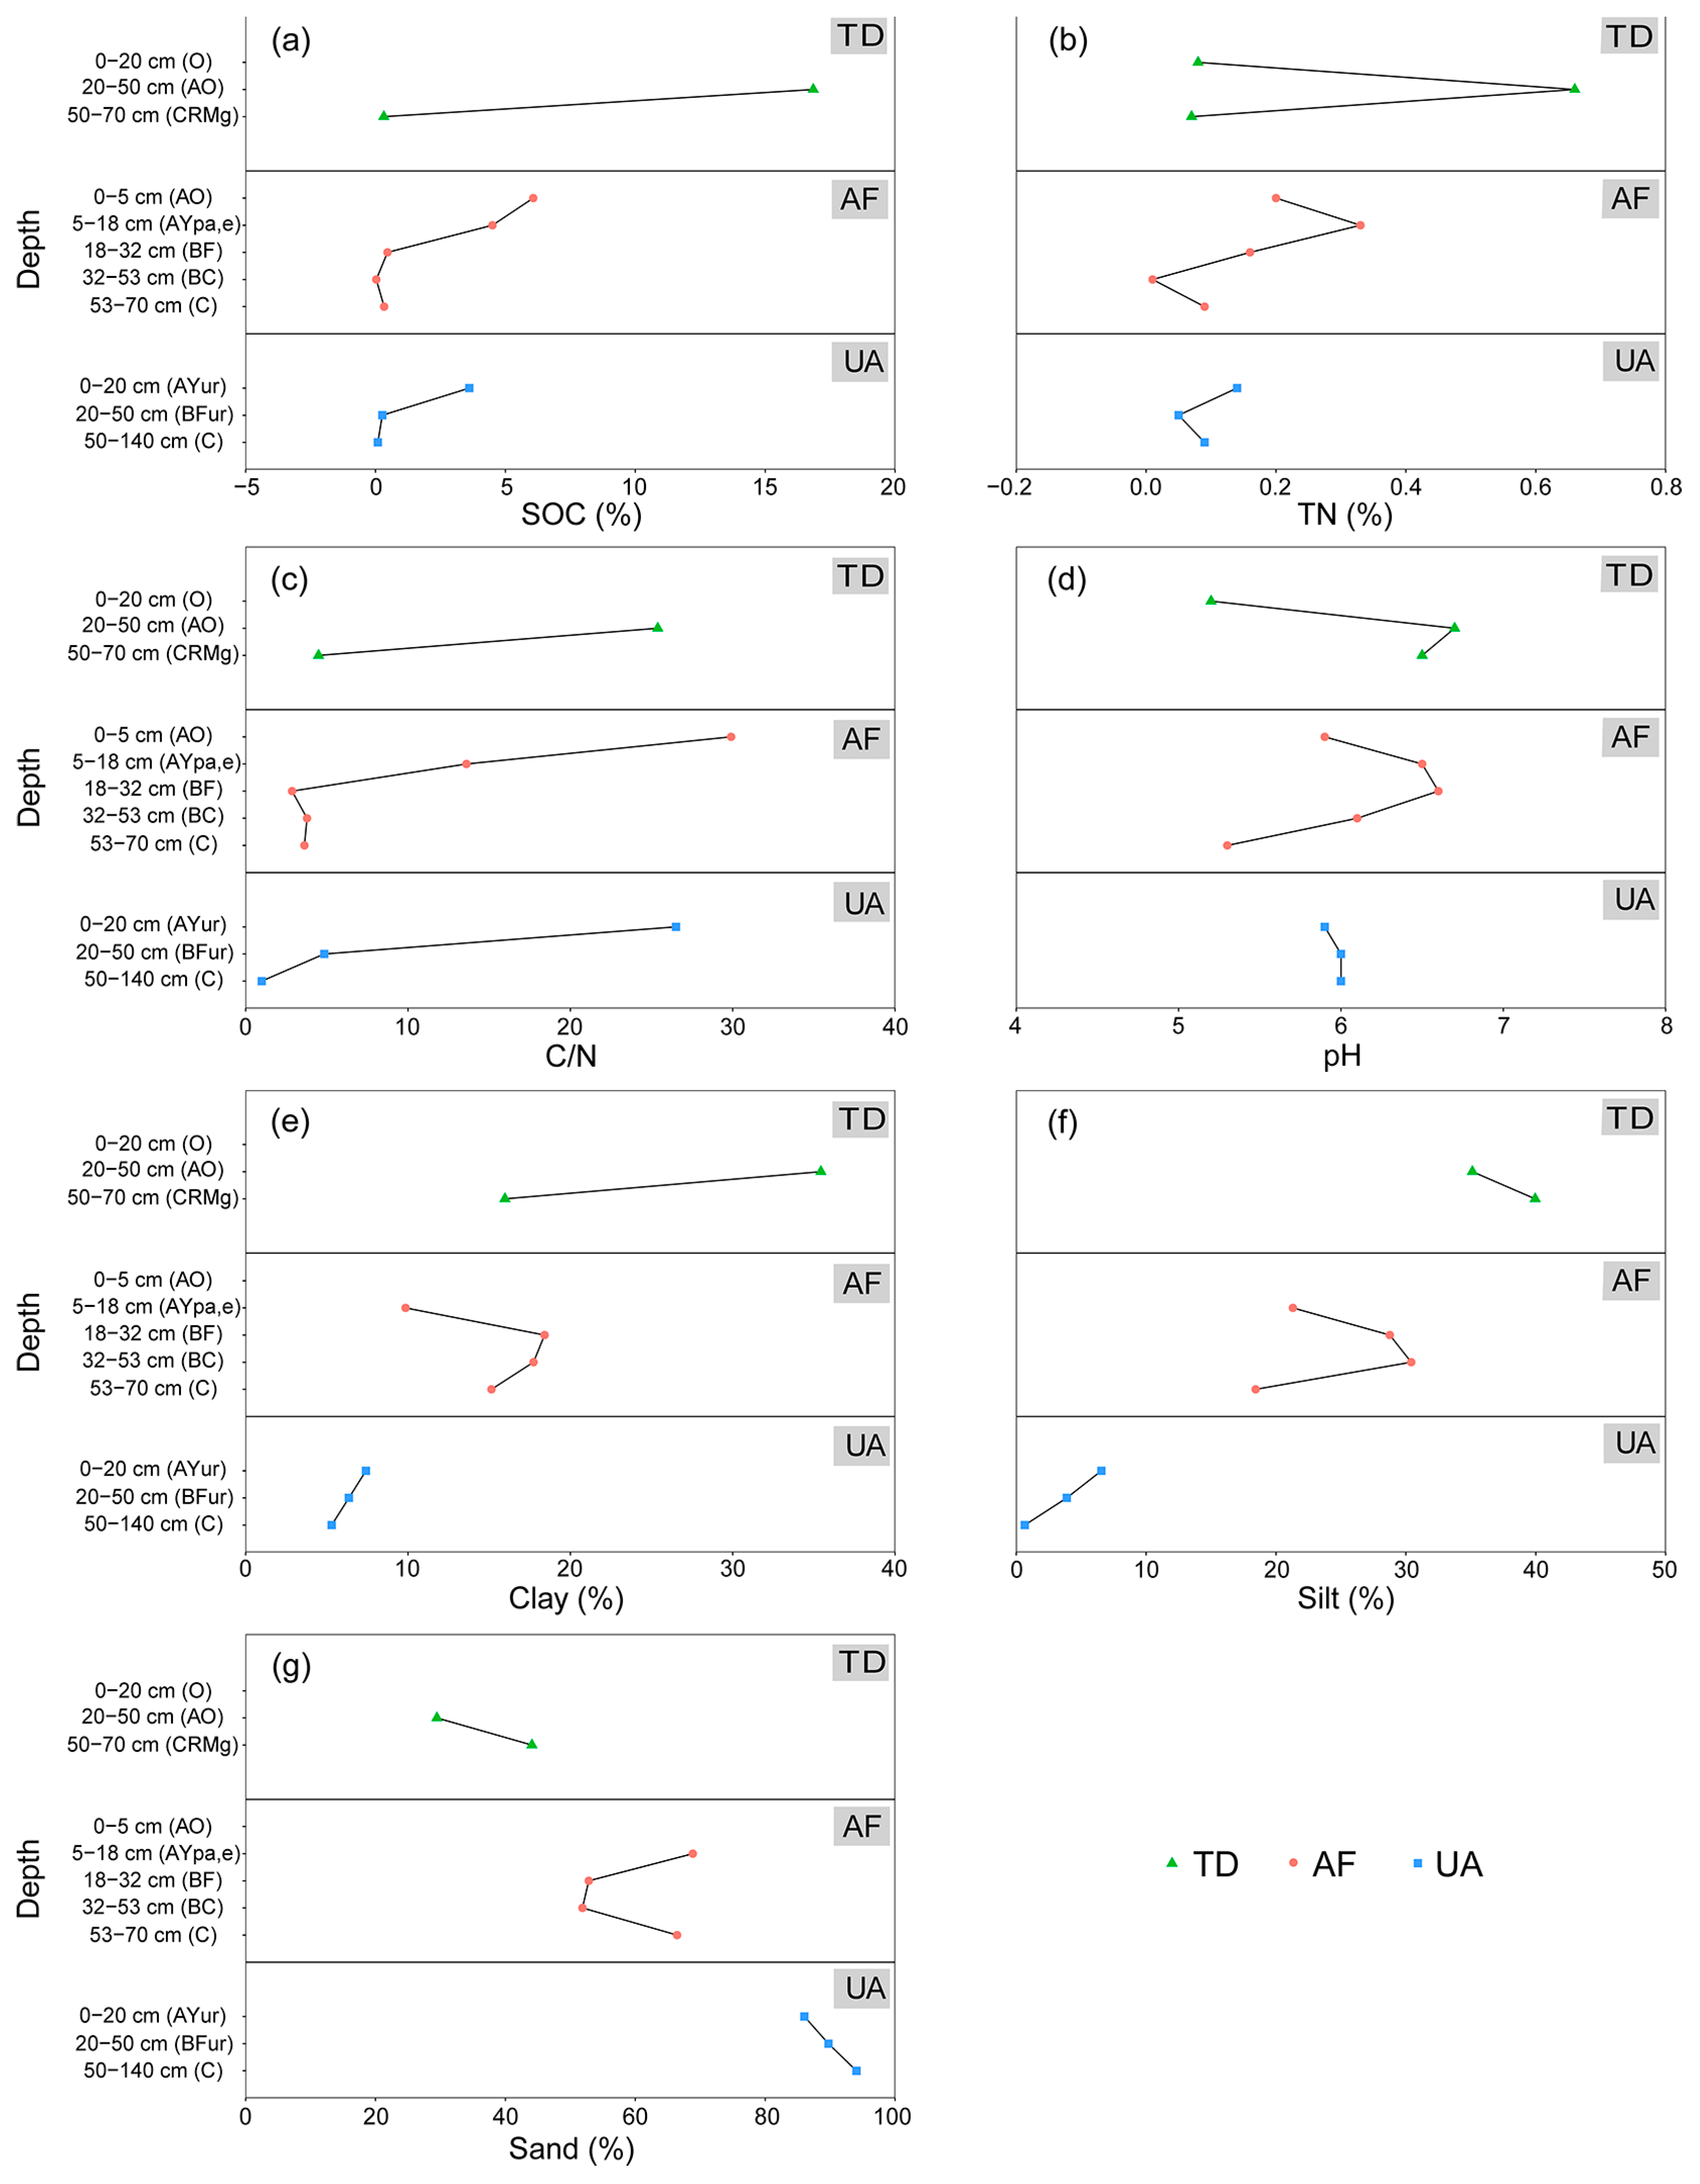
Specifically, SOC contents decreased with increasing soil depth at the three sampling sites in the Nadym region (Figure 2). The average SOC contents at the three sampling sites were as follows: tundra (8.59%) > abandoned farmland (2.28%) > urban area (1.32%). In the tundra, an AO horizon exhibited the highest SOC contents, reaching 16.85%. Meanwhile, the average TN contents at the three sampling sites in the Nadym region were ranked as follows: tundra (0.27%) > abandoned farmland (0.15%) > urban area (0.09%). In the tundra, TN contents were highest in the AO horizon, reaching 0.66%.
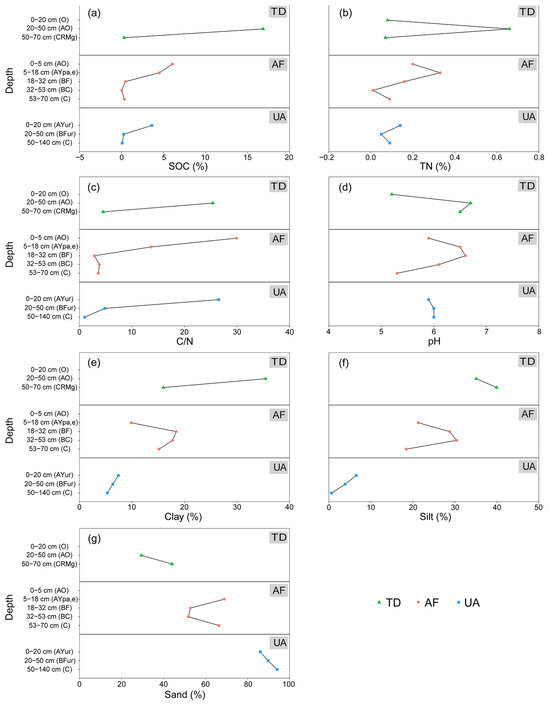
Figure 2.
Physicochemical properties in permafrost-affected soils of the Nadym region.TD—tundra; AF—abandoned farmland; UA—urban area; (a) SOC—soil organic carbon. (b) TN—soil total nitrogen. (c) C/N—the mass ratio of SOC to TN. (d) pH; (e) Clay (<0.002 mm). (f) Silt (0.002–0.05 mm). (g) Sand (>0.05 mm).
C/N ratios in the upper layers of the soil profile at the three sampling sites were higher than those in the lower soil layers. Among them, the C/N ratio in the AO horizon of the abandoned farmland was the highest, reaching 29.90. Conversely, in the urban area, the C/N ratio in the C horizon was the lowest, at only 0.99. The average C/N ratios in the soils of the three sampling sites ranked as follows: tundra (14.94) > urban area (10.78) > abandoned farmland (10.75).
The average soil pH values at the three sampling sites were as follows: tundra (6.13) = abandoned farmland (6.13) > urban area (5.97). In addition, sand predominated in the soil texture at the three sampling sites, with the average values as follows: sand (64.81%) > silt (20.56%) > clay (14.62%). The average sand content values of the three sampling sites were as follows: urban area (89.94%) > abandoned farmland (59.99%) > tundra (36.77%). At the sampling site of the urban area, the highest sand content was found in the C horizon. However, at the sampling site of the tundra, silt predominated in the soil texture, with average values as follows: silt (37.54%) > sand (36.77%) > clay (25.70%). It should also be noted that the silt contents in the deep soil layers at the sampling site of the tundra exceeded that in the surface soil layers.
3.2. Concentrations of Metal Elements in Permafrost-Affected Soils in the Nadym Region
The concentrations of MEs in permafrost-affected soils of the Nadym region are presented in Table 4. The average concentrations of these MEs varied from less than 0.10 mg kg−1 for Cr and Pb to 9884.30 mg kg−1 for Fe in permafrost-affected soils of the Nadym region. The average ME concentrations were distributed as follows: Fe > Mn > Zn > Cr > Ni > Cu > Pb > As. Considering significant coefficients of variation in ME concentrations, which ranged from 36.22 for Zn to 112.49 for Pb, further analysis of ME concentrations was carried out in the soils of three different sampling sites.
Table 4.
The concentrations of metal elements (MEs) in permafrost-affected soils in the Nadym region.
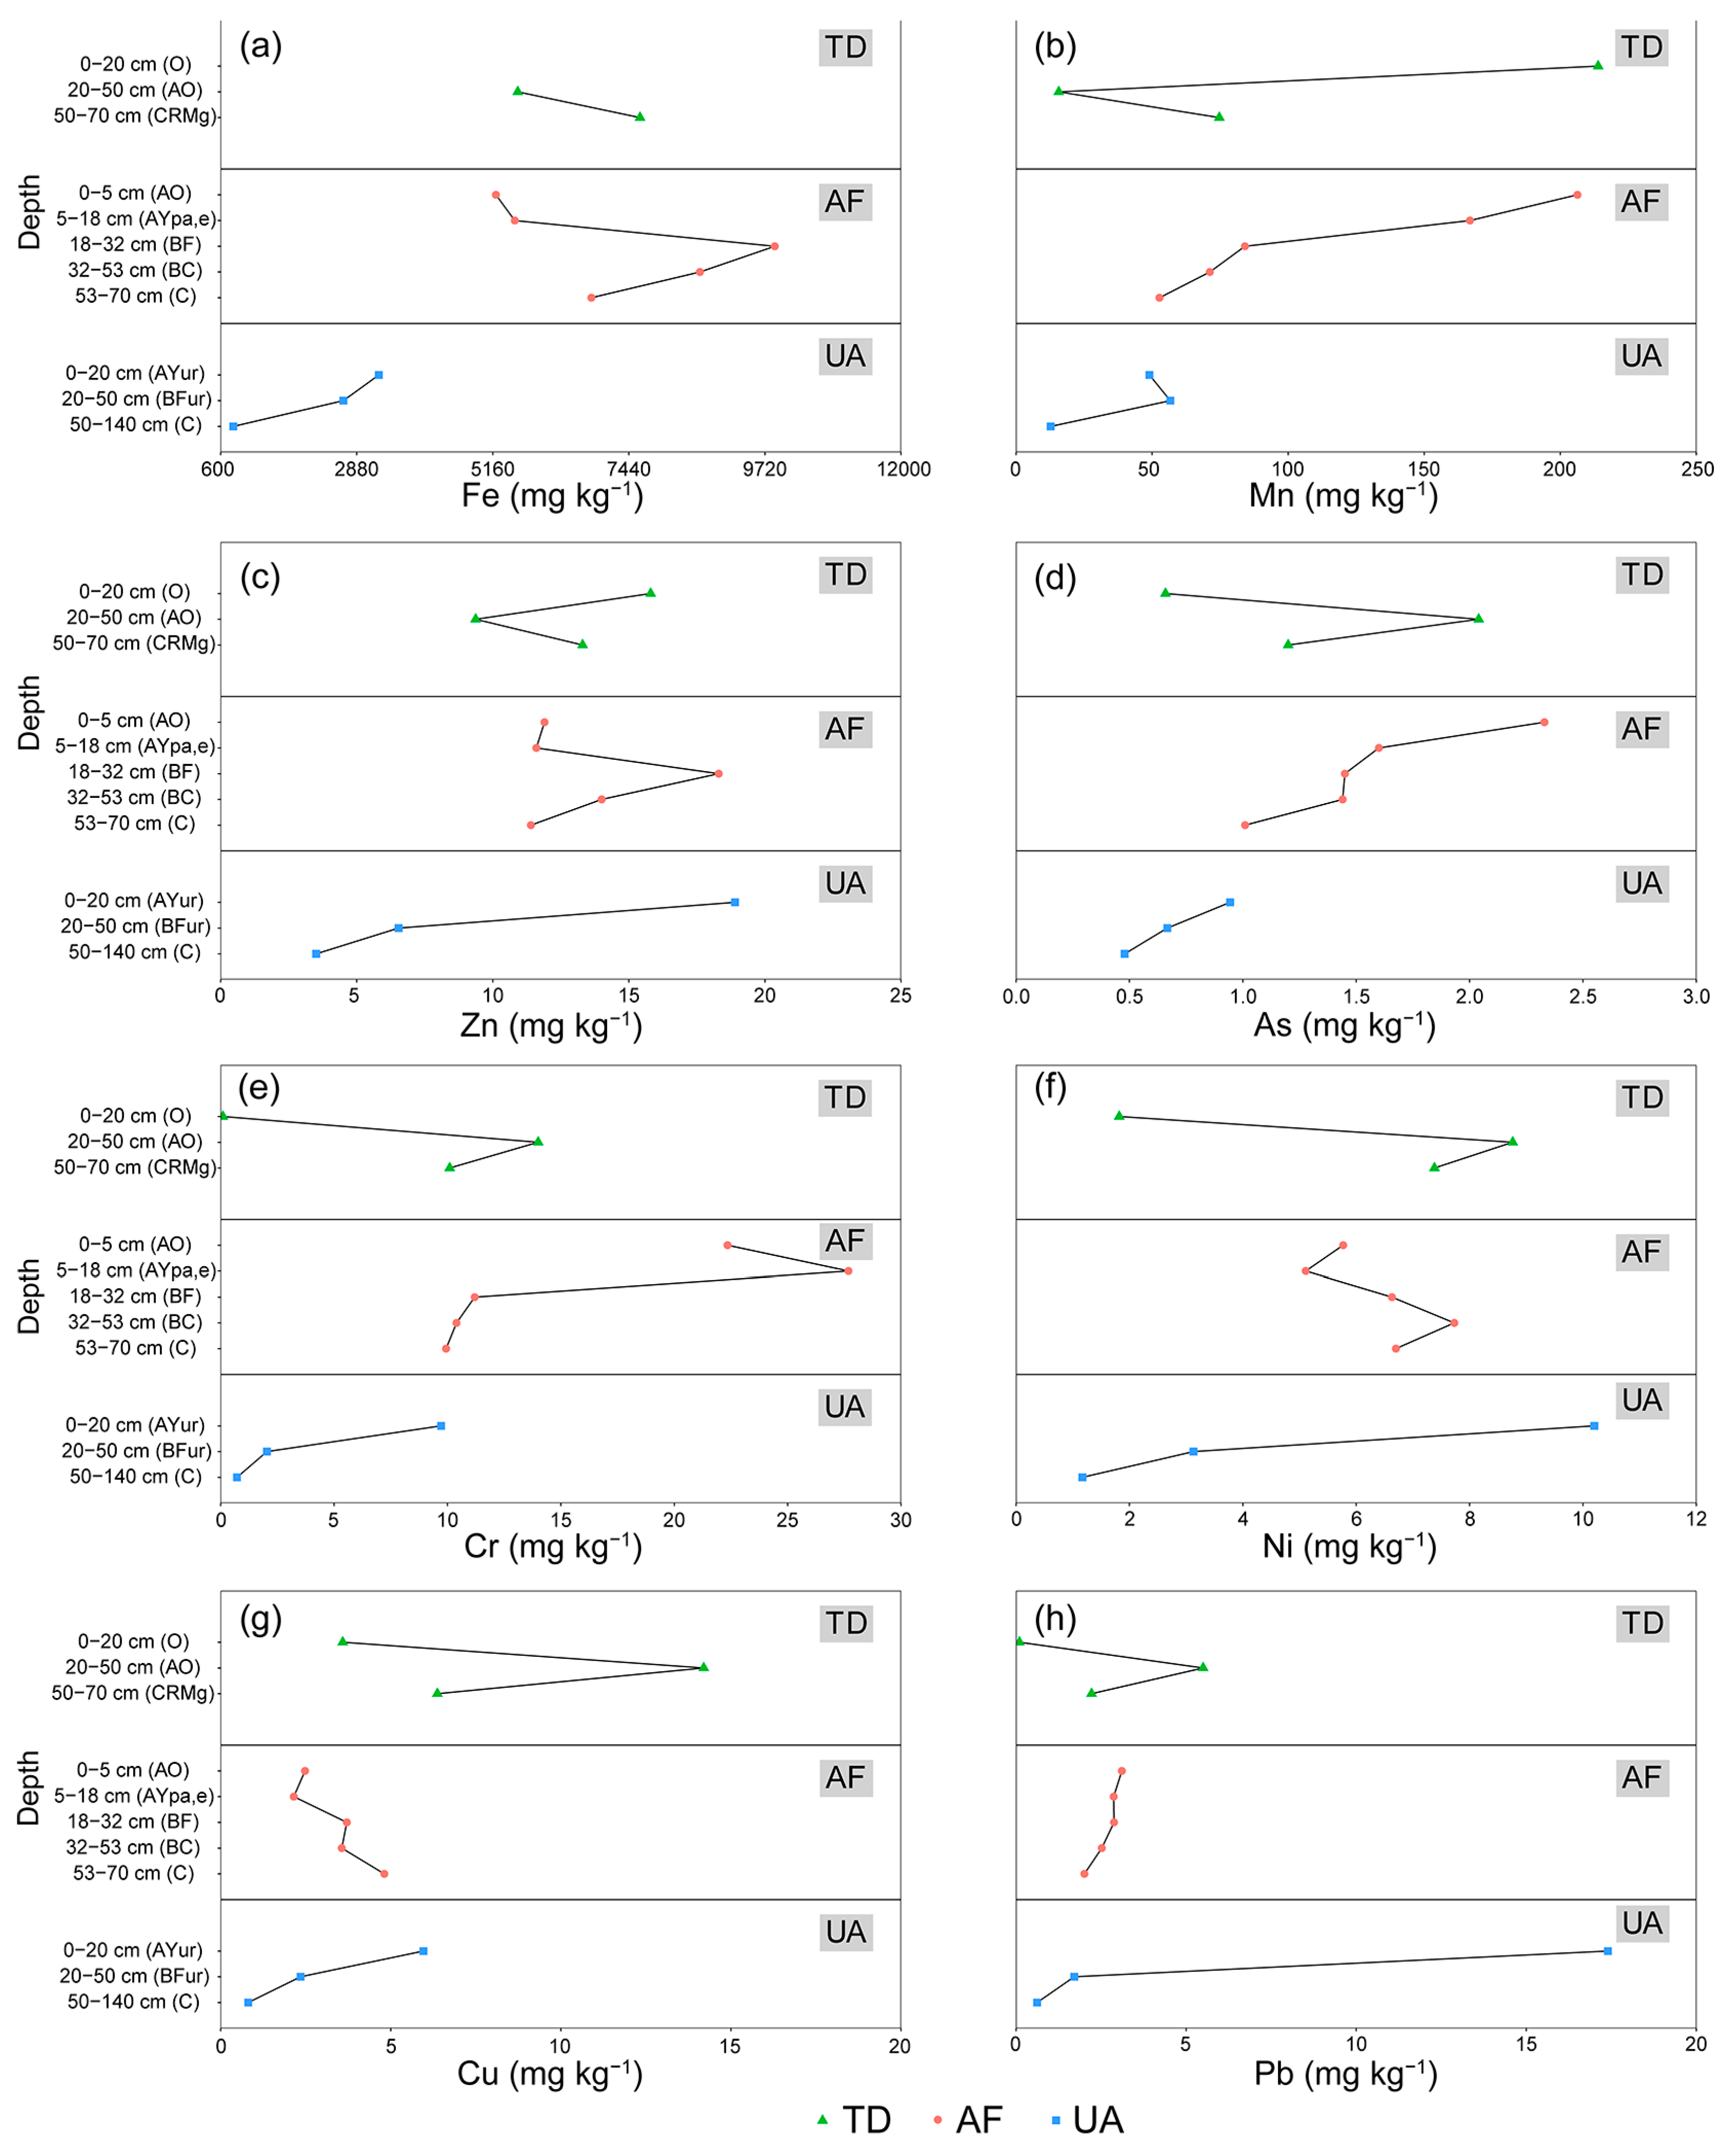
As shown in Figure 3, in the tundra, the Fe concentration increased with soil depth, while Mn and Zn concentrations initially decreased and then increased. Other MEs (As, Cr, Ni, Cu, and Pb) were characterized by high concentrations in the middle soil horizon and lower concentrations in both top and deep soil layers. In the abandoned farmland, the concentrations of Mn, As, and Pb decreased with increasing soil depth. Conversely, Cu concentration increased with soil depth, following the order C > BF > BC > AO > AYpa,e, The concentrations of Fe, Zn, Cr, and Ni exhibited a trend of initially increasing and then decreasing. In urban soils, the concentrations of Fe, Zn, As, Cr, Ni, Cu, and Pb in soil horizons decreased with increasing soil depth. Moreover, the Mn concentration showed a trend of first increasing and then decreasing.
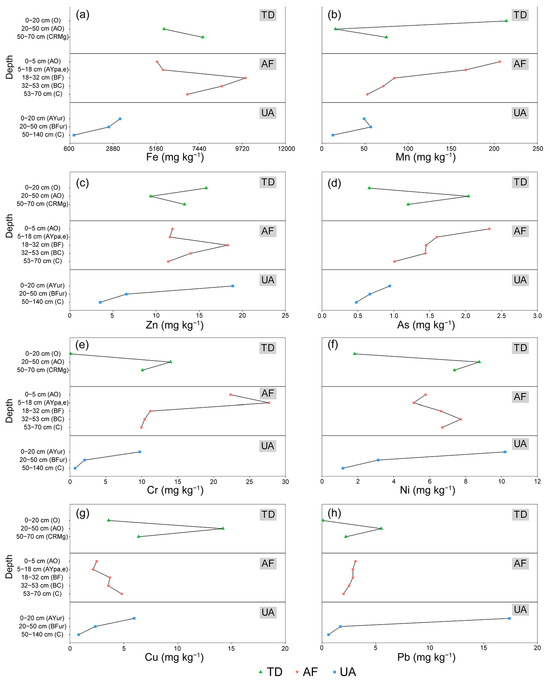
Figure 3.
The concentrations (mg kg−1) of metal elements (MEs) in permafrost-affected soils of the Nadym region. TD—tundra; AF—abandoned farmland; UA—urban area. (a–h) The concentrations of eight MEs (Fe, Mn, Zn, As, Cr, Ni, Cu, and Pb) in soil depths and horizons.
The specific effects of various soil properties on MEs in permafrost-affected soils of the Nadym region are presented in Figure 4. Soil texture was significantly associated with Fe (R2 = 0.40–0.68, p < 0.05). SOC, TN, and C/N were positively correlated with As (R2 = 0.38–0.44, p < 0.05). SOC and TN were positively related to Cu (R2 = 0.62 and 0.54, p < 0.05). C/N had a positive relationship with Pb (R2 = 0.40, p < 0.05).
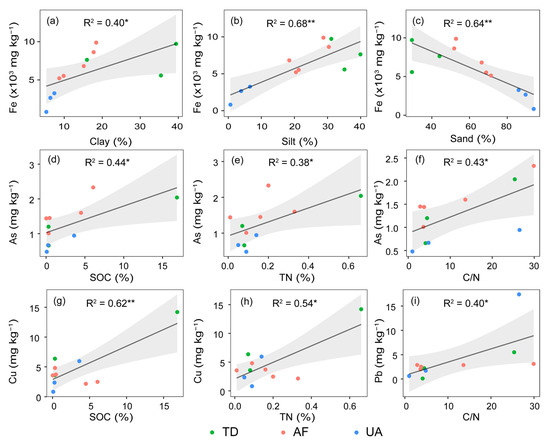
Figure 4.
Regression models of metal elements (MEs). TD—tundra; AF—abandoned farmland; UA—urban area. (a) Clay (<0.002 mm). (b) Silt (0.002–0.05 mm). (c) Sand (>0.05 mm). (d,g) SOC—soil organic carbon. (e,h). TN—soil total nitrogen. (f,i) C/N—the mass ratio of SOC to TN. **: significance level of p < 0.01; *: significance level of p < 0.05. The grey shadowed areas represent the 95% confidence interval. Only statistically significant results are shown here.
3.3. Sources of Metal Elements in Permafrost Affected Soils of the Nadym Region
The PMF model was run 20 times to reach the minimum Q value. The signal-to-noise ratios (S/N) of all MEs were higher than 2, defined as “strong”, indicating the main indicators derived from the PMF analysis reflected reasonable results. The bootstrap (BS) method was also applied to evaluate the uncertainty of the PMF analysis. A total of 500 BS runs were performed, and the BS factor was assigned (R2 > 0.6), indicating the results of the PMF model were reliable.
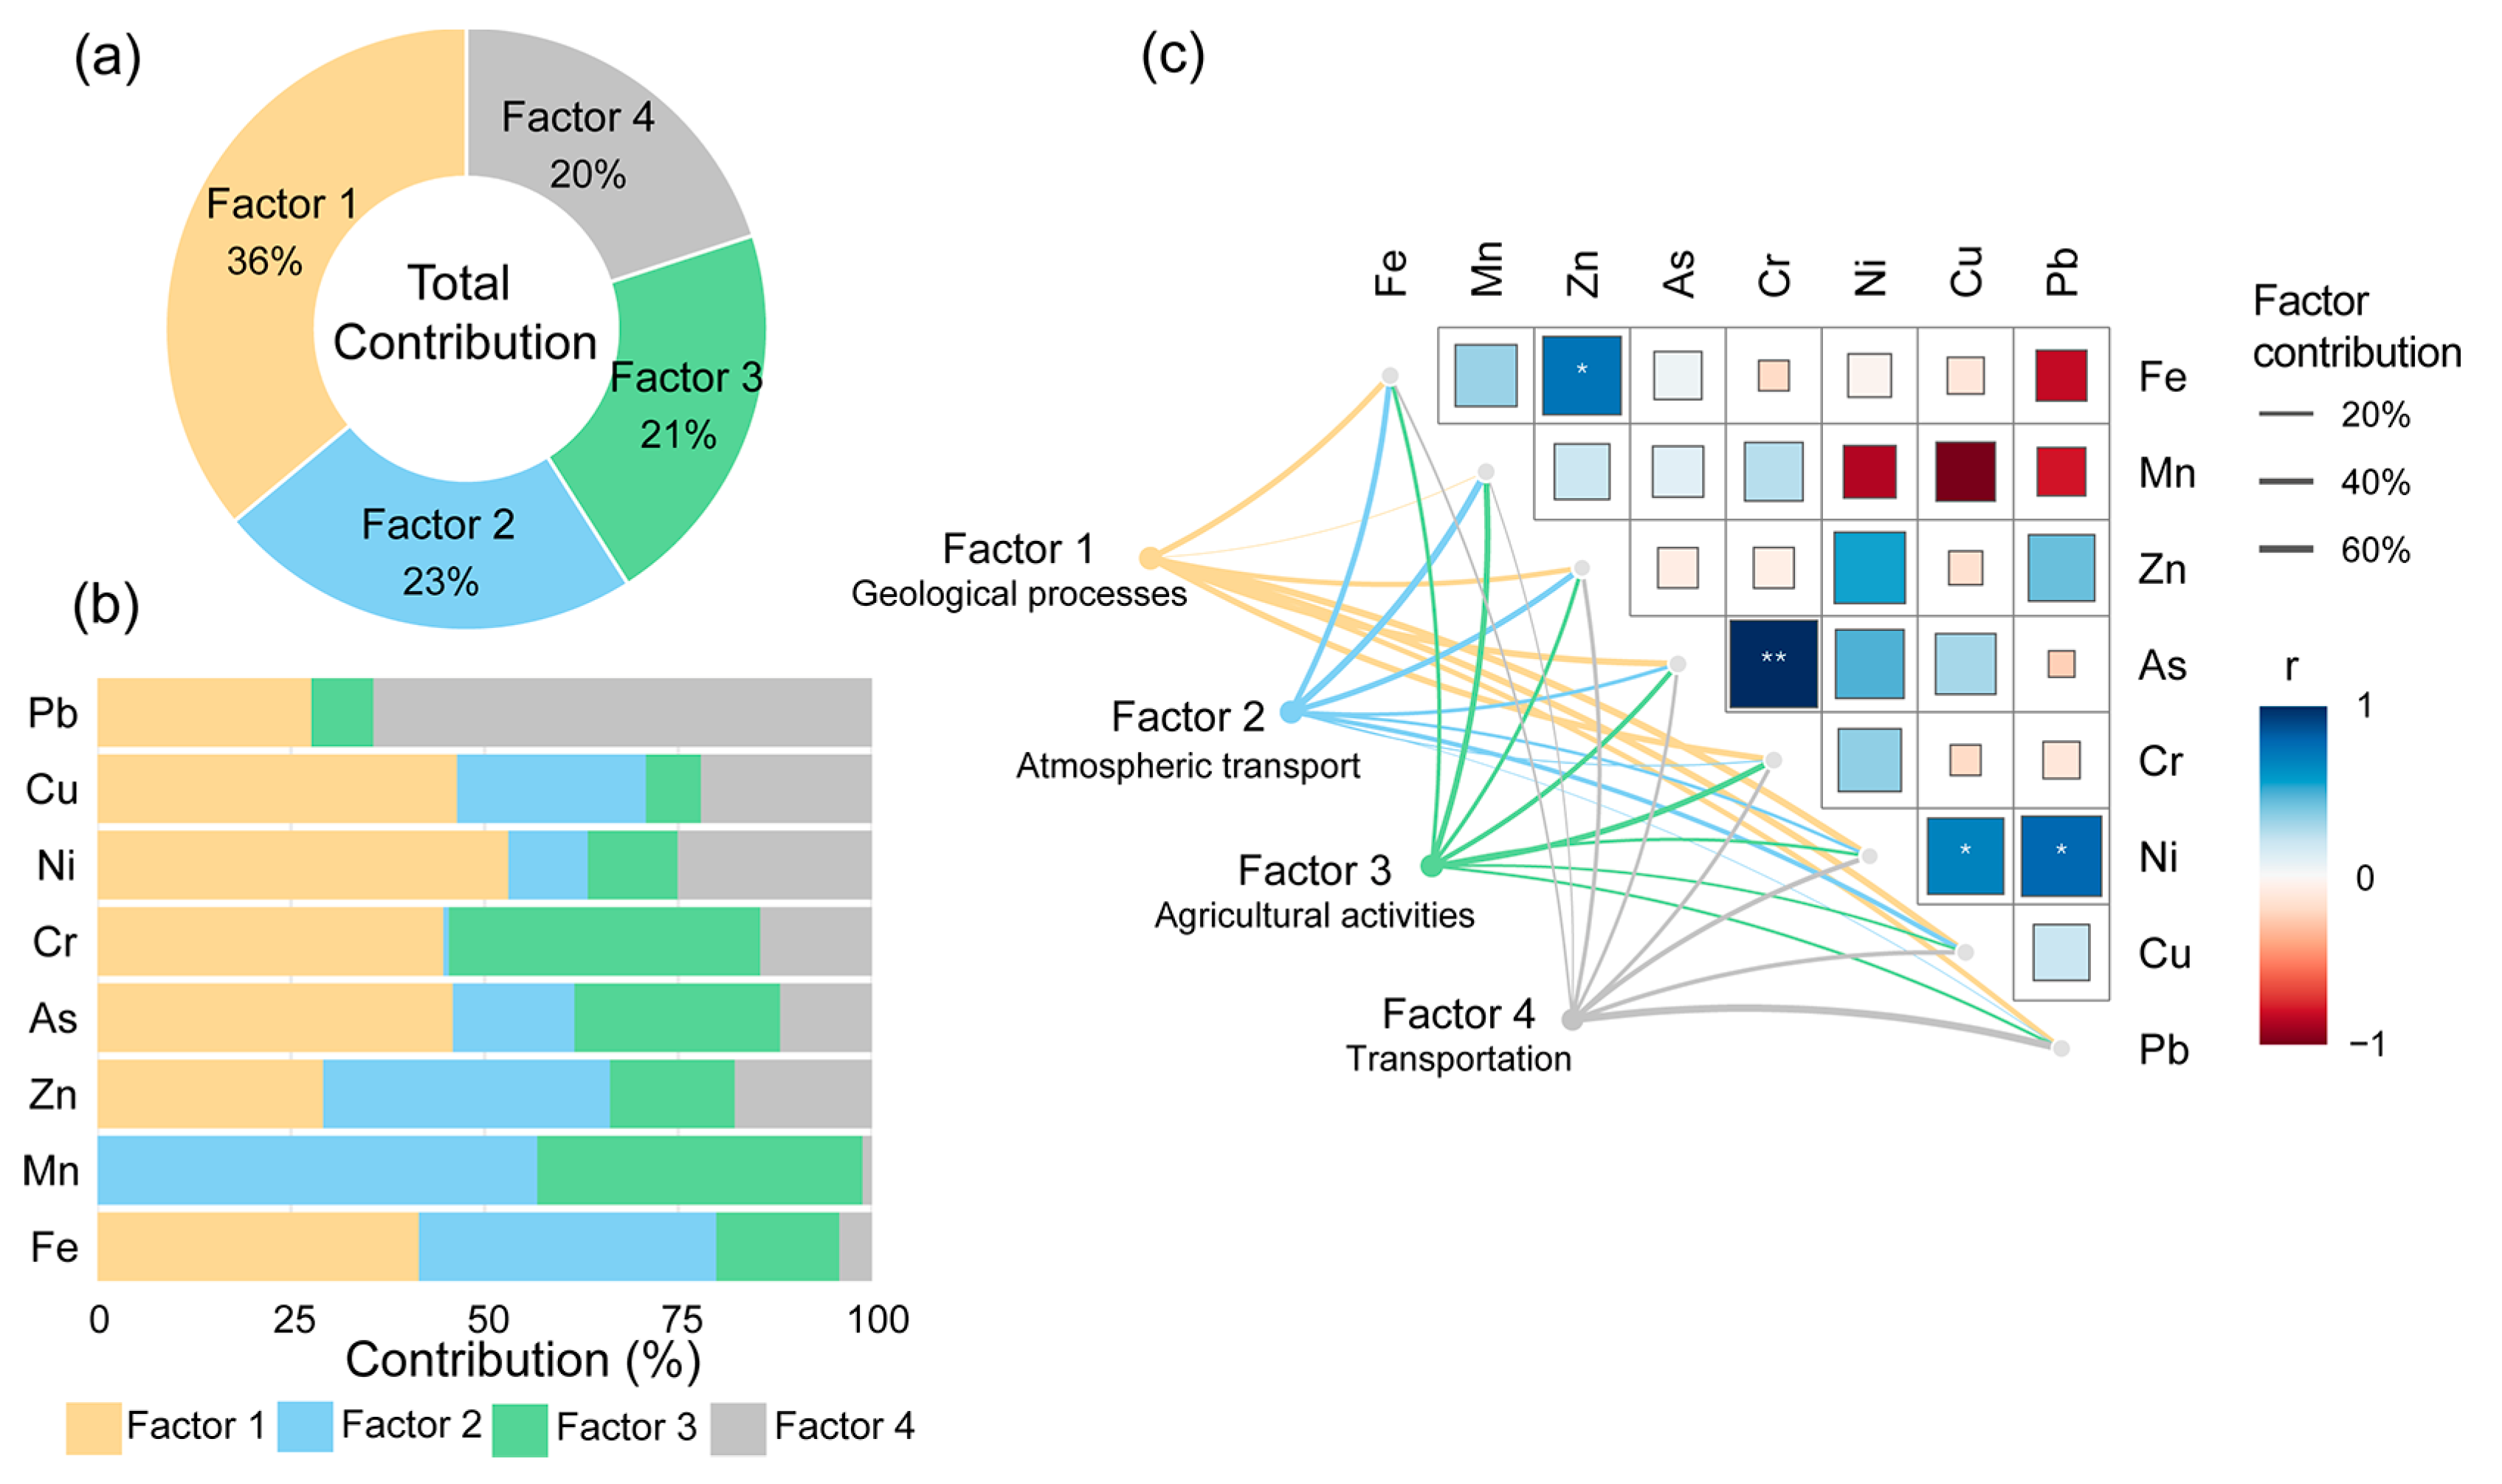
Four factors were determined, termed Factor 1, Factor 2, Factor 3, and Factor 4, with contribution rates of 36%, 23%, 21%, and 20%, respectively (Figure 5a). Among them, Factor 1 was primarily contributed by Fe (41.50%), Zn (29.13%), As (45.88%), Cr (44.67%), Ni (53.06%), and Cu (46.42%), Factor 2 was mainly dominated by Fe (38.39%), Mn (56.81%), Zn (37.06%), and Cu (24.40%), Factor 3 was characterized by Mn (41.98%), Cr (40.21%), and As (26.56%), and Factor 4 was mainly loaded on Pb (64.34%) (Figure 5b). Fe was positively associated with Zn (p < 0.05). As was significantly correlated with Cr (p < 0.01). Ni, Cu, and Pb had positive relationships (p < 0.05) (Figure 5c).

Figure 5.
Source apportionment of metal elements (MEs) in the Nadym region. (a) The percentage of contribution for each factor by PMF model. (b) Factor profiles of MEs in permafrost-affected soils derived from PMF model. (c) The correlations of MEs by combining Pearson analysis and PMF model, **: significance level of p < 0.01 and *: significance level of p < 0.05.
3.4. Ecological Status Assessment in the Nadym Region
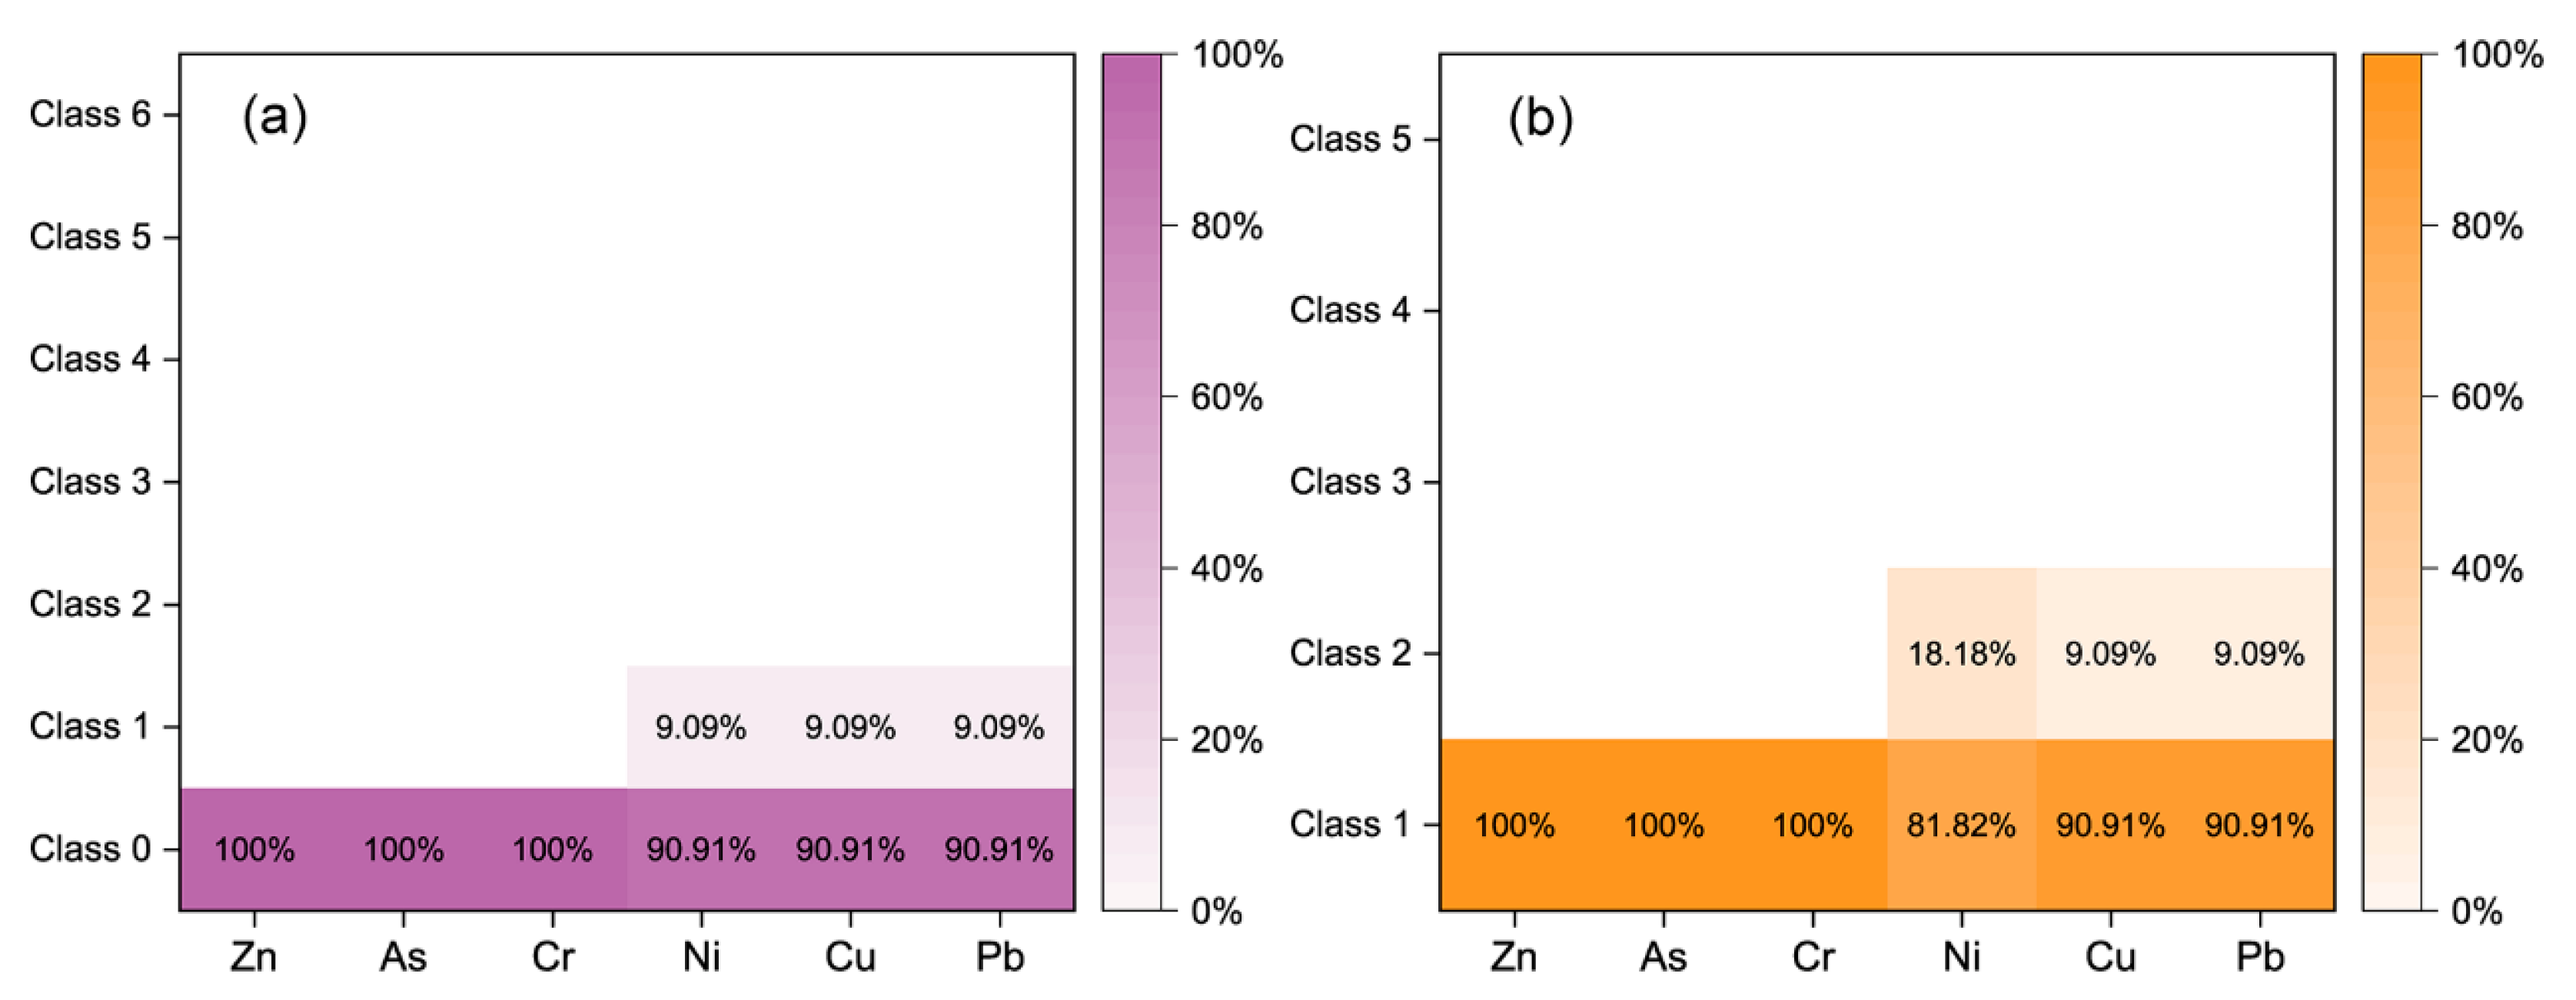
The total percentages of Igeo and EF for PTEs in permafrost-affected soils in the Nadym region are presented in Figure 6. Firstly, the Igeo values for Zn, As, and Cr were classified as class 0 (no pollution). The percentage of PTEs, such as Ni, Cu, and Pb with Igeo at class 0 (no pollution), reached 90.91%, while those at class 1 (no contamination to slight pollution) accounted for 9.09%. Secondly, the values of Zn, As, and Cr with EF were classified as class 1 (no enrichment). The percentage of Ni, Cu, and Pb with EF at class 1 (no enrichment) ranged from 81.82% to 90.91%, while that at class 2 (moderate enrichment) was between 9.09 and 18.18%. Therefore, the values of Igeo and EF in the soils of the three sampling sites were low, and the soils of the Nadym region can be classified as practically uncontaminated.

Figure 6.
Ecological state of potentially toxic elements (PTEs) in permafrost-affected soils of the Nadym region. (a) Geoaccumulation index (Igeo), Class 0: Igeo ≤ 0 (no pollution) and Class 1: 0 < Igeo ≤ 1 (no contamination to slight pollution). (b) Enrichment factor (EF), Class 1: EF < 2 (no enrichment) and Class 2: 2 ≤ EF < 5 (moderate enrichment).
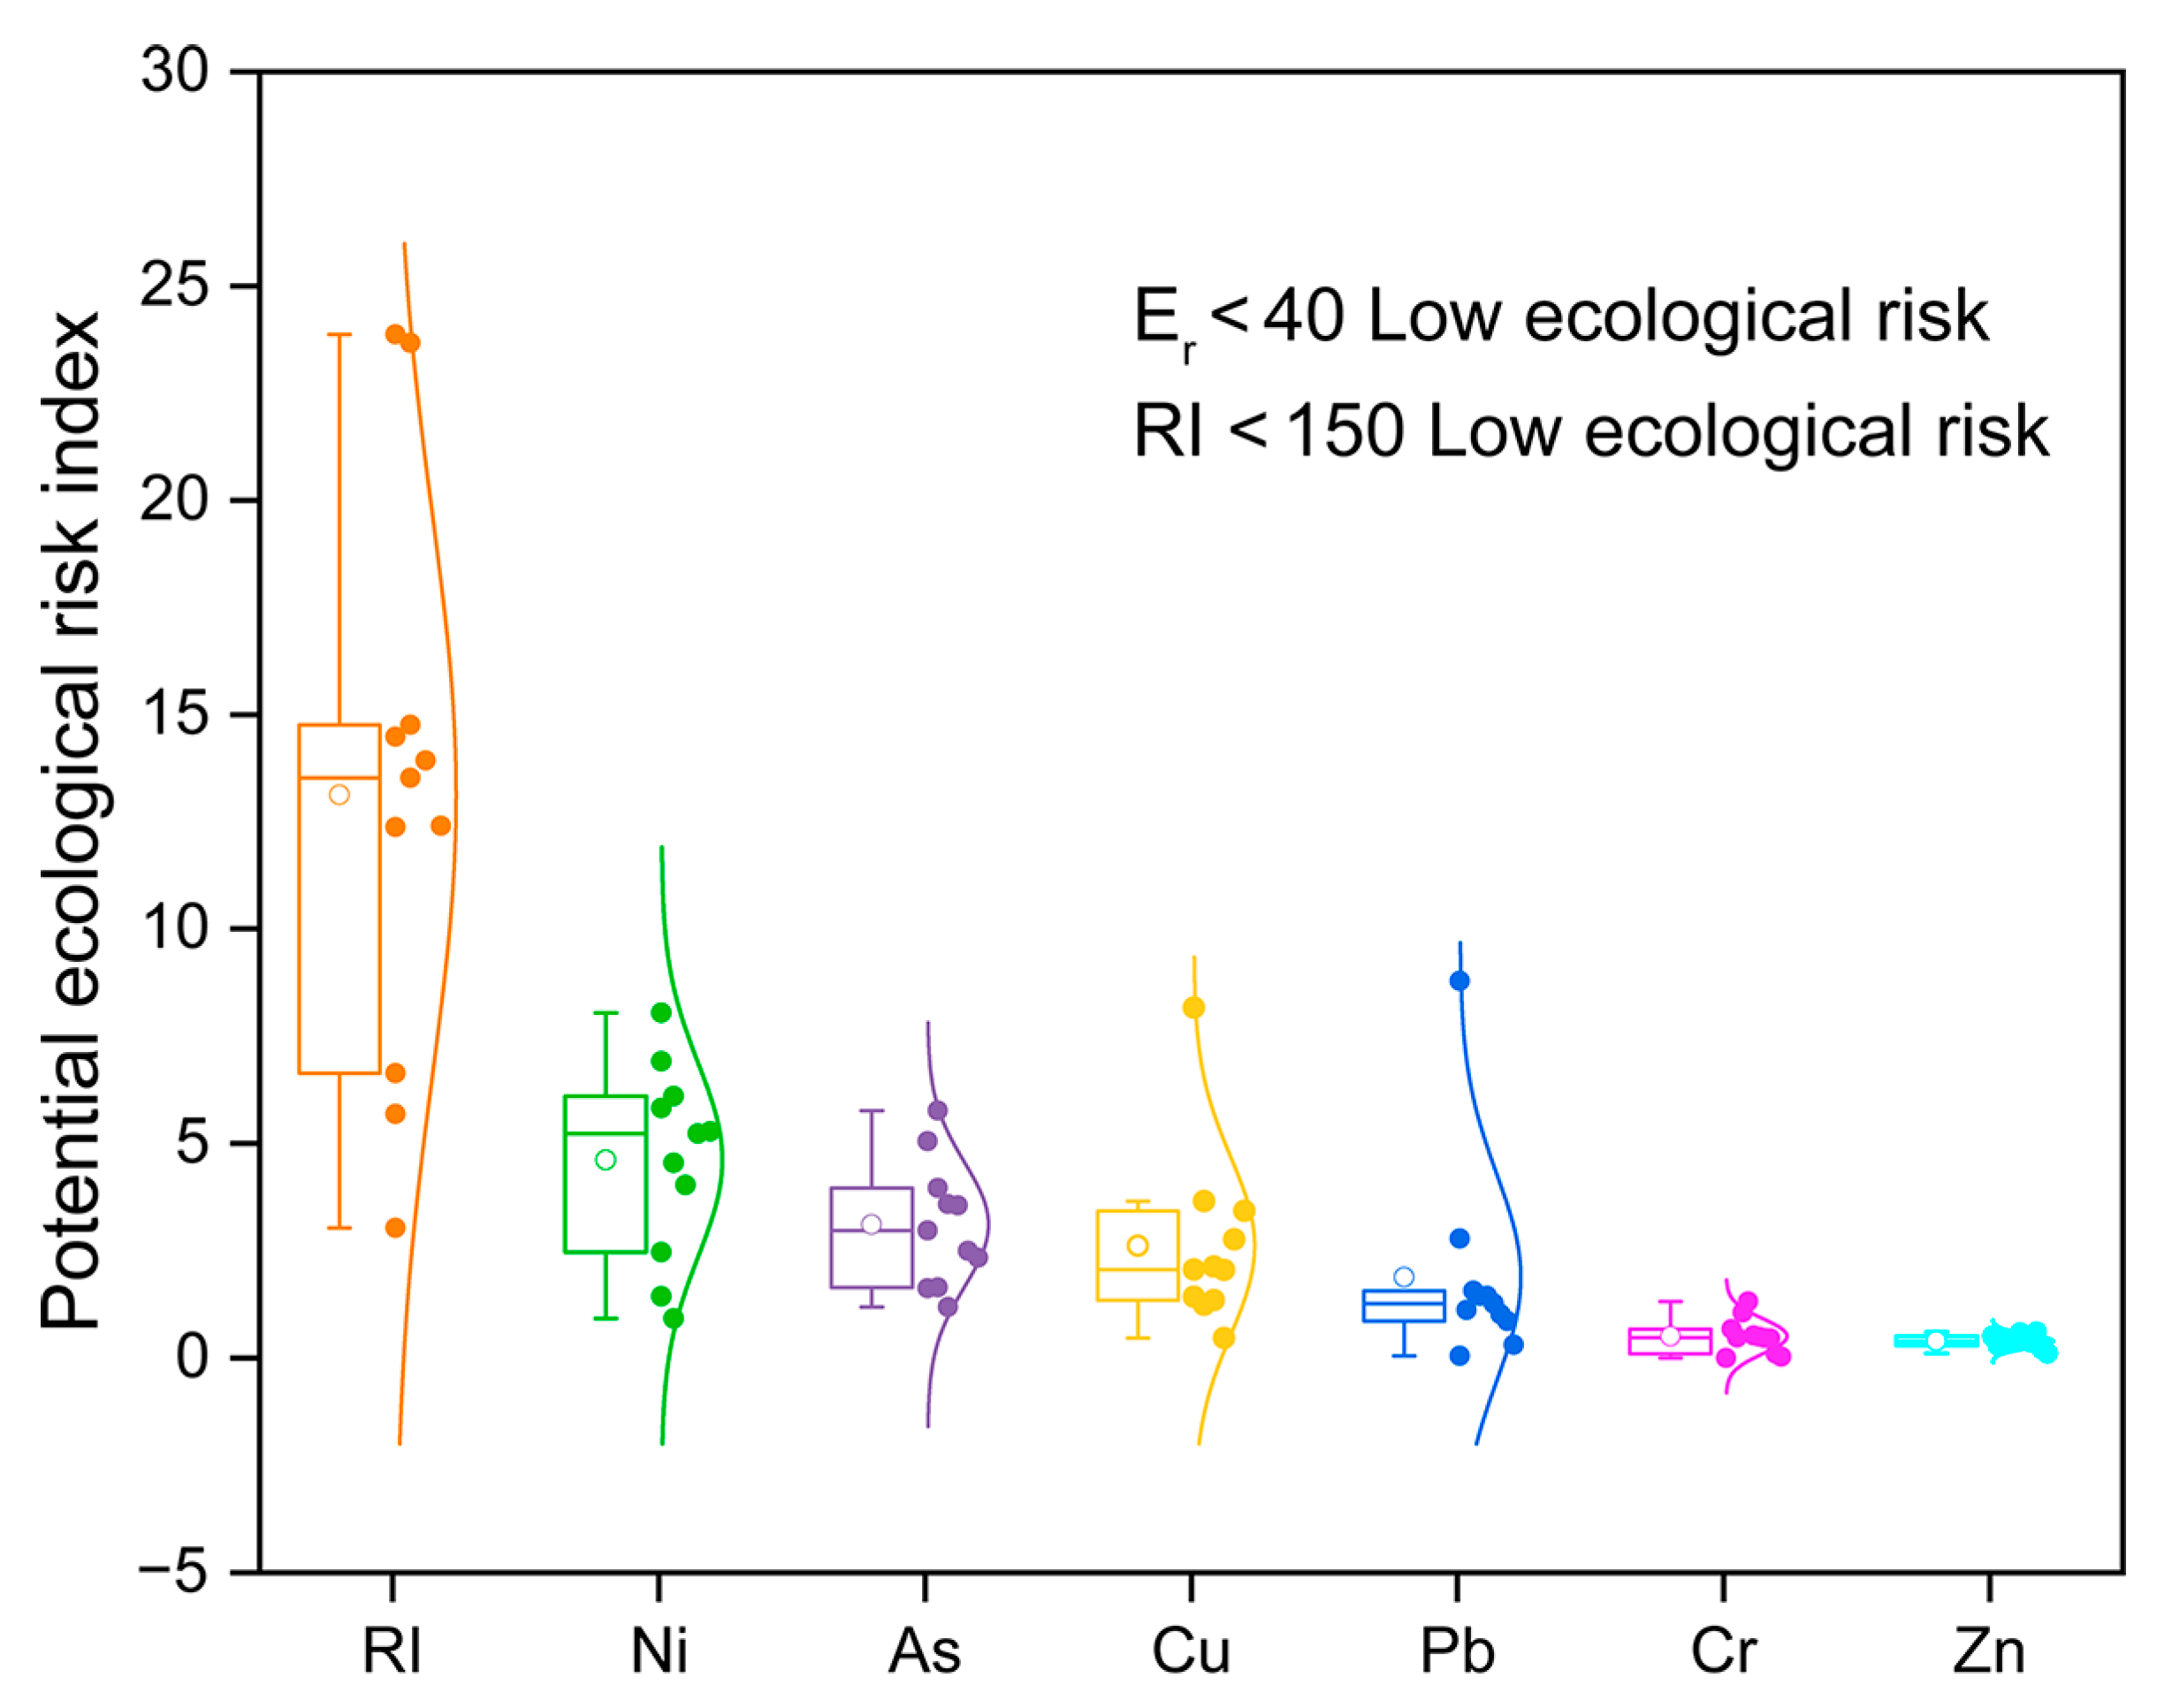
The PLI and mCd were applied to assess the ecological state of PTEs’ contamination in permafrost-affected soils in the Nadym region (Table 5). The PLI values in the soils of the three sampling sites in the Nadym region were 0.38 ± 0.18 (no pollution). In addition, the mCd values in the soils of the three sampling sites in the Nadym region were 0.46 ± 0.21 (nil to very low degree of pollution). In addition, RI values ranged from 3.03 to 23.87, indicating low potential ecological risks (Figure 7). The average values for PTEs were as follows: Ni (4.52) > As (2.94) > Cu (2.77) > Pb (2.00) > Cr (0.45) > Zn (0.39), indicating low potential ecological risks in permafrost-affected soils of the Nadym region.
Table 5.
Pollution load index (PLI) and modified contamination degree (mCd) for all potentially toxic elements (PTEs) in permafrost-affected soils of the Nadym region. PLI < 1: no pollution; mCd < 1.5: nil to a very low degree of pollution.

Figure 7.
Potential ecological risk index in permafrost-affected soils of the Nadym region. Er—potential ecological risk index of the i-th element. RI—potential ecological risk index for all potentially toxic elements (PTEs), including Ni, As, Cu, Pb, Cr, and Zn.
4. Discussion
At sampling sites in the Nadym region, the tundra revealed the highest contents of SOC and TN. Furthermore, the distribution patterns of SOC and TN in permafrost-affected soils of the Nadym region were similar. The high contents of SOC and TN in the tundra’s surface soil layer may be attributed to the high proportion of mosses [35]. Additionally, the slow rate of peat decomposition and specific soil water contents in permafrost-affected soils might contribute to higher soil organic matter content [35,36].
Permafrost-affected soils at sampling sites in the Nadym region were classified as slightly acidic. The acidic nature of permafrost-affected soils in the West Siberian tundra and forest tundra has been repeatedly noted in several studies [37,38]. Under low temperatures and excessive moisture, the transformation of plant residues led to the formation of mobile organic acids, which could penetrate deeply into the crust and soil mineral horizons [39].
The concentrations of MEs in our study area were significantly lower than those in other Arctic regions (Table 6). Recent studies have also indicated low concentrations of MEs in the Nadym region [5,40]. This might be due to the low local population (45,584 in 2021). Additionally, the dominance of sandy soils in the Nadym region is a primary reason for the low concentrations of MEs. Nizamutdinov et al. pointed out that young cities located on sandy soils were less susceptible to heavy metal pollution [37]. In Salekhard, the administrative center of Yamalo-Nenets Autonomous District, which is mainly situated on clay deposits, higher concentrations of Cr and Cu were observed [37]. Meanwhile, on the Taimyr Peninsula, concentrations of Ni, Cu, and Hg exceeded the average values of the Russian Arctic, due to its proximity to “Nornickel”, a large Russian nickel and palladium mining and smelting company in Norilsk [41]. In Yukon, Canada, the concentrations of Mn, Ni, Cu, and Cd were slightly higher near an actively retreating glacier, possibly due to atmospheric transport caused by frequent dust storms during the spring and summer [42]. In the Svalbard region of the Norwegian Arctic, variations in ME concentrations may be explained by crustal influence. Additionally, long-range atmospheric transport led to Hg deposition and subsequent accumulation in the surface soil of the Arctic [43]. Variations in ME concentrations in horizons A and B of the soil profile in the central Barents region reflected the geological complexity of the Arctic territory [44].
Table 6.
Comparison between average concentrations of metal elements (MEs) in this study and other Arctic areas.
In this study, Fe was significantly associated with soil texture, and its concentration was highest in the BF horizon of Histic Cryosols, which has also been documented in another study [39]. These findings indicated that Fe was influenced by soil texture and soil type. Meanwhile, other MEs are positively correlated with clay and silt and negatively associated with sand, indicating that MEs generally have a greater affinity for the finer fraction and are more prone to drainage and potential leaching in sandy soils [34,46]. Additionally, As and Cu were positively correlated with SOC and TN, indicating that As and Cu were key MEs of organic matter. The positive correlation between C/N and As indicated that organic matter could influence As through adsorption and/or chelation [47], which might explain the higher As concentration in the soil organic horizon observed in this study.
Factor 1 was primarily contributed by Fe, Zn, As, Cr, Ni, and Cu (29.13–53.06%). The concentrations of most MEs were low, which has been noted in other studies of the Nadym region [5,40]. Additionally, the distribution of Fe, Zn, Ni, and Cu showed significant eluvial and illuvial differentiation in abandoned farmland. These indicate that Factor 1 was likely from geological processes. Factor 2 was mainly dominated by Fe (38.39%), Mn (56.81%), Zn (37.06%), and Cu (24.40%). Related studies have revealed that MEs can be transported with aerosols over thousands of kilometers to Arctic regions [13,15,26]. Thus, Factor 2 in the Arctic was likely attributed to long-range atmospheric transport. Factor 3 was characterized by Mn (41.98%), Cr (40.21%), and As (26.56%). The concentrations of Mn, Cr, and As were elevated in the surface soil layers of abandoned farmland, and Cr was significantly correlated with As (p < 0.01). Additionally, phosphate fertilizers contained high concentrations of Mn, Cr, As, and Pb, and previous agricultural activities might lead to the accumulation of these MEs [48,49]. Factor 4 was mainly loaded on Pb (64.34%). At urban sampling sites, Pb concentrations were highest in the surface soil layers. Additionally, Pb in the Nadym region was proven to primarily originate from vehicle emissions [50]. Therefore, factor 4 can be interpreted as the transportation.
The results of the PLI and mCd indicated low potential ecological risks in the Nadym region. Among them, 9.09% to 18.18% of Ni, Cu, and Pb exhibited moderate enrichment. The PMF analysis showed that Pb (64.34%), Ni (25.06%), and Cu (22.08%) primarily originated from transportation sources. Additionally, Cu (24.40%) and Ni (10.25%) were attributed to long-range atmospheric transport. Therefore, despite the low potential ecological risks in the Nadym region, the potential ecological risks of Pb, Ni, and Cu still need to be given attention. Additionally, recent studies indicated that slight variations in ME concentrations could exceed threshold concentration in organisms [5]. More research is needed in the future to further investigate the ecological status of the Nadym region.
5. Conclusions
In summary, the average contents of SOC and TN in Histic Cryosols of tundra (8.59% and 0.27%) were significantly higher than those in Plaggic Podzols (Arenic, Gelic, and Turbic) of abandoned farmland (2.28% and 0.15%) and in Ekranic Technosols (Umbric) of urban area (1.32% and 0.09%). Additionally, the concentrations of most MEs (except for Zn) were higher in the AO horizon of the tundra. In abandoned farmland, the distribution of Fe, Zn, Ni, and Cu showed eluvial and illuvial differentiation, with higher concentrations in mineral horizons than in surficial organic layer, while Mn, As, and Cr accumulated in the topsoil. In urban areas, the concentrations of nearly all MEs decreased with increasing soil depth. Four sources of MEs were identified by the PMF model and correlation analysis, with contributions from geological processes (36%), atmospheric transport (23%), agricultural activities (21%), and transportation (20%). Among these, 41.50% to 53.06% of Fe, As, Cr, Ni, and Cu likely originated from geological processes; 24.40% to 56.81% of Fe, Mn, Zn, and Cu were derived from atmospheric transport; 26.56% to 41.98% of Mn, Cr, and As were attributed to agricultural activities; and 64.34% of Pb was likely sourced from transportation. The low values of Igeo, EF, PLI, mCd, and RI for PTEs indicated that permafrost-affected soils in the Nadym region were mainly in a practically uncontaminated state. This study reveals the accumulation patterns and source apportionment of MEs in permafrost-affected soils in the Nadym region of the Yamalo-Nenets Autonomous District and provides a scientific basis for further research on ecological security in local permafrost regions.
Author Contributions
Conceptualization, E.A. and W.W.; data processing, W.W.; software, W.W.; validation, W.W.; writing—original draft preparation, W.W.; writing—review and editing, E.M., X.W., S.Y., and E.A.; visualization, W.W. and G.L.; supervision, E.A. and X.W.; methodology, T.N. and A.P. All authors have read and agreed to the published version of the manuscript.
Funding
This work was funded by the Russian Science Foundation (24-44-00006), and the National Natural Science Foundation of China (32361133551 and 41941015).
Data Availability Statement
The raw data supporting the conclusions of this article will be made available by the authors on request.
Acknowledgments
We appreciate Vyacheslav Polyakov, Ekaterina Chebykina, Tatiana Minkina, Marina Nadporozhskaya, and Ivan Kushnov for their valuable guidance and suggestions on this manuscript. We are thankful to the two anonymous reviewers for their insightful comments that greatly improved this manuscript. This work was also supported by the China Scholarship Council.
Conflicts of Interest
The authors declare no conflicts of interest.
References
- Ji, X.; Abakumov, E.; Antcibor, I.; Tomashunas, V.; Knoblauch, C.; Zubzycki, S.; Pfeiffer, E.M. Influence of anthropogenic activities on metals in arctic permafrost: A characterization of benchmark soils on the Yamal and Gydan peninsulas in Russia. Arch. Environ. Contam. Toxicol. 2019, 76, 540–553. [Google Scholar] [CrossRef] [PubMed]
- Kazanin, A.; Kazanina, M.; Andreev, A. Energy complex of Russian Arctic. In Energy of the Russian Arctic: Ideals and Realities; Salygin, V.I., Ed.; Palgrave Macmillan: Singapore, 2022; pp. 63–86. [Google Scholar] [CrossRef]
- Lifshits, S.; Glyaznetsova, Y.; Erofeevskaya, L.; Chalaya, O.; Zueva, I. Effect of oil pollution on the ecological condition of soils and bottom sediments of the arctic region (Yakutia). Environ. Pollut. 2021, 288, 117680. [Google Scholar] [CrossRef] [PubMed]
- Walker, T.R.; Crittenden, P.D.; Young, S.D.; Prystina, T. An assessment of pollution impacts due to the oil and gas industries in the Pechora basin, north-eastern European Russia. Ecol. Indic. 2006, 6, 369–387. [Google Scholar] [CrossRef]
- Moskovchenko, D.; Shamilishvilly, G.; Abakumov, E. Soil Biogeochemical Features of Nadym-Purovskiy Province (Western Siberia), Russia. Ecol. Balk. 2019, 11, 113–126. Available online: https://openurl.ebsco.com/EPDB%3Agcd%3A6%3A16295014/detailv2?sid=ebsco%3Aplink%3Ascholar&id=ebsco%3Agcd%3A141284531&crl=c (accessed on 27 August 2024).
- Pithan, F.; Mauritsen, T. Arctic amplification dominated by temperature feedbacks in contemporary climate models. Nat. Geosci. 2014, 7, 181–184. [Google Scholar] [CrossRef]
- Chen, X.; Kang, S.; Hu, Y.; Yang, J. Temporal and spatial analysis of vegetation fire activity in the circum-Arctic during 2001–2020. Res. Cold Arid. Reg. 2023, 15, 48–56. [Google Scholar] [CrossRef]
- Zhang, M.; Zhou, Z.; Wen, Z.; Zhou, F.; Ma, Z.; Lei, B. Thermal-moisture dynamics and thermal stability of active layer in response to wet/dry conditions in the central region of the Qinghai-Tibet Plateau, China. Res. Cold Arid. Reg. 2023, 15, 27–38. [Google Scholar] [CrossRef]
- Mu, C.; Schuster, P.F.; Abbott, B.W.; Kang, S.; Guo, J.; Sun, S.; Wu, Q.; Zhang, T. Permafrost degradation enhances the risk of mercury release on Qinghai-Tibetan Plateau. Sci. Total Environ. 2020, 708, 135127. [Google Scholar] [CrossRef]
- Turetsky, M.R.; Abbott, B.W.; Jones, M.C.; Walter Anthony, K.; Olefeldt, D.; Schuur, E.A.; Koven, C.; McGuire, A.D.; Grosse, G.; Kuhry, P.; et al. Permafrost collapse is accelerating carbon release. Nature 2019, 569, 32–34. [Google Scholar] [CrossRef]
- Mao, C.; Kou, D.; Wang, G.; Peng, Y.; Yang, G.; Liu, F.; Zhang, J.; Yang, Y. Trajectory of Topsoil Nitrogen Transformations Along a Thermo-Erosion Gully on the Tibetan Plateau. J. Geophys. Res. Biogeosciences 2019, 124, 1342–1354. [Google Scholar] [CrossRef]
- Khan, M.S.; Zaidi, A.; Goel, R.; Musarrat, J. Biomanagement of Metal-Contaminated Soils; Springer Science & Business Media: Berlin/Heidelberg, Germany, 2011; Volume 20, p. 518. [Google Scholar]
- Rudnicka-Kepa, P.; Zaborska, A. Sources, fate and distribution of inorganic contaminants in the Svalbard area, representative of a typical Arctic critical environment-a review. Environ. Monit. Assess. 2021, 193, 724. [Google Scholar] [CrossRef] [PubMed]
- Grotti, M.; Ardini, F.; Vecchio, M.A.; Mataloni, M.; Bertinetti, S.; Bruschi, F.; Moroni, B.; Cappelletti, D.; Hobin, K.; Vanhaecke, F. New insights into the sources of atmospheric lead reaching the Arctic by isotopic analysis of PM10 atmospheric particles and resuspended soils. Atmos. Environ. 2024, 330, 120541. [Google Scholar] [CrossRef]
- Shevchenko, V.; Lisitzin, A.; Vinogradova, A.; Stein, R. Heavy metals in aerosols over the seas of the Russian Arctic. Sci. Total Environ. 2003, 306, 11–25. [Google Scholar] [CrossRef] [PubMed]
- Zaborska, A.; Beszczynska-Moller, A.; Wlodarska-Kowalczuk, M. History of heavy metal accumulation in the Svalbard area: Distribution, origin and transport pathways. Environ. Pollut. 2017, 231, 437–450. [Google Scholar] [CrossRef] [PubMed]
- Barinova, S.; Gabyshev, V.; Gabysheva, O. Phytoplankton in the Ecological Assessment of the Mining Facilities Influence on the Anabar River in the Permafrost Zone of the Arctic, Eastern Siberia, Russia. Land 2023, 12, 1775. [Google Scholar] [CrossRef]
- Rajaram, R.; Ganeshkumar, A.; Emmanuel Charles, P. Ecological risk assessment of metals in the Arctic environment with emphasis on Kongsfjorden Fjord and freshwater lakes of Ny-Alesund, Svalbard. Chemosphere 2023, 310, 136737. [Google Scholar] [CrossRef]
- McConnell, J.R.; Edwards, R. Coal burning leaves toxic heavy metal legacy in the Arctic. Proc. Natl. Acad. Sci. USA 2008, 105, 12140–12144. [Google Scholar] [CrossRef]
- Yakimov, A.S. New book about cryogenic soils of Western Siberia. Soil Sci. 2012, 812–813. Available online: https://elibrary.ru/item.asp?id=17745652 (accessed on 25 October 2011). (In Russian).
- Opekunova, M.G.; Opekunov, A.Y.; Kukushkin, S.Y.; Ganul, A.G. Background element concentrations in soils and bottom sediments of the North of Western Siberia. Soil Sci. 2019, 422–439, (In Russian with English abstract). [Google Scholar] [CrossRef]
- Sizov, O.; Fedorov, R.; Pechkina, Y.; Kuklina, V.; Michugin, M.; Soromotin, A. Urban Trees in the Arctic City: Case of Nadym. Land 2022, 11, 531. [Google Scholar] [CrossRef]
- Kukkonen, I.T.; Suhonen, E.; Ezhova, E.; Lappalainen, H.; Gennadinik, V.; Ponomareva, O.; Gravis, A.; Miles, V.; Kulmala, M.; Melnikov, V.; et al. Observations and modelling of ground temperature evolution in the discontinuous permafrost zone in Nadym, north-west Siberia. Permafr. Periglac. Process. 2020, 31, 264–280. [Google Scholar] [CrossRef]
- Nizamutdinov, T.; Suleymanov, A.; Morgun, E.; Yakkonen, K.; Abakumov, E. Soils and olericultural practices in circumpolar region of Russia at present and in the past. Front. Sustain. Food Syst. 2022, 6, 1032058. [Google Scholar] [CrossRef]
- Fedorov, R.; Kuklina, V.; Sizov, O.; Soromotin, A.; Prihodko, N.; Pechkin, A.; Krasnenko, A.; Lobanov, A.; Esau, I. Zooming in on Arctic urban nature: Green and blue space in Nadym, Siberia. Environ. Res. Lett. 2021, 16, 075009. [Google Scholar] [CrossRef]
- Moskovchenko, D.V.; Pozhitkov, R.Y.; Soromotin, A.V. Snow Contamination by Metals and Metalloids in a Polar Town: A Case Study of Nadym, Russia. Arch. Environ. Contam. Toxicol. 2024, 86, 304–324. [Google Scholar] [CrossRef] [PubMed]
- WRB. World Reference Base for Soil Resources. International Soil Classification System for Naming Soils and Creating Legends for Soil Maps, 4th ed.; International Union of Soil Sciences (IUSS): Vienna, Austria, 2022; Available online: https://wrb.isric.org/files/WRB_fourth_edition_2022-12-18.pdf (accessed on 27 August 2024).
- Rastvorova, O.G.; Andreev, D.P.; Gagarina, E.I.; Kasatkina, G.A.; Fedorova, N.N. Chemical Analysis of Soils; St. Petersburg University Publishers: St. Petersburg, Russia, 1995; p. 264. (In Russian) [Google Scholar]
- Shein, E.V. Soil Physics Course; Moscow University Publishers: Moscow, Russia, 2005; p. 432. (In Russian) [Google Scholar]
- Norris, G.; Duvall, R.; Brown, S.; Bai, S. EPA Positive Matrix Factorization (PMF) 5.0. Fundamentals and User Guide; Environmental Protection Agency Office of Research and Development: Washington, DC, USA, 2014; p. 136. Available online: https://www.epa.gov/sites/default/files/2015-02/documents/pmf_5.0_user_guide.pdf (accessed on 27 August 2024).
- Zhang, J.; Zhou, X.; Wang, Z.; Yang, L.; Wang, J.; Wang, W. Trace elements in PM(2.5) in Shandong Province: Source identification and health risk assessment. Sci. Total Environ. 2018, 621, 558–577. [Google Scholar] [CrossRef] [PubMed]
- Arruti, A.; Fernandez-Olmo, I.; Irabien, A. Impact of the global economic crisis on metal levels in particulate matter (PM) at an urban area in the Cantabria Region (Northern Spain). Environ. Pollut. 2011, 159, 1129–1135. [Google Scholar] [CrossRef]
- Wang, W.; Abakumov, E.; Wu, X.; Ji, X.; Mu, C.; Zhu, X.; Li, G. Accumulation pattern and risk assessment of metal elements in permafrost-affected soils on the Qinghai-Tibet Plateau. CATENA 2023, 220, 106665. [Google Scholar] [CrossRef]
- Kabata-Pendias, A. Trace Elements in Soils and Plants, 3rd ed.; CRC Press: Boca Raton, FL, USA, 2000; p. 403. [Google Scholar]
- Shamilishvili, G.A.; Abakumov, E.V.; Pechkin, A.S.; Kobelev, V.O. Soil organic carbon and total nitrogen stock alteration under the influence of linear construction in the conditions of permafrost insular distribution on the example of Nadym region of the Yamal-Nenets Autonomous District. Sci. Bull. Yamal-Nenets Auton. Dist. 2017, 1, 87–91. Available online: https://elibrary.ru/item.asp?id=34904243 (accessed on 27 August 2024). (In Russian).
- Budantseva, N.A.; Chizhova, J.N.; Bludushkina, L.B.; Vasilchuk, Y.K. Stable isotopes of oxygen, hydrogen and carbon and the age of pals near the village of Eletsky, northeast of the Bolshezemelskaya tundra. Arct. Antarct. 2017, 4, 38–56. (In Russian) [Google Scholar] [CrossRef]
- Nizamutdinov, T.; Morgun, E.; Pechkin, A.; Kostecki, J.; Greinert, A.; Abakumov, E. Differentiation of Trace Metal Contamination Level between Different Urban Functional Zones in Permafrost Affected Soils (the Example of Several Cities in the Yamal Region, Russian Arctic). Minerals 2021, 11, 668. [Google Scholar] [CrossRef]
- Kukushkin, S.Y. Indicators of Anthropogenic Load on Natural-Territorial Complexes during the Development of Oil and Gas Condensate Fields in the North of Western Siberia. Ph.D. Thesis, Russian State Hydrometeorological University, St. Petersburg, Russia, 2017. (In Russian). [Google Scholar]
- Romanenko, E.A.; Moskovchenko, D.V.; Kudryavtsev, A.A.; Shigabaeva, G.N. Mobile Forms of Metals in Soils in the Nadym-Pur Interfluve (Western Siberia). Bull. Nizhnevartovsk State Univ. 2020, 2, 136–145. (In Russian) [Google Scholar] [CrossRef]
- Moskovchenko, D.V.; Romanenko, E.A. Biogeochemical Features of Landscapes of the Nadym Region of YANAO. Bull. Nizhnevartovsk State Univ. 2022, 4, 122–136, (In Russian with English abstract). [Google Scholar] [CrossRef]
- Allen-Gil, S.M.; Ford, J.; Lasorsa, B.K.; Monetti, M.; Vlasova, T.; Landers, D.H. Heavy metal contamination in the Taimyr peninsula, Siberian Arctic. Sci. Total Environ. 2003, 301, 119–138. [Google Scholar] [CrossRef] [PubMed]
- Bachelder, J.; Cadieux, M.; Liu-Kang, C.; Lambert, P.; Filoche, A.; Galhardi, J.A.; Hadioui, M.; Chaput, A.; Bastien-Thibault, M.-P.; Wilkinson, K.J.; et al. Chemical and microphysical properties of wind-blown dust near an actively retreating glacier in Yukon, Canada. Aerosol Sci. Technol. 2020, 54, 2–20. [Google Scholar] [CrossRef]
- Halbach, K.; Mikkelsen, O.; Berg, T.; Steinnes, E. The presence of mercury and other trace metals in surface soils in the Norwegian Arctic. Chemosphere 2017, 188, 567–574. [Google Scholar] [CrossRef] [PubMed]
- Reimann, C.; Ayras, M.; Chekushin, V.; Bogatyrev, I.; Boyd, R.; Caritat, P.; Dutter, R.; Finne, T.E.; Halleraker, J.H.; Jager, O.; et al. Environmental Geochemical Atlas of the Central Barents Region: Special Publication of the Central Kola Expedition, Geological Survey of Finland and Geological Survey of Norway; Schweizerbart Science Publishers: Stuttgart, Germany, 1998; p. 743. [Google Scholar]
- Suleymanov, A.; Nizamutdinov, T.; Morgun, E.; Abakumov, E. Assessing and geostatistical mapping of metal contamination in the polar arable plot (Yamal-Nenets Autonomous District, Russia). Int. J. Environ. Sci. Technol. 2024, 21, 2575–2584. [Google Scholar] [CrossRef]
- Weil, R.R.; Brady, N.C. The Nature and Properties of Soils, 15th ed.; Pearson Education: London, UK, 2017; p. 1105. [Google Scholar]
- Aftabtalab, A.; Rinklebe, J.; Shaheen, S.M.; Niazi, N.K.; Moreno-Jimenez, E.; Schaller, J.; Knorr, K.H. Review on the interactions of arsenic, iron (oxy)(hydr)oxides, and dissolved organic matter in soils, sediments, and groundwater in a ternary system. Chemosphere 2022, 286, 131790. [Google Scholar] [CrossRef]
- Niu, J.; Liu, C.; Huang, M.; Liu, K.; Yan, D. Effects of Foliar Fertilization: A Review of Current Status and Future Perspectives. J. Soil Sci. Plant Nutr. 2020, 21, 104–118. [Google Scholar] [CrossRef]
- Jiao, W.; Chen, W.; Chang, A.C.; Page, A.L. Environmental risks of trace elements associated with long-term phosphate fertilizers applications: A review. Environ. Pollut. 2012, 168, 44–53. [Google Scholar] [CrossRef]
- Kitilyuk, L.I. Hygienic Significance of Heavy Metals in Assessing the Health Status of the Population of the Far North. Ph.D. Thesis, Institute of Medical Problems of the Extreme North Krasnoyarsk, Krasnoyarsk, Russia, 2006. (In Russian). [Google Scholar]

Disclaimer/Publisher’s Note: The statements, opinions and data contained in all publications are solely those of the individual author(s) and contributor(s) and not of MDPI and/or the editor(s). MDPI and/or the editor(s) disclaim responsibility for any injury to people or property resulting from any ideas, methods, instructions or products referred to in the content. |
© 2024 by the authors. Licensee MDPI, Basel, Switzerland. This article is an open access article distributed under the terms and conditions of the Creative Commons Attribution (CC BY) license (https://creativecommons.org/licenses/by/4.0/).