Article

Evaluating Cultivated Reserved Land Resources in a Highly Urbanized Region of China: A Case Study in Haishu District, Ningbo City

1
Chongqing Institute of Green and Intelligent Technology, Chinese Academy of Sciences, Chongqing 400714, China
2
Ningbo Institute of Surveying, Mapping, and Remote Sensing, Ningbo 315016, China
3
National Tibetan Plateau Data Center, Key Laboratory of Tibetan Environmental Changes and Land Surface Processes, Institute of Tibetan Plateau Research, Chinese Academy of Sciences, Beijing 100101, China
4
State Key Laboratory of Hydrology-Water Resources and Hydraulic Engineering, National Cooperative Innovation Center for Water Safety and Hydro-Science, College of Hydrology and Water Resources, Hohai University, Nanjing 210098, China
5
Southwest Research Institute for Hydraulic and Water Transport Engineering, Chongqing Jiaotong University, Chongqing 400074, China
*
Authors to whom correspondence should be addressed.
Land 2024, 13(9), 1444; https://doi.org/10.3390/land13091444 (registering DOI)
Submission received: 12 August 2024 / Revised: 3 September 2024 / Accepted: 5 September 2024 / Published: 6 September 2024

Abstract

:
Cultivated reserved land resources are pivotal for achieving food security and sustainable agricultural development. However, existing research on these resources often grapples with issues such as the lack of current data and underutilization of available data. This study focuses on Haishu District in Ningbo City of China, an economically developed area, and uses the third national land survey data to identify potential agricultural and construction lands suitable for conversion to cultivation. Through the application of the limiting factor method and the Analytic Hierarchy Process (AHP), the results indicate that the potentials of reserved cultivated land and the reclamation potential of construction land in Haishu District are estimated at 503.07 and 1527.50 ha, respectively. These lands are primarily rated as generally suitable and marginally suitable for agriculture, suggesting a moderate overall quality of reserved cultivated resources. This study emphasizes the practice of surveying reserved cultivated land, to boost effective land management and strategic development.

1. Introduction

In recent years, the rapid expansion of the global population coupled with the accelerated pace of economic development, has significantly increased the demand for land resources critical to ensuring food security [1,2]. As such, the escalating need for agricultural land is becoming increasingly urgent. It is further intensified by the continuous advancement of urbanization and industrialization, which encroach upon fertile cultivated lands [3]. This situation highlights the critical importance of adopting sustainable land-use strategies to navigate the growing challenges. To respond to these challenges, China has long taken proactive measures to protect cultivated land, which aims at balancing the cultivated land development and compensating for its loss by improving underutilized agricultural land [4]. In 1997, China’s Ministry of Land and Resources established the National Land Consolidation and Rehabilitation Center (NLCRC) to address the issue of land fragmentation. The national land consolidation program was successively launched for two decades, from 2000 to 2010 and 2011 to 2020. It is estimated that from 2000 to 2010, land-use efficiency increased by 3% to 10%, with at least 37.5 million mu of cultivated land being consolidated during this period [5]. This strategic initiative seeks to mitigate the adverse effects of land appropriation for construction and development projects by optimizing the use of reserve land resources that can be cultivated for agriculture.
The start of land survey for China is later than other developed economies [6], officially initiating its first national land survey in 1984, providing data and information for the sustainable use and management of land resources [7]. As of 2020, China has conducted a total of three national land surveys, with durations were 13 years (1996), 3 years (2009), and 3 years (2019), respectively [8]. In particular, the latest China Third National Land Survey (CTNLS) uses high-resolution remote sensing images (finer than 1 m) as the base map, and with the help of mobile Internet, cloud computing platforms, drones, and other advanced technologies, 219,000 investigators have participated in the survey, and 295 million survey patches have been collected to comprehensively investigate the national land-utilization status [9]. According to the statistics (including irregular dynamic updates), even in the context of China’s implementation of the policy of balancing requisition and compensation, 7.53 × 10⁶ ha of cultivated land was still lost from 2009 to 2019 [10]. However, to date, the studies regarding the potential of China’s regional cultivated reserved land resources based on high-precision land surveys have yet to be adequately undertaken. In particular, the evaluation of cultivated reserved land resources focusing on the district and county administrative level is more in line with the policy formulation strategy of government agencies based on local conditions [11].
Cultivated reserved land resources normally refer to those land resources that can be converted into cultivated land through land consolidation measures like development, reclamation, or consolidation under existing natural economic, and technical conditions [12]. These currently underexploited or entirely uncultivated lands harbor considerable potential to enhance agricultural yield and promote long-term sustainable practices. The identification and subsequent evaluation of these lands for agricultural purposes stand as critical endeavors, paving the way for their efficient management and utilization. Nevertheless, their evaluation process is intricate, requiring detailed analyses that account for a wide array of considerations, including meticulously considering land quality, ecological conditions, the impacts of climate variability, and socio-economic implications [13]. These complex inter-relationships work on how each element influences the land’s potential for cultivation and its eventual productivity.
Current studies in this field mainly emphasize the nature and potential of cultivated reserved land resources, including spatio-temporal characteristics analysis [14], regional water balance [15], quality–quantity requisition–compensation balance [16,17], potentiality, and suitability evaluations [18,19]. Such research endeavors aim to provide a nuanced understanding of cultivated reserved land resources, offering vital information for their strategic management and contributing significantly to the discourse on sustainable land use and food security. With the development of observation hardware techniques and survey methods, the resulting tremendous data concerning land use, coverage, and attributes bring both opportunities and challenges in the identification and assessment of cultivated reserved land resources, especially considering data acquisition costs and analysis complexity from the images with high spatio-temporal resolution [20]. This integration poses additional difficulties due to the differing resolutions, coverage, and data formats. Furthermore, the task of identifying cultivated reserved land resources demands an integrated consideration of numerous factors, including the quality of land, ecological conditions, climatic variables, and socio-economic elements, making the task particularly daunting due to the intricate interplay among these factors [15]. Despite significant progress in evaluating and utilizing potential cultivated land resources, the assessment of farmland potential in highly urbanized areas is often overlooked. These areas, driven by rapid urban expansion and industrial development, face an urgent need for land resources [21,22]. Efficient utilization and conservation of cultivated land in these areas are crucial for optimizing land-use structure and alleviating resource scarcity. However, due to challenges such as data acquisition difficulties and complex land-use changes, studies focusing on highly urbanized areas are scarce.
In this context, this study selects the Haishu District in Ningbo City as a study area, representing a typical highly economically developed area in China. Based on the complete national land survey data (update to 2022) and the thematic land data, we employ the Analytic Hierarchy Process (AHP) in conjunction with various limiting factors to assess land cultivation suitability, to provide a fine and scientifically rigorous framework for the exploration of China’s regional cultivated reserved land resources.

2. Study Area

The Haishu District (hereafter referred to as the HD) spans an area of 595.2 km2, and is situated in Ningbo City within Zhejiang Province, which is the heart of China’s eastern seaboard (29°88′07.92″ N, 121°55′72.89″ E) along with the south of the Yangtze River Delta (Figure 1a). Ningbo’s economy ranks among China’s top-performing cities in terms of economic growth and reflects a significant indicator of national economic trends. With a population of approximately 909,000 residents, the HD achieved a remarkable gross domestic product (GDP) of 1646.91 billion yuan in 2023 issued by the Economic Aggregate of the HD Government [23]
The district benefits from the subtropical monsoon climate, enjoying mild temperatures, moderate humidity, and distinct seasonal transitions. The district benefits from a climatic advantage, which is further enhanced by its diverse topography. Over 50% of the land area is covered in steep hills and mountains, creating a unique ecological backdrop that has a significant impact on land use and agricultural practices. Specifically, the Yaojiang, Fenghuajiang, and Yongjiang flow through Ningbo’s plains, enriching the soil and fostering a robust agricultural sector within the HD. An area of 437.05 km2 is dedicated to agriculture, accounting for 73.43% of the entire district. This includes 103.65 km2 of highly productive cultivated land, with 91.55 km2 allocated to paddy fields and the remaining 12.10 km2 to dry land farming (Figure 1d). This critical agricultural infrastructure is concentrated mainly in the central parts of the HD, making it a vital hub for farming activities. The eastern urban edges and the mountainous western regions of the HD host smaller plots of cultivated land. These areas highlight the intricate relationship between urban expansion, rugged terrain, and agricultural distribution, reflecting the complex dynamics of geography, climate, and human activity that shape HD’s agricultural and economic landscape [24].

3. Materials and Methods

3.1. Data Sources

To identify the cultivated reserved land resources within the study area, this research utilized a variety of thematic land data, including the results of the third land survey, the latest data on land-use changes, coastline revision data, historical land reclamation data, integrated data on forest resources, data on million-mu afforestation projects, annual monitoring data of wetland resources, abandoned mine data, areas prone to geological disasters classified by risk level, records of land reclamation projects over the years, illegal construction data, data on unused land suitable for cultivation, agricultural land converted for other uses, data on key project land supply, and information on urban–rural construction land increase–decrease linkage projects. Planning data included the following: the delineation of the three types of land-use zones, land-use planning, and land consolidation planning. The above data are obtained from the HD Branch of the Ningbo Municipal Bureau of Natural Resources and Planning [25].

3.1.1. China Third National Land Survey Data

This study utilized data sourced from the third national land survey (CTNLS) overseen by the State Council and publicly released in 2019 [8]. The execution of this survey was the responsibility of the specially constituted China National Land Survey Leading Group Office, which was mandated by the State Council. The primary objective of this group was to carry out a thorough and methodical inventory of the land resources and their respective utilization across China at various intervals, and they can be accessed from China’s 31 provinces or the China Land Survey Results Sharing Application Service Platform, ensuring a broad and detailed foundation for the research.
Compared with the previous two surveys, the CTNLS has achieved substantial improvements by leveraging high-precision true digital orthophoto mapping and implementing stricter measurement criteria. A key feature of the CTNLS is the employment of satellite imagery with resolutions of one meter or below, as reported by the Ministry of Natural Resources of the People’s Republic of China. This survey was distinguished by the predominant use of Chinese-made satellite technologies, including BJ-2, ZY-3, and GF-2 satellites [26]. Moreover, the CTNLS enables the generation of more detailed land-use status maps that accurately represent smaller land parcels. In addition to the traditional 3S technologies, the survey incorporates advanced technological integrations such as mobile Internet, cloud computing, and drone usage, significantly enhancing the efficiency and precision of mapping and surveying practices. Detailed information on the CTNLS can be referred to in Table 1 from Chen et al. [6].
Typically, the orthophoto maps are created to extract information on land-use changes year on year under the guidance of the latest remote sensing monitoring plots provided by national authorities, the CTNLS findings, and the previous year’s land-use change survey results from the database. Moreover, by integrating monitoring data and other pertinent natural resource management information, survey-base maps are produced to conduct field investigations and evidence collection by capturing changes in land type, area, attributes, and related layer properties for the current year, thereby updating the national-level land survey database.

3.1.2. Environmental Factors of Land Sources

Assessing the potential for cultivating reserved land resources requires a detailed examination of critical limiting factors that are largely influenced by the land’s natural resources. These factors encompass ambient temperature, soil pH levels, the gradient of the terrain, the proportion of gravel in the soil, the amount of organic carbon present, the depth of the effective soil layer, the density of the soil, and the conditions affecting both drainage and soil moisture. Within Ningbo City, most areas meet the cultivation criteria concerning temperature, hydrology, and drainage; thus, these factors are not included in the scope of this study. The foundational datasets that inform this analysis are cataloged in Table 2, which can be accessed from the National Earth System Science Data Center of China [27]. To ensure uniformity across different data sources, such datasets have been spatial resampled to 30 m resolution by the bilinear interpolation method in this study.

3.2. Methods

3.2.1. Environment Impact Factors Pre-Processing

(1)
Soil physicochemical properties and topographic factors
The soil physicochemical properties data are sourced from the National Earth System Science Data Center. The dataset includes measurements of organic carbon, pH, total nitrogen, total phosphorus, total potassium, gravel content, clay content, silt content, gravel content larger than 2 mm, and soil layer thickness across different soil depths (0–5 cm, 5–15 cm, 15–30 cm, 30–60 cm, 60–100 cm). The weighted average of these soil properties is calculated based on the stratification depth. Notably, the amount of organic matter in soil is estimated from its carbon content using the 1.724 conversion factor [28]. Moreover, the average soil properties are resampled to a 30 m resolution. The classification of soil types follows the methodology used in the HWSD database, which is based on the content of sand, clay, and silt.
In terms of topographic factors, all average soil properties are also harmonized to a 30 m resolution by the bilinear interpolation method. Based on the ASTER GDEM Digital Elevation Model (DEM), slope length (L), and steepness (S) are calculated from Equations (1)–(3). Due to the presence of a large amount of steep-slope farmland with gradients ranging from 15° to 25° in Zhejiang Province, the slope factor must also consider conditions on steep slopes. Hence, the soil erosion equations [29] for calculating slope length and steepness are applicable to areas with a slope below 18%; the equations are as follows:
S = 10.80 sin θ + 0.03 ,   9 % > θ > 0 16.80 sin θ 0.50 ,   18 % θ 9 % 21.91 sin θ 0.96 ,   θ > 18 %
L = r 20 m
m = 0.45 ,   θ 40 % 0.35 ,   40 % > θ 21 % 0.20 ,   21 % > θ 9 % 0.15 ,   9 % > θ 0
where θ represents the slope in percentage, r is the slope length in meters, and m is an exponent.
(2)
Rainfall erosivity
Precipitation is the main driving factor causing soil erosion, which significantly affects soil conservation ability [30]. Currently, algorithms with optimal parameters developed by Zhang and Fu [31] have been widely tested and applied to derive rainfall erosivity over steep-slope areas, and the corresponding equations for estimating rainfall erosivity (R) [32] in the HD based on monthly average rainfall are as follows:
R = 0.3589 F 1.9462
F = i = 1 12 p i P
Here, F is an index explaining the seasonal variation in annual precipitation; and P and pi represent the annual rainfall and the rainfall for the ith month (mm), respectively.
(3)
Vegetation cover management factor
The Vegetation cover management factor (C) quantifies the comparison of soil erosion from vegetated or cultivated lands under equivalent conditions to that of exposed soil, highlighting its significance in soil conservation [33]. The application of NDVI for calculating the C factor on a regional basis has proven to enhance the precision of soil conservation assessments [34]. Here, the composite NDVI, representing a multi-year average of the maximum NDVI values over the study period, is used for the empirical function of the C factor (Equation (6)). Considering the actual situation of vegetation cover and soil and water loss, the C factor for water bodies and construction zones is set by default to 0.001 and 0.1.
C = 1.2899 e 6.343 N D V I ,   F o r e s t   a n d   G r a s s l a n d 0.143 ln N D V I + 0.2525 ,   C r o p l a n d
(4)
Soil erodibility
Soil erodibility (K) typically refers to how prone a soil is to erosion [35]. It can be described as the volume of soil lost per unit of external erosive forces, like rainfall intensity, surface runoff, and groundwater seepage. K can be estimated by obtaining it from the modified EPIC model using a correction equation proposed by Zhang, Shu [36]. The equations are as follows:
K E P I C = 0.1317 0.2 + 0.3 exp 0.0256 S a n d 1 S i l t 100 × S i l t C l a y + S i l t 0.3 1 0.25 O C O C + exp 3.72 2.95 O C × 1 0.7 S n S n + exp 5.51 + 22.9 S n
S n = 1 S a n d 100
K = 0.51575 K E P I C 0.01383 × 0.1317
where KEPIC represents the soil erodibility factor estimated based on the EPIC model, Sand, Silt, and Clay represent the content of sand, silt, and clay in the soil in percentage, respectively; OC is the soil organic carbon content in percentage.
(5)
Soil erosion assessment
The Revised Universal Soil Loss Equation (RUSLE) stands as the globally most adopted model for assessing soil erosion due to water erosion on field scales. RUSLE integrates a variety of factors, including rainfall pattern, soil type, topography, crop system, and management practices, to accurately predict the rate of soil erosion under different environmental conditions [37]. According to the RUSLE equation, factors such as rainfall, soil, topography, and vegetation cover are used to calculate the soil erosion modulus.
A = R × K × L S × C × P
where A is the soil erosion modulus in tons per hectare per year; R is the rainfall erosivity in MJ·mm per hectare per hour per year; K is the soil erodibility factor in tons hectare hours per hectare MJ·mm; LS is the topographic factor (L is the slope length factor, S is the steepness); C is the vegetation cover factor; and P is the management factor, which is set to 1 for the potential cultivated land in this study.

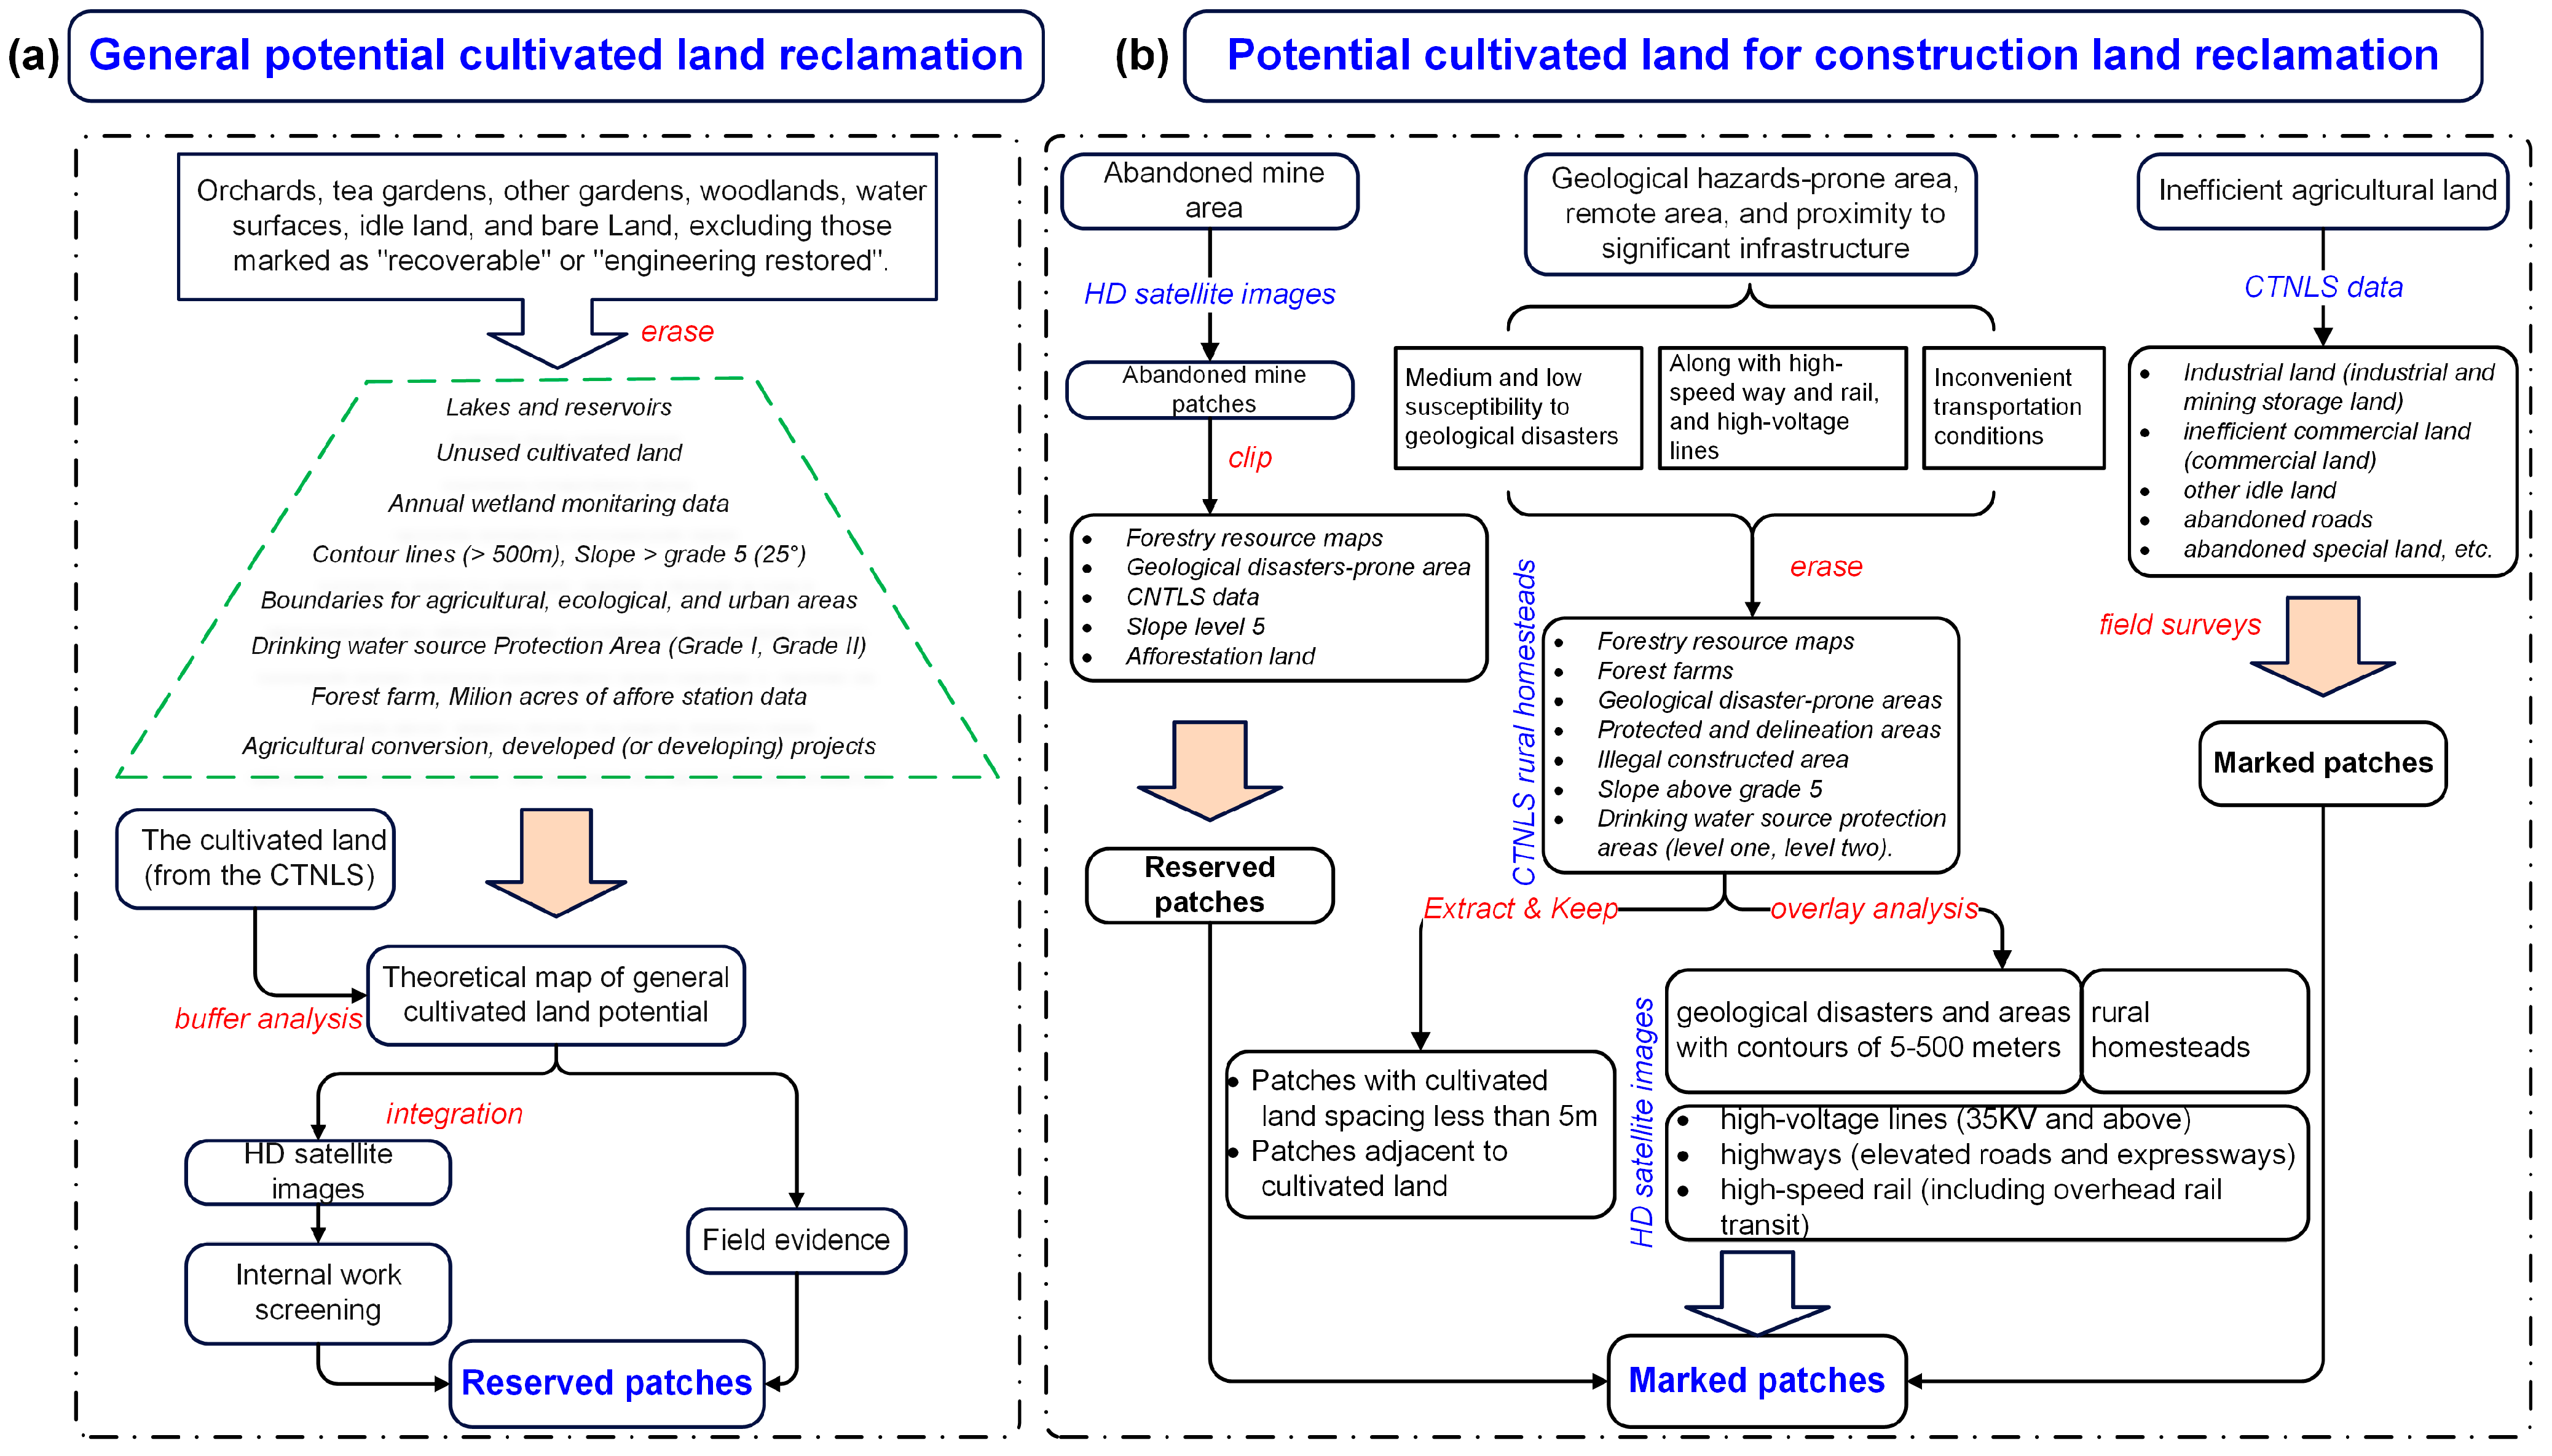
3.2.2. Cultivated Reserved Land Resources Extraction

The extraction of potential cultivated land resources meticulously combines technical processes with on-site operations, ensuring the effective identification and protection of cultivated land resources. The extraction measures are categorized into two main types: general cultivated land reclamation potential and constructed land reclamation potential. The concept of “general potential cultivated land” encompasses areas that are not currently used for agriculture but possess the natural attributes and conditions necessary to be developed into arable land. This can include underutilized lands, such as abandoned fields or fallow areas, as well as non-agricultural lands that could be converted for cultivation purposes. While “constructed land reclamation potential” refers to land that has previously been used for non-agricultural purposes, such as urban or industrial areas, but is now considered for reversion to agricultural use. The relevant extraction process mainly refers to the “Technical Specifications for High-Standard Farmland Construction in Drylands (Trial)” issued by the General Office of the Ministry of Agriculture and Rural Affairs of China [38].
The selection of general cultivated land potential follows a detailed, multi-step process utilizing land survey data to pinpoint plots with real agricultural potential (Figure 2a). The process starts by choosing specific land types, such as orchards and tea gardens, excluding plots classified as “immediately restorable” or “engineering restorable” to focus on genuine cultivation opportunities. Rigorous exclusion criteria eliminate unsuitable areas, including lands covered by forests, wetlands, prone to geological disasters, with elevations over 500 m, steep slopes (Grade 5 and above), previously converted for non-agricultural uses, or within protected zones (e.g., near water sources). Moreover, the narrow and fragmented plots along roads and rivers are removed using buffer zones to enhance plot selection. Plots within 30 m of existing cultivated land are given priority, aligning with the standards for access roads, to ensure easy integration into the agricultural landscape. These plots are categorized as continuous or isolated based on their proximity, with a focus on minimizing fragmentation and consolidating cultivated resources. Plots are then integrated based on a 5 m proximity rule to promote cohesive agricultural development. Lastly, small isolated plots under 0.5 acres, not near existing cultivated land, are excluded to maintain the economic viability of cultivation efforts.
Regarding the potential for reclaiming construction land for agricultural use, the focus shifts toward identifying reclaimable land within developed or utilized areas (Figure 2b). These sites are classified based on their urban or non-urban location, targeting inefficiently used lands, residential areas, and industrial or mining areas. The process begins with local townships reporting inefficient land use, followed by comprehensive on-site evaluations to ascertain the current state and potential for reclamation. Screening these plots is a pivotal step, aiming to identify those that hold promise for conversion back to cultivated land. Special attention is given to areas with particular constraints, such as those prone to geological disasters, remote locations, or areas with extreme environmental conditions, to evaluate their suitability and potential for reclamation rigorously [39]. Additionally, another focus is placed on mines, where existing mining rights and the condition of abandoned mine sites are assessed to identify opportunities for land restoration [40].

3.2.3. Suitability Evaluation of Cultivated Land

The suitability evaluation of the extracted cultivated reserved land resources aims at quantifying the weights of different parameters within a multi-criteria problem, thus facilitating systematic decision making. This can be evaluated through the Analytic Hierarchy Process (AHP), which is a multi-criteria evaluation and decision-making methodology introduced by Saaty [41]. The AHP simplifies complex decisions by structuring them into a hierarchy of criteria, sub-criteria, and alternatives from which decisions can be made.
In AHP, decisions are broken down into a series of pairwise comparisons to evaluate the relative importance of various elements within each level of the hierarchy against elements in the subsequent level. The outcomes of these pairwise comparisons are then organized into a matrix, and with the input of expert judgment, priority scales are derived.
This matrix approach is fundamental to AHP, as it converts subjective assessments into a set of objective criteria that can be analyzed to determine the best course of action. The detailed process can be found in Xiao, Yang [42], and the expression is simply expressed as follows:
S i = j = 1 m p j w j
where Si is the suitability score of the evaluation unit (i = 1, 2, …, n, where i is the evaluation unit within the grid cell); pj is the score of the jth evaluation factor of the ith evaluation unit (j = 1, 2, …, m, where j is the evaluation factor, i.e., the evaluation index); and wj is the weight of the jth evaluation factor of the ith evaluation unit. The comprehensive suitability classification criteria follow that S scores are categorized into different levels, with every 10 points representing a distinct tier for scores above 60, which is classified into temporarily unsuitable, low suitability, medium suitability, and high suitability areas based on the comprehensive scores of each factor for potential cultivated land resources (Table 3).
Based on the impact of evaluation factors on the natural suitability of cultivated land, each influencing factor is classified and quantified using a combined method of qualitative and quantitative analysis to evaluate the suitability of cultivated reserved land resources. For example, the slope factor of the terrain is classified according to the standards for soil and water conservation in mountainous areas, with a slope greater than 25° being the critical value for unsuitability for cultivation. Slopes between 0° and 25° are divided into five ranges: 0° to 2.5°, 2.5° to 5°, 5° to 8°, 8° to 15°, and 15° to 25°, and scores are given based on the degree of suitability for cultivation. For potential cultivated land resources where natural conditions temporarily do not meet the criteria for development as cultivated reserved land resources, such plots are included in the temporarily unsuitable category. Natural conditions that do not meet the criteria for development as cultivated reserved land resources include elevation greater than 800 m, gravel content over 35% for particles larger than 2 mm, soil layer thickness less than 50 cm, soil pH not between 5.2 and 9, and soil layer thickness below 50 cm. The corresponding evaluation factors with their respective criteria can be found in Table 4, and the weighted results can be classified according to Table 3.

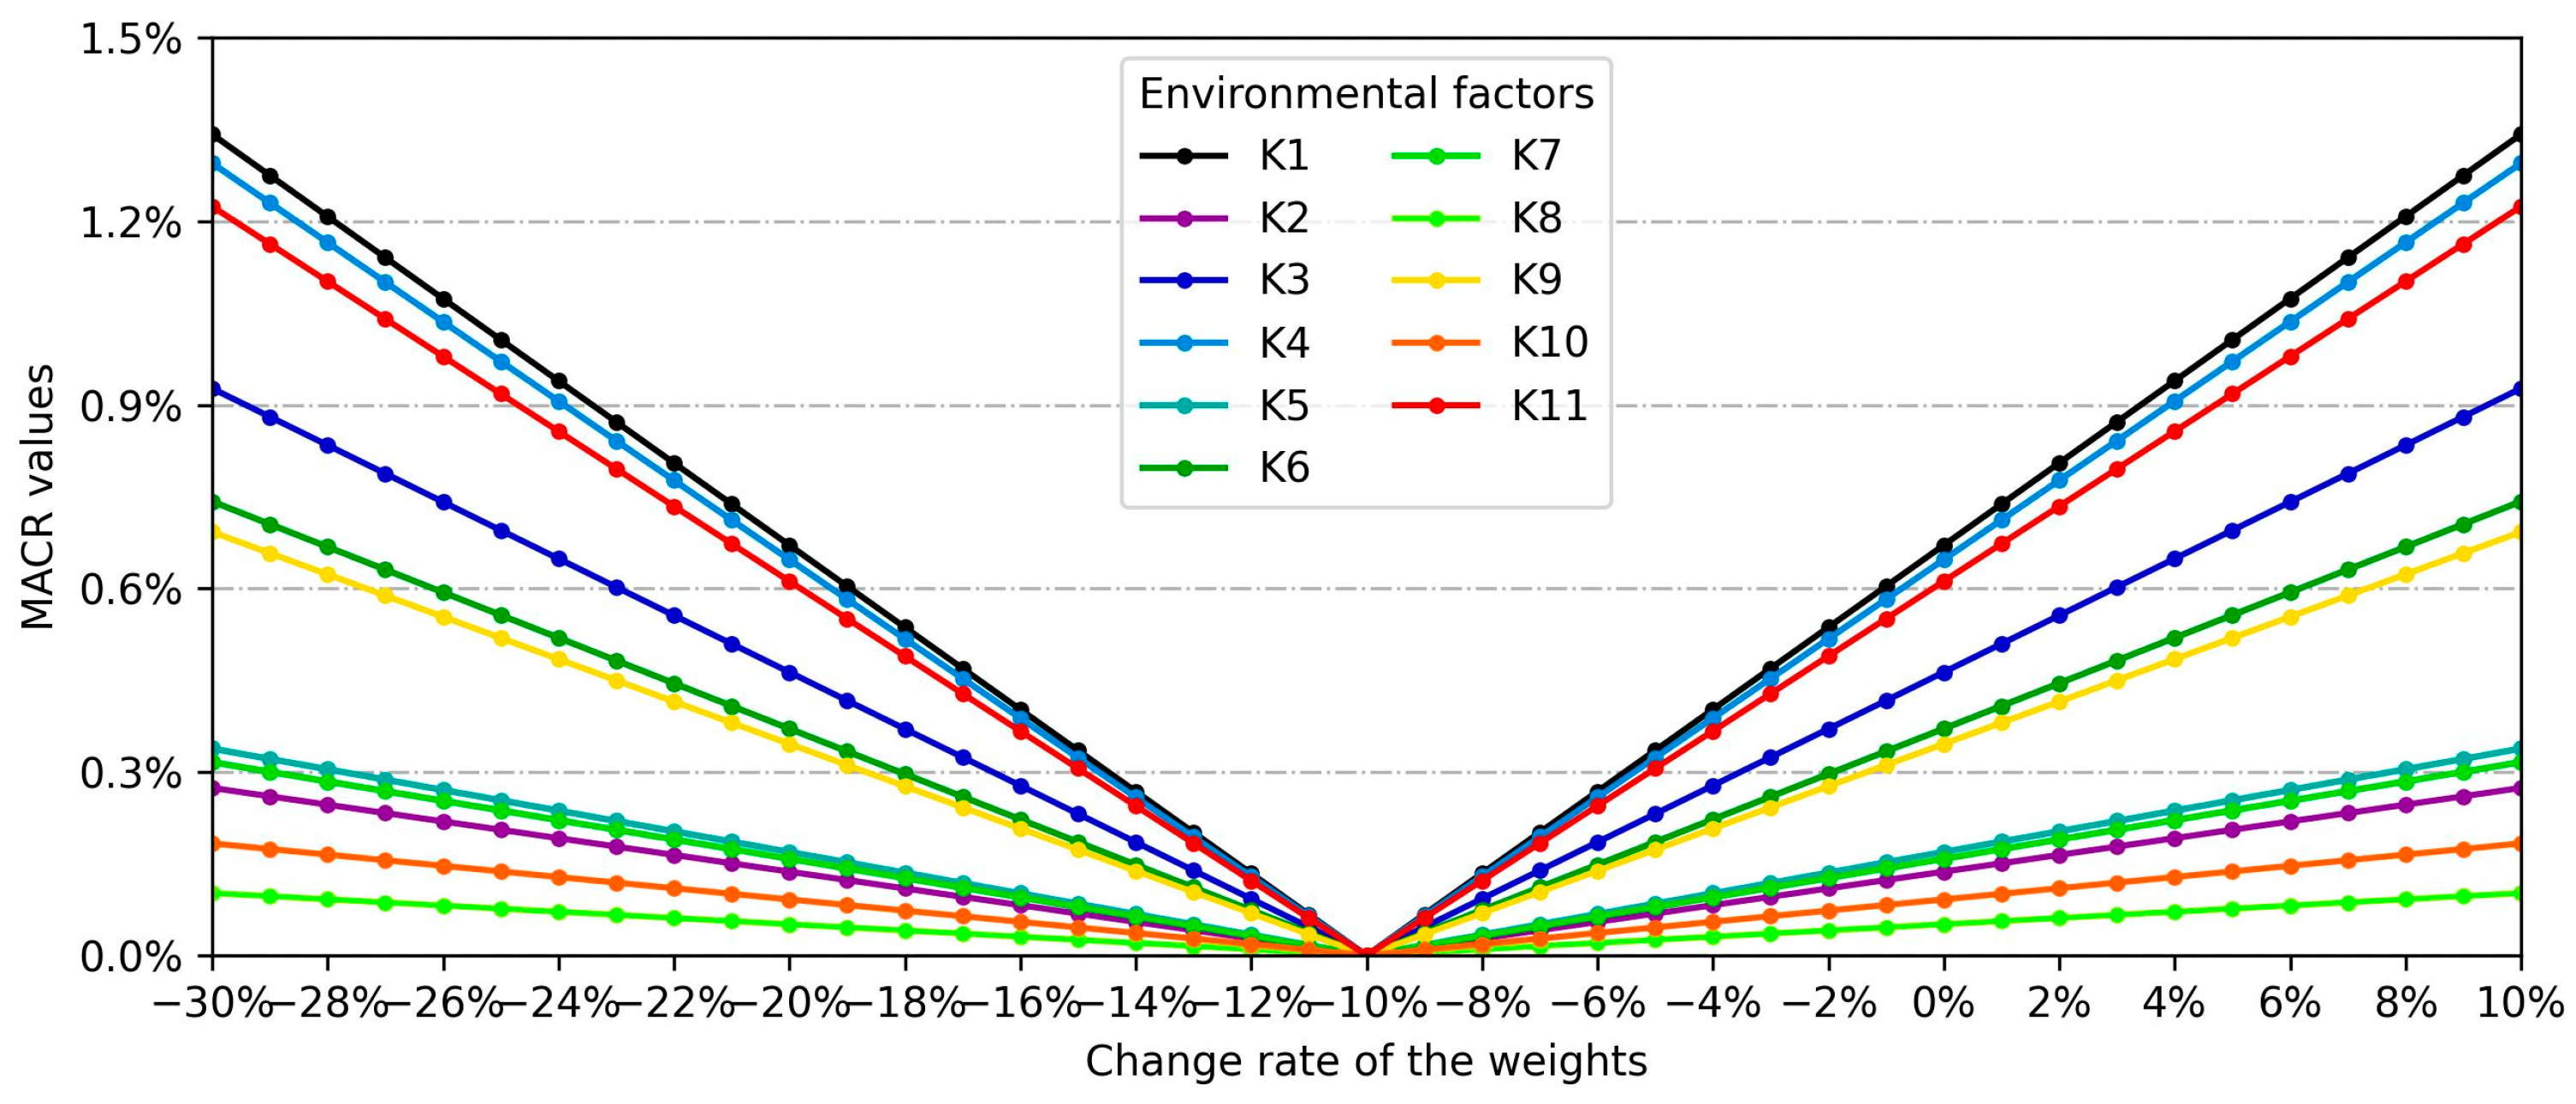
3.2.4. Sensitivity Analysis of the Evaluation Indicators

The One-At-a-Time (OAT) method can be logically simple and effective in testing the sensitivity of evaluation indicator weights, in which the impact of changing the values of each of the chosen factors is evaluated in turn. In practice, the weights calculated by the AHP method are used as the initial weights, and then the weights of the criterion factors are sequentially changed using the OAT method to observe the trend and regularity of their impact on the quality of cultivated land and its spatial pattern changes, to evaluate the impact of uncertainty in the weights of each indicator on the research results [43].
In practice, the OAT method initially establishes the Range of Percentage Change (RPC) for weights, which serves as the boundary for allowable variations in the original weightings of indicators, specified as a percentage. This boundary also represents the comprehensive set of discrete percentage adjustments permissible under the study’s parameters. Furthermore, the Incremental Percentage Change (IPC) is determined, indicating the proportion of weight values that change within this interval. When all indicators are adjusted according to the IPC within the scope of the PRC, the total evaluation score can be calculated after each adjustment. The applied equation is below:
R w j , p c = w j × 1 + p c × x j + i j n w i × 1 w j × 1 + p c 1 w j × x i , R P C min p c R P C max
where R represents the evaluation results, w is the original weight obtained from Table 2, pc is the percentage change rate of the weights, and x is the factor scores, while i and j mean the ith and jth factor referring to the factors.
M A C R w j , p c = k = 1 N 1 N × R k w j , p c R 0 S 0 × 100 %
where MACR (wj, pc) is the mean of the absolute change rate with wj as a change rate, and R0 is the evaluation result when the pc is 0, while other evaluation results under weights change are denoted as R.

4. Results

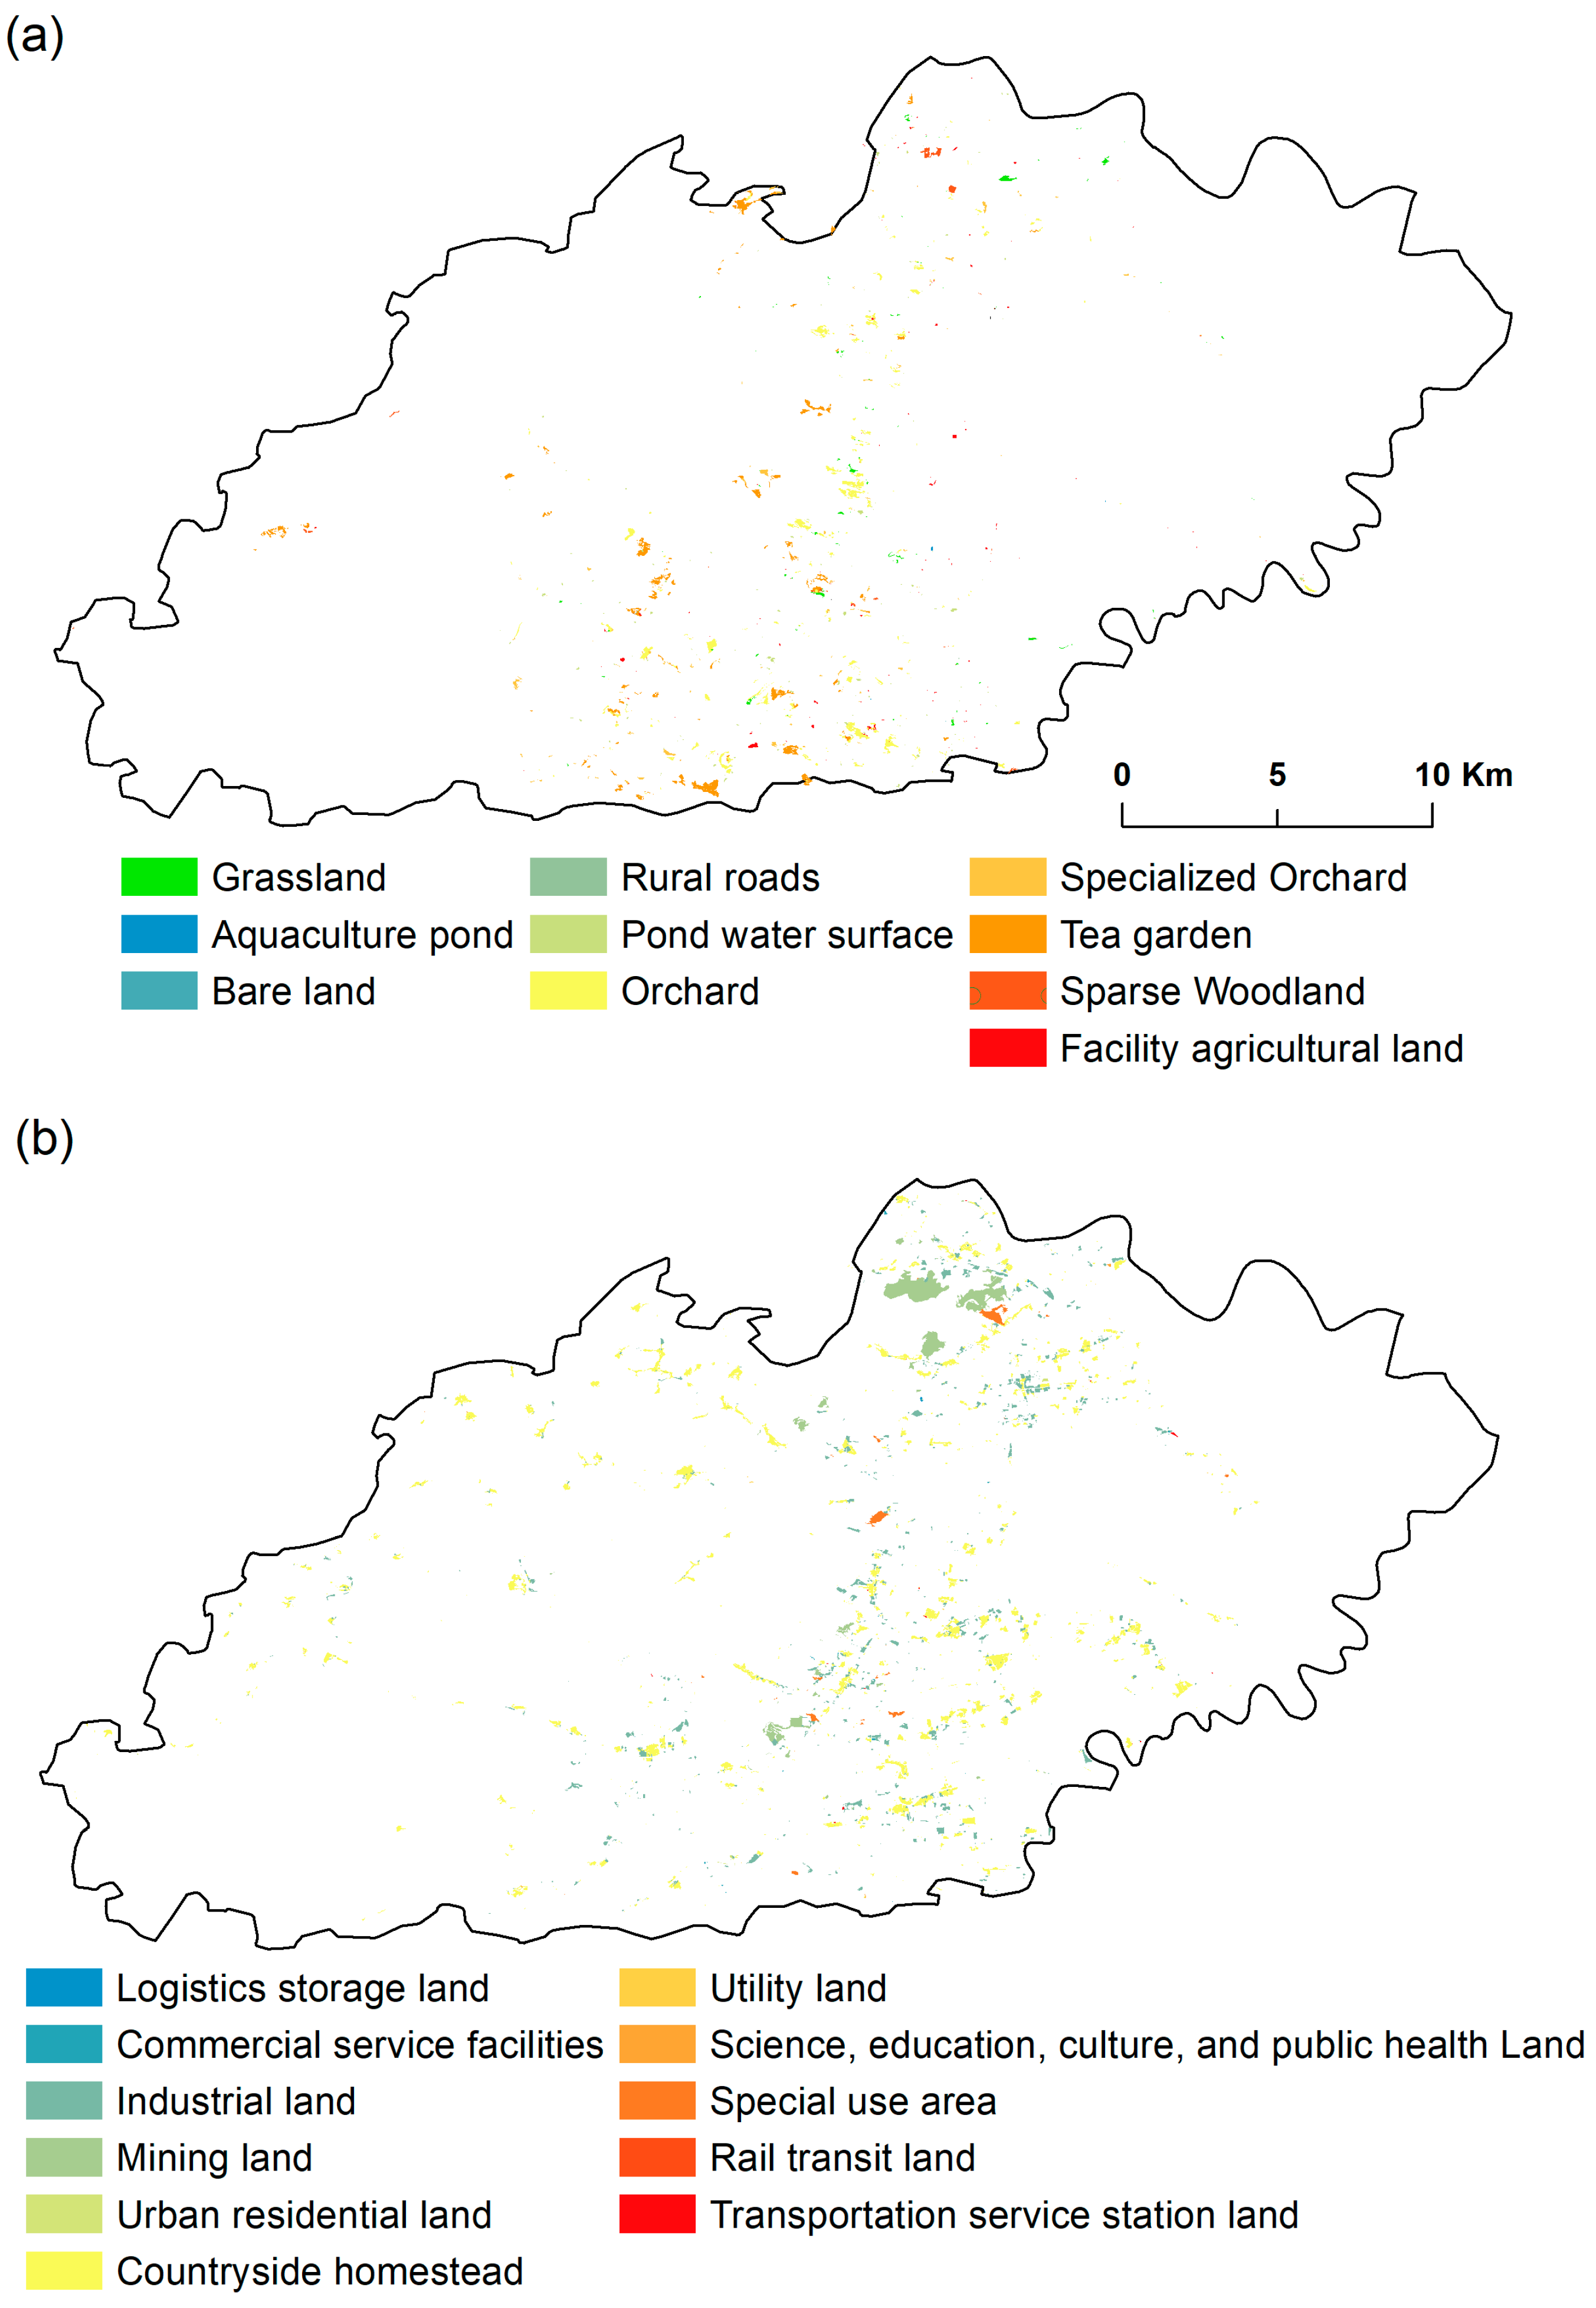
4.1. Identification of Cultivated Reserved Land Resources

As shown in Figure 3a, only 0.71% of the district’s total land area (426.45 ha) has been identified as having general reclamation potential for cultivation within the study area. Orchards are the largest land use within this area, covering 169.40 ha, followed closely by tea gardens at 165.62 ha. Other categories include gardens and ponds, which cover 39.30 ha and 25.31 ha, respectively. These areas represent 39.84%, 38.94%, 9.27%, and 5.96% of the district’s cultivated land reserve resources with general reclamation potential. In contrast, land uses such as grasslands, facility cultivated lands, breeding ponds, rural roads, and barren tracts are much less common, each accounting for no more than 3.02% of the general reclamation potential reserve resources. Conversely, the area designated for potential construction land reclamation is significantly larger, totaling 1378.20 ha, or 2.32% of the district’s total land area, as depicted in Figure 3b. Rural homesteads dominate this category, covering 815.87 ha. Industrial and mining lands are also substantial, with areas of 353.43 ha and 207.67 ha, respectively. These figures represent 59.16%, 25.65%, and 15.14% of the district’s reserves for potential construction land reclamation as of 2022.
Additionally, urban residential areas, transportation infrastructure, educational facilities, cultural institutions, health-related lands, and commercial services facilities are minimally represented, each constituting less than 0.02% of the potential land resource for construction land reclamation.

4.2. Main Influencing Factors of Cultivated Reserved Land Resources

The RUSLE equation analysis for the HD shows a wide range of soil erosion intensity, with the erosion modulus reaching up to 889.32 t/(ha·year) at its highest and as low as 0 t/(ha·year) in other areas, as seen in Figure 4a. The majority of the district experiences erosion levels that generally fall below the threshold for slight erosion, indicating a relatively stable soil condition conducive to various land uses, including agriculture. The district’s terrain, which slopes gently from the southeast toward the northwest and is depicted in Figure 4b, has areas predominantly flat under a 10° slope. This topographical feature, especially notable in the eastern section of the HD, aligns with the district’s agricultural zones. The presence of flat terrains in these agricultural hubs suggests that these areas are less susceptible to erosion, aiding in the preservation of soil quality and stability.
In contrast, the less common areas with slopes ranging from 10° to 25°, and especially those exceeding 25° in the northern and southern parts of the HD, present a different scenario. These steeper areas are more prone to soil erosion due to water runoff, especially if vegetation cover is sparse or soil binding is weak, underscoring the importance of erosion control measures in these regions. The distribution of soil depth across the HD, as shown in Figure 4c, further influences the district’s land-use potential and erosion risk. Soil layers exceeding 100 cm in thickness, primarily located in the central region, offer substantial benefits for agricultural productivity due to higher water retention capacities and greater nutrient availability. The areas with shallower soils, particularly those with less than 85 cm thickness found in the western parts of the HD, may face challenges related to water stress and limited root development, potentially increasing susceptibility to erosion. The soil pH map (Figure 4d) indicates that weakly acidic across most areas, which could affect nutrient solubility and availability. The correlation between soil acidity and elevation suggests that elevation may influence soil formation processes and subsequently its chemical properties [44,45].
In summary, the variations in soil erosion intensity, topography, soil depth, and acidity across the HD highlight the need for differentiated land management approaches tailored to local conditions. Strategies to combat soil erosion might include soil conservation practices in steeper areas and the enhancement of vegetation cover to stabilize the soil. Moreover, leveraging the deep soils for agriculture and adjusting farming practices to accommodate soil pH variations can optimize land use, ensuring sustainable agricultural productivity and environmental preservation in the HD.

4.3. Suitability Analysis of Cultivated Reserved Land Resources in the HD

Upon analyzing the cultivated land suitability in the HD, it is observed that the potential for general reclamation of cultivated reserved land resources is approximately 7546.08 mu (Figure 5a). The distribution of suitability across this area is as follows: high suitability areas comprise 384.12 mu (5.09%), medium suitability areas cover 2464.59 mu (32.66%), low suitability areas extend over 1986.21 mu (26.32%), and temporarily unsuitable areas span 2711.16 mu (35.93%). This analysis reveals that the general reclamation potential in the HD is primarily concentrated in temporarily unsuitable and medium suitability areas, indicating a restricted developable area with a limited potential for expanding cultivated reserved land resources.
Figure 5b presents the evaluation of the potential for construction land reclamation in the HD, with a total area of 1527.50 ha. The land is categorized into different suitability levels: high suitability (3.33%), medium suitability (50.58%), low suitability (26.45%), and temporarily unsuitable (19.65%). Despite the HD’s increased focus on ecological and environmental protection, which has improved the utilization of cultivated land, especially in mountainous and hilly areas, the overall potential for reclamation of reserved cultivated land predominantly falls into the medium and low suitability categories. This highlights the need for soil quality improvements to enhance the feasibility of land reclamation.
After years of development, the HD has nearly exhausted its reserves of flat, fertile, and readily developable land. The areas suitable for supplemental cultivated land rectification are diminishing, with many existing cultivated lands being small-scale and fragmented. This fragmentation poses significant development challenges, increasing the cost and complexity of land development efforts. This situation is very common in areas where economic development has maintained rapid growth for a long time [46]. For future development and utilization of these lands, it is crucial to employ a strategic approach. Emphasis should be placed on the rational use of small and scattered cultivated reserved land resources.

4.4. Sensitivity Analysis of the Evaluation Results

Finally, a series of OAT-based sensitivity analysis simulations was conducted to measure the stability of the above evaluation results. The OAT method is firstly activated by the initial weights derived from the AHP method, and then driven repeatedly by adjusting incrementally weights of the criterion indicators. Consequently, under the setting of the PRC at ±30% and the IPC at ±2%, the sensitivity analysis in this study encompasses a comprehensive 451 calculations (11 × 41), where each run generates an individual MACR value.
Figure 6 summarizes the MACR values for various indicators with different weight settings, which reveal a central symmetrical distribution, pivoting around a weight change rate of 0%. As the magnitude of the weight change rate escalates, the MACR values demonstrate a nearly linear escalation, though the slopes differ among indicators. For the same evaluation factor, the MACR values are consistent when the absolute value of the weight change rate is the same (weight change of ±n%, 0 ≤ n ≤ 30), indicating that the sensitivity of the evaluation results remains the same whether the weight of an indicator is increased or decreased by the same amount. Correspondingly, the indicators with steeper slopes are more sensitive to changes in the suitability evaluation of cultivated land.
The order of sensitivity of the evaluation factors, from most to least sensitive, is as follows: K1 (Slope) > K4 (Soil thickness) > K11 (Land use) > K3 (Soil type) > K6 (Total nitrogen) > K9 (Organic matter) > K5 (pH) > K7 (Total phosphorus) > K2 (Elevation) > K10 (Soil erosion) > K8 (Total potassium). For example, K1 (Slope) shows the highest sensitivity, with a MACR value of 1.3419% when the weight is increased by 30%. Conversely, K8 (Total potassium) displays a MACR value of merely 0.102%.

5. Discussion

In this study, the reserved cultivated land is selected outside the areas delineated by the Three Zones and Three Lines land-use policy [47], assessing areas where government regulations do not strictly prohibit agricultural development. In general, a comprehensive suitability evaluation should consider factors such as climate and socio-economic status, following principles of scientific accuracy, completeness, and practicality to ensure the reliability and usability of the evaluation results [48,49].
Determining the criteria and its sub-criteria is an important stage of land suitability assessment [50], and the availability of local impact factor data needs to be considered to a large extent [51]. Geographically, the HD is situated in a small, urbanized area where topography, soil physicochemical properties, and soil nutrients exhibit significant spatial variation. In contrast, climatic conditions remain relatively uniform, leading to the implicit neglect of climatic factors in our evaluation framework. Also, the study considers the intricate relationship between soil erosion and ecological conditions, including climate, hydrology, vegetation, and soil characteristics. These ecological factors directly or indirectly influence the extent and nature of soil erosion, offering a clear depiction of ecological health through measurable soil erosion metrics. Moreover, as the only factor representing socio-economic society status in our evaluation framework, land use plays the dominant role in synthesizing human activity, economic elements, land policies, and governmental development directives into a comprehensive socio-economic factor, integrating multiple dimensions of urban dynamics [52]. However, it is worth noting that when transferring the evaluation framework to other larger or different areas, it is necessary to adapt the selection strategy appropriately, adding or removing environmental factors to enhance its utility across diverse contexts.
For the five main evaluation categories, the weights of general land suitability evaluation factors in the following order of importance: soil physical and chemical properties (35.2%), topography (29.6%), soil nutrients (19.2%), and ecological conditions and land use, each with an 8% share. It is noteworthy that this hierarchy is significantly influenced by the number of sub-categories nested within each primary category as shown in Table 2. Moreover, the study also implements the sensitivity analysis toward the weights of all factors, demonstrating that the land suitability results are reliable and robust according to the simulated MACR values (Figure 6). It means that the observed near-linear relationships and consistent sensitivities across a spectrum of weight adjustments underscore the method’s dependability and efficacy in yielding stable results [53,54,55]. Accordingly, the sensitivity analysis has revealed that slope, soil depth, land use, and soil type are the most sensitive sub-criteria in the land suitability evaluation, and these findings are largely in line with the previous studies [50,56,57].
Regarding the results, we found that the general cultivated land reclamation potential is primarily limited to orchards and tea gardens. This limitation arises because traditional cultivated land has gradually been transformed into orchards and other cash crops over time due to the long-term urbanization process and the evolution of cultivated land fragmentation in rural development [58,59]. This situation requires strategic prioritization in land-use planning to maximize output from highly suitable areas and improve conditions of less suitable lands through sustainable practices. Given the significant portion of land reserved for potential construction reclamation, there is a clear indication of a shift toward more urban and industrial developments. This shift must be balanced with agricultural expansion to ensure food security and sustainable land use amid rapid urbanization [60,61].
Moreover, soil erosion analysis shows that most of the district experiences low to moderate erosion levels, indicating stable conditions favorable for agriculture, consistent with Zhang and Wang’s findings [58]. Soil conservation practices in steeper areas and enhancing vegetation cover could be beneficial in maintaining and preventing erosion on gentle slopes, whereas for steep slopes (>40%), the effect of topography dominates, and vegetation effects become insignificant [62]. In particular, cultivating plants with deeper and denser root systems can simultaneously improve soil structure and its steady-state retention of carbon, water, and nutrients, as well as sustainable yields [63]. The district is currently confronted with the challenge of dwindling reserves of flat and fertile land, alongside the fragmentation of existing cultivated land [59]. Hence, the strategies should emphasize judicious utilization of dispersed and small land reserves, such as supporting smallholder farmers and ensuring that land reclamation and industrial expansion do not disenfranchise rural populations [64]. To fully capitalize on these lands, constrained by current natural conditions, it is imperative to implement effective measures to enhance their quality [65,66], including bolstering the construction of farmland water conservancy and water collection facilities, which will improve the quality of cultivated reserved land resources, expand their effective area, and mitigate risks such as reduced grain production due to poor soil quality or water scarcity following recultivation.

6. Conclusions

In this study, a robust and straightforward evaluation framework for land suitability evaluation has been established by integrating AHP and sensitivity analysis in a small and highly urbanized area. Particularly, the newly updated CTNLS survey information enables the research to undertake reliable analysis and present the results in vector format. The main conclusions of this paper are as follows:
(1)
The area identified for general reclamation of potential cultivated land reserves is 63.78 ha, which is only 0.71% of the total district area. Orchards and tea gardens make up most of this area, nearly 80% of the potential cultivated land resources. In contrast, the area with potential for conversion from construction land to cultivated land is larger, at 206.82 ha, constituting 2.32% of the district’s total area, and is primarily composed of rural homesteads, and industrial and mining lands.
(2)
The soil erosion analysis shows that most areas within the district have low-to-moderate erosion levels, with zones of slight erosion that are generally stable for agricultural activities. However, variations in soil depth, particularly the deeper soils in the central area, and the predominantly weakly acidic soil pH, do influence agricultural productivity. These factors call for specific land management approaches to enhance land-use efficiency and support sustainable development.
(3)
The HD faces challenges of diminishing reserves of developable land, fragmentation of existing cultivated lands, and the need for soil quality improvements. Strategic measures, including the rational use of small and scattered land resources and enhancements in soil and water conservation, need to be implemented in time for sustainable agricultural expansion and environmental protection.

Author Contributions

Conceptualization, J.S., B.Y. and L.C.; methodology, X.W. (Xiaoyi Wang) and L.C.; software, X.W. (Xiaoyi Wang), L.C. and J.S.; validation, X.W. (Xiaoyi Wang), X.W. (Xiaoqing Wang), C.C. and J.G.; formal analysis, X.W. (Xiaoqing Wang), M.L., L.C. and S.Z. (Sidong Zeng); investigation, M.L., J.G. and J.S.; resources, B.Y., C.C. and S.Z. (Sidong Zeng); data curation, H.L. and J.S.; writing—original draft preparation, X.W. (Xiaoyi Wang) and L.C.; writing—review and editing, J.S., H.L., B.Y. and S.Z. (Sidong Zeng); visualization, L.C., J.S., X.W. (Xiaoqing Wang) and J.G.; supervision, H.L., B.Y., C.C., S.Z. (Shiliang Zhou) and S.Z. (Sidong Zeng); project administration, J.S., B.Y., S.Z. (Shiliang Zhou) and S.Z. (Sidong Zeng); funding acquisition, J.S., B.Y. and S.Z. (Sidong Zeng). All authors have read and agreed to the published version of the manuscript.

Funding

This research was funded by the Youth Innovation Promotion Association, CAS (2021385), National Natural Science Foundation of China, grant number 42401093, 42101397, and 42071033, and the Key Laboratory of Transportation Industry for Inland Waterway Regulation Technology of the Ministry of Transport, grant number KLIWRE2023A01.

Data Availability Statement

Readers could contact the corresponding author to request source data (with permission from all authors).

Acknowledgments

We thank to Ningbo Institute of Surveying, Mapping, and Remote Sensing, Ningbo for supporting the CTNLS data in this article.

Conflicts of Interest

The authors declare no conflicts of interest.

References

  1. Molotoks, A.; Smith, P.; Dawson, T.P. Impacts of land use, population, and climate change on global food security. Food Energy Secur. 2021, 10, e261. [Google Scholar] [CrossRef]
  2. Smith, G.R.; Archer, R. Climate, population, food security: Adapting and evolving in times of global change. Int. J. Sustain. Dev. World Ecol. 2020, 27, 419–423. [Google Scholar] [CrossRef]
  3. Miao, Y.; Liu, J.; Wang, R.Y. Occupation of Cultivated Land for Urban–Rural Expansion in China: Evidence from National Land Survey 1996–2006. Land 2021, 10, 1378. [Google Scholar] [CrossRef]
  4. Zhou, B.-B.; Lv, L. Understanding the dynamics of farmland loss in a rapidly urbanizing region: A problem-driven, diagnostic approach to landscape sustainability. Landsc. Ecol. 2020, 35, 2471–2486. [Google Scholar] [CrossRef]
  5. Xue, Y.; Mao, K.; Weeks, N.; Xiao, J. Rural Reform in Contemporary China: Development, Efficiency, and Fairness. J. Contemp. China 2021, 30, 266–282. [Google Scholar] [CrossRef]
  6. Chen, X.; Yu, L.; Du, Z.; Liu, Z.; Qi, Y.; Liu, T.; Gong, P. Toward sustainable land use in China: A perspective on China’s national land surveys. Land Use Policy 2022, 123, 106428. [Google Scholar] [CrossRef]
  7. Wang, J.; He, T.; Lin, Y. Changes in ecological, agricultural, and urban land space in 1984–2012 in China: Land policies and regional social-economical drivers. Habitat Int. 2018, 71, 1–13. [Google Scholar] [CrossRef]
  8. Zhou, Y.; Zhong, Z.; Cheng, G. Cultivated land loss and construction land expansion in China: Evidence from national land surveys in 1996, 2009 and 2019. Land Use Policy 2023, 125, 106496. [Google Scholar] [CrossRef]
  9. Office of the Third National Land Survey; Leading Group of the State Council; Ministry of Natural Resources; National Bureau of Statistics. The Third National Land Survey Main Data Bulletin. People’s Daily, 27 August 2021; p. 017.
  10. Liu, L.; Liu, Z.; Gong, J.; Wang, L.; Hu, Y. Quantifying the amount, heterogeneity, and pattern of farmland: Implications for China’s requisition-compensation balance of farmland policy. Land Use Policy 2019, 81, 256–266. [Google Scholar] [CrossRef]
  11. Chen, L.; Zhao, H.; Song, G.; Liu, Y. Optimization of cultivated land pattern for achieving cultivated land system security: A case study in Heilongjiang Province, China. Land Use Policy 2021, 108, 105589. [Google Scholar] [CrossRef]
  12. TD/T 1007-2003; Standards of Surveying and Evaluating Reserved Land Resource for Cultivation. Ministry of Natural Resources of the People’s Republic of China: Beijing, China, 2003.
  13. Song, W.; Zhang, H.; Zhao, R.; Wu, K.; Li, X.; Niu, B.; Li, J. Study on cultivated land quality evaluation from the perspective of farmland ecosystems. Ecol. Indic. 2022, 139, 108959. [Google Scholar] [CrossRef]
  14. Yi, L.; Zhang, Z.; Wang, X.; Liu, B.; Zuo, L.; Zhao, X.; Wang, J. Spatial-temporal change of major reserve resources of cultivated land in China in recent 30 years. Trans. Chin. Soc. Agric. Eng. 2013, 29, 1–12. [Google Scholar]
  15. Liu, X.; Cai, Z.; Xu, Y.; Zheng, H.; Wang, K.; Zhang, F. Suitability Evaluation of Cultivated Land Reserved Resources in Arid Areas Based on Regional Water Balance. Water Resour. Manag. 2022, 36, 1463–1479. [Google Scholar] [CrossRef]
  16. Guan, X.; Zhang, F.; Li, L.; Guo, L.; Shao, Z. Suitability evaluation of reserve resources of cultivated land development in Beijing. Trans. Chin. Soc. Agric. Eng. 2010, 26, 304–310. [Google Scholar]
  17. Gao, X.; Wu, K.; Yun, W.; Tang, C.; Xu, S.; Ma, Z. Analysis on county based reserved resource for cultivated land and quality-quantity requisition-compensation balance in planning period. Trans. Chin. Soc. Agric. Eng. 2015, 31, 213–219. [Google Scholar]
  18. Yu Jing, Y.J.; Nie Yan, N.Y.; Zhou Yong, Z.Y.; He YouYong, H.Y. Niche-fitness theory and its application to GIS-based multi-suitability evaluation of cultivated land. Acta Pedol. Sin. 2006, 43, 190–196. [Google Scholar]
  19. Bi, W.; Dang, X.; Ma, H.; Deng, M.; Li, P.; Cao, X.; Shi, P. Evaluation of arable land suitability and potential from the perspective of “Food Crop Production Strategy based on Farmland Management” in northwest China. Trans. Chin. Soc. Agric. Eng. 2021, 37, 235–243. [Google Scholar]
  20. Ghamisi, P.; Rasti, B.; Yokoya, N.; Wang, Q.; Hofle, B.; Bruzzone, L.; Bovolo, F.; Chi, M.; Anders, K.; Gloaguen, R.; et al. Multisource and Multitemporal Data Fusion in Remote Sensing: A Comprehensive Review of the State of the Art. IEEE Geosci. Remote Sens. Mag. 2019, 7, 6–39. [Google Scholar] [CrossRef]
  21. Wei, Y.D.; Ye, X. Urbanization, urban land expansion and environmental change in China. Stoch. Environ. Res. Risk Assess. 2014, 28, 757–765. [Google Scholar] [CrossRef]
  22. Liu, Y.; Lu, F.; Xian, C.; Ouyang, Z. Urban development and resource endowments shape natural resource utilization efficiency in Chinese cities. J. Environ. Sci. 2023, 126, 806–816. [Google Scholar] [CrossRef]
  23. Government, H.D. Economic Aggregate. 2024. Available online: https://www.haishu.gov.cn/col/col1229099913/index.html (accessed on 26 July 2024).
  24. Liu, R.Z.; Borthwick, A.G.L. Measurement and assessment of carrying capacity of the environment in Ningbo, China. J. Environ. Manag. 2011, 92, 2047–2053. [Google Scholar] [CrossRef] [PubMed]
  25. Ningbo Municipal Bureau of Natural Resources and Planning. Ningbo Haishu District People’s Government. 2024. Available online: https://www.haishu.gov.cn/col/col1229100660/index.html (accessed on 16 July 2024).
  26. Mi, S.; Shihong, D. Forty years’ progress and challenges of remote sensing in national land survey. J. Geogr. Inf. Sci. 2022, 24, 597–616. [Google Scholar]
  27. National Earth System Science Data Center of China. National Earth System Science Data Center/WDC for Renewable Resources and Environment. 2024. Available online: http://wdcrre.data.ac.cn/ (accessed on 16 July 2024).
  28. Minasny, B.; McBratney, A.B.; Wadoux, A.M.J.C.; Akoeb, E.N.; Sabrina, T. Precocious 19th century soil carbon science. Geoderma Reg. 2020, 22, e00306. [Google Scholar] [CrossRef]
  29. Datta, P.S.; Schack-Kirchner, H. Erosion relevant topographical parameters derived from different DEMs—A comparative study from the Indian Lesser Himalayas. Remote Sens. 2010, 2, 1941–1961. [Google Scholar] [CrossRef]
  30. Jian, Z.; Sun, Y.; Wang, F.; Zhou, C.; Pan, F.; Meng, W.; Sui, M. Soil conservation ecosystem service supply-demand and multi scenario simulation in the Loess Plateau, China. Glob. Ecol. Conserv. 2024, 49, e02796. [Google Scholar] [CrossRef]
  31. Zhang, W.; Fu, J. Rainfall erosivity estimation under different rainfall amount. Resour. Sci. 2003, 25, 35–41. [Google Scholar]
  32. Li, P.; Chen, J.; Zhao, G.; Holden, J.; Liu, B.; Chan, F.K.S.; Hu, J.; Wu, P.; Mu, X. Determining the drivers and rates of soil erosion on the Loess Plateau since 1901. Sci. Total Environ. 2022, 823, 153674. [Google Scholar] [CrossRef]
  33. Panagos, P.; Borrelli, P.; Meusburger, K.; Alewell, C.; Lugato, E.; Montanarella, L. Estimating the soil erosion cover-management factor at the European scale. Land Use Policy 2015, 48, 38–50. [Google Scholar] [CrossRef]
  34. Ayalew, D.A.; Deumlich, D.; Šarapatka, B.; Doktor, D. Quantifying the sensitivity of NDVI-based C factor estimation and potential soil erosion prediction using Spaceborne earth observation data. Remote Sens. 2020, 12, 1136. [Google Scholar] [CrossRef]
  35. Wang, B.; Zheng, F.; Römkens, M.J.M.; Darboux, F. Soil erodibility for water erosion: A perspective and Chinese experiences. Geomorphology 2013, 187, 1–10. [Google Scholar] [CrossRef]
  36. Zhang, K.L.; Shu, A.P.; Xu, X.L.; Yang, Q.K.; Yu, B. Soil erodibility and its estimation for agricultural soils in China. J. Arid Environ. 2008, 72, 1002–1011. [Google Scholar] [CrossRef]
  37. Kumar, M.; Sahu, A.P.; Sahoo, N.; Dash, S.S.; Raul, S.K.; Panigrahi, B. Global-scale application of the RUSLE model: A comprehensive review. Hydrol. Sci. J. 2022, 67, 806–830. [Google Scholar] [CrossRef]
  38. General Office of Ministry of Agriculture and Rural Affairs of China. Technical Specification for High Standard Farmland Construction in Dry Land (Trial). 2024. Available online: http://www.moa.gov.cn/nybgb/2023/202311/202311/t20231122_6441064.htm (accessed on 4 September 2024).
  39. Zhang, F.; Shu, H.; Yan, B.; Wu, X.; Lan, H.; Peng, J. Characteristic analysis and potential hazard assessment of reclaimed mountainous areas in Lanzhou, China. CATENA 2023, 221, 106771. [Google Scholar] [CrossRef]
  40. Yu, H.; Zahidi, I. Spatial and temporal variation of vegetation cover in the main mining area of Qibaoshan Town, China: Potential impacts from mining damage, solid waste discharge and land reclamation. Sci. Total Environ. 2023, 859, 160392. [Google Scholar] [CrossRef]
  41. Saaty, T.L. A scaling method for priorities in hierarchical structures. J. Math. Psychol. 1977, 15, 234–281. [Google Scholar] [CrossRef]
  42. Xiao, L.; Yang, X.; Chen, S.; Chai, H. Suitability assessment of reserve cultivated land resources south of the Yangtze River. Resour. Sci. 2015, 37, 2030–2038. [Google Scholar]
  43. Hou, X.; Liu, J.; Zhang, D.; Zhao, M.; Xia, C. Impact of urbanization on the eco-efficiency of cultivated land utilization: A case study on the Yangtze River Economic Belt, China. J. Clean. Prod. 2019, 238, 117916. [Google Scholar] [CrossRef]
  44. Makungwe, M.; Chabala, L.M.; Chishala, B.H.; Lark, R.M. Performance of linear mixed models and random forests for spatial prediction of soil pH. Geoderma 2021, 397, 115079. [Google Scholar] [CrossRef]
  45. Tian, Q.; Jiang, Y.; Tang, Y.; Wu, Y.; Tang, Z.; Liu, F. Soil pH and organic carbon properties drive soil bacterial communities in surface and deep layers along an elevational gradient. Front. Microbiol. 2021, 12, 646124. [Google Scholar] [CrossRef]
  46. Ren, X. Governing the Urban in China and India: Land Grabs, Slum Clearance, and the War on Air Pollution; Princeton University Press: Princeton, NJ, USA, 2020; Volume 8. [Google Scholar]
  47. Urban Planning Society of China. Three Zones and Three Lines. 2024. Available online: https://en.planning.org.cn/upsc/view?id=1134 (accessed on 4 September 2024).
  48. Gigović, L.; Pamučar, D.; Lukić, D.; Marković, S. GIS-Fuzzy DEMATEL MCDA model for the evaluation of the sites for ecotourism development: A case study of “Dunavski ključ” region, Serbia. Land Use Policy 2016, 58, 348–365. [Google Scholar] [CrossRef]
  49. Modica, G.; Pollino, M.; Lanucara, S.; La Porta, L.; Pellicone, G.; Di Fazio, S.; Fichera, C.R. Land Suitability Evaluation for Agro-forestry: Definition of a Web-Based Multi-Criteria Spatial Decision Support System (MC-SDSS): Preliminary Results. In Proceedings of the Computational Science and Its Applications—ICCSA 2016, Beijing, China, 4–7 July 2016; pp. 399–413. [Google Scholar]
  50. Xue, L.; Cao, P.; Xu, D.; Guo, Y.; Wang, Q.; Zheng, X.; Han, R.; You, A. Agricultural land suitability analysis for an integrated rice–crayfish culture using a fuzzy AHP and GIS in central China. Ecol. Indic. 2023, 148, 109837. [Google Scholar] [CrossRef]
  51. Kazemi, H.; Akinci, H. A land use suitability model for rainfed farming by Multi-criteria Decision-making Analysis (MCDA) and Geographic Information System (GIS). Ecol. Eng. 2018, 116, 1–6. [Google Scholar] [CrossRef]
  52. Hoque, I.; Rohatgi, S. Identification of Potential Urban Residential Area by Integrating AHP and WCL in RS and GIS Environment: A Case Study of Siliguri Municipal Corporation and Its Buffer of 7 km, West Bengal. J. Indian Soc. Remote Sens. 2022, 50, 1437–1456. [Google Scholar] [CrossRef]
  53. Chen, Y.; Yu, J.; Khan, S. Spatial sensitivity analysis of multi-criteria weights in GIS-based land suitability evaluation. Environ. Model. Softw. 2010, 25, 1582–1591. [Google Scholar] [CrossRef]
  54. Zhang, Y.; Gao, Y.; Zhang, Y.; Liang, Z.; Zhang, Z.; Zhao, Y.; Li, P. Assessment of agricultural water resources carrying capacity and analysis of its spatio-temporal variation in Henan Province, China. J. Clean. Prod. 2023, 403, 136869. [Google Scholar] [CrossRef]
  55. Xie, Z.; Gao, X.; Feng, C.; He, J. Study on the evaluation system of urban low carbon communities in Guangdong province. Ecol. Indic. 2017, 74, 500–515. [Google Scholar] [CrossRef]
  56. Chen, J. GIS-based multi-criteria analysis for land use suitability assessment in City of Regina. Environ. Syst. Res. 2014, 3, 13. [Google Scholar] [CrossRef]
  57. Danvi, A.; Jütten, T.; Giertz, S.; Zwart, S.J.; Diekkrüger, B. A spatially explicit approach to assess the suitability for rice cultivation in an inland valley in central Benin. Agric. Water Manag. 2016, 177, 95–106. [Google Scholar] [CrossRef]
  58. Zhang, C.; Wang, X.; Liu, Y. Changes in quantity, quality, and pattern of farmland in a rapidly developing region of China: A case study of the Ningbo region. Landsc. Ecol. Eng. 2019, 15, 323–336. [Google Scholar] [CrossRef]
  59. Liu, J.; Jin, X.; Xu, W.; Zhou, Y. Evolution of cultivated land fragmentation and its driving mechanism in rural development: A case study of Jiangsu Province. J. Rural Stud. 2022, 91, 58–72. [Google Scholar] [CrossRef]
  60. Liu, Y.; Zhou, Y. Reflections on China’s food security and land use policy under rapid urbanization. Land Use Policy 2021, 109, 105699. [Google Scholar] [CrossRef]
  61. Zhu, Z.; Chan, F.K.S.; Li, G.; Xu, M.; Feng, M.; Zhu, Y.-G. Implementing urban agriculture as nature-based solutions in China: Challenges and global lessons. Soil Environ. Health 2024, 2, 100063. [Google Scholar] [CrossRef]
  62. Koulouri, M.; Giourga, C. Land abandonment and slope gradient as key factors of soil erosion in Mediterranean terraced lands. Catena 2007, 69, 274–281. [Google Scholar] [CrossRef]
  63. Kell, D.B. Breeding crop plants with deep roots: Their role in sustainable carbon, nutrient and water sequestration. Ann. Bot. 2011, 108, 407–418. [Google Scholar] [CrossRef] [PubMed]
  64. Donaldson, J.A.; Zhang, F.Q. Rural China in transition: Changes and transformations in China’s agriculture and rural sector. Contemp. Chin. Political Econ. Strateg. Relat. Int. J. 2015, 1, 51. [Google Scholar]
  65. Lei, J. Reforming the natural resource auditing system from the ecological civilization perspective. Chin. J. Popul. Resour. 2020, 18, 87–96. [Google Scholar] [CrossRef]
  66. Gold, M.; Binder, S.; Nolte, C. Expanding the coverage and accuracy of parcel-level land value estimates. PLoS ONE 2023, 18, e0291182. [Google Scholar] [CrossRef]
Figure 1. (a,b) location map of the study area, (c) elevation map of the Haishu district, and (d) class distribution map of the cultivated land in 2022.
Land 13 01444 g001
Figure 2. Flowchart of the cultivated reserved land resources extraction, subplots (a,b) illustrate the steps for general potential cultivated land reclamation, and constructed land reclamation potential, respectively.
Land 13 01444 g002
Figure 3. Spatial classification distribution map of (a) general reclaimable cultivated land and (b) construction land reclaimable cultivated land resources.
Land 13 01444 g003
Figure 4. Spatial distribution maps of the soil attributions showing (a) soil erosion t/(ha·year), (b) slope (°), (c) soil layer thickness (cm), and (d) soil pH (°).
Land 13 01444 g004
Figure 5. Spatial distribution of potential of general cultivated land reclamation (a) and construction land reclamation (b).
Land 13 01444 g005
Figure 6. MACR values for the land suitability under different simulations.
Land 13 01444 g006
Table 1. The information of the Third National Land Survey of China.
ItemsContent
Initial time frames8 October 2017–31 December 2019
InvestmentCNY 13.256 billion (planned investment)
Coordinate systems of the land survey databaseGeodetic coordinate system: CGCS 2000 (EPSG:4490).
Projected coordinate system: Gauss–Kruger coordinate system.
Land-use (LU)
classification system
As defined in the National Standard of Land Use Status Classification [25], LU is organized into a two-tiered
hierarchy comprising 12 main categories and 53 subcategories.
Land surveying methodIn addition to the parcel-by-parcel field survey of the land-use type and area, a cell phone with satellite positioning and navigation function is also used to take photos to verify the national and provincial pre-judged changed parcels.
Core survey
technologies
In addition to the 3S integration technique, China has further adopted innovative technologies such as mobile Internet, cloud computing, and drones, and established the “Internet plus investigation” mechanism.
Spatial resolutions of the remote sensing imageryLess than or equal to 1 m (1:5000).
China’s domestic satellite data acquired by BJ-2 ZY-3, and GF-2 accounts for more than 90% of the used satellite data.
Scales of the produced land-use
status maps
Urban areas: ≥1:2000
Rural areas: ≥1:5000
The minimum size of the parcels shown on the maps or the actual parcel sizeTerminology: minimum actual parcel size (MinAP), unit: m2:
Cultivated land with utility and construction land: 200 m2
Cultivated land without utility: 400 m2
Other land-use and land-cover changes: 600 m2
All parcels are drawn as polygons.
OutcomesThe third national land survey database.
15 types of summary tables:
Maintained tables: the area summary table of the land use, the area summary table of cultivated lands with different slope gradients, and the statistical table of the information related to the land survey.
Added tables: the area summary table of industrial and mining land in urban and rural areas, the statistical table of specific surveys, etc.
Deleted tables: the area summary table of the land uses in rural areas.
Sourced by the Ningbo Institute of Surveying, Mapping, and Remote Sensing, Ningbo.
Table 2. Data sources and format.
NameFormat
Haishu District DEM Data Raster
(30 m × 30 m)
China High-Resolution National Soil Information Grid Basic Attributes Dataset 90 m Soil Bulk Density (2010–2018) Raster
(90 m × 90 m)
China High-Resolution National Soil Information Grid Basic Attributes Dataset 90 m Soil pH (2010–2018)
China High-Resolution National Soil Information Grid Basic Attributes Dataset 90 m Soil Thickness (2010–2018)
China High-Resolution National Soil Information Grid Basic Attributes Dataset 90 m Soil Total Nitrogen (2010–2018)
China High-Resolution National Soil Information Grid Basic Attributes Dataset 90 m Soil Total Phosphorus (2010–2018)
China High-Resolution National Soil Information Grid Basic Attributes Dataset 90 m Soil Total Potassium (2010–2018)
China High-Resolution National Soil Information Grid Basic Attributes Dataset 90 m Soil Organic Carbon (2010–2018)
China High-Resolution National Soil Information Grid Basic Attributes Dataset 90 m Soil Gravel Content > 2 mm (2010–2018)
China 1 km Soil Sand Content Data Raster
(1 km × 1 km)
China 1 km Soil Clay Content Data
China 2 km Soil Silt Content Data
China 1 km Resolution Monthly NDVI Dataset
China 30 m Resolution Soil Erodibility Factor Dataset Raster
(30 m × 30 m)
Table 3. The comprehensive classified suitability criteria.
ItemsTemporal UnsuitableLow SuitabilityMedium SuitabilityHigh Suitability
Score (S)<7070~8080~9090~100
Table 4. Suitability evaluation factor weights, scores, and grading indicators for cultivated reserved land resources with general reclamation potential in the HD.
ItemsVariablesClassification Threshold Criteria and the Corresponding ScoresWeights
1009080706050
TopographySlope (°)
(K1)
0–2.52.5–5/5–88–1515–250.176
Elevation (m)
(K2)
/0–100100–200200–500500–800/0.12
Soil physicochemical propertiesSoil type
(K3)
Loam, silty loam/Sandy loam, clay loam, sandy clay loam/Silty clay, loam clayClay, heavy clay, sand, sandy clay0.12
Soil thickness (cm)
(K4)
>80/65–80/50–65/0.16
pH
(K5)
/6–7/7–8/8–90.072
Soil nutrientsTotal nitrogen (%)
(K6)
>0.40.2–0.40.15–0.20.1–0.150.07–0.1<0.070.048
Total phosphorus (%) (K7)>0.10.08–0.10.06–0.080.04–0.060.02–0.04<0.020.032
Total Potassium (%) (K8)>2.52–2.51.5–21–1.50.5–1<0.50.032
Organic matter (%) (K9)/21.5–2.01.0–1.50.6–1.0<0.60.08
Ecological conditionsSoil erosion
(K10)
/Slight/Mild/Moderate0.08
Land use/(K11)Mining land/Utility landLogistics warehousing landRural homestead, Industrial land, Traffic service landCommercial service Industry facility land, Urban and rural residential land, Rail transit land, Special land, Science, education, culture, and health land0.08
Bare landGrasslandFacility cultivated landOthersOrchardPond water surfaces, tea gardens, rural roads, breeding ponds
Disclaimer/Publisher’s Note: The statements, opinions and data contained in all publications are solely those of the individual author(s) and contributor(s) and not of MDPI and/or the editor(s). MDPI and/or the editor(s) disclaim responsibility for any injury to people or property resulting from any ideas, methods, instructions or products referred to in the content.

