Abstract
Biophilic design introduces a variety of sensory elements into the built environment, incorporating a natural experience into daily life. From the environmental psychology aspect, the effects of multisensory stimulus are not a result of simply adding the effects of uni-sensory stimuli, and the interactive effects among sensory approaches need to be considered. With the demand for promoting health and well-being, increasing numbers of studies began to investigate sensory systems other than just the visual cue of the biophilic design. This review focuses on the multisensory effect of biophilic design on human psychological and physiological responses as well as cognitive function. We summarized empirical evidence of the interactions between two and three sensory modalities from existing research. In addition, we systematically summarized the key methods and technologies used in experimental studies that explore the health benefits of biophilic design in terms of study types and population, environmental exposure simulation, health benefit measurement, and experimental process design. We finally identified some knowledge gaps in and future directions for biophilic design studies from the multisensory interaction perspective. The experimental design of quantifying the effects of multisensory interaction and its lasting effects are the focus of future research.
1. Introduction
Biophilia is the term popularized by Harvard biologist Edward O. Wilson to describe human’s innate connections with nature [1]. Therefore, biophilic design particularly emphasizes the connection between humans and nature and enhances the comfort and well-being of the built environment by incorporating natural elements and processes. For example, the visual connection with nature could lower blood pressure and heart rate [2] and positively impact attitude and overall happiness [3]. In addition, the non-visual connection with nature could reduce systolic blood pressure and stress hormones [4,5] and result in perceived improvements in mental health and tranquility [6,7]. Yale social ecologist Stephen Kellert proposed the three-dimensional framework for biophilic design, suggesting that “human satisfaction and wellbeing continue to be reliant on perceiving and responding to sensory variability, especially when this occurs in structured and organized ways within the built environment” [8]. Biophilic design becomes a reasonable approach to encourage the multi-sensorial experience of contact with nature in the built environment, which could provide positive effects on human health and well-being.
The perception of the built environment by individuals is inherently multisensory, with the five common senses of the human body being auditory, olfactory, taste, visual, and haptic. However, in studies related to the current built environment, taste is an abstract aspect that is not easily integrated into the environment. Meanwhile, thermal sensation as a passive tactile contact is a key element of haptics, which could seriously affect people’s comfort and perception levels in the built environment, therefore many experiments have used thermal sensation as an important indicator. Our review focuses particularly on the four visual, auditory, thermal, and olfactory sensory factors, which are the most influential in built environments1.
Previous studies have thoroughly examined the independent effects of single-sensory stimulation on human comfort, physiological and psychological responses, and cognitive function. For example, the visual connection with nature could help with mental stress recovery [9] and improve cognitive performance [10]. A view of greenery from windows has been shown in several studies to have restorative effects on people’s well-being. Specifically, a landmark study from Ulrich found that patients who had a green view in their wards recovered faster and required less pain medication than those who had a brick wall view [11]. Li and Sullivan also proved that a classroom view of green landscapes leads to better performance in attention and increased recovery [12]. In addition, types of view are crucial for restoration. Felsten pointed out that a view containing water and a more dramatic nature scene is more restorative [13]. Besides the view, daylight is another visual clue of nature that has multiple health advantages [14,15]. For instance, Kullar and Lindsten found that working in a classroom without daylight may disturb the hormone pattern and negatively influence students’ academic performance [16]. Zadeh et al. also found that daylight can positively affect circadian rhythms and reduce morning sleepiness [17]. Research on the soundscape in the built environment is always related to the negative effects of noise. For example, studies have shown that the presence of urban man-made noise can affect human memory [18], attenuate attention [19], and increase depressive mood [20]. Meanwhile, natural sound as a positive-effect soundscape can be beneficial to human stress recovery and memory performance. Benfield et al. found that listening to pure natural sound can improve people’s memory ability and a 3 min exposure to natural sound following an unsettling video can lead to greater mood recovery [21]. As a noise-masking tool, natural sound can improve speech privacy while increasing cognitive performance, concentration, and worker satisfaction [22]. Thermal comfort in different climate zones has been well studied (Thermal Comfort Database II) [23], including different thermal sensations on different body parts [24,25,26], physiological models for describing thermal comfort level [27,28,29], and personal comfort devices for satisfying personal thermal needs [30]. A noticeable change in research topics is that studying the undesirable thermal environment has shifted towards studying the desirable quality of air movement and personal comfort control systems [30,31]. Researchers proposed that comfort standards should rely on dynamic and spatially variable indoor climates for comfort evaluation. The concept of alliesthesia—the physiological basis for thermal delight proposed by De Dear—supports the transformation from neutrality to delight [32], which also has analogies to other senses as well. Olfactory atmospheres in the built environment were shown to have a significant influence on our health and well-being [33]. Sick-building syndrome (SBS) is an office condition defined by the World Health Organization in 1979 and describes the illness caused by air pollution in the built environment. The symptoms include headache, dizziness, nausea, eye, nose/throat irritation, dry cough, and even personality changes. Many of the outbreaks of SBS that have been reported over the last half-century were linked to an unfamiliar and unpleasant smell in the poorly ventilated environment [34,35]. To alleviate SBS symptoms, researchers have demonstrated that both increased ventilation rates and reduced air pollution can exert a significant influence on subjective health and well-being [36]. Meanwhile, undesirable and negatively valenced malodors tend to be associated with negative outcomes on the health, well-being, and mood of those who are exposed to them. Meanwhile, it is important to note that pleasant ambient scents can also be used to help improve our mood and well-being [37]. More recent studies find that short-term exposure to pleasant ambient fragrances, such as grapefruit odor [38], can impact people’s attention, anxiety, and mood, with different effect sizes on genders. In terms of the office setting, many researchers have argued that lavender can sometimes be used to enhance productivity by reducing stress [39,40]. These findings indicated that we need to reduce air pollution and increase positive scent stimulus at the same time to promote health and well-being.
Despite this extensive body of work, much of the research remains siloed, with studies often focusing on single-sensory approaches. At the same time, since vision plays a dominant role in our perception [41], other sensory modalities, such as acoustic, olfactory, and thermal senses, are mostly neglected in the design process. For example, when we introduce water features into the indoor environment, not only does the floating water make people relax visually and cool thermally, but also the water sound can mask high-frequency sound and create a relatively quiet space [8]. Therefore, integrating multisensory design can promote the occupants’ well-being. For instance, a recent study conducted in a living lab found that biophilic interventions have the most potential to positively mitigate the experience of stressors. Participants felt less stressed in each of the biophilic conditions, especially in the multisensory intervention [42]. However, the effects of multisensory stimuli are not a result of simply adding the effects of uni-sensory stimuli together. Research on multisensory interactions has increased over the last few decades in the field of cognitive neuroscience and neurophysiology. However, the effect of the built environment on human health and comfort through a multisensory approach has not been fully investigated. Only a few studies analyzed different combinations of environmental senses, with less than 9% percent of studies considering visual, acoustical, and thermal senses together [43]. Among existing multisensory studies, most have focused on reducing the negative impacts of different sensory stimuli [44]. However, a higher level of experiential delight is needed to achieve the goal of well-being, we should get beyond mere ‘comfort’ and design for these higher-level experiences [45]. Specifically, sound privacy, thermal discomfort, low lighting level, and poor indoor air quality (IAQ) have been identified as important factors contributing to an unhealthy environment. Research on beneficial environmental parameters, including natural view, natural sound, scent, aesthetics, security, and ergonomic design factors is still limited.
In summary, research on single senses is now relatively complete, but research on more than two sensory approaches is still limited, this review aims to address this gap by summarizing existing scientific evidence on the perception and response to biophilic environments through various sensory approaches. Additionally, it seeks to identify gaps in the current research and propose directions for future studies, ultimately advocating for a more integrated multisensory approach to design that prioritizes human health and well-being.
2. Methods
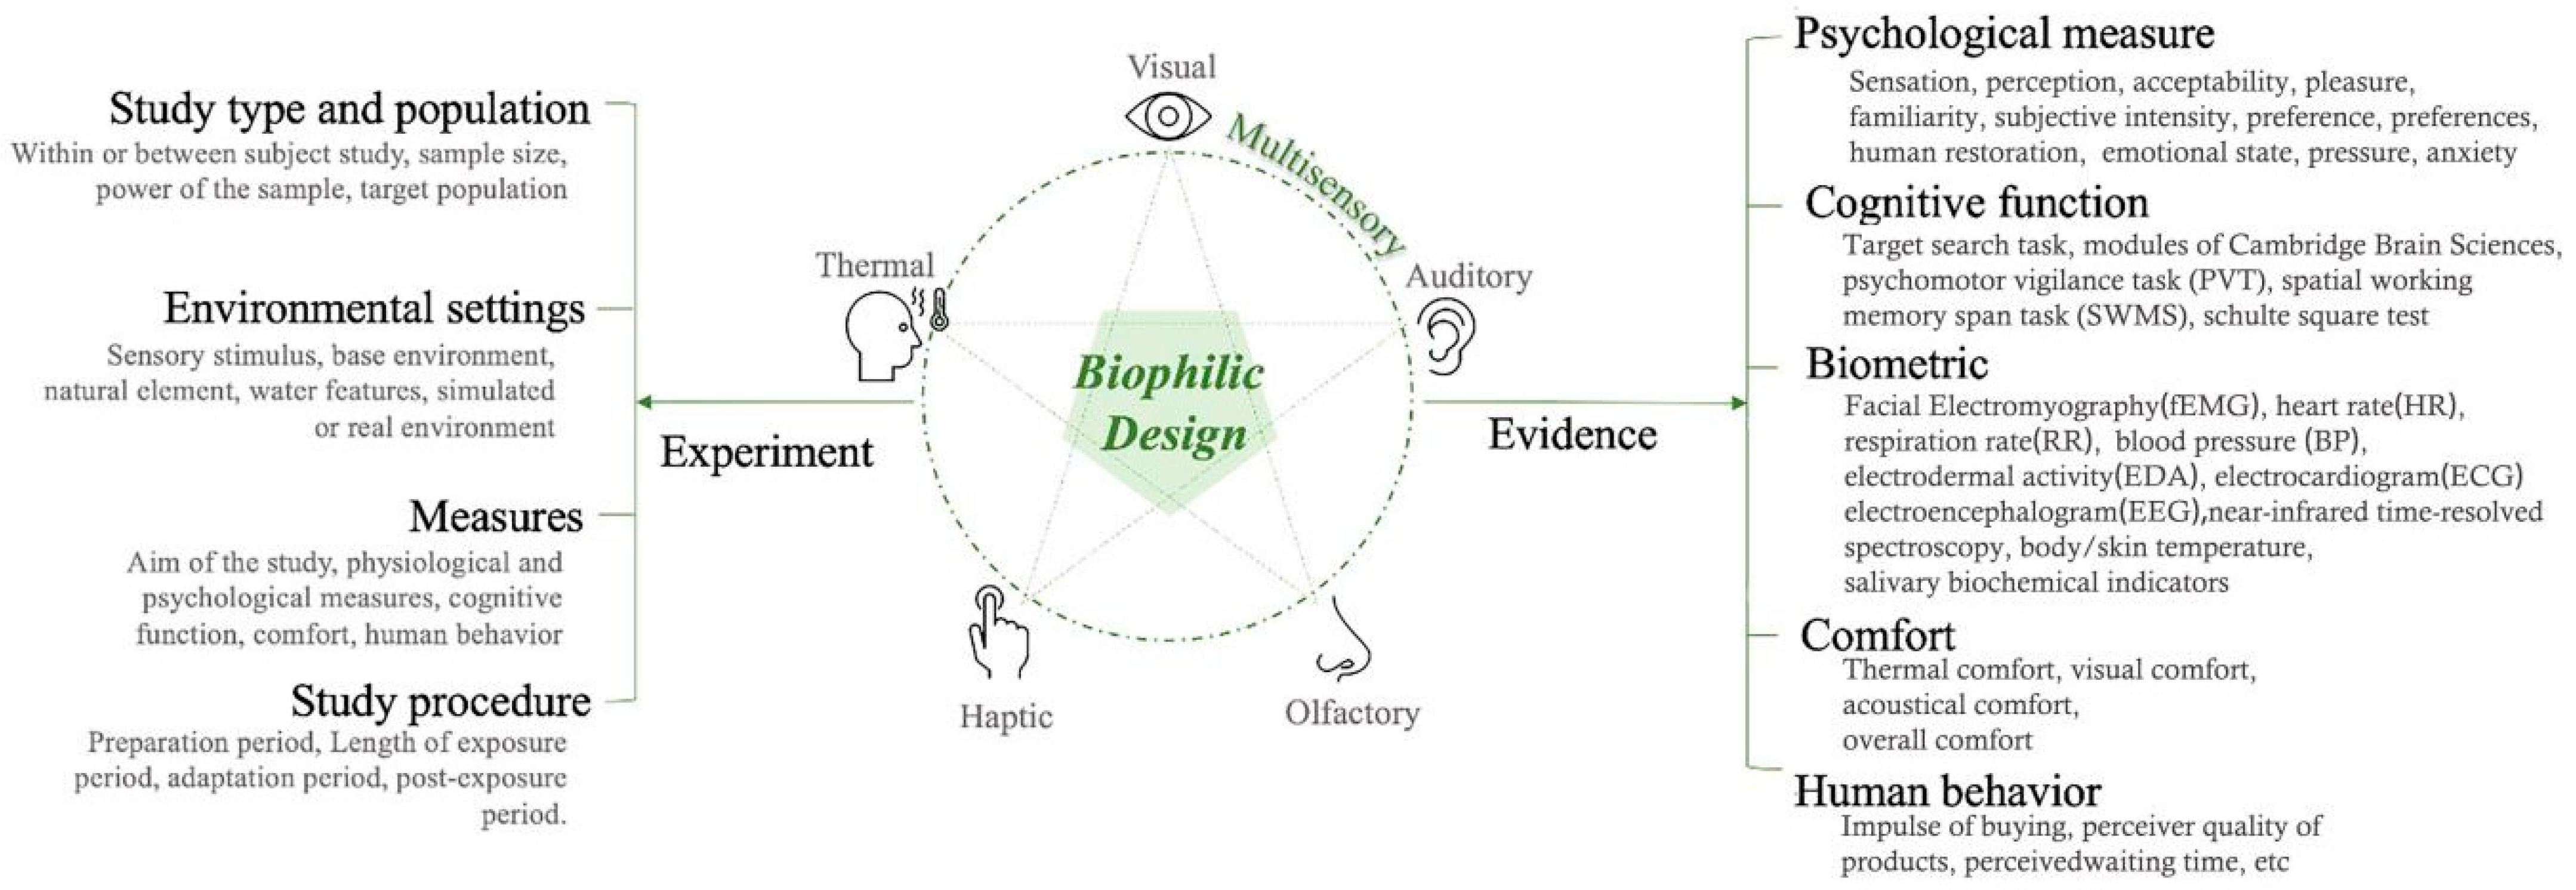
We conducted a scoping review following Arksey and O’Malley’s framework [46], which is a particularly useful approach when the information on a topic has not been comprehensively reviewed or is complex and diverse [47]. We aim to summarize evidence from existing biophilic design literature, rapidly map the key concepts of biophilia underpinning the multisensory design, and identify gaps in the sensorial evidence. Since this topic involves multiple environmental factors together which have not been reviewed comprehensively before, a scoping review will help us assemble multisensory studies and propose a potential research direction in the biophilic design field (Figure 1).
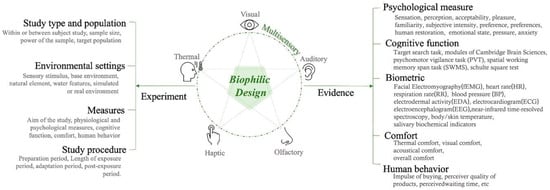
Figure 1.
Knowledge framework for multisensory implementation of biophilic design.
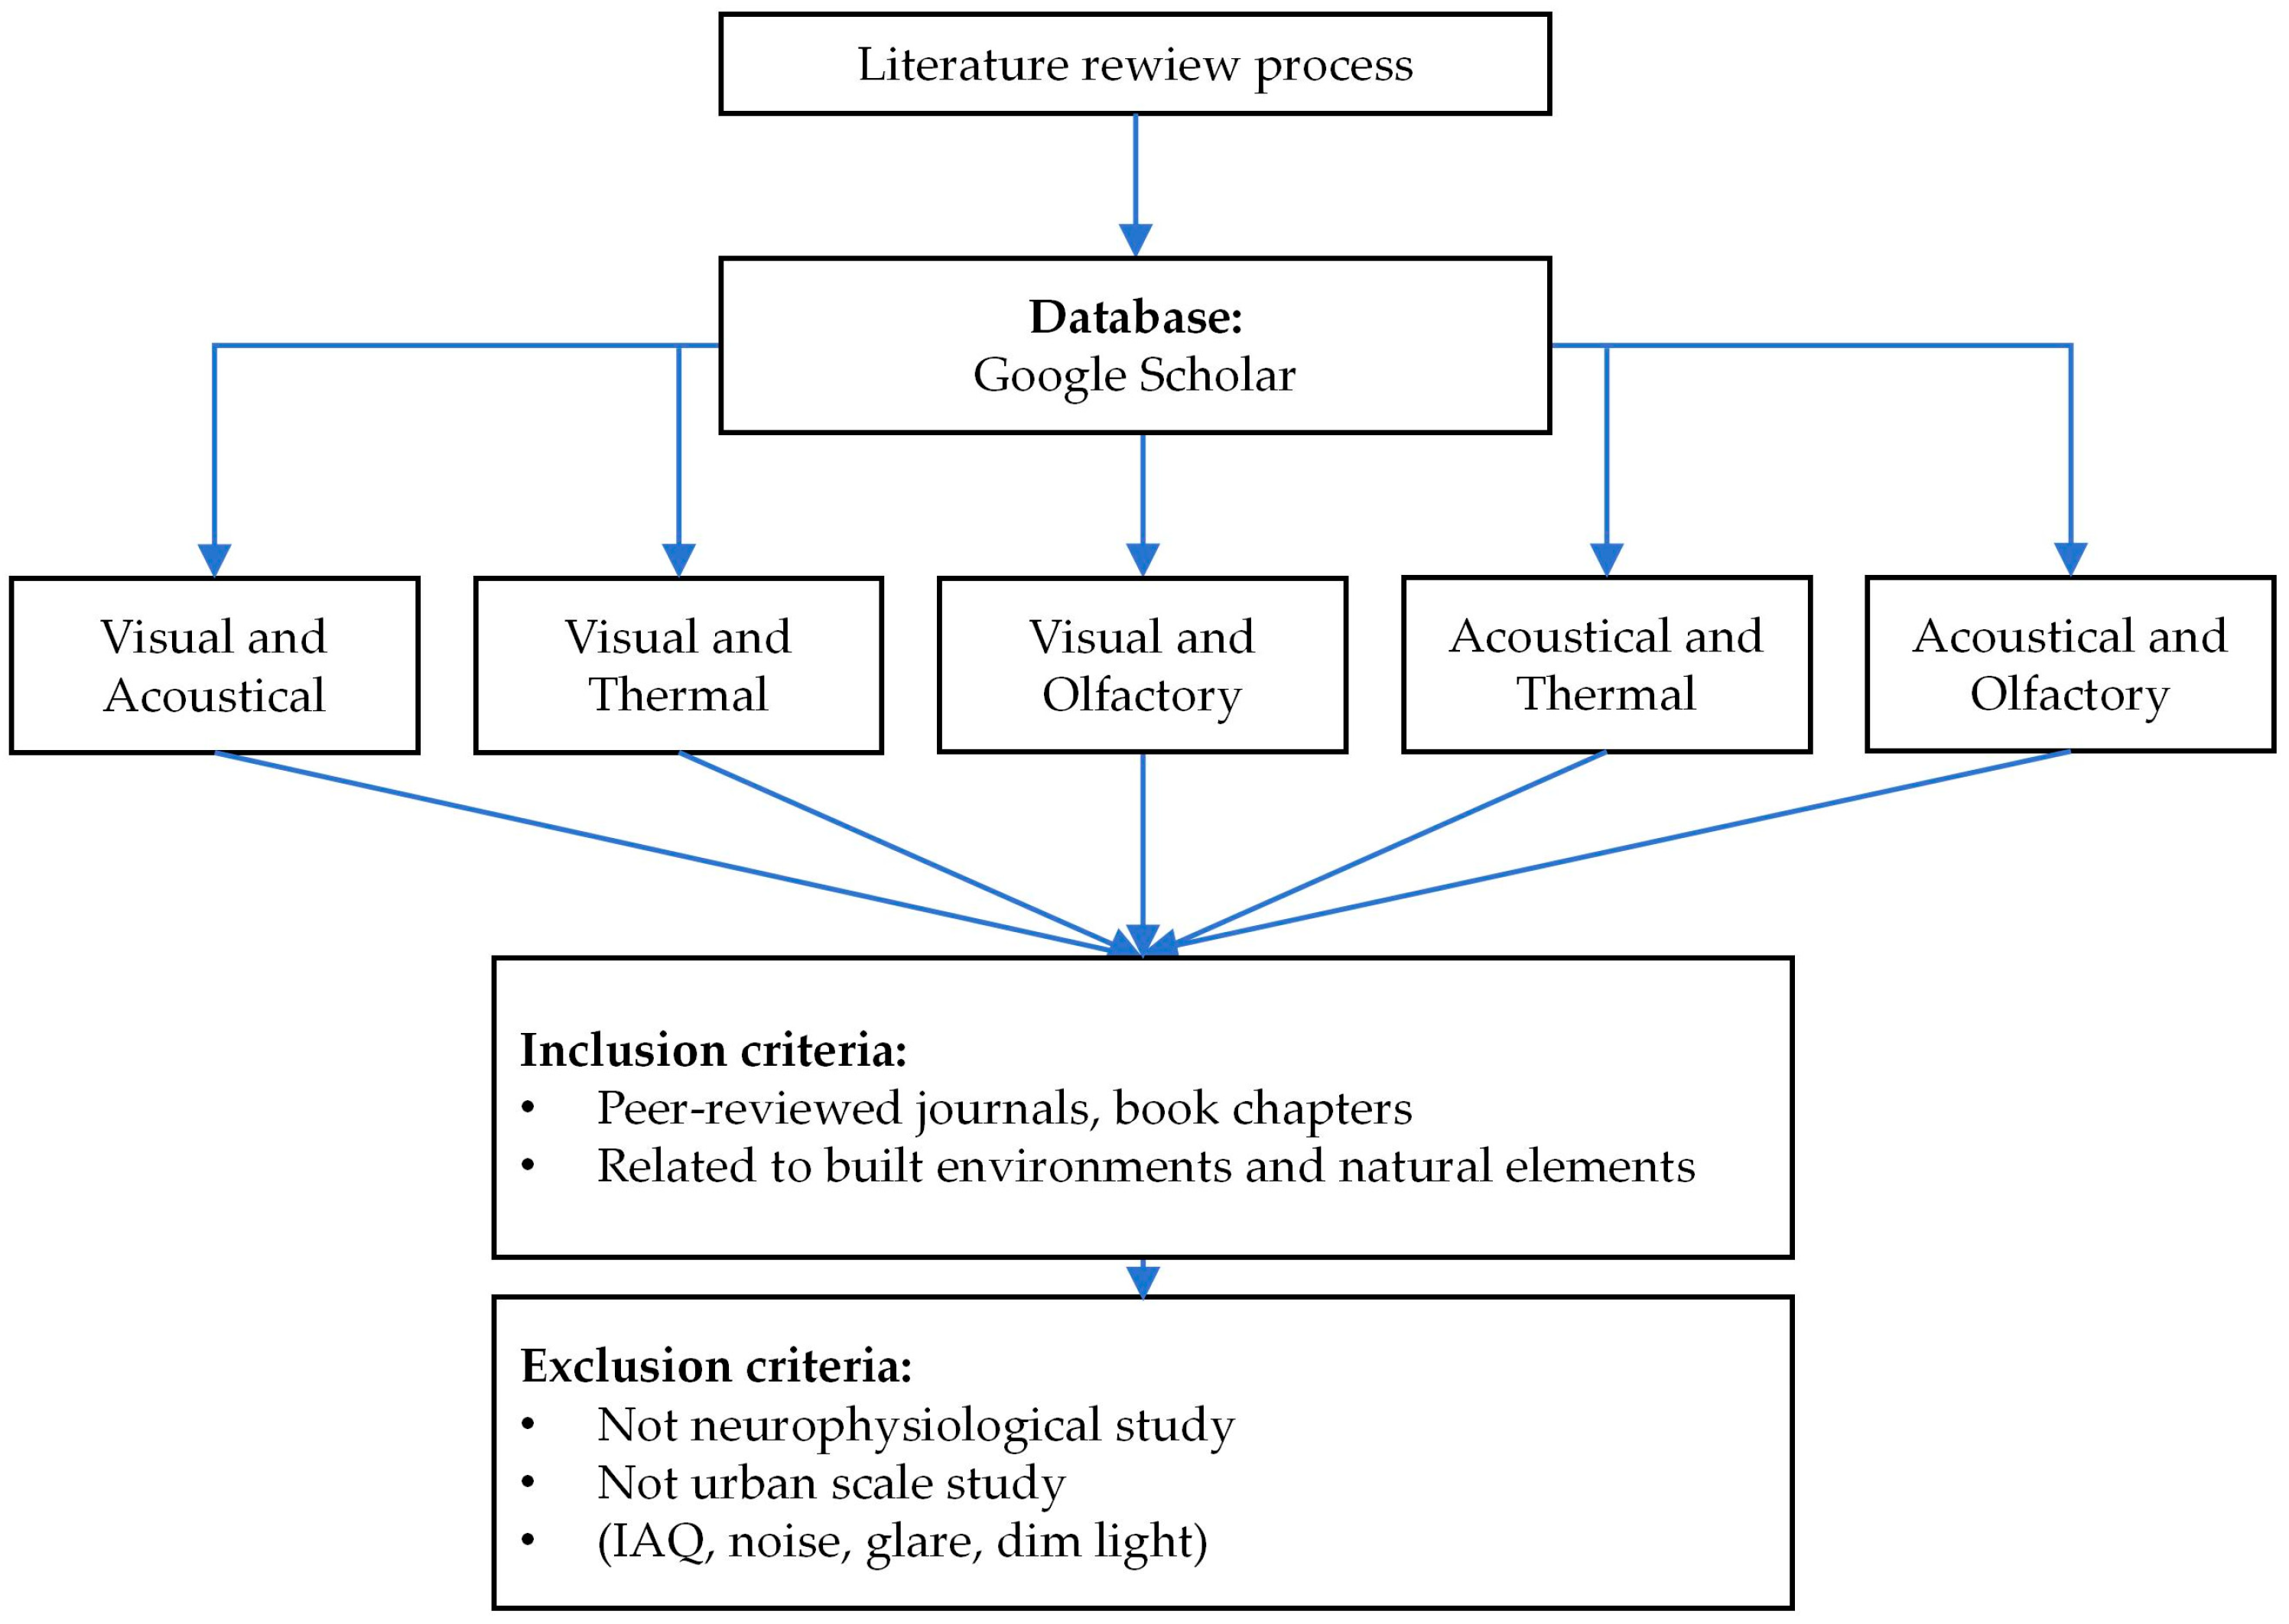
First of all, we frame our research question as “What is the current evidence on people’s physiological, psychological, and cognitive responses to biophilic design through multisensory approaches?” Specifically, we focused on four well-studied senses in environmental perception studies: visual, acoustical, olfactory, and thermal. Then, we used Google Scholar to search for peer-reviewed papers and book chapters in the fields of building science, public health, and environmental psychology. In terms of the searching process, we started with reviews on single-sensory studies and then explored the experimental studies investigating more than one sensory approach to environmental settings with biophilic features. Initially, a preliminary selection was conducted based on the titles and abstracts of the relevant literature, and 316 research papers were selected. We also use the snowball method to search through the reference list of multisensory studies to increase our database. Since we mainly focused on the positive effects of exposure to biophilic features, we excluded articles evaluating interaction effects caused by negative indoor air quality (IAQ), noise, glare, and dim light in combination with other environmental senses, as well as non-neurophysiological and non-urban scale studies. The detailed inclusion and exclusion criteria are shown in Figure 2. As a result, a total of 26 research papers were identified and included. The details of each paper can be found in the table. We charted the selected studies by key findings, experimental design and procedure, measures, and statistical method. Based on this, we summarized results from different sensory studies and provided a study design methodology for future work.
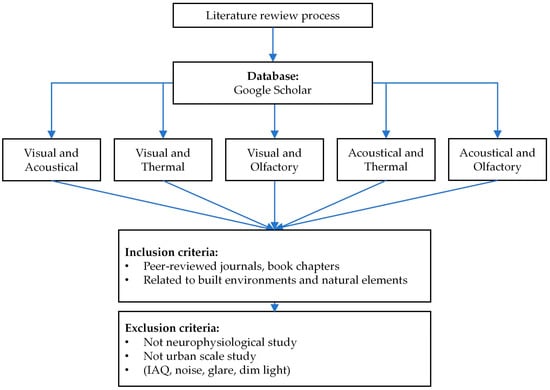
Figure 2.
Literature searching criteria.
3. Research Findings
3.1. Bi-Sensory
3.1.1. Visual–Acoustical
Visual–audio interactions can significantly influence the overall perception of a space. This is because when visual and acoustical feelings are coupled, attention paid to the visual cues would change the conscious perception of sound and vice versa. Under the umbrella of biophilic design, the goal of studies involving visual–auditory interactions was to focus on introducing natural scenery and sound into the built environment. Specifically, this topic has been widely explored on the urban scale, where studies found that the pleasantness of the visual environment was related to the judgments of the soundscape [48,49]. Studies also demonstrated that a combined visual–auditory natural environment led to a greater recovery in stress levels than the view-only scenario [50]. In addition, the contribution of natural sound to the overall impression of the urban environment was more significant than natural visual factors when there is a high level of road traffic noise [51].
For the indoor environment, Jahncke et al. found that people prefer offices with natural elements, whereas natural sound was associated with restorative qualities [52]. In addition, a study focusing on open-space offices found that natural sound always had greater effects on people’s recovery from fatigue and annoyance compared to environmental noise no matter whether the visual scene was natural or not, and the combination of water and natural environment was the best restorative condition [53]. Based on the visual–auditory interaction, Sun et al. also proposed a personal factor to modify the impact of natural window views on sound perception in a living room, called “audiovisual aptitude” [54]. A recent study conducted in a living lab found that an immersive biophilic indoor environment with visual and auditory biophilic features could improve occupant satisfaction and cognitive performance while reducing stress [42]. Another study found that the visual–auditory environment produced a better acute recovery effect. While with a longer recovery time, the auditory restorative environment might produce the most pronounced stress-recovery effects, followed by the visual restorative environment [55].
Water as a key feature in the biophilic design framework could offer a multisensory experience by providing visual, acoustical, thermal, and tactile delight [8]. Specifically, water sound is a natural and cost-effective tool to mask noise [56,57,58,59], reduce physiological stress levels [60], boost cognitive function, and improve mood [3]. However, using water features indoors is rare. Abdalrahman and Galbrun found that the introduction of the water feature which generates a water sound and produces visual stimuli improved perception dramatically [61,62]. They also suggested that water features need to be incorporated into the open-space office with plenty of workstations. More recently, Hasegawa and Lau summarized 27 visual–auditory review studies and highlighted the benefits of using water in an indoor environment, including that water features are influential visual factors for improving psychological responses and audio features have a similar potential [63].
3.1.2. Visual–Thermal
Vision may have a relevant influence on how we perceive other senses. For example, studies found that daylighting may have psychological and physiological interactions with thermal sensation. Kulve et al. found that the changes in visual and thermal comfort were positively related [64]. Specifically, thermal discomfort can be compensated for by lighting color and intensity, resulting in a higher perceived visual quality [64]. Through a controlled experimental investigation by using natural daylighting, Chinazzo et al. summarized that the quantity of daylight could influence thermal perception, resulting in a cross-modal effect, with a low daylight illuminance leading to a less comfortable and less acceptable thermal environment in cold conditions and a more comfortable one in warm conditions [65]. By giving participants more control over daylighting and electrical lighting, Haldi and Robinson concluded that there is no significant interaction between thermal and visual sensation, but people tended to be more thermally and visually comfortable when both conditions met their satisfaction [66]. Whether the relationship is strong or not, we could confidently say that from the psychological aspect, the interaction between daylighting and thermal sensation cannot be ignored. However, previous studies did not find significant interaction effects on physiological parameters, such as skin temperature, cognitive behavior therapy (CBT), and energy expenditure. Although the interaction between daylighting and thermal sensation has been studied for years, another vision-based biophilic component, a window view, was lacking enough literature support. Only one study explored the relationship between window view and thermal comfort and found that people felt significantly cooler when there was an accessible window view [67].
3.1.3. Visual–Olfactory
The combined visual and olfactory stimulation of the environment is relaxing. Song et al. showed that the combination of visual and olfactory stimulation increased sensations associated with “natural” and “realistic” [68]. Li et al. demonstrated that visual–olfactory co-stimulation could reduce fatigue, enhance self-esteem, relieve stress, improve spatial working memory, and reduce psychomotor vigilance errors [69].
3.1.4. Acoustical–Thermal
Previous studies investigated the interaction between acoustical and thermal senses in the built environment, but the results were controversial. Tiller et al. found that acoustic conditions can affect people’s thermal comfort with no reverse effect [70]. Pellerin et al. reported that sound level may alter thermal pleasantness only in warm conditions [71]. However, a study in Japan suggested that the thermal environment must be taken into consideration in acoustical studies by claiming that the operating temperature can affect people’s acoustical sensations [72]. A more recent study found that acoustic comfort was found to be greater at 25 °C compared to those at 20 °C or 30 °C [73].
As a representative of natural sound, water sound affected not only acoustic perception but also thermal and overall indoor environmental comfort. Yang and Moon [74] used recorded water sound from indoor fountains to study the interaction between sound and thermal comfort and its effect on acoustical perception. They found that water sounds could enhance pleasantness, calmness, and naturalness without increment of noise, loudness, or annoyance in a hot thermal environment.
3.1.5. Acoustical–Olfactory
Olfactory and acoustical elements individually or combined have received the most research attention in the retail context. A study found that when plants’ scents and pleasant sounds are combined, consumers rate the environment positively and experience enhanced satisfaction [75,76]. The multisensory effect between scent and sound was also investigated in healthcare research. With cautious usage, ambient scent and music can reduce patients’ anxiety in the waiting room of a plastic surgeon [77]. Recently, a study examined the nature of any cross-modal interactions between ambient sound and smell in a laboratory setting designed to capture the sensory cues that might be encountered in a typical urban environment [78]. The influence of odor on sound evaluation showed that the presence of odor had little effect on the evaluations of birdsong and low-volume sound. However, the concentration of odor was associated with a positive evaluation of noise. For example, a study found that the aroma of lilac can reduce the annoyance caused by traffic noise in urban streets [79]. Therefore, a positive sensory stimulus might improve the evaluation of perception through other senses, while a negative sensory stimulus has the opposite effect. In the built environment, acoustical and olfactory elements are highly correlated with each other. For overall comfort, the effect of sound was stronger than odor; while for congruency, the effects of sound and odor were almost equal.
3.1.6. Other Bi-Sensory Elements
Studies on thermal–olfactory and olfactory–touch interactions have been conducted, albeit in a limited number. One study found that thermal discomfort may produce a “revenge effect” for fragrance comfort, and fragrant stimuli resulted in an increase in the beta-band in “slightly warm” environments [80]. Research on the design of medical facilities suggests that when it is challenging to establish direct connections with the natural environment, an indirect natural experience model could be utilized. This may involve incorporating natural materials such as wood to stimulate the sense of touch, evoking olfactory memories with natural scents, and creating a “realistic” natural experience through various means.
3.2. Multisensory Experience
Most of the studies with the multisensory concept only focused on two senses [44]. It may be due to two main reasons: (1) it is hard to control more than two sensory variables in the experimental design; (2) the interactive effects among different sensory experiences might be too small to detect. However, some studies used multiple environmental factors that represent different senses to create a prediction model for indoor environmental comfort. For example, Krüger and Zannin discussed thermal, luminous, and acoustic comfort in the same study and proposed that designers should systematically consider all senses indoors to promote a healthy environment [81]. Huang et al. found that both thermal and acoustical senses dominate the satisfaction level of the indoor environment [82].
There are even fewer publications when we constrain all the existing studies to the realm of biophilic design. Yang and Moon incorporated three different room temperatures and three illuminance levels along with different types and levels of sound (including water sound) [73] and found that the effect of acoustic factors was the greatest on indoor environmental comfort, followed by room temperature and illuminance. Thermal perceptual comfort is susceptible to auditory and visual environments; however, the impact of the visual environment and thermal environment on auditory comfort is not significant [83]. A study investigated the recovery in a sensory-enriched break environment by integrating three sensory stimuli, including natural outdoor view and indoor greenery, bird sound, and herb scent [84]. They concluded that sensory-enriched environments were perceived as more pleasant and restorative compared to the standard break room. High levels of environmental pleasure are associated with low physiological stress responses in the sense of smell, to some extent with auditory stimuli, but not with visual stimuli [85]. Birdsong combined with visual–olfactory stimulation can increase physiological recovery and overall perception of quality assessment but has no significant impact on mental well-being [86]. Zhong et al. demonstrated in a sense walking experiment that high visual and smell environment quality can enhance soundscape evaluations, although the smell environment had a greater impact on the soundscape comfort degree (SCD) than the visual environment in waterfront space in mountainous cities (WSMCs) [87].
4. Study Design Implication
We summarized the research method used by experimental studies focusing on using biophilic elements to generate sensory stimuli for human subjects. Table 1 summarizes the study design of selected studies in detail. They could be divided into four subsections: study type and population, environmental settings, measures, and study procedure. We summarized each subsection with thoughts on the current state of the art, knowledge gaps, and future study design approaches.

Table 1.
Summary table of all the experimental studies.
4.1. Study Type and Subject
Due to differences in research questions, sample size, experimental procedures, and people’s behavioral responses, different researchers have adopted different research designs. According to statistics, 20 studies were experimental studies, and 6 studies were field studies; the majority of papers conducted short-term laboratory studies in a controlled environment, where environmental factors other than the target sensory elements were under control. The specific study questions and study sample size are shown in Table 2.
Table 2.
Study type and population analysis table.
Due to limited resources and the high costs associated with maintaining a controlled environment, laboratory studies typically involve fewer than 100 participants (except for acoustical–olfactory experiments). However, as the complexity of multisensory experiments and the number of experimental groups increases, so does the number of participants. When the number of senses increased to three or more, between-subject experiments required at least a hundred people, and only the intended within-subject experiments used 60 people as a sample.
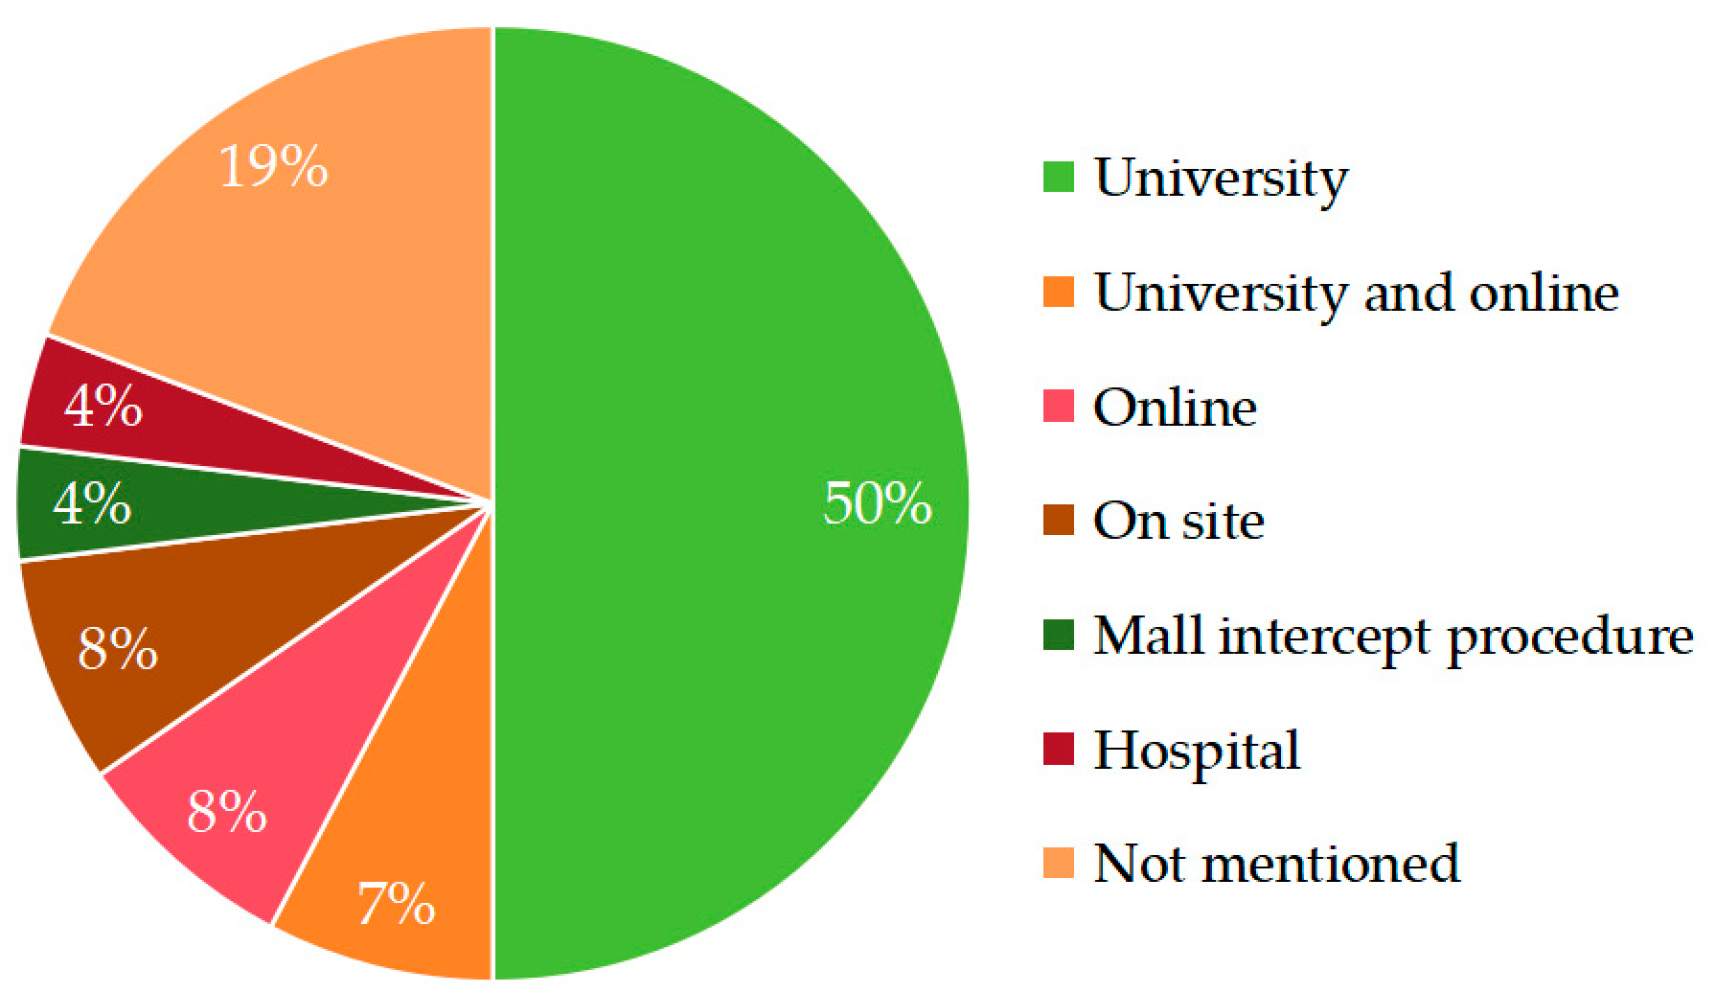
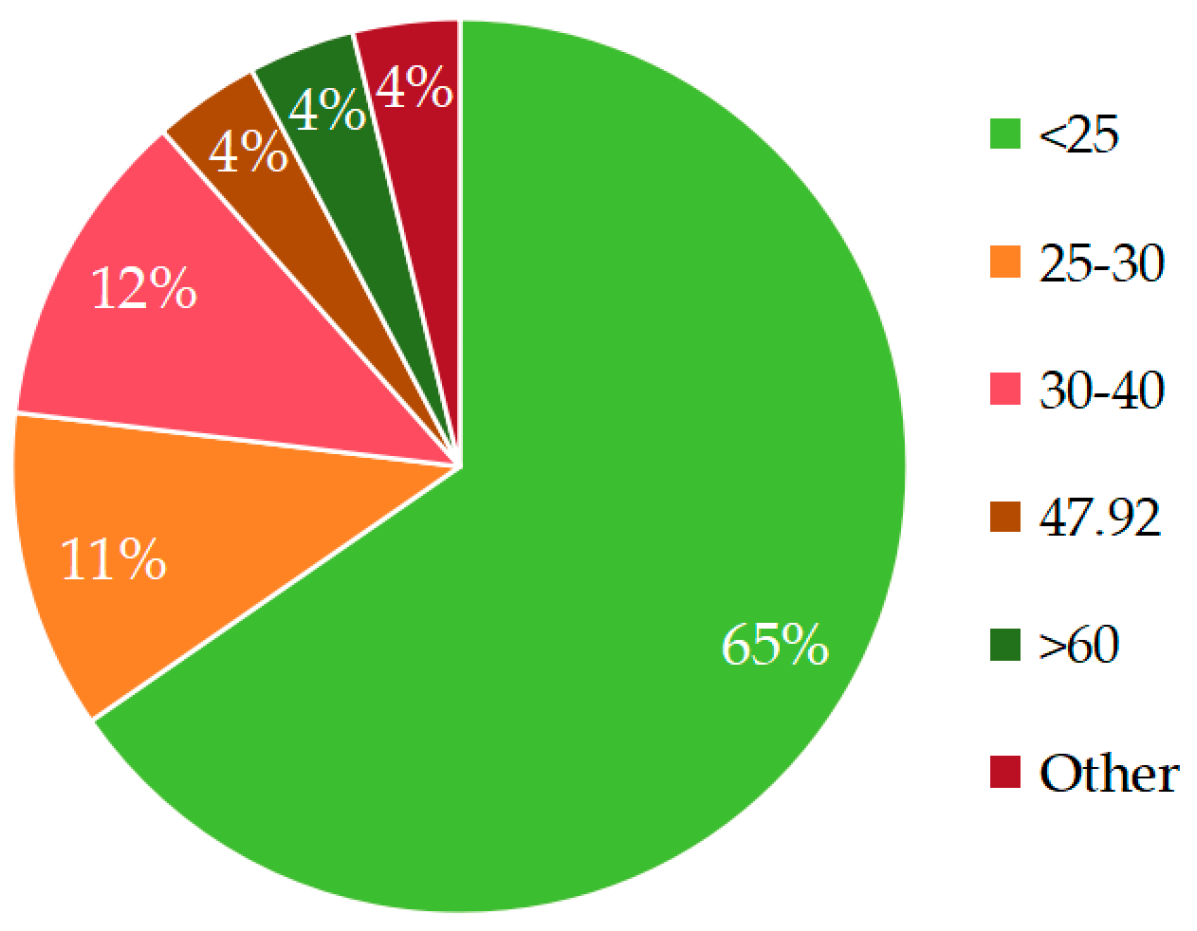
When we look at the form of recruitment, we find that more than half of the studies were recruited from universities (57%), and a few others were recruited from special approaches and organizations such as online, on-site, and in hospitals (Figure 3). Similarly, participants recruited from the university were overwhelmingly students and mostly under 25 years old, with only one study explicitly stating that it recruited staff from the university. Some studies recruited participants from specific groups, such as the elderly over 60 years of age, patients in hospitals, and shoppers who came to the mall (Figure 4 and Figure 5).

Figure 3.
Recruitment method.
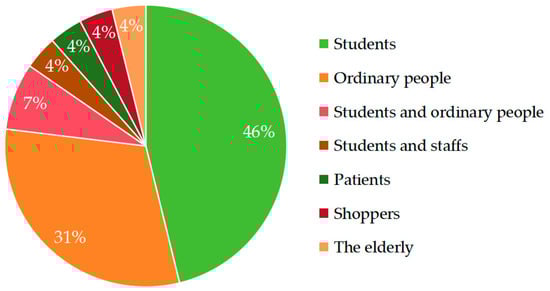
Figure 4.
Types of participants.

Figure 5.
Average age distribution5.
Due to the consideration of control variables, the vast majority of experiments restrict the characteristics of the population very strictly, such as age range, sex ratio, height and weight, etc. Of the 24 experiments that explicitly stated the sex ratio, 50% (12) studied the ratio of men to women as basically 1:1, and there were even two studies that only studied the female group (Table 2), thus only two studies analyzed the heterogeneity of the population of different ages. Galbrun and Calarco have statistically analyzed cultural groups, such as “Middle Eastern”, “Asian”, and “African”; however, cultural differences were not statistically analyzed due to small sample sizes for each cultural group.
In addition to screening for age and gender, studies similarly screened participants for sensory abilities, with 75% (15) of the 20 experiments involving screening subjects for hearing ability, either through self-reporting or testing with an audiometer. Only about half of the studies involving the senses of vision and smell screened for their visual and olfactory abilities. Notably, for the study on thermal sensation, Chang et al., 2023 [80] chose residents who had been in the area for more than a year to ensure that they had similar adaptations to the local climate; Chang et al., 2023 [80] and Yang and Moon, 2019 [73,74] achieved similarity in heat perception by controlling for the type of clothing worn by the participants. In addition, mental problems, smoking and drinking, health level, BMI index, pregnancy, medication use, etc., also played a very important role in the inclusion and exclusion criteria of the study. Furthermore, Galbrun and Calarco, 2014 [61] and Hong and Jeon, 2013 [51] conducted a consistency test on the participants to ensure the accuracy of the experimental results.
According to the countries where the experiments were conducted, a total of 11 countries from three continents were involved in the 26 papers, with Asia accounting for 46% (12 papers), Europe for 38% (10 papers), and North America for 15% (4 papers); there was a lack of research on countries in South America, Oceania, and Africa (Figure 6).
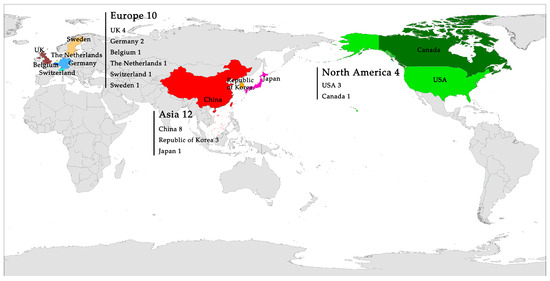
Figure 6.
Map of study sites.
4.2. Environmental Settings
Multiple biophilic design strategies could be applied to introduce nature indoors and create sensory experiences in experimental settings. Among the selected studies, researchers adopted different biophilic elements and their combinations, which will be introduced in the following section (Table 3).
Table 3.
Environmental settings analysis table.
For visual exposure, a large majority of studies used screens or VR to display the selected image. However, Park et al. used virtual reality to show the recorded urban video [50]. Yin et al. used virtual reality technology to watch immersive 360-degree field-of-view videos to create a more immersive experience [90]. Instead of using pictures or pre-recorded videos, Yin et al. stimulated three-dimensional virtual offices in VR by using Rhino5 software in advance and rendered in real-time during experiments by using Unity software (version 2017.1.0f3) [9,10]. For acoustical exposure, researchers played sound either through headphones or screen speakers in lab studies and used portable speakers to play the stimulus in field studies. For thermal-related exposure, studies were conducted in lab settings by changing room temperature directly. Experimental sessions were separated based on different temperatures given that it would take a long time to switch between temperatures, and also a long time is needed for participants to adapt. Only one study changed the temperature by directing subjects to three typical spaces [80,83]. For olfactory exposure, the most common way to disperse the scent is using a diffuser, but essential oil and perfume can also be used to create a scented environment.
4.3. Measures
We categorized all measures into five domains: psychological measures, cognitive function, biometrics, comfort, and human behavior (Table 4).
Table 4.
Measurement method analysis table.
Psychometric methods have their earliest origins and are widely used, and with the development of technology, some studies also incorporated biometric measures along with psychological indicators, because physiological measures can help the researcher understand human responses objectively in real time. Studies in recent years have shown that more and more researchers are using physiological indicator measures, and their methods are more diverse. Cognitive tests were also incorporated into experiments to measure participants’ performance. Research on comfort has grown rapidly, especially in the last few years and especially with respect to thermal comfort. Along with physiological and psychological measures, researchers also recorded human social behavior in field studies.
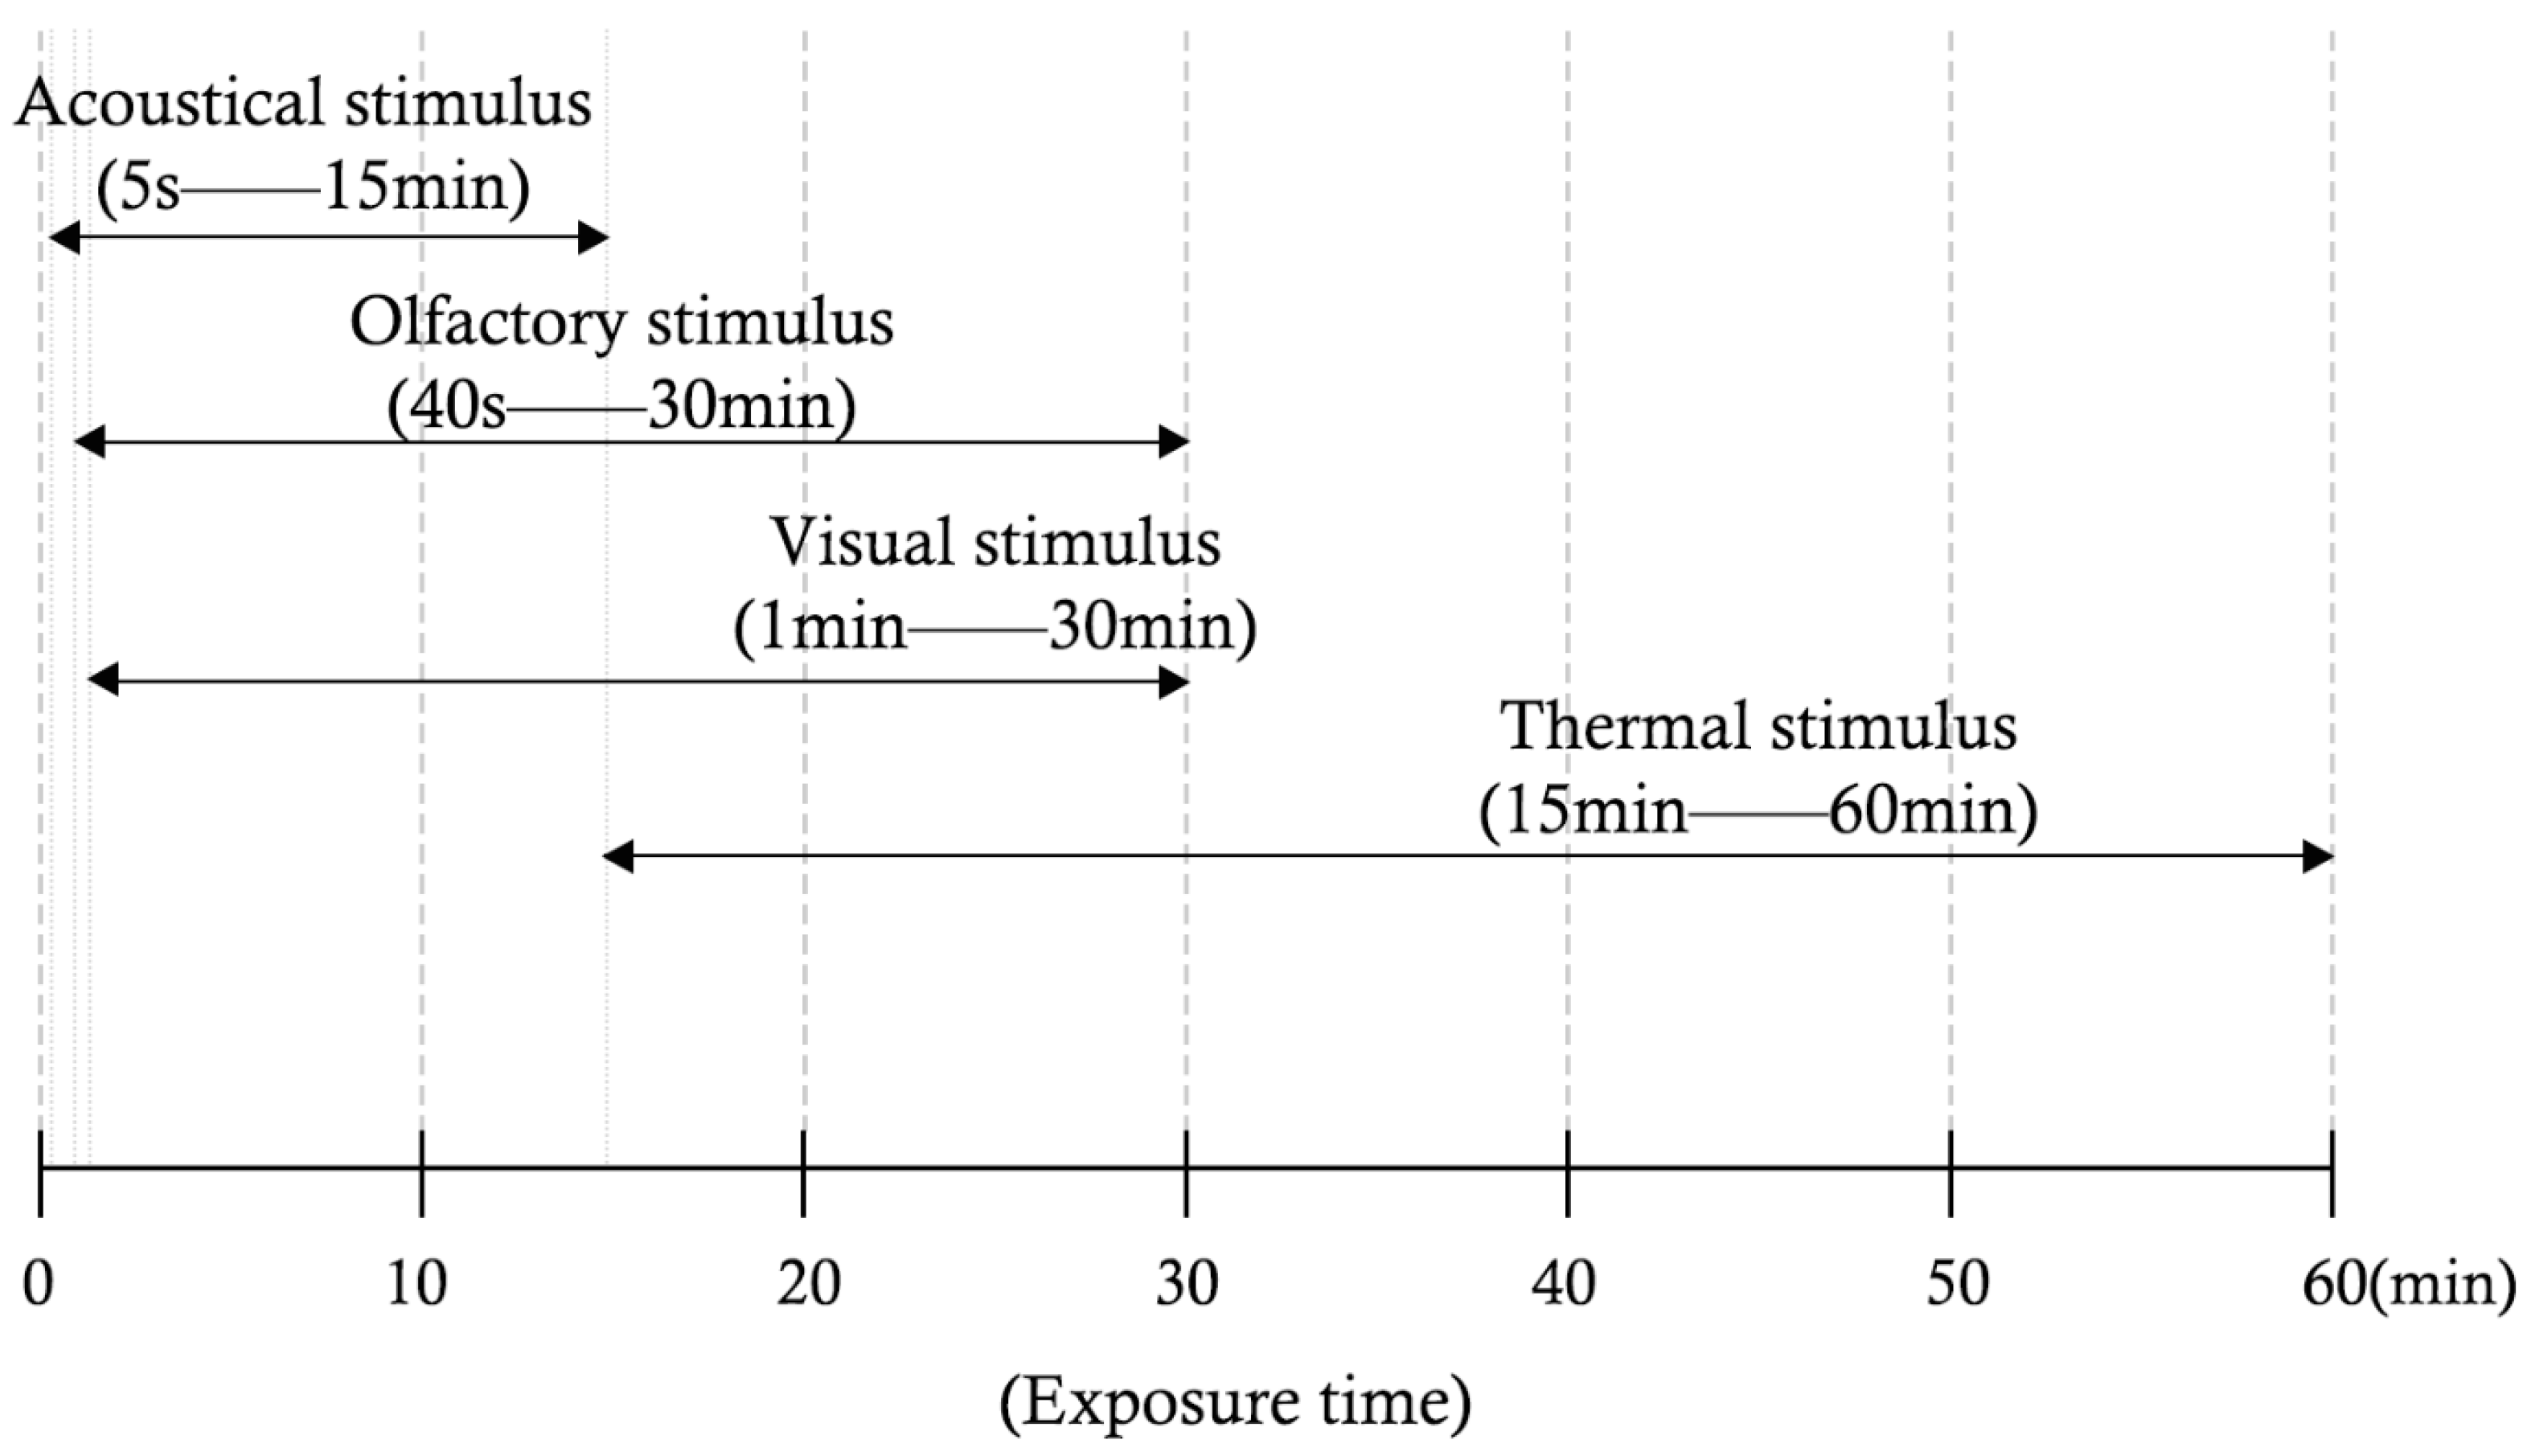
4.4. Study Procedure
The time for environmental exposure and perception could be different in experiments targeting different senses (Figure 7). For visual and sound perception, humans can process light and sound signals within a second. However, for thermal perception, a human’s dermal system needs more time to sense the change in room temperature and make the relevant adaptation. For smell, the chemical composition of the scent needs time to mix with the air and diffuse to smell organs. Due to these differences, studies related to acoustical perception always used a shorter exposure time for each sound stimulus, which is usually less than 15 min and as short as 5 s. However, when considering the recovery and long-term effects, researchers tend to extend the duration of auditory intervention. In a long-term study conducted by Aristizabal et al., a sound file lasting 6 h and 30 min was utilized to replicate an authentic natural environment, which was cyclically repeated [42].

Figure 7.
Exposure time for different stimuli (in most cases).
For research assessing visual perception, the exposure time ranged from 1 min to 30 min. The experimental time was always longer than 15 min when changing room temperature was needed. Therefore, if multiple sensory stimuli exist in a single experiment, a longer exposure time is needed for related human responses.
When designing a multisensory study, we not only need to consider the exposure time but also need to consider the carry-over effect of the previous experimental session. For visual and acoustical stimuli, people can quickly switch between different scenes. But when we included temperature as one of the environmental factors, researchers always set aside at least 15 min as adaptation time [64,65,73]. For the lab-based odor study, researchers ventilate the space for 5 min to clear out the residual of the previous scent [73].
5. Gaps and Future Directions
5.1. Beneficial Effects of Sensory Experiences
A noticeable shift has been seen from eliminating undesirable environments to creating beneficial environments. Studies began to look at positive design components advocated by theories of biophilic design, such as incorporating natural view, daylighting, natural sound, air movement, and flora scents indoors. However, we still need more scientific evidence to promote biophilic design. For example, how can we incorporate pleasant scents into the workspaces? How can we use natural sound as a sound masker in offices and public spaces? How can we create dynamic airflow in an office and urban public spaces?
5.2. Interaction between Multisensory Exposure to Nature
A deeper comprehension of interactions among senses would lead to a better understanding, modeling, and prediction of the impacts of sensory elements on people’s comfort, perception, health, and well-being. In this review, we examined studies that investigated correlations between different sensory stimuli, including the interactions between visual and acoustical, visual and thermal, acoustical and thermal, and acoustical and olfactory stimuli. However, our findings highlight that studies on the interactions between visual and olfactory, thermal and olfactory, and among three or more senses remain limited. Additionally, tactile interactions with natural elements such as flowers, trees, water, and rocks are acknowledged as potential factors influencing human experience. However, research in this area remains limited. Current studies predominantly focus on the passive tactile perception related to thermal sensations, overlooking the subjective aspects of tactile engagement with these natural elements. This gap highlights the need for further exploration into the active, subjective dimensions of tactile interactions in natural settings.
Beyond these traditional senses, it is important to consider other environmental factors such as humidity and air pressure, which can interact with temperature to influence human sensory experiences. For instance, studies have shown that the combination of temperature and humidity can significantly affect thermal comfort physiological responses [91] and work performance [92]. Moreover, research found that optimal thermal comfort is not static and can depend on several interacting factors, including the direction and speed of airflow [93]. Furthermore, with the advancement of biology, new types of senses—such as emotions (e.g., stress and fear), time perception, and spatial perception—have been identified or defined. Future research should explore these emerging sensory dimensions and their possible connections with traditional sensory modalities. By doing so, we can achieve a more comprehensive understanding of multisensory interactions and their contributions to human well-being, thereby fostering innovation in biophilic design practices.
5.3. Subjects Heterogeneity and Limited Generalization
Existing research has predominantly focused on students or younger populations, with most experiments being conducted in regions like Western Europe, East Asia, and North America. This geographical and demographic concentration limits the generalizability of the findings, thereby restricting their applicability to a broader range of populations. Future studies should expand their focus to include diverse age groups, such as children, middle-aged individuals, and the elderly. Additionally, consideration should also be given to the restorative effects on special populations, such as the chronically ill and pregnant women. By doing so, research can generate more universally applicable conclusions, ultimately fostering a more comprehensive understanding of how biophilic design can contribute to health promotion across various demographics.
5.4. Study Design Methodology for Multisensory Studies
It becomes challenging to design experiments for studying multiple senses. Researchers need to choose between different experimental strategies for different senses. For example, visual studies may need to extend their experimental time to accommodate for the adaption of temperature. For studying the interaction between olfactory and acoustical, researchers need to set aside ventilation time between each pair of sounds and scents.
5.5. The Lasting Impact of Multisensory Experiences
Although most current studies focus on short-term effects (usually within two hours) under various experimental conditions, some studies have begun to explore long-term effects (weeks or months). This is crucial because some benefits of natural exposure are immediate, while others accumulate over extended periods. Therefore, in future studies, it is very necessary to quantify both the immediate and long-term effects of multisensory interaction, particularly exploring the underlying neural mechanisms and psychological processes, as understanding these aspects will be the key to optimizing the biophilic design for human well-being.
5.6. Objective Physiological Measures
The psychological and cognitive effects of environmental stimuli have been studied for more than a century. The processes of data collection heavily rely on subjective self-report factors, which have been criticized for their reliability and precision. Measurement of objective and real-time physiological data via sensors has recently been proposed as a solution to the lack of accuracy of subjective assumptions and has gained some traction, with more than half of the selected biophilic studies already incorporating physiological identification data into their analyses.
To advance our understanding of the complex impacts of biophilic design on human well-being, it is crucial to foster interdisciplinary collaborations. By integrating knowledge and methods from urban design, environmental psychology, public health, and neuroscience, better data interpretation and integration could take place, thereby revealing the intricate relationships between multisensory environmental stimuli and human responses. Such collaborations will not only enhance the accuracy and depth of research findings but also drive innovation and advancements in design practices, ultimately leading to built environments that better support human health and well-being.
6. Conclusions
This review advocates for the accumulation of more scientific evidence to quantitatively evaluate multisensory experiences in biophilic environments and their subsequent influence on health and well-being, thereby underscoring the research’s value and future orientation. We therefore comprehensively analyzed empirical studies investigating the interactions between two and three sensory modalities in biophilic design, systematically summarizing the pivotal methods and techniques employed in these experimental studies. These include study types and subject selection, environmental exposure simulations, health benefit assessment indicators, and experimental process design. This analysis not only deepens our understanding of the health benefits associated with biophilic design but also provides methodological insights for future research endeavors.
The existing research shows that multisensory approaches can offer more substantial benefits than those focusing on single sensory modalities. However, current research exhibits limitations in studies involving more than two senses, especially three or more senses, inadequate coverage of different population types and geographical areas, as well as insufficient research on the long-term effects. Therefore, future research should focus on the comprehensive analysis of multisensory interactions. It is essential to consider the restorative effects across various populations and special groups. This inclusive approach will ensure that the benefits of biophilic design are accessible to all, thereby enhancing its impact on public health. At the same time, both short- and long-term impacts on health should be taken into account. Additionally, expanding the use of objective data collection methods and enhancing interdisciplinary collaboration will enable researchers to gain a deeper understanding of this field, ultimately leading to more effective health promotion outcomes.
Author Contributions
J.Y. (Jie Yin): Conceptualization, Methodology, Writing—Review and Editing, Supervision, Project administration, Funding acquisition; H.Z.: Data Curation, Investigation, Writing—Review and Editing; J.Y. (Jing Yuan): Conceptualization, Methodology, Investigation, Data Curation, Writing—Original Draft Preparation. All authors have read and agreed to the published version of the manuscript.
Funding
National Natural Science Foundation of China (No. 52378073); The First Batch of 2024 MOE of PRC Industry-University Collaborative Education Program (Program No. 230805329314629, Kingfar-CES “Human Factors and Ergonomics” Program); Fundamental Research Funds for the Central Universities (No. 22120240378).
Conflicts of Interest
The authors declare no conflicts of interest.
Notes
| 1 | (ASHRAE GUIDELINE 10—Interactions Affecting the Achievement of Acceptable Indoor Environments|Engineering360, n.d.) |
| 2 | The checkmarks in the “Sensory” column indicate which sensory elements were examined in each study. |
| 3 | Eight participants were excluded before analysis, as they had reported having tinnitus or that they had not heard any sound during the experiment. One participant was excluded for not following the instructions, which left 40 participants for the analysis. |
| 4 | In addition, all participants had been living in Minnesota for at least two years by the time the study began and were thus accustomed to the sounds introduced in this study. |
| 5 | In this analysis, it is assumed that students whose specific age is not indicated are under 25 years old. |
References
- Wilson, E.O. Biophilia; Harvard University Press: Cambridge, MA, USA, 1984. [Google Scholar]
- Brown, D.K.; Barton, J.L.; Gladwell, V.F. Viewing Nature Scenes Positively Affects Recovery of Autonomic Function Following Acute-Mental Stress. Environ. Sci. Technol. 2013, 47, 5562–5569. [Google Scholar] [CrossRef] [PubMed]
- Barton, J.; Pretty, J. What is the Best Dose of Nature and Green Exercise for Improving Mental Health? A Multi-Study Analysis. Environ. Sci. Technol. 2010, 44, 3947–3955. [Google Scholar] [CrossRef] [PubMed]
- Park, B.J.; Tsunetsugu, Y.; Kasetani, T.; Kagawa, T.; Miyazaki, Y. The physiological effects of Shinrin-yoku (taking in the forest atmosphere or forest bathing): Evidence from field experiments in 24 forests across Japan. Environ. Health Prev. Med. 2009, 15, 18–26. [Google Scholar] [CrossRef] [PubMed]
- Orsega-Smith, E.; Mowen, A.J.; Payne, L.L.; Godbey, G. The Interaction of Stress and Park Use on Psycho-physiological Health in Older Adults. J. Leis. Res. 2004, 36, 232–256. [Google Scholar] [CrossRef]
- Jahncke, H.; Hygge, S.; Halin, N.; Green, A.M.; Dimberg, K. Open-plan office noise: Cognitive performance and restoration. J. Environ. Psychol. 2011, 31, 373–382. [Google Scholar] [CrossRef]
- Tsunetsugu, Y.; Park, B.-J.; Miyazaki, Y. Trends in research related to “Shinrin-yoku” (taking in the forest atmosphere or forest bathing) in Japan. Environ. Health Prev. Med. 2009, 15, 27–37. [Google Scholar] [CrossRef]
- Kellert, S.R.; Heerwagen, J.; Mador, M. Biophilic Design: The Theory, Science and Practice of Bringing Buildings to Life; John Wiley & Sons: Hoboken, NJ, USA, 2011. [Google Scholar]
- Yin, J.; Yuan, J.; Arfaei, N.; Catalano, P.J.; Allen, J.G.; Spengler, J.D. Effects of biophilic indoor environment on stress and anxiety recovery: A between-subjects experiment in virtual reality. Environ. Int. 2020, 136, 105427. [Google Scholar] [CrossRef]
- Yin, J.; Arfaei, N.; MacNaughton, P.; Catalano, P.J.; Allen, J.G.; Spengler, J.D. Effects of biophilic interventions in office on stress reaction and cognitive function: A randomized crossover study in virtual reality. Indoor Air 2019, 29, 1028–1039. [Google Scholar] [CrossRef]
- Ulrich, R.S. View through a window may influence recovery from surgery. Science 1984, 224, 420–421. [Google Scholar] [CrossRef]
- Li, D.; Sullivan, W.C. Impact of views to school landscapes on recovery from stress and mental fatigue. Landsc. Urban Plan. 2016, 148, 149–158. [Google Scholar] [CrossRef]
- Felsten, G. Where to take a study break on the college campus: An attention restoration theory perspective. J. Environ. Psychol. 2009, 29, 160–167. [Google Scholar] [CrossRef]
- Aries, M.B.C.; Aarts, M.P.J.; van Hoof, J. Daylight and health: A review of the evidence and consequences for the built environment. Light. Res. Technol. 2013, 47, 6–27. [Google Scholar] [CrossRef]
- Osibona, O.; Solomon, B.D.; Fecht, D. Lighting in the Home and Health: A Systematic Review. Int. J. Environ. Res. Public Health 2021, 18, 609. [Google Scholar] [CrossRef]
- Küller, R.; Lindsten, C. Health and behavior of children in classrooms with and without windows. J. Environ. Psychol. 1992, 12, 305–317. [Google Scholar] [CrossRef]
- Zadeh, R.S.; Shepley, M.M.; Williams, G.; Chung, S.S.E. The Impact of Windows and Daylight on Acute-Care Nurses’ Physiological, Psychological, and Behavioral Health. HERD Health Environ. Res. Des. J. 2014, 7, 35–61. [Google Scholar] [CrossRef]
- Benfield, J.A.; Bell, P.A.; Troup, L.J.; Soderstrom, N. Does Anthropogenic Noise in National Parks Impair Memory? Environ. Behav. 2010, 42, 693–706. [Google Scholar] [CrossRef]
- Mathews, K.E.; Canon, L.K. Environmental noise level as a determinant of helping behavior. J. Pers. Soc. Psychol. 1975, 32, 571–577. [Google Scholar] [CrossRef]
- Rautio, N.; Filatova, S.; Lehtiniemi, H.; Miettunen, J. Living environment and its relationship to depressive mood: A systematic review. Int. J. Soc. Psychiatry 2018, 64, 92–103. [Google Scholar] [CrossRef]
- Benfield, J.; Taff, B.; Newman, P.; Smyth, J. Natural sound facilitates mood recovery. Ecopsychology 2014, 6, 183–188. [Google Scholar]
- DeLoach, A.G.; Carter, J.P.; Braasch, J. Tuning the cognitive environment: Sound masking with “natural” sounds in open-plan offices. J. Acoust. Soc. Am. 2015, 137, 2291. [Google Scholar] [CrossRef]
- Ličina, V.F.; Cheung, T.; Zhang, H.; de Dear, R.; Parkinson, T.; Arens, E.; Chun, C.; Schiavon, S.; Luo, M.; Brager, G.; et al. Development of the ASHRAE Global Thermal Comfort Database II. Build. Environ. 2018, 142, 502–512. [Google Scholar] [CrossRef]
- Zhang, H.; Arens, E.; Huizenga, C.; Han, T. Thermal sensation and comfort models for non-uniform and transient environments: Part I: Local sensation of individual body parts. Build. Environ. 2010, 45, 380–388. [Google Scholar] [CrossRef]
- Zhang, H.; Arens, E.; Huizenga, C.; Han, T. Thermal sensation and comfort models for non-uniform and transient environments, part II: Local comfort of individual body parts. Build. Environ. 2010, 45, 389–398. [Google Scholar] [CrossRef]
- Zhang, H.; Arens, E.; Huizenga, C.; Han, T. Thermal sensation and comfort models for non-uniform and transient environments, part III: Whole-body sensation and comfort. Build. Environ. 2010, 45, 399–410. [Google Scholar] [CrossRef]
- Fanger, P.O. Thermal comfort: Analysis and applications in environmental engineering: Fanger, P.O. Danish Technical Press, Copenhagen, Denmark, 1970, 244 pp.: Abstr. in World Textile Abstracts. Appl. Ergon. 1972, 3, 181. [Google Scholar] [CrossRef]
- Huizenga, C.; Hui, Z.; Arens, E. A model of human physiology and comfort for assessing complex thermal environments. Build. Environ. 2001, 36, 691–699. [Google Scholar] [CrossRef]
- Cheng, Y.; Niu, J.; Gao, N. Thermal comfort models: A review and numerical investigation. Build. Environ. 2012, 47, 13–22. [Google Scholar] [CrossRef]
- Zhang, H.; Arens, E.; Zhai, Y. A review of the corrective power of personal comfort systems in non-neutral ambient environments. Build. Environ. 2015, 91, 15–41. [Google Scholar] [CrossRef]
- de Dear, R.J.; Akimoto, T.; Arens, E.A.; Brager, G.; Candido, C.; Cheong, K.W.D.; Li, B.; Nishihara, N.; Sekhar, S.C.; Tanabe, S.-I.; et al. Progress in thermal comfort research over the last twenty years. Indoor Air 2013, 23, 442–461. [Google Scholar] [CrossRef]
- de Dear, R. Revisiting an old hypothesis of human thermal perception: Alliesthesia. Build. Res. Inf. 2011, 39, 108–117. [Google Scholar] [CrossRef]
- Spence, C. Using Ambient Scent to Enhance Well-Being in the Multisensory Built Environment. Front. Psychol. 2020, 11, 598859. [Google Scholar] [CrossRef] [PubMed]
- Jones, A.P. Indoor air quality and health. Atmos. Environ. 1999, 33, 4535–4564. [Google Scholar] [CrossRef]
- Spengler, J.D.; Chen, Q.Y. Indoor air quality factors in designing a healthy building. Annu. Rev. Energy Environ. 2000, 25, 567–600. [Google Scholar] [CrossRef]
- Wargocki, P.; Wyon, D.P.; Sundell, J.; Clausen, G.; Fanger, P.O. The Effects of Outdoor Air Supply Rate in an Office on Perceived Air Quality, Sick Building Syndrome (SBS) Symptoms and Productivity. Indoor Air 2000, 10, 222–236. [Google Scholar] [CrossRef]
- Weber, S.T.; Heuberger, E. The Impact of Natural Odors on Affective States in Humans. Chem. Senses 2008, 33, 441–447. [Google Scholar] [CrossRef]
- Haehner, A.; Maass, H.; Croy, I.; Hummel, T. Influence of room fragrance on attention, anxiety and mood. Flavour Fragr. J. 2016, 32, 24–28. [Google Scholar] [CrossRef]
- Ludvigson, H.W.; Rottman, T.R. Effects of ambient odors of lavender and cloves on cognition, memory, affect and mood. Chem. Senses 1989, 14, 525–536. [Google Scholar] [CrossRef]
- Motomura, N.; Sakurai, A.; Yotsuya, Y. Reduction of Mental Stress with Lavender Odorant. Percept. Mot. Ski. 2001, 93, 713–718. [Google Scholar] [CrossRef]
- Hutmacher, F. Why Is There So Much More Research on Vision Than on Any Other Sensory Modality? Front. Psychol. 2019, 10, 2246. [Google Scholar] [CrossRef]
- Aristizabal, S.; Byun, K.; Porter, P.; Clements, N.; Campanella, C.; Li, L.; Mullan, A.; Ly, S.; Senerat, A.; Nenadic, I.Z.; et al. Biophilic office design: Exploring the impact of a multisensory approach on human well-being. J. Environ. Psychol. 2021, 77, 101682. [Google Scholar] [CrossRef]
- Torresin, S.; Pernigotto, G.; Cappelletti, F.; Gasparella, A. Combined effects of environmental factors on human perception and objective performance: A review of experimental laboratory works. Indoor Air 2018, 28, 525–538. [Google Scholar] [CrossRef] [PubMed]
- Schweiker, M.; Ampatzi, E.; Andargie, M.S.; Andersen, R.K.; Azar, E.; Barthelmes, V.M.; Berger, C.; Bourikas, L.; Carlucci, S.; Chinazzo, G.; et al. Review of multi-domain approaches to indoor environmental perception and behaviour. Build. Environ. 2020, 176, 106804. [Google Scholar] [CrossRef]
- Altomonte, S.; Allen, J.; Bluyssen, P.M.; Brager, G.; Heschong, L.; Loder, A.; Schiavon, S.; Veitch, J.A.; Wang, L.; Wargocki, P. Ten questions concerning well-being in the built environment. Build. Environ. 2020, 180, 106949. [Google Scholar] [CrossRef]
- Arksey, H.; O’Malley, L. Scoping studies: Towards a methodological framework. Int. J. Soc. Res. Methodol. 2005, 8, 19–32. [Google Scholar] [CrossRef]
- Peters, M.D.J.; Godfrey, C.M.; Khalil, H.; McInerney, P.; Parker, D.; Soares, C.B. Guidance for conducting systematic scoping reviews. JBI Evid.-Based Implement. 2015, 13, 141–146. [Google Scholar] [CrossRef]
- Viollon, S.; Lavandier, C. A sound judgment depending on the urban visual setting? J. Acoust. Soc. Am. 1999, 105, 981. [Google Scholar] [CrossRef]
- Viollon, S.; Lavandier, C.; Drake, C. Influence of visual setting on sound ratings in an urban environment. Appl. Acoust. 2002, 63, 493–511. [Google Scholar] [CrossRef]
- Park, S.H.; Lee, P.J.; Jung, T.; Swenson, A. Effects of the aural and visual experience on psycho-physiological recovery in urban and rural environments. Appl. Acoust. 2020, 169, 107486. [Google Scholar] [CrossRef]
- Hong, J.Y.; Jeon, J.Y. Designing sound and visual components for enhancement of urban soundscapes. J. Acoust. Soc. Am. 2013, 134, 2026–2036. [Google Scholar] [CrossRef]
- Jahncke, H.; Naula, S.; Eriksson, K. The effects of auditive and visual settings on perceived restoration likelihood. Noise Health 2015, 17, 1–10. [Google Scholar] [CrossRef]
- Ma, H.; Shu, S. An Experimental Study: The Restorative Effect of Soundscape Elements in a Simulated Open-Plan Office. Acta Acust. United Acust. 2018, 104, 106–115. [Google Scholar] [CrossRef]
- Sun, K.; Sanchez, G.M.E.; De Coensel, B.; Van Renterghem, T.; Talsma, D.; Botteldooren, D. Personal Audiovisual Aptitude Influences the Interaction Between Landscape and Soundscape Appraisal. Front. Psychol. 2018, 9, 780. [Google Scholar] [CrossRef] [PubMed]
- Liu, G.; Zou, J.; Qiao, M.; Zhu, H.; Yang, Y.; Guan, H.; Hu, S. Stress recovery at home: Effects of the indoor visual and auditory stimuli in buildings. Build. Environ. 2023, 244, 110752. [Google Scholar] [CrossRef]
- Watts, G.R.; Pheasant, R.J.; Horoshenkov, K.V.; Ragonesi, L. Measurement and Subjective Assessment of Water Generated Sounds. Acta Acust. United Acust. 2009, 95, 1032–1039. [Google Scholar] [CrossRef]
- Jeon, J.Y.; Lee, P.J.; You, J.; Kang, J. Perceptual assessment of quality of urban soundscapes with combined noise sources and water sounds. J. Acoust. Soc. Am. 2010, 127, 1357–1366. [Google Scholar] [CrossRef] [PubMed]
- Haapakangas, A.; Kankkunen, E.; Hongisto, V.; Virjonen, P.; Oliva, D.; Keskinen, E. Effects of Five Speech Masking Sounds on Performance and Acoustic Satisfaction. Implications for Open-Plan Offices. Acta Acust. United Acust. 2011, 97, 641–655. [Google Scholar] [CrossRef]
- Jeon, J.Y.; Lee, P.J.; You, J.; Kang, J. Acoustical characteristics of water sounds for soundscape enhancement in urban open spaces. J. Acoust. Soc. Am. 2012, 131, 2101–2109. [Google Scholar] [CrossRef]
- Alvarsson, J.J.; Wiens, S.; Nilsson, M.E. Stress Recovery during Exposure to Nature Sound and Environmental Noise. Int. J. Environ. Res. Public Health 2010, 7, 1036–1046. [Google Scholar] [CrossRef]
- Galbrun, L.; Calarco, F.M.A. Audio-visual interaction and perceptual assessment of water features used over road traffic noise. J. Acoust. Soc. Am. 2014, 136, 2609–2620. [Google Scholar] [CrossRef]
- Abdalrahman, Z.; Galbrun, L. Audio-visual preferences, perception, and use of water features in open-plan offices. J. Acoust. Soc. Am. 2020, 147, 1661–1672. [Google Scholar] [CrossRef]
- Hasegawa, Y.; Lau, S.-K. Audiovisual Bimodal and Interactive Effects for Soundscape Design of the Indoor Environments: A Systematic Review. Sustainability 2021, 13, 339. [Google Scholar] [CrossRef]
- Kulve, M.T.; Schlangen, L.; Lichtenbelt, W.v.M. Interactions between the perception of light and temperature. Indoor Air 2018, 28, 881–891. [Google Scholar] [CrossRef] [PubMed]
- Chinazzo, G.; Wienold, J.; Andersen, M. Daylight affects human thermal perception. Sci. Rep. 2019, 9, 13690. [Google Scholar] [CrossRef]
- Haldi, F.; Robinson, D. On the unification of thermal perception and adaptive actions. Build. Environ. 2010, 45, 2440–2457. [Google Scholar] [CrossRef]
- Ko, W.H.; Schiavon, S.; Zhang, H.; Graham, L.T.; Brager, G.; Mauss, I.; Lin, Y.-W. The impact of a view from a window on thermal comfort, emotion, and cognitive performance. Build. Environ. 2020, 175, 106779. [Google Scholar] [CrossRef]
- Song, C.; Ikei, H.; Miyazaki, Y. Physiological effects of forest-related visual, olfactory, and combined stimuli on humans: An additive combined effect. Urban For. Urban Green. 2019, 44, 126437. [Google Scholar] [CrossRef]
- Li, Z.; Zhang, W.; Cui, J.; Wang, L.; Liu, H.; Liu, H. Biophilic environment with visual-olfactory stimuli contributes to psychophysiological restoration and cognitive enhancement. Build. Environ. 2024, 250, 111202. [Google Scholar] [CrossRef]
- Tiller, D.; Wang, L.; Musser, A.; Radik, M. AB-10-017: Combined effects of noise and temperature on human comfort and performance (1128-RP). Faculty Publications in Architectural Engineering. ASHRAE Trans. 2010, 116. Available online: https://digitalcommons.unl.edu/archengfacpub/40 (accessed on 27 July 2024).
- Pellerin, N.; Candas, V. Combined effects of temperature and noise on human discomfort. Physiol. Behav. 2003, 78, 99–106. [Google Scholar] [CrossRef]
- Nagano, K.; Horikoshi, T. New comfort index during combined conditions of moderate low ambient temperature and traffic noise. Energy Build. 2005, 37, 287–294. [Google Scholar] [CrossRef]
- Yang, W.; Moon, H.J. Combined effects of acoustic, thermal, and illumination conditions on the comfort of discrete senses and overall indoor environment. Build. Environ. 2019, 148, 623–633. [Google Scholar] [CrossRef]
- Yang, W.; Moon, H.J. Effects of recorded water sounds on intrusive traffic noise perception under three indoor temperatures. Appl. Acoust. 2019, 145, 234–244. [Google Scholar] [CrossRef]
- Mattila, A.S.; Wirtz, J. Congruency of scent and music as a driver of in-store evaluations and behavior. J. Retail. 2001, 77, 273–289. [Google Scholar] [CrossRef]
- Morrin, M.; Chebat, J.-C. Person-Place Congruency. J. Serv. Res. 2005, 8, 181–191. [Google Scholar] [CrossRef]
- Fenko, A.; Loock, C. The Influence of Ambient Scent and Music on Patients’ Anxiety in a Waiting Room of a Plastic Surgeon. HERD: Health Environ. Res. Des. J. 2014, 7, 38–59. [Google Scholar] [CrossRef]
- Ba, M.; Kang, J. A laboratory study of the sound-odour interaction in urban environments. Build. Environ. 2019, 147, 314–326. [Google Scholar] [CrossRef]
- Ba, M.; Kang, J. Effect of a fragrant tree on the perception of traffic noise. Build. Environ. 2019, 156, 147–155. [Google Scholar] [CrossRef]
- Chang, J.; Du, M.; Hong, B.; Qu, H.; Chen, H. Effects of thermal-olfactory interactions on emotional changes in urban outdoor environments. Build. Environ. 2023, 232, 110049. [Google Scholar] [CrossRef]
- Krüger, E.L.; Zannin, P.H. Acoustic, thermal and luminous comfort in classrooms. Build. Environ. 2004, 39, 1055–1063. [Google Scholar] [CrossRef]
- Huang, L.; Zhu, Y.; Ouyang, Q.; Cao, B. A study on the effects of thermal, luminous, and acoustic environments on indoor environmental comfort in offices. Build. Environ. 2012, 49, 304–309. [Google Scholar] [CrossRef]
- Du, M.; Hong, B.; Gu, C.; Li, Y.; Wang, Y. Multiple effects of visual-acoustic-thermal perceptions on the overall comfort of elderly adults in residential outdoor environments. Energy Build. 2023, 283, 112813. [Google Scholar] [CrossRef]
- Sona, B.; Dietl, E.; Steidle, A. Recovery in sensory-enriched break environments: Integrating vision, sound and scent into simulated indoor and outdoor environments. Ergonomics 2019, 62, 521–536. [Google Scholar] [CrossRef] [PubMed]
- Hedblom, M.; Gunnarsson, B.; Iravani, B.; Knez, I.; Schaefer, M.; Thorsson, P.; Lundström, J.N. Reduction of physiological stress by urban green space in a multisensory virtual experiment. Sci. Rep. 2019, 9, 10113. [Google Scholar] [CrossRef]
- Qi, Y.; Chen, Q.; Lin, F.; Liu, Q.; Zhang, X.; Guo, J.; Qiu, L.; Gao, T. Comparative study on birdsong and its multi-sensory combinational effects on physio-psychological restoration. J. Environ. Psychol. 2022, 83, 101879. [Google Scholar] [CrossRef]
- Zhong, B.; Xie, H.; Gao, T.; Qiu, L.; Li, H.; Zhang, Z. The Effects of Spatial Characteristics and Visual and Smell Environments on the Soundscape of Waterfront Space in Mountainous Cities. Forests 2022, 14, 10. [Google Scholar] [CrossRef]
- ISO/TS 15666: 2003; Acoustics-Assessment of Noise Annoyance by Means of Social and Socio-Acoustic Surveys. International Organisation for Standardization: Geneva, Switzerland, 2003.
- ISO/TS 12913-2: 2018; Acoustics—Soundscape—Part 2: Data Collection and Reporting Requirements. ISO: Geneva, Switzerland, 2018.
- Yin, J.; Zhu, S.; MacNaughton, P.; Allen, J.G.; Spengler, J.D. Physiological and cognitive performance of exposure to biophilic indoor environment. Build. Environ. 2018, 132, 255–262. [Google Scholar] [CrossRef]
- Nikolopoulou, M.; Steemers, K. Thermal comfort and psychological adaptation as a guide for designing urban spaces. Energy Build. 2003, 35, 95–101. [Google Scholar] [CrossRef]
- Wu, J.; Hou, Z.; Shen, J.; Lian, Z. Quantitative effect on work performance considering interactions among multiple indoor environmental factors. Build. Environ. 2020, 185, 107286. [Google Scholar] [CrossRef]
- Luo, M.; Zhang, H.; Wang, Z.; Arens, E.; Chen, W.; Bauman, F.S.; Raftery, P. Ceiling-fan-integrated air-conditioning: Thermal comfort evaluations. Build. Cities 2021, 2, 928–951. [Google Scholar] [CrossRef]


Disclaimer/Publisher’s Note: The statements, opinions and data contained in all publications are solely those of the individual author(s) and contributor(s) and not of MDPI and/or the editor(s). MDPI and/or the editor(s) disclaim responsibility for any injury to people or property resulting from any ideas, methods, instructions or products referred to in the content. |
© 2024 by the authors. Licensee MDPI, Basel, Switzerland. This article is an open access article distributed under the terms and conditions of the Creative Commons Attribution (CC BY) license (https://creativecommons.org/licenses/by/4.0/).