
Defining and Verifying New Local Climate Zones with Three-Dimensional Built Environments and Urban Metabolism


Abstract
1. Introduction
Background
2. Literature Review
2.1. Scale of Local Climate Zones
2.2. Factors of Local Climate Zones
2.3. Research Gaps
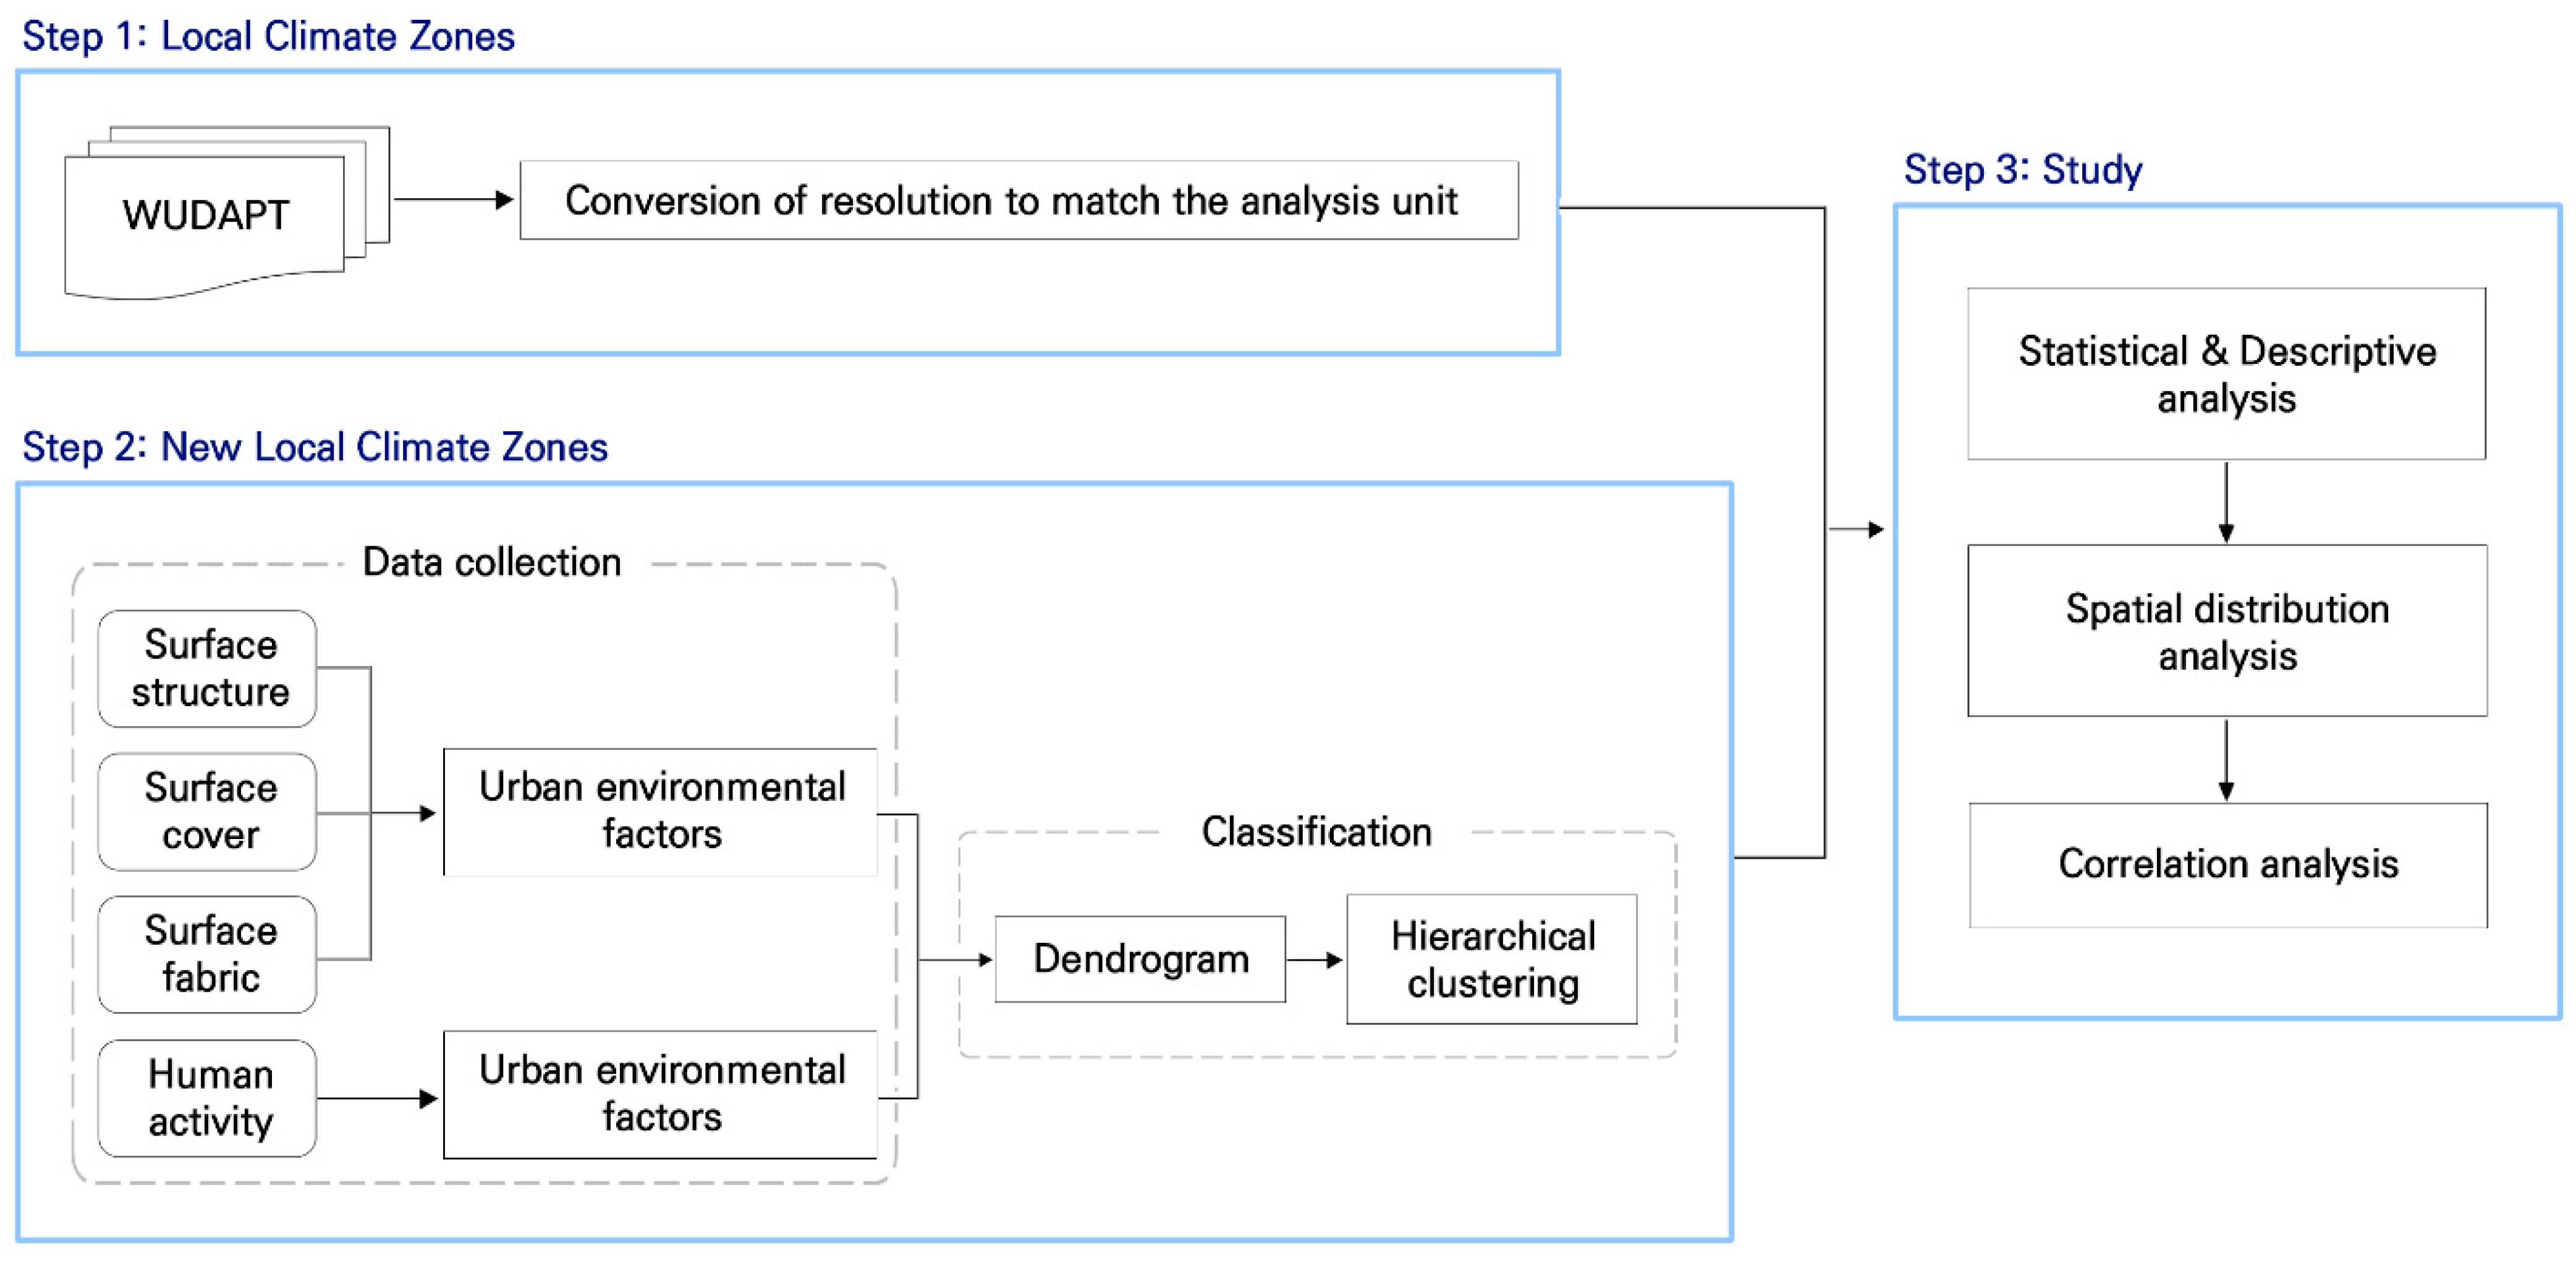
3. Methodology
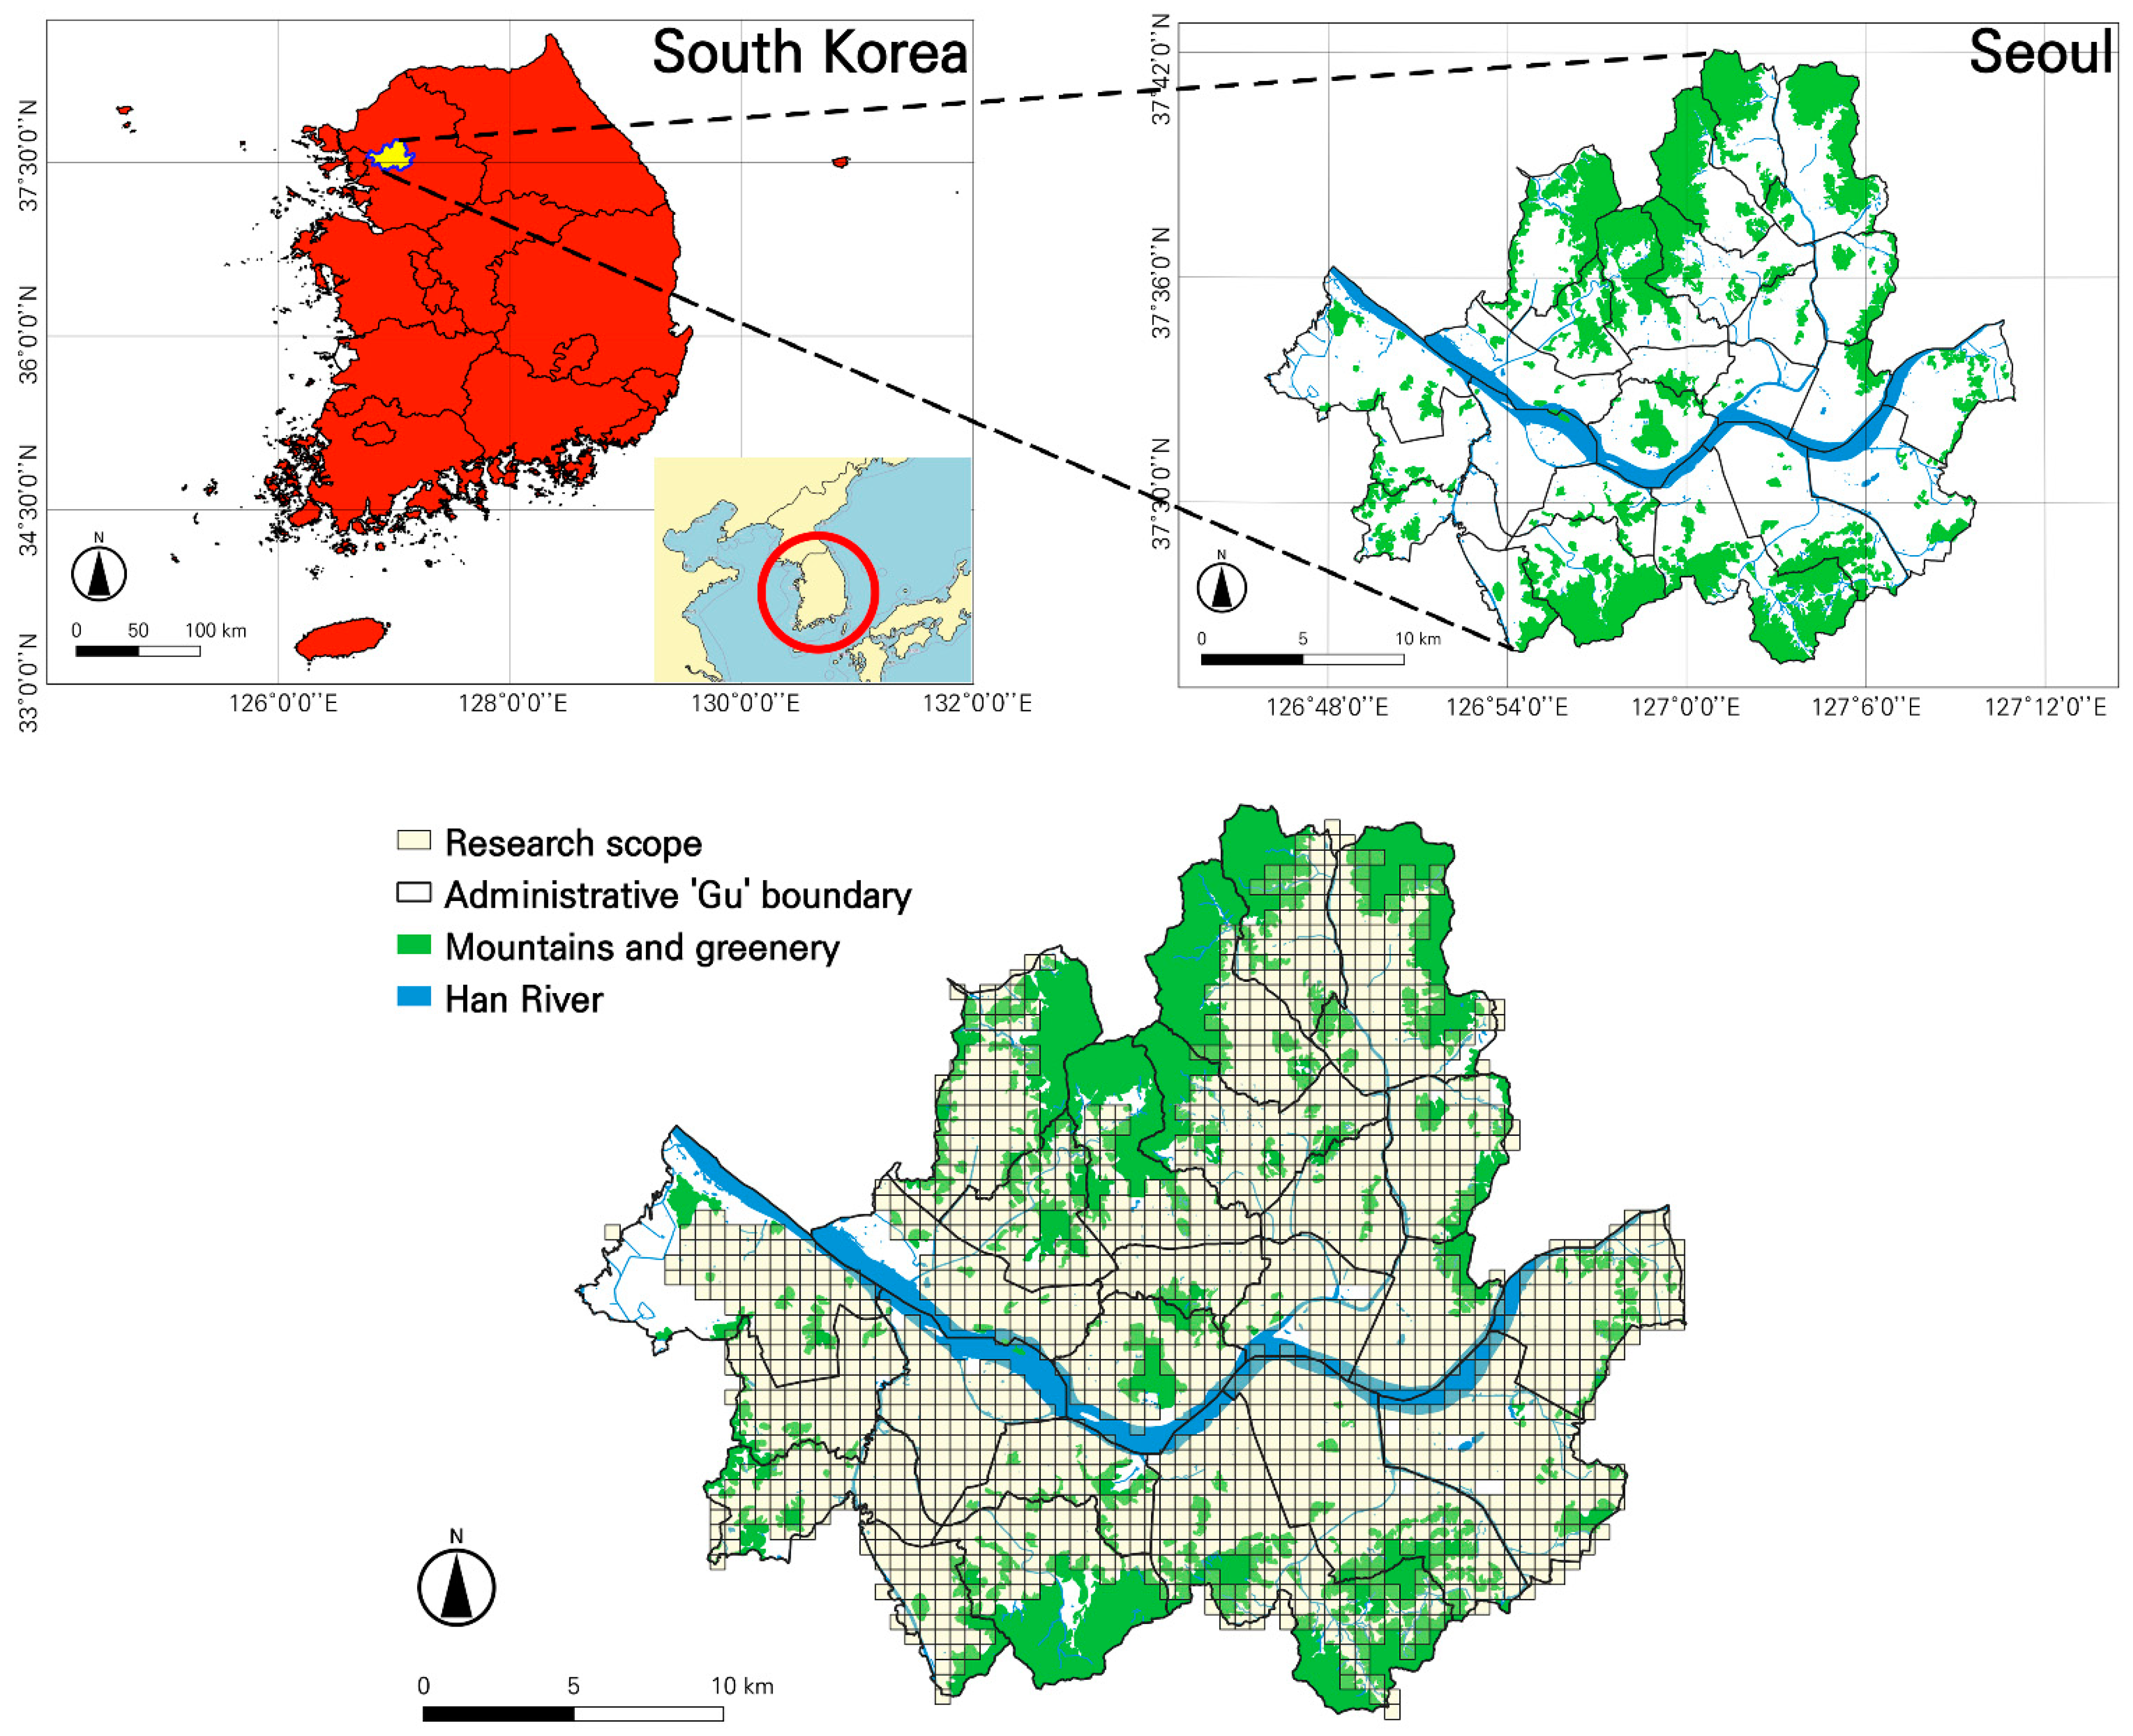
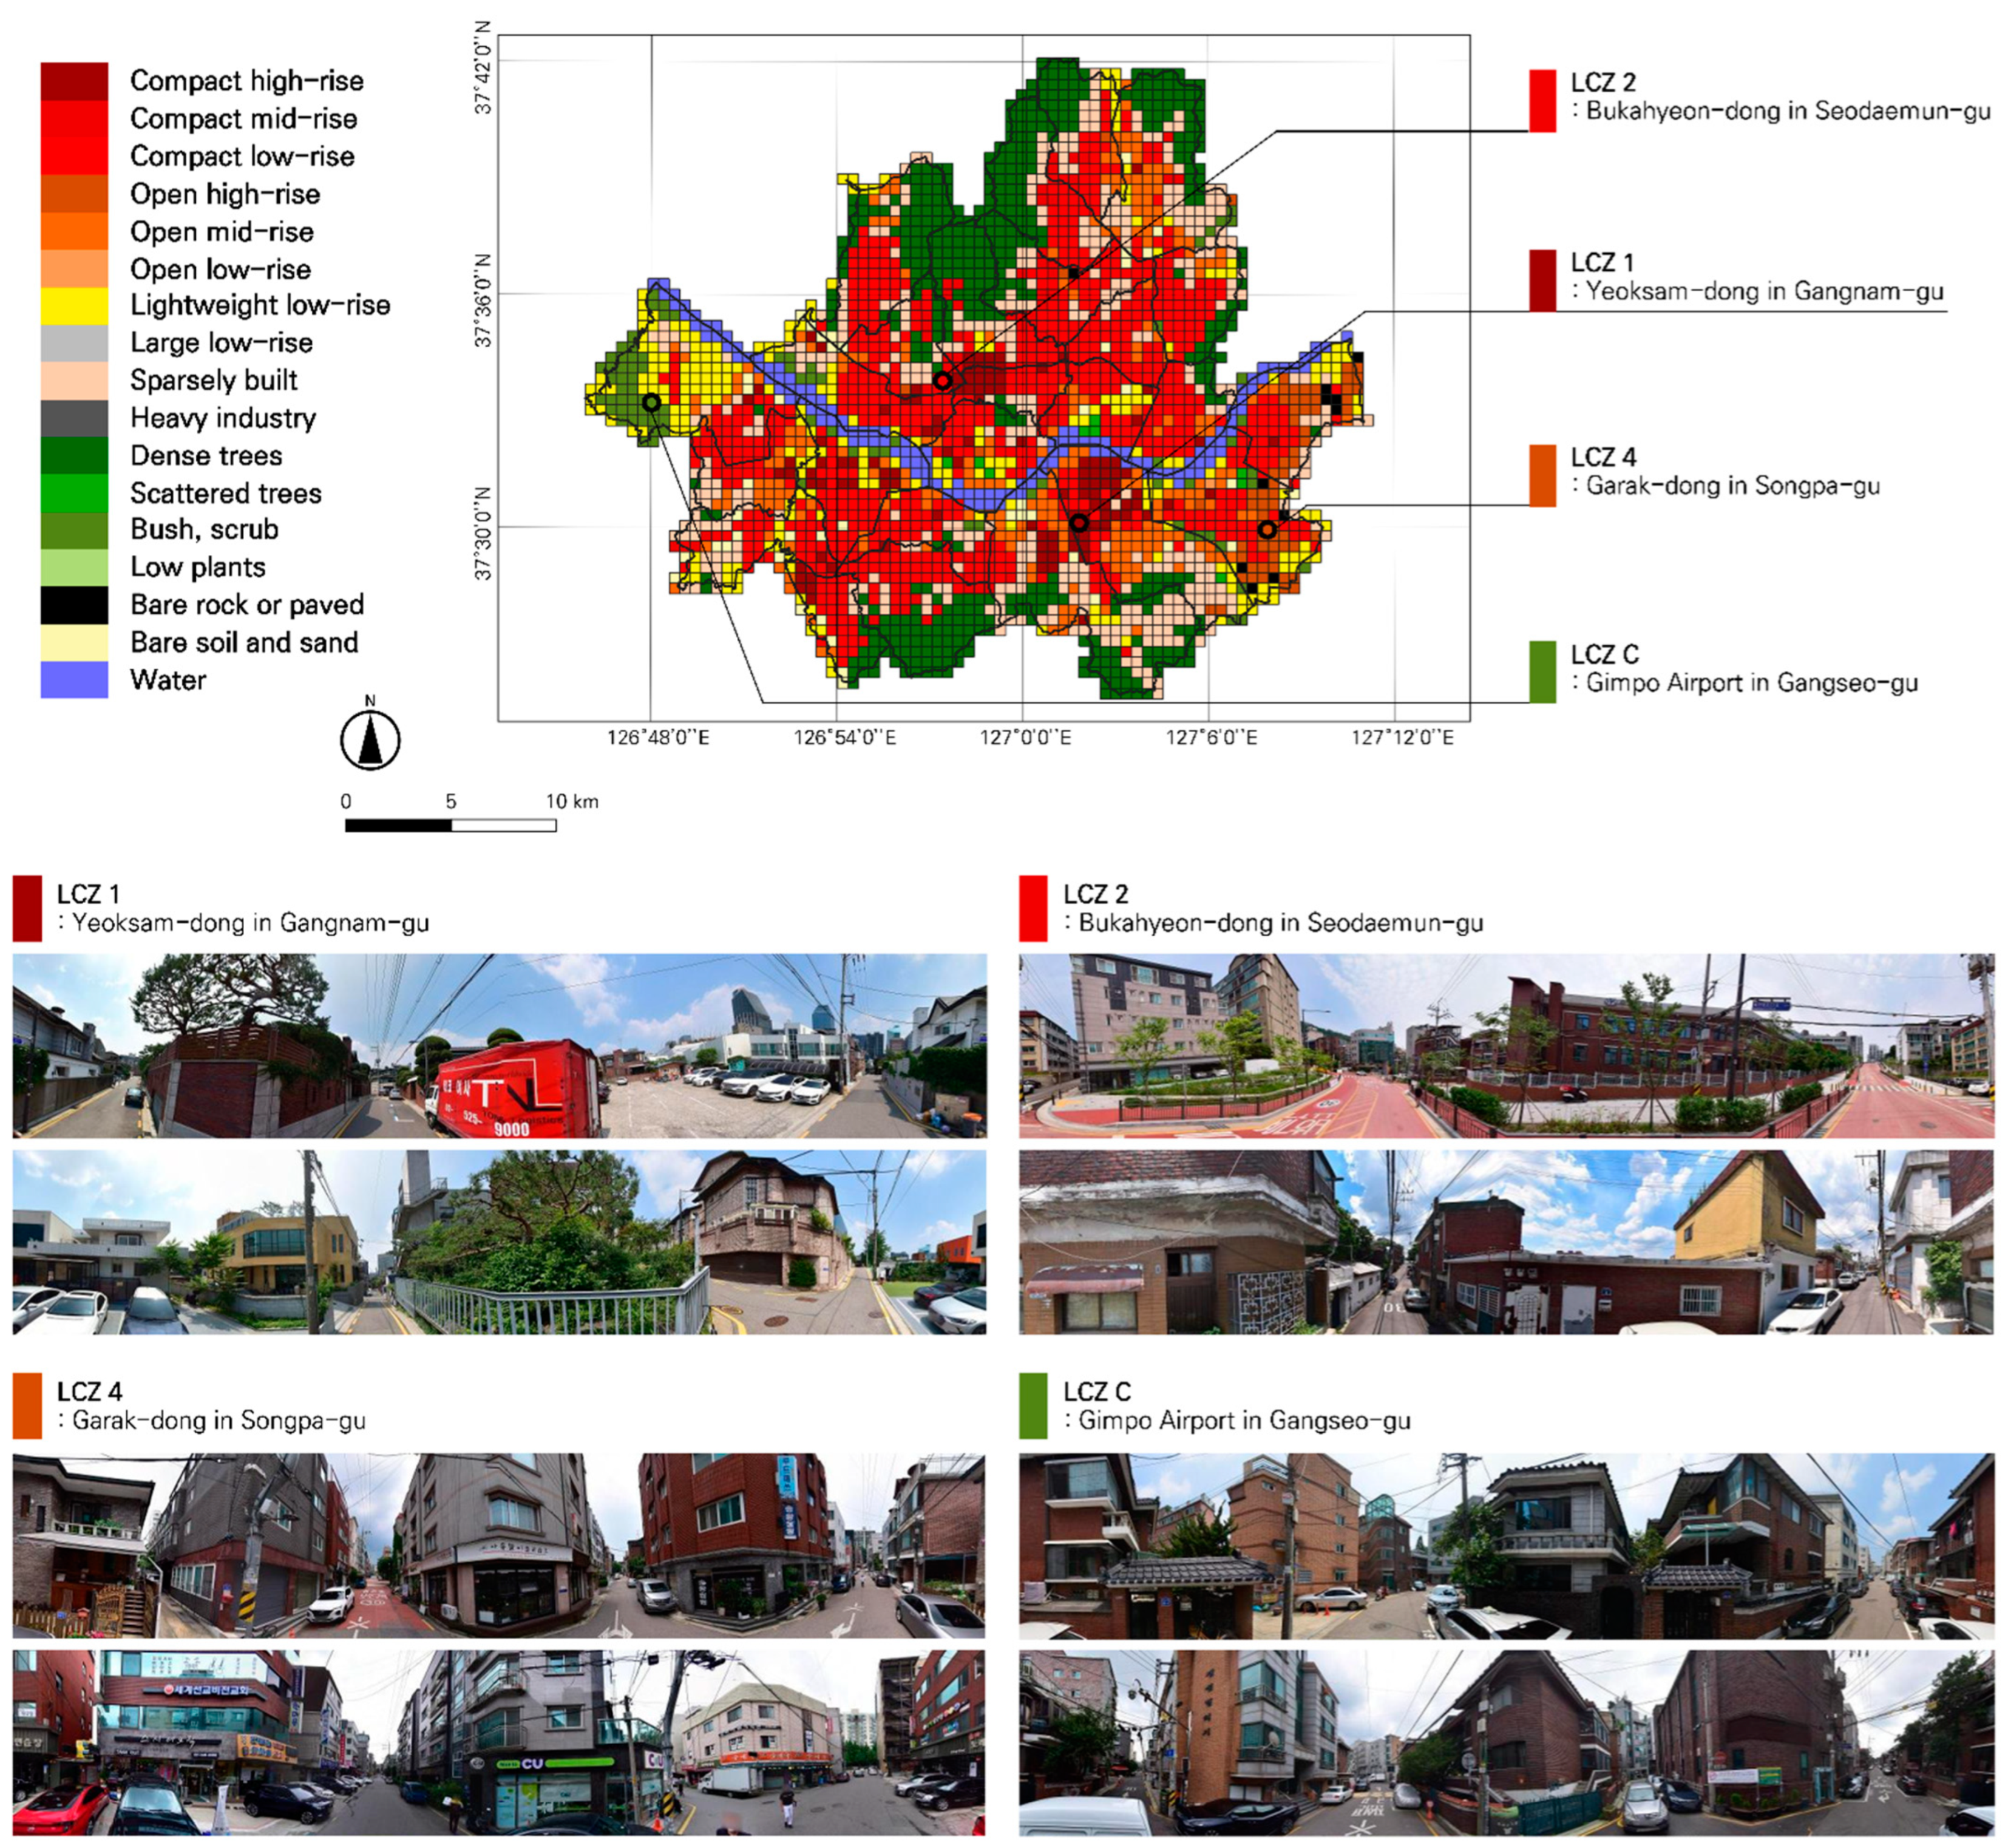
3.1. Research Scope
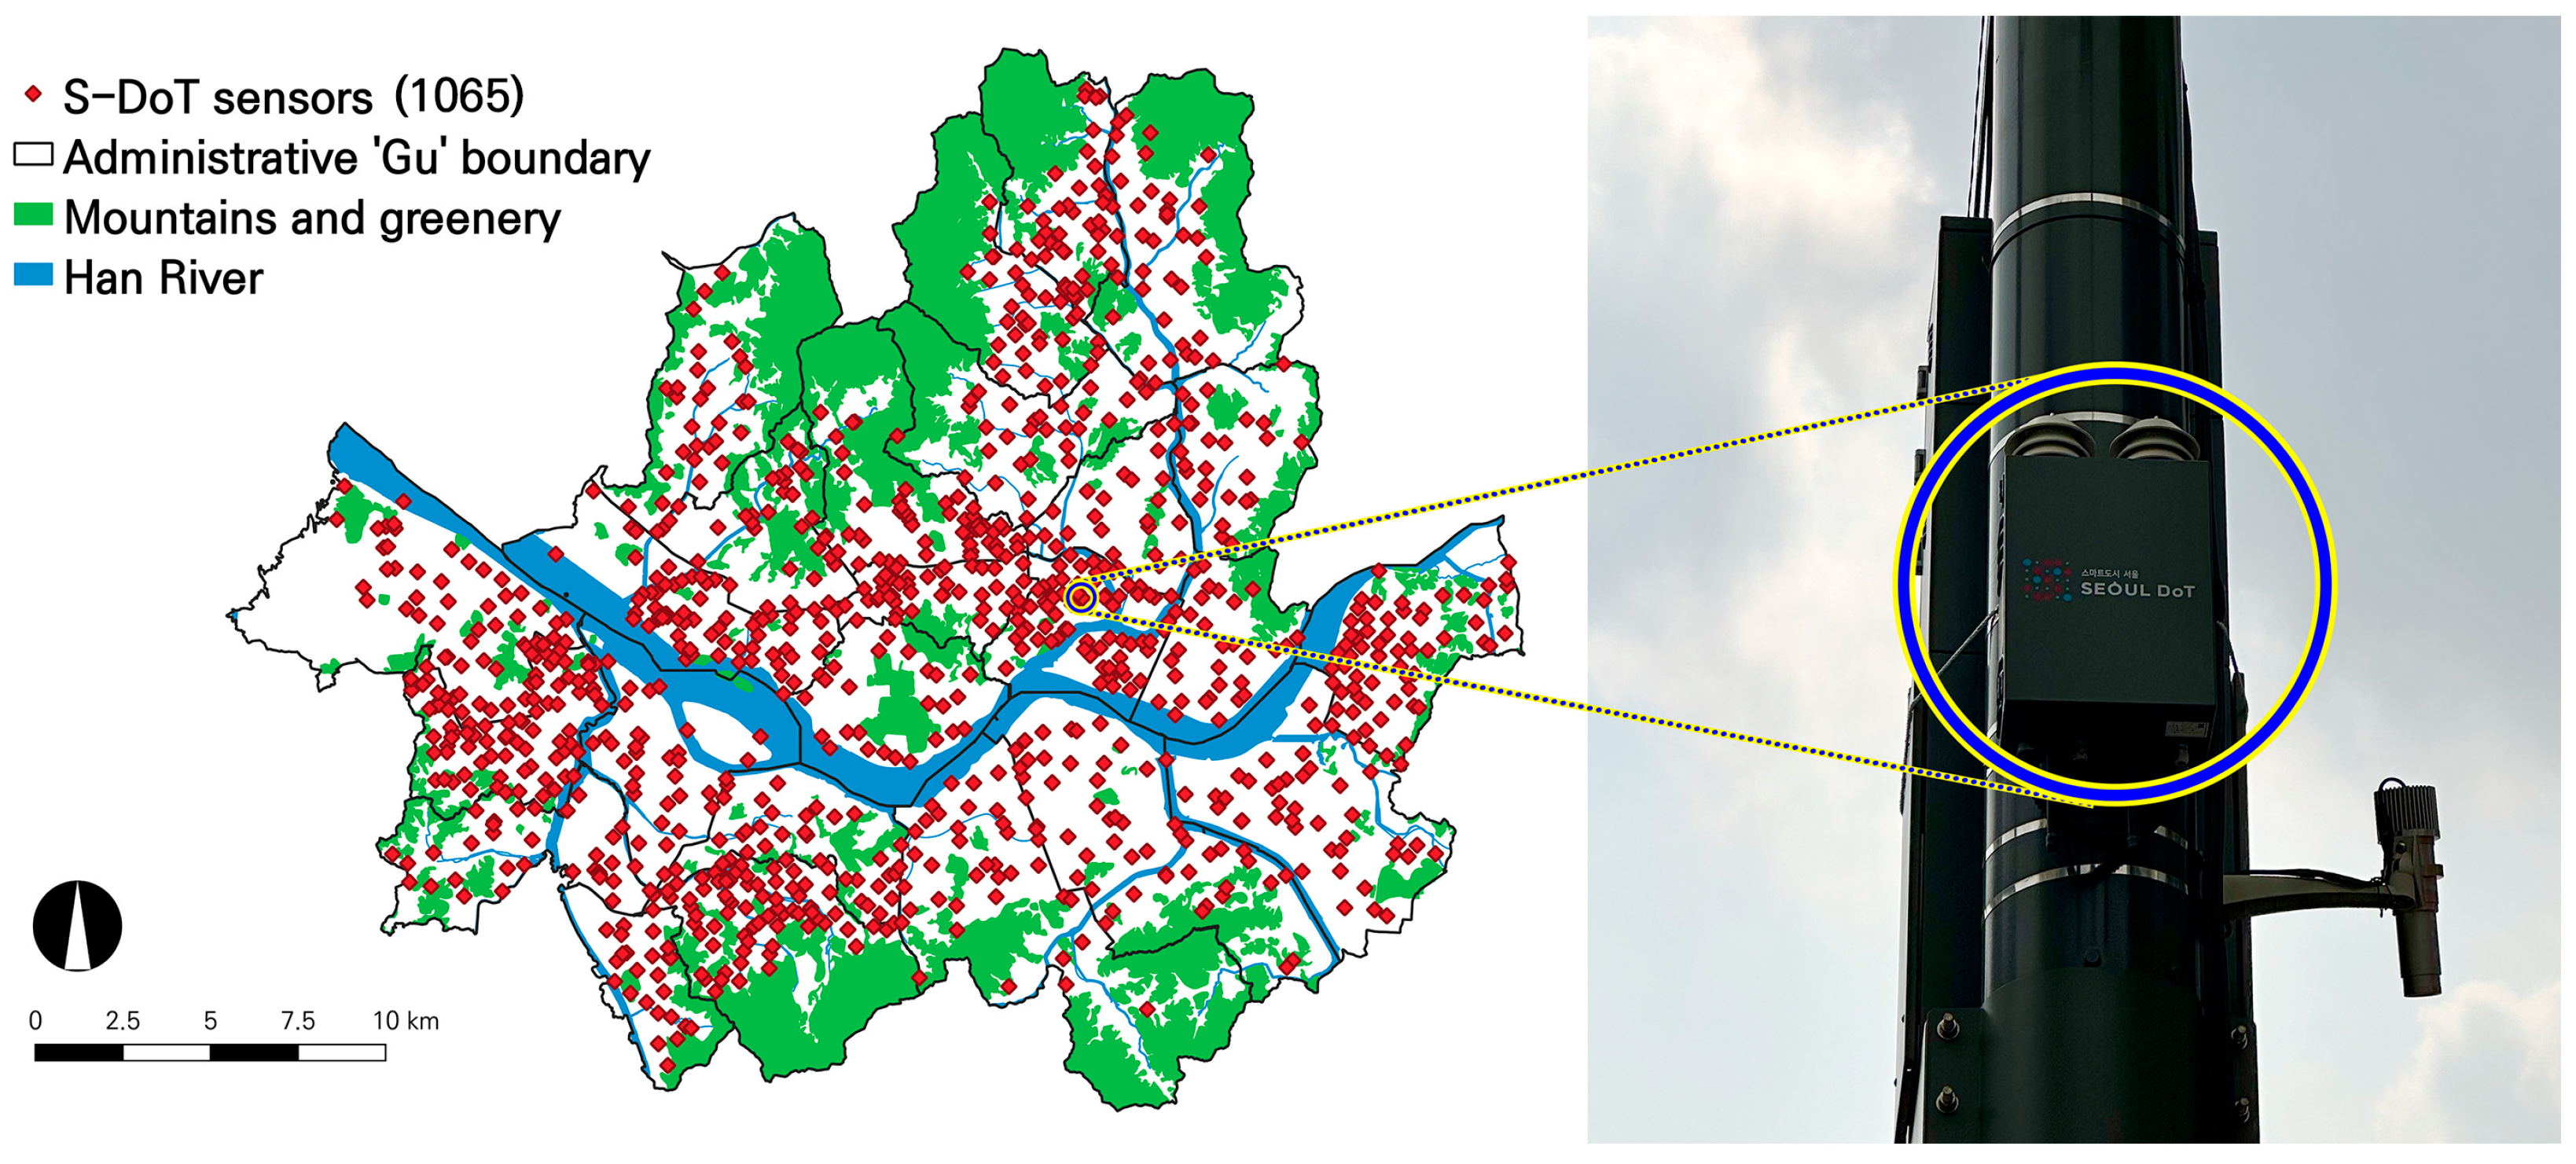
3.2. Data Collection
3.3. Analysis Method
4. Results
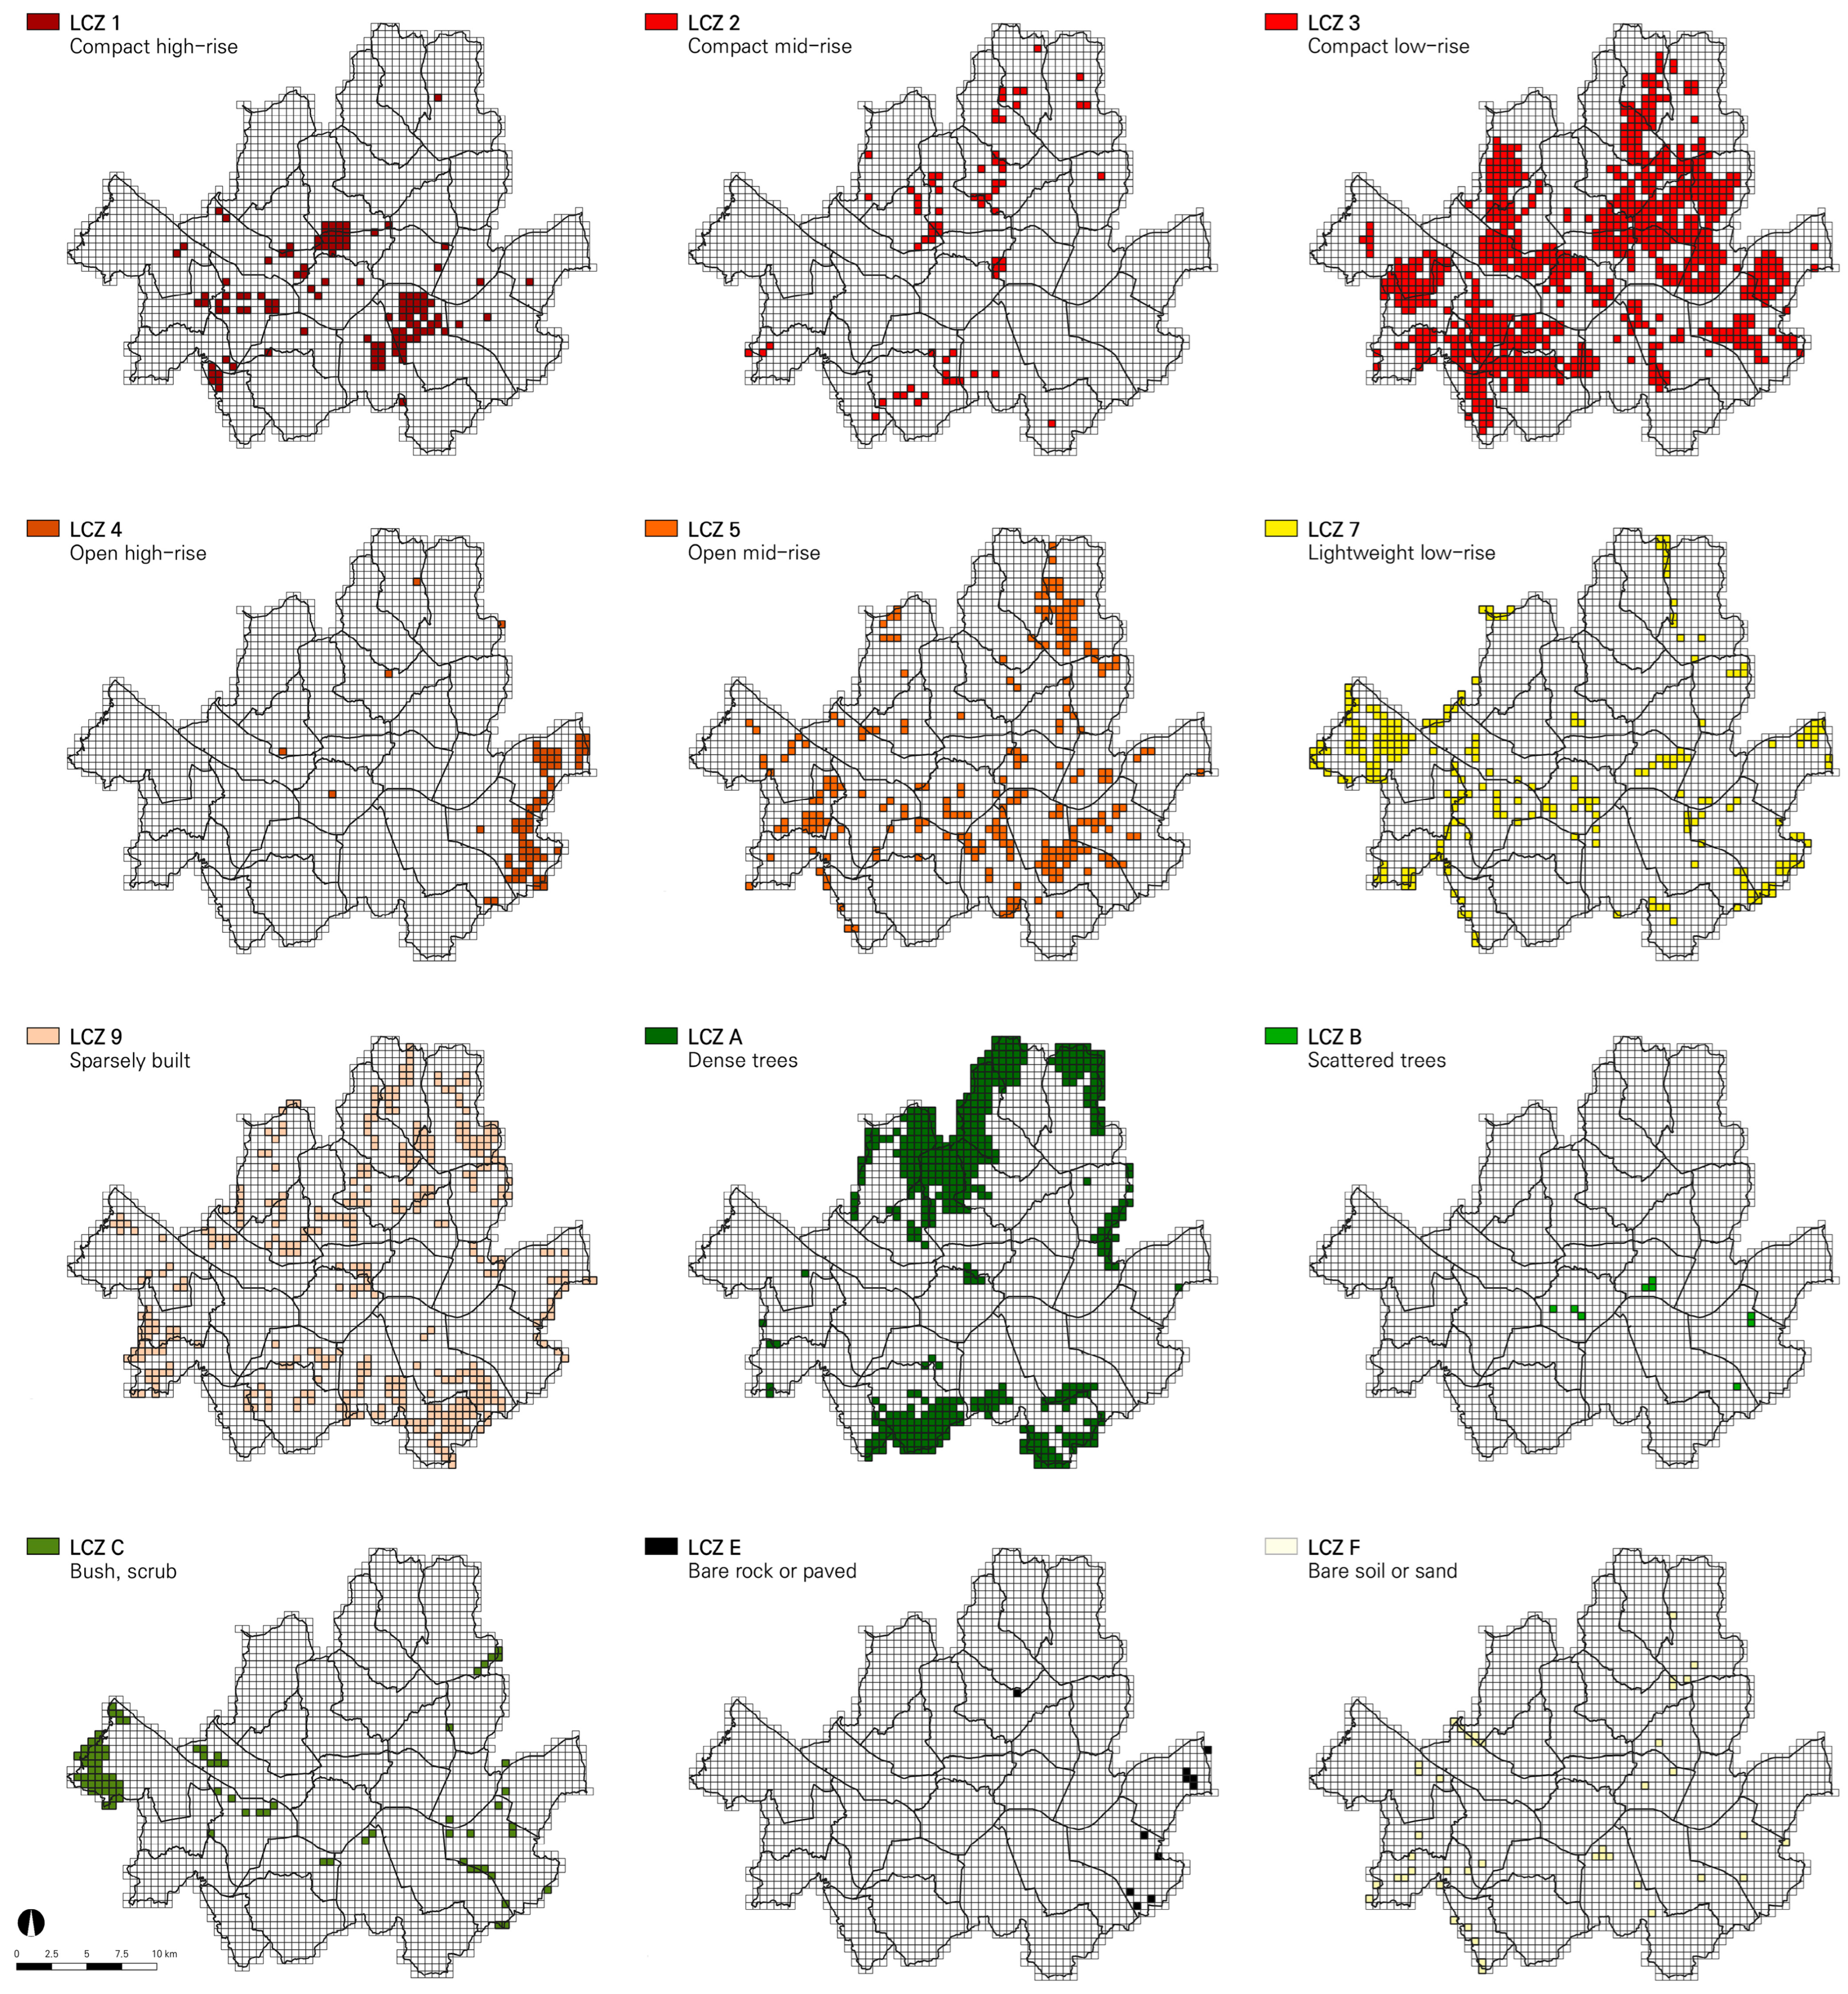
4.1. Critical Research on Local Climate Zones
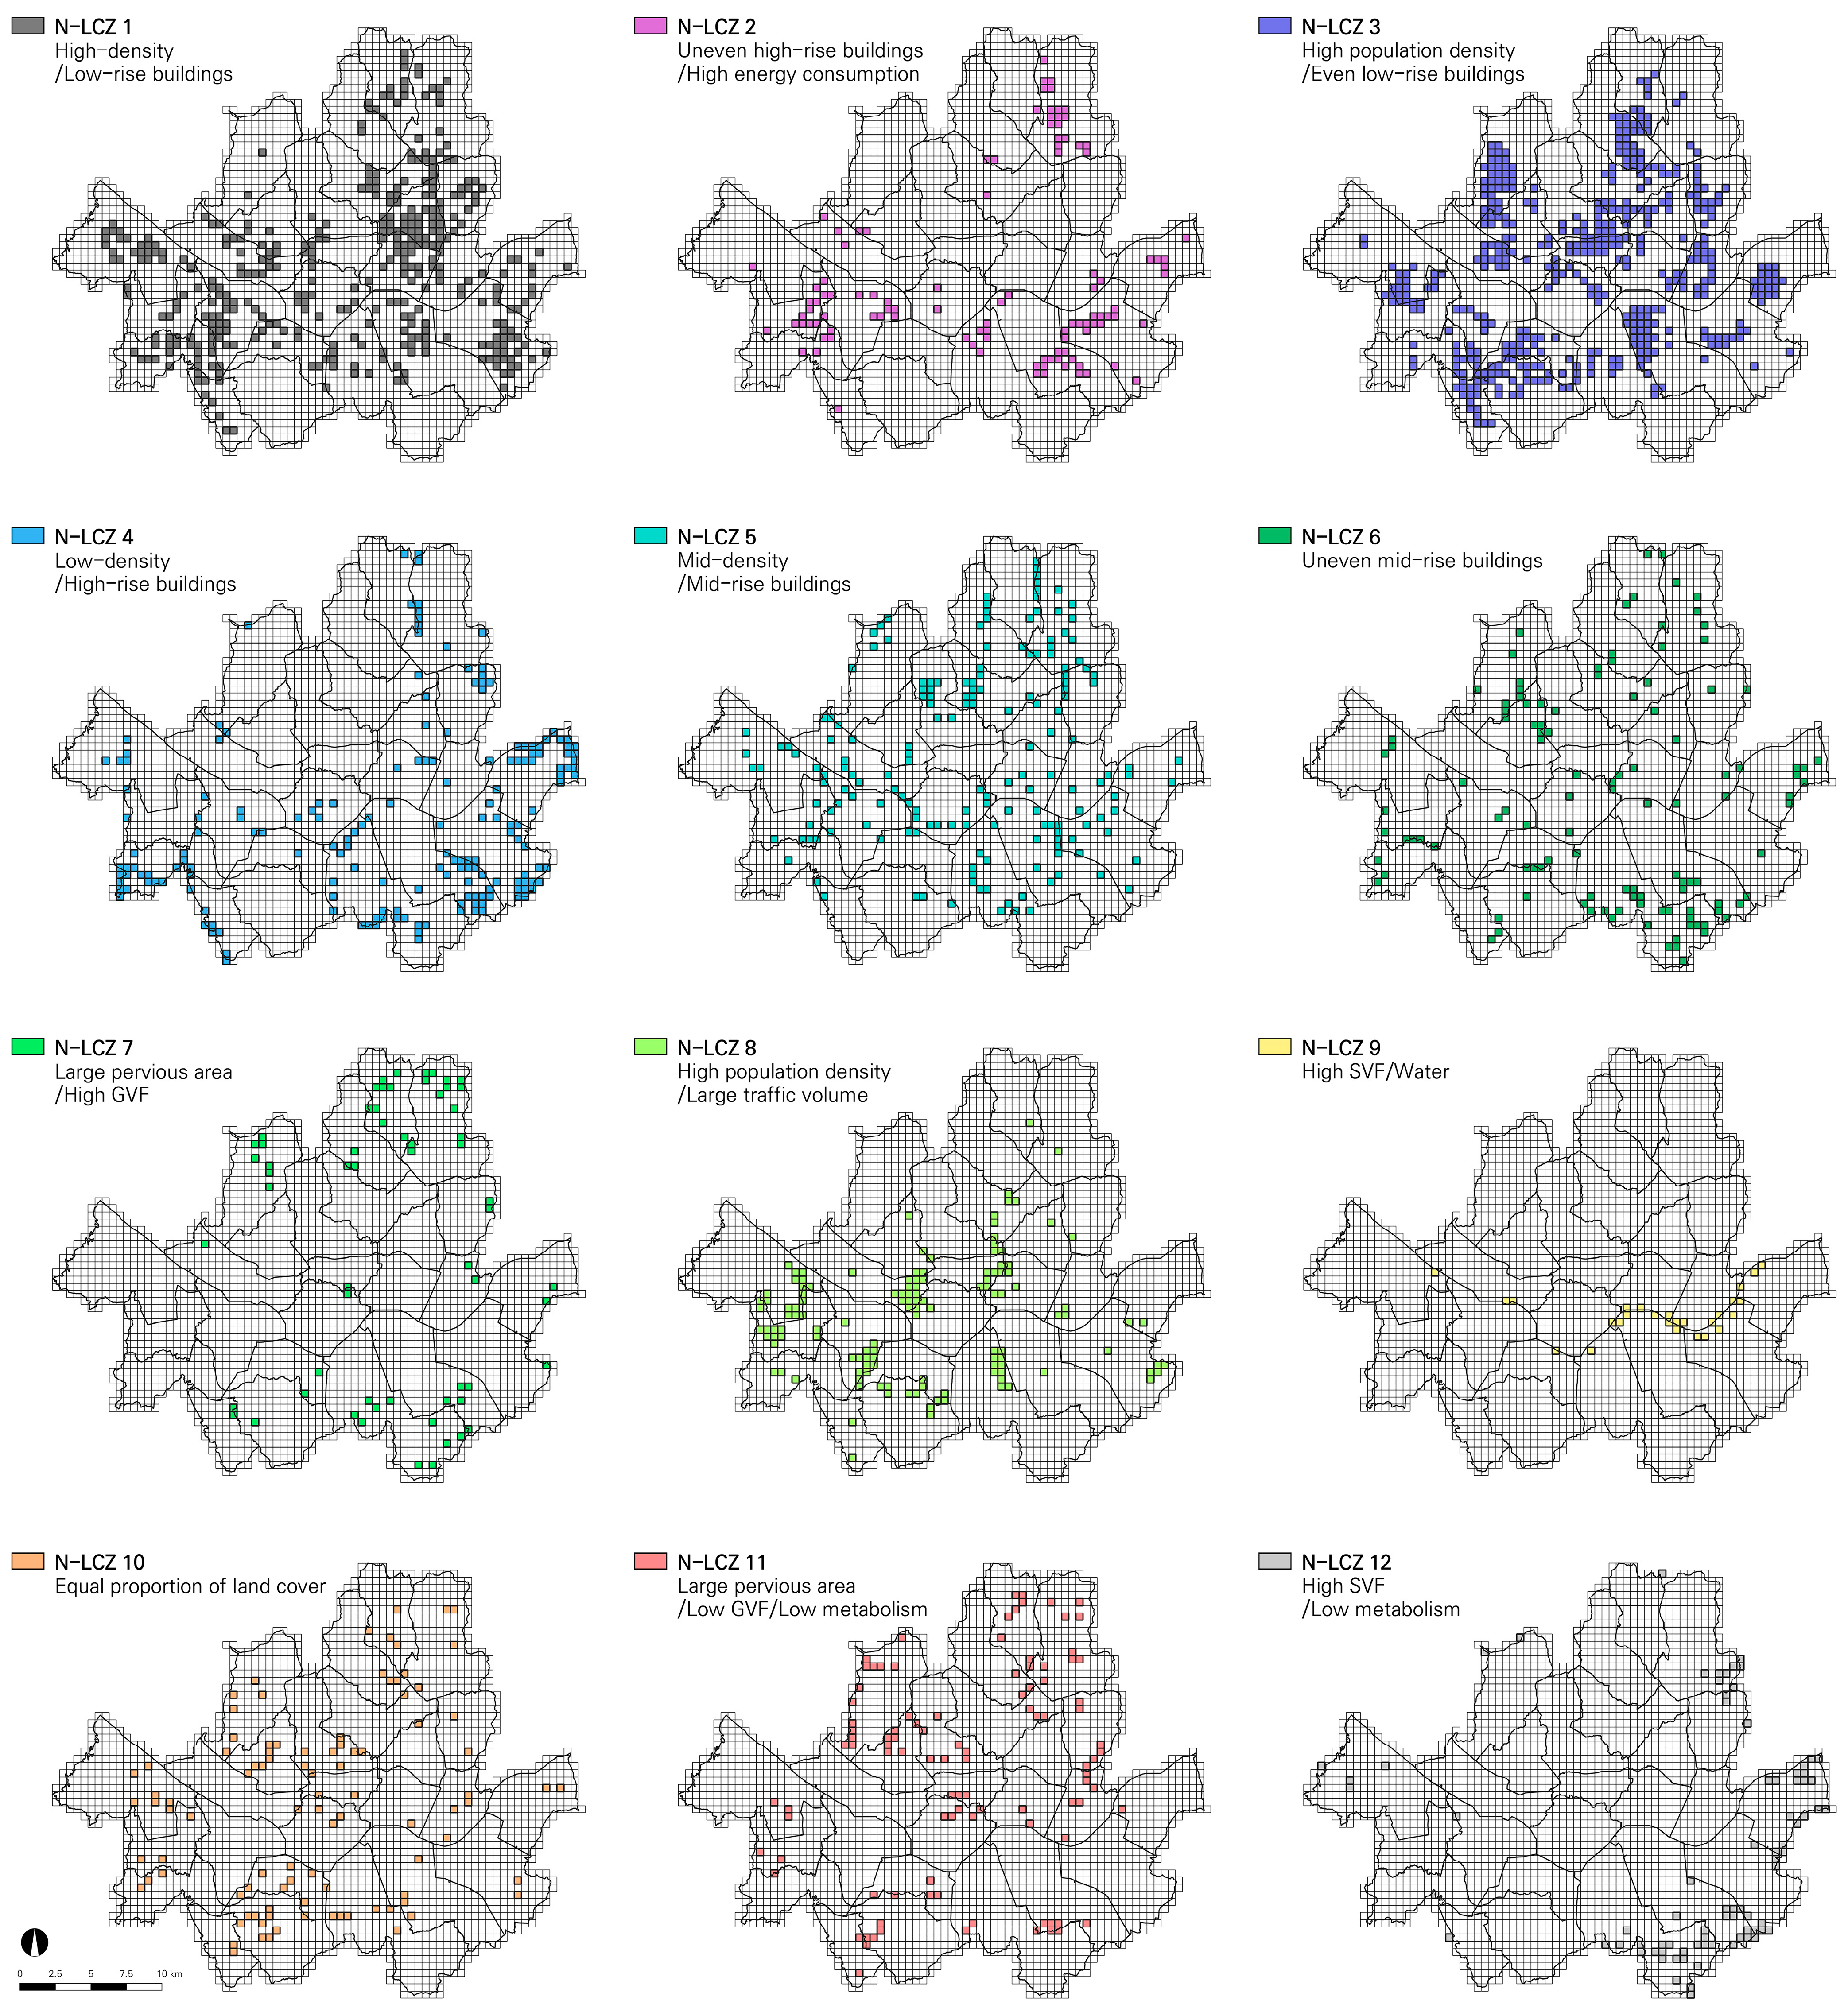
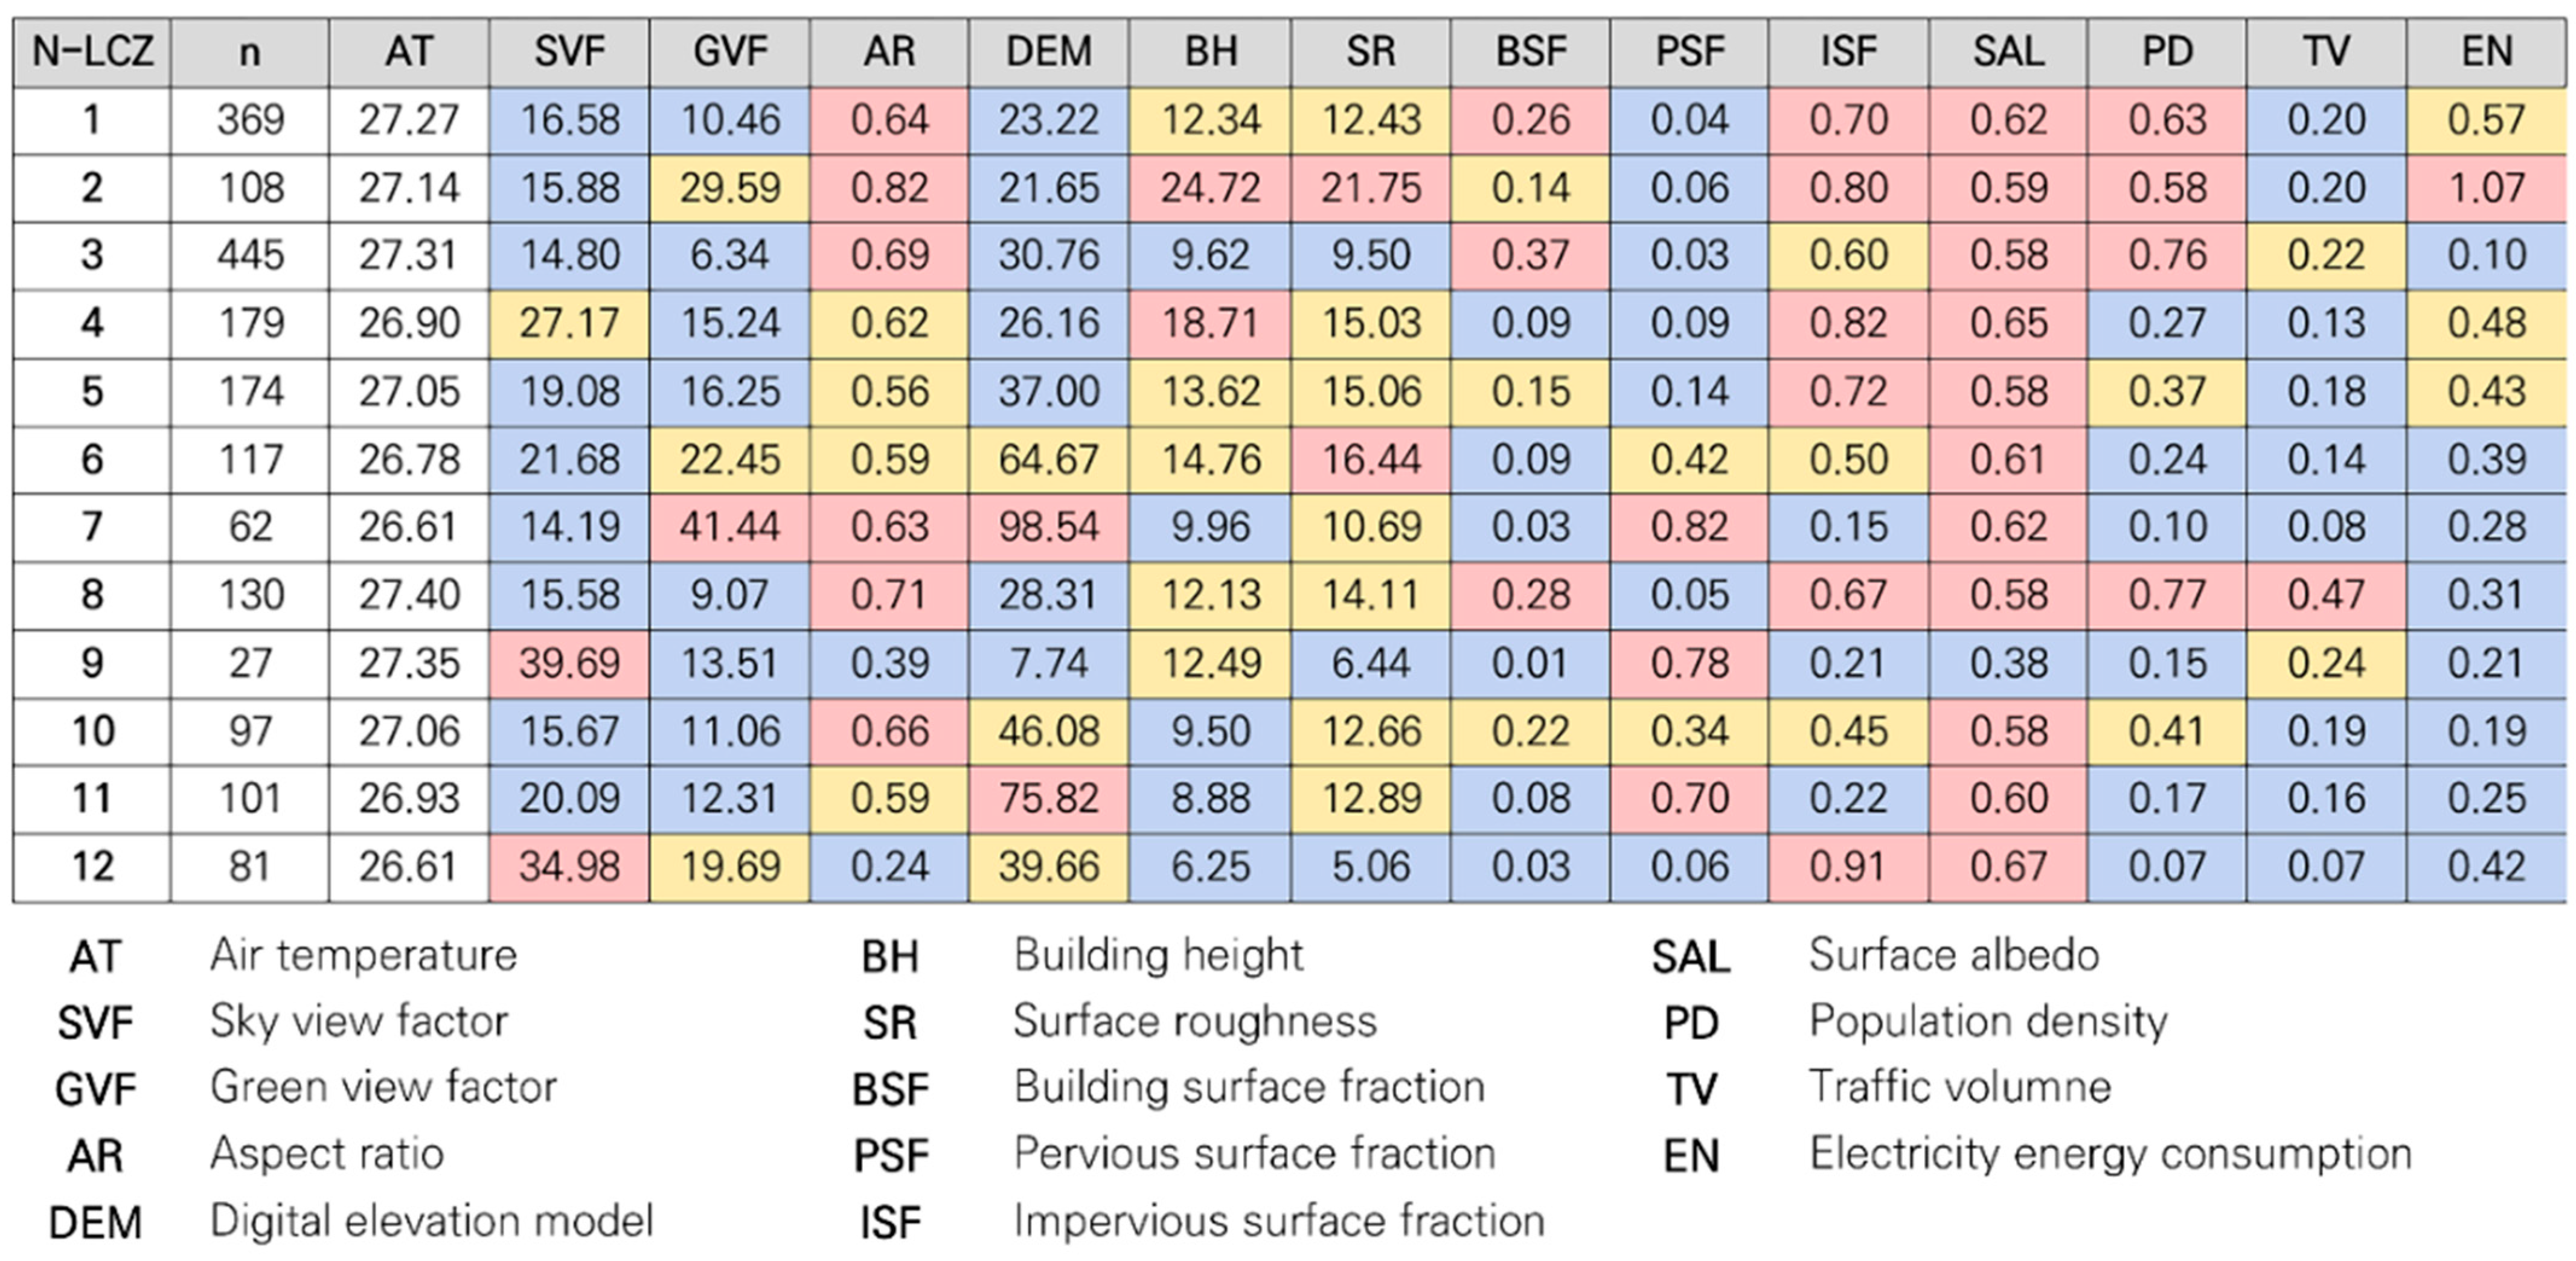
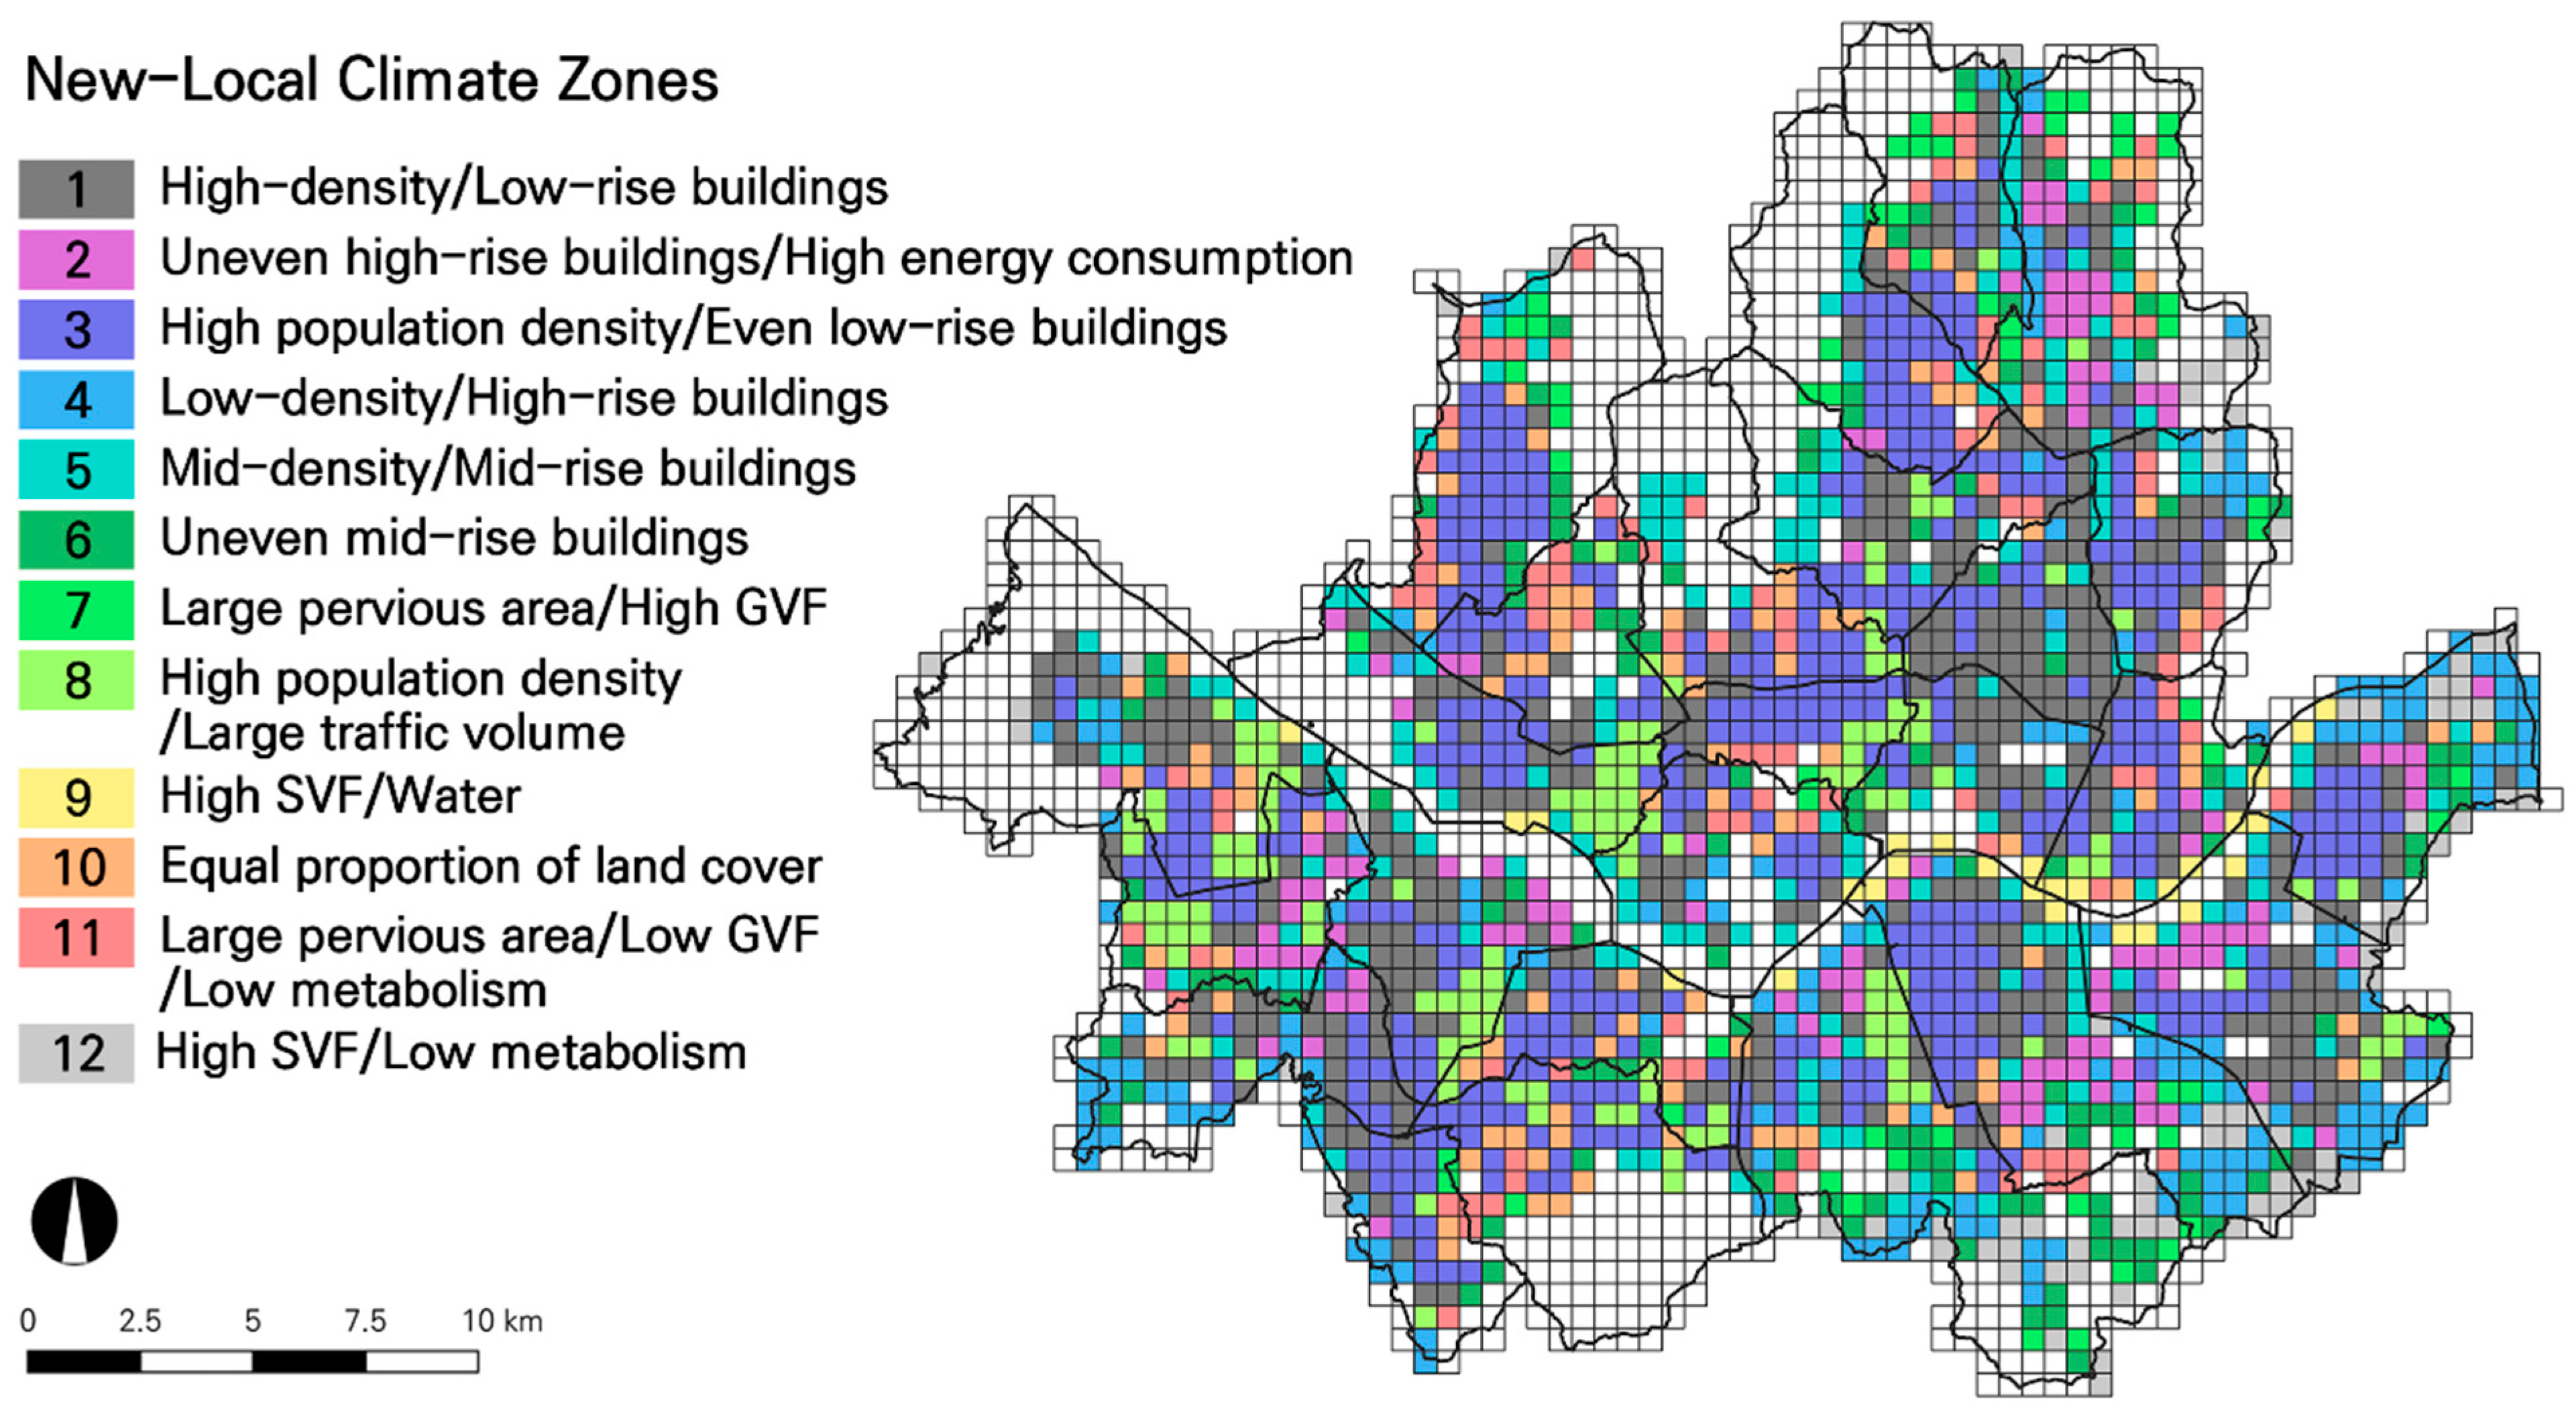
4.2. New Local Climate Zone System Development
5. Discussion
5.1. Consistency between Urban Type Attributes and Spatial Distribution
5.2. The Significance of Urban Metabolism
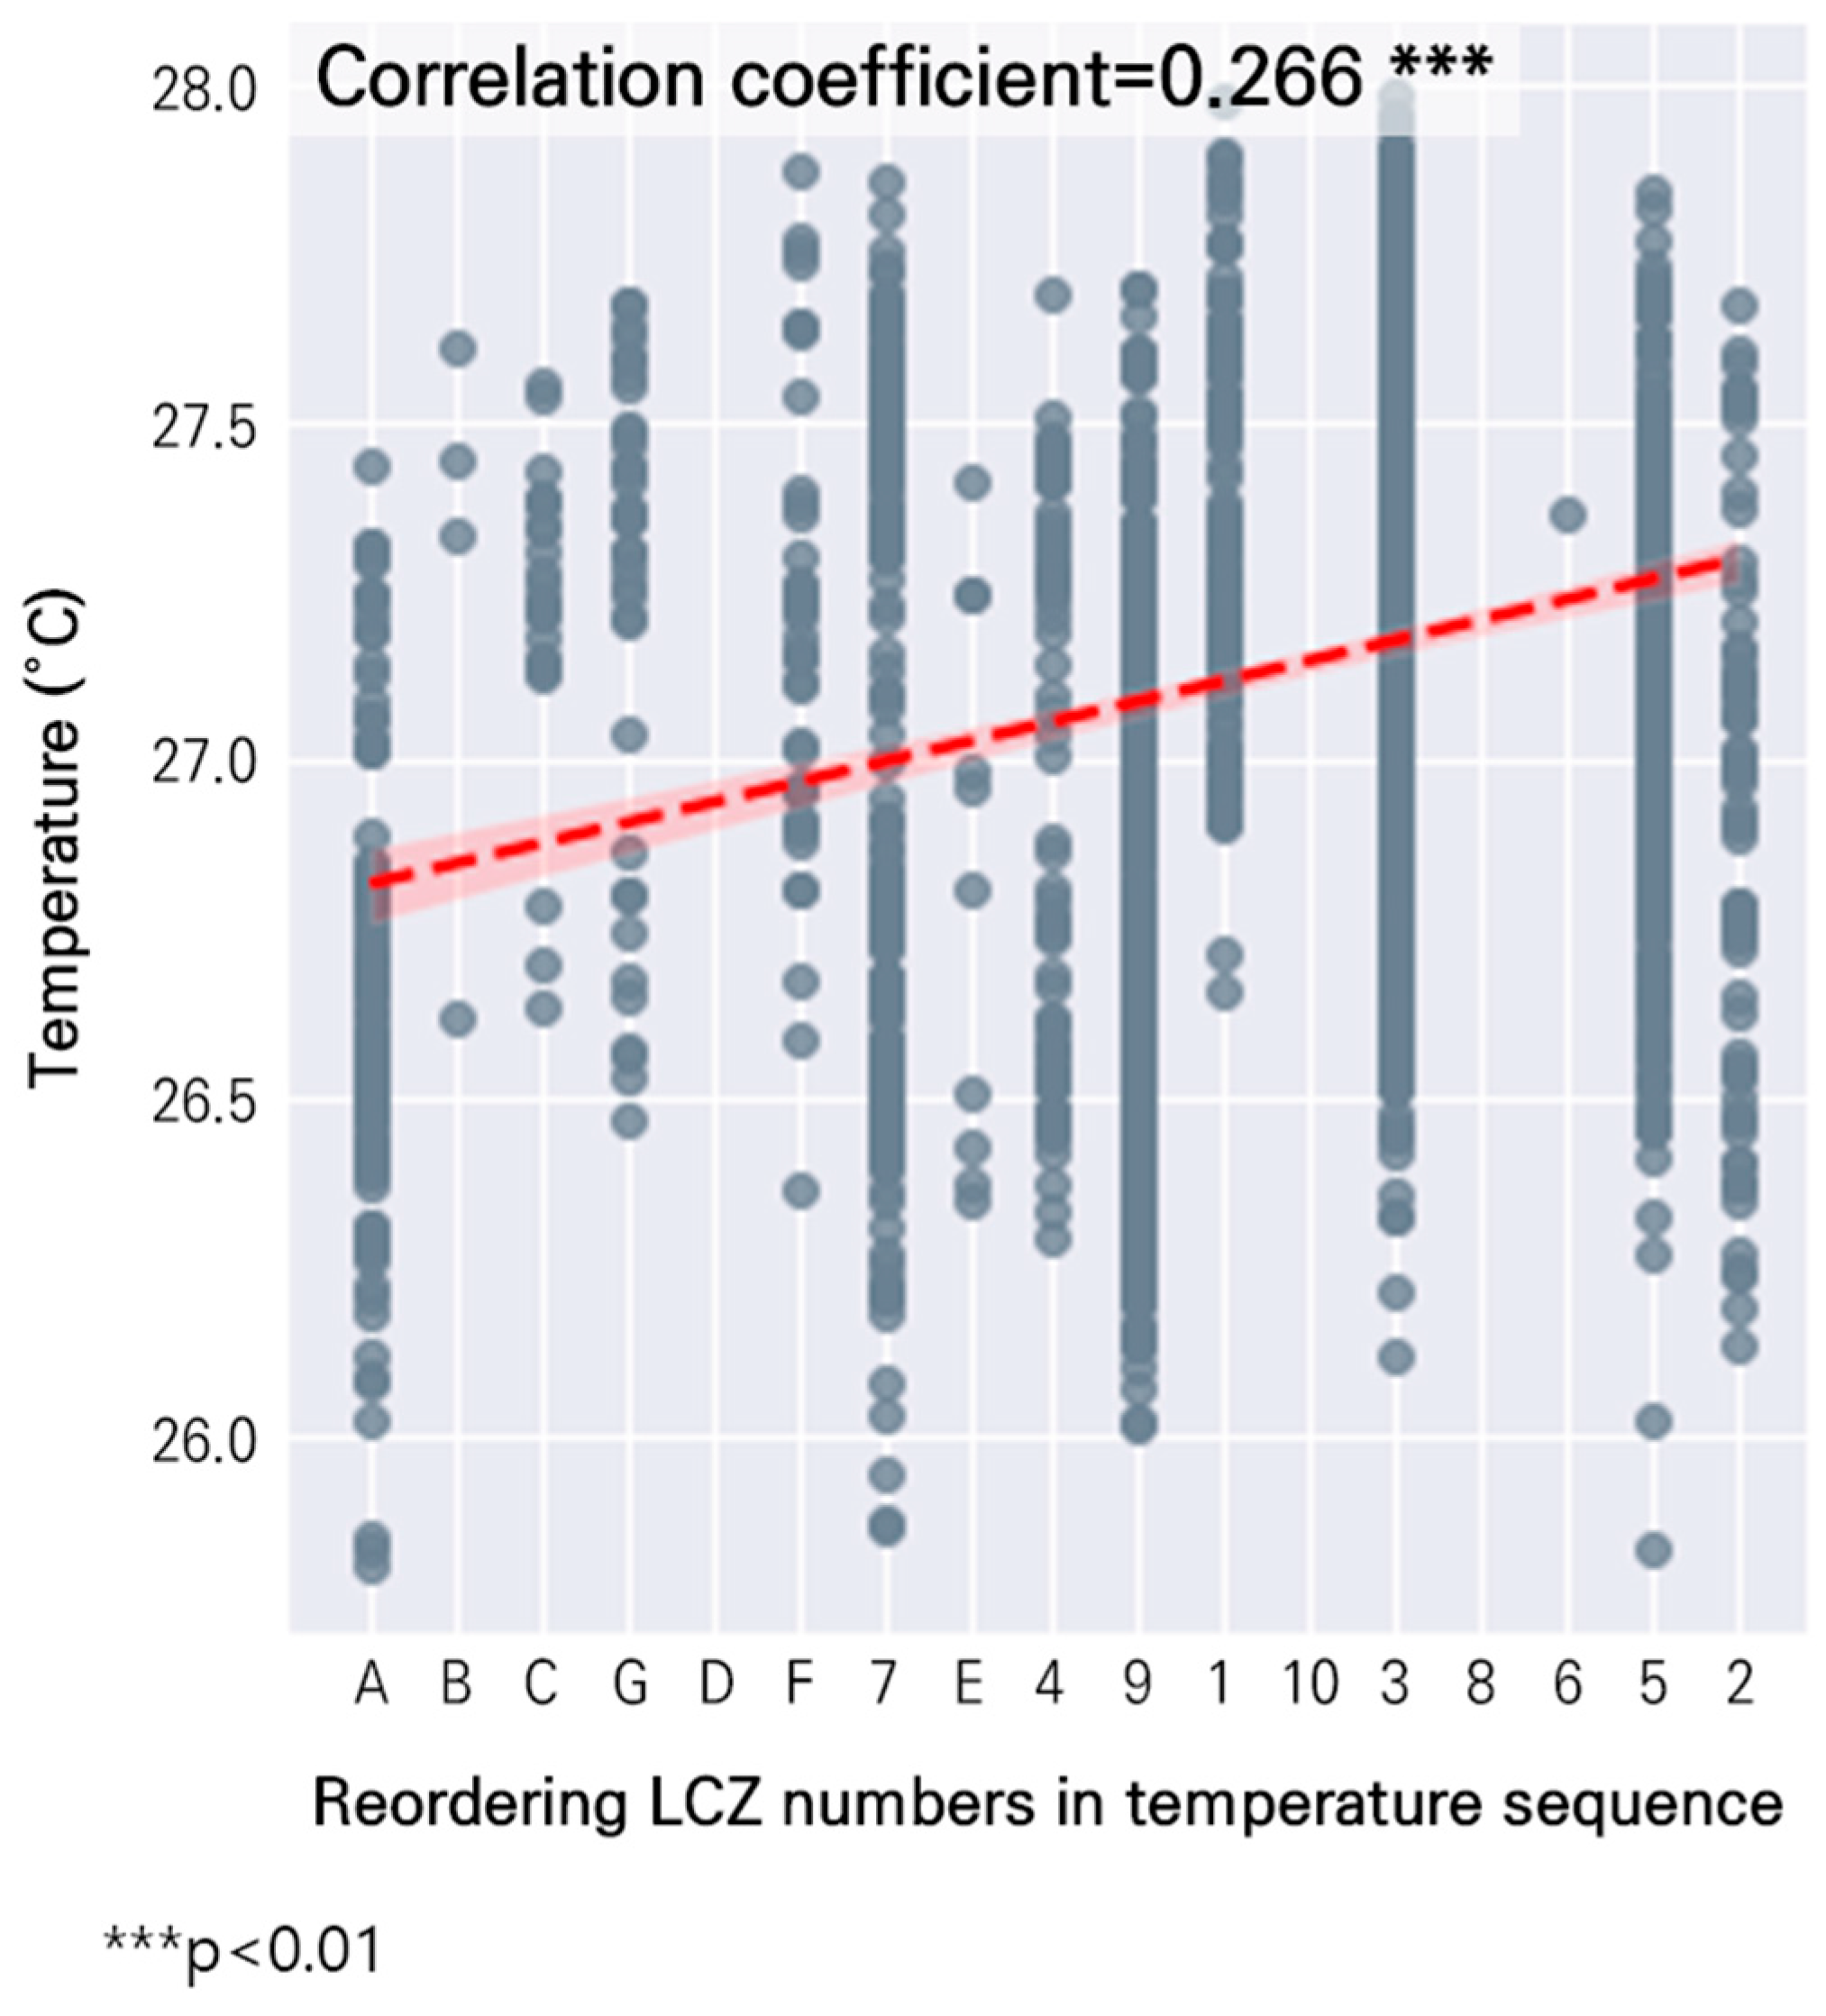
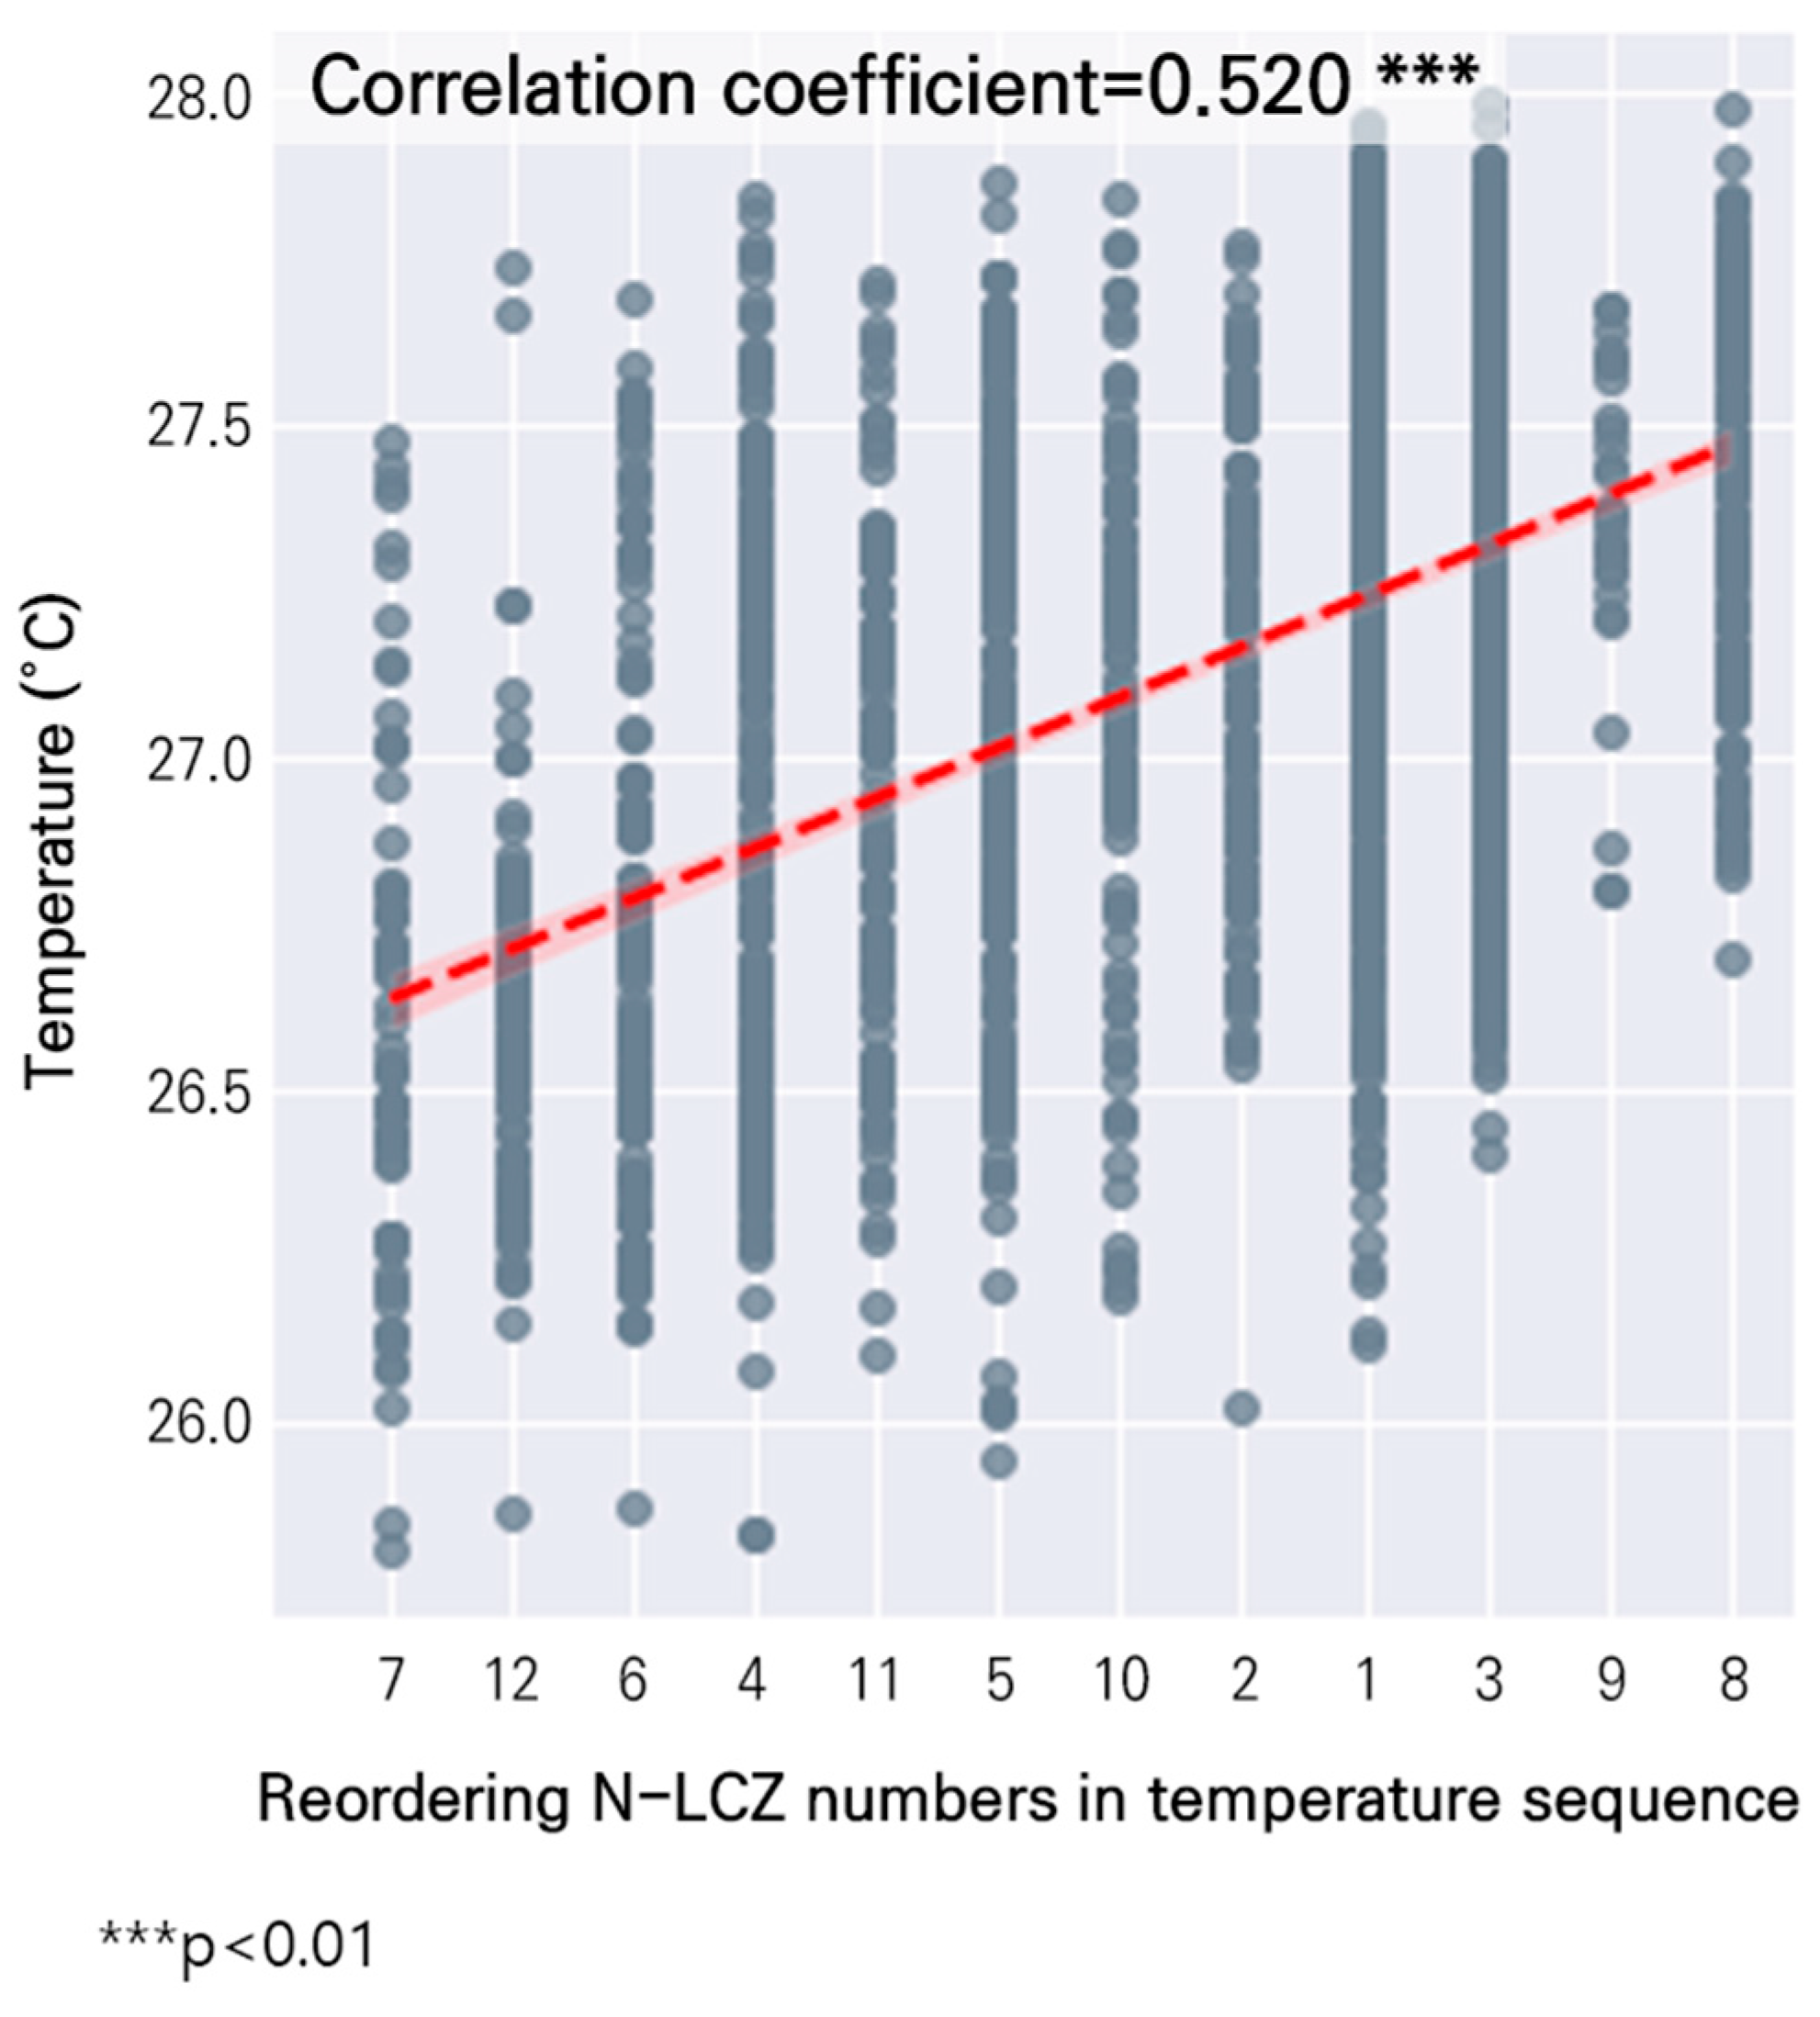
5.3. Microscale Analysis of Urban Thermal Environments
5.4. Limitations of This Study and Further Research
6. Conclusions
Author Contributions
Funding
Data Availability Statement
Conflicts of Interest
Appendix A
Appendix B
References
- Zhou, X.; Chen, H. Impact of urbanization-related land use land cover changes and urban morphology changes on the urban heat island phenomenon. Sci. Total Environ. 2018, 635, 1467–1476. [Google Scholar] [CrossRef] [PubMed]
- Oh, K.; Hong, J. The relationship between urban spatial elements and the urban heat island effect. J. Urban Des. Inst. Korea 2005, 6, 47–63. [Google Scholar]
- Monteiro, A.; Ankrah, J.; Madureira, H.; Pacheco, M.O. Climate risk mitigation and adaptation concerns in urban areas: A systematic review of the impact of IPCC assessment reports. Climate 2022, 10, 115. [Google Scholar] [CrossRef]
- Cha, S.; Oh, K. The Impact of the Geometry of Urban Residential Street Canyons on Thermal Comfort-Based on a Decision Tree Analysis Method. J. Archit. Inst. Korea 2020, 36, 187–198. [Google Scholar]
- Ngarambe, J.; Oh, J.W.; Su, M.A.; Santamouris, M.; Yun, G.Y. Influences of wind speed, sky conditions, land use and land cover characteristics on the magnitude of the urban heat island in Seoul: An exploratory analysis. Sustain. Cities Soc. 2021, 71, 102953. [Google Scholar] [CrossRef]
- Cui, D.; Liang, S.; Wang, D. Observed and projected changes in global climate zones based on Köppen climate classification. Wiley Interdiscip. Rev. Clim. Chang. 2021, 12, e701. [Google Scholar] [CrossRef]
- Stewart, I.D.; Oke, T.R. Local climate zones for urban temperature studies. Bull. Am. Meteorol. Soc. 2012, 93, 1879–1900. [Google Scholar] [CrossRef]
- Quan, S.J.; Bansal, P. A systematic review of GIS-based local climate zone mapping studies. Build. Environ. 2021, 196, 107791. [Google Scholar] [CrossRef]
- Brousse, O.; Georganos, S.; Demuzere, M.; Vanhuysse, S.; Wouters, H.; Wolff, E.; Linard, C.; Lipzig, N.; Dujardin, S. Using local climate zones in Sub-Saharan Africa to tackle urban health issues. Urban Clim. 2019, 27, 227–242. [Google Scholar] [CrossRef]
- Chen, Y.C.; Lo, T.W.; Shih, W.Y.; Lin, T.P. Interpreting air temperature generated from urban climatic map by urban morphology in Taipei. Theor. Appl. Climatol. 2019, 137, 2657–2662. [Google Scholar] [CrossRef]
- Huang, F.; Jiang, S.; Zhan, W.; Bechtel, B.; Liu, Z.; Demuzere, M.; Huang, Y.; Xu, Y.; Ma, L.; Xia, W.; et al. Mapping local climate zones for cities: A large review. Remote Sens. Environ. 2023, 292, 113573. [Google Scholar] [CrossRef]
- Xie, J.; Zhou, S.; Chung, L.C.H.; Chan, T.O. Evaluating land-surface warming and cooling environments across urban–rural local climate zone gradients in subtropical megacities. Build. Environ. 2024, 251, 111232. [Google Scholar] [CrossRef]
- Lyu, T.; Buccolieri, R.; Gao, Z. A numerical study on the correlation between sky view factor and summer microclimate of local climate zones. Atmosphere 2019, 10, 438. [Google Scholar] [CrossRef]
- Oke, T.R. Street design and urban canopy layer climate. Energy Build. 1988, 11, 103–113. [Google Scholar] [CrossRef]
- Lin, P.; Gou, Z.; Lau, S.S.Y.; Qin, H. The impact of urban design descriptors on outdoor thermal environment: A literature review. Energies 2017, 10, 2151. [Google Scholar] [CrossRef]
- Houet, T.; Pigeon, G. Mapping urban climate zones and quantifying climate behaviors–an application on Toulouse urban area (France). Environ. Pollut. 2011, 159, 2180–2192. [Google Scholar] [CrossRef] [PubMed]
- Javanroodi, K.; Perera, A.T.D.; Hong, T.; Nik, V.M. Designing climate resilient energy systems in complex urban areas considering urban morphology: A technical review. Adv. Appl. Energy 2023, 12, 100155. [Google Scholar] [CrossRef]
- Hou, H.; Su, H.; Yao, C.; Wang, Z.H. Spatiotemporal patterns of the impact of surface roughness and morphology on urban heat island. Sustain. Cities Soc. 2023, 92, 104513. [Google Scholar] [CrossRef]
- Davenport, A.G.; Grimmond, C.S.B.; Oke, T.R.; Wieringa, J. Estimating the roughness of cities and sheltered country. In Proceedings of the Preprints, 12th Conference on Applied Climatology, Asheville, NC, USA, 8–11 May 2000; American Meteorological Society: Boston, MA, USA, 2000; pp. 96–99. [Google Scholar]
- Ng, E.; Yuan, C.; Chen, L.; Ren, C.; Fung, J.C. Improving the wind environment in high-density cities by understanding urban morphology and surface roughness: A study in Hong Kong. Landsc. Urban Plan. 2011, 101, 59–74. [Google Scholar] [CrossRef]
- Leconte, F.; Bouyer, J.; Claverie, R.; Pétrissans, M. Using Local Climate Zone scheme for UHI assessment: Evaluation of the method using mobile measurements. Build. Environ. 2015, 83, 39–49. [Google Scholar] [CrossRef]
- Rodler, A.; Leduc, T. Local climate zone approach on local and micro scales: Dividing the urban open space. Urban Clim. 2019, 28, 100457. [Google Scholar] [CrossRef]
- Yan, J.; Chen, W.Y.; Zhang, Z.; Zhao, W.; Liu, M.; Yin, S. Mitigating PM2.5 exposure with vegetation barrier and building designs in urban open-road environments based on numerical simulations. Landsc. Urban Plan. 2024, 241, 104918. [Google Scholar] [CrossRef]
- Zhang, J.; Li, Z.; Wei, Y.; Hu, D. The impact of the building morphology on microclimate and thermal comfort-a case study in Beijing. Build. Environ. 2022, 223, 109469. [Google Scholar] [CrossRef]
- Zhou, W.; Yu, W.; Zhang, Z.; Cao, W.; Wu, T. How can urban green spaces be planned to mitigate urban heat island effect under different climatic backgrounds? A threshold-based perspective. Sci. Total Environ. 2023, 890, 164422. [Google Scholar] [CrossRef] [PubMed]
- Robitu, M.; Musy, M.; Inard, C.; Groleau, D. Modeling the influence of vegetation and water pond on urban microclimate. Sol. Energy 2006, 80, 435–447. [Google Scholar] [CrossRef]
- Wimberly, M.C.; Davis, J.K.; Evans, M.V.; Hess, A.; Newberry, P.M.; Solano-Asamoah, N.; Murdock, C.C. Land cover affects microclimate and temperature suitability for arbovirus transmission in an urban landscape. PLoS Neglected Trop. Dis. 2020, 14, e0008614. [Google Scholar] [CrossRef]
- Zhang, Y.; Harris, A.; Balzter, H. Characterizing fractional vegetation cover and land surface temperature based on sub-pixel fractional impervious surfaces from Landsat TM/ETM+. Int. J. Remote Sens. 2015, 36, 4213–4232. [Google Scholar] [CrossRef]
- Khamchiangta, D.; Dhakal, S. Physical and non-physical factors driving urban heat island: Case of Bangkok Metropolitan Administration, Thailand. J. Environ. Manag. 2019, 248, 109285. [Google Scholar] [CrossRef]
- Du, P.; Chen, J.; Bai, X.; Han, W. Understanding the seasonal variations of land surface temperature in Nanjing urban area based on local climate zone. Urban Clim. 2020, 33, 100657. [Google Scholar] [CrossRef]
- Yu, W.; Yang, J.; Wu, F.; He, B.; Yu, H.; Ren, J.; Xiao, X.; Xia, J.C. Downscaling mapping method for local climate zones from the perspective of deep learning. Urban Clim. 2023, 49, 101500. [Google Scholar] [CrossRef]
- Dutta, K.; Basu, D.; Agrawal, S. Evaluation of seasonal variability in magnitude of urban heat islands using local climate zone classification and surface albedo. Int. J. Environ. Sci. Technol. 2022, 19, 8677–8698. [Google Scholar] [CrossRef]
- Yang, J.; Wang, Z.H.; Kaloush, K.E. Environmental impacts of reflective materials: Is high albedo a ‘silver bullet’ for mitigating urban heat island? Renew. Sustain. Energy Rev. 2015, 47, 830–843. [Google Scholar] [CrossRef]
- Ryu, Y.H.; Baik, J.J. Quantitative analysis of factors contributing to urban heat island intensity. J. Appl. Meteorol. Climatol. 2012, 51, 842–854. [Google Scholar] [CrossRef]
- Chen, Y.; Zheng, B.; Hu, Y. Mapping local climate zones using ArcGIS-based method and exploring land surface temperature characteristics in Chenzhou, China. Sustainability. 2020, 12, 2974. [Google Scholar] [CrossRef]
- Hidalgo, J.; Dumas, G.; Masson, V.; Petit, G.; Bechtel, B.; Bocher, E.; Foley, M.; Schoetter, R.; Mills, G. Comparison between local climate zones maps derived from administrative datasets and satellite observations. Urban Clim. 2019, 27, 64–89. [Google Scholar] [CrossRef]
- Fan, P.Y.; He, Q.; Tao, Y.Z. Identifying research progress, focuses, and prospects of local climate zone (LCZ) using bibliometrics and critical reviews. Heliyon 2023, 9, e14067. [Google Scholar] [CrossRef] [PubMed]
- Wolman, A. The metabolism of cities. Sci. Am. 1965, 213, 178–193. [Google Scholar] [CrossRef]
- Zhang, Y. Urban metabolism: A review of research methodologies. Environ. Pollut. 2013, 178, 463–473. [Google Scholar] [CrossRef]
- Currie, P.K.; Musango, J.K.; May, N.D. Urban metabolism: A review with reference to Cape Town. Cities 2017, 70, 91–110. [Google Scholar] [CrossRef]
- Wong, P.P.Y.; Lai, P.C.; Low, C.T.; Chen, S.; Hart, M. The impact of environmental and human factors on urban heat and microclimate variability. Build. Environ. 2016, 95, 199–208. [Google Scholar] [CrossRef]
- Barles, S. Society, energy and materials: The contribution of urban metabolism studies to sustainable urban development issues. J. Environ. Plan. Manag. 2010, 53, 439–455. [Google Scholar] [CrossRef]
- Liao, W.; Liu, X.; Wang, D.; Sheng, Y. The impact of energy consumption on the surface urban heat island in China’s 32 major cities. Remote Sens. 2017, 9, 250. [Google Scholar] [CrossRef]
- Li, N.; Quan, S.J. Identifying urban form typologies in Seoul using a new Gaussian mixture model-based clustering framework. Environ. Plan. B Urban Anal. City Sci. 2023, 50, 2333–2620. [Google Scholar] [CrossRef]
- Zheng, Y.; Ren, C.; Xu, Y.; Wang, R.; Ho, J.; Lau, K.; Ng, E. GIS-based mapping of Local Climate Zone in the high-density city of Hong Kong. Urban Clim. 2018, 24, 419–448. [Google Scholar] [CrossRef]
- Kim, J.; Kang, M. A study on the micro-scale heat wave vulnerability assessment using urban data sensors (S-DoT) in Seoul. J. Korea Plan. Assoc. 2022, 57, 215–234. [Google Scholar] [CrossRef]
- Demuzere, M.; Kittner, J.; Bechtel, B. LCZ Generator: A web application to create Local Climate Zone maps. Front. Environ. Sci. 2021, 9, 637455. [Google Scholar] [CrossRef]
- Biswas, G.; Roy, T.K. Measuring Objective Walkability from Pedestrian-Level Visual Perception Using Machine Learning and GSV in Khulna, Bangladesh. Geomat. Environ. Eng. 2023, 17, 5–27. [Google Scholar] [CrossRef]
- Xia, Y.; Yabuki, N.; Fukuda, T. Sky view factor estimation from street view images based on semantic segmentation. Urban Clim. 2021, 40, 100999. [Google Scholar] [CrossRef]
- Nassar, A.; Blackburn, G.; Whyatt, J. Dynamics and controls of urban heat sink and island phenomena in a desert city: Development of a local climate zone scheme using remotely-sensed inputs. Int. J. Appl. Earth Obs. Geoinf. 2016, 51, 76–90. [Google Scholar] [CrossRef]
- Wu, J.; Liu, C.; Wang, H. Analysis of Spatio-temporal patterns and related factors of thermal comfort in subtropical coastal cities based on local climate zones. Build. Environ. 2022, 207, 108568. [Google Scholar] [CrossRef]
- Park, C.; Ha, J.; Lee, S. Association between Three-Dimensional Built Environment and Urban Air Temperature: Focused on Seasonal and Temporal Differences. Sustainability 2017, 9, 1338. [Google Scholar] [CrossRef]
- Murtagh, F.; Contreras, P. Algorithms for hierarchical clustering: An overview. Wiley Interdiscip. Rev. Data Min. Knowl. Discov. 2012, 2, 86–97. [Google Scholar] [CrossRef]
- Liu, N.; Xu, Z.; Zeng, X.J.; Ren, P. An agglomerative hierarchical clustering algorithm for linear ordinal rankings. Inf. Sci. 2021, 557, 170–193. [Google Scholar] [CrossRef]
- Park, N.; Ko, H. Agglomerative hierarchical clustering analysis with deep convolutional autoencoders. J. Korea Multimed. Soc. 2020, 23, 1–7. [Google Scholar]
- Jeong, N.; Lee, J. Hierarchical clustering on international research trends of translation studies-focusing on routledge publications. J. Humanit. Soc. Sci. 21 2022, 13, 1493–1506. [Google Scholar] [CrossRef]
- Yang, J.; Wang, Y.; Xiu, C.; Xiao, X.; Xia, J.; Jin, C. Optimizing local climate zones to mitigate urban heat island effect in human settlements. J. Clean. Prod. 2020, 275, 123767. [Google Scholar] [CrossRef]
- Bechtel, B.; Demuzere, M.; Mills, G.; Zhan, W.; Sismanidis, P.; Small, C.; Voogt, J. SUHI analysis using Local Climate Zones—A comparison of 50 cities. Urban Clim. 2019, 28, 100451. [Google Scholar] [CrossRef]
- Deborah, L.J.; Baskaran, R.; Kannan, A. A survey on internal validity measure for cluster validation. Int. J. Comput. Sci. Eng. Surv. 2010, 1, 85–102. [Google Scholar] [CrossRef]
- Kim, M.; Ramakrishna, R.S. New indices for cluster validity assessment. Pattern Recognit. Lett. 2005, 26, 2353–2363. [Google Scholar] [CrossRef]
- Ki, D.; Lee, S. Analyzing the effects of Green View Index of neighborhood streets on walking time using Google Street View and deep learning. Landsc. Urban Plan. 2021, 205, 103920. [Google Scholar] [CrossRef]
- Buyantuyev, A.; Wu, J. Urban heat islands and landscape heterogeneity: Linking spatiotemporal variations in surface temperatures to land-cover and socioeconomic patterns. Landsc. Ecol. 2010, 25, 17–33. [Google Scholar] [CrossRef]
- Jenerette, G.D.; Harlan, S.L.; Buyantuev, A.; Stefanov, W.L.; Declet-Barreto, J.; Ruddell, B.L.; Myint, S.W.; Kaplan, S.; Li, X. Micro-scale urban surface temperatures are related to land-cover features and residential heat related health impacts in Phoenix, AZ USA. Landsc. Ecol. 2016, 31, 745–760. [Google Scholar] [CrossRef]


| Smart Seoul Data of Things (S-Dot) Sensors | Spatial Resolution | 1065 Stations |
| Temporal Resolution | One Hour | |
| Usage | Air Temperature | |
| Year | 2021 | |
| Acquisition date | 6/1–8/31 (total 92 days) | |
| Variables | Description | Sources | ||
|---|---|---|---|---|
| Microclimate | Air temperature (°C) | The average air temperature in the analysis unit * | Seoul Open Data Plaza (2021) | |
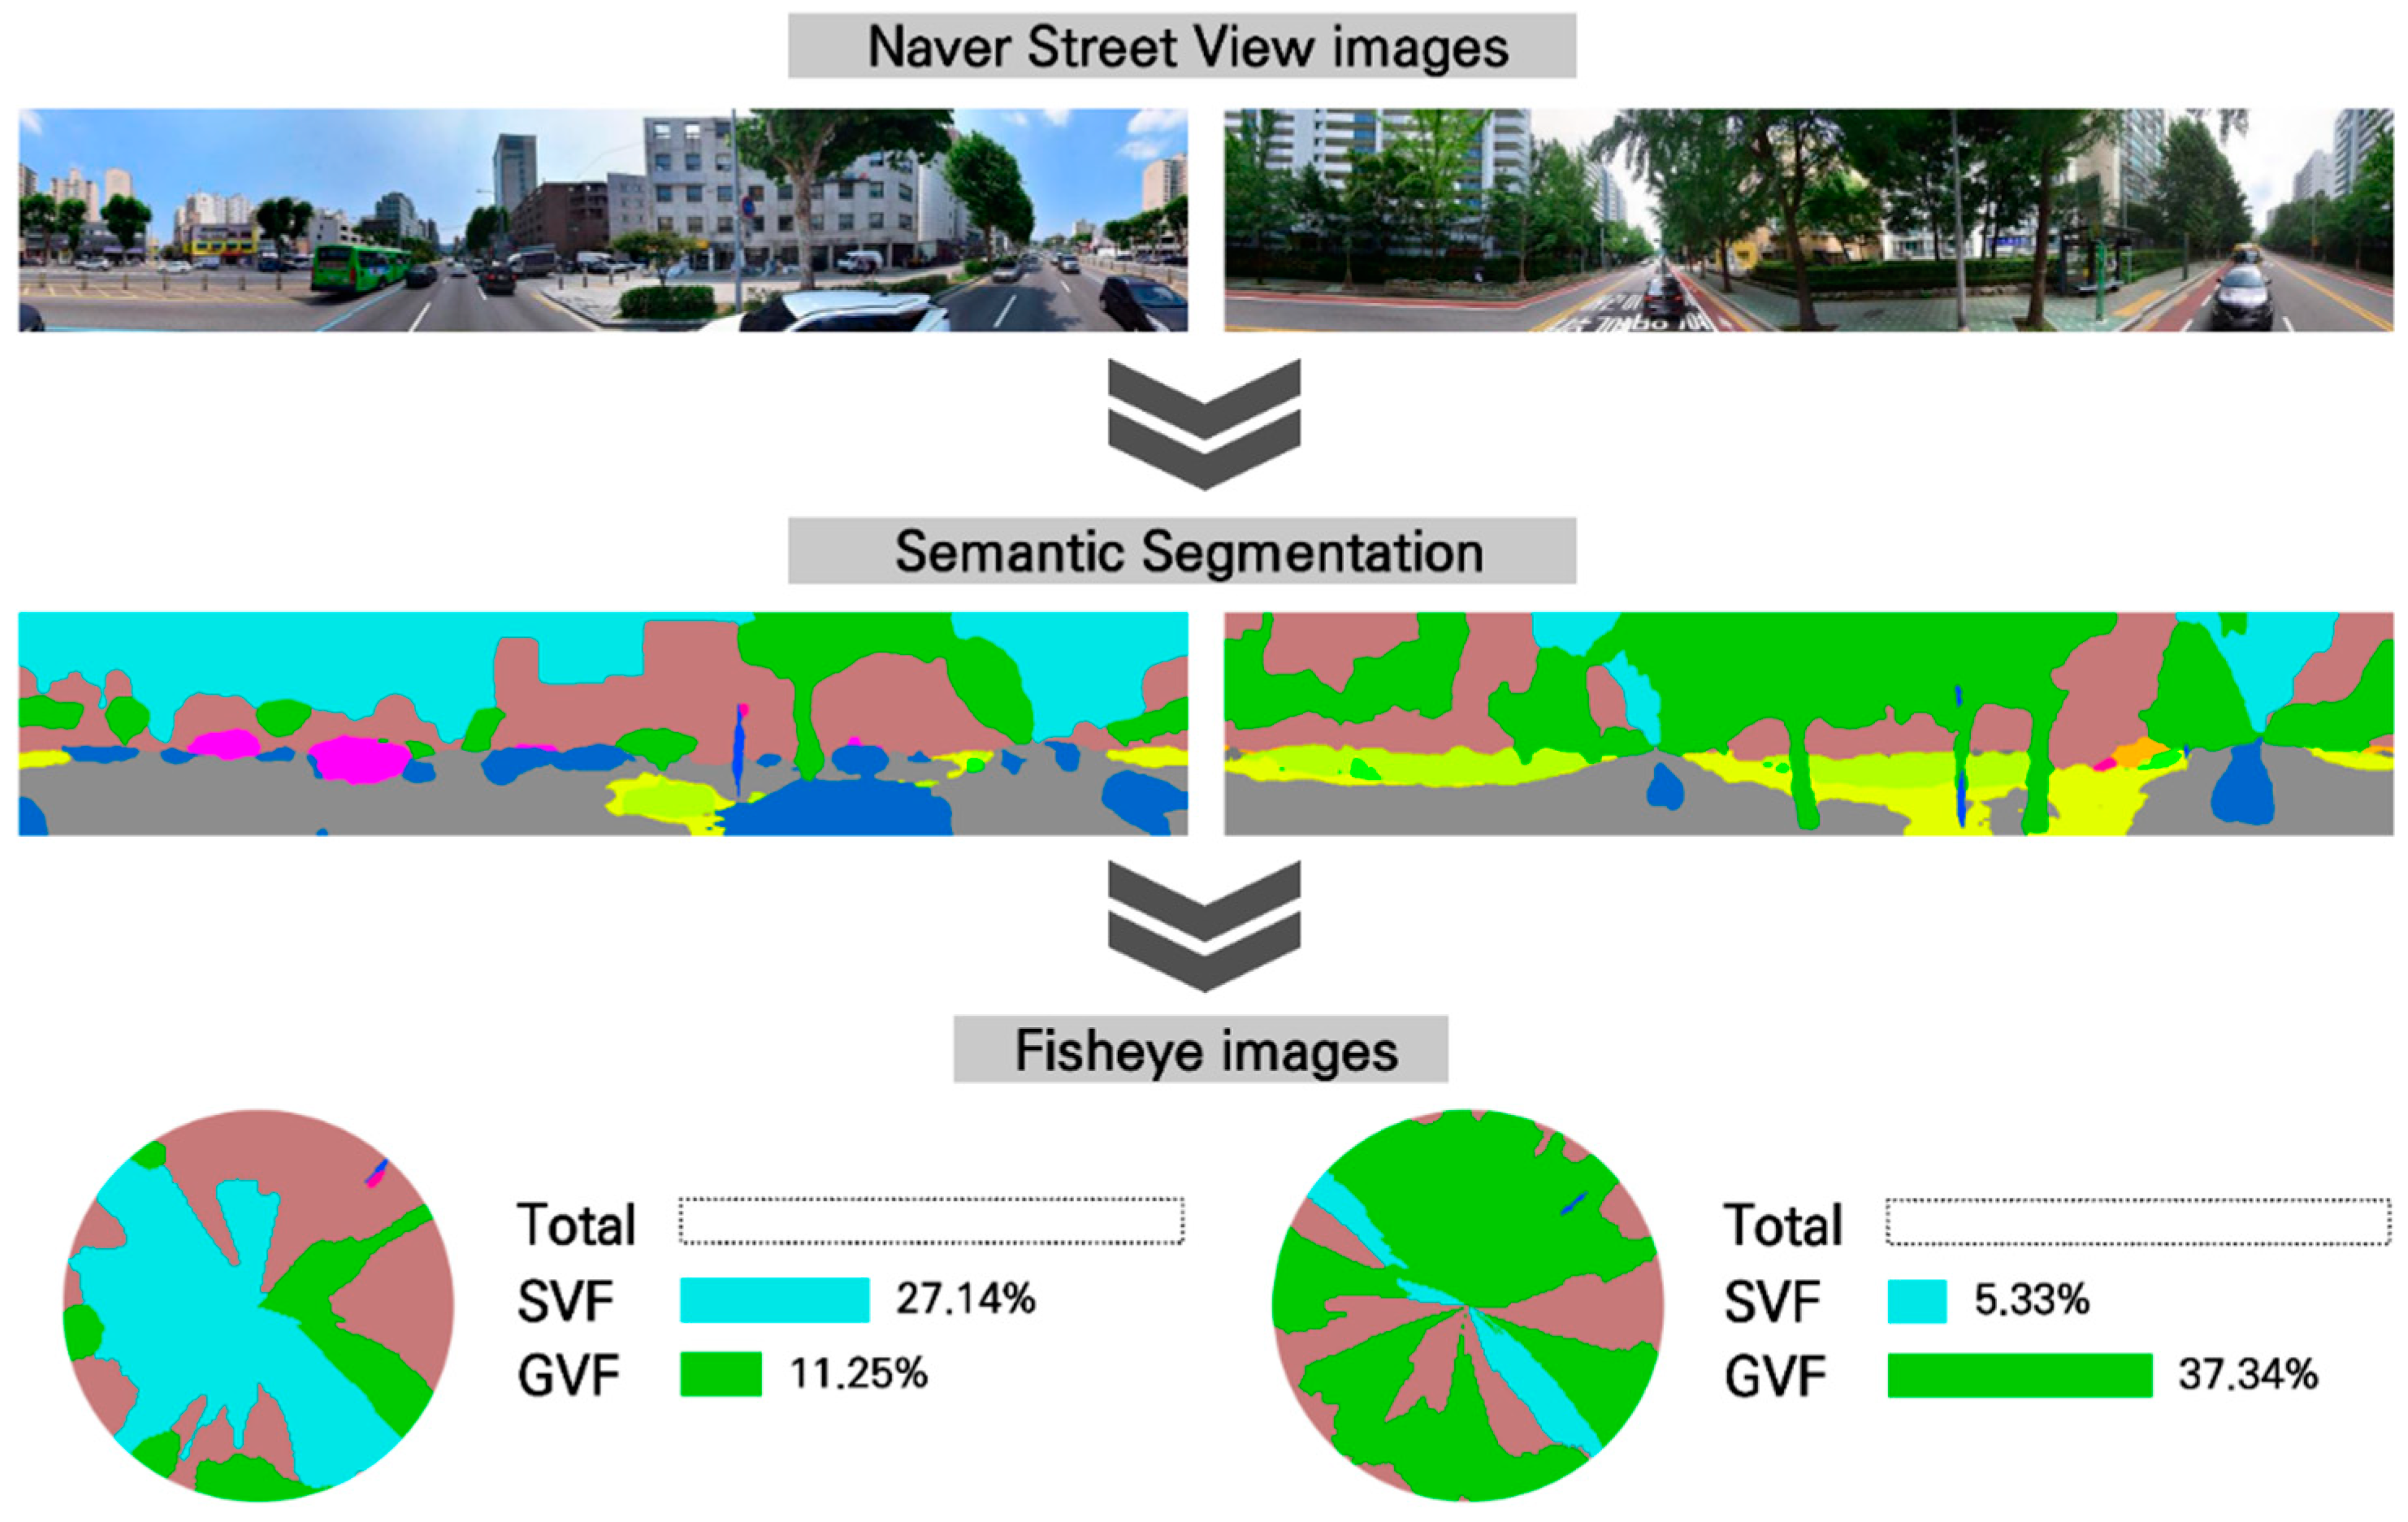
| Urban environmental factors | Surface structure | SVF (%) | The proportion of sky measured at the pedestrian level within the analysis unit | Naver Street View (2021) |
| GVF (%) | The proportion of greenery measured at the pedestrian level within the analysis unit | |||
| Aspect ratio | The ratio of average building height to average road width within the analysis unit | New address Database (2021) | ||
| DEM (m) | The average elevation within the analysis unit | V-World (2021) | ||
| Building height (m) | The average building height within the analysis unit | New address Database (2021) | ||
| Surface roughness (m) | The standard deviation of the sum of elevation and building height within the analysis unit | New address Database (2021)/V-World (2015) | ||
| Surface cover | Building surface fraction | The proportion of total building floor area within the analysis unit | New address Database (2021)/V-World (2021) | |
| Pervious surface fraction | The proportion of total impervious surface area (including vegetation and water bodies) within the analysis unit | |||
| Impervious surface fraction | The proportion of area excluding building surfaces and impervious surfaces within the analysis unit | |||
| Surface fabric | Surface albedo | The proportion of average solar irradiance reflected within the analysis unit | Landsat8 | |
| Urban metabolic factors | Human activity | Population density (people/m2) | Total residential population per analysis unit | Seoul Open Data Plaza (2021) |
| Traffic volume | The normalized index of total estimated traffic volume within the analysis unit | View-T (2021) | ||
| Electricity energy consumption (kWh/m2) | Total electricity consumption per analysis unit | Architecture Data Private Opening System (2021) | ||
| Variables | Obs. | Mean | Std. Dev. | Min. | Max. | ||
|---|---|---|---|---|---|---|---|
| Air temperature (°C) | 1890 | 27.12 | 0.44 | 25.81 | 27.98 | ||
| Urban environmental factors | Surface structure | SVF (%) | 1890 | 18.78 | 7.91 | 0.17 | 59.48 |
| GVF (%) | 1890 | 13.80 | 10.44 | 0.00 | 66.88 | ||
| Aspect ratio | 1890 | 0.63 | 0.41 | 0.00 | 10.18 | ||
| DEM (m) | 1890 | 36.31 | 29.03 | 4.05 | 266.48 | ||
| Building height (m) | 1890 | 12.60 | 9.49 | 0.00 | 150.00 | ||
| Surface roughness (m) | 1890 | 12.70 | 7.41 | 0.00 | 62.91 | ||
| Surface cover | Building surface fraction | 1890 | 0.21 | 0.13 | 0.00 | 0.52 | |
| Pervious surface fraction | 1890 | 0.16 | 0.24 | 0.00 | 1.00 | ||
| Impervious surface fraction | 1890 | 0.63 | 0.20 | 0.00 | 1.00 | ||
| Surface fabric | Surface albedo | 1890 | 0.60 | 0.08 | 0.28 | 0.94 | |
| Urban metabolic factors | Human activity | Population density (people/m2) | 1890 | 0.50 | 0.33 | 0.00 | 3.97 |
| Traffic volume | 1890 | 0.20 | 0.13 | 0.00 | 1.00 | ||
| Electricity energy consumption (kWh/m2) | 1890 | 0.38 | 1.41 | 0.00 | 35.03 |
Disclaimer/Publisher’s Note: The statements, opinions and data contained in all publications are solely those of the individual author(s) and contributor(s) and not of MDPI and/or the editor(s). MDPI and/or the editor(s) disclaim responsibility for any injury to people or property resulting from any ideas, methods, instructions or products referred to in the content. |
© 2024 by the authors. Licensee MDPI, Basel, Switzerland. This article is an open access article distributed under the terms and conditions of the Creative Commons Attribution (CC BY) license (https://creativecommons.org/licenses/by/4.0/).
Share and Cite
Park, S.; Lee, S.; Oh, K. Defining and Verifying New Local Climate Zones with Three-Dimensional Built Environments and Urban Metabolism. Land 2024, 13, 1461. https://doi.org/10.3390/land13091461
Park S, Lee S, Oh K. Defining and Verifying New Local Climate Zones with Three-Dimensional Built Environments and Urban Metabolism. Land. 2024; 13(9):1461. https://doi.org/10.3390/land13091461
Chicago/Turabian StylePark, Siyeon, Sugie Lee, and Kyushik Oh. 2024. "Defining and Verifying New Local Climate Zones with Three-Dimensional Built Environments and Urban Metabolism" Land 13, no. 9: 1461. https://doi.org/10.3390/land13091461
APA StylePark, S., Lee, S., & Oh, K. (2024). Defining and Verifying New Local Climate Zones with Three-Dimensional Built Environments and Urban Metabolism. Land, 13(9), 1461. https://doi.org/10.3390/land13091461