Article

Nature-Based Solutions Scenario Planning for Climate Change Adaptation in Arid and Semi-Arid Regions

by
Rifat Olgun
1,2,*,
Chingwen Cheng
3 and
Paul Coseo
2
1
Vocational School of Serik G-S. Sural, Akdeniz University, Antalya 07500, Türkiye
2
The Design School, Arizona State University, Tempe, AZ 85287, USA
3
Stuckeman School, Pennsylvania State University, University Park, PA 16802, USA
*
Author to whom correspondence should be addressed.
Land 2024, 13(9), 1464; https://doi.org/10.3390/land13091464 (registering DOI)
Submission received: 26 July 2024 / Revised: 28 August 2024 / Accepted: 5 September 2024 / Published: 10 September 2024
(This article belongs to the Special Issue Strategic Planning for Urban Sustainability)

Abstract

:
Extreme climatic conditions cause a decrease in ecosystem services, the disruption of the ecological balance, and damage to human populations, especially in areas with socially vulnerable groups. Nature-based solutions applying blue-green infrastructure (BGI) against these negative impacts of climate change have an important role in planning sustainable cities. This study aims to identify priority areas and develop scenarios and strategies for spatial planning to understand the tradeoffs in approaches and to maximize the benefits of ecosystem services provided by BGI in cities with arid and semi-arid climates, using Phoenix, Arizona, a swiftly urbanizing city in the Sonoran Desert, as the study area. Using GIS-based multi-criteria decision-making techniques and the Green Infrastructure Spatial Planning model integrated with the city’s existing water structures, this study is conducted at the US census scale. The hotspots for BGI are mapped from the combined GIS-based multi-criteria evaluation and expert stakeholder-driven weighting. In the hotspots where priority areas for BGI in Phoenix are identified, the city center area with a high density of impervious surfaces is identified as the highest priority area. It is revealed that social vulnerability and environmental risks (flooding, heat) have a positive correlation in Phoenix, and stormwater management and the urban heat island are the criteria that should be considered first in BGI planning.

1. Introduction

Ecosystems provide many benefits to human and non-human life. These benefits, which occur for free as part of the natural processes within ecosystems, are collectively termed ecosystem services [1,2]. Regulatory ecosystem services are crucial in reducing the impacts of climate change on cities and increasing their ability to withstand these impacts [3,4], such as mitigating climate change-induced flooding hazards [5]. Among the regulating services, key services include managing waste, enhancing the air and soil quality, mitigating natural disasters like floods and landslides, regulating the climate, controlling diseases, facilitating pollination, purifying water, and controlling harmful species [6]. However, the worldwide population growth and the consequent expansion of urban settlements are causing great damage to ecosystems [7]. This makes cities vulnerable to the impacts of climate change [8] and contributes to the climate justicescape, where vulnerable communities with a lack of green infrastructure investment are facing inequitable consequences from climate change impacts [9,10].
Cities are the areas where climate change is felt the most intensely [11]. Therefore, many social [9], economic [12,13,14], and environmental problems [15] arise in cities due to climate change. An increased urban heat island (UHI) effect [16], an increase in the number of hot days [17], increased air pollution [18], water shortages [19], changes in precipitation regimes [20], coastal floods, and floods caused by rainwater are among these problems [21]. Nowadays, about 30% of the world’s population is exposed to these adverse climatic conditions for at least 20 days per year [22]. For instance, in just two years, 2021 and 2022, the devastating flooding disasters in Australia, China, India, Malaysia, Nigeria, Pakistan, and Western Europe, as well as the forest fires in Algeria, Argentina, Canada, Greece, Turkey, and the USA, resulted in the loss of thousands of lives and the destruction of homes as a result of the negative effects of climate change [23,24].
To prevent these problems in cities, researchers, decision-makers, and planners have put forward green infrastructure (GI) systems that provide nature-based solutions (NbS) as an alternative urban planning approach [25,26] to traditional command-and-control gray infrastructure approaches (e.g., concrete dams and channelized drainage for flood control) [27]. Cohen-Shacham et al. [28] define NbS as societal activities to safeguard, steward, and repair urban ecosystems, which, at the same time, both effectively and adaptively make progress toward other societal challenges (e.g., social justice). In this way, nature-based solutions, of which GI is an example, align human well-being with biodiversity benefits simultaneously. Accordingly, countries in the United States [5,29], the United Kingdom [30], Europe [31], China [32], and other countries in Asia [8] have developed strategies and policies for the planning and implementation of GI systems. Towards the end of the initial decade of the twenty-first century, the BGI planning paradigm emerged, which, unlike prevailing planning methodologies, aims to plan open green spaces, natural and semi-natural areas (cultural landscapes), rivers and valleys, and natural corridors within urban environments as a cohesive system, combining GI with water management and aiming for a nature-based water cycle, as well as the benefits of green spaces [33]. BGI systems are a holistic combination of sustainable ecological functions and cultural values. Scientific studies have shown that when BGI is integrated into the urban structure at different levels (micro, medium, and macro levels), it increases the resilience of cities in dealing with the negative impacts of climate change and provides significant environmental, social, and economic advantages compared to gray infrastructure [12,33].
The geographical structure of regions is important in developing different planning scenarios and strategies [34]. For this reason, BGI systems are planned for various ecosystem services in different regions [35]. For example, BGI planning strategies have been developed to improve the local climatic conditions in Stuttgart (Germany) and Melbourne (Australia); reduce runoff in Seattle (USA), Portland (USA), and Rotterdam (the Netherlands); and protect the existing water resources in Durban (South Africa) [36,37]. Generally, research on the planning and design of BGI systems has been carried out in areas with heavy rainfall. Studies to control excess rainwater [38], reduce runoff, reduce the burden of gray infrastructure [20], and provide ecological connectivity [39] between existing green spaces in these regions are seen in the literature and practice [40,41]. However, very few studies have demonstrated the planning and implementation of BGI systems in arid and semi-arid regions. These studies in the literature especially focus on the use of green spaces to reduce temperatures and mitigate the urban heat island effect [6,15,42]. However, we have not encountered a BGI study in the literature that evaluates various criteria in a holistic approach through GIS-based multi-criteria evaluation and expert stakeholder-driven weighting in desert cities with high drought levels.
This study was prompted by the following research question: How can we identify strategic hotspots to maximize the multifunctionality of BGI in cities in arid or semi-arid regions at a regional scale and where are the priority areas for BGI? Accordingly, the aim of this study is to identify priority areas and develop scenarios and strategies for spatial planning to understand the tradeoffs in approaches and to maximize the benefits of ecosystem services provided by BGI in cities that have arid and semi-arid climates. In particular, evaluating different scenarios can provide decision-makers with a better understanding of how to anticipate governance and plan for uncertainty [43]. In this context, it is necessary to focus on more benefits in line with the requirements of the region, rather than focusing on only one benefit of BGI. For this reason, a GIS-based model that can analyze many criteria and combine these multiple criteria is useful for decision-making [44]. In this study, we adopt the Green Infrastructure Spatial Planning (GISP) model, developed by Meerow and Newell [29] for this purpose and applied to the city of Detroit, Michigan and in follow-up research by Meerow [25,45] to the assessment of the GI of Manila (Philippines), Los Angeles (USA), and New York City (USA). In addition, Chang et al. [46] used GISP to assess the GI of the Yanshuei River Basin (Taiwan). In some studies, GI planning frameworks have been created by integrating various spatial factors with the GISP model [47,48].
The City of Phoenix, Arizona, USA was selected as the study area, where the negative impacts of climate change, such as extreme heat and drought conditions, are occurring more frequently and intensely [49], as well as increasing summertime temperatures combined with urban-induced heat [50], water availability issues [51], and monsoon flash floods [52]. Thus, officials are increasingly concerned about green space [53] and equitable access to high-quality green space to cope with climate change impacts. In addition, microbursts accompanying thunderstorms in the city and small-scale destructive winds damaging trees and other green infrastructure are also influential factors for the study area [54,55].

2. Materials and Methods

2.1. Study Area

The City of Phoenix, the capital of Arizona, USA, is located in the northeastern part of the Sonoran Desert. It is the fifth-largest city in the United States by population [50] and the country’s most populous state capital, with a population of 1,608,139 and a population density of approximately 8039.3 people per square kilometer [56] (Figure 1). Agricultural activities were intensively developed from the city’s foundation in the late 1800s until the second half of the twentieth century. The city had a relatively low population growth rate since its establishment for many years [57]. However, with the development of air conditioning, along with advancements in technology, it has experienced rapid population growth and urbanization in recent decades. Today, it is one of the largest and fastest-growing metropolitan areas in the United States [52].
Phoenix is one of the hottest cities in the United States due to its location in an arid and semi-arid region with mild winters and hot summers [49]. The 30-year average daily maximum temperature is above 38 °C for about 110 days of the year [53]. The average highest temperature is 41.3 °C in July, but the climate is rapidly shifting to a hotter regime. The 1991–2020 average summertime temperature (June–August) for Sky Harbor Airport, the official reporting station for Phoenix, was 27.9 °C. However, the summer of 2020 had an average temperature of 35.9 °C, shattering the previous hottest summer on record for 2015 with an average temperature of 35.1 °C [58]. By 2023, Phoenix broke the 2020 record with an average temperature of 36 °C (June–August). The winter months bring relief from the heat and the climate is mild, where the average daily high temperature is above 17.6 °C and the average daily low temperature is below 3.9 °C. Most of the rainfall occurs during the winter season and the monsoon season (15 June to 30 September). The average annual precipitation for the last two decades (2003–2023) is 163.3 mm (6.43 in) for Phoenix [58]. Approximately half of the average annual precipitation falls during the monsoon period [59] (Suchy et al., 2020). Flash floods during the monsoon period cause damage to people and property [52,58,60]. At the same time, increasing impervious surfaces due to urbanization have increased the urban heat island effect in Phoenix, causing the average daily air temperature to rise by 3.1 °C and the night-time minimum temperature to rise by 5 °C over the last 52 years [50,61].

2.2. Methods

This study employed the GISP model to analyze spatial data (i.e., social, topography, land cover–land use, zoning plan, weather, air pollution, and drainage) and identify “hotspots” where multiple BGI benefits are required based on ecosystem services. In addition, the BGI scenarios’ tradeoffs and synergies between planning priorities were evaluated using the US census tract as a unit of analysis. The GISP model utilizes GIS-based multi-criteria decision-making techniques with six planning criteria identified: managing stormwater, reducing social vulnerability, increasing access to park areas, reducing the urban heat island effect, improving the air quality, and increasing the landscape connectivity (Table 1).

2.2.1. Managing Stormwater

The determination of flood areas in stormwater management is important in the preparation of strategic urban plans. In this context, the “Flood Susceptibility Mapping using GIS-AHP Multi-Criteria Analysis” method was used to determine flood areas. A database for the management of stormwater was created by using ten different data belonging to the study area (Table 1). Alos Palsar’s Digital Elevation Model (DEM) data with a 12.5 m spatial resolution were used to create the data infrastructure for the topographic structure of the land, such as the slope, elevation, aspect, and surface flow direction “https://asf.alaska.edu (accessed on 12 September 2023)”. Road information for the study area was obtained from the United States government’s open data website “https://data.gov/ (accessed on 21 October 2023)”. Data on water structures were obtained from the AZGeo Data Hub developed by the Arizona Geographic Information Council and Arizona State Land Department “https://azgeo-data-hub-agic.hub.arcgis.com/ (accessed on 17 September 2023)”. The monthly average precipitation data of the study area for the last 10 years (2014–2023) were obtained from measurements at 7 different stations (Phoenix Airport, Litchfield Park, Youngtown, Phoenix Deer Valley Municipal Airport, Carefree, Scottsdale Municipal Airport, Tempe ASU) located in and around the study area [58]. Using the precipitation data obtained, the precipitation map of the study area was created with the inverse distance weighted (IDW) technique, which is frequently used in the creation of precipitation maps. The equations and analysis steps used to generate the TWI, GMIS, NDVI, and drainage density are shown in Supplementary File S1. In the last stage, after the database was created, each piece of data was weighted in the database with the analytic hierarchy process, one of the multi-criteria decision-making methods. Then, flood areas were determined by overlaying the data according to the weight values with the ArcGIS 10.5 software.

2.2.2. Reducing Social Vulnerability

The most widely used method for this is the social vulnerability index (SoVI). In this study, the SoVI with 27 social variables and the heat vulnerability index (HVI) with 10 social variables (see Supplementary File S1), created by Wright et al. [62] from the 2012–2016 American Community Survey (ACS), were used to identify the areas with a high concentration of socially disadvantaged and vulnerable groups within the study area. Then, the correlation between these two indices was analyzed, and the social vulnerability value was calculated for each census tract.

2.2.3. Increasing Access to Park Areas

A population-weighted approach was used to calculate the service areas of park areas. Census tract data produced by the US Census Bureau for 2020 were used to determine the population data. First of all, the population density in the study area was evaluated with the kernel density method. The population data of the census tract were distributed equally to the existing buildings within the tract in the zoning plan. To calculate the walking distances of the users, the roads that provided access to green areas were determined. In this context, highways that did not allow walking were removed from the database, and streets and roads that were under 35 miles per hour (mph) were used. To calculate more accurate accessibility values, the entry points of all park areas were identified and entered into the road database. The accessibility/service areas of park areas were determined in the ArcGIS 10.5 software using the GIS-based network analysis modules. Finally, the population within the total service areas of the parks and the percentage of the population within the service areas of the parks were calculated. The equations used to generate the census tract park total service area population and percentage of population covered by the park service are shown in Supplementary File S1.

2.2.4. Reducing the Urban Heat Island Effect

BGI systems are important in cooling the region and reducing the UHI effect. Therefore, determining areas with high land surface temperature and UHI values in the planning of BGI ensures the success of the plans. In determining the UHI effect, firstly, the land surface temperature (LST) needs to be determined. An LST analysis was performed to determine the change in the LST over 10 years and to determine the current situation. For the analysis, Landsat 8 (18 June 2013 and 2 July 2018) and Landsat 9 (8 July 2023) satellite images were downloaded from the USGS. While downloading the satellite images, it was ensured that the cloudiness of the data was less than 10% and that the data belonged to the period when the temperature was high. After the pre-processing of the satellite images, the LST analysis was performed. In the last stage, the relationship between the LST and NDVI was analyzed by correlation analysis, and the stack profile of the UHI was derived (of which details are shown in Supplementary File S1).

2.2.5. Improving Air Quality

The 10-year air quality index (2013–2022) data from six stations, produced by the United States Environmental Protection Agency (EPA), were used to evaluate the air quality in the study area [64]. Since the air quality index (AQI) takes into account six different air pollutants measured within the geographical area, it is a general indicator of the air quality of the region. Air pollutants considered in the calculation of the AQI are ozone (ppm), PM2.5 (µg/m3), PM10 (µg/m3), CO (ppm), SO2 (ppb), NO2 (ppb) (Supplementary File S1). An air quality map of the study area was created with the IDW interpolation technique, which used a linearly weighted combination of data from these measurement stations.

2.2.6. Increasing Landscape Connectivity

In addition to the social and technical benefits of GI, ecological benefits are also important for urban areas. Urban green areas provide habitats for many species. However, with increasing urbanization, these areas become fragmented and decrease. The high-resolution (1 m) Lidar image prepared by Zhang and Turner II [65] was used to identify and classify the land cover in the study area. After pre-processing the Lidar image in the ArcGIS 10.5 software, the study area was classified into 8 land classes. The map contained eight land cover classes, including (1) buildings, (2) asphalt, (3) bare soil and concrete, (4) trees and shrubs, (5) grass, (6) water, (7) active cropland, and (8) fallow (these classes are defined in Supplementary File S1).
Different software programs measure both the structural and functional connectivity in a region. In this research, the Fragstats 4.2 software, which has been used in many scientific studies, and the validity of the data that it produces is scientifically accepted, is preferred. With the “Patch Cohesion Index” metric in the Fragstats 4.2 software, the physical connectivity of habitat patches in the research area was evaluated at the landscape scale.
To be able to compare the maps (for the six criteria) obtained as a result of the analysis of the GISP criteria, a linear scale transformation (“score range”) was applied to the measurement scales [29,47,67]. Thus, all criteria scores ranged from zero to ten.

2.3. GIS-Based Multi-Criteria Decision-Making Analysis

A survey form was prepared to obtain the opinions of experts working on GI and BGI systems around the world on the prioritization of the GISP model criteria (Supplementary File S3). After ethics committee approval (approval date 28 November 2023), the online survey form was sent to approximately 81 experts, and 39 experts, who were city planners, professional planners, and landscape architects, responded. In the survey form, they were asked to perform a pairwise comparison and weight the relative importance of the 6 criteria of the GISP model using three different methods (rating, ranking, and pairwise comparison).
The data from the pairwise comparison survey were analyzed with an Excel-based AHP calculator [68] and the Expert Choice V11 software. Therefore, the weight value of each criterion in the model was determined. Then, a hotspot map for the planning of GI was developed using the weighted linear combination technique and the weights of the criteria produced by the experts.
Quantifying the correlations between the GISP model criteria is important in determining the criteria’ potential relationships. In this context, Pearson’s bivariate correlation was used to reveal the spatial tradeoffs and synergies between the model criteria for all census tracts in Phoenix. The IBM SPSS 23 Statistics and JMP Statistics software (https://www.jmp.com/en_us/software/data-analysis-software.html) were used to analyze and create the graphs.

3. Results

This section summarizes the results of the GISP model criteria analysis of Phoenix. Maps and tables for each criterion obtained from the analysis results are shown in Supplementary File S2.

3.1. Managing Stormwater

To determine the flood risk areas of Phoenix and its flood susceptibility, the identified criteria were analyzed. The Camelback East, Paradise Valley, and North Mountain planning villages of Phoenix have a higher vegetation density compared to other planning villages. At the same time, due to the agricultural areas in the west of the Laveen and the Estrella planning villages, the density of green areas is also high in these villages. However, it is seen that the percentage of impervious (PI) surfaces is high in densely populated areas. In the Escanto and Central City planning villages, where industry, trade, and Phoenix Sky Harbor International Airport are located, the drainage density is high due to the high PI values. The TWI values are also high in these areas, with low slopes and dense settlements. Phoenix’s land elevation increases from south to north. However, South Mountain Park and Preserve in the south of the city has the highest elevation in the south. It is also observed that the average annual precipitation increases as one moves northward depending on the elevation. Phoenix does not have a very sloping land structure. Most of the area is in the 0–5% slope range. Phoenix has an extensive road network that provides connectivity in and around the city. Within the scope of the study, heavily used roads in the city’s extensive road network were evaluated. In this context, the city center and the area where the airport is located are under the influence of roads. Phoenix has rivers and water channels of different widths and lengths, with various flow rates, both continuous and seasonal. In this regard, most of the city is located within a four-kilometer radius of rivers and canals. The soil structure of the study area is in the HSG-C group. The areas north of the Ahwatukee Foothills, east of Desert View, southwest of the North Gateway, and northwest of Deer Valley have soil structures in the HSG-B group. There is a group of soils with high surface runoff if drainage is not provided, especially in the area around the Salt River that runs through the Central City, South Mountain, Laveen, and Estrella planning villages.
The flood susceptibility of Phoenix is analyzed using GIS-based multi-criteria decision analysis. At this stage of the analysis, the flood susceptibility criteria and sub-criteria are weighted according to the information obtained from the literature. Then, all criteria are overlaid according to these weight values (which are shown in Supplementary File S2). According to the results of the analysis, the flood risk is high in areas with densely populated areas. The high PI values, low vegetation density, and high topographic wetness values increase the risk of flooding in these areas (Figure 2).

3.2. Reducing Social Vulnerability

Census tracts with high values of social vulnerability are present on both sides of the east–west (l-10) and north–south (l-17) interstate highways crossing through Phoenix. The North Mountain and Alhambra planning villages in the study area have high SoVI values. There is also a high density of socially vulnerable populations in the South Mountain region. In the Central City planning village, there are census tracts with high SoVI values around Phoenix Sky Harbor International Airport.
The HVI has higher values in the center of Phoenix, in areas with industrial and commercial centers. At the same time, the HVI is higher in areas with high percentages of ethnic minorities and elderly residents, low incomes, low vegetation density, and high surface temperatures. The HVI values are particularly high north of South Mountain, southwest of Central City, east of the Estrella and Laveen planning villages, and east of the Alhambra and North Mountain planning villages.
The relationship between the SoVI and HVI was evaluated by correlation analysis. According to the results of the analysis, a weakly positive (r = 0.359) and significant (p < 0.05) relationship was found between the SoVI and HVI. An increasing SoVI value increases the HVI value. Similarly, an increasing HVI value leads to an increasing SoVI value. Accordingly, the SoVI and HVI values of the census tracts were combined with the same impact ratio to determine the social vulnerability of the study area (see Supplementary File S2).

3.3. Increasing Access to Park Areas

It is observed that the population density (persons per km2) is high in the Maryvale planning village. This planning village is followed by Alhambra, Central City, and the southern region of North Mountain. When the distribution of park areas is evaluated, the public park areas in Phoenix are not planned and implemented in an equal and fair manner throughout the city. Park areas are unevenly distributed across the city. This situation shows that individuals living in the city do not benefit from park areas equally. Not all of the population in the study area has access to park areas within a 10 min (800 m) walking distance. However, the Central City planning village has few residential areas due to the presence of industrial areas, commercial centers, and the airport. Therefore, approximately 92% of the existing residential areas in this region have access to park areas.

3.4. Reducing the Urban Heat Island Effect

The results of the analysis show that the LST of the study area varies between regions according to the vegetation structure/density of the city and the presence of impervious surfaces. Especially in areas with a dense urban texture, the surface temperature is quite high. It is seen that, due to the increase in urbanization and the expansion of settlement areas over time, the impervious surfaces have increased, and the land surface temperature values have also increased. Due to the ecological characteristics of Phoenix, which does not have dense natural vegetation cover (it has extensive bare soil), the surface temperature has high values in the regions outside the settlements. In addition, when the study area is evaluated in terms of the UHI effect, it is seen that the UHI is high in the city center.
In this context, the relationship between the land surface temperature and vegetation presence/density of Phoenix (years 2023, 2018, 2013) is evaluated by correlation analysis. According to the results of the analysis, it is concluded that there is a negative correlation (r: −0.466, p < 0.001 for 2023; r: −0.582, p < 0.001 for 2018; r: −0.523, p < 0.001 for 2013) between the vegetation structure and land surface temperature. In this case, as the presence/density of green areas increases, the land surface temperature decreases. When the LST and NDVI maps are evaluated together, the cooling effect of green areas on the land surface is realized not only at the location but also in its immediate surroundings (see Supplementary File S2).

3.5. Improving Air Quality

Phoenix’s topography impacts the region’s air pollution [69]. The region has a valley structure surrounded by mountains from the north and south. This situation prevents the polluted air from moving away from the region with the wind effect [70]. At the same time, the fact that the region has dry air with low humidity and little rainfall causes particles in the air to accumulate. Another cause of air pollution in Phoenix is temperature changes [42]. The reason for the high levels of air pollution, especially in the region around the Salt River, is that when the temperatures drop, cold air flows southward from the mountains to the lower reaches of the valley [71,72]. This moving air causes pollutants to accumulate in the Salt River zone in the south of the study area.

3.6. Increasing Landscape Connectivity

The patch cohesion index for vegetated land cover is calculated for each tract in the study area and it is assumed that these areas would provide habitats for a wide range of urban-dwelling species. In Phoenix, the ecological vulnerability is high in areas of dense urbanization, especially near the interstate highways and the airport. The patches in this region are smaller and poorly connected. These fragmented landscape patches are isolated and more vulnerable. Due to the Natural Park and Mountain Preserve areas to the north, south, and east of the research area, the habitat areas/ecosystem patches in these areas have a more holistic structure. The connectivity between the patches in this region is stronger than in residential areas. However, the areas of high ecological vulnerability around the rivers and canals in Phoenix contain flat, wide, and bare soils [67]. At the same time, these areas are located close to the toxic release inventory areas, which increases this sensitivity. In this context, wetlands, around rivers and canals, do not contribute much in terms of altering the pattern of ecological vulnerability [67] and do not provide any benefit in reducing the ecological fragility.
In the last stage, a linear scale transformation (“score range”) was applied to the measurement scales to be able to compare the maps (for six indicators) obtained as a result of the analysis of the GISP criteria. In this way, all criteria scores ranged from 0 to 10. The six different criteria maps for each criterion are shown in Figure 2. Each map shows the relative prioritization of census tracts in Phoenix according to the criteria set for BGI planning. Darker-shaded tracts on the maps represent areas with higher priority for BGI development based on the model. According to the maps, the priority areas for each of the BGI planning criteria differ.

4. Discussion

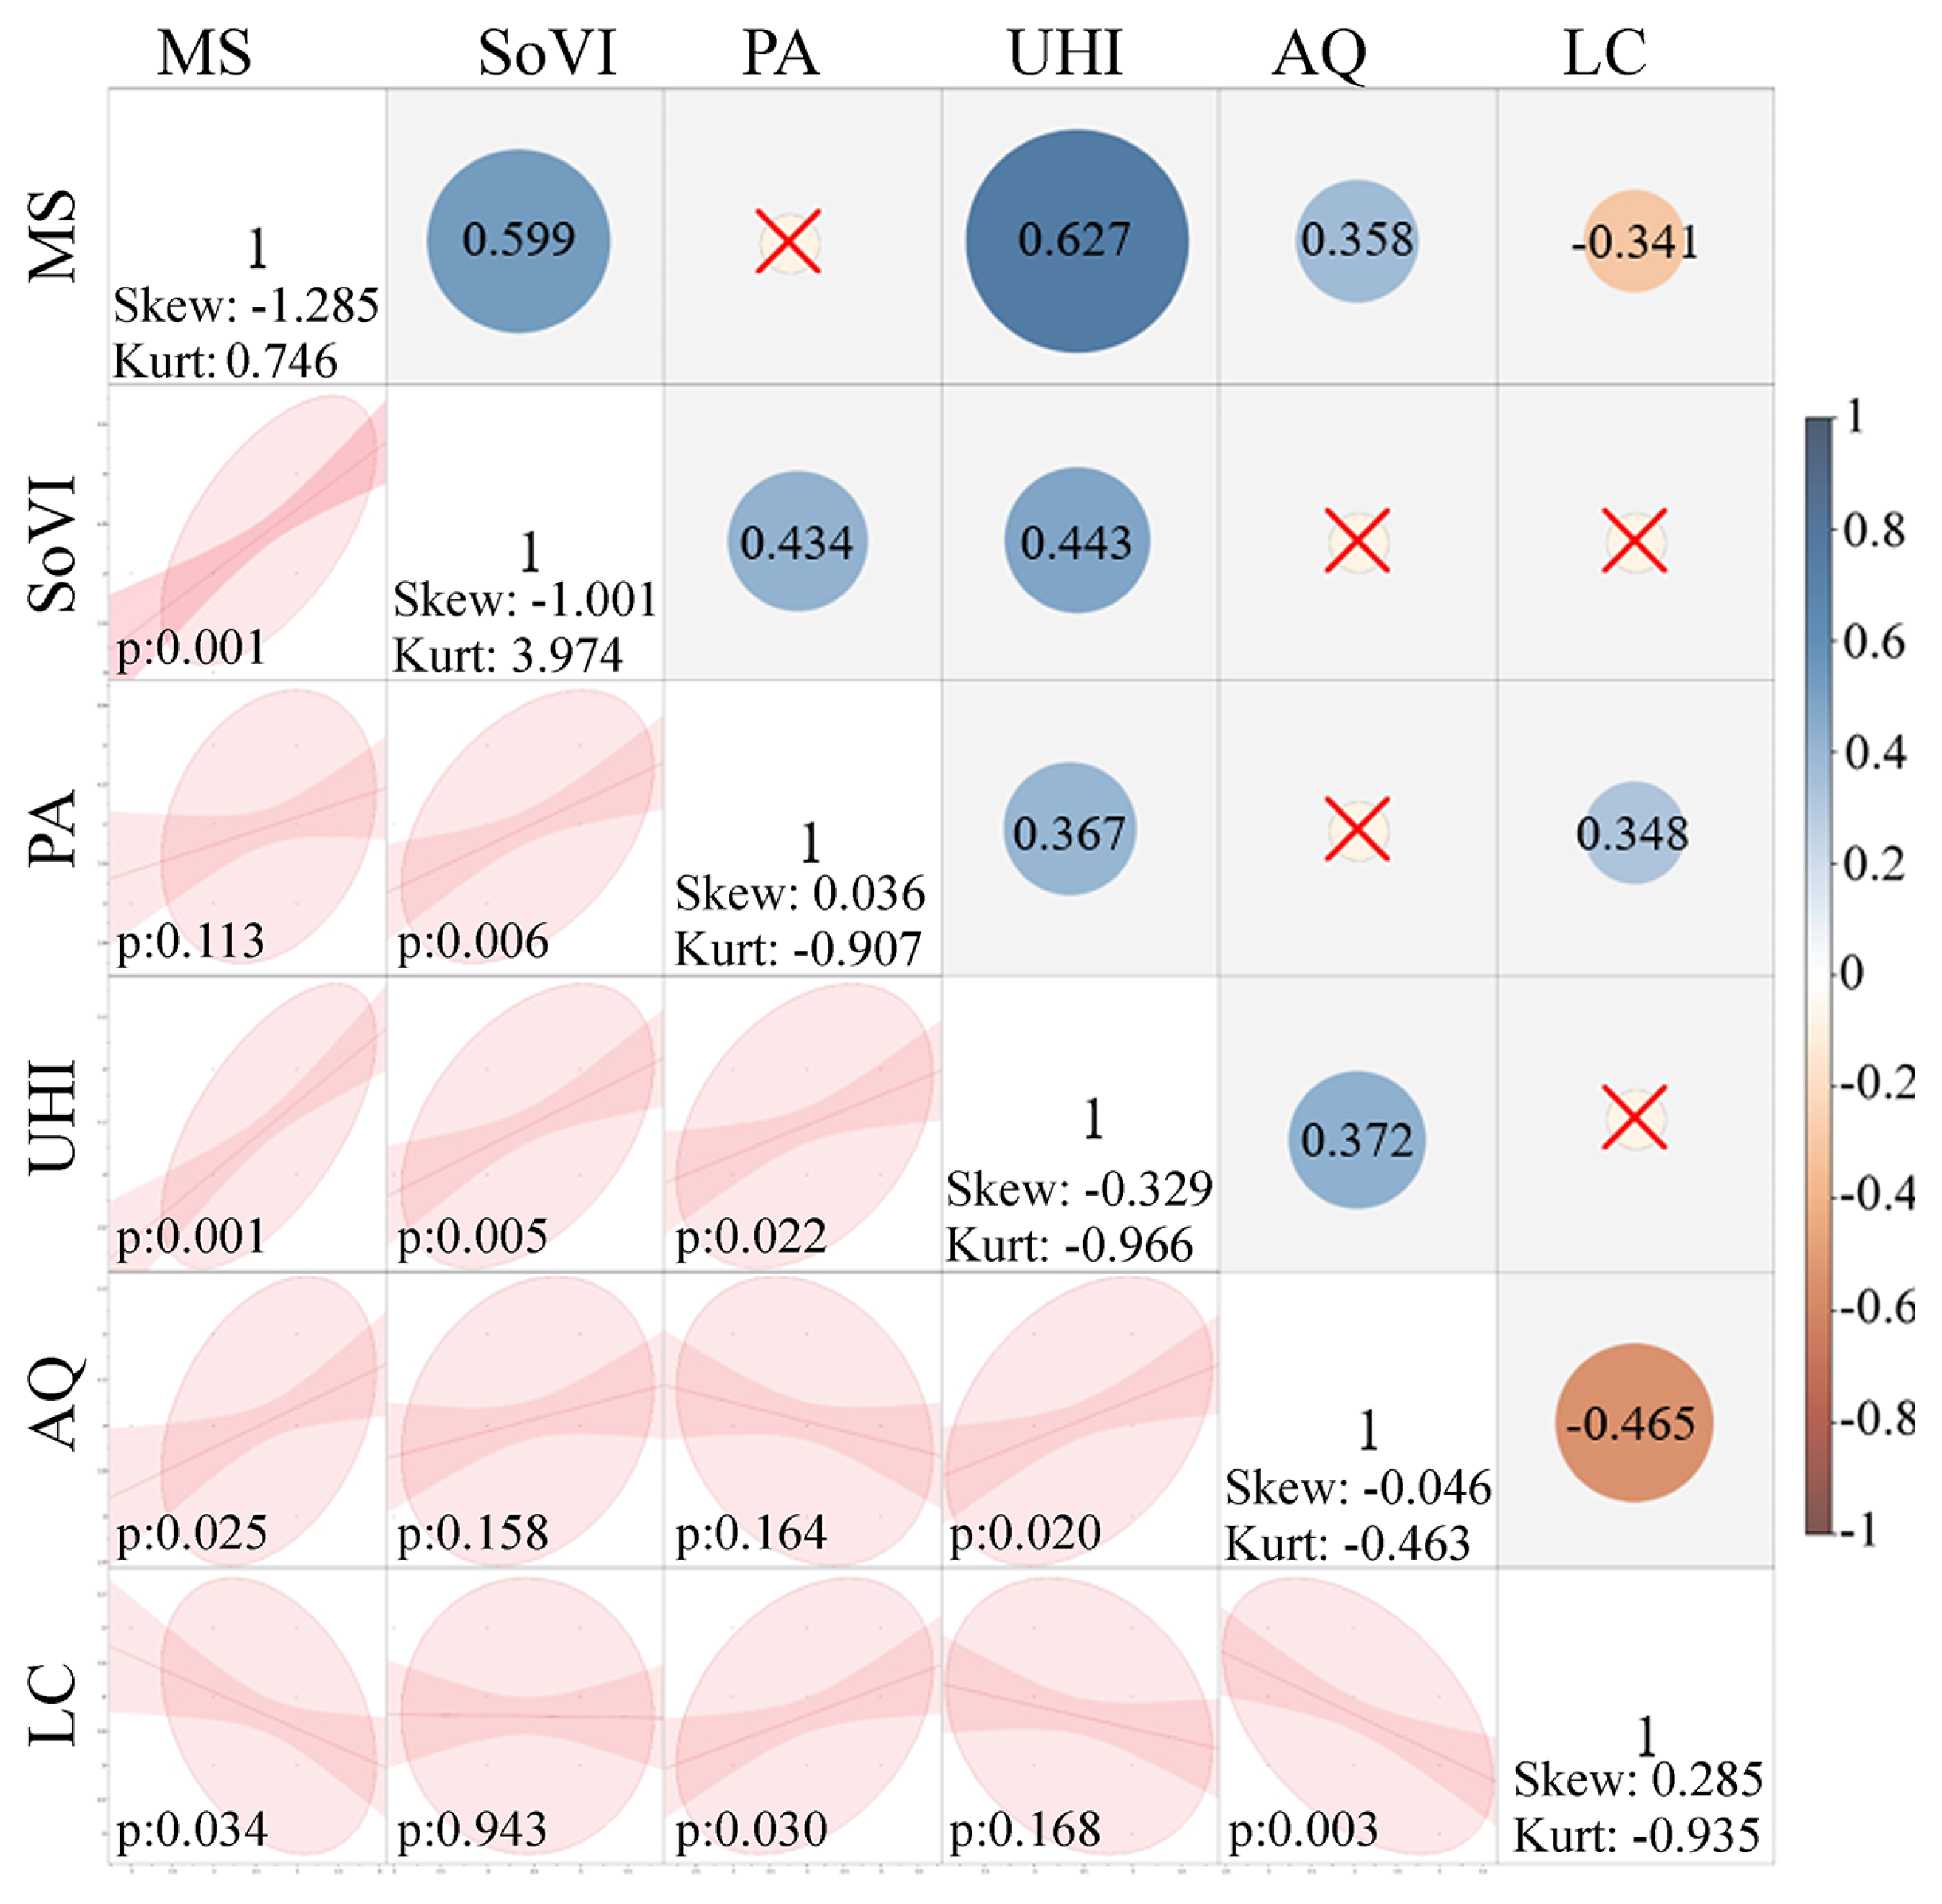
4.1. Synergies and Tradeoffs between Planning Criteria

Assessing the correlations between the GISP model criteria is important in identifying spatial tradeoffs and synergies for such efforts as scenario planning. The findings of the correlation analysis are shown in Figure 3. The colors represent whether the correlation between the criteria is positive (blue) or negative (brown), while the saturation of the colors shows the strength of the association. The Pearson correlation coefficients are written above the dots. The presence of an X in a box indicates that there is no statistically significant relationship between the criteria. The figure also includes kurtosis–skewness values, statistical significance values, and criterion distributions.
Stormwater and the SoVI, UHI, and air quality have positive correlations (synergy) when the results of the correlation analysis between the criteria are considered. Considering that the problem of stormwater is experienced in regions with more residential areas and impervious surfaces, it is expected that the UHI value, air pollution, and SoVI value will be higher in these areas in Phoenix. There is a positive correlation between the SoVI, park area accessibility, and UHI. These three synergistic criteria show similarities within the urban structure. Areas with insufficient park area availability and limited park area accessibility have high UHI values and are socially vulnerable areas.
Decreasing the distance between park areas increases the connectivity between landscape patches. Thus, there is a positive correlation between the accessibility (or “availability”) of park areas and landscape connectivity. The increase in landscape connectivity due to the availability of park areas mitigates the impact of air pollution. Therefore, there is a tradeoff between air pollution and landscape connectivity.
According to the survey results, there is no statistically significant relationship between the SoVI and air pollution. However, when the current structure is evaluated, there is a high population density of individuals with lower socioeconomic status and ethnic/racial minorities in the southern and western regions of Phoenix. Additionally, since the airport and industrial zone are located in this area, air pollution is higher in these areas than in the rest of the city. Grineski et al. [73], deBuys [54], and Kaus [74] emphasize that individuals living in these areas have a high rate of illness caused by exposure to air pollution. This fact shows that there is a synergy between air pollution and the SoVI.

4.2. Prioritization for BGI Planning

The expert stakeholders who participated in the survey rated the importance of the GISP criteria on a five-point scale from least to most important and ranked them in order of importance. Accordingly, in the rating of the planning criteria, stormwater management is seen as the most important criterion for BGI planning in cities. When the ranking of the planning criteria is evaluated, reducing the urban heat island effect is ranked first (Table 2).
In the survey, the experts performed pairwise comparisons of the planning criteria using the AHP technique. According to the results of the analysis of the pairwise comparison data, the criteria were weighted within themselves. In this context, stormwater management had the highest weight value, followed by UHI, AQ, SoVI, PA, and LC. Based on these weight values, the census tracts for each criterion were overlaid in the ArcGIS 10.5 software, resulting in the creation of a map identifying hotspots for BGI planning (Figure 4).
Being in a hot and arid climate and poor-draining soil conditions, Phoenix receives low annual precipitation, yet the amount of precipitation is not uniformly distributed at certain intervals, which contributes to the instantaneously high rainfall intensity, resulting in flash floods in urbanized areas. Therefore, nature-based structures (bioretention systems, bioswales, etc.) that will reduce stormwater runoff, harvest rainwater, and facilitate groundwater recharge should be planned in areas with high flood risks, especially in urban centers where the number of impervious surfaces is high. This will both reduce the flooding risk and provide a precaution against water scarcity [75], which will occur in the coming years due to climate change and increased urbanization and water consumption.
The rivers (Salt, Gila, and Verde) and canals in and around Phoenix, which have limited water resources, are important for the sustainability of the riparian ecosystems and ecological structure in the region. The wetlands and habitats around these rivers have shrunk and disappeared over time due to the impact of urbanization [76]. However, the Tres Rios wetland on the banks of the Salt River southwest of Phoenix provides ecosystem services, flood control, habitat restoration, recreation, and environmental education [77,78,79].
Implementing urban infrastructure [80] and nature-based solutions needed to combat climate change for the entire city requires a holistic analysis of the geomorphology of the city and an understanding of the social needs and political will. For this reason, planning the infrastructure required to combat climate change in a way that ensures social and environmental justice in the most vulnerable parts of the city will reduce the impacts of climate change in these regions. Nonetheless, in Phoenix, there are fewer projects implemented to mitigate climate change problems in regions inhabited by socially vulnerable people [54,81]. As a result, air pollution and the UHI impact are high in these regions, the amount of green space is low, and water management is ineffective.
As seen in the hotspot map of the study area, the priority areas for BGI planning are the areas with a high urban density. The implementation of BGI in these areas will increase the resilience of the city against the effects of climate change and contribute to social and environmental justice.

4.3. NbS for Just and Healthy Urban Planning Implications

The United Nations World Urbanization Prospects estimate that, by 2050, approximately 68% of the world’s population will live in urban areas [82]. Most of the projected urbanization due to population growth is foreseen to take place in arid areas, which cover 41% of the global land surface and have 35% of the world’s largest cities [83]. In this context, the city of Phoenix, within the Phoenix Metropolitan Area, which has been called “the least sustainable city in the world” by Ross [84], is an important example of dryland urbanization. The transformation of Phoenix from an agricultural region to a metropolis with intense urban activity has led to extensive changes in land cover and land use. As a result of these land cover and land use changes, several interrelated environmental problems have emerged, such as deteriorating air quality [85], regional biodiversity loss [86], water scarcity [87], and an urban heat island [75]. This situation threatens the sustainability of the city.
The rapid increase and spread of urbanization in Phoenix has led to increased development in floodplains and increased volumes of impervious surfaces. This increases the risk of flash flooding in the city and the negative effects of the urban heat island [50,61]. Although the city of Phoenix does not receive heavy rainfall throughout the year, the area experiences flash floods, especially during the monsoon season. Therefore, reducing the impervious surfaces, increasing the vegetation density, and constructing stormwater retention facilities will contribute to the reduction of stormwater runoff and groundwater recharge.
The ecosystems of arid cities are different from those of cities with intense precipitation due to factors such as inadequate water resources, a low density of green areas, a high land surface temperature and urban heat island effect, irregular rainfall, and a diverse vegetation structure. Therefore, Phoenix has the potential to offer different BGI recommendations compared to wetter cities (Baltimore, Portland, Seattle, etc.).
The water demand for green infrastructure raises water management concerns, especially for cities in arid or semi-arid regions [75,88], because the water use in cities located in these regions could exceed local water availability [89]. The Phoenix region, which is arid and developing in terms of urbanization, is supplied by local rivers in the Salt–Verde basins, water from the Colorado River, groundwater, and wastewater [90]. However, with intense urbanization and population growth, the excessive water consumption in various areas (industrial productions, parks, nurseries, golf courses, lawns, etc.) leads to significant reductions in surface water and groundwater withdrawals in Phoenix [91]. Therefore, it is important to establish a relationship between urban green infrastructure and water resource management in Phoenix for the sustainability of the city.
Studies have shown that the preference for the arid landscape (xeriscape) design approach rather than traditional and common landscape designs in the planning and implementation of green spaces in arid regions contributes significantly to water saving [92,93]. However, two different studies in Phoenix have noted that xeriscape application increased the air temperatures and thermal discomfort. At the same time, this leads to excessive energy consumption for cooling systems and the risk of increased rates of heat-related morbidity and mortality [75,94]. For this reason, landscape areas should include trees that will provide spatial cooling through both shading and evapotranspiration, reduce the urban UHI effect, and increase the thermal comfort. In this context, xeriscape application in the landscapes of Phoenix with arid-tolerant tree species (low-water-use trees) will provide a cooling effect, reduce the UHI effect, and contribute significantly to water savings.
Increasing impervious surfaces due to urbanization increase the surface runoff and UHI. The study carried out by Flower et al. [95] in Salt Lake City (USA) revealed that the surface temperature of pervious concrete under the sun was equal to that of conventional concrete in the shade. It was also found to be, on average, 10 °C cooler than asphalt under the sun [96]. Therefore, the use of pervious surfaces in structural applications in Phoenix will contribute to reducing the surface runoff and temperature effects.
Since the boundaries of the study area determined are very wide, it is not possible to measure the surface temperature of each point at the same time. For this reason, satellite images of three different periods (2013, 2018, 2023) obtained by the remote sensing method were used in the study. The LST and UHI values of each period were calculated from these satellite images. The reason for considering LST values is that studies have shown that the LST is significantly correlated with the air temperature [53,97]. Phoenix is one of the hottest cities in the USA [98], and, with global temperatures rising due to climate change, extreme heat in the region is the most deadly threat [99]. In this city, characterized by a desert ecosystem, a master plan has been prepared that aims to increase the amount of green space to reduce the UHI [100]. This master plan aims to increase the tree canopy from 10% to 25% to reduce the city’s heat. However, as emphasized by Zhang et al. [53], to make the most of the potential cooling benefits of green spaces, not only the quantity and spatial size of green spaces but also the density and distribution of green spaces need to be considered in planning and implementation. Since more than 45% of the land in Phoenix is used for residential areas and much of it is privately owned [101], this constrains the planning and implementation of green infrastructure in certain areas [60].
The findings of the study show that social vulnerability and environmental risks (flooding, heat) have a positive correlation in Phoenix, as in other cities [25,29,45]. In Phoenix, low-income, high-percentage renters and low-percentage English speakers are the variables that most increase the value of social vulnerability [67]. Zhang et al. [53] found that when the presence of green spaces and the social structure are considered together, neighborhoods with high social vulnerability have fewer green spaces. This conclusion is also valid for Phoenix. Prioritizing green infrastructure planning in areas with high social vulnerability will contribute to reducing the environmental risks in the region. In addition, increasing the accessibility of socially vulnerable groups to park areas within the green infrastructure will increase the level of utilization of the opportunities and benefits of these areas.
In the 20-year air quality report prepared by the American Lung Association, it is determined that 4 out of 10 Americans live in unhealthy air quality. In this report, Phoenix ranks seventh in ozone pollution [102]. When the AQI values (last 10 years) of Phoenix are examined, it is seen that air pollution is high, especially in the southern region of the city. The intensive industrial and commercial areas, highways, and the airport in this region [103] are thought to contribute to the high level of air pollution. Studies on reducing air pollution show that GI is an effective planning approach to reduce particulate matter in the air and improve the air quality [104,105]. For this reason, researchers propose street afforestation, roof gardens, facade greening, vertical gardens, and green corridor systems in the whole city as solutions to reduce air pollution in cities [106,107]. The City of Phoenix has prepared long-term plans to reduce air pollution (especially reducing ozone and particulate pollution) and improve the air quality. The City of Phoenix’s objective is to achieve healthy air quality for people in Phoenix by 2050. This will be achieved by increasing the number of excellent and good days for air quality to 90% annually [51]. Furthermore, the “City of Phoenix Tree and Shade Master Plan”, prepared by the City of Phoenix in 2010, aims to reduce the carbon footprint of the region, reduce stormwater runoff, increase bio-diversity, improve the air quality, reduce the urban heat island effect, and reduce energy costs. With the successful implementation of these plans, Phoenix expects to achieve many goals and policies in terms of urban sustainability. In this context, planning water structures and green areas in a holistic structure through natural and artificial corridors will contribute to the city’s effective utilization of ecosystem services and will be effective in the implementation of nature-based solutions.

5. Conclusions

The empirical data provided by the GISP model criteria at the stage of determining priority areas for BGI will provide a great advantage for planners and decision-makers to develop planning scenarios and strategies that consider the urban ecosystem services provided in the interconnected social–ecological–technological systems [108]. The model, which has a flexible structure in creating the database [25,45], will support the development of anticipatory, participatory, and multifunctional BGI policies and strategies in the field of landscape architecture and planning. In addition, the fact that new criteria could be included in the model depending on the social, economic, cultural, and ecological structures of the cities will offer planning approaches according to the internal dynamics of the cities.
Climate change is causing the rapid warming of cities, where extreme heat and droughts are likely to be major challenges in the next few decades [109,110]. Thus, using BGI as NbS is an indispensable planning approach for arid and semi-arid regions. Being located in a region characterized by arid climatic conditions, Phoenix is adversely affected by extreme climatic conditions, which are rapidly changing due to climate change. This negative impact particularly damages fragile populations (children, the elderly, and people with disabilities) in areas where socially vulnerable groups are located. It also leads to a decrease in ecosystem services and the disruption of the ecological balance.
Nature-based solutions, such as BGI, buffer against the negative impacts of climate change, and they have an important role in planning and building sustainable and livable cities. In this context, integrating BGI into Phoenix’s zoning planning processes and plans will contribute to mitigating many of the negative impacts associated with climate change and urbanization. Finally, our city-wide analysis precludes a higher level of detailed granularity and the recommendation of site-specific NbS BGI strategies at the city block level; however, we believe that subsequent studies will be able to focus on the identified hotspots.

Supplementary Materials

The following supporting information can be downloaded at: https://www.mdpi.com/article/10.3390/land13091464/s1, File S1: Formulas and flowcharts for the methodology of the study [62,63,64,111,112,113,114,115,116,117,118,119,120]; File S2: Maps and tables of sub-criteria analysis results [100,121]; File S3: Analytic hierarchy process survey.

Author Contributions

Conceptualization, R.O., P.C. and C.C.; methodology, R.O.; software, R.O.; formal analysis, R.O.; investigation, R.O.; writing—original draft preparation, R.O., P.C. and C.C.; writing—review and editing, R.O., P.C. and C.C.; visualization, R.O. All authors have read and agreed to the published version of the manuscript.

Funding

This research was funded by the Scientific and Technological Research Council of Turkey (TUBITAK) Science Fellowships and Grant Programme Directorate, grant number 1059B192201012, 2022/1.

Data Availability Statement

The raw data supporting the conclusions of this article will be made available by the authors on request.

Conflicts of Interest

The authors declare no conflicts of interest.

References

  1. Langemeyer, J.; Wedgwood, D.; McPhearson, T.; Baró, F.; Madsen, A.L.; Barton, D.N. Creating urban green infrastructure where it is needed—A spatial ecosystem service-based decision analysis of green roofs in Barcelona. Sci. Total Environ. 2020, 707, 135487. [Google Scholar] [CrossRef] [PubMed]
  2. García-Pardo, K.A.; Moreno-Rangel, D.; Domínguez-Amarillo, S.; García-Chávez, J.R. Remote sensing for the assessment of ecosystem services provided by urban vegetation: A review of the methods applied. Urban For. Urban Green. 2022, 74, 127636. [Google Scholar] [CrossRef]
  3. Arnold, J.; Kleemann, J.; Fürst, C. A Differentiated Spatial Assessment of Urban Ecosystem Services Based on Land Use Data in Halle, Germany. Land 2018, 7, 101. [Google Scholar] [CrossRef]
  4. Hansen, R.; Olafsson, A.S.; Van der Jagt, A.P.; Rall, E.; Pauleit, S. Planning multifunctional green infrastructure for compact cities: What is the state of practice? Ecol. Indic. 2019, 96, 99–110. [Google Scholar] [CrossRef]
  5. Cheng, C.; Yang, Y.E.; Ryan, R.; Yu, Q.; Brabec, E. Assessing climate change-induced flooding mitigation for adaptation in Boston’s Charles River watershed, USA. Landsc. Urban Plan. 2017, 167, 25–36. [Google Scholar] [CrossRef]
  6. Kim, G.; Coseo, P. Urban park systems to support sustainability: The role of urban park systems in hot arid urban climates. Forests 2018, 9, 439. [Google Scholar] [CrossRef]
  7. Biasin, A.; Masiero, M.; Amato, G.; Pettenella, D. Nature-based solutions modeling and cost-benefit analysis to face climate change risks in an urban area: The case of Turin (Italy). Land 2023, 12, 280. [Google Scholar] [CrossRef]
  8. Lee, D.; Oh, K.; Suh, J. Diagnosis and prioritization of vulnerable areas of urban ecosystem regulation services. Land 2022, 11, 1804. [Google Scholar] [CrossRef]
  9. Cheng, C. Spatial climate justice and green infrastructure assessment: A case study for the Huron River watershed, Michigan, USA. J. Geogr. Inf. Sci. 2016, 1, 176–190. [Google Scholar] [CrossRef]
  10. Cheng, C. Climate justicescape and implications for urban resilience in American cities. In The Routledge Handbook of Urban Resilience, 1st ed.; Burayidi, M.A., Allen, A., Twigg, J., Wamsler, C., Eds.; Routledge: London, UK, 2019; pp. 83–96. [Google Scholar]
  11. Kim, J.; Kang, J. Development of hazard capacity factor design model for net-zero: Evaluation of the flood adaptation effects considering green-gray infrastructure interaction. Sustain. Cities Soc. 2023, 96, 104625. [Google Scholar] [CrossRef]
  12. Pour, S.H.; Wahab, A.K.A.; Shahid, S.; Asaduzzaman, M.; Dewan, A. Low impact development techniques to mitigate the impacts of climate-change-induced urban floods: Current trends, issues and challenges. Sustain. Cities Soc. 2020, 62, 102373. [Google Scholar] [CrossRef]
  13. Gao, D.; Feng, H.; Cao, Y. The spatial spillover effect of innovative city policy on carbon efficiency: Evidence from China. Econ. Surv. Singap. 2024, 1–23. [Google Scholar] [CrossRef]
  14. Gao, D.; Zhou, X.; Wan, J. Unlocking sustainability potential: The impact of green finance reform on corporate ESG performance. Corp. Soc. Responsib. Environ. Manag. 2024, 31, 4211–4226. [Google Scholar] [CrossRef]
  15. Alkhaled, S.; Coseo, P.; Brazel, A.; Cheng, C.; Sailor, D. Between aspiration and actuality: A systematic review of morphological heat mitigation strategies in hot urban deserts. Urban Clim. 2020, 31, 100570. [Google Scholar] [CrossRef]
  16. Hu, X.; Cao, J.; Qian, Y.; Zhou, W.; Zheng, Z. Extreme heat events in mainland China from 1981 to 2015: Spatial patterns, temporal trends, and urbanization impacts. Sustain. Cities Soc. 2024, 100, 104999. [Google Scholar] [CrossRef]
  17. Lipponen, A.H.; Mikkonen, S.; Kollanus, V.; Tiittanen, P.; Lanki, T. Increase in summertime ambient temperature is associated with decreased sick leave risk in Helsinki, Finland. Environ. Res. 2024, 240, 117396. [Google Scholar] [CrossRef]
  18. Ravindiran, G.; Rajamanickam, S.; Kanagarathinam, K.; Hayder, G.; Janardhan, G.; Arunkumar, P.; Arunachalam, S.; AlObaid, A.A.; Warad, I.; Muniasamy, S.K. Impact of air pollutants on climate change and prediction of air quality index using machine learning models. Environ. Res. 2023, 239, 117354. [Google Scholar] [CrossRef]
  19. Olmstead, S.M. Climate change adaptation and water resource management: A review of the literature. Energy Econ. 2014, 46, 500–509. [Google Scholar] [CrossRef]
  20. Almaaitah, T.; Appleby, M.; Rosenblat, H.; Drake, J.; Joksimovic, D. The potential of blue-green infrastructure as a climate change adaptation strategy: A systematic literature review. Blue-Green Syst. 2021, 3, 223–248. [Google Scholar] [CrossRef]
  21. Undurraga, R.; Vicuña, S.; Melo, O. Compensating water service interruptions to implement a safe-to-fail approach to climate change adaptation in urban water supply. Water 2020, 12, 1540. [Google Scholar] [CrossRef]
  22. Lenaker, A.; Seymour, F. Global Emissions and Local Deforestation Are Combining to Create Dangerous Levels of Heat Stress in the Tropics; World Resources Institute: Washington, DC, USA, 2022; Available online: https://www.wri.org/ (accessed on 2 September 2023).
  23. Hutley, N.; Dean, A.; Hart, N.; Daley, J. Uninsurable Nation: Australia’s Most Climate-Vulnerable Places, 1st ed.; Climate Council: Sydney, Australia, 2022; pp. 1–29. [Google Scholar]
  24. Ariyarathna, I.S.; Abeyrathna, W.P.; Jamei, E.; Chau, H. A Review of the application of blue–green infrastructure (BGI) as an effective urban flood mitigation strategy for livable and healthy cities in Australia. Architecture 2023, 3, 461–476. [Google Scholar] [CrossRef]
  25. Meerow, S. The politics of multifunctional green infrastructure planning in New York City. Cities 2020, 100, 102621. [Google Scholar] [CrossRef]
  26. Acosta, F.; Haroon, S. Memorial Parking Trees: Resilient Modular Design with Nature-Based Solutions in Vulnerable Urban Areas. Land 2021, 10, 298. [Google Scholar] [CrossRef]
  27. Hamstead, Z.; Coseo, P. Building policies, plans, and cities to manage extreme weather events: Perspectives from urban planning and landscape architecture. In Transforming Global Health, 1st ed.; Smith, K.H., Ram, P.K., Eds.; Springer: Cham, Switzerland, 2020; Volume 1, pp. 261–283. [Google Scholar]
  28. Cohen-Shacham, E.; Walters, G.; Janzen, C.; Maginnis, S. Nature-Based Solutions to Address Global Societal Challenges, 1st ed.; IUCN: Gland, Switzerland, 2016; 97p. [Google Scholar]
  29. Meerow, S.; Newell, J.P. Spatial planning for multifunctional green infrastructure: Growing resilience in Detroit. Landsc. Urban Plan. 2017, 159, 62–75. [Google Scholar] [CrossRef]
  30. Parker, J.; Zingoni de Baro, M.E. Green infrastructure in the urban environment: A systematic quantitative review. Sustainability 2019, 11, 3182. [Google Scholar] [CrossRef]
  31. Slätmo, E.; Nilsson, K.; Turunen, E. Implementing green infrastructure in spatial planning in Europe. Land 2019, 8, 62. [Google Scholar] [CrossRef]
  32. Wei, J.; Qian, J.; Tao, Y.; Hu, F.; Ou, W. Evaluating spatial priority of urban green infrastructure for urban sustainability in areas of rapid urbanization: A case study of Pukou in China. Sustainability 2018, 10, 327. [Google Scholar] [CrossRef]
  33. Everett, G.; Adekola, O.; Lamond, J. Developing a blue-green infrastructure (BGI) community engagement framework template. Urban Des. Int. 2023, 28, 172–188. [Google Scholar] [CrossRef]
  34. Vujadinovič, D.; Šabić, D. The importance of regions in geographical research. Importance Reg. Geogr. Res. 2017, 913, 195–208. [Google Scholar] [CrossRef]
  35. O’Donnell, E.C.; Netusil, N.R.; Chan, F.K.S.; Dolman, N.J.; Gosling, S.N. International perceptions of urban blue-green infrastructure: A comparison across four cities. Water 2021, 13, 544. [Google Scholar] [CrossRef]
  36. Dolman, N.; O’Donnell, H. 5 Lessons Learned from Blue-Green Infrastructure Delivery. Available online: https://www.ice.org.uk/news-and-insight/the-civil-engineer/july-2021/theory-and-practice-of-blue-green-infrastructure (accessed on 5 December 2023).
  37. Valente de Macedo, L.S.; Barda Picavet, M.E.; Puppim de Oliveira, J.A.; Shih, W. Urban green and blue infrastructure: A critical analysis of research on developing countries. J. Clean. Prod. 2021, 313, 127898. [Google Scholar] [CrossRef]
  38. Suleiman, L. Blue-green infrastructure, from niche to mainstream: Challenges and opportunities for planning in Stockholm. Technol. Forecast. Soc. Chang. 2021, 166, 120528. [Google Scholar] [CrossRef]
  39. Molné, F.; Donati, G.F.; Bolliger, J.; Fischer, M.; Maurer, M.; Bach, P.M. Supporting the planning of urban blue-green infrastructure for biodiversity: A multi-scale prioritisation framework. J. Environ. Manag. 2023, 342, 118069. [Google Scholar] [CrossRef] [PubMed]
  40. Kozak, D.; Henderson, H.; Rotbart, D.; Aradas, R. Blue-green infrastructure (BGI) in dense urban watersheds. The case of the Medrano Stream Basin (MSB) in Buenos Aires. Sustainability 2020, 12, 2163. [Google Scholar] [CrossRef]
  41. Gomes, M.V.R.; Battemarco, B.P.; Guimarães, L.F.; Oliveira, A.K.B.D.; Rutigliani, V.D.A.; Cabral, F.M.; Bezerra, R.D.O.P.; Lourenço, I.B.; Rezende, O.M.; Magalhães, P.C.D.; et al. The use of blue-green infrastructure as a multifunctional approach to watersheds with socio-environmental vulnerability. Blue-Green Syst. 2021, 3, 281–297. [Google Scholar] [CrossRef]
  42. Ortega-Rosas, C.I.; Enciso-Miranda, C.A.; Macías-Duarte, A.; Morales-Romero, D.; Villarruel-Sahagún, L. Urban vegetation cover correlates with environmental variables in a desert city: Insights of mitigation measures to climate change. Urban Ecosyst. 2020, 23, 1191–1207. [Google Scholar] [CrossRef]
  43. Quay, R. Anticipatory governance: A tool for climate change adaptation. J. Am. Plan. Assoc. 2010, 76, 496–511. [Google Scholar] [CrossRef]
  44. Sharma, A.; Woodruff, S.; Budhathoki, M.; Hamlet, A.; Chen, F.; Fernando, H. Role of green roofs in reducing heat stress in vulnerable urban communities a multidisciplinary approach. Environ. Res. Lett. 2018, 13, 194011. [Google Scholar] [CrossRef]
  45. Meerow, S. A green infrastructure spatial planning model for evaluating ecosystem service tradeoffs and synergies across three coastal megacities. Environ. Res. Lett. 2019, 14, 125011. [Google Scholar] [CrossRef]
  46. Chang, H.-S.; Lin, Z.-H.; Hsu, Y.-Y. Planning for green infrastructure and mapping synergies and trade-offs: A case study in the Yanshuei River Basin, Taiwan. Urban For. Urban Green. 2021, 65, 127325. [Google Scholar] [CrossRef]
  47. Tran, T.J.; Helmus, M.R.; Behm, J.E. Green infrastructure space and traits (GIST) model: Integrating green infrastructure spatial placement and plant traits to maximize multifunctionality. Urban For. Urban Green. 2020, 49, 126635. [Google Scholar] [CrossRef]
  48. Dong, X.; Ye, Y.; Yang, R.; Li, X. Planning for green infrastructure based on integration of multi-driving factors: A case study in pilot site of sponge city. Sustain. Cities Soc. 2023, 93, 104549. [Google Scholar] [CrossRef]
  49. Arizona State Climate Office. Available online: https://azclimate.asu.edu/ (accessed on 17 October 2023).
  50. Cilek, A.; Unal, M.; Middel, A. The effects of 2-D and 3-D urban landscape metrics on mean radiant temperature in hot-arid Phoenix and Tempe, Arizona, USA. Sustain. Cities Soc. 2024, 101, 105116. [Google Scholar] [CrossRef]
  51. The City of Phoenix. Drought Information and Clean Air. 2023. Available online: https://www.phoenix.gov/ (accessed on 10 September 2023).
  52. Helmrich, A.; Kuhn, A.; Roque, A.; Santibanez, A.; Kim, Y.; Grimm, N.B.; Chester, M. Interdependence of social-ecological-technological systems in Phoenix, Arizona: Consequences of an extreme precipitation event. J. Infrastruct. Preserv. Resil. 2023, 4, 1–13. [Google Scholar] [CrossRef]
  53. Zhang, Y.; Murray, A.T.; Turner, B. Optimizing green space locations to reduce daytime and nighttime urban heat island effects in Phoenix, Arizona. Landsc. Urban Plan. 2017, 165, 162–171. [Google Scholar] [CrossRef]
  54. deBuys, W. The Least Sustainable City: Phoenix as a Harbinger for Our Hot Future. 2013. Available online: https://grist.org/climate-energy/the-least-sustainable-city-phoenix-as-a-harbinger-for-our-hot-future/ (accessed on 11 December 2023).
  55. Romantic, D.; Taszarek, M.; Brooks, H. Convective environments leading to microburst, macroburst and downburst events across the United States. Weather Clim. Extrem. 2022, 37, 100474. [Google Scholar] [CrossRef]
  56. Census Demographic and Housing Characteristics File. 2020. Available online: https://data.census.gov/ (accessed on 7 July 2023).
  57. Aragon, N.U.; Stuhlmacher, M.; Smith, J.P.; Clinton, N.; Georgescu, M. Urban agriculture’s bounty: Contributions to Phoenix’s sustainability goals. Environ. Res. Lett. 2019, 14, 105001. [Google Scholar] [CrossRef]
  58. National Weather Service. Annual and Monthly Record data for Phoenix. 2023. Available online: https://www.weather.gov/psr/ (accessed on 1 January 2024).
  59. Suchy, A.K.; Palta, M.M.; Stromberg, J.C.; Childers, D.L. High potential nitrate removal by urban accidental wetlands in a desert city: Limitations and spatiotemporal patterns. Ecosystems 2020, 23, 1227–1242. [Google Scholar] [CrossRef]
  60. Meerow, S.; Helmrich, A.M.; Andrade, R.; Larson, K.L. How do heat and flood risk drive residential green infrastructure implementation in Phoenix, Arizona? Urban Ecosyst. 2021, 24, 989–1000. [Google Scholar] [CrossRef]
  61. Kane, K.; Connors, J.P.; Galletti, C.S. Beyond fragmentation at the fringe: A path-dependent, high-resolution analysis of urban land cover in Phoenix, Arizona. Appl. Geogr. 2014, 52, 123–134. [Google Scholar] [CrossRef]
  62. Wright, M.; Watkins, L.; Hondula, D.; Kurtz, L.; Chakalian, P.; Harlan, S.; Declet-Barreto, J. Social and Heat Vulnerability Indices in Phoenix, Arizona. Environmental Data Initiative. 2019. Available online: https://scholar.google.com/citations?view_op=view_citation&hl=en&user=vMd8LmIAAAAJ&sortby=pubdate&citation_for_view=vMd8LmIAAAAJ:qjMakFHDy7sC (accessed on 17 September 2023).
  63. Logan, T.; Williams, T.; Nisbet, A.; Liberman, K.; Zuo, C.; Guikema, S. Evaluating urban accessibility: Leveraging open-source data and analytics to overcome existing limitations. Environ. Plan. B Urban Anal. City Sci. 2019, 46, 897–913. [Google Scholar] [CrossRef]
  64. Environmental Protection Agency. 2023. Available online: https://www.epa.gov/outdoor-air-quality-data/download-daily-data (accessed on 6 September 2023).
  65. Zhang, Y.; Turner II, B.L. Land-Cover Mapping of the Central Arizona Region Based on 2015 National Agriculture Imagery Program (NAIP) Imagery. 2020. Available online: https://sustainability-innovation.asu.edu/caplter/data/view/knb-lter-cap.685.1/ (accessed on 8 September 2023).
  66. McGarigal, K.; Cushman, S.A.; Ene, E. Fragstats v4: Spatial Pattern Analysis Program for Categorical Maps. Available online: https://www.fragstats.org (accessed on 12 October 2023).
  67. Chang, H.; Pallathadka, A.; Sauer, J.; Grimm, N.B.; Zimmerman, R.; Cheng, C.; Iwaniec, D.M.; Kim, Y.; Lloyd, R.; McPhearson, T.; et al. Assessment of urban flood vulnerability using the social-ecological-technological systems framework in six US cities. Sustain. Cities Soc. 2021, 68, 102786. [Google Scholar] [CrossRef]
  68. Goepel, K.D. Implementation of an online software tool for the analytic hierarchy process (AHP-OS). Int. J. Anal. Hierarchy Process. 2018, 10, 469–487. [Google Scholar]
  69. Wang, G.; Ostoja-Starzewski, M. Influence of topography on the Phoenix CO2 dome: A computational study. Atmos. Sci. Lett. 2004, 5, 103–107. [Google Scholar] [CrossRef]
  70. Pope, R.; Wu, J. Characterizing air pollution patterns on multiple time scales in urban areas: A landscape ecological approach. Urban Ecosyst. 2014, 17, 855–874. [Google Scholar] [CrossRef]
  71. Stone, E. Winter Air Really Is Worse in South, West Phoenix. Here’s Why. Azcentral. 2019. Available online: https://www.azcentral.com/ (accessed on 7 September 2023).
  72. IQAir. What Is the Air Quality in Phoenix Now? Available online: https://www.iqair.com/us/ (accessed on 12 November 2023).
  73. Grineski, S.; Bolin, B.; Boone, C. Criteria air pollution and marginalized populations: Environmental inequality in metropolitan Phoenix, Arizona. Soc. Sci. Q. 2007, 88, 535–554. [Google Scholar] [CrossRef]
  74. Kaus, E. The Importance of Green Infrastructures: The Case of Phoenix. 2020. Available online: https://upe2020.wordpress.com/2020/11/21/green-infrastructure-phoenix/ (accessed on 2 January 2024).
  75. Yang, J.; Wang, Z. Planning for a sustainable desert city: The potential water buffering capacity of urban green infrastructure. Landsc. Urban Plan. 2017, 167, 339–347. [Google Scholar] [CrossRef]
  76. Whittley, K. Tres Rios. Available online: http://www.azheritagewaters.nau.edu/loc_TresRios.html (accessed on 10 December 2023).
  77. Economides, C. Green Infrastructure: Sustainable Solutions in 11 Cities across the United States. 2014. Available online: https://water.columbia.edu/ (accessed on 23 October 2023).
  78. Stefanakis, A.I. The role of constructed wetlands as green infrastructure for sustainable urban water management. Sustainability 2019, 11, 6981. [Google Scholar] [CrossRef]
  79. The City of Phoenix. History of Tres Rios. Available online: https://www.phoenix.gov/waterservices/tresrios/wetlandsinfo (accessed on 3 January 2024).
  80. Kim, G.; Miller, P.A. The impact of green infrastructure on human health and well-being: The example of the Huckleberry Trail and the Heritage Community Park and Natural Area in Blacksburg, Virginia. Sustain. Cities Soc. 2019, 48, 101562. [Google Scholar] [CrossRef]
  81. Depietri, Y.; McPhearson, T. Integrating the grey, green, and blue in cities: Nature-based solutions for climate change adaptation and risk reduction. In Theory and Practice of Urban Sustainability Transitions, 1st ed.; Kabisch, N., Korn, H., Stadler, J., Bonn, A., Eds.; Springer: Cham, Switzerland, 2017; Volume 1, pp. 91–109. [Google Scholar]
  82. Ritchie, H.; Roser, M. Urbanization. 2019. Available online: https://ourworldindata.org/urbanization (accessed on 3 October 2023).
  83. Gilman, J.; Wu, J. Identifying broken linkages coupling water availability and dryland urbanization for sustainability: The case of the Phoenix metropolitan region, USA. J. Environ. Manag. 2024, 352, 120097. [Google Scholar] [CrossRef]
  84. Ross, A. Bird on Fire: Lessons from the World’s Least Sustainable City, 1st ed.; Oxford University Press: Oxford, UK, 2011. [Google Scholar]
  85. Lee, S.M.; Fernando, H.J.S.; Grossman-Clarke, S. Mm5-Smoke-Cmaq as a modeling tool for 8-h ozone regulatory enforcement: Application to the state of Arizona. Environ. Model. Assess. 2007, 12, 63–74. [Google Scholar] [CrossRef]
  86. Roggema, R.; Tillie, N. Realizing emergent ecologies: Nature-based solutions from design to implementation. Land 2022, 11, 1972. [Google Scholar] [CrossRef]
  87. Wentz, E.A.; Gober, P. Determinants of small-area water consumption for the City of Phoenix, Arizona. Sustain. Water Resour. Manag. 2007, 21, 1849–1863. [Google Scholar] [CrossRef]
  88. Shashua-Bar, L.; Pearlmutter, D.; Erell, E. The influence of trees and grass on outdoor thermal comfort in a hot-arid environment. Int. J. Climatol. 2011, 31, 1498–1506. [Google Scholar] [CrossRef]
  89. Houdeshel, C.D.; Hultine, K.R.; Johnson, N.C.; Pomeroy, C.A. Evaluation of three vegetation treatments in bioretention gardens in a semi-arid climate. Landsc. Urban Plan. 2015, 135, 62–72. [Google Scholar] [CrossRef]
  90. Larson, K.L.; Wiek, A.; Withycombe Keeler, L. A comprehensive sustainability appraisal of water governance in Phoenix, AZ. J. Environ. Manag. 2013, 116, 58–71. [Google Scholar] [CrossRef]
  91. Gober, P.; Kirkwood, C.W. Vulnerability assessment of climate-induced water shortage in Phoenix. Proc. Natl. Acad. Sci. USA 2010, 107, 21295–21299. [Google Scholar] [CrossRef]
  92. DeNicola, E.; Aburizaiza, O.S.; Siddique, A.; Khwaja, H.; Carpenter, D.O. Climate change and water scarcity: The case of Saudi Arabia. Ann. Glob. Health 2015, 81, 342–353. [Google Scholar] [CrossRef]
  93. Ismaeil, E.M.H.; Sobaih, A.E.E. Assessing xeriscaping as a retrofit sustainable water consumption approach for a Desert University campus. Water 2022, 14, 1681. [Google Scholar] [CrossRef]
  94. Chow, W.T.; Brazel, A.J. Assessing xeriscaping as a sustainable heat island mitigation approach for a desert city. Build. Environ. 2011, 47, 170–181. [Google Scholar] [CrossRef]
  95. Flower, W.; Burian, S.J.; Pomeroy, C.A.; Pardyjak, E.R. Surface Temperature and Heat Exchange Differences between Pervious Concrete and Traditional Concrete and Asphalt Pavements. In Proceedings of the Low Impact Development Conference, San Francisco, CA, USA, 11–14 April 2010. [Google Scholar]
  96. Meerow, S.; Natarajan, M.; Krantz, D. Green infrastructure performance in arid and semi-arid urban environments. Urban Water J. 2021, 18, 275–285. [Google Scholar] [CrossRef]
  97. Klok, L.; Zwart, S.; Verhagen, H.; Mauri, E. The surface heat island of Rotterdam and its relationship with urban surface characteristics. Resour. Conserv. Recycl. 2012, 64, 23–29. [Google Scholar] [CrossRef]
  98. Zheng, B.; Myint, S.W.; Fan, C. Spatial configuration of anthropogenic land cover impacts on urban warming. Landsc. Urban Plan. 2014, 130, 104–111. [Google Scholar] [CrossRef]
  99. Hondula, D.M.; Davis, R.E.; Saha, M.V.; Wegner, C.R.; Veazey, L.M. Geographic dimensions of heat-related mortality in seven U.S. cities. Environ. Res. 2015, 138, 439–452. [Google Scholar] [CrossRef]
  100. The City of Phoenix. The City of Phoenix Tree and Shade Master Plan (2010). Available online: https://www.phoenix.gov/parkssite/Documents/071957.pdf (accessed on 7 October 2023).
  101. Keys, E.; Wentz, E.A.; Redman, C.L. The spatial structure of land use from 1970–2000 in the Phoenix, Arizona, metropolitan area. Prof. Geogr. 2007, 59, 131–147. [Google Scholar] [CrossRef]
  102. American Lung Association. State of the Air. 2019. Available online: https://www.lung.org/ (accessed on 23 October 2023).
  103. Balsas, C.J.L. Improving land-use-based urbanism through award-winning planning practice and scholarship: A North American case study. Socio. Ecol. Pract. Res. 2023, 5, 275–291. [Google Scholar] [CrossRef]
  104. Ferrari, B.; Quatrini, V.; Barbati, A.; Corona, P.; Masini, E.; Russo, D. Conservation and enhancement of the green infrastructure as a nature-based solution for Rome’s sustainable development. Urban Ecosyst. 2019, 22, 865–878. [Google Scholar] [CrossRef]
  105. Seok, Y.; Ji, E.; Lee, J. How to manage urban disturbances: Focused on social-ecological vulnerability to fine dust pollution. Environ. Impact Assess. Rev. 2024, 104, 107317. [Google Scholar] [CrossRef]
  106. Chen, L.; Liu, C.; Zhang, L.; Zou, R.; Zhang, Z. Variation in tree species ability to capture and retain airborne fine particulate matter (PM2.5). Sci. Rep. 2017, 7, 3206. [Google Scholar] [CrossRef]
  107. Jia, Y.; Lu, K.; Zheng, T.; Li, X.; Liu, X.; Peng, Z.; He, H. Effects of roadside green infrastructure on particle exposure: A focus on cyclists and pedestrians on pathways between urban roads and vegetative barriers. Atmos. Pollut. Res. 2021, 12, 1–12. [Google Scholar] [CrossRef]
  108. McPhearson, T.; Cook, E.M.; Berbés-Blázquez, M.; Cheng, C.; Grimm, N.B.; Andersson, E.; Barbosa, O.; Chandler, D.G.; Chang, H.; Chester, M.V.; et al. A social-ecological-technological systems framework for urban ecosystem services. One Earth 2022, 5, 505–518. [Google Scholar] [CrossRef]
  109. Li, X.; Stringer, L.C.; Dallimer, M. The impacts of urbanisation and climate change on the urban thermal environment in Africa. Climate 2022, 10, 164. [Google Scholar] [CrossRef]
  110. Wang, T.; Sun, F. Integrated drought vulnerability and risk assessment for future scenarios: An indicator based analysis. Sci. Total Environ. 2023, 900, 165591. [Google Scholar] [CrossRef] [PubMed]
  111. Kopecký, M.; Macek, M.; Wild, J. Topographic Wetness Index calculation guidelines based on measured soil moisture and plant species composition. Sci. Total Environ. 2021, 757, 143785. [Google Scholar] [CrossRef] [PubMed]
  112. Brown de Colstoun, E.C.; Huang, C.; Wang, P.; Tilton, J.C.; Tan, B.; Phillips, J.; Niemczura, S.; Ling, P.Y.; Wolfe, R.E. Global Man-Made Impervious Surface (GMIS) Dataset from Landsat. 2017. Available online: https://sedac.ciesin.columbia.edu/data/set/ulandsat-gmis-v1 (accessed on 25 October 2023).
  113. Aslan, N. Detection of Urban Heat Islands from Landsat Imageries: A Case Study of West Mediterranean Region. Master’s Thesis, Akdeniz University, Antalya, Turkey, 2016. [Google Scholar]
  114. Artis, D.A.; Carnahan, W.H. Survey of emissivity variability in thermography of urban areas. Remote Sens. Environ. 1982, 12, 313–329. [Google Scholar] [CrossRef]
  115. Sobrino, J.A.; Jiménez-Muñoz, J.C.; Paolini, L. Land surface temperature retrieval from Landsat TM 5. Remote Sens. Environ. 2004, 90, 434–440. [Google Scholar] [CrossRef]
  116. Olgun, R.; Yılmaz, T. Determination of ecologically suitable settlement areas by using GIS-based multi-criteria decision making analysis: The case of Nigde province. Fresen. Environ. Bull. 2019, 28, 3768–3777. [Google Scholar]
  117. Görener, Ö. A swot-ahp approach for assessment of medical tourism sector in Turkey. Alphanumeric J. 2016, 4, 159–170. [Google Scholar] [CrossRef]
  118. Wind, Y.; Saaty, T.L. Marketing applications of the analytic hierarchy process. Manag. Sci. 1980, 26, 641–658. [Google Scholar] [CrossRef]
  119. Özdemir Işık, B.; Demir, S. Integrated multi-criteria decision-making methods for the sustainability of historical–cultural structures on the Trabzon coastline. Sustainability 2017, 9, 2114. [Google Scholar] [CrossRef]
  120. Zare, K.; Mehri-Tekmeh, J.; Karimi, S. A swot framework for analyzing the electricity supply chain using an integrated AHP methodology combined with fuzzy-topsis. Int. Strat. Manag. Rev. 2015, 3, 66–80. [Google Scholar] [CrossRef]
  121. Fao-Unesco. The Digital Soil Map of the World. Available online: https://www.fao.org/soils-portal/data-hub/soil-maps-and-databases/ (accessed on 21 October 2023).
Figure 1. Map of the study area boundary of the City of Phoenix, AZ, USA.
Land 13 01464 g001
Figure 2. Relative prioritized maps of GISP model criteria for each census tract in Phoenix, AZ.
Land 13 01464 g002
Figure 3. Statistical relationship between the planning criteria in the study.
Land 13 01464 g003
Figure 4. Map of hotspots for BGI planning in Phoenix, AZ.
Land 13 01464 g004
Table 1. The criteria and data sources utilized for the GISP model. Modified from Meerow and Newell [29].
GISP Model CriterionAbbreviationCriterion DatabaseDescription
1. Managing StormwaterMSFlood susceptibility mapping using GIS-AHP multi-criteria analysis
- Topographic wetness index
- Elevation
- Slope
- Precipitation
- Global man-made impervious surface dataset
- Normalized difference vegetation index (NDVI)
- Distance from river
- Distance from road
The analytic hierarchy process (AHP) method is used to assign weights to all data. The resulting data are then overlaid, and the values for each census tract are averaged.
2. Reducing Social VulnerabilitySoVIHeat vulnerability index (HVI)
Social vulnerability index (SoVI)
The SoVI with 27 social variables and the HVI with 10 social variables created by Wright et al. [62] from the 2012–2016 American Community Survey.
3. Increasing Access to Park AreasPAThe existing public parks (open street map, zoning plan)
Census data
Population-weighted distance to the nearest park [25,63].
4. Reducing the Urban Heat Island EffectUHILand surface temperature (LST) and UHIEstimates of average LST and UHI for each census tract obtained from Landsat for the last 10 years (years 2013, 2018, and 2023).
5. Improving Air QualityAQAir quality index (O3, PM2.5, PM10, CO, SO2, NO2)Air quality index between 2013 and 2022 is used [64].
6. Increasing Landscape ConnectivityLCThe physical continuity of vegetated areasThe high-resolution (1 m) Lidar image created by Zhang and Turner II [65] and the “Patch Cohesion Index” metric in the Fragstats 4.2 software [66].
Table 2. Results of the expert survey (N:39).
CriterionRatingRankingPairwise Comparison Weights
Rank OrderMeanStd. DeviationRank OrderMeanStd. DeviationRank OrderWeight
MS14.670.52922.542.53910.325
SoVI34.430.55233.311.21740.112
PA53.970.70643.641.11250.071
UHI24.460.55411.871.30120.270
AQ44.050.64754.621.18430.170
LC63.710.82564.791.85260.052
MS: managing stormwater, SoVI: reducing social vulnerability, PA: increasing access to park areas, UHI: reducing the urban heat island effect, AQ: improving air quality, LC: increasing landscape connectivity.
Disclaimer/Publisher’s Note: The statements, opinions and data contained in all publications are solely those of the individual author(s) and contributor(s) and not of MDPI and/or the editor(s). MDPI and/or the editor(s) disclaim responsibility for any injury to people or property resulting from any ideas, methods, instructions or products referred to in the content.

