
Exploring the Impact of Visual and Aural Elements in Urban Parks on Human Behavior and Emotional Responses


Abstract
:1. Introduction
1.1. The Health Benefits of Parks
1.2. The Effects of Visual or Auditory Elements on Human Behavior and Emotions
1.3. The Interactive Effects of Visual and Auditory Elements on Human Behavior and Emotions
2. Materials and Methods
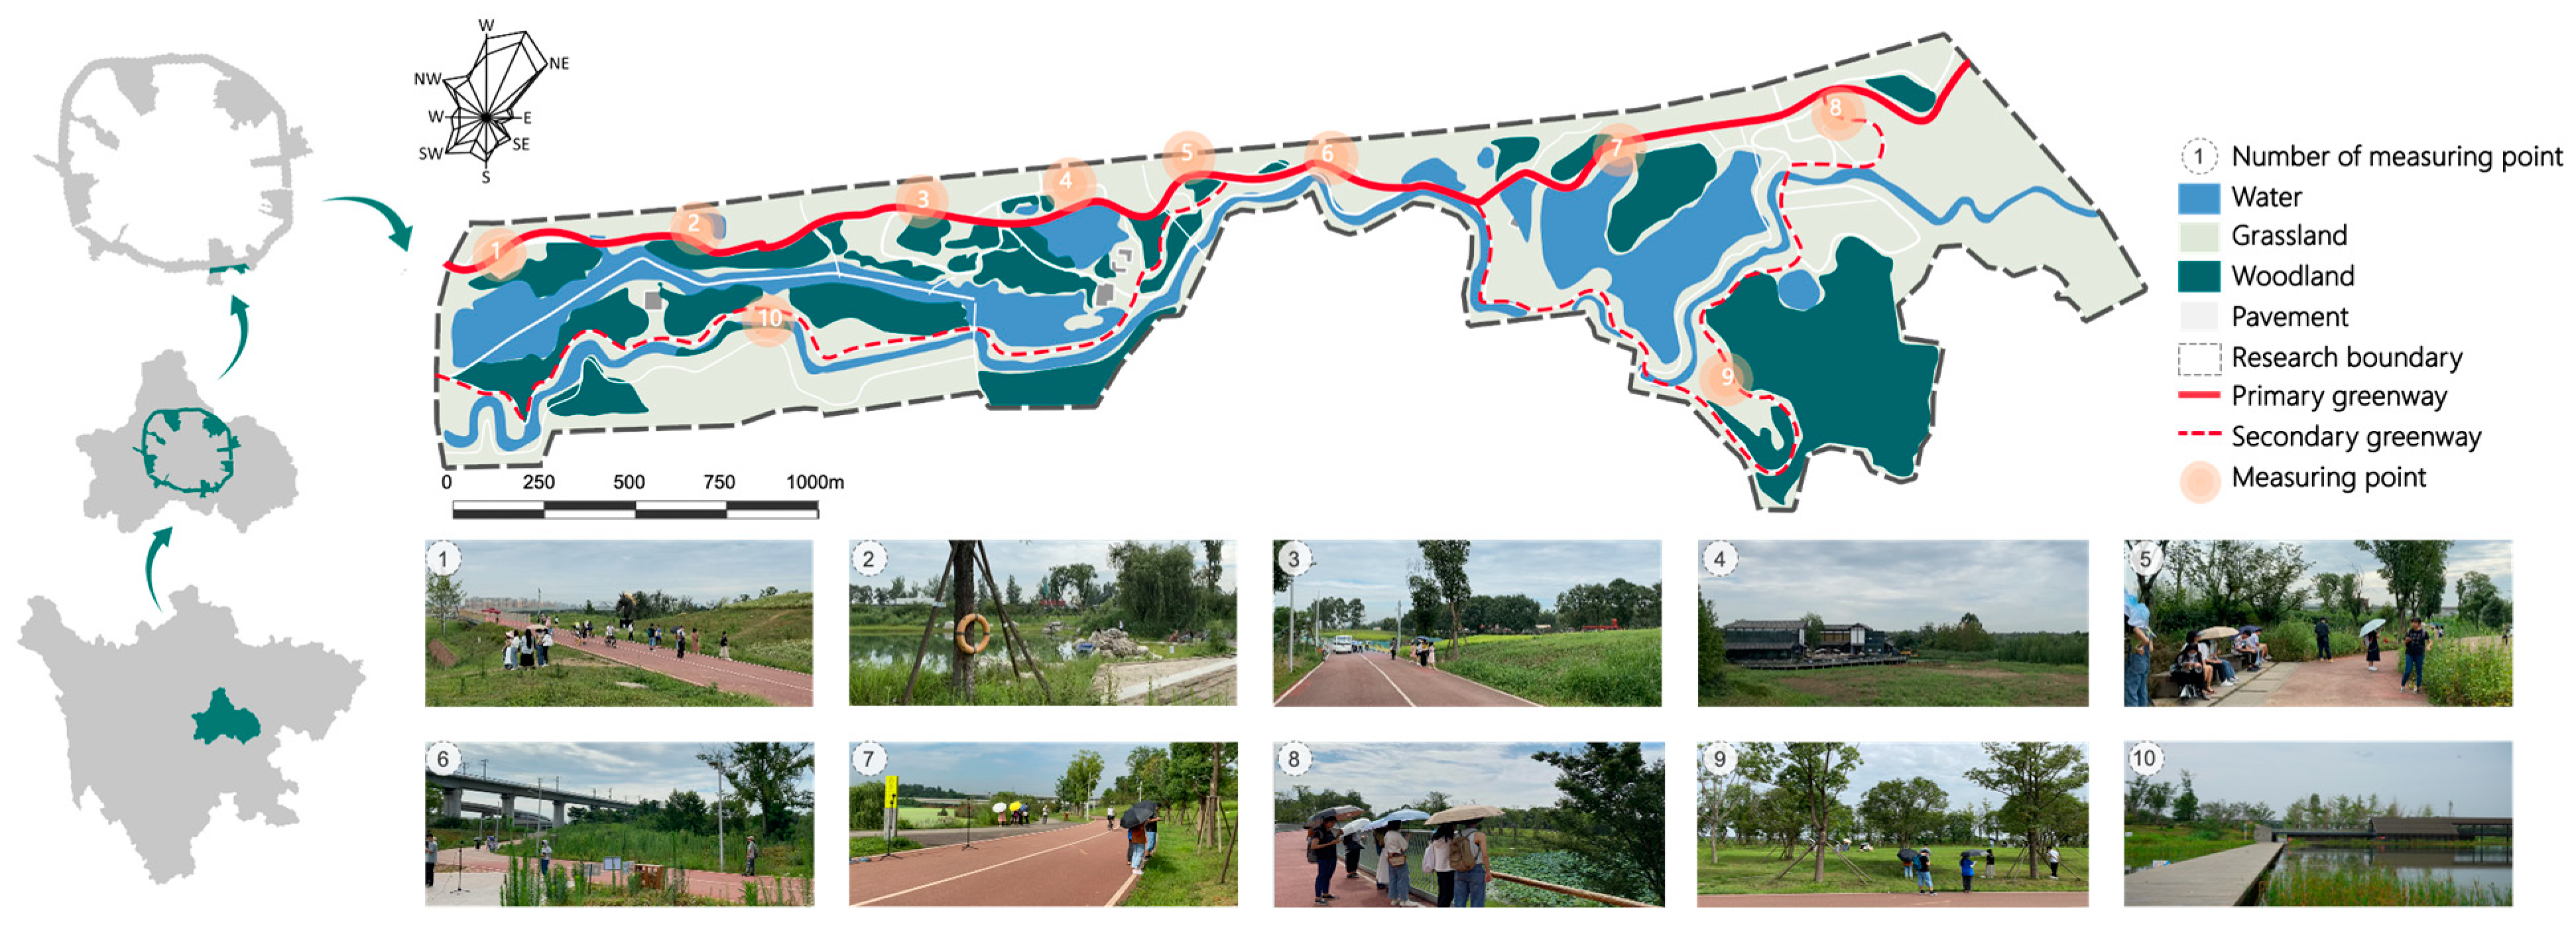
2.1. Research Site
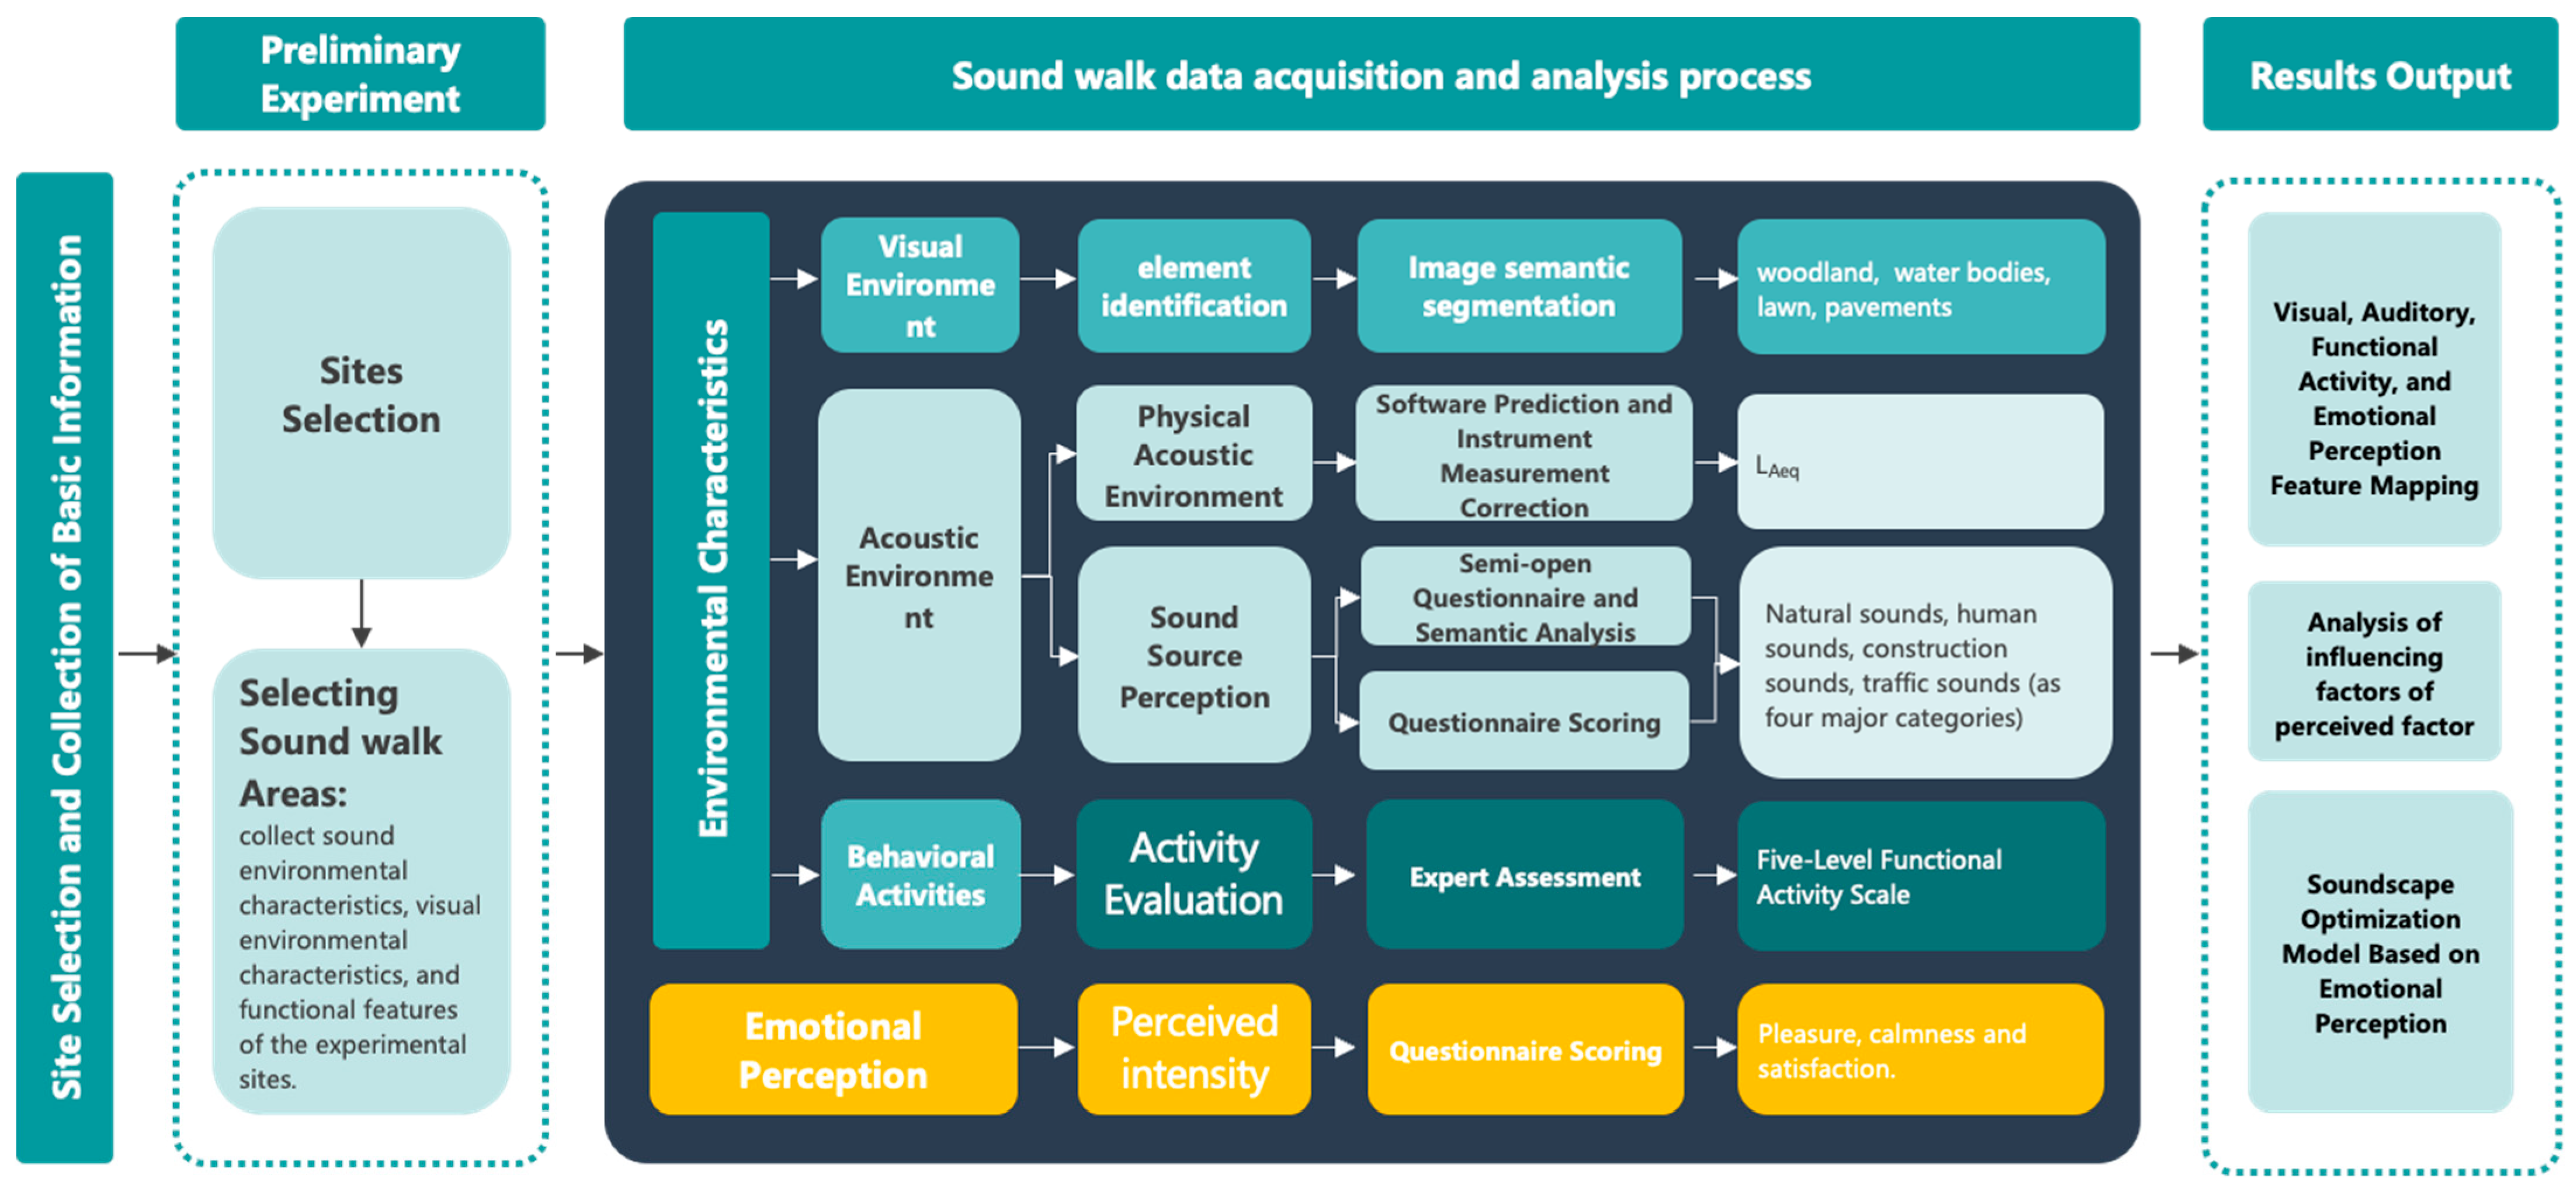
2.2. Measurements
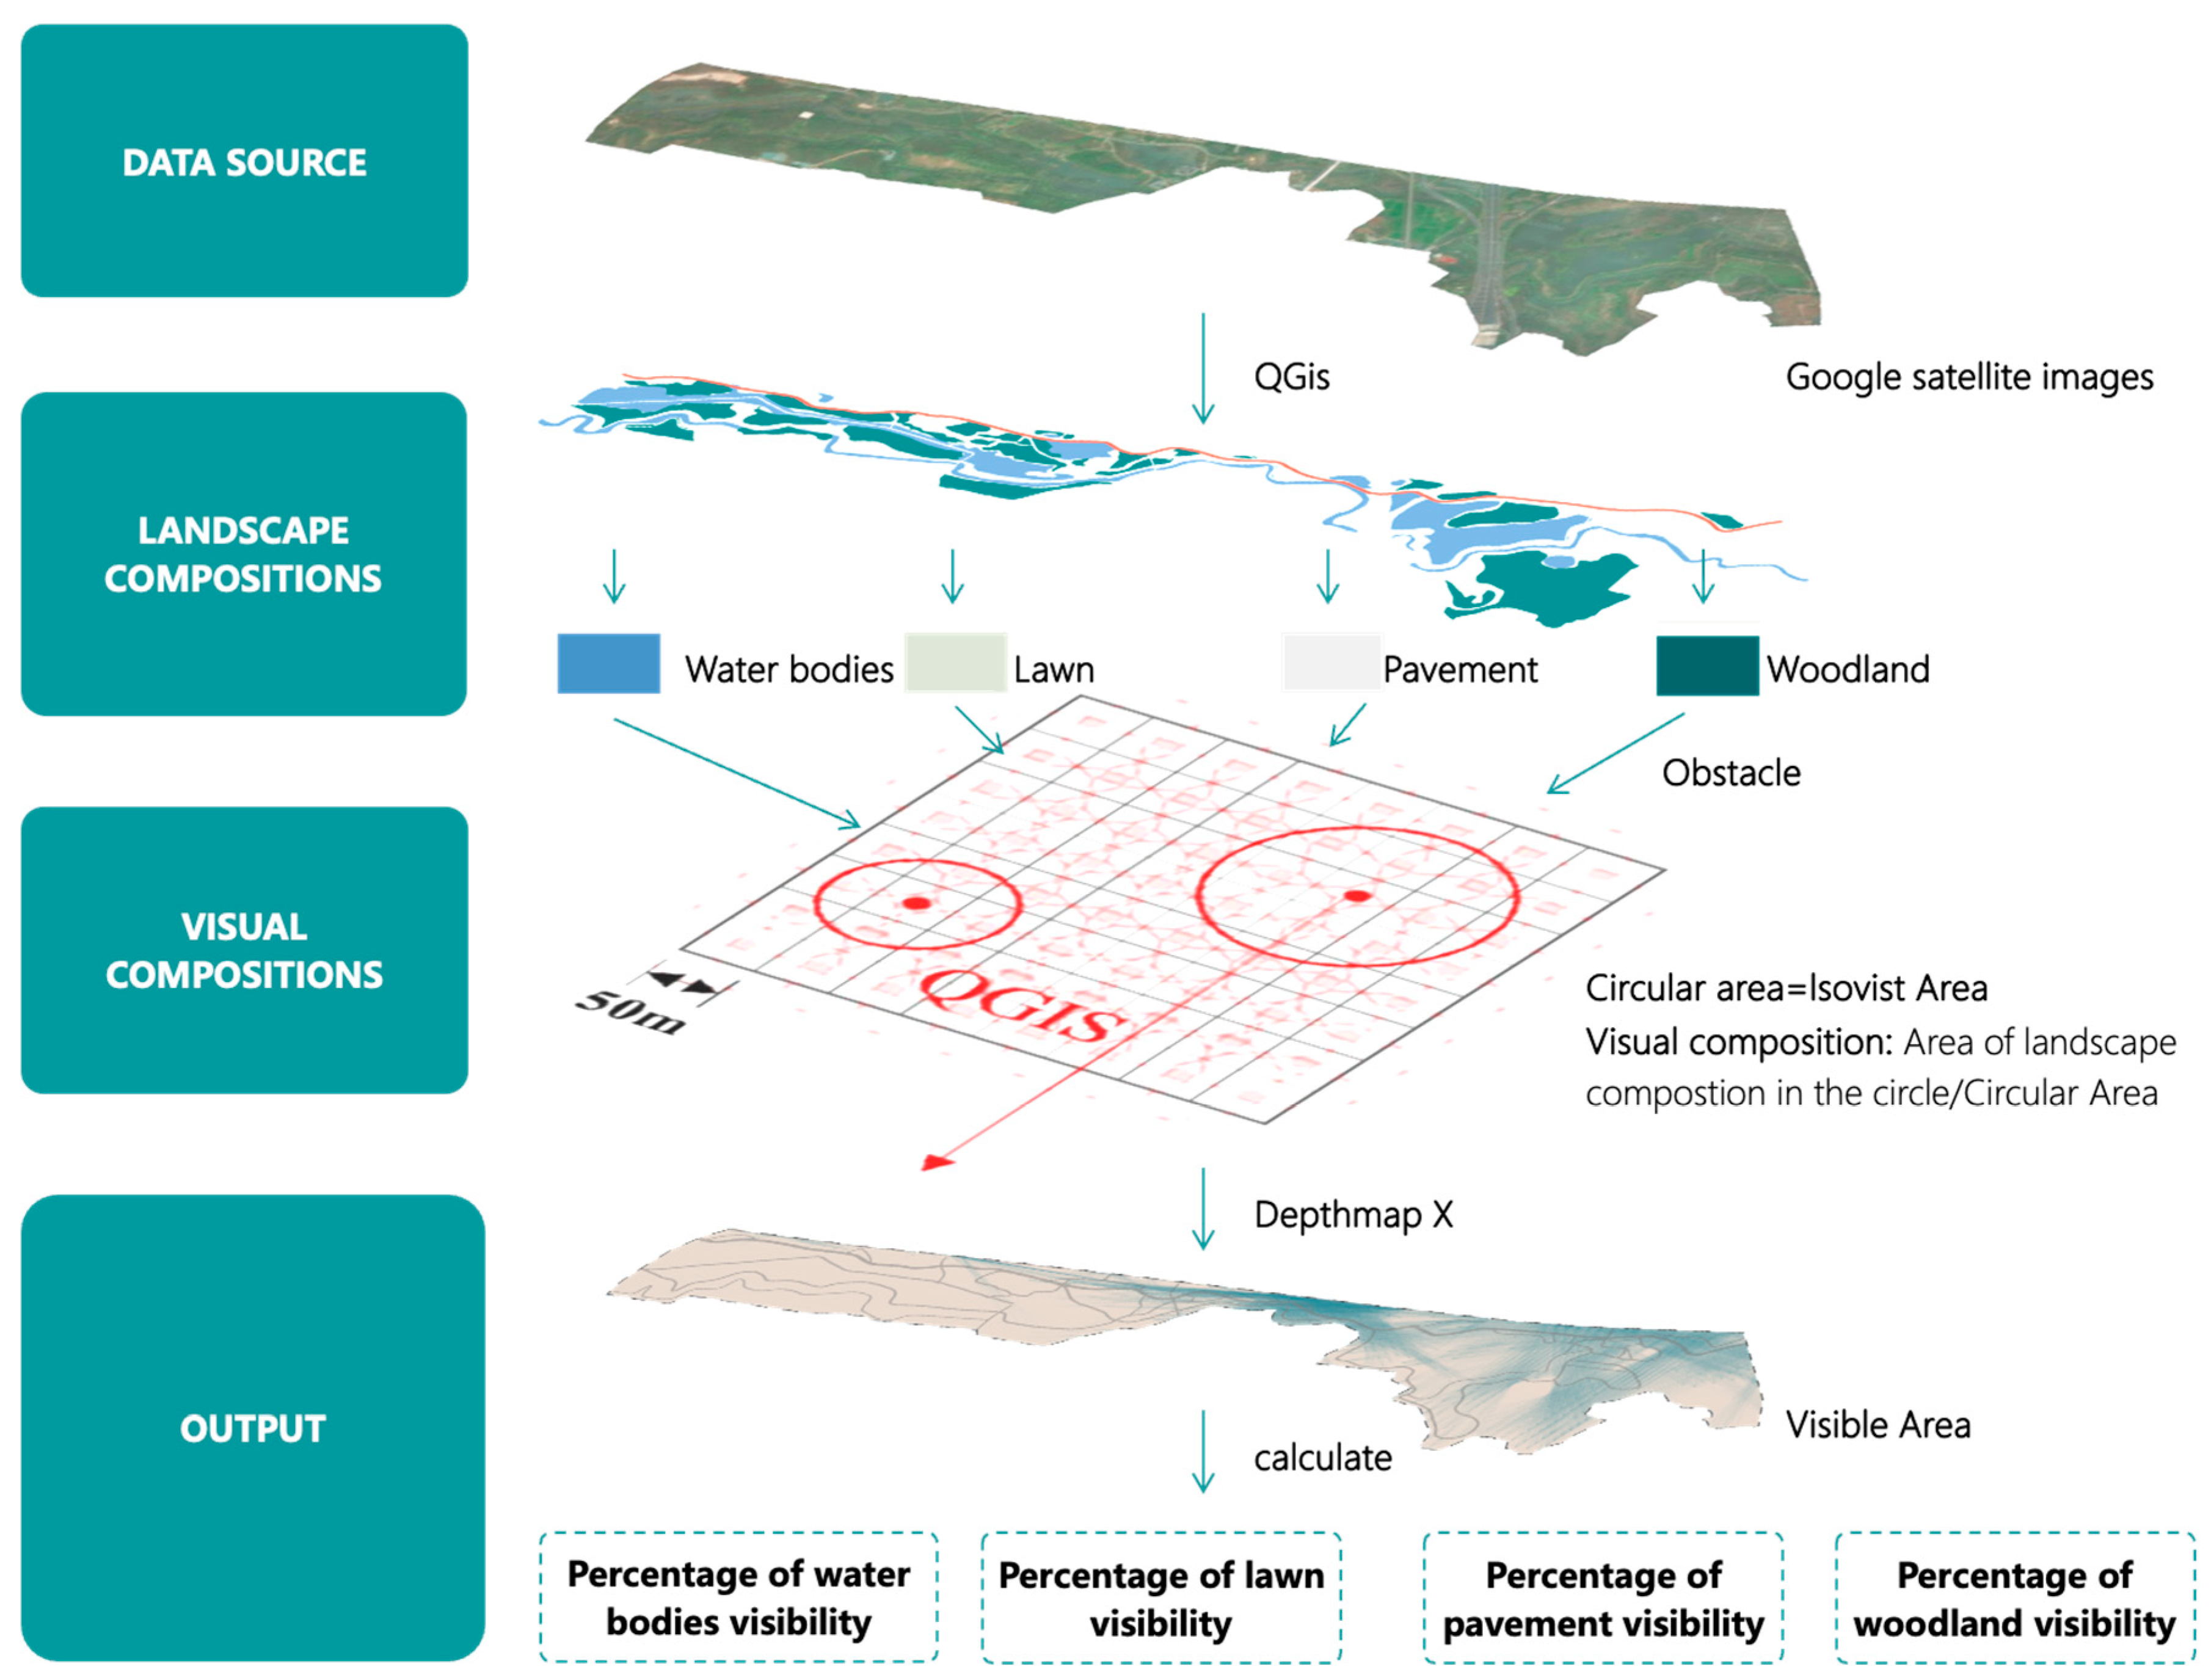
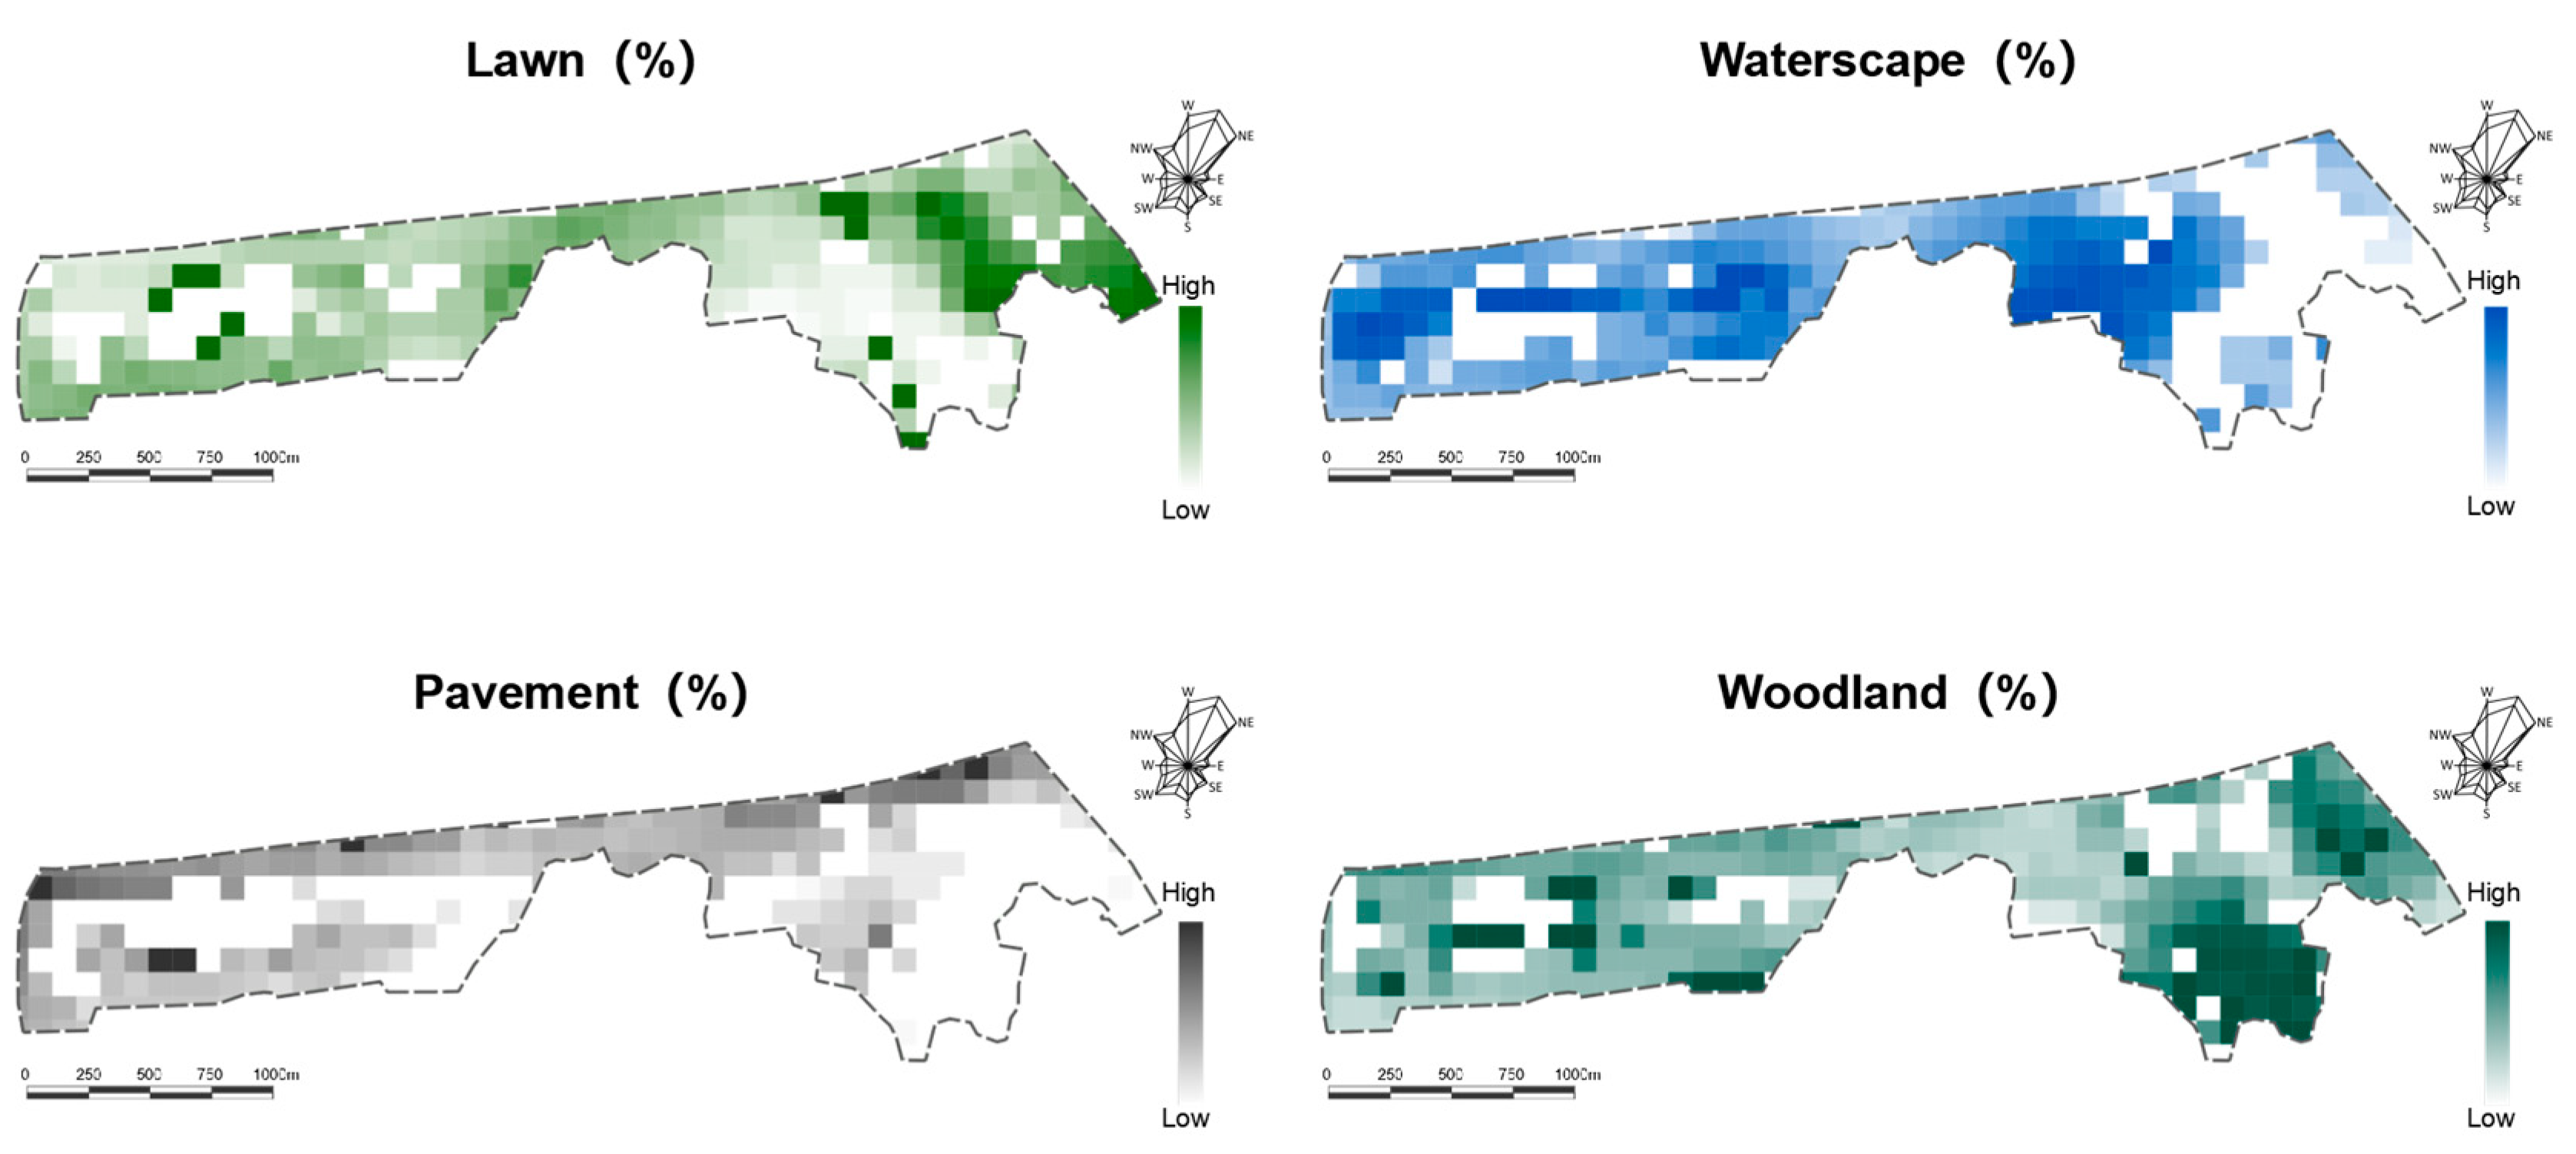
2.2.1. Visual Landscape Composition
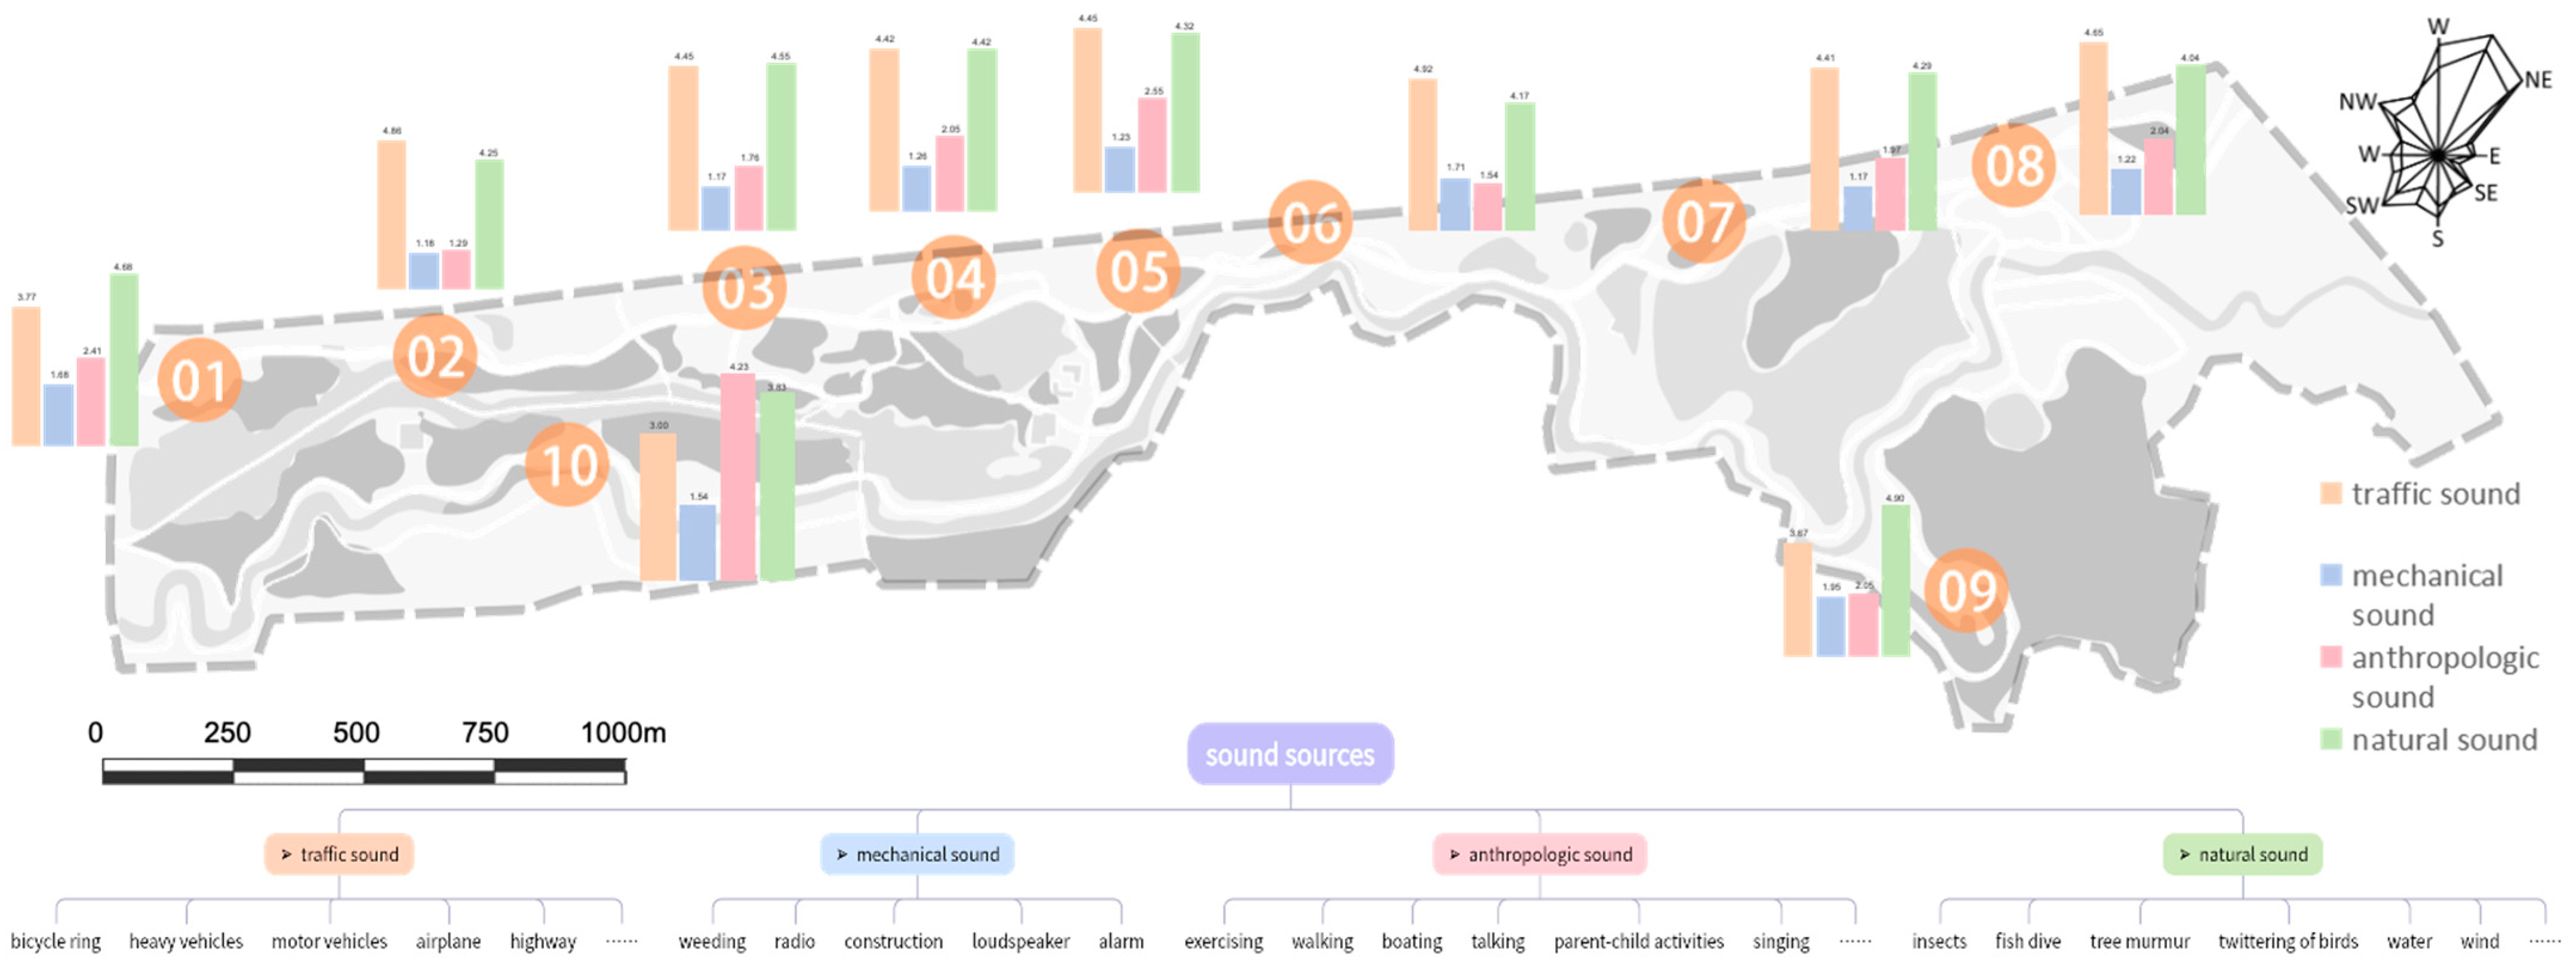
2.2.2. Auditory Environmental Characteristics
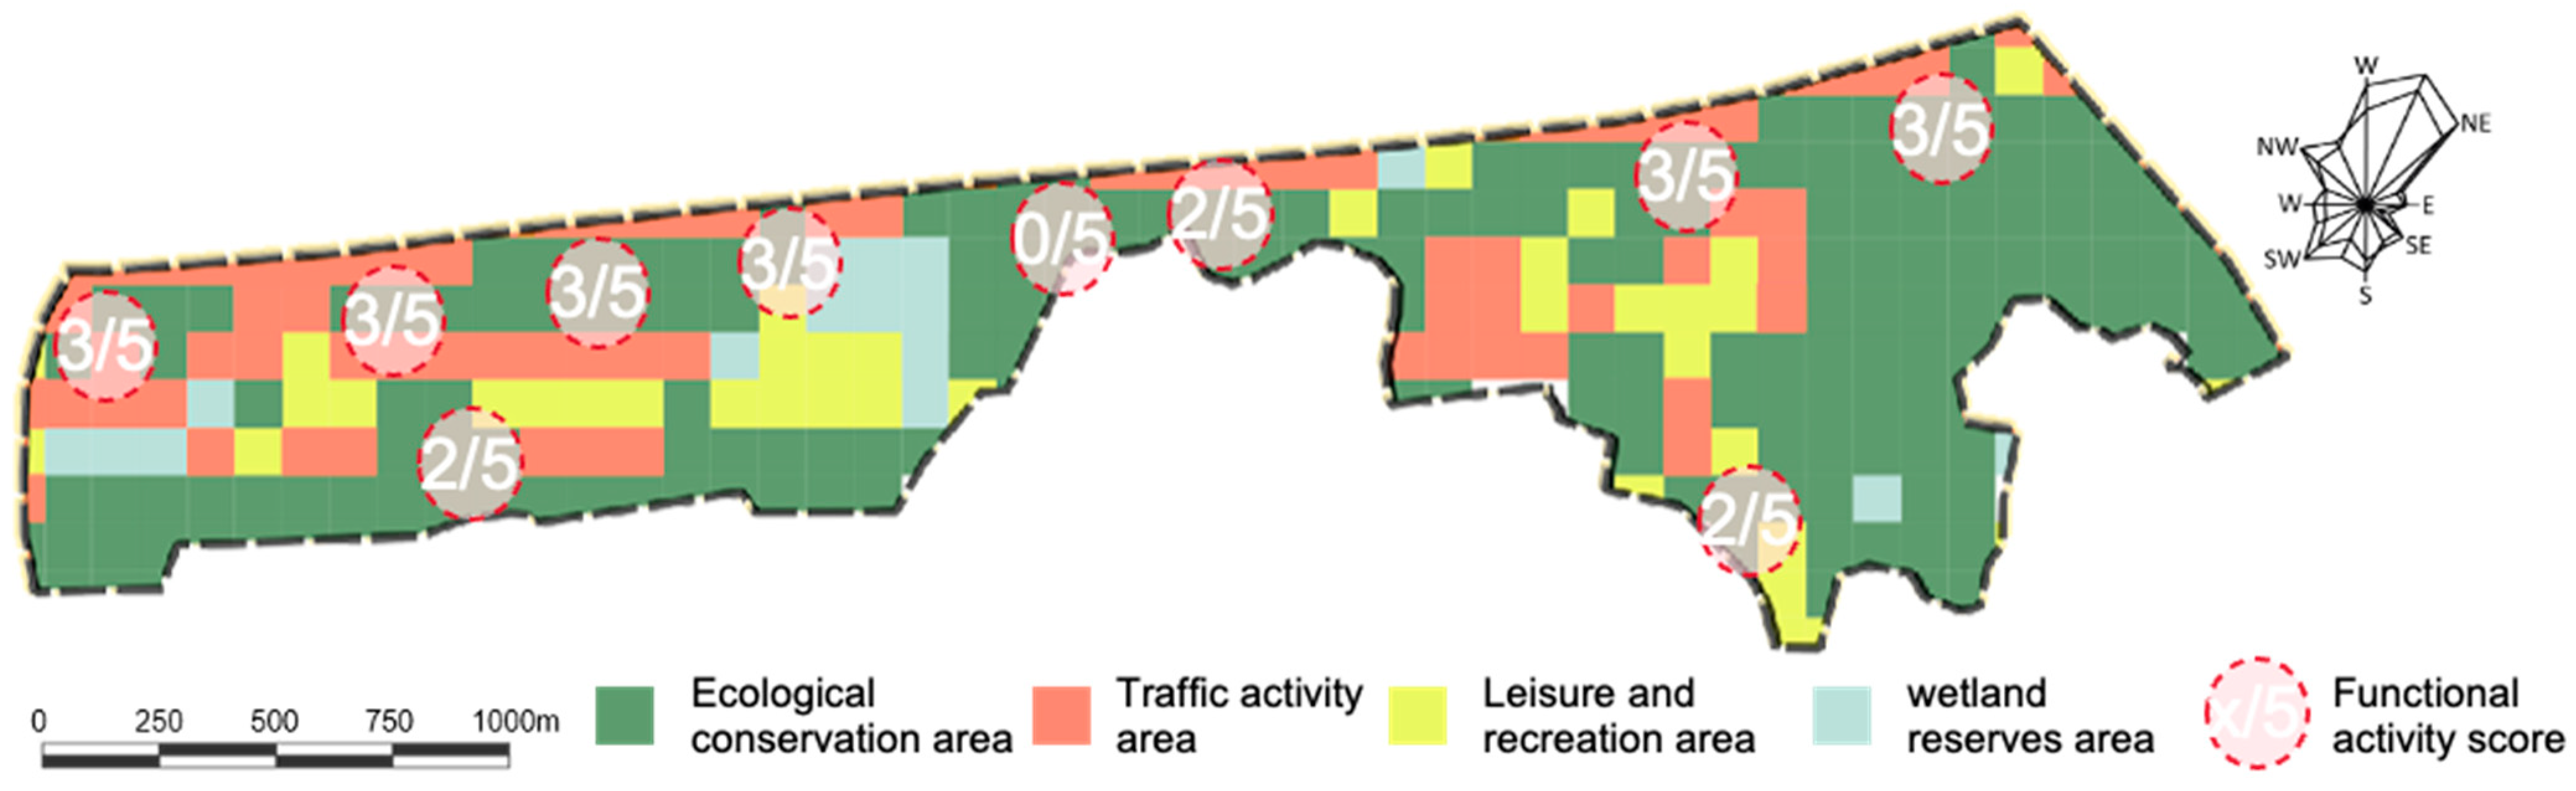
2.2.3. Behavioral Vitality Characteristics
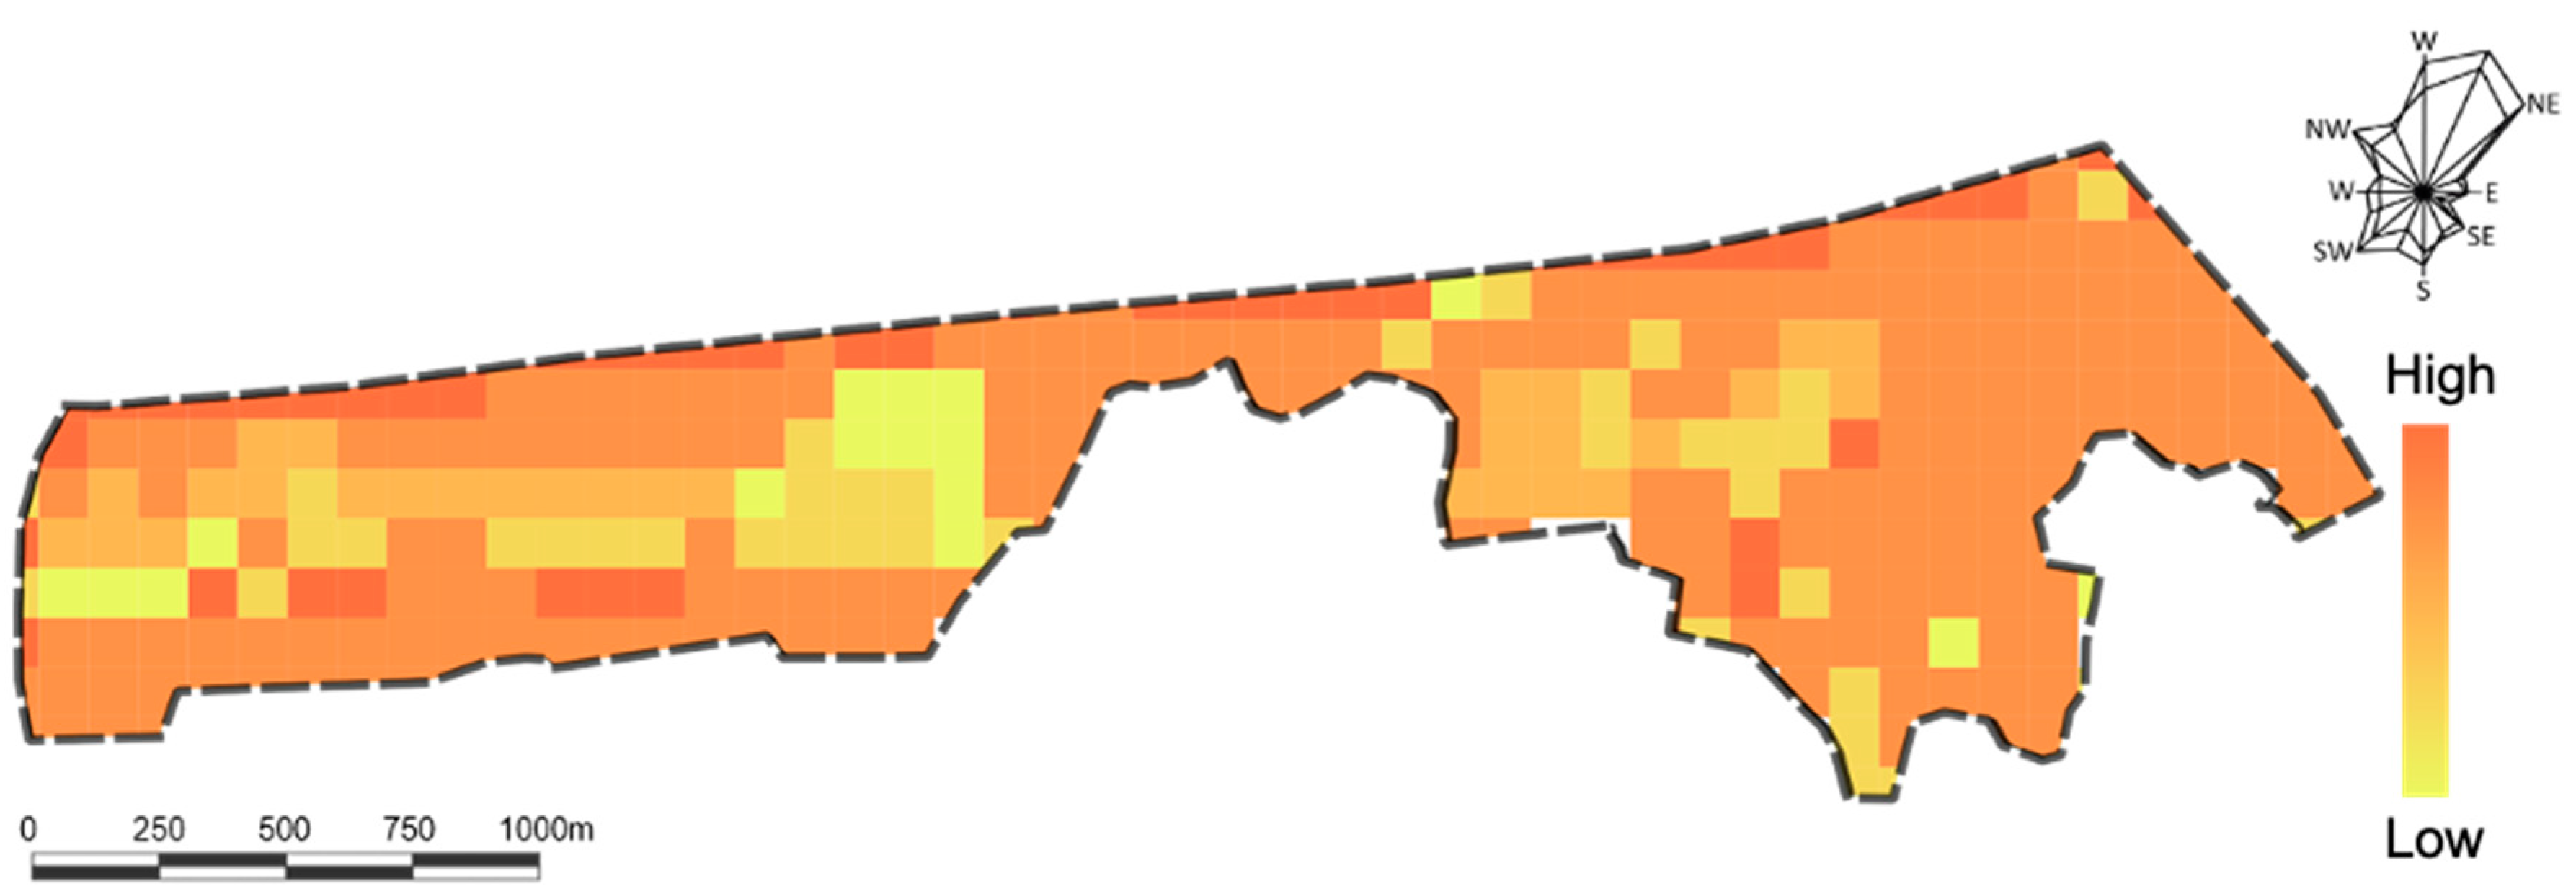
2.2.4. Emotional Perception Evaluation
2.3. Data Collection
2.4. Data Analysis and Visualization
3. Results
3.1. Manipulation Checks
3.2. Descriptive Analysis
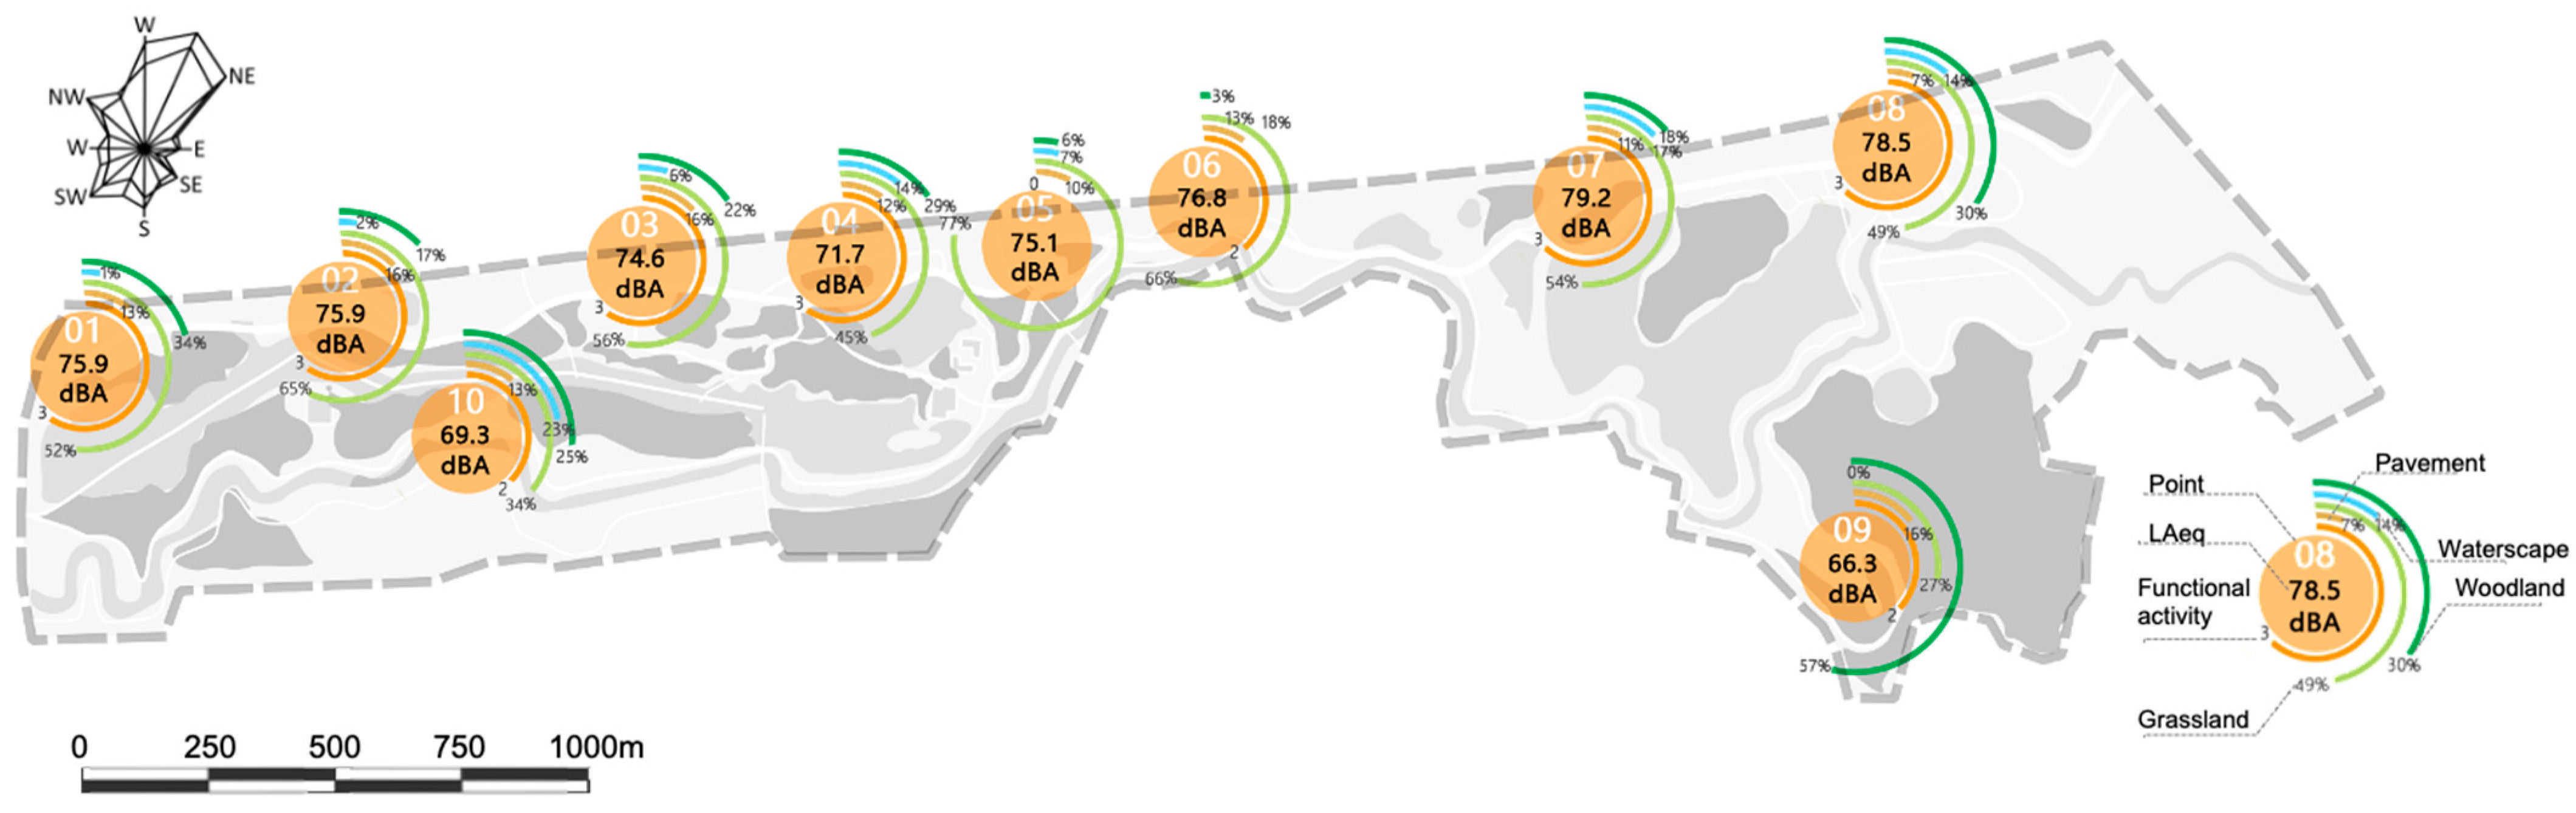
3.2.1. Descriptive Analysis of Visual Environmental Characteristics
3.2.2. Analysis of Auditory Environmental Characteristics
3.2.3. Analysis of Behavioral Vitality Characteristics
3.3. Analysis of Factors Influencing Sound Source Perception and Emotional Perception
3.3.1. Analysis of Factors Affecting the Intensity of Sound Source Perception
3.3.2. Analysis of Factors Influencing Emotional Perception
3.4. Emotional Perception Model Prediction
4. Discussion
4.1. Discussion on the Influence of Sound Source Perception Intensity
4.2. Emotional Responses and Audiovisual Landscape Elements
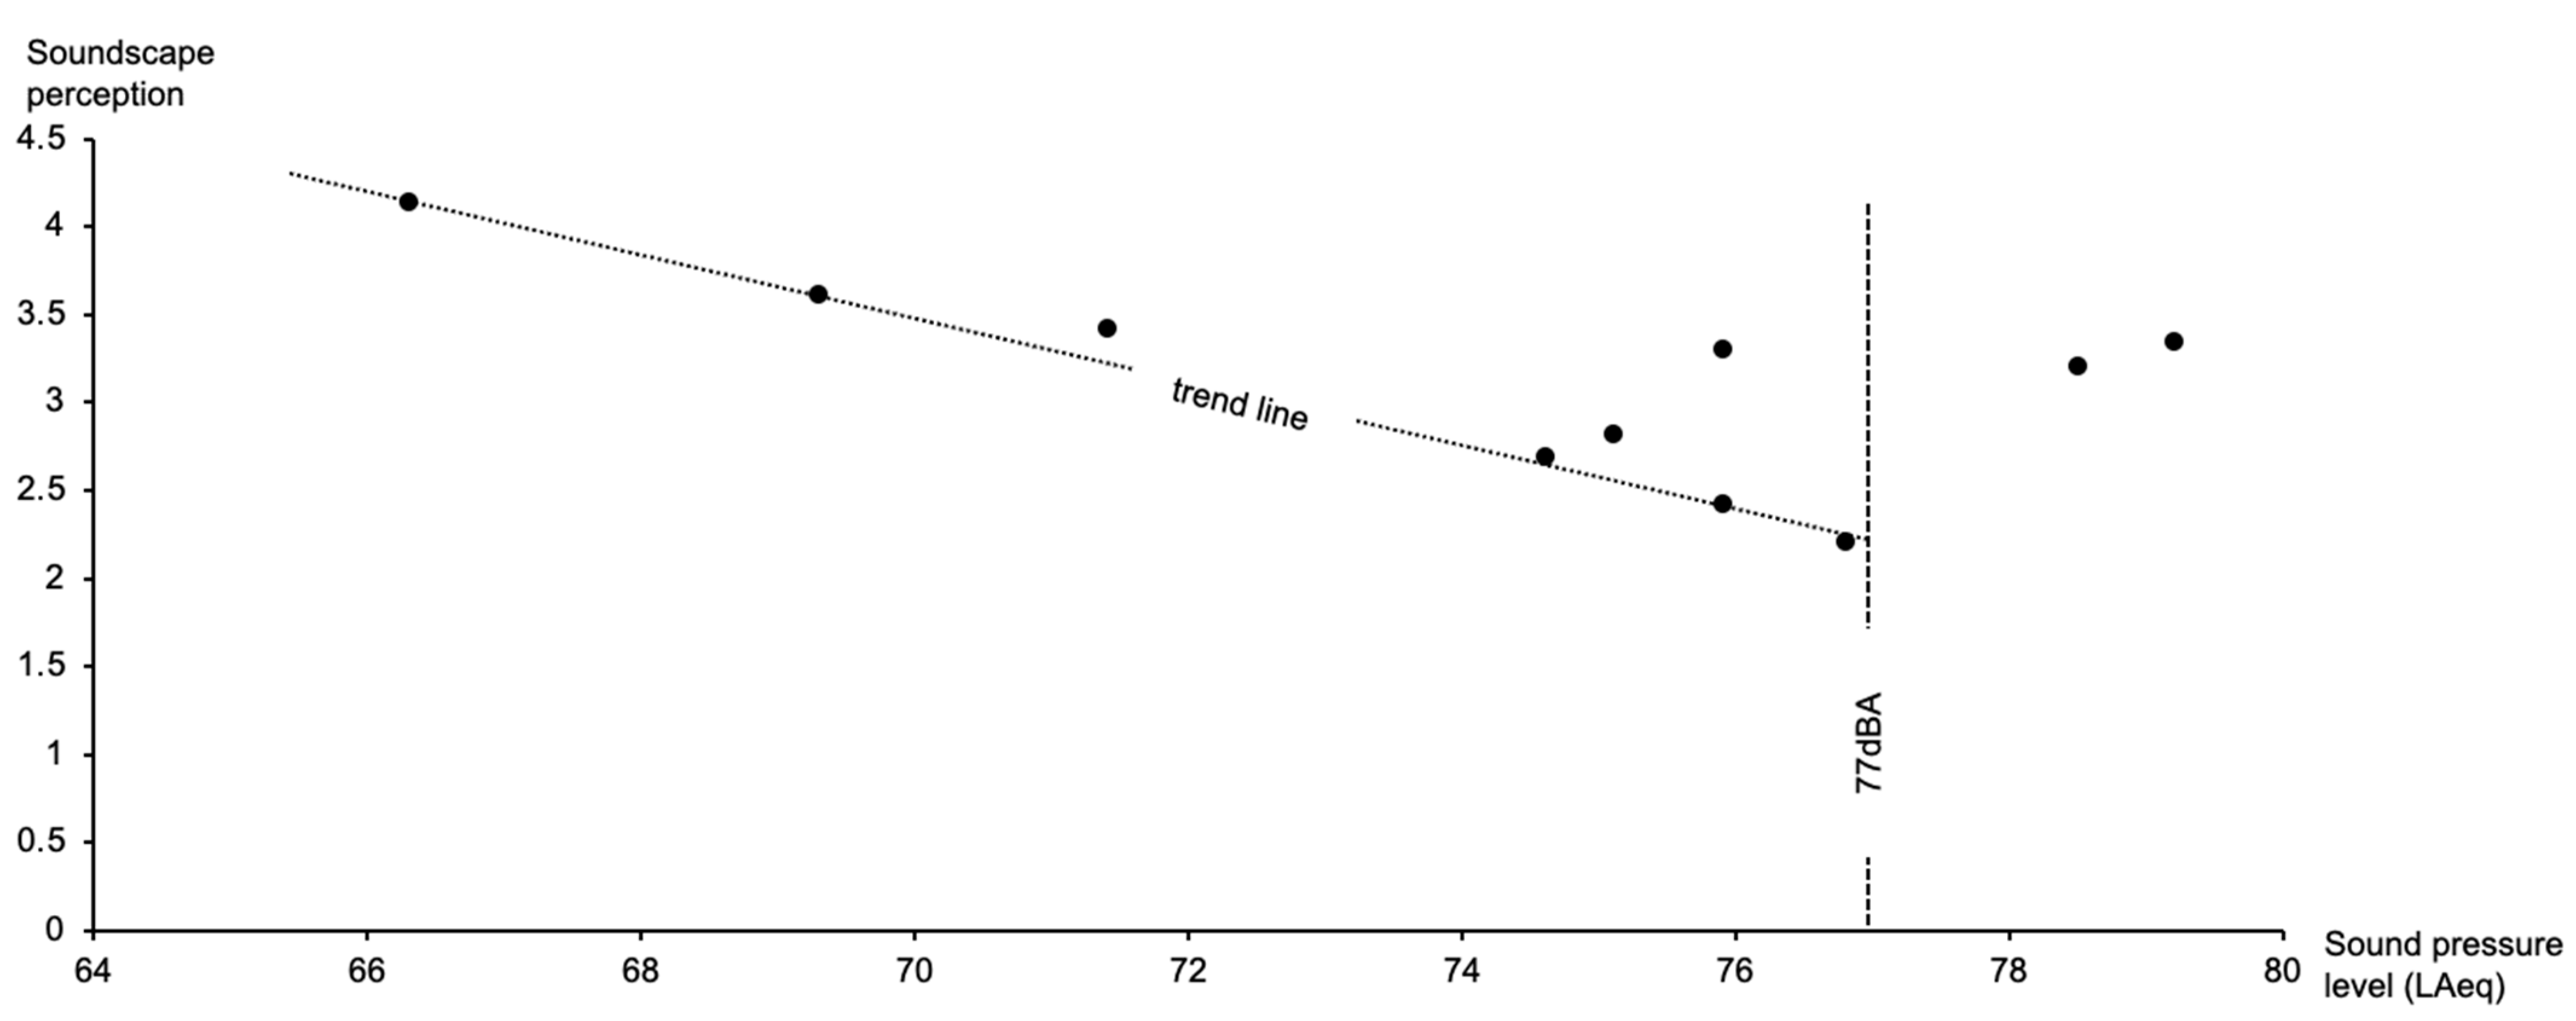
4.3. Guidance of Landscape Design Based on Sound Pressure Level and Emotional Perception
4.4. Limitations
5. Conclusions
Author Contributions
Funding
Data Availability Statement
Conflicts of Interest
References
- World Health Organization. Healthy Cities Vision. Available online: https://www.who.int/europe/news-room/fact-sheets/item/healthy-cities-vision (accessed on 30 July 2024).
- U.S. Environmental Protection Agency. Green Infrastructure: Design and Implementation. Available online: https://19january2017snapshot.epa.gov/green-infrastructure/green-infrastructure-design-and-implementation_.html (accessed on 30 July 2024).
- National Health Service. Healthy New Towns. Available online: https://www.england.nhs.uk/ourwork/innovation/healthy-new-towns/ (accessed on 30 July 2024).
- National Health Commission. Healthy China 2030 Planning Outline. 2016. Available online: http://www.nhc.gov.cn/xxgk/pages/healthy-china-2030 (accessed on 30 July 2024).
- Ulrich, R.S. View through a window may influence recovery from surgery. Science 1984, 224, 420–421. [Google Scholar] [CrossRef] [PubMed]
- Kaplan, R.; Kaplan, S. The Experience of Nature: A Psychological Perspective; Cambridge University Press: Cambridge, UK, 1989. [Google Scholar]
- Maas, J.; Verheij, R.A.; Groenewegen, P.P.; de Vries, S.; Spreeuwenberg, P. Green space, urbanity, and health: How strong is the relation? J. Epidemiol. Community Health 2006, 60, 587–592. [Google Scholar] [CrossRef] [PubMed]
- Barton, J.; Pretty, J. What is the best dose of nature and green exercise for improving mental health? A multi-study analysis. Environ. Sci. Technol. 2010, 44, 3947–3955. [Google Scholar] [CrossRef] [PubMed]
- Kaplan, S. The restorative benefits of nature: Toward an integrative framework. J. Environ. Psychol. 1995, 15, 169–182. [Google Scholar] [CrossRef]
- Hartig, T.; Mang, M.; Evans, G.W. Restorative effects of natural environment experiences. Environ. Behav. 1991, 23, 3–26. [Google Scholar] [CrossRef]
- Hartig, T.; Mitchell, R.; de Vries, S.; Frumkin, H. Nature and health. Annu. Rev. Public Health 2014, 35, 207–228. [Google Scholar] [CrossRef]
- Peters, K.; Elands, B.; Buijs, A. Social interactions in urban parks: Stimulating social cohesion? Urban For. Urban Green. 2010, 9, 93–100. [Google Scholar] [CrossRef]
- Kuo, F.E.; Sullivan, W.C.; Coley, R.L.; Brunson, L. Fertile ground for community: Inner-city neighborhood common spaces. Am. J. Community Psychol. 1998, 26, 823–851. [Google Scholar] [CrossRef]
- Tzoulas, K.; Korpela, K.; Venn, S.; Yli-Pelkonen, V.; Kaźmierczak, A.; Niemela, J.; James, P. Promoting ecosystem and human health in urban areas using Green Infrastructure: A literature review. Landsc. Urban Plan. 2007, 81, 167–178. [Google Scholar] [CrossRef]
- Bowler, D.E.; Buyung-Ali, L.; Knight, T.M.; Pullin, A.S. A systematic review of evidence for the added benefits to health of exposure to natural environments. BMC Public Health 2010, 10, 456. [Google Scholar] [CrossRef]
- WHO. Urban Green Spaces and Health: A Review of Evidence; World Health Organization Regional Office for Europe: Copenhagen, Denmark, 2016. [Google Scholar]
- EPA. Green Infrastructure: Managing Wet Weather with Green Infrastructure; United States Environmental Protection Agency: Washington, DC, USA, 2019.
- Ulrich, R.S.; Simons, R.F.; Losito, B.D.; Fiorito, E.; Miles, M.A.; Zelson, M. Stress recovery during exposure to natural and urban environments. J. Environ. Psychol. 1991, 11, 201–230. [Google Scholar] [CrossRef]
- White, M.; Smith, A.; Humphryes, K.; Pahl, S.; Snelling, D.; Depledge, M. Blue space: The importance of water for preference, affect, and restorativeness ratings of natural and built scenes. J. Environ. Psychol. 2010, 30, 482–493. [Google Scholar] [CrossRef]
- Berman, M.G.; Jonides, J.; Kaplan, S. The cognitive benefits of interacting with nature. Psychol. Sci. 2008, 19, 1207–1212. [Google Scholar] [CrossRef] [PubMed]
- Alvarsson, J.J.; Wiens, S.; Nilsson, M.E. Stress recovery during exposure to nature sound and environmental noise. Int. J. Environ. Res. Public Health 2010, 7, 1036–1046. [Google Scholar] [CrossRef]
- Krause, B. The Great Animal Orchestra: Finding the Origins of Music in the World’s Wild Places; Little, Brown and Company: Boston, MA, USA, 2013. [Google Scholar]
- Payne, S.R. The production of a perceived restorativeness soundscape scale. Appl. Acoust. 2013, 74, 255–263. [Google Scholar] [CrossRef]
- Zhang, M.; Kang, J. Towards the evaluation, description, and creation of soundscapes in urban open spaces. Environ. Plan. B Plan. Des. 2007, 34, 68–86. [Google Scholar] [CrossRef]
- Jennings, P.; Cain, R. A framework for improving urban soundscapes. Appl. Acoust. 2013, 74, 293–299. [Google Scholar] [CrossRef]
- Gidlöf-Gunnarsson, A.; Öhrström, E. Noise and well-being in urban residential environments: The potential role of perceived availability to nearby green areas. Landsc. Urban Plan. 2007, 83, 115–126. [Google Scholar] [CrossRef]
- Lynch, K. The Image of the City; MIT Press: Cambridge, MA, USA, 1960. [Google Scholar]
- Appleton, J. The Experience of Landscape; Wiley: London, UK, 1975. [Google Scholar]
- Brown, A.L.; Muhar, A. An approach to the acoustic design of outdoor space. J. Environ. Plan. Manag. 2004, 47, 827–842. [Google Scholar] [CrossRef]
- Jo, H.I.; Jeon, J.Y. The influence of human-related sounds on the restorative effects of viewing and listening to urban and rural environments. Sustainability 2020, 12, 2730. [Google Scholar]
- Zhang, Y.; Kang, J.; Kang, J. Effects of soundscape on the environmental restoration in urban natural environments. Noise Control Eng. J. 2014, 62, 480–490. [Google Scholar]
- Velarde, M.D.; Fry, G.; Tveit, M.S. Health effects of the physical environment in the urban landscape: A review. J. Urban Health 2007, 84, 273–284. [Google Scholar]
- Brown, A.L.; Kang, J.; Gjestland, T. Towards standardization in soundscape preference assessment. Appl. Acoust. 2011, 72, 387–392. [Google Scholar] [CrossRef]
- Berg, M.; Meekes, J.; Hekmat, A.; van den Berg, A.E. The role of soundscape and visual landscape in health and well-being. Environ. Behav. 2014, 46, 782–805. [Google Scholar]
- Franco, L.S.; Shanahan, D.F.; Fuller, R.A. A review of the benefits of nature experiences: More than meets the eye. Int. J. Environ. Res. Public Health 2017, 14, 864. [Google Scholar] [CrossRef]
- Herzog, T.R.; Black, A.P.; Fountaine, K.A.; Knotts, D.J. Reflection and preference in natural environments. Environ. Behav. 2015, 47, 113–141. [Google Scholar]
- Stokols, D.; Prkachin, K.M.; LaCroix, J.M. Health and well-being in urban environments: An integrative approach. Environ. Behav. 2013, 45, 471–493. [Google Scholar]
- Heng, L.; Hui, X. Investigation of soundscape walks in mountain city parks. In Proceedings of the 2017 National Acoustics Academic Conference of the Chinese Acoustical Society; Key Laboratory of Mountainous Town Construction and New Technology, Ministry of Education, College of Architecture and Urban Planning, Chongqing University: Chongqing, China, 2017; pp. 605–606. Available online: https://kns.cnki.net/kcms2/article/abstract?v=-4s28oSk47_vZaY0YFQFXymX-7gWZehTxeCD7FhqfOljK3XxbIUHQI05g4rsd_CLp2om5LE2cd8NoRfEmtlH7MUFdatUH18w5RnJJ_tvafGweLQ2s-CHAE1T-k-wi2ssu6Af31vpQGob5pdNJ7mmvvyvtvnGSf3SOBm08mRK3sW0VNX0jdvhp8s4r0L-CIK4GSTp0d8E0yn3Z0h0I9Z79zfvpbhzmhEqPpgxNTZGFoWWWcYRvn3yRg==&uniplatform=NZKPT&language=CHS (accessed on 5 September 2024).
- Yin, Y.; Shao, Y.; Lu, H.; Hao, Y.; Jiang, L. Predicting and Visualizing Human Soundscape Perception in Large-Scale Urban Green Spaces: A Case Study of the Chengdu Outer Ring Ecological Zone. Forests 2023, 14, 1946. [Google Scholar] [CrossRef]
- ISO/TS 12913-2:2018; Acoustics—Soundscape—Part 2: Data Collection and Reporting Requirements. BSI Standards Publication: London, UK, 2018.
- Sarwono, J.; Kusdinar, D.; Winarni, S. The effect of music genre on the atmosphere and the buying behavior of café visitors. J. Cult. Herit. Manag. Sustain. Dev. 2022, 12, 64–76. [Google Scholar]
- Russell, J.A. A Circumplex Model of Affect. J. Personal. Soc. Psychol. 1980, 39, 1161–1178. [Google Scholar] [CrossRef]
- Kang, J.; Zhang, M. Semantic differential analysis of the soundscape in urban open public spaces. Build. Environ. 2010, 45, 150–157. [Google Scholar] [CrossRef]
- Mengchi, F. Evaluation and Prediction of Urban Park Soundscape. Master’s Thesis, Zhejiang University, Hangzhou, China, 2019. [Google Scholar]
- Bahali, S.; Tamer-Bayazit, N. Soundscape Research on the Gezi Park–Tunel Square Route. Appl. Acoust. 2017, 116, 260–270. [Google Scholar] [CrossRef]
- Jo, H.I.; Jeon, J.Y. Overall Environmental Assessment in Urban Parks: Modelling Audio-Visual Interaction with a Structural Equation Model Based on Soundscape and Landscape Indices. Build. Environ. 2021, 204, 108166. [Google Scholar] [CrossRef]
- Cheung, L. Improving visitor management approaches for the changing preferences and behaviours of country park visitors in Hong Kong. Nat. Resour. Forum 2013, 37, 231–241. [Google Scholar] [CrossRef]
- Schultz, T.J. Synthesis of social surveys on noise annoyance. J. Acoust. Soc. Am. 1978, 64, 377–405. [Google Scholar] [CrossRef]
- Fu, X.Y.; Yang, P.; Jiang, S.; Xing, J.X.; Kang, D. Influences on the sense of landscape security by different landscape environment design elements and constitution. Urban Probl. 2019, 9, 37–44. Available online: https://kns.cnki.net/kcms2/article/abstract?v=-4s28oSk47-TVmzLq-vKbR5BYZ0p4ogzfQCdyd3myQ4zMe3P0rSlESQF7TSTdwgYxsn-3NQa2yc9O0FiN0EtYzQKe0Fb0phLvHXmmeb8yUMyPL-oI6JjL59NAo1v6SHuSnMfXkpvH-NBnPkapQMjuPPhGcv6-s3vlISC3ZBvArn5jspMmbqojwkyz_GGJ4W2rBOS0GwNIISPt31f8Ea11VjEVuiQ7n2JSq2htQ09t-Q=&uniplatform=NZKPT&language=CHS (accessed on 5 September 2024).
- Koussa, F.; Defrance, J.; Jean, P.; Blanc-Benon, P. Acoustic performance of gabions noise barriers: Numerical and experimental approaches. Appl. Acoust. 2013, 74, 189–197. [Google Scholar] [CrossRef]
- Pheasant, R.; Horoshenkov, K.; Watts, G.; Barrett, B. The acoustic and visual factors influencing the construction of tranquil space in urban and rural environments tranquil spaces-quiet places? J. Acoust. Soc. Am. 2010, 129, 1210–1217. [Google Scholar] [CrossRef]
- Aletta, F.; Kang, J.; Axelsson, Ö. Soundscape descriptors and a conceptual framework for developing predictive soundscape models. Landsc. Urban Plan. 2016, 149, 65–74. [Google Scholar] [CrossRef]
- Van Renterghem, T.; Botteldooren, D. Reducing the acoustical visibility of roads through the application of green roofs and green walls. Landsc. Urban Plan. 2009, 95, 105–112. [Google Scholar]
- Fang, C.F.; Ling, D.L. Investigation of the noise reduction provided by tree belts. Landsc. Urban Plan. 2005, 71, 29–34. [Google Scholar] [CrossRef]
- Nilsson, M.E.; Berglund, B. Soundscape quality in suburban green areas and city parks. Acta Acust. United Acust. 2006, 92, 903–911. [Google Scholar]
- Yang, W.; Kang, J. Acoustic comfort evaluation in urban open public spaces. Appl. Acoust. 2005, 66, 211–229. [Google Scholar] [CrossRef]
- Gozalo, G.R.; Morillas, J.M.B.; González, D.M.; Moraga, P.A.; Vílchez-Gómez, R. Relationship between objective acoustic indices and subjective assessments for the quality of soundscapes. Appl. Acoust. 2017, 116, 366–374. [Google Scholar] [CrossRef]
- Völker, S.; Kistemann, T. The impact of blue space on human health and well-being—Salutogenetic health effects of inland surface waters: A review. Int. J. Hyg. Environ. Health 2011, 214, 449–460. [Google Scholar] [CrossRef] [PubMed]
- Völker, S.; Heiler, A.; Pollmann, T.; Kistemann, T. How does water affect health? Blue space theory and the quality of urban blue spaces. Water Res. 2018, 144, 236–246. [Google Scholar] [CrossRef]
- Annerstedt, M.; Währborg, P. Nature-assisted therapy: Systematic review of controlled and observational studies. Scand. J. Public Health 2011, 39, 371–388. [Google Scholar] [CrossRef]


| Significant (p-Value) | ||
|---|---|---|
| Shapiro–Wilk Test | Kolmogorov–Smirnov Test | |
| Traffic sounds (S1) | 0.290 | 0.776 |
| Construction sounds (S2) | 0.417 | 0.601 |
| Human sounds (S3) | 0.240 | 0.854 |
| Natural sounds (S4) | 0.285 | 0.762 |
| Behavioral vitality (v) | 0.354 | 0.625 |
| Pleasure (E1) | 0.220 | 0.860 |
| Calmness (E2) | 0.178 | 0.900 |
| Satisfaction (E3) | 0.242 | 0.890 |
| Point Location | Wo | Wa | L | P | Others | LAeq | S1 | S2 | S3 | S4 | V | E1 | E2 | E3 | |
|---|---|---|---|---|---|---|---|---|---|---|---|---|---|---|---|
| NO.1 | Mean | 34% | 1% | 52% | 13% | 0% | 75.9 | 3.77 | 1.68 | 2.41 | 4.68 | 3 | 3.14 | 2.73 | 3.3 |
| Std. Dev | - | - | - | - | - | 0.73 | 0.76 | 0.78 | 0.47 | - | 0.69 | 0.86 | 0.63 | ||
| NO.2 | Mean | 17% | 2% | 65% | 16% | 0% | 75.9 | 4.86 | 1.18 | 1.29 | 4.25 | 3 | 2.18 | 1.57 | 2.43 |
| Std. Dev | - | - | - | - | - | 0.35 | 0.38 | 0.52 | 0.69 | - | 0.89 | 0.73 | 0.98 | ||
| NO.3 | Mean | 22% | 6% | 56% | 16% | 0% | 74.6 | 4.45 | 1.17 | 1.76 | 4.55 | 3 | 2.41 | 1.93 | 2.69 |
| Std. Dev | - | - | - | - | - | 0.56 | 0.38 | 0.82 | 0.56 | - | 0.77 | 1.14 | 0.83 | ||
| NO.4 | Mean | 29% | 14% | 45% | 12% | 0% | 71.4 | 4.42 | 1.26 | 2.05 | 4.42 | 3 | 3.05 | 2.42 | 3.42 |
| Std. Dev | - | - | - | - | - | 0.67 | 0.44 | 0.69 | 0.59 | - | 0.69 | 0.88 | 0.59 | ||
| NO.5 | Mean | 6% | 7% | 77% | 10% | 0% | 75.1 | 4.45 | 1.23 | 2.55 | 4.32 | 0 | 2.55 | 1.73 | 2.82 |
| Std. Dev | - | - | - | - | - | 0.66 | 0.42 | 0.58 | 0.63 | - | 0.58 | 0.69 | 0.65 | ||
| NO.6 | Mean | 3% | 18% | 66% | 13% | 0% | 76.8 | 4.92 | 1.71 | 1.54 | 4.17 | 2 | 1.96 | 1.42 | 2.21 |
| Std. Dev | - | - | - | - | - | 0.28 | 0.93 | 0.58 | 0.75 | - | 0.73 | 0.64 | 0.82 | ||
| NO.7 | Mean | 18% | 17% | 54% | 11% | 0% | 79.2 | 4.41 | 1.17 | 1.97 | 4.29 | 3 | 3.07 | 2.55 | 3.35 |
| Std. Dev | - | - | - | - | - | 0.67 | 0.38 | 0.72 | 0.61 | - | 0.94 | 1.19 | 0.9 | ||
| NO.8 | Mean | 30% | 14% | 49% | 7% | 0% | 78.5 | 4.65 | 1.22 | 2.04 | 4.04 | 3 | 3.09 | 2.39 | 3.21 |
| Std. Dev | - | - | - | - | - | 0.56 | 0.41 | 0.81 | 0.86 | - | 0.65 | 1.01 | 0.63 | ||
| NO.9 | Mean | 57% | 0% | 27% | 16% | 0% | 66.3 | 3.67 | 1.95 | 2.05 | 4.90 | 2 | 3.86 | 3.52 | 4.64 |
| Std. Dev | - | - | - | - | - | 0.64 | 1.13 | 0.90 | 0.29 | - | 0.77 | 1.05 | 0.71 | ||
| NO.10 | Mean | 25% | 23% | 34% | 13% | 5% | 69.3 | 3.00 | 1.54 | 4.23 | 3.83 | 2 | 3.42 | 2.46 | 3.62 |
| Std. Dev | - | - | - | - | - | 1.00 | 0.93 | 0.80 | 1.06 | - | 0.84 | 1.01 | 0.78 | ||
| Mean | 24% | 11% | 52% | 13% | 1% | 74.3 | 4.26 | 1.41 | 2.19 | 4.35 | 2.4 | 2.87 | 2.27 | 3.17 | |
| Model Fit (R2) | Durbin–Watson Test | Attribute | Estimate B | Standard Error | t-Value | p-Value | VIF |
|---|---|---|---|---|---|---|---|
| 0.597 | 1.622 | lawn | −0.058 | 0.004 | −16.043 | <0.001 | 1.885 |
| pavement | 0.090 | 0.011 | 8.115 | <0.001 | 1.898 | ||
| lAeq | 0.275 | 0.016 | 17.127 | <0.001 | 2.785 |
| Wo | Wa | L | P | V | ||
| S1 | Correlation (Pearson’s r) | −0.347 ** | −0.093 | 0.471 ** | 0.161 * | 0.063 |
| Significant (p) | <0.001 | 0.183 | <0.001 | 0.021 | 0.366 | |
| S2 | Correlation (Pearson’s r) | 0.183 ** | −0.023 | −0.195 ** | 0.194 ** | −0.062 |
| Significant (p) | 0.008 | 0.747 | 0.005 | 0.005 | 0.376 | |
| S3 | Correlation (Pearson’s r) | 0.124 | 0.340 ** | −0.367 ** | −0.119 | 0.235 ** |
| Significant (p) | 0.074 | <0.001 | <0.001 | 0.088 | 0.001 | |
| S4 | Correlation (Pearson’s r) | 0.204 ** | −0.291 ** | 0.038 | −0.240 ** | −0.037 |
| Significant (p) | 0.003 | <0.001 | 0.588 | <0.001 | 0.591 |
| Wo | Wa | L | P | S1 | S2 | S3 | S4 | LAeq | V | ||
|---|---|---|---|---|---|---|---|---|---|---|---|
| E1 | Correlation (Pearson’s r) | 0.472 ** | 0.029 | −0.494 ** | 0.128 * | −0.466 ** | 0.036 | 0.276 ** | 0.130 * | −0.261 ** | 0.120 * |
| Significant (p) | <0.001 | 0.658 | <0.001 | 0.046 | <0.001 | 0.572 | <0.001 | 0.043 | <0.001 | 0.045 | |
| E2 | Correlation (Pearson’s r) | 0.467 ** | −0.070 | −0.432 ** | 0.197 ** | −0.314 ** | 0.055 | 0.055 | 0.110 | −0.075 | −0.496 ** |
| Significant (p) | <0.001 | 0.275 | <0.001 | 0.002 | <0.001 | 0.390 | 0.141 | 0.088 | 0.244 | <0.001 | |
| Emotion | Model Fit (R2) | Durbin–Watson Test | Attribute | Estimate B | Standard Error | t-Value | p-Value | VIF |
|---|---|---|---|---|---|---|---|---|
| E1 | 0.500 | 1.547 | Woodland | 0.025 | 0.402 | 0.433 | <0.001 | 1.493 |
| Water bodies | 0.015 | 0.004 | 0.145 | 0.014 | 1.376 | |||
| Activity intensity | −0.362 | 0.006 | −0.039 | 0.049 | 1.216 | |||
| Traffic sound | −0.362 | 0.047 | −0.388 | <0.001 | 1.139 | |||
| Natural sound | 0.193 | 0.054 | 0.182 | <0.001 | 1.074 | |||
| E2 | 0.542 | 1.645 | Woodland | 0.051 | 0.005 | 0.787 | <0.001 | 2.538 |
| Pavement | −0.040 | 0.015 | −0.188 | 0.008 | 2.021 | |||
| LAeq | −0.027 | 0.022 | −0.108 | 0.023 | 3.261 | |||
| Activity intensity | −0.121 | 0.065 | −0.121 | <0.001 | 1.739 |
Disclaimer/Publisher’s Note: The statements, opinions and data contained in all publications are solely those of the individual author(s) and contributor(s) and not of MDPI and/or the editor(s). MDPI and/or the editor(s) disclaim responsibility for any injury to people or property resulting from any ideas, methods, instructions or products referred to in the content. |
© 2024 by the authors. Licensee MDPI, Basel, Switzerland. This article is an open access article distributed under the terms and conditions of the Creative Commons Attribution (CC BY) license (https://creativecommons.org/licenses/by/4.0/).
Share and Cite
Jin, T.; Lu, J.; Shao, Y. Exploring the Impact of Visual and Aural Elements in Urban Parks on Human Behavior and Emotional Responses. Land 2024, 13, 1468. https://doi.org/10.3390/land13091468
Jin T, Lu J, Shao Y. Exploring the Impact of Visual and Aural Elements in Urban Parks on Human Behavior and Emotional Responses. Land. 2024; 13(9):1468. https://doi.org/10.3390/land13091468
Chicago/Turabian StyleJin, Tongfei, Jiayi Lu, and Yuhan Shao. 2024. "Exploring the Impact of Visual and Aural Elements in Urban Parks on Human Behavior and Emotional Responses" Land 13, no. 9: 1468. https://doi.org/10.3390/land13091468