Article

Spatio-Temporal Heterogeneity of the Urban Heat Effect and Its Socio-Ecological Drivers in Yangzhou City, China

1
College of Horticulture and Landscape Architecture, Yangzhou University, Yangzhou 225009, China
2
Jiangsu Key Laboratory of Crop Genetics and Physiology/Jiangsu Key Laboratory of Crop Cultivation and Physiology/Jiangsu Co-Innovation Center for Modern Production Technology of Grain Crops, Agricultural College of Yangzhou University, Yangzhou 225009, China
3
Research Institute of Rice Industrial Engineering Technology of Yangzhou University, Yangzhou 225009, China
*
Author to whom correspondence should be addressed.
Land 2024, 13(9), 1470; https://doi.org/10.3390/land13091470
Submission received: 25 June 2024 / Revised: 8 September 2024 / Accepted: 9 September 2024 / Published: 10 September 2024

Abstract

:
Rapid urbanization and land-use changes may affect the intensity of urban heat islands (UHIs). However, research on the eastern Chinese city of Yangzhou is lacking. Using land cover data and the InVest Urban Cooling model, this study evaluated the spatiotemporal heterogeneity of the UHI effect from 1990 to 2020 and its socioecological drivers in Yangzhou City. Landscape pattern indices such as patch area (CA), percentage of landscape (PLAND), number of patches, patch density, and aggregation index were created using Fragstats 4.2 software. Several social indicators, such as gross domestic product (GDP), night-light index, and population density, were considered to explore their correlation with UHI indicators. During the past three decades, rapid urbanization in Yangzhou has intensified the UHI effect, with the cooling capacity (cc park) and heat mitigation index (HMI) decreasing by ~9.6%; however, the mixed air temperature (T air) has increased by 0.14 °C. The main heat island areas are concentrated in southern Yangzhou, including the Hanjiang and Guangling districts, and have expanded over time. T air was positively correlated with GDP, night-light index, and population density. Moreover, for the impervious land use type, cc park and HMI were negatively correlated with CA and PLAND (p < 0.01). This study contributes to a deeper understanding of the dynamics of UHIs and provides valuable insights for policymakers, urban planners, and researchers striving to create sustainable and climate-resilient cities in Yangzhou.

1. Introduction

Urbanization is a key characteristic of the 21st century, with cities serving as epicenters of economic activity, innovation, and cultural exchange [1]. However, this rapid urban growth has led to a range of environmental challenges, with the most evident being the urban heat island (UHI) effect [2,3]. The UHI effect refers to the phenomenon in which urban areas experience higher air temperatures than their rural counterparts, leading to localized zones of heat stress. This thermal disparity is driven by several factors, including changes in land use, alterations in surface albedo, modification of natural landscapes, and anthropogenic heat emissions [4,5,6,7,8].
The spatiotemporal dynamic evolution of UHIs is a key component of urban thermal environmental monitoring. The InVest model, which is a comprehensive evaluation model for ecosystem services and trades, is a set of ecosystem service models covering terrestrial, freshwater, marine, and coastal ecosystems [9,10,11]. The Urban Cooling module in the InVEST model developed by Sharp et al. (2020) assessed the mitigation capacity of vegetation in reducing heat island effects [12]. This model has been applied to assess and manage ecosystem services to ensure their sustainability and quality. Recently, it has been widely used to mitigate the effects of UHIs. Ronchi et al. (2020) [13] compared the urban historical planning morphology and explored the impact of different urban planning approaches on the cooling capacity (cc park) of cities by applying the InVest Urban Cooling model in Milan. This study found that urban planning methods affect aspects such as greenspace area, permeability, building density, tree density, and tree canopy cover in cities. Zawadzka et al. (2021) [11] assessed the heat mitigation capacity of urban green spaces in England using the InVest Urban Cooling model and found that the InVest model can address limitations in data analysis for planning communities and support decision-making processes. Hou et al. (2023) [14] employed the Random Forest method to quantify the key environmental factors of UHIs, including urban green coverage, surface albedo, urban morphology, and human activity levels. They found that urban green cover was the most crucial determinant of UHIs, followed by surface albedo. Lauwaet et al. (2024) [15] introduced a high-resolution dataset to simulate UHI effects in 100 European cities and analyzed the correlation between UHI phenomena and meteorological and urban characteristics. This study evaluated the cooling effects of green infrastructure and land unsealing on urban heat and found considerable impacts of these factors on the heat island index. They highlighted the major impact of the UHI phenomenon on public health, with climate change further increasing the mortality risk.
The landscape pattern index has emerged as a crucial ecological tool in the context of accelerating urbanization. This index effectively quantifies the structure, composition, and function of landscapes, enabling a comprehensive assessment of ecosystem health, biodiversity, and their responses to environmental changes [16,17,18]. However, while previous studies have highlighted the major effects of urbanization on landscape patterns, the relationship between the landscape pattern index and UHI effect remains poorly understood. Additionally, socioeconomic indicators, such as gross domestic product (GDP), may influence the UHI effect. Therefore, in-depth research into the potential correlations between socio-ecological factors and the UHI effect is essential to enhance our understanding of the impact of urbanization on the ecological environment and to inform urban planning and strategies to mitigate heat island effects.
Yangzhou City is located in the central part of Jiangsu Province. It is a transitional area that has undergone an economic shift from southern Jiangsu to extend to northern Jiangsu. It is a node city in the Yangtze River Delta urban agglomeration, Grand Canal cultural belt, and Nanjing metropolitan area. Yangzhou City exemplifies an intricate nexus between rapid urbanization and environmental challenges. As one of China’s historical and cultural hubs, Yangzhou has experienced unprecedented urban expansion and population growth in recent decades. The confluence of industrialization, infrastructure development, and urban sprawl has considerably altered the landscape of cities, leading to profound changes in land use, vegetation cover, and thermal characteristics. These transformations have profound implications for the formation and dynamics of UHIs in the urban fabric. However, there is currently a lack of systematic studies on the UHI effect in Yangzhou City.
Thus, the objectives of this study were as follows: (i) to delineate the spatiotemporal heterogeneity of UHIs within Yangzhou City using the InVest model and land use data and geospatial techniques; (ii) to identify the socio-ecological drivers that contribute to UHI formation and exacerbation, encompassing factors such as land use/land cover changes, demographic dynamics, and economic activities; and (iii) to assess the implications of UHIs for urban sustainability, public health, and ecosystem functioning, and to propose targeted interventions and policy recommendations for mitigating the adverse effects of heat stress while promoting climate resilience and socio-ecological well-being.
The structure of this study is outlined as follows: Section 1 (Introduction) reviews the background and current status of UHI effects and related research. Section 2 (Materials and Methods) describes the methodology of the InVest Urban Cooling model and calculation of the landscape pattern index. Section 3 (Results) presents the spatiotemporal changes in the UHI effect in Yangzhou from 1990 to 2020 and an analysis of its driving factors. Section 4 (Discussion) discusses the findings and research limitations and explores their implications for urban planning and management. Section 5 (Conclusions) summarizes the main findings and offers suggestions for future research.

2. Materials and Methods
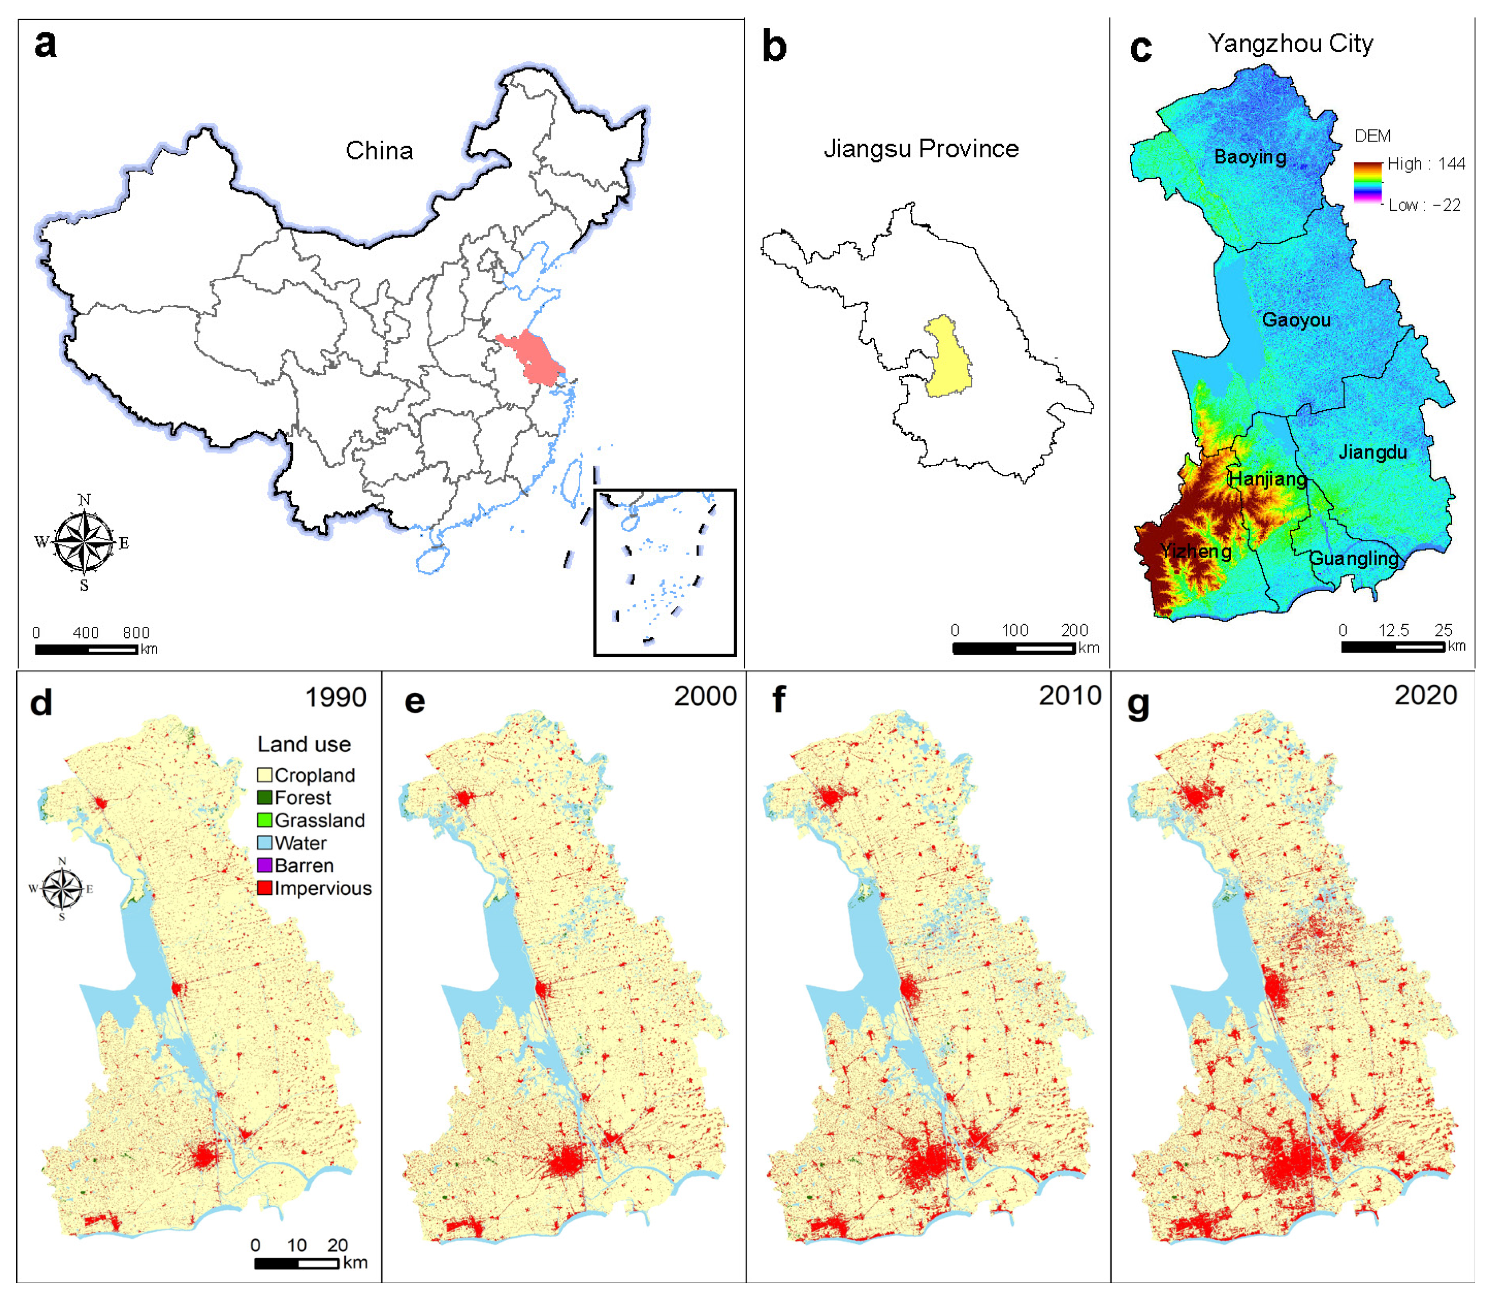
2.1. Study Area

Yangzhou City (32°15′–33°25′ N, 119°01′–119°54′ E) is located at the convergence of the Yangtze River and the Grand Canal in the central part of Jiangsu Province, China (Figure 1). There are currently three districts, one county, and two county-level cities with 77 townships, 14 streets, and 1125 administrative villages. The total area of the city is 6591 km2, with a permanent population of 4.585 million and an urbanization rate of 72.79% by the end of 2023 (http://www.jiangsu.gov.cn/col/col84314/index.html, accessed on 8 September 2024). Yangzhou is situated on the northern edge of the subtropical humid climate zone of East Asia, characterized by a mild climate and distinct seasons, with an average annual temperature of approximately 15 °C, annual precipitation of 1030 mm, and an average annual sunshine duration of 2177 h [19]. The predominant soil types in the region are paddy fields, tides, marshes, and yellow-brown soils (https://www.resdc.cn/DOI/, accessed on 8 September 2024).

2.2. Data Source

The land cover raster data for Yangzhou City from 1990, 2000, 2010, and 2020 were sourced from Yang and Huang (2021) [20], with a spatial resolution of 0.03 × 0.03 km (Table 1). Digital elevation data were obtained from the Geospatial Data Cloud (http://www.gscloud.cn, accessed on 8 September 2024) at a spatial resolution of 0.03 × 0.03 km. Annual average potential evapotranspiration data were obtained from Zomer et al. (2022) [21] with a spatial resolution of 1 × 1 km. Data on GDP and population density were sourced from the Resource and Environment Science and Data Center, Chinese Academy of Sciences (https://www.resdc.cn/Default.aspx, accessed on 8 September 2024), with a spatial resolution of 1 × 1 km. Night-light index data were obtained from the National Tibetan Plateau Data Center (https://data.tpdc.ac.cn/home, accessed on 8 September 2024) at a spatial resolution of 1 × 1 km. All raster data, except for potential evapotranspiration, had an original temporal resolution of one year. All raster data are standardized to a spatial resolution of 0.03 × 0.03 km for spatial analysis and mapping, using the BILINEAR downscaling method.

2.3. Assessment of the Urban Heat Island Effect

The InVest Urban Cooling model calculates the heat mitigation index (HMI) based on shade, evapotranspiration, albedo, and distance to cooling areas such as green spaces and water bodies. The model requires several inputs, including a raster for land use/land cover, reference evapotranspiration (raster), study area (vector), and biophysical table [22]. In addition, specific input parameters, such as the reference air temperature, magnitude of the UHI effect, air-blending distance, and maximum cooling distance, must be defined (Table S1). Through simulations, it was possible to obtain results such as the cc park index, HMI, and mixed air temperature (T air). The cc park index is calculated as follows [23]:
cci = 0.6 × shade + 0.2 × albedo + 0.2 × ETI
where cci represents the cc park of the i-th pixel with a range of values from 0 to 1; 0 indicates no cc park; and 1 indicates the maximum cc park. shade refers to the shading factor, which represents the proportion of the area where the tree canopy is greater than 2 m in various land cover types. albedo is the reflectivity of the surface; that is, the proportion of solar radiation reflected by the ground [10]. The ETI represents the normalized value of potential evapotranspiration, which is the amount of evapotranspiration from vegetation (or the amount of evaporation from the soil for unvegetated areas). The recommended weighting (0.6, 0.2, and 0.2) is based on empirical data and reflects a higher impact of shading than that of evapotranspiration [23]. The biophysical parameter table includes the evapotranspiration coefficients (Kc) for different land cover types, green area, shade, and albedo, with the specific indicators shown in Table 2 [10]. The default values in the InVest model were selected because they encapsulate a wide range of urban land cover types commonly found in cities worldwide, including Yangzhou. These parameters have been validated in numerous studies and applied in diverse urban settings [22]. They provide a reliable baseline for comparing different land cover types and their cooling effects. The robustness of these parameters ensures that they can be appropriately applied to Yangzhou given the city’s comparable urban characteristics.
Large green spaces larger than 0.02 km2 have a cooling effect on the surrounding area [23,24]. If a pixel is not influenced by any large green space, its HMI is the same as its cc value; if it is influenced, the HMI is calculated using the cc value, with a distance weight applied. The model did not test whether greenspaces were contiguous. Thus, many small green spaces within the search distance had the same effect on urban heat mitigation as a single large green space in the same area within the search distance. The formula for calculating the green area GAi within the cooling radiation range around a pixel is as follows:
GA i =   cell area × j d   radius   from   i g j          
The cc park index for a pixel is calculated as follows:
cc   park i = j d   radius   from   i g j ×   cc i ×   e d i ,   j d cool
where cellarea represents the area of the pixel (ha), and gi indicates the patch attribute, where green spaces are marked as 1 and other types as 0, which is dimensionless. d(i,j) denotes the distance between pixels i and j. dcool is the cooling radiation range.
By analyzing the cooling effects of large green spaces, the InVest model calculates the HMI as follows:
HMI i = cc i cc   park i if   cc i cc   park i   or   GA i < 2   ha otherwise  
The air temperature without air mixing, T air nomix , is calculated for each pixel as follows:
T air nomix ,   i = T air ,   ref +   ( 1 HM i )   ×   UHI max
where T air ,   ref is the rural reference temperature, and UHI max is the maximum magnitude of the UHI effect for the city (or, more precisely, the difference between T air ,   ref and the maximum temperature observed in the city). The temperatures were spatially averaged owing to air mixing. The actual air temperature (with mixing), T air, was derived from T air nomix using a Gaussian function with kernel radius r [22].
To validate the model, we analyzed the relationship between the measured and simulated air temperatures (Figure S1). The correlation coefficient (R2) was 0.99, indicating the accuracy of the model.

2.4. Calculation of the Landscape Pattern Index

Landscape pattern indices are quantitative metrics that capture essential information regarding landscape patterns and reflect their structural and spatial characteristics. These indices reveal the inherent relationships between landscape configurations and ecological processes, thereby enhancing our understanding of their functions and dynamics. These are divided into three scales: patch, class, and landscape. To achieve a holistic planning perspective, we use social and environmental indices along with class levels to analyze the whole city. Among the six landscape types analyzed—cropland, forest, grassland, water bodies, bare land, and impervious land—this study primarily examined cropland and impervious land, which occupy the largest proportions.
The heat island effect is influenced by several factors. Five key metrics were selected to evaluate the type, number, distribution, and clustering of patches: patch area (CA), percentage of landscape (PLAND), number of patches (NP), patch density (PD), and aggregation index (AI). The formulae and ecological meanings of these indicators are listed in Table S2. These interrelated and complementary metrics offer a detailed view of the landscape [25]. CA and PLAND provide information on different types of patches, whereas NP and PD examine the patch distribution. AI measures the degree of clustering of landscape patches. By considering these metrics, we can assess the relationship between urban landscape patterns and the heat island effect more comprehensively. Fragstats 4.2 software was used to compute the landscape pattern indices.

2.5. Statistical Analysis

Vector data from 1990, 2000, 2010, and 2020 were calibrated in ArcGIS 10.2 using the Albers coordinate system based on remote sensing images. The land cover in Yangzhou City was classified into six types: cropland, forest, grassland, water bodies, bare land, and impervious areas. Correlation analysis of heat island effect indicators (cc park, HMI, and T air) and landscape pattern indices (CA, PLAND, NP, PD, IJI, and AI) was performed using SPSS 28.0 software with the Pearson correlation coefficient. The GDP, night-light index, and population density were selected as social indicators to reflect the intensity of human activities. The night-light index is primarily used as a proxy for urban activity and population density. Although it is recognized that lighting may contribute marginally to heat emissions, the primary role of the night-light index in this study is to identify areas with high levels of human activity. These areas often correspond to regions with higher energy consumption and anthropogenic heat release, which considerably contribute to the UHI effect. Data analysis and regression modeling were conducted using R software (version 4.3.1). Specifically, the lm function from the stats package was employed to fit linear regression models, and the poly function was used to handle quadratic terms for quadratic regression analysis. A density scatter plot was drawn using data from 2020 as a representative year to reflect the potential relationship between socioecological factors and heat island effect indicators.

3. Results

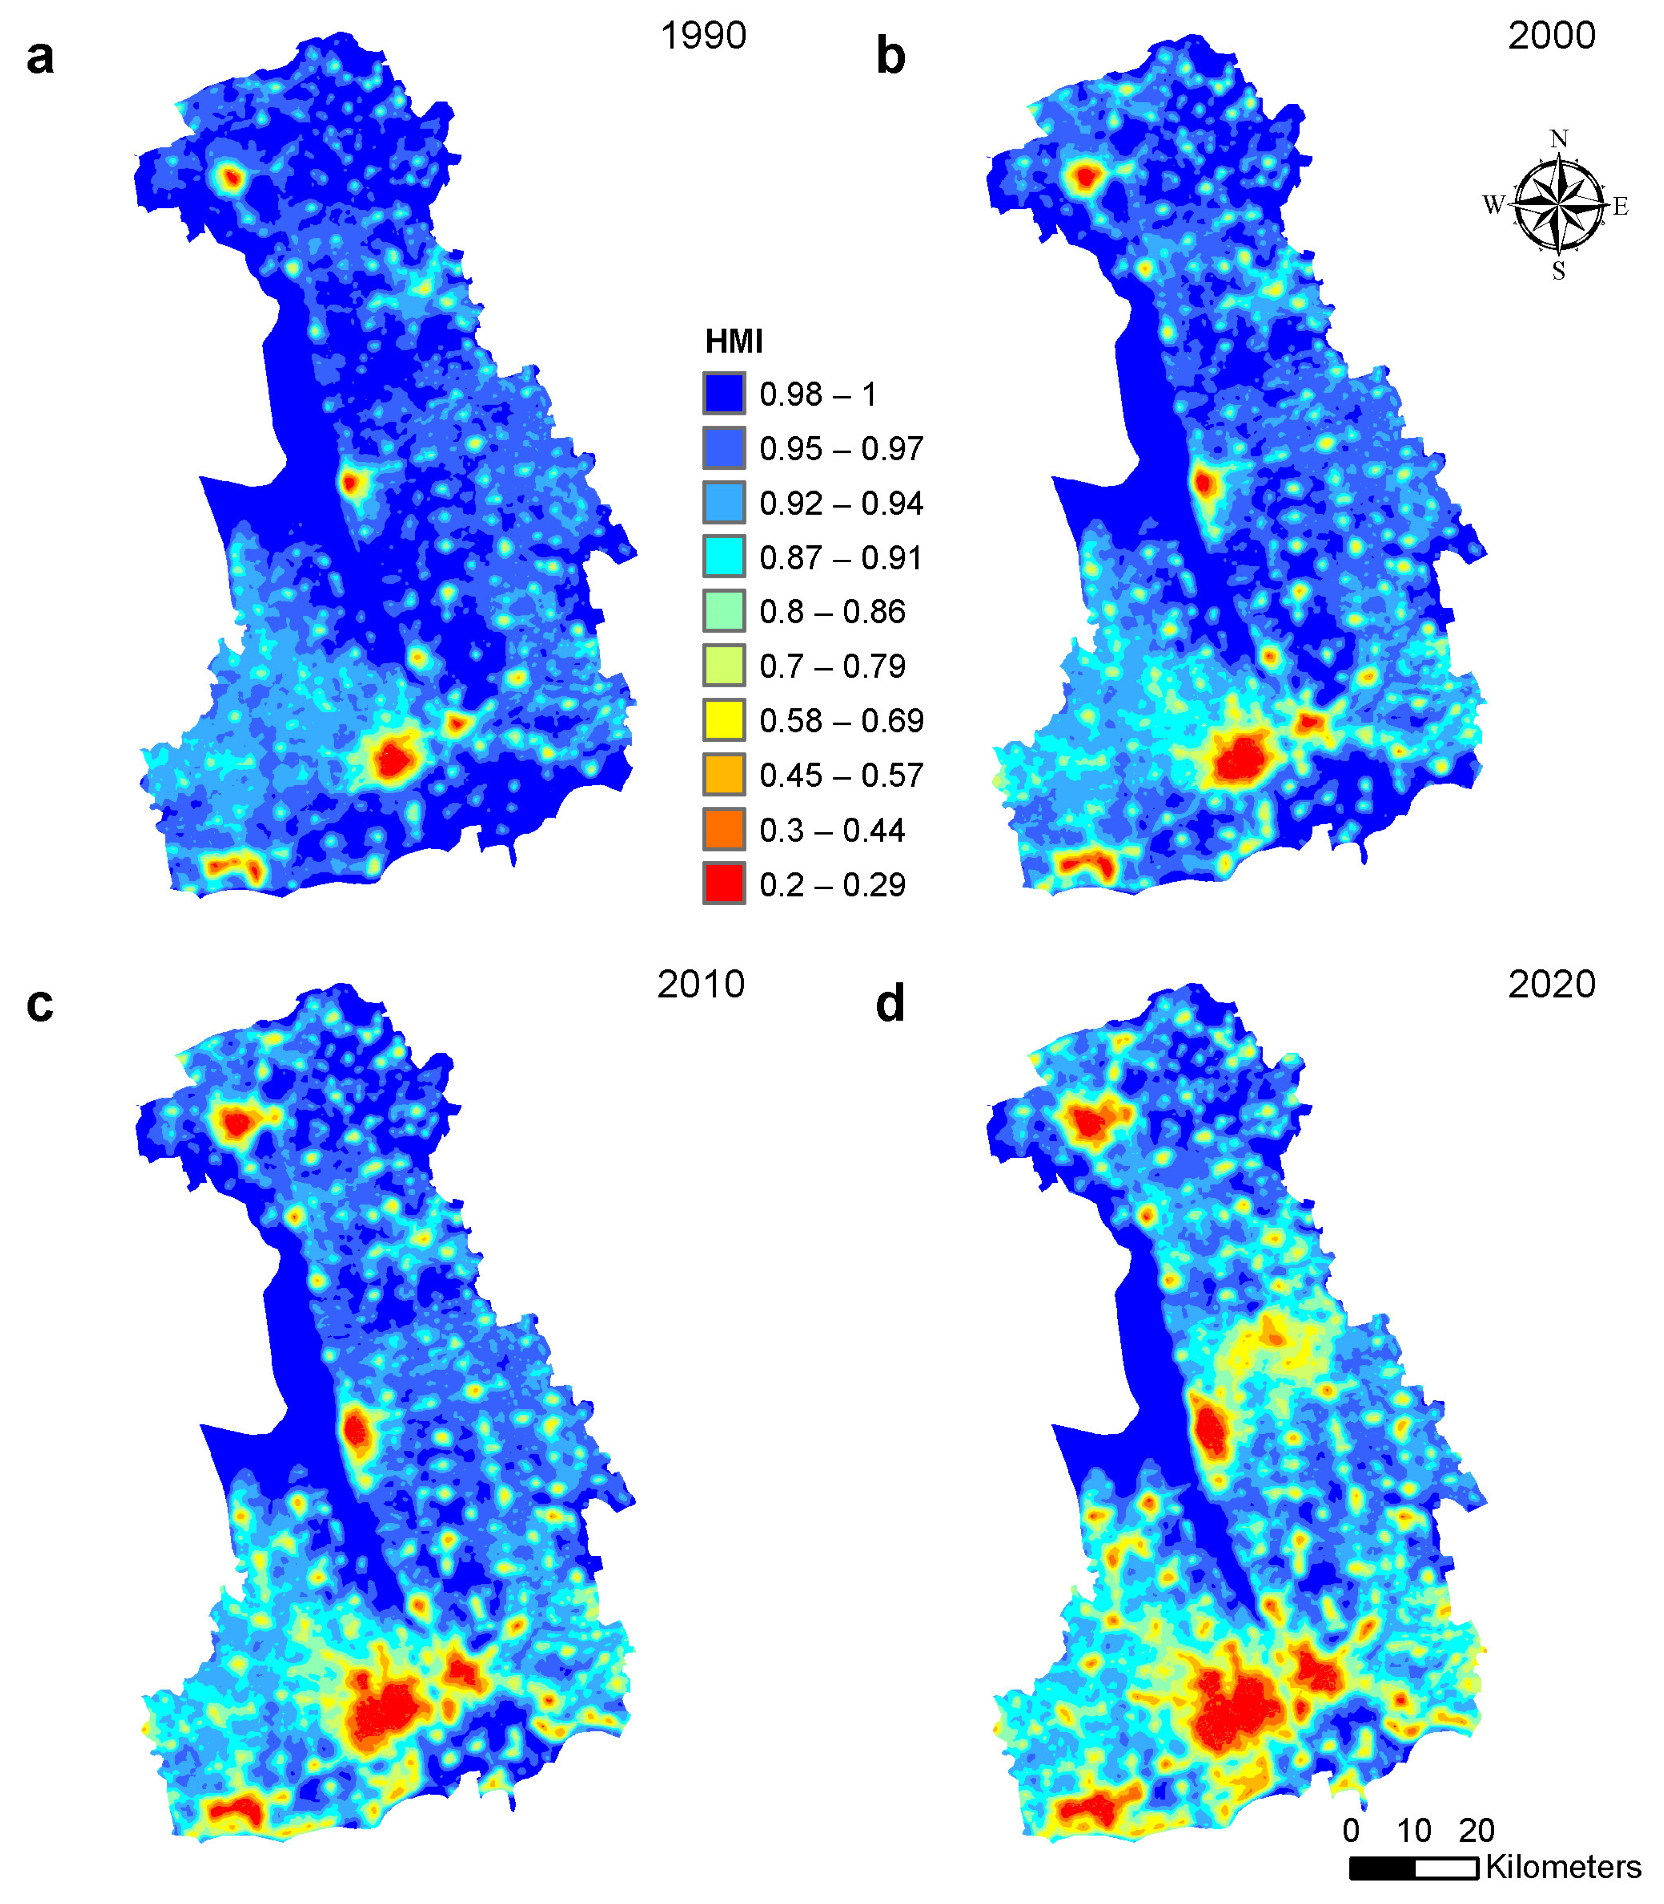
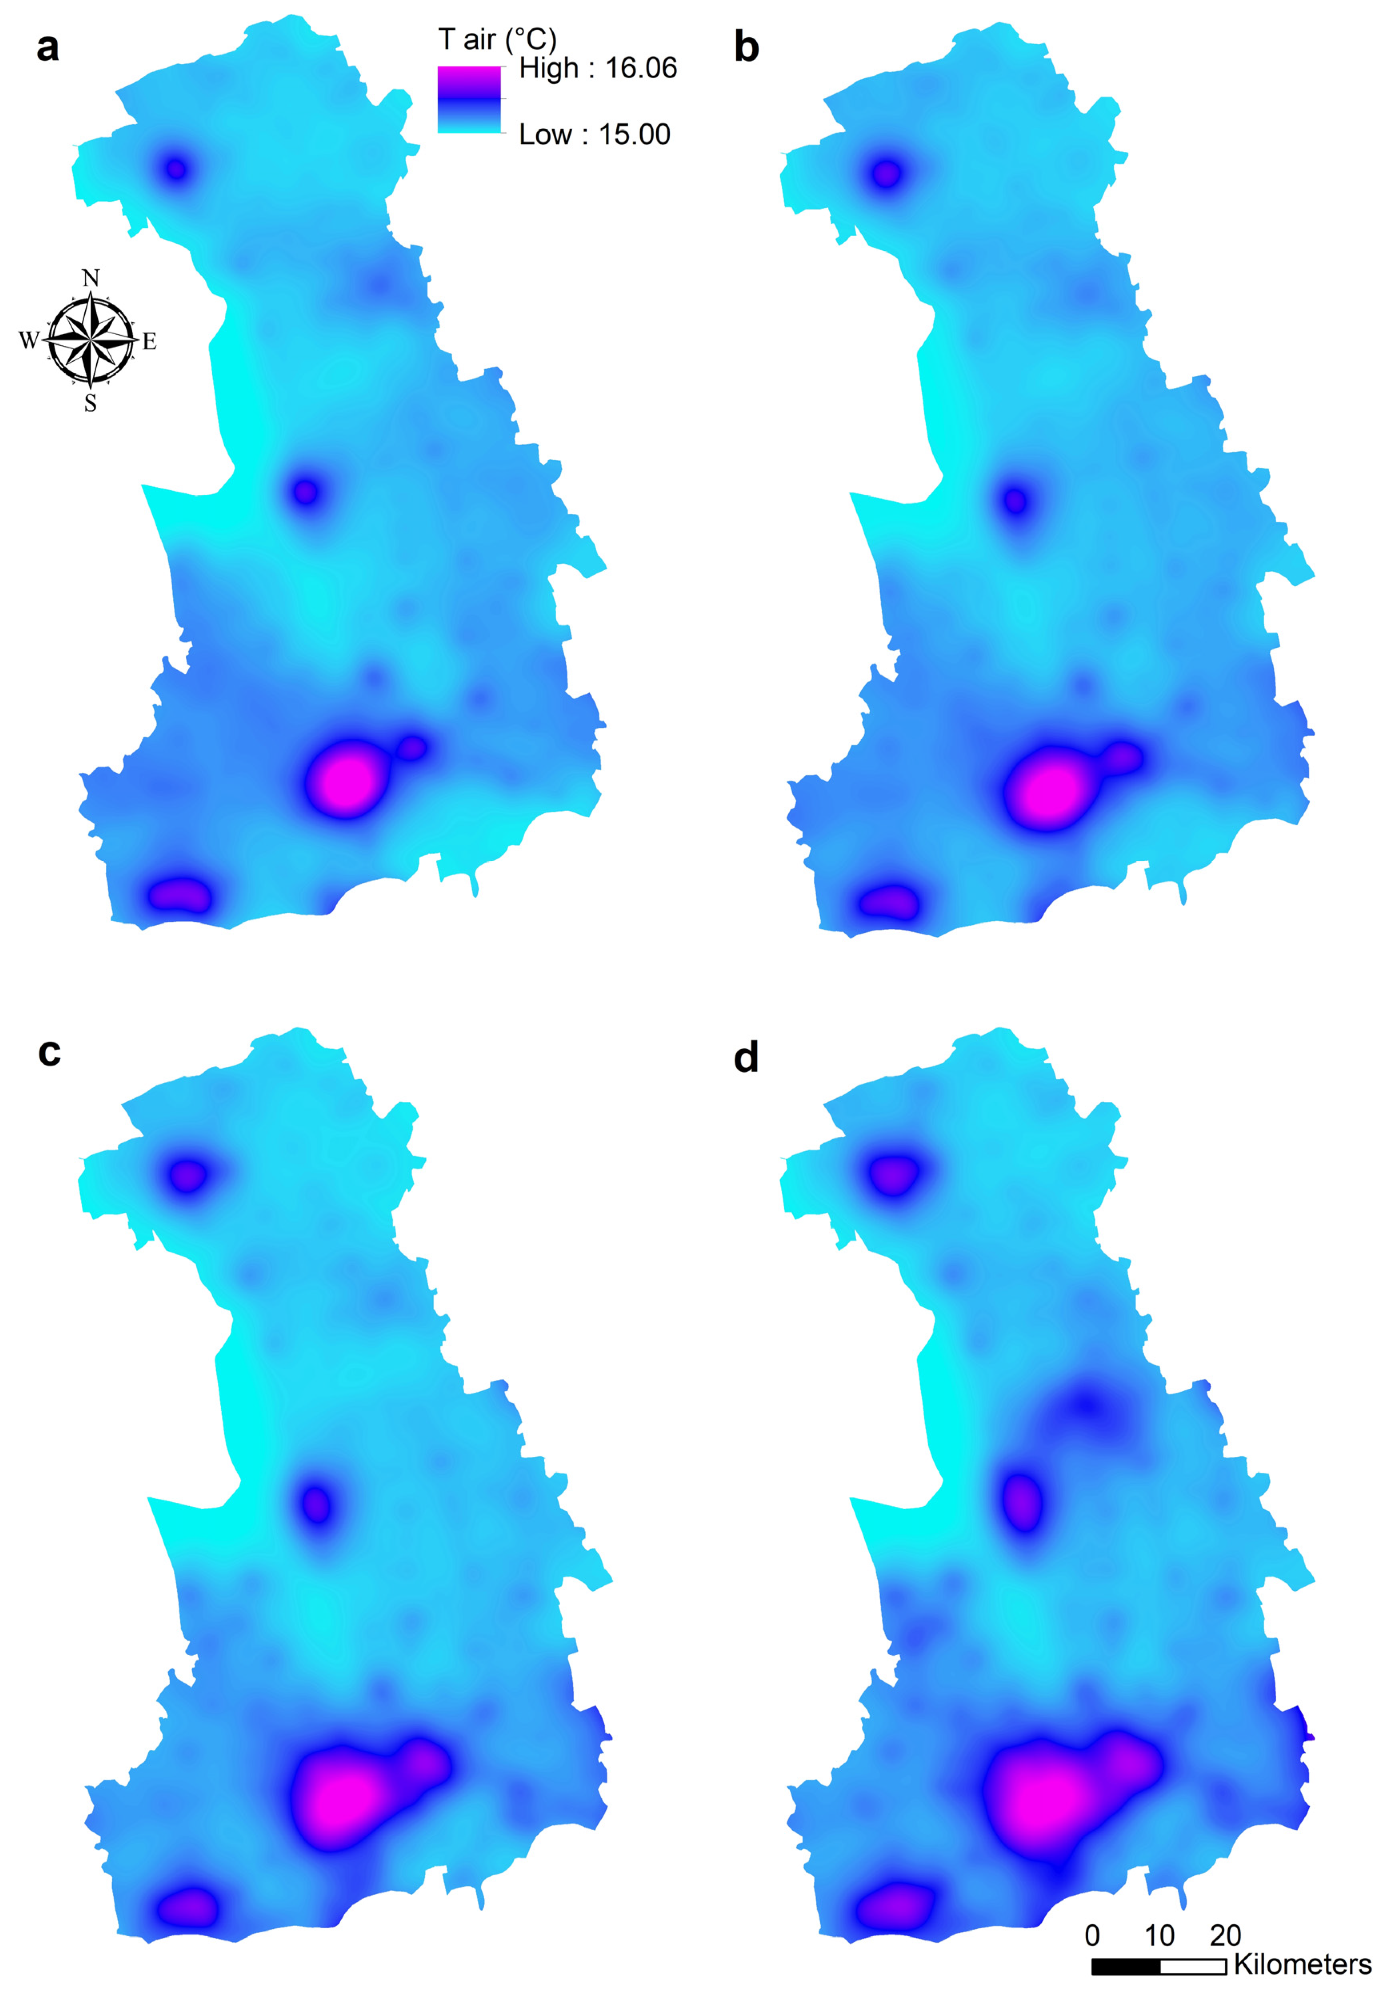
3.1. Spatio-Temporal Heterogeneity of the Urban Heat Island Effect

From 1990 to 2020, the number of parks in Yangzhou City decreased by 9.6% (Table 3). Spatial analysis revealed that the high-value zones of this index were predominantly located in the western waters of Gaoyou Lake, whereas the low-value zones were clustered around central urban areas (Figure 2). Over the same period, the area with low-value cc park expanded considerably, especially in the southern parts of Yangzhou, coinciding with the rapid urbanization of the Hanjiang and Guangling districts.
The HMI showed values closely aligned with those of cc park, although the minimum values were consistently higher. From 1990 to 2020, the HMI exhibited a downward trend, reflecting a gradual decrease in the heat-mitigation capacity of the region. Spatially, the HMI patterns were similar to those of cc park, with low-value areas increasing, especially in the south, and high-value areas diminishing over time (Figure 3).
A slight upward trend in the T air was observed from 1990 to 2020, increasing by 0.92% from 15.08 °C to 15.22 °C. High T air values were predominantly observed in southern Yangzhou City, whereas lower values were observed over Gaoyou Lake in the west (Figure 4). Over the past 30 years, hotspot zones have expanded considerably, particularly in the southern parts of the city.

3.2. Changes in the Landscape Pattern Index

In the cropland land cover category, the CA index tracked the area changes over a 30-year period, revealing a 14.9% decrease in cropland from 549,032 m2 in 1990 to 467,436 m2 in 2020 (Table 4). The PLAND index illustrates the proportion of different landscape types within the total area, showing a notable decrease in cropland dominance from 83.4% in 1990 to 71.0% in 2020, which is a decrease of 12.4%. The NP index, which counts the number of cropland patches, increased from 2943 in 1990 to 9897 in 2020, likely owing to the fragmentation and division caused by human activities. The PD index, which indicates the density of patches within a landscape, increased from 0.447 in 1990 to 1.503 in 2020. This increase reflects the growing fragmentation and heterogeneity of cropland landscapes. AI measures the connectivity between patches, with a lower AI indicating a more dispersed and fragmented landscape and a higher AI suggesting greater connectivity. The AI for croplands decreased from 96.4% in 1990 to 93.8% in 2020, indicating a gradual reduction in connectivity and cohesion over time, leading to an increasingly dispersed and fragmented landscape.
Under the impervious land cover category, the CA index in Yangzhou City exhibited a substantial increase over time, from 36,497 m2 in 1990 to 98,994 m2 in 2020, representing a considerable increase of 171.2%. This growth underscores the rapid urbanization of the city. The PLAND index increased from 5.5% in 1990 to 15.0% in 2020, representing a 9.5% increase in the urban landscape dominance. The NP index decreased from 51,499 in 1990 to 46,529 in 2020, which is a reduction of 9.7%. This trend indicates a decrease in the fragmentation of the urban landscape, suggesting a shift towards greater continuity and stability as urbanization intensifies. Concurrently, the PD index decreased from 7.822 in 1990 to 7.067 in 2020, indicating a decline in landscape fragmentation and heterogeneity. Additionally, AI improved from 61.3% in 1990 to 78.3% in 2020, which is an increase of 17.0%. This increase signifies that the urban landscape has become more interconnected, cohesive, and aligned with broader trends of urban consolidation.

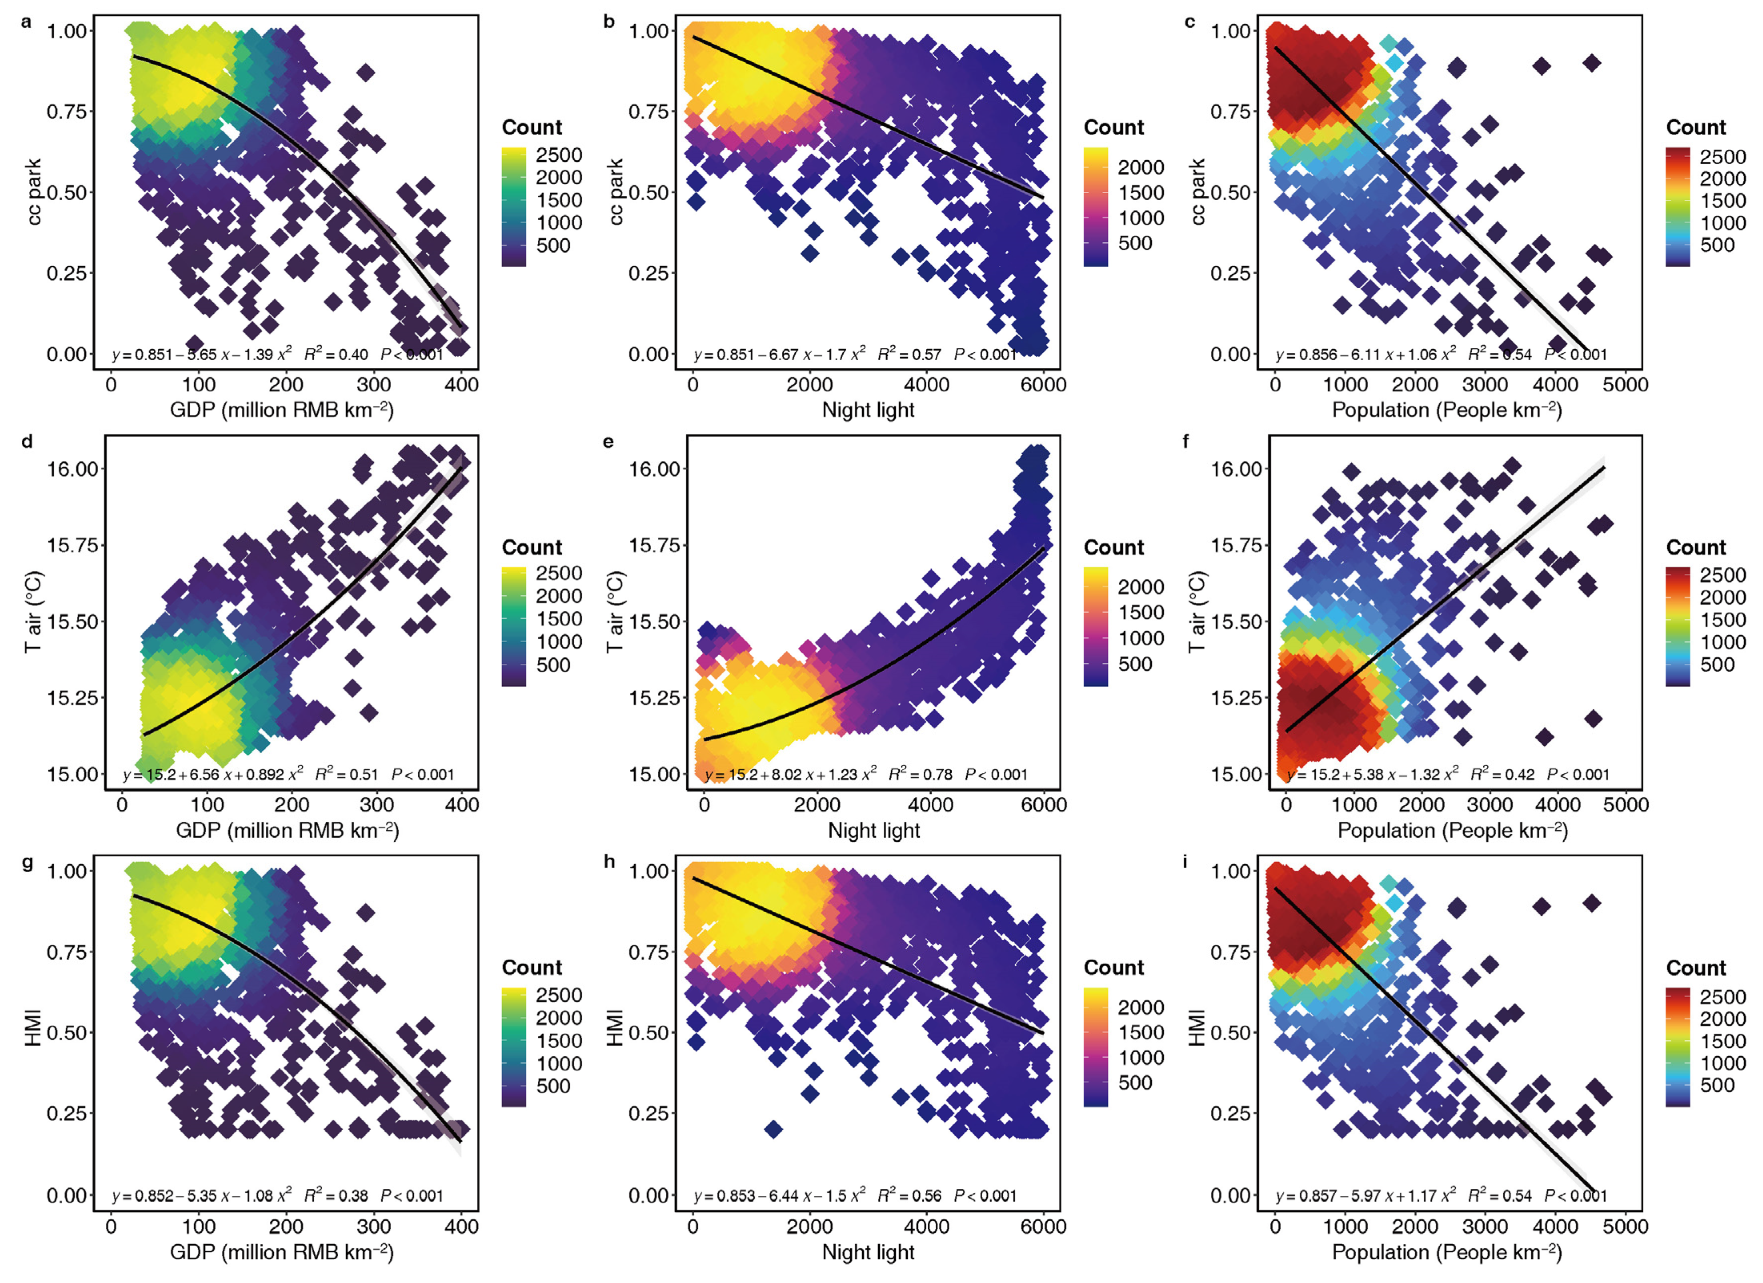
3.3. Driving Factors of the Urban Heat Island Effect

The UHI effect in Yangzhou is influenced by various landscape, social, and economic factors. In this section, we identify and analyze the key potential drivers that contribute to the UHI effect in the study area. In the cropland landscape, the cc park and HMI indices were negatively correlated with T air, NP, and PD. Specifically, the negative correlations between these two indices and T air were extremely significant (p < 0.01), whereas those for NP were significant (p < 0.05) (Table 5 and Figure S2). Additionally, these two indices showed significant positive correlations with CA, PLAND, and AI (p < 0.05). T air was significantly negatively correlated with CA, PLAND, and AI and significantly positively correlated with NP (p < 0.05). Moreover, CA and PLAND exhibited highly significant negative correlations with NP (p < 0.01).
In the impervious landscape, the cc park and HMI indices exhibited negative correlations with T air, CA, PLAND, and AI, with extremely significant negative correlations noted for T air, CA, and PLAND (p < 0.01). These indices displayed positive but not statistically significant correlations with NP and PD. T air was positively correlated with CA, PLAND, and AI, with correlations with CA and PLAND reaching extremely significant levels (p < 0.01). Furthermore, there was a highly significant positive correlation between CA and PLAND (p < 0.01) and a significant negative correlation between NP and AI (p < 0.05).
Rapid population growth and urbanization in Yangzhou have intensified the UHI effect. Areas with high population densities typically exhibit higher temperatures owing to increased human activity and energy consumption. GDP, night-light, and population density indices serve as proxies for the intensity of human activities. Our analysis examined the correlations between these indices and heat island effect indicators in 2020 (Figure 5). The cc park exhibits significant negative correlations with GDP, night-light, and population density, with correlation coefficients (R2) ranging from 0.40 to 0.57, suggesting that more intense human activities are associated with diminished urban cooling capacities. Similarly, the HMI correlates with these indices in a manner akin to cc park, with R2 values from 0.38 to 0.56, indicating that increased human activity reduces the city’s capacity for heat mitigation. It is important to note that cc park reflects heat mitigation capacity and therefore exhibits a spatial pattern similar to that of the HMI. Thus, the driving factors of these two indicators also show consistency. Furthermore, T air shows significant positive correlations with GDP, night-light, and population density, with R2 values between 0.42 and 0.78, demonstrating that air temperatures rise as human activities intensify.

4. Discussion

4.1. Spatio-Temporal Dynamics of Urban Heat Island and Socio-Ecological Drivers

Our analysis revealed notable spatiotemporal variations in the intensity and extent of the UHI effect across different regions of the city. This underscores the importance of considering spatial and temporal dimensions in UHI mitigation strategies and urban planning initiatives. The continuous shrinkage of cropland landscapes and expansion of urban landscapes were the primary drivers of the heat island effect in Yangzhou City, which is consistent with previous studies [3]. The Hanjiang and Guangling districts in the southern part of Yangzhou, which constitute the city’s main urban areas, have experienced an increase in their cc park and HMI over the past 30 years due to urbanization. Consequently, the T air increased by 0.14 °C.
This study identified various social and ecological factors contributing to simulated UHI patterns. These included demographic characteristics, socioeconomic status, human activity intensity, and the landscape pattern index. Understanding these drivers is essential for devising targeted interventions aimed at mitigating the UHI effects and enhancing urban resilience. The T air was strongly influenced by night-light intensity, showing a significant correlation with an R2 value of 0.78. This underscores the profound impact of human activities on the heat island effect and aligns with the findings of Niu et al. (2021), who employed multiscale geographically weighted regression to analyze the drivers of heat islands in 281 Chinese cities [5]. An analysis of the night-light index revealed areas with high urban activity. It is important to note that, while the night-light index can indicate regions of higher population density and economic activity, it is not a direct measure of heat production. High lighting density in newly developed areas does not necessarily equate to high heat emissions. Therefore, the findings related to the night-light index should be interpreted as indicative of potential hotspots of human activity that could indirectly contribute to UHIs through associated energy usage and infrastructure development. This approach acknowledges the limitations of the night-light index as a standalone indicator and complements it with additional data on land use and socioeconomic factors to provide a more comprehensive understanding of UHI dynamics. In addition, some weak linear correlations (such as between T air and population) indicate the complexity and potential spatial heterogeneity of the driving factors of the UHI effect. The interaction between these driving factors and the impact of the UHI effect can be further explored using other methods, such as spatial autocorrelation [26].
Urban densification is a well-known driver of UHI intensity because higher population density and increased built-up areas can lead to greater heat retention and reduced cooling effects [27]. In this study, we evaluated densification trends in Yangzhou City over the past three decades using population density and built-up area data. From 1990 to 2020, Yangzhou has experienced notable urban expansion and densification. Population density increased from approximately 658 persons per square kilometer in 1980 to 687 persons per square kilometer in 2020. The urbanization rate of Yangzhou City has increased by 44.8% (https://www.yangzhou.gov.cn/, accessed on 8 September 2024), the percentage of impressive landscape has increased by 9.5%, and the population has increased by 4.3%. This densification contributed to the increase in UHI intensity observed in our study.
The wind environment and convection-induced cooling effects are critical factors that influence UHI dynamics [28]. Wind enhances the dispersion of heat and pollutants, leading to cooling effects, particularly in densely populated urban areas. However, this study did not include a detailed analysis of the wind environment for several reasons. Our study primarily aimed to investigate the spatiotemporal heterogeneity of UHIs and their socioecological drivers such as land-use change, population density, and economic activities. Including the wind environment is beyond the scope of this study. Moreover, extensive literature has established the influence of wind on UHIs [29]. Our study builds on this foundation and focuses on less-explored socio-ecological aspects that are critical for urban planning and policy-making in Yangzhou. The role of atmospheric pollution in the formation of UHIs has been investigated. Wu et al. (2017) found that atmospheric aerosol particles, particularly PM2.5, affected the surface energy balance and atmospheric warming rates, thereby influencing the intensity of UHIs. Observations show that higher PM2.5 levels in urban areas are associated with lower heat island intensities, especially during the daytime [30]. Future research should investigate additional socio-ecological variables to better understand the mechanisms driving the heat island effect. For example, high urban green coverage and low urban population density and building density can mitigate the intensity of the urban heat island effect, mainly through evapotranspiration, shading, and regulating air flow [11,31].

4.2. Implications for Urban Planning and Management

This study has major implications for urban planning and management in Yangzhou City. By incorporating strategies to mitigate UHIs into urban planning frameworks, such as promoting green spaces, enhancing building designs and materials, and implementing heat-resistant infrastructure, cities can mitigate the adverse effects of UHIs and improve their overall livability. We offer several recommendations: First, Yangzhou is a canal city with an extensive network of rivers, which stands to benefit considerably from the implementation of photovoltaic systems in its waterways. Surface photovoltaic systems can effectively alleviate the UHI effect by utilizing canal water, thereby conserving valuable land resources while simultaneously lowering water surface temperatures and reducing evaporation. In addition, the deployment of these systems diminishes the reliance on fossil fuels [32], resulting in decreased greenhouse gas and other pollutant emissions. Such initiatives not only enhance the utilization of renewable energy within urban environments but also contribute to improved air quality and further mitigate the UHI effect. Second, the designs of green roofs should be improved. Green roofs not only lower surface temperatures but also enhance biodiversity and create pleasant spaces for residents [33]. Finally, urban layout and zoning should be improved. Strategic urban planning that optimizes building density, height, and orientation can improve airflow and reduce heat accumulation in densely populated areas [34].
In addition to the aforementioned multimeasure-centric solution sets, the framework proposed by Zhao et al. (2023) emphasizes an integrated approach that considers the interplay between various measures and their cumulative effects [34]. The first aspect is stakeholder engagement. Community members, businesses, and local governments should be involved in the planning process to ensure that proposed solutions are practical, acceptable, and sustainable. The second is data-driven decision-making. High-resolution spatial and temporal data were used to identify UHI hotspots and monitor the effectiveness of implemented measures. Finally, policy and regulatory support are provided. Developing and enforcing policies that encourage or mandate the adoption of UHI mitigation strategies, such as green building codes and urban greening incentives.

4.3. Limitations

First, although this study analyzed the spatiotemporal dynamics of the UHI effect in Yangzhou City over nearly 30 years, seasonal or diurnal variations were not considered. In addition, future research should explore the relationship between urban warming, the increasing demand for space cooling, and the associated power consumption in summer. Li et al. (2023) [35] provided valuable insights that could help us understand this connection and develop targeted mitigation strategies. Integrating cooling demand data with UHI analysis offers a more comprehensive understanding of the impact of urban warming. Second, the main urban areas of Yangzhou City are the most severely affected by the heat island effect. Finally, environmental indicators, such as PM2.5, which can help analyze the intrinsic driving forces behind the heat island effect, should also be considered in future research.

5. Conclusions

This study aims to advance our understanding of the spatiotemporal heterogeneity of UHIs and their socioecological drivers in Yangzhou City, China. By elucidating the complex interplay between urbanization, environmental change, and socioeconomic dynamics, we aim to inform evidence-based decision-making and policy formulation aimed at enhancing urban sustainability and resilience in the face of climate change.
The rapid urbanization in Yangzhou has intensified the UHI effect, with the T air increasing by 0.14 °C. The main heat island areas are concentrated in southern Yangzhou and have expanded over time. Air temperature was strongly and positively correlated with the GDP, night-light index, and population density. Under the impervious land use type, cc park and HMI were negatively correlated with CA and PLAND. By integrating multi-measure-centric solutions and a complementary framework for decision-making, Yangzhou can effectively mitigate the adverse impacts of UHIs. This holistic approach not only addresses the immediate thermal comfort of urban residents but also contributes to long-term urban sustainability and resilience.
Future research should focus on advancing our understanding of the complex interactions among the social, ecological, and climatic factors that contribute to the formation of UHIs. Long-term monitoring, interdisciplinary research approaches, and advanced modeling techniques can provide valuable insights into the nature of UHI dynamics and inform evidence-based decision-making and urban planning practices. Moreover, we will investigate the use of models to simulate UHI maps, integrate multisource data, including land surface temperature (LST), and account for seasonal and diurnal variations to deepen our understanding of UHI dynamics. Finally, addressing the spatiotemporal heterogeneity of the UHI effect and its potential socio-ecological drivers requires a multifaceted collaborative approach. By leveraging the synergies among scientific research, policymaking, and community engagement, we can promote sustainable urban development and build climate-adaptive cities for future generations.

Supplementary Materials

The following supporting information can be downloaded at: https://www.mdpi.com/article/10.3390/land13091470/s1, Figure S1: Relationship between measured air temperature and simulated air temperature derived from the InVest Urban Cooling model; Figure S2: Scatter plot of the relationship between landscape pattern index and air temperature (°C) under different land use type. Table S1: Additional parameters for the InVest Urban Cooling model; Table S2: Formula and ecological meaning of the landscape pattern index used in this study. References [19,22] are cited in the Supplementary Materials.

Author Contributions

Conceptualization, T.W. and Q.X.; methodology, T.W. and Z.W.; formal analysis, T.W.; writing—original draft preparation, T.W.; writing—review and editing, T.W., Z.W. and Q.X.; visualization, T.W. and Z.W.; supervision, Q.X.; funding acquisition, Q.X. All authors have read and agreed to the published version of the manuscript.

Funding

This research was funded by the National Natural Science Foundation of China (32301961), the Natural Science Foundation of Jiangsu Province (BK20210791), the General Project of Philosophy and Social Science Research in Colleges and Universities in Jiangsu Province (2023SJYB2057), the Lv Yang Jin Feng Talent Plan of Yangzhou City, and the Qinglan Project of Yangzhou University.

Data Availability Statement

The raw data supporting the conclusions of this article will be made available by the authors on request.

Conflicts of Interest

The authors declare no conflicts of interest.

References

  1. Deng, X.; Gao, F.; Liao, S.; Liu, Y.; Chen, W. Spatiotemporal Evolution Patterns of Urban Heat Island and Its Relationship with Urbanization in Guangdong-Hong Kong-Macao Greater Bay Area of China from 2000 to 2020. Ecol. Indic. 2023, 146, 109817. [Google Scholar] [CrossRef]
  2. Zhang, K.; Cao, C.; Chu, H.; Zhao, L.; Zhao, J.; Lee, X. Increased Heat Risk in Wet Climate Induced by Urban Humid Heat. Nature 2023, 617, 738–742. [Google Scholar] [CrossRef] [PubMed]
  3. Peng, J.; Qiao, R.; Wang, Q.; Yu, S.; Dong, J.; Yang, Z. Diversified Evolutionary Patterns of Surface Urban Heat Island in New Expansion Areas of 31 Chinese Cities. npj Urban Sustain. 2024, 4, 14. [Google Scholar] [CrossRef]
  4. Cabon, V.; Quénol, H.; Dubreuil, V.; Ridel, A.; Bergerot, B. Urban Heat Island and Reduced Habitat Complexity Explain Spider Community Composition by Excluding Large and Heat-Sensitive Species. Land 2024, 13, 83. [Google Scholar] [CrossRef]
  5. Niu, L.; Zhang, Z.; Peng, Z.; Liang, Y.; Liu, M.; Jiang, Y.; Wei, J.; Tang, R. Identifying Surface Urban Heat Island Drivers and Their Spatial Heterogeneity in China’s 281 Cities: An Empirical Study Based on Multiscale Geographically Weighted Regression. Remote Sens. 2021, 13, 4428. [Google Scholar] [CrossRef]
  6. Geng, X.; Zhang, D.; Li, C.; Yuan, Y.; Yu, Z.; Wang, X. Impacts of Climatic Zones on Urban Heat Island: Spatiotemporal Variations, Trends, and Drivers in China from 2001–2020. Sustain. Cities Soc. 2023, 89, 104303. [Google Scholar] [CrossRef]
  7. Dewan, A.; Kiselev, G.; Botje, D.; Mahmud, G.I.; Bhuian, M.H.; Hassan, Q.K. Surface Urban Heat Island Intensity in Five Major Cities of Bangladesh: Patterns, Drivers and Trends. Sustain. Cities Soc. 2021, 71, 102926. [Google Scholar] [CrossRef]
  8. Nuruzzaman, M. Urban Heat Island: Causes, Effects and Mitigation Measures—A Review. Int. J. Environ. Monit. Anal. 2015, 3, 67–73. [Google Scholar] [CrossRef]
  9. Chen, L.; Ma, Y. Exploring the Spatial and Temporal Changes of Carbon Storage in Different Development Scenarios in Foshan, China. Forests 2022, 13, 2177. [Google Scholar] [CrossRef]
  10. Phelan, P.E.; Kaloush, K.; Miner, M.; Golden, J.; Phelan, B.; Silva, H.; Taylor, R.A. Urban Heat Island: Mechanisms, Implications, and Possible Remedies. Annu. Rev. Environ. Resour. 2015, 40, 285–307. [Google Scholar] [CrossRef]
  11. Zawadzka, J.E.; Harris, J.A.; Corstanje, R. Assessment of Heat Mitigation Capacity of Urban Greenspaces with the Use of InVEST Urban Cooling Model, Verified with Day-Time Land Surface Temperature Data. Landsc. Urban Plan. 2021, 214, 104163. [Google Scholar] [CrossRef]
  12. InVest. User’s Guide. Available online: http://releases.naturalcapitalproject.org/invest-userguide/latest/en/urban_cooling_model.html (accessed on 8 September 2024).
  13. Ronchi, S.; Salata, S.; Arcidiacono, A. Which Urban Design Parameters Provide Climate-Proof Cities? An Application of the Urban Cooling InVEST Model in the City of Milan Comparing Historical Planning Morphologies. Sustain. Cities Soc. 2020, 63, 102459. [Google Scholar] [CrossRef]
  14. Hou, H.; Longyang, Q.; Su, H.; Zeng, R.; Xu, T.; Wang, Z.H. Prioritizing Environmental Determinants of Urban Heat Islands: A Machine Learning Study for Major Cities in China. Int. J. Appl. Earth Obs. Geoinf. 2023, 122, 103411. [Google Scholar] [CrossRef]
  15. Lauwaet, D.; Berckmans, J.; Hooyberghs, H.; Wouters, H.; Driesen, G.; Lefebre, F.; De Ridder, K. High Resolution Modelling of the Urban Heat Island of 100 European Cities. Urban Clim. 2024, 54, 101850. [Google Scholar] [CrossRef]
  16. Pan, Y.; Wu, Y.; Xu, X.; Zhang, B.; Li, W. Identifying Terrestrial Landscape Character Types in China. Land 2022, 11, 1014. [Google Scholar] [CrossRef]
  17. Jia, Y.; Tang, L.; Xu, M.; Yang, X. Landscape Pattern Indices for Evaluating Urban Spatial Morphology—A Case Study of Chinese Cities. Ecol. Indic. 2019, 99, 27–37. [Google Scholar] [CrossRef]
  18. Tan, C.; Xu, B.; Hong, G.; Wu, X. Integrating Habitat Risk and Landscape Resilience in Forest Protection and Restoration Planning for Biodiversity Conservation. Landsc. Urban Plan. 2024, 248, 105111. [Google Scholar] [CrossRef]
  19. Hu, D.; Wang, R.-S.; Lei, K.-P.; Li, F.; Wang, Z.; Wang, B.-N. Expanding Ecological Appropriation Approach: Solar Space Method and a Case Study in Yangzhou City, East China. Ecol. Complex. 2009, 6, 473–483. [Google Scholar] [CrossRef]
  20. Yang, J.; Huang, X. 30 m Annual Land Cover and Its Dynamics in China from 1990 to 2019. Earth Syst. Sci. Data Discuss. 2021, 4417810, 3907–3925. [Google Scholar] [CrossRef]
  21. Zomer, R.J.; Xu, J.; Trabucco, A. Version 3 of the Global Aridity Index and Potential Evapotranspiration Database. Sci. Data 2022, 9, 409. [Google Scholar] [CrossRef]
  22. Hu, Y.; Wang, C.; Li, J. Assessment of Heat Mitigation Services Provided by Blue and Green Spaces: An Application of the InVEST Urban Cooling Model with Scenario Analysis in Wuhan, China. Land 2023, 12, 963. [Google Scholar] [CrossRef]
  23. Zardo, L.; Geneletti, D.; Pérez-Soba, M.; Van Eupen, M. Estimating the Cooling Capacity of Green Infrastructures to Support Urban Planning. Ecosyst. Serv. 2017, 26, 225–235. [Google Scholar] [CrossRef]
  24. McDonald, R.; Kroeger, T.; Boucher, T.; Longzhu, W.; Salem, R.; Adams, J.; Bassett, S.; Edgecomb, M.; Garg, S. Planting Healthy Air: A Global Analysis of the Role of Urban Trees in Addressing Particulate Matter Pollution and Extreme Heat; CAB International: Wallingford, UK, 2016. [Google Scholar]
  25. Ren, S.; Zhao, H.; Zhang, H.; Wang, F.; Yang, H. Influence of Natural and Social Economic Factors on Landscape Pattern Indices—The Case of the Yellow River Basin in Henan Province. Water 2023, 15, 4175. [Google Scholar] [CrossRef]
  26. Xi, Y.; Wang, S.; Zou, Y.; Zhou, X.C.; Zhang, Y. Seasonal Surface Urban Heat Island Analysis Based on Local Climate Zones. Ecol. Indic. 2024, 159, 111669. [Google Scholar] [CrossRef]
  27. Deng, X.; Cao, Q.; Wang, L.; Wang, W.; Wang, S.; Wang, S.; Wang, L. Characterizing Urban Densification and Quantifying Its Effects on Urban Thermal Environments and Human Thermal Comfort. Landsc. Urban Plan. 2023, 237, 104803. [Google Scholar] [CrossRef]
  28. Abbassi, Y.; Ahmadikia, H.; Baniasadi, E. Impact of Wind Speed on Urban Heat and Pollution Islands. Urban Clim. 2022, 44, 101200. [Google Scholar] [CrossRef]
  29. Zhao, Y.; Li, H.; Bardhan, R.; Kubilay, A.; Li, Q.; Carmeliet, J. The Time-Evolving Impact of Tree Size on Nighttime Street Canyon Microclimate: Wind Tunnel Modeling of Aerodynamic Effects and Heat Removal. Urban Clim. 2023, 49, 101528. [Google Scholar] [CrossRef]
  30. Wu, H.; Wang, T.; Riemer, N.; Chen, P.; Li, M.; Li, S. Urban Heat Island Impacted by Fine Particles in Nanjing, China. Sci. Rep. 2017, 7, 11422. [Google Scholar] [CrossRef]
  31. Ramírez-Aguilar, E.A.; Lucas Souza, L.C. Urban Form and Population Density: Influences on Urban Heat Island Intensities in Bogotá, Colombia. Urban Clim. 2019, 29, 100497. [Google Scholar] [CrossRef]
  32. Woolway, R.I.; Zhao, G.; Rocha, S.M.G.; Thackeray, S.J.; Armstrong, A. Decarbonization Potential of Floating Solar Photovoltaics on Lakes Worldwide. Nat. Water 2024, 2, 566–576. [Google Scholar] [CrossRef]
  33. Jahangir, M.H.; Zarfeshani, A.; Arast, M. Investigation of Green Roofs Effects on Reducing of the Urban Heat Islands Formation (The Case of a Municipal District of Tehran City, Iran). Nat.-Based Solut. 2024, 5, 100100. [Google Scholar] [CrossRef]
  34. Zhao, Y.; Sen, S.; Susca, T.; Iaria, J.; Kubilay, A.; Gunawardena, K.; Zhou, X.; Takane, Y.; Park, Y.; Wang, X.; et al. Beating Urban Heat: Multimeasure-Centric Solution Sets and a Complementary Framework for Decision-Making. Renew. Sustain. Energy Rev. 2023, 186, 113668. [Google Scholar] [CrossRef]
  35. Li, H.; Zhao, Y.; Bardhan, R.; Chan, P.W.; Derome, D.; Luo, Z.; Ürge-Vorsatz, D.; Carmeliet, J. Relating Three-Decade Surge in Space Cooling Demand to Urban Warming. Environ. Res. Lett. 2023, 18, 124033. [Google Scholar] [CrossRef]
Figure 1. The location of Yangzhou City in China and its land cover change from 1990 to 2020. (a) indicates the location of Jiangsu Province in China; (b) indicates Yangzhou City in Jiangsu Province; (c) indicates the elevation of Yangzhou City. (dg) indicate the land use changes from 1990, 2000, 2010, and 2020, respectively. The map highlights the main administrative divisions and landmarks in the study area, including the Hanjiang District and Guangling District, which comprise the focus of this research.
Land 13 01470 g001
Figure 2. Change in cooling capacity (cc park) in Yangzhou City from 1990 to 2020. Note that the analysis focused on all seasons in a whole year. (ad) indicate the years of 1990, 2000, 2010, and 2020, respectively.
Land 13 01470 g002
Figure 3. Changes in the heat mitigation index (HMI) in Yangzhou City from 1990 to 2020. Note that the analysis focused on all seasons in a whole year. (ad) indicate the years of 1990, 2000, 2010, and 2020, respectively.
Land 13 01470 g003
Figure 4. Change in the mixed air temperature (T air) in Yangzhou City from 1990 to 2020. Note that the analysis focused on all seasons in a whole year. (ad) indicate the years of 1990, 2000, 2010, and 2020, respectively.
Land 13 01470 g004
Figure 5. A density scatter plot reflecting the relationship between the heat island effect index and social index. cc park, cooling capacity; HMI, heat mitigation index; T air, mixed air temperature; and GDP, gross domestic product. (ac) indicate the relationship between the GDP, night light, population, and cc park; (df) indicate the relationship between the GDP, night light, population, and T air; (gi) indicate the relationship between the GDP, night light, population, and HMI. Note that the density scatter plot was drawn using data from 2020 as a representative year to reflect the potential relationship between social factors and heat island effect indicators. The ‘Count’ in the legend represents the number of data points in each region.
Land 13 01470 g005
Table 1. Geographical and socio-ecological data sources.
DataRepresentative YearSpatial ResolutionSource
Land cover1990, 2000, 2010, and 20200.03 × 0.03 kmYang and Huang (2021) [20] (https://zenodo.org/records/8176941, accessed on 8 September 2024)
Digital elevation (DEM)0.03 × 0.03 kmGeospatial data cloud (http://www.gscloud.cn, accessed on 8 September 2024)
Potential evapotranspirationAnnual average1 × 1 kmZomer et al. (2022) [21] (https://doi.org/10.6084/m9.figshare.7504448.v5, accessed on 8 September 2024)
Gross domestic product (GDP)20201 × 1 kmResource and Environment Science and Data Center, Chinese Academy of Sciences (RESDC) (https://www.resdc.cn/Default.aspx, accessed on 8 September 2024)
Night-light index20201 × 1 kmNational Tibetan Plateau Data Center (TPDC) (https://data.tpdc.ac.cn/home, accessed on 8 September 2024)
Population density20201 × 1 kmRESDC (https://www.resdc.cn/Default.aspx, accessed on 8 September 2024)
Table 2. The biophysical parameters used for the InVest model.
Land Cover TypeKcGreen_AreaShadeAlbedo
Cropland0.610.30.2
Forest110.90.3
Grassland0.6510.50.2
Water110.10.1
Barren0.2000.27
Impervious0.300.20.15
Table 3. Changes in the heat island effect index from 1990 to 2020.
Yearcc ParkHMIT Air (°C)
Mean ± S.D.MinMaxMean ± S.D.MinMaxMean ± S.D.MinMax
19900.94 ± 0.080.021.000.94 ± 0.080.201.0015.08 ± 0.0615.0015.66
20000.92 ± 0.110.011.000.92 ± 0.100.201.0015.11 ± 0.0915.0015.84
20100.89 ± 0.140.011.000.89 ± 0.140.201.0015.16 ± 0.1415.0015.98
20200.85 ± 0.170.011.000.85 ± 0.170.171.0015.22 ± 0.1715.0016.06
cc park, cooling capacity; T air, mixed air temperature; and HMI, heat mitigation index; S.D., standard deviation.
Table 4. Changes in the landscape pattern index from 1990 to 2020.
Land Cover TypeYearCA PLANDNP PD AI
m2% %
Cropland1990549,03283.429430.44796.4
2000521,20579.252541.79895.8
2010492,94874.979361.20594.8
2020467,43671.098971.50393.8
Impervious199036,4975.551,4997.82261.3
200051,0047.747,9807.28869.6
201070,57410.746,5537.07174.6
202098,99415.046,5297.06778.3
CA, patch area; PLAND, percentage of landscape; NP, number of patches; PD, patch density; and AI, aggregation index.
Table 5. Correlation analysis between the urban heat island effect and landscape pattern index.
Land Cover Type cc ParkHMIT AirCAPLANDNPPDAI
Croplandcc park11.000 **−1.000 **0.986 *0.989 *−0.983 *−0.9380.978 *
HMI 1−1.000 **0.986 *0.989 *−0.983 *−0.9380.978 *
T air 1−0.987 *−0.990 *0.984 *0.932−0.980 *
CA 11.000 **−0.999 **−0.9450.939
PLAND 1−0.998 **−0.9490.944
NP 10.932−0.939
PD 1−0.853
IJI 0.944
AI 1
Imperviouscc park11.000 **−1.000 **−1.000**−1.000 **0.8280.681−0.927
HMI 1−1.000 **−1.000**−1.000 **0.8280.681−0.927
T air 10.999**1.000 **−0.830−0.6800.928
CA 11.000 **−0.828−0.6850.927
PLAND 1−0.828−0.6810.927
NP 10.957 *−0.978 *
PD 1−0.896
IJI 0.930
AI 1
The correlation analysis was conducted using the average values of four independent years in 1990, 2000, 2010, and 2020, with n = 4 for each indicator. **: significance at the 0.01 level (two tailed); *: significance at the 0.05 level (two tailed). Significant correlations are shown in bold. cc park, cooling capacity; HMI, heat mitigation index; T air, mixed air temperature; CA, patch area; PLAND, percentage of landscape; NP, number of patches; PD, patch density; and AI, aggregation index.
Disclaimer/Publisher’s Note: The statements, opinions and data contained in all publications are solely those of the individual author(s) and contributor(s) and not of MDPI and/or the editor(s). MDPI and/or the editor(s) disclaim responsibility for any injury to people or property resulting from any ideas, methods, instructions or products referred to in the content.

