Abstract
Understanding the effects of short-term artificial revegetation on preventing soil degradation in erosion gullies of black soil areas is essential to choosing the most suitable species of vegetation for controlling the development of erosion gullies. A field experiment with short-term artificial revegetation with herbaceous species (Medicago sativa L., Glycyrrhiza pallidiflora Maxim., Elytrigia repens (L.) Desv. ex Nevski, Rheum palmatum L., Asparagus officinalis L., Trifolium repens L., Bromus inermis Leyss., Elymus dahuricus Turcz.) and a runoff scouring test were conducted in a typical erosion gully in a black soil area. Soil erosion, physicochemical characteristics, and shoot/root characteristics were measured to evaluate the effects of short-term artificial revegetation. Short-term artificial revegetation significantly decreased (p < 0.05) sediment yield by 91.1% ± 7.2% compared with that of bare soil. Soil total nitrogen (TN), total potassium (TP), available phosphorus (AP), cation exchange capacity (CEC), water-stable aggregates > 0.25 mm (WR0.25), and aggregate mean weight diameter (MWD) and mean geometric diameter (GWD) were significantly correlated with vegetated treatments, indicating they were factors sensitive to short-term artificial revegetation. Except for total potassium (TK), the other soil characteristics decreased in vegetated treatments. In addition to increasing TK, vegetated treatments also increased soil available nitrogen (AN)/TN ratios in the short term. The overall effects of different herbaceous species on soil and water conservation, soil quality, and vegetation growth were evaluated, and Trifolium repens L. is the most suitable for preventing soil degradation in an erosion gully. The results of this study will provide a reference for the restoration and protection of the ecological environment in black soil areas with gully erosion.
1. Introduction
Soil erosion is a global phenomenon that is becoming increasingly important, especially in the context of climate change. Gully erosion occurs across a wide range of environments as a sign of land degradation. Agricultural fields are damaged by gully erosion, sediments are lost, and surface soil quality is compromised [1,2]. In Northeast China, the mainly black and fertile soils are essential for grain production, and therefore play a crucial role in national food security. However, as of 2020, 666.7 thousand gullies were reported in the region (Songliao River Water Resources Commission of the Ministry of Water Resources, http://www.slwr.gov.cn/, accessed on 1 May 2024). As erosion gullies expand annually, they encroach on arable land by 7.39 km2 y−1 [3]. The annual loss in grain yields due to gully erosion is approximately 36.2 × 10⁸ kg, which represents 10% of the country’s total grain supply (National Earth System Science Data Center, http://northeast.geodata.cn, accessed on 1 May 2024).
Combating the gully erosion is very necessary to prevent land degradation in black soil. Erosion gullies develop by headcuts and expanding gully slopes. Trees and shrubs are commonly used types of vegetation to prevent gully wall expansion and effectively control gully erosion [4]. Although the mechanisms by which vegetation conserves water and soil are well understood [5,6], planting trees or shrubs to control gully erosion has some drawbacks. First, the trees planted may not be suitable for the environment. It is generally true that native forest trees retain soil and water better than shrubs and grasslands, but when planted, the effects can be very different [7]. Second, the effects of trees and shrubs are slow to develop because of the long growing periods. Third, in contrast to nonintercepted drops, those intercepted by tall trees without an understory can be larger and have greater kinetic energy, which can lead to soil crusting, surface runoff generation, and gully formation [8,9]. Last, shrubland is hydraulically more efficient than grassland, leading to higher runoff and erosion rates [10].
Herbaceous revegetation can effectively reduce soil and water loss [11,12], and it conserves more soil and water compared with trees and shrubs on gully slopes [7,13]. On gully slopes, herbaceous canopies, roots, and litter all play a role in controlling soil erosion [14]. In addition to intercepting and diverting rainwater, herbaceous vegetation canopies provide physical protection to soils by reducing the impact of raindrops and reducing “splash” effects [15]. As with the canopy, litter can serve as a protective barrier, while roots can hold soil in place, trap sediment, and add organic substances to soil, thus improving soil structure [16]. The infiltrability and structural stability of soil are improved by plant roots and reduce gully erosion [4]. Roots play a major role in soil resistance to concentrated flow erosion by virtue of the characteristics of their fibrils (fibrils < 1.0 mm in diameter), which are distributed densely at a depth of 0–30 cm [17]. It may be helpful to use herbaceous revegetation studies to understand the relationships between herbaceous species and soil characteristics, and to select the species that are most suitable for restoration [18,19]. Several soil quality characteristics are commonly evaluated under different vegetation treatments, including total phosphorus, bulk density, aggregate stability, saturated hydraulic conductivity, and macroporosity [20,21]. It is crucial to fully understand how to restore degraded soils, determining the responses of soil nutrients and structure to revegetation.
Compared with trees and shrubs, herbaceous vegetation has the advantages of low cost, efficiency, and multiple roles. According to Wang et al. [22], grassland has important effects on erosion control. In addition, the cost of controlling gully erosion by herbaceous vegetation is expected to be only a third of that by trees or shrubs. Last, planted forage grass has a short growing period, and the effects are apparent in one year. Yan et al. [23] also found that herbaceous vegetation on gully slopes decreased runoff and soil loss by 19–30% and 78–97%, respectively. However, few managers use herbaceous vegetation to measure whether it can control the active degrading soil quality in gullies. Whether short-term artificial herbaceous revegetation is suitable for controlling erosion gullies and preventing soil degradation on gully slopes in black soil regions remains uncertain. In addition, little is known about which herbaceous species are suitable for preventing soil degradation in gully slopes.
To examine the effects of different species of short-term herbaceous vegetation on the soil quality in gully slopes and then select the species best suited for controlling soil degradation in an erosion gully of a black soil region, we conducted a field artificial revegetation experiment and a runoff scouring experiment with eight species of herbs. Study objectives included determining (1) the role of herbaceous vegetation in preventing soil and water loss on gully slopes; (2) the effects of short-term artificial herbaceous vegetation restoration on soil physicochemical properties; and (3) the suitable herbaceous species to combat soil degradation in an erosion gully. The hypotheses are as follows: (1) herbaceous revegetation can reduce soil erosion on gully slopes; (2) short-term artificial herbaceous revegetation will improve the soil quality.
2. Materials and Methods
2.1. Study Area
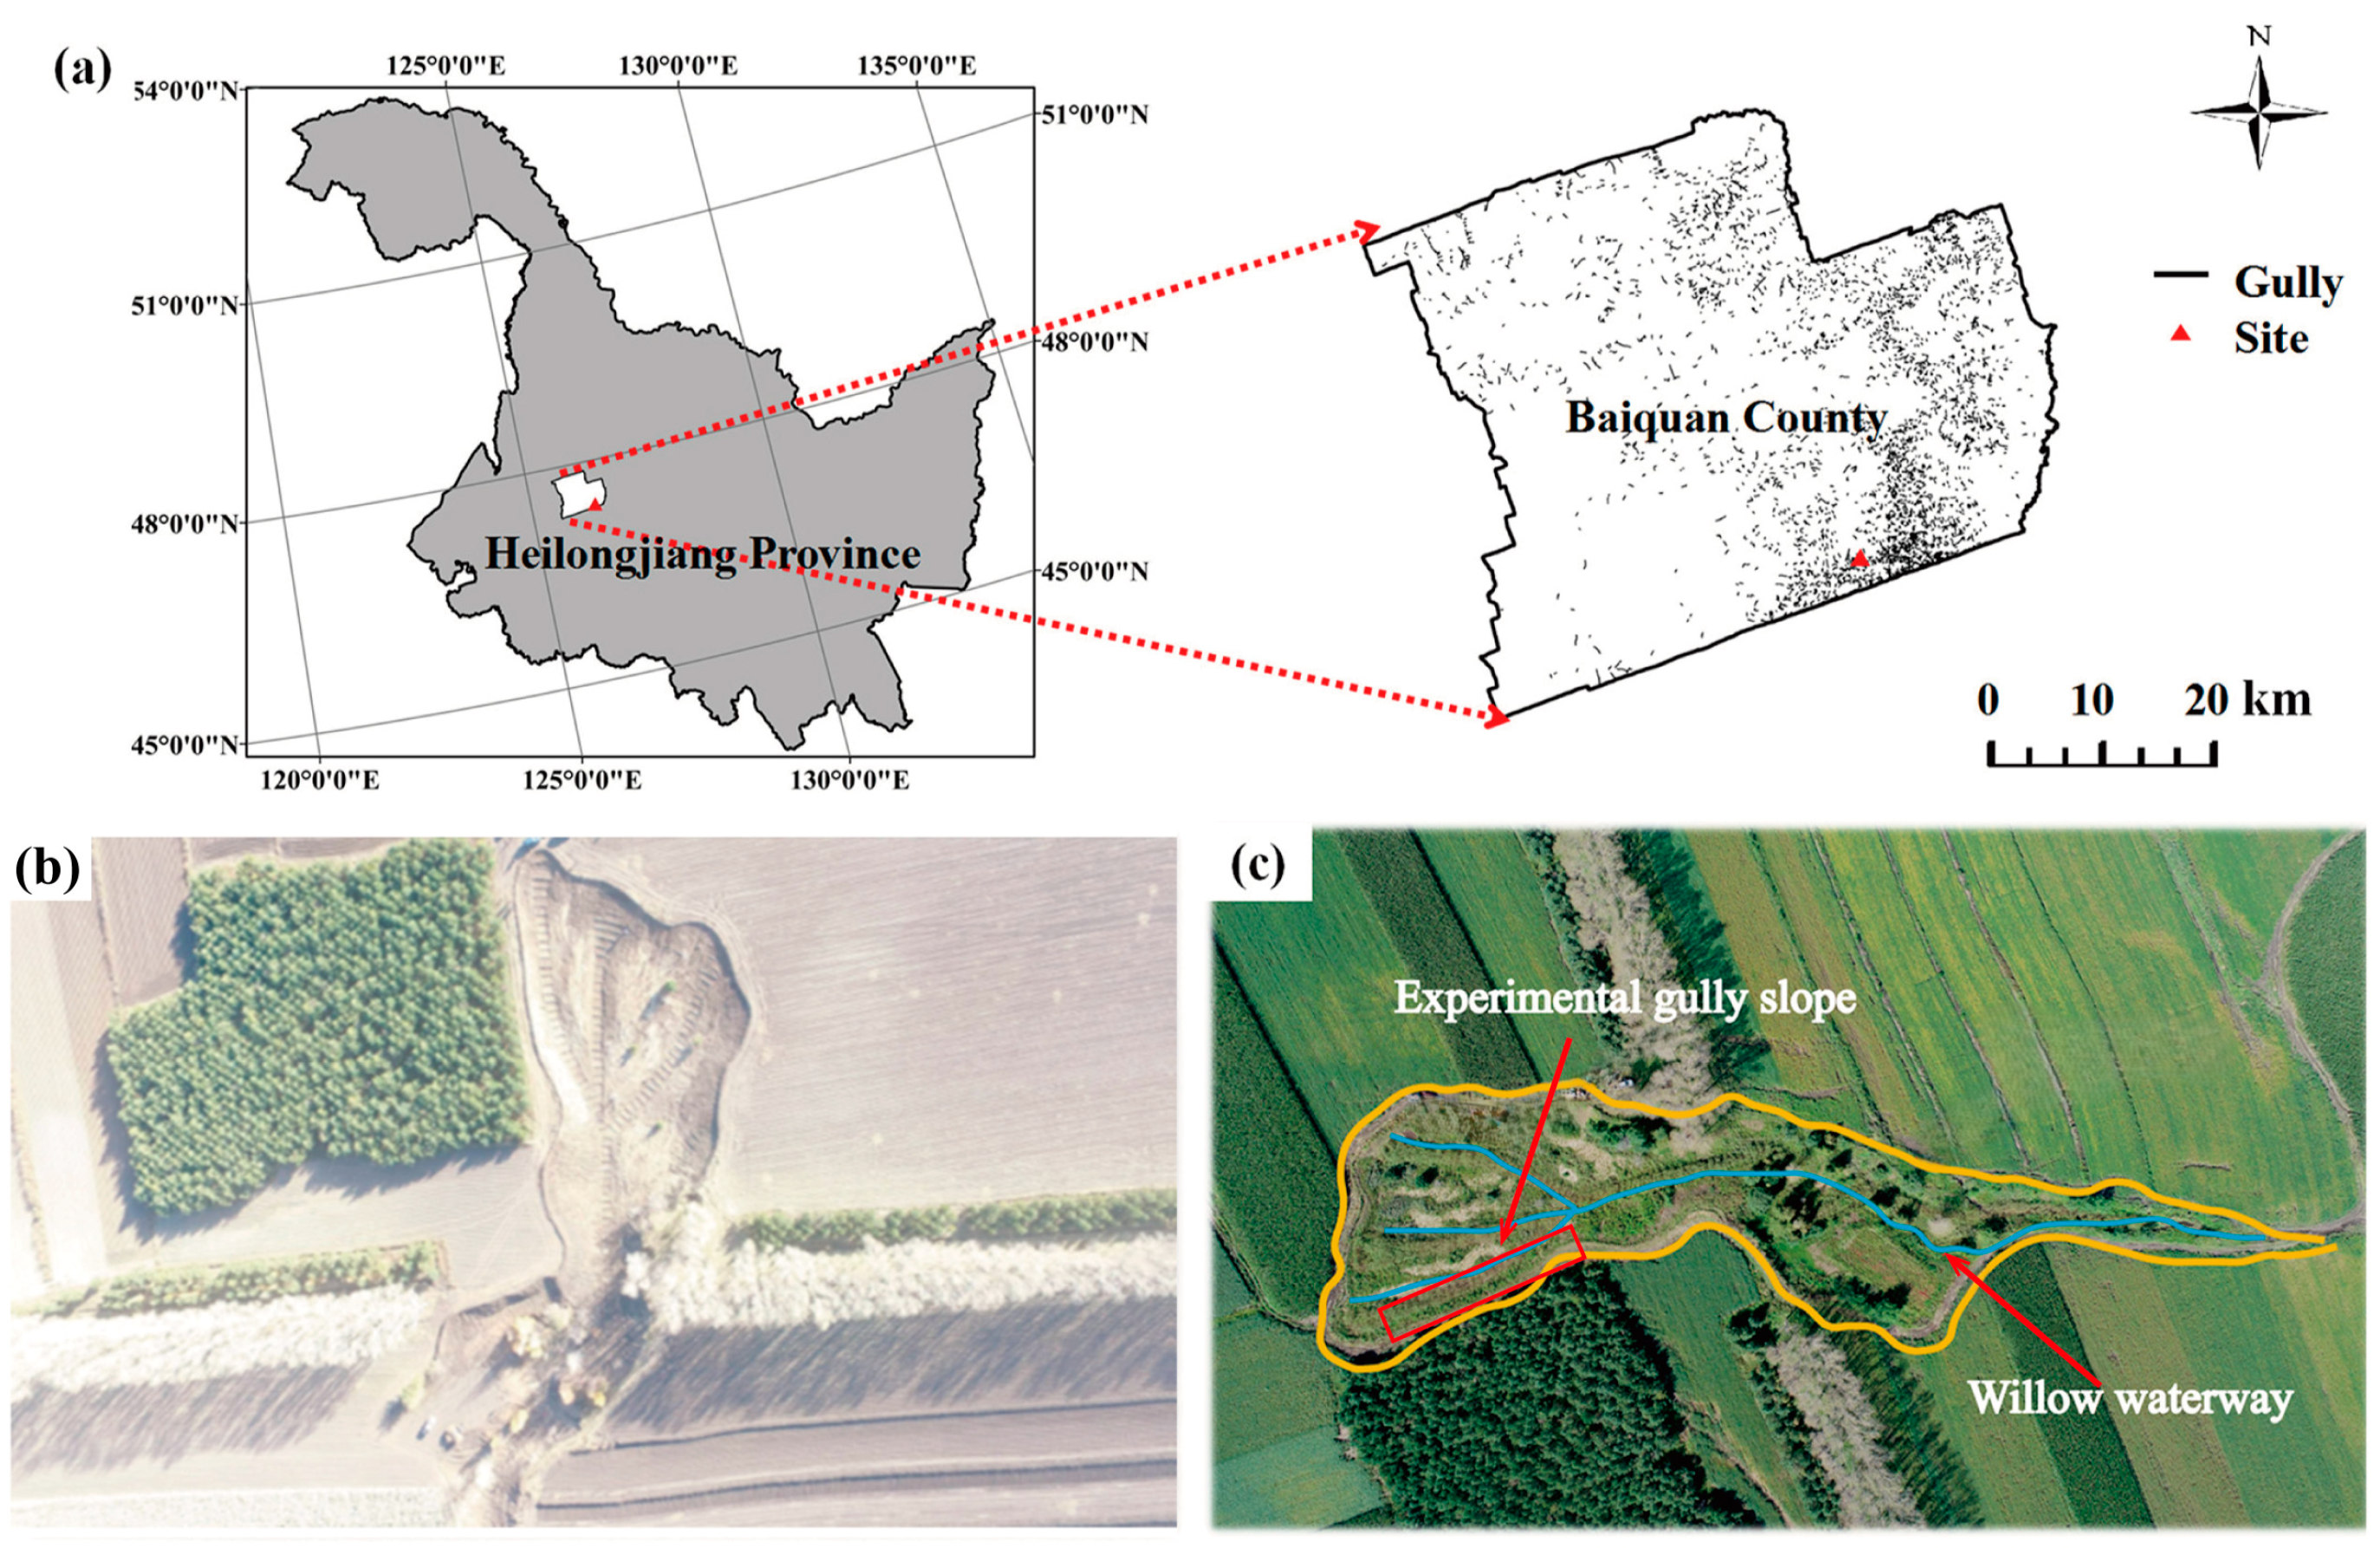
The erosion gully was in Zhaoguojun Village of Baiquan County in Heilongjiang Province (47°23′45.23″–47°23′54.18″ N, 126°16′21.03″–126°16′25.52″ E; Figure 1), China. The length of the erosion gully was 789 m, and the area of the gully was 1.1 ha. The mean depth of the erosion gully was 5 m. The longitudinal gradient of the gully was 61.3‰. The average annual temperature in the region is 1.5 °C, and the average annual rainfall is 530 mm. The soil is a silt loam soil and classified as Mollisol (also called black soil), with a soil depth of 30–50 cm. Soils and their parent materials are generally acidic to alkaline, with varying textures ranging from loam to clay loam, with most sola consisting mainly of clay loam. The land use types are forests and sloped croplands (3° to 5°).
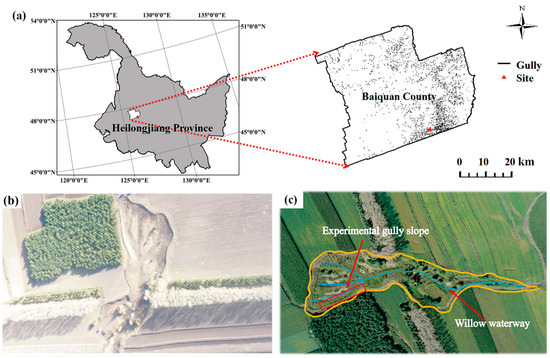
Figure 1.
Location of the study site in Baiquan County, Heilongjiang Province, China, with the color image showing the erosion gully examined in the study. Note: (a) is the location of the study site, (b) is the aerial view of the experimental gully slope before artificial revegetation, and (c) is the aerial view of the experimental gully slope after artificial revegetation.
2.2. Experimental Setup
In May 2018, eight species of perennial herbaceous plants were planted on the gully slope (Table S1), and bare soil was used for the control (BARE). Rheum palmatum L. (RH) is a perennial herb in the Caryophyllales, Polygonaceae, and Rheum L. Asparagus officinalis L. (AS) is a perennial herb in the Asparagales, Liliaceae, and Asparagus L. Elymus dahuricus Turcz. (ET) is a perennial herb in the Gramineae, and Elymus Linn. Medicago sativa L. (ME) is a perennial herb in the Rosaceae, Leguminosae, and Medicago L. Glycyrrhiza pallidiflora Maxim. (GL) is a perennial herb in the Rosaceae, Leguminosae, and Glycyrrhiza L. Elytrigia repens (L.) Desv.ex Nevski. (EN) is a perennial herb in the Gramineae, and Elytrigia Desv. Trifolium repens L. (TR) is a perennial herb in the Fabales Bromhead, Leguminosae, and Trifolium L. Bromus inermis Leyss. (BR) is a perennial herb in the Gramineae, and Bromus L. Fabaceae can fix nitrogen (N), a potentially important contribution in degraded soils. The Fabaceae and Gramineae plants were achieved by strip sowing with a 30 cm row spacing and 2–3 cm depth. AS was also sown using strip sowing with a row spacing of 30 cm and a sowing depth of 4–6 cm. RH was transplanted with a 30 cm row spacing with 1–2 plants per hole, growing to 15 cm, and a plant spacing of 50 cm. The germination rate and clarity were obtained (GB 6141 seed quality grading of Leguminosae and GB 6142 seed quality grading of Gramineae). Six replicate photos of each plot were taken at a height of 1.5 m, and PCOVER software (Version 3.00) was used to obtain the vegetation coverage (VC, %).
2.3. Runoff Scouring Experiment
Sixteen months after sowing, we conducted a field runoff scouring experiment, in September 2019. Three months before the runoff scouring experiment, each species of herbaceous plant was surrounded in three replicate runoff plots (2 m × 1 m). To isolate treatments, a steel sheet was embedded to a soil depth of 0.1 m around each runoff plot. Plastic pipes, valves, a buffer tank, and a water supply tank were used to supply water to the runoff plot [23]. An attachment was designed to connect the buffer tank to the water supply tank at its bottom. Until the runoff plot was filled with water, water from the water supply tank spilled into the buffer tank, ensuring uniform water flow that was stable and nonpressurized. In order to ensure adequate water supplementation during the experiment, two trucks supplied filtered water. The flow discharge was controlled using an adjusting valve and measured three times before and after each experiment. First, the soil of a runoff plot was saturated with water with a watering can to prevent the water from infiltrating into it. According to the maximum rainfall intensity (75 mm h−1) in the area (China Meteorological Data Service Centre, https://data.cma.cn/, accessed on 1 May 2024), the flow discharge was set at 0.24 L s−1, which was controlled by a switch. Runoff velocity was measured with a staining method. Each runoff scouring experiment was conducted three times. After the start and at the end of the experiment, three 5 s runoff samples were collected. Sediment yield was collected for 5 s every 15 s. As a measure of sediment concentration, samples were dried at 105 °C until a constant weight was reached (SC, g cm−3).
Surface runoff (SR, mm), sediment yield (SY, g m−2), and soil erosion rate (ER, g m−2 s−1) during the observation time (t, s) were calculated using Equations (1)–(4), respectively, as follows:
where V is the runoff volume (m3); L and W are the length (m) and width (m) of the plot, respectively; and M is the amount of soil loss (g).
SR = V/LW × 103
SY = M/LW
M = V × SC × 1000
ER = SY/t
The mean flow velocity (u, m s−1) was calculated as the product between surface flow velocity (us, m s−1) and the correction factor (α = 0.67). We measured the us every 2 min at a marked 1 m distance with five replications using the KMnO4 coloration technique. An accurate 1.0 mm steel rule was used to measure flow width (w, m) at three runoff observation sections. The flow hydraulic parameter unit flow discharge (q, m2 s−1), flow depth (h, m), flow shear stress (τ, Pa), stream power (ω, W m−2), Reynolds number (Re), and Froude number (Fr) were calculated using Equations (5)–(10), respectively, as follows:
where Q is flow discharge (m3 s−1); ρ is the water density (kg m−3); g is the constant of gravity (m s−2); R is the hydraulic radius (m), which is equal to the mean flow depth; J is the hydraulic gradient, which is equal to the sine of the soil surface slope angle; and υ0 is the kinematical viscosity (m2 s−1).
q = Q/w
h = q/u
τ = ρgRJ
ω = uτ
Re = uR/υ0
2.4. Soil Sampling and Laboratory Analysis
Before Frost’s Descent in 2018, a 1 m long sample section was randomly selected within the plant row of each plot. Three replications were carried out. We recorded the number of plants in each sample area. In the following year, the number of surviving plants was investigated after the plants in the sample area had resumed growth to calculate the resume growth rate of the plant. The resume growth rate = N (number of surviving plants before winter)/N1 (number of surviving plants after winter) × 100%.
Soil samples were collected outside the runoff plot with shovels before runoff scouring experiments at depths of 0–5 and 5–10 cm. Three samples were collected from the top to bottom of the gully slope and then composited as one soil sample. The sampling process was repeated three times per vegetated treatment and the bare soil. Drying was allowed to take place naturally by storing soil samples in well-ventilated conditions. Dried soils were sieved through a 200 μm mesh. Sieved soils were analyzed for physical and chemical properties.
The aggregate size distribution was measured by a slow-wetting method, with 50 g of air-dried soil that passed through a 10 mm sieve placed on the top of three nested sieves (2.0, 0.25, and 0.053 mm mesh) and submerged in tap water for 10 min. For 2 min, the wet sieve apparatus (DIK-2001, Daiki Rika Kogyo Co., Ltd., Saitama, Japan) was oscillated 3 cm up and down at a rate of 30 cycles per minute. Using the resistant soil materials on top of each sieve and the remaining unstable aggregates (<0.25 mm), all materials were oven-dried at 50 °C for 48 h. The wet aggregate stability (WAS) of the soil aggregates that remained above the sieves was calculated by weighing them after oven-drying:
WAS = (weight of aggregates on sieves/50 g) × 100%
The bulk density (BD) of the undisturbed soil was determined using a cutting ring (volume = 100 cm3) and oven-dried at 105 °C to a constant weight. By analyzing soil particle size distribution with a Mastersizer 2000 laser sizer (Malvern Instruments Ltd., Malvern, UK), soils were divided into sand, silt, and clay fractions. Soil BD, field capacity (FC), water content (SWC), and porosity (P) were measured separately by steel ring (volume = 100 cm3) and gravimetric methods. Soil aeration porosity was calculated as the difference between P and FC.
Soil organic carbon (SOC) and total nitrogen (TN) contents were determined by a Euro single elemental analyzer (Euro Vector, Milan, Italy). We measured soil total potassium (TK) using flame photometry, and soil nitrogen (AN) using Kang Hui dishes [24]. Soil available phosphorus (AP) was measured using a molybdenum–antimony resistance colorimetric method [25]. The soil cation exchange capacity (CEC) was determined by the CH3COONH4 exchange method, while the soil pH level was measured using a pH meter (S20P-K; Mettler-Toledo, Greifensee, Switzerland) in suspension with a 1:2.5 soil-to-water ratio.
After runoff scouring experiments, plants were clipped above the soil surface, sorted by species, and oven-dried for 48 h at 65 °C to a constant mass, then weighed to calculate shoot dry weight (SDW, kg ha−1). Topsoil root samples were collected by digging a randomly selected soil block of 20 cm (width) × 20 cm (length) × 30 cm (depth). After immersing a soil block in water for 12 h, intact and clean roots were collected by washing three times in water. Specific root length (SRL, m g−1), root/shoot ratio (RSR), root length density (RLD, cm cm−3), root surface area density (RSD, cm2 cm−3), and root volume (RV, cm3) were analyzed by a scanner (Expression 1640XL, Epson, Nagano-ken, Japan) and the WinRHIZO 2004a root analysis system (Regent Instrument Inc., Quebec, QC, Canada). RLD and RSD are the ratios of root length and surface area, respectively, and soil volume. Root biomass was determined by oven-drying at 65 °C for 48 h to a constant mass.
2.5. Statistical Analyses
The soil properties of eight species were compared with analysis of variance (ANOVA; t-test) and least significant difference (LSD), both at significance level p < 0.05. The coefficients of correlation between soil clay content, root characteristics, and aggregate characteristics were determined using Pearson correlation analysis with p < 0.05. Analysis of the data and data processing were performed using SPSS 22 (SPSS Inc., Chicago, IL, USA) and Origin 2021 (Origin Lab Corp., Northampton, MA, USA). ArcGIS 10.6 (Esri Inc., Redlands, CA, USA) was used to generate the study area map. Principal component analysis was performed with SPSSAU (https://spssau.com/, accessed on 1 May 2024) to obtain scores to evaluate the effects of short-term artificial revegetation.
3. Results
3.1. Adaptability of Artificial Revegetation
Differences in the timing of growth stages demonstrated the adaptability of artificial revegetation on the gully slope (Tables S1 and S2). Resume growth is an important indictor in evaluating vegetation adaptability. BR and RH were the first species to resume growth on 3 May. Most of the species returned to green during the first 10 d period of May. The last species to resume growth was GL on June 10. The resume growth ratio varied from 60% to 92% and was greater than 90% for ME, GL, and TR.
There were large differences in shoot and root characteristics among treatments with different herbaceous species. GL had the largest shoot dry weight (34,817 ± 12,106 kg ha−1, p < 0.05), whereas AS had the smallest (425 ± 150 kg ha−1, p > 0.05, Figure 2A). EN had the largest specific root length (1.094 ± 0.240 m g−1, p > 0.05), whereas RH had the smallest (0.004 ± 0.004 m g−1, p > 0.05, Figure 2B). RH had the largest root/shoot ratio (2.93 ± 0.76, p < 0.05), whereas EN had the smallest (0.36 ± 0.06, p > 0.05, Figure 2C). As shown in Figure 2D, BR had the largest root length density (0.94 ± 0.10 cm cm−3, p < 0.05), whereas GL had the smallest (0.03 ± 0.01 cm cm−3, p > 0.05). BR had the largest root surface area density (0.06 ± 0.00 cm2 cm−3, p > 0.05), whereas GL had the smallest (0.01 ± 0.00 cm2 cm−3, p > 0.05, Figure 2E). As shown in Figure 2F, RH had the largest root volume (135.2 ± 68.1 cm3, p < 0.05), whereas ET had the smallest (8.1 ± 0.2 cm3, p > 0.05).
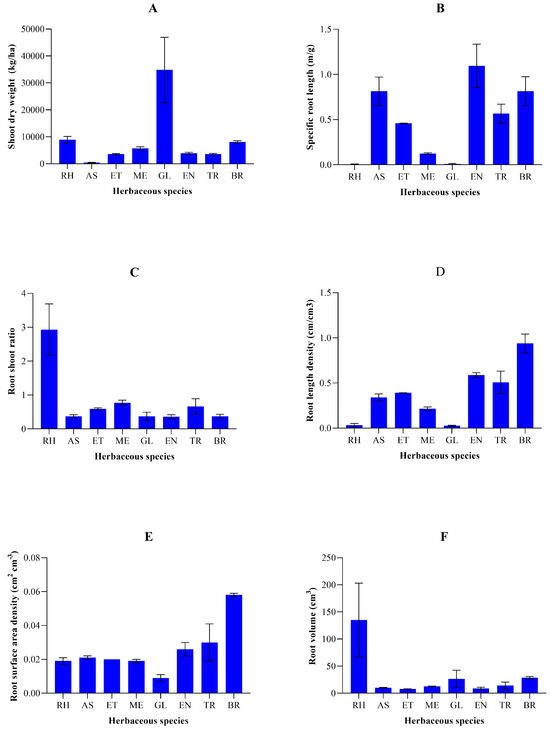
Figure 2.
Shoot and root characteristics ((A) shoot dry weight; (B) specific root length; (C) root shoot ratio; (D) root length density; (E) root surface area density; (F) root volume) of eight herbaceous species used in vegetation restoration of a gully slope. Values are mean ± SE (n = 3).
3.2. Factors Sensitive to Short-Term Artificial Revegetation
According to the correlation matrix shown in Figure 3, the factors SY, ER, TN, TK, AP, CEC, water-stable aggregates (>0.25 mm) (WR0.25), aggregate mean weight diameter (MWD), and aggregate geometric mean diameter (GWD) were significantly correlated with vegetated treatments (p < 0.05). Thus, those factors were sensitive to short-term artificial revegetation. The factors are analyzed in detail in the following paragraphs.
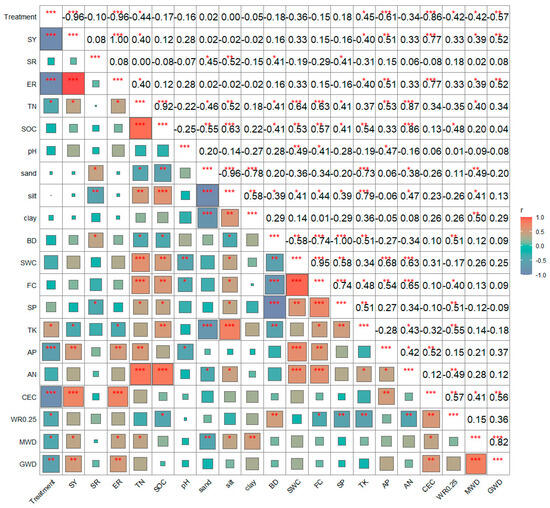
Figure 3.
Correlation matrix for vegetation treatments and related soil characteristics. The color of each square is proportional to the value of Pearson’s correlation coefficient. Red indicates a positive correlation (dark green, r = 1); blue indicates a negative correlation (dark red, r = 1). * p < 0.05; ** p < 0.01; *** p < 0.001. Abbreviations: SY, sediment yield; SR, surface runoff; ER, erosion rate; TN, soil total nitrogen; SOC, soil organic carbon; BD, soil bulk density; SWC, soil water content; FC, field capacity; SP, soil porosity; TK, soil total potassium; AP, soil available phosphorus; AN, soil available N; CEC, cation exchange capacity; WR0.25, water-stable aggregates (>0.25 mm); MWD, aggregate mean weight diameter; GWD, aggregate mean geometric diameter.
3.3. Effects of Artificial Revegetation on Reducing Soil and Water Loss
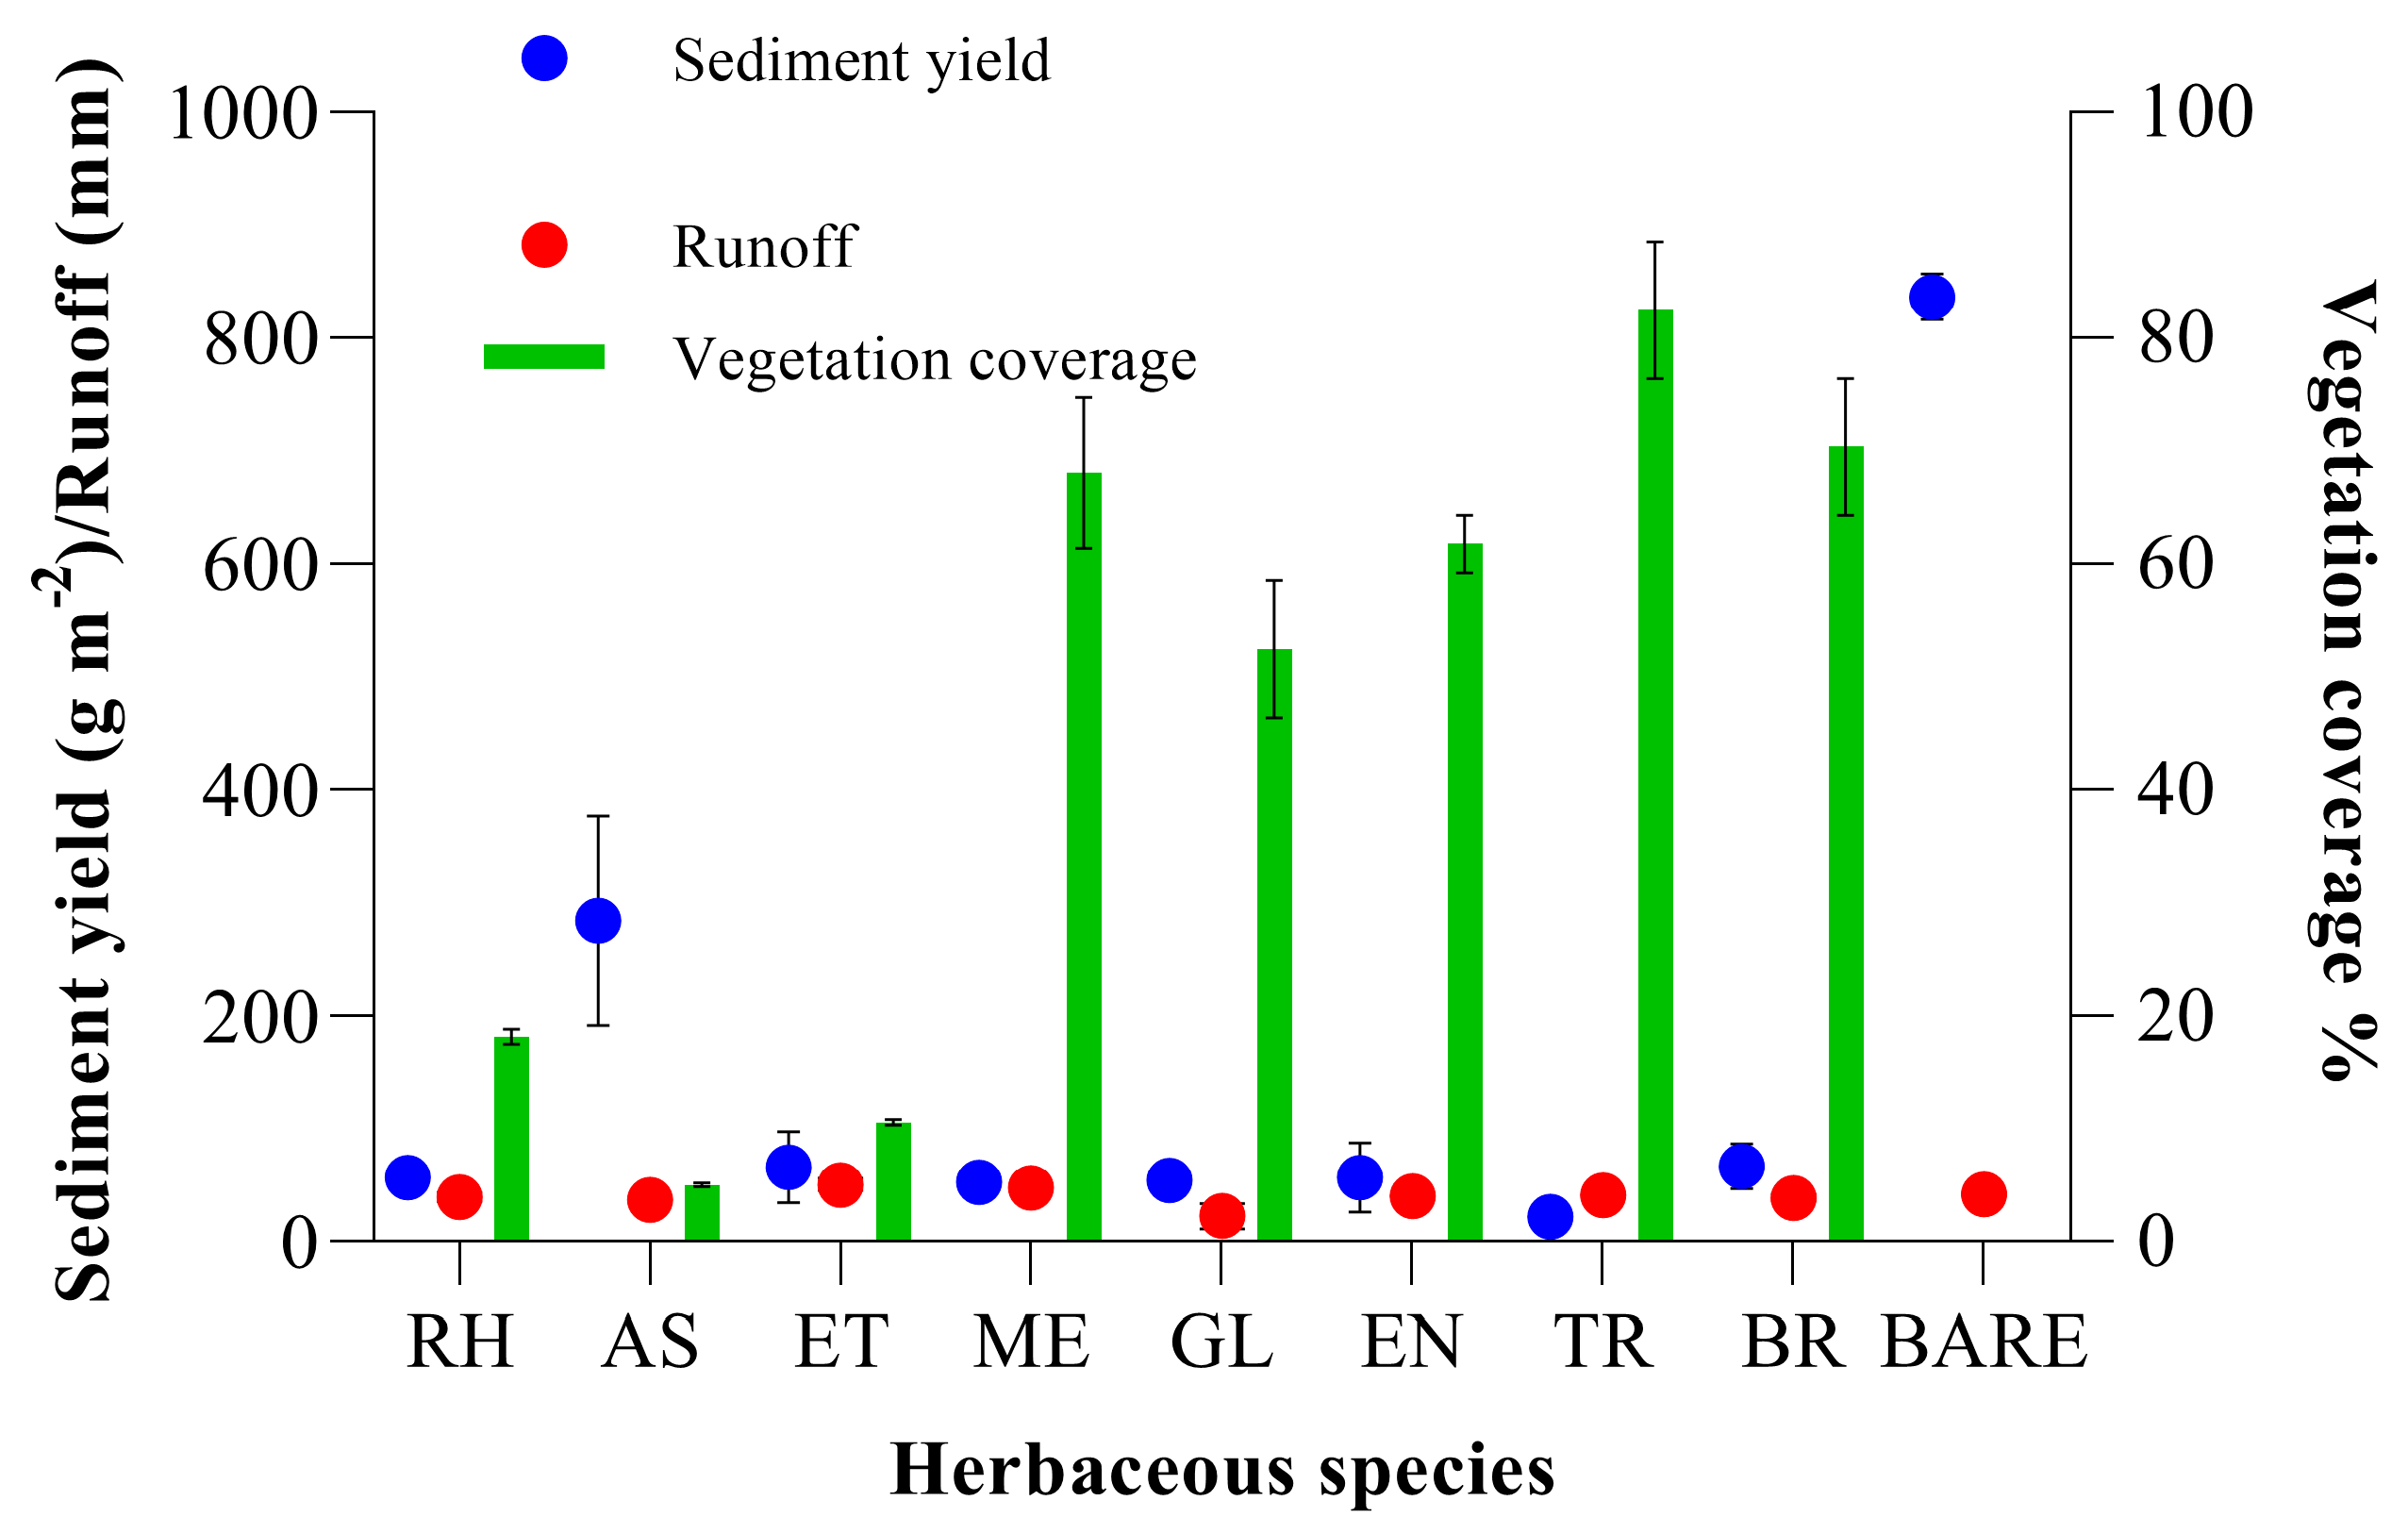
An important function of herbaceous vegetation in controlling gully wall expansion is to reduce surface runoff and sediment loss. Compared with bare soil without vegetation coverage (BARE), vegetated treatments reduced average sediment yield by 91.1% ± 7.2% during runoff scouring (Figure 4). Among the herbaceous species, sediment yield was most reduced with TR (p > 0.05). By contrast, the highest sediment yield was with AS. Vegetation coverage of RH, AS, and ET was lower than that of ME, GL, EN, TR, and BR. Surface runoff was not significantly different between vegetated treatments and BARE (p > 0.05). Among the herbaceous species (Table S3), flow hydraulic parameters varied with species. AS had the largest q and RH had the smallest q. AS had the largest Re and RH had the smallest Re. BR had the largest Fr and GL had the smallest Fr.
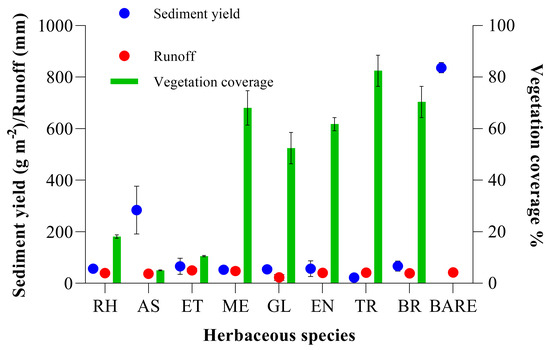
Figure 4.
Sediment yield, surface runoff, and vegetation coverage with different species of herbaceous vegetation. Values are mean ± SE (n = 3).
3.4. Responses of Soil Physicochemical Characteristics to Artificial Revegetation
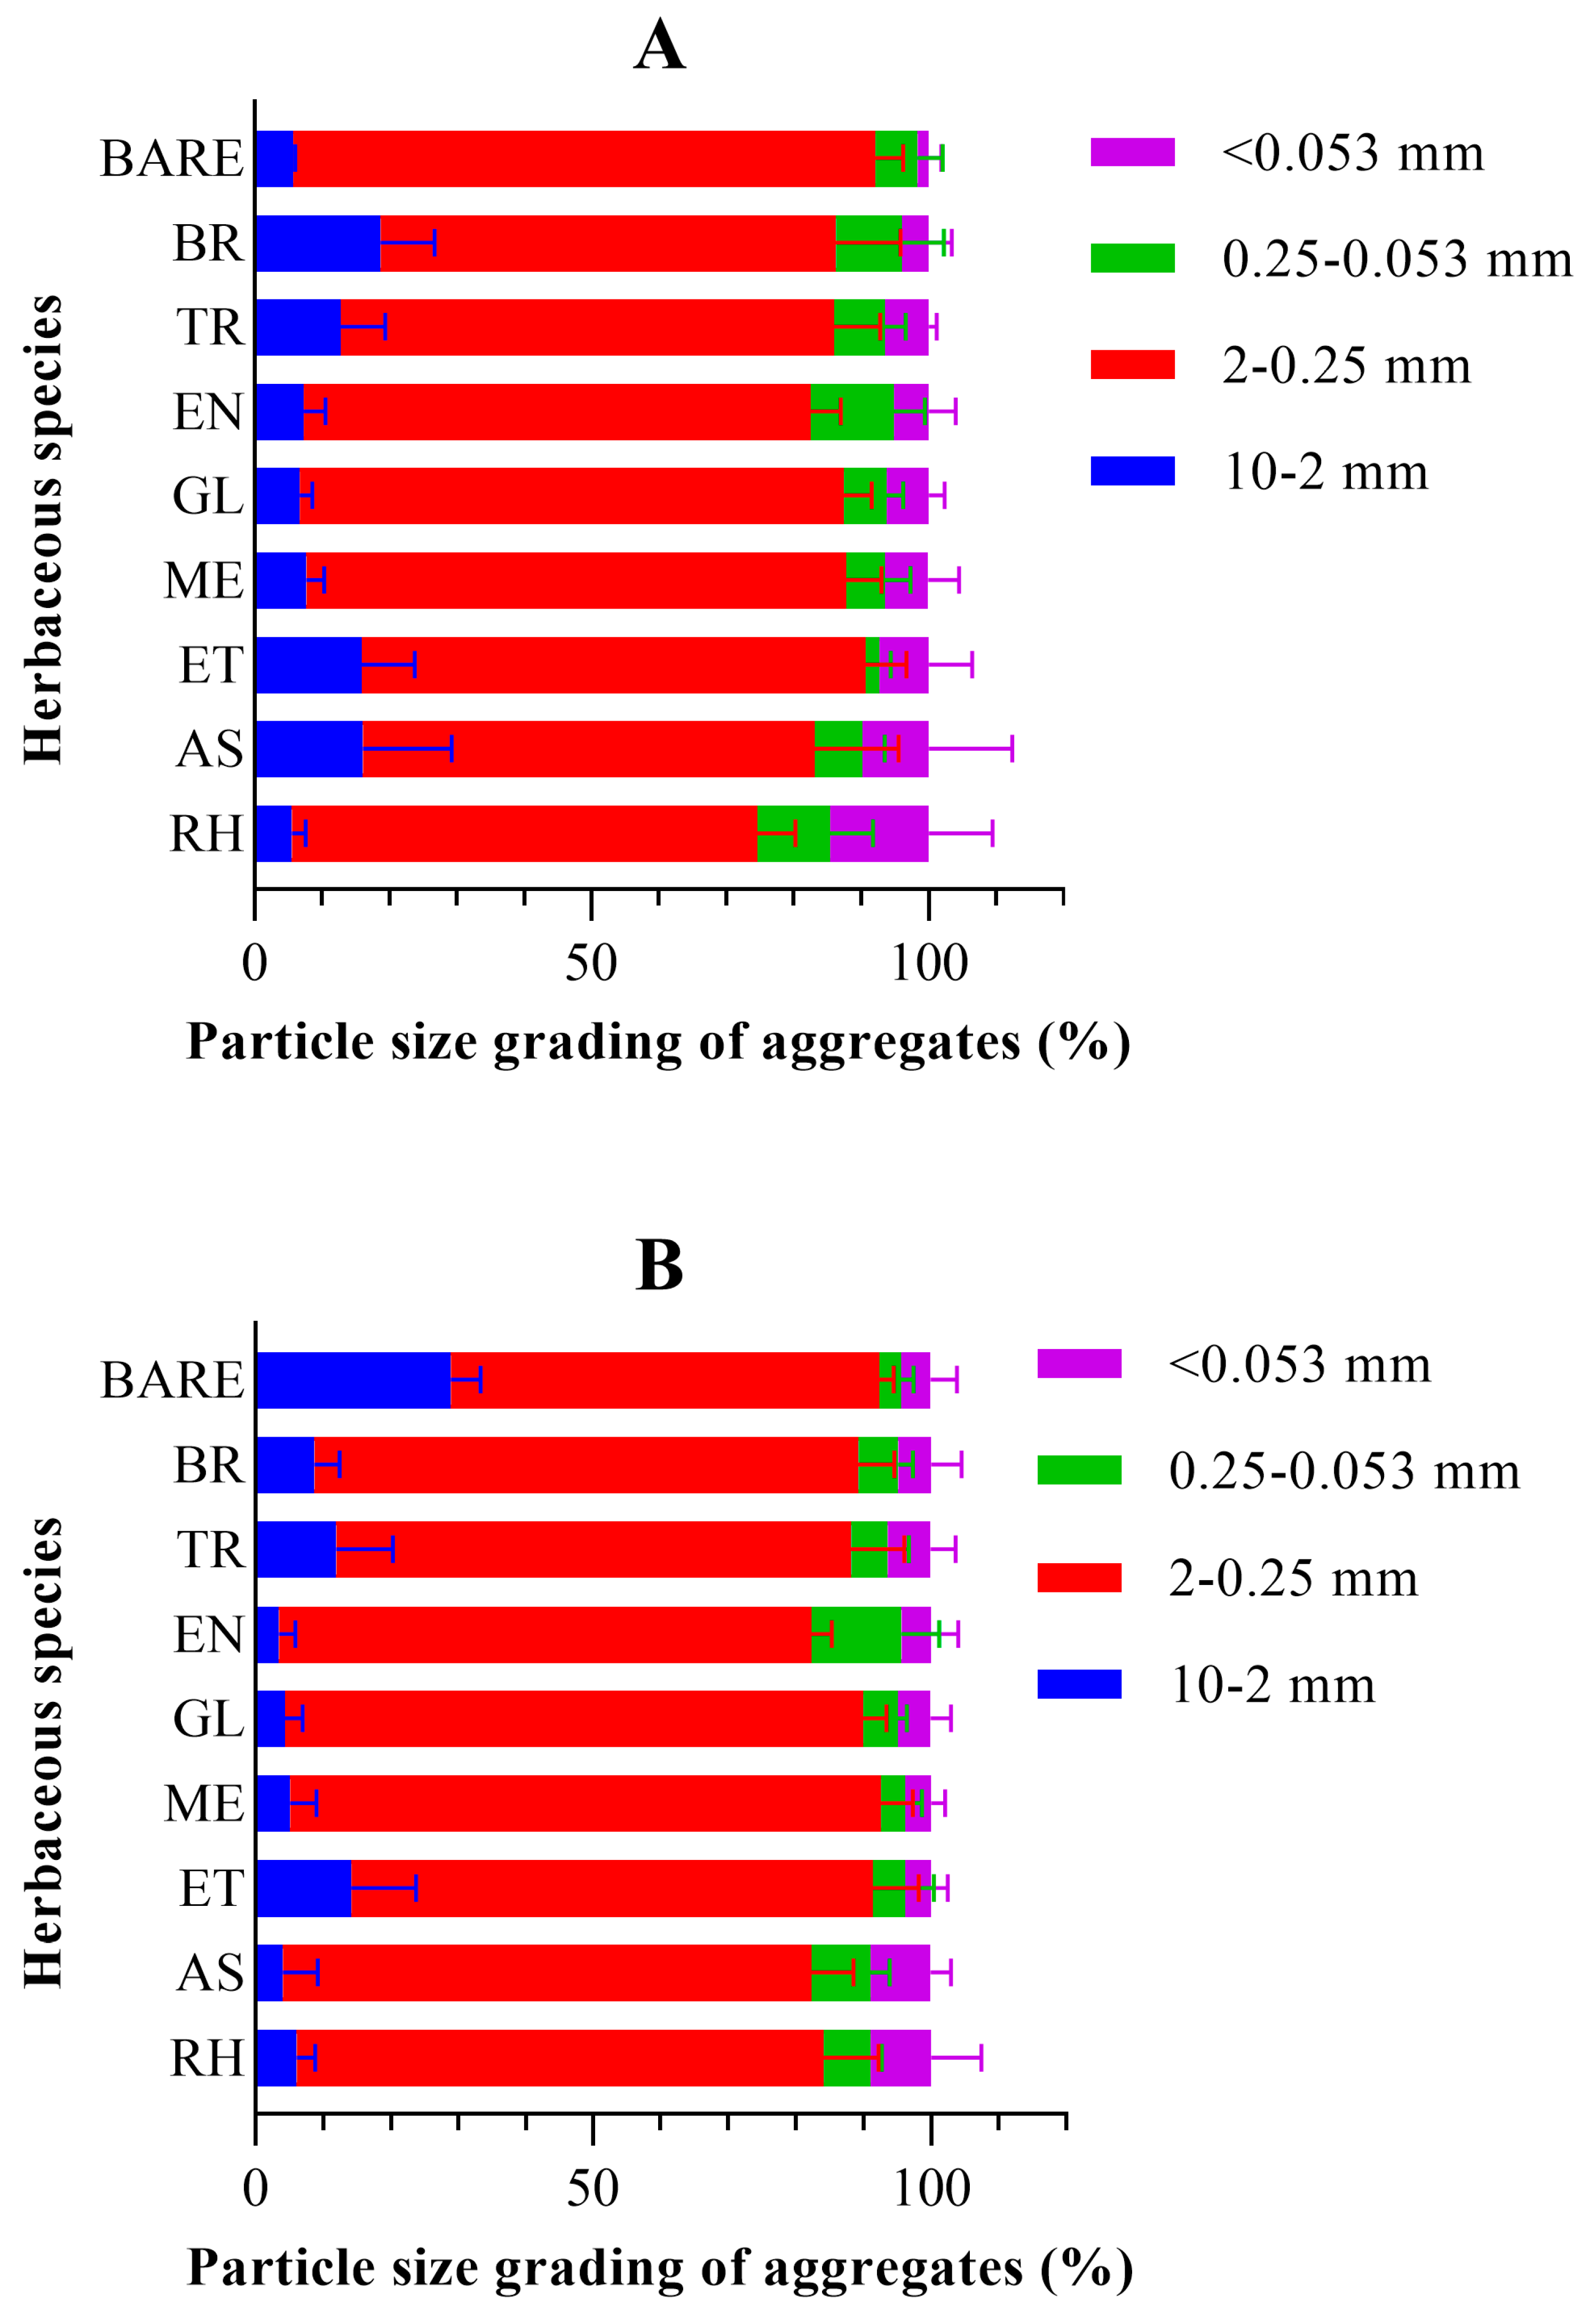
Soil physical characteristics varied with herbaceous species (Figure 5 and Table 1). Soil aggregate fractions varied with species of herbaceous vegetation (Figure 5). Four fractions of soil aggregates were evaluated: macroaggregates (>2.0 mm), small macroaggregates (0.25–2.0 mm), microaggregates (0.053–0.25 mm), and silt plus clay (<0.053 mm). In both 0–5 cm (Figure 5A) and 5–10 cm (Figure 5B) soil layers, the silt plus clay fraction in vegetated plots was larger than that in BARE. To analyze the relations, t-tests were used to compare the differences in soil aggregate fractions between BARE and vegetated treatments. In the 0–5 cm layer, the silt plus clay fraction in BARE (1.63% ± 1.86%) was lower than that in vegetated treatments (7.51% ± 3.34%, p = 0.020). In the 5–10 cm layer, the silt plus clay fraction in BARE (4.43% ± 3.82%) was also lower than that in vegetated treatments (5.76% ± 2.13%, p = 0.471). In the 0–5 cm layer, WR0.25 were a larger fraction in BARE (92.11% ± 4.32%) than in vegetated treatments (84.78% ± 4.88%, p = 0.049). In the 5–10 cm layer, WR0.25 were also a larger fraction in BARE (92.31% ± 2.25%) than in vegetated treatments (84.78% ± 4.88%, p = 0.093). Thus, vegetated treatments increased the silt plus clay fraction and decreased the macroaggregate fraction of soil aggregates. However, the differences between BARE and vegetated treatments in the 5–10 cm layer were not significant (p > 0.05). In the 0–5 cm soil layer, the MWD (20.68 ± 9.21 mm) and GWD (14.44 ± 13.81 mm) of BARE were greater than those in vegetated treatments (MWD: 8.67 ± 3.97 mm; GWD: 1.82 ± 1.85 mm). By contrast, in the 5–10 cm soil layer, the MWD (3.72 ± 1.59 mm) and GWD (1.34 ± 0.33 mm) of BARE were smaller than those in vegetated treatments (MWD: 7.61 ± 1.66 mm; GWD: 2.30 ± 1.62 mm).
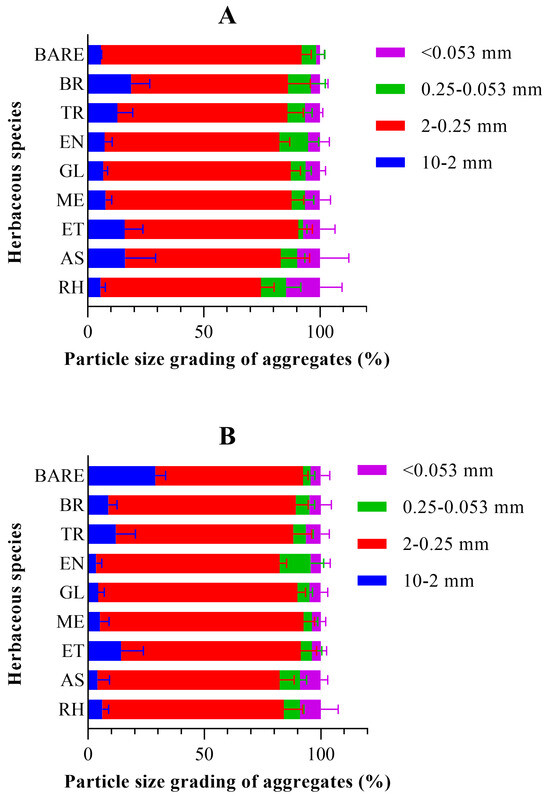
Figure 5.
Soil aggregate fractions with different herbaceous species on an erosion gully slope. (A) 0–5 cm soil depth; (B) 5–10 cm soil depth.

Table 1.
Soil physical characteristics with different herbaceous species.
Soil chemical properties (Table 2) are expressed as the difference between vegetated treatments and BARE at the 0–10 cm depth in Figure S1. The mean value of the CEC under vegetated treatments (19.55 ± 0.67 cmol kg−1) was lower by approximately 15% than that under the BARE condition (22.94 ± 1.43 cmol kg−1, Figure S1d). The mean values of total N (0.92 ± 0.40 g kg−1, Figure S1e) and AP (23.94 ± 5.67 mg kg−1, Figure S1b) were lower under vegetated treatments by approximately 39% than those under the BARE condition (TN: 1.53± 0.35 g kg−1; AP: 36.08 ± 0.84 mg kg−1). By contrast, the mean value of TK (7.07 ± 1.86 g kg−1, Figure S1a) under vegetated treatments increased by more than 59% compared with that under the BARE condition (4.43 ± 0.08 g kg−1). The mean value of the AN/TN ratio under vegetated treatments (0.07 ± 0.05, Figure S1f) was greater by approximately 134% than that under the BARE condition (0.03 ± 0.01). The not-significant related factors (p > 0.05) in Figure 3 are AN (Figure S1c) and SOC (Figure S1g), which were lower under vegetated treatments (42.66 ± 3.28 mg kg−1 and 10.39 ± 5.71 g kg−1) than those under the BARE condition (46.00 ± 1.24 mg kg−1 and 13.46 ± 0.97 g kg−1).
Table 2.
Soil chemical characteristics with different herbaceous species.
3.5. Evaluation of Short-Term Artificial Revegetation
Principal component analysis was conducted to evaluate the short-term effects of artificial revegetation on an erosion gully. The evaluation was based on effects on soil and water conservation, soil quality, and vegetation growth (Table 3). The evaluation of soil and water conservation was based on SY, SR, τ, ω, Re, and Fr (Table S3). The weighting of each parameter was 18.19%, 14.40%, 17.32%, 16.25%, 17.75%, and 16.09%, and the evaluation scores for the eight herbaceous species were ranked AS > RH > ET > ME > GL > BR > EN > TR. In this evaluation, the higher the ranking was, the worse the soil and water conservation effect. The evaluation of soil quality was based on SOC, TN, C/N ratio, sand, silt, clay, pH, BD, FC, SP, TK, AP, AN, CEC, WR0.25, MWD, and GWD. The weighting of each parameter was 5.24%, 5.50%, 4.98%, 5.91%, 6.11%, 4.77%, 4.89%, 6.29%, 5.62%, 6.29%, 5.70%, 5.59%, 5.99%, 4.70%, 5.91%, 5.49%, and 4.82%, and the evaluation scores were ranked TR > BR > EN > RH > ME > GL > AS > ET. The evaluation of vegetation growth was based on VC, SDW, SRL, RSR, RLD, RSD, and RV. The weighting of each parameter was 12.67%, 13.50%, 13.79%, 15.06%, 14.39, 15.23%, and 15.37%, and the evaluation scores were ranked BR > EN > TR > AS > ET > ME > RH > GL.
Table 3.
Comprehensive evaluation scores for effects of artificial revegetation by different herbaceous species in an erosion gully on soil and water conservation, soil quality, and vegetation growth.
The selection of suitable herbaceous species for artificial revegetation is very important in preventing soil degradation in erosion gullies. Based on the objectives, the suitable herbaceous species varied a bit. However, the TR, BR, and EN consistently had the top three rankings by score in all three aspects evaluated. This means that the three herbaceous species (TR, BR, and EN) were suitable for preventing soil degradation in erosion gullies. Based on the characteristics and growing period of the herbaceous vegetation planted (Tables S1 and S2), TR was better than BR and EN. Therefore, TR was the most suitable species for use in artificial revegetation to prevent soil degradation in an erosion gully.
4. Discussion
4.1. The Effects of Artificial Revegetation with Herbaceous Species on Soil Erosion
Reducing soil erosion is critical for controlling gully development [4]. Artificial revegetation can quickly alter soil surface properties and reduce soil losses during surface runoff [23]. In Figure 3, vegetation treatments had a strong relationship with sediment yield (SY) and erosion rate (ER). MWD and GWD were significant factors influencing the SY and ER. Increased aggregate stability will reduce soil erosion by minimizing rainfall-induced aggregate disturbance and increasing soil pores [26,27]. However, the lower MWD and GWD with revegetated treatments (Table 1) did not result in increased sediment output (Figure 3). This meant that vegetation cover played an essential role in lowering sediment yield.
Figure 4 shows how vegetation treatments reduced soil erosion. Soil erosion was directly linked to vegetation features [7]. Previous research has shown that vegetation coverage, and shoot and root traits all have an impact on soil erosion. However, in our investigation, vegetation coverage was not significantly related to sediment output (p > 0.05). In prior research, the role of vegetation coverage was to minimize rainfall kinetic energy and prevent soil particles from dispersing [11]. The influence of herbaceous vegetation cover was not investigated because our study focused on runoff scouring tests. However, the roots of herbaceous vegetation play an important role in soil stabilization [28]. AS produced more sediment than other vegetated treatments due to its poor vegetation coverage (Figure 4).
4.2. Changes in Soil Physicochemical Characteristics
Short-term (16 months) artificial revegetation of an erosion gully slope with herbaceous vegetation did not improve soil quality. It significantly decreased soil nutrient concentrations (except TK), WR0.25, and aggregate water stability compared with bare soil.
Although sediment yield decreased with revegetated treatments, the WR0.25, MWD, and GWD suggested short-term herbaceous species revegetation destroyed soil structure and, instead of conserving nutrients, released them for plant uptake. Abiotic and biotic processes (e.g., SOM and microorganisms) interact to form soil aggregates as a result of aggregation and fragmentation processes [29]. The decreased aggregate stability can be attributed to vegetation root penetration. By affecting the size of aggregates and the connectivity or size by producing [30] or clogging [31] pores, root penetration primarily affects soil structure. Growing roots can cause soil particles and aggregates to become pressed by growing roots during the initial stages of vegetation growth [32,33]. It is unavoidable that the growth of roots leads to a reduction in the porosity of rhizosphere soil when the penetration resistance of soil is greater than the pressure. Also, thickened and lengthened roots can disperse soil particles or aggregates [34] and crack macroaggregates [35]. Although short-term artificial revegetation did not increase aggerate stability in this study (Figure 3), aggerate stability appeared to tend toward future increases, with increased large macroaggregates (Figure 5).
In previous studies, soil nutrients increased after vegetation restoration [36,37,38]. However, in our study, SOC and AN were not sensitive to short-term artificial revegetation. The soil nutrient-preserving capability (represented by the CEC) decreased with the vegetated treatments (Figure 3). With the exception of TK, soil nutrients were generally lower under vegetation treatment than in bare soil. One reason to explain the lack of sensitivity could be that because the herbaceous litter input was relatively small, the C input to the soil was also relatively small during the experiment. Secondly, a shallow root system, weak soil consolidation, and the need for plants to absorb nutrients are also factors to consider. The input of soil nutrients was less than the nutrients consumed by vegetation growth in the short term. The third reason was the breakdown of soil aggregate. Newly imported nutrients can benefit from soil aggregates because they provide physical protection and reduce their accessibility by microbes [39,40,41]. However, with the breakdown of soil aggregate by root penetration, the soil nutrients are mineralized and lost [42]. The decrease in WR0.25 (Figure 5) mainly caused by the breakdown of soil aggregates could contribute to the loss of SOC and soil nutrients. The last reason could be the “priming effect”. The input of vegetation litter with a high C:N ratio can lead to priming effects and accelerate the decomposition of native SOC [43]. Compared with farmland soils, the addition of exogenous organic matter (vegetation litter) to gully slope soil with a relatively low SOC content may lead to greater stimulation of microbial activity and consequently drive increases in the decomposition of native SOC [44]. Although the TN under vegetated treatments (0.09% ± 0.04%) was lower than that under bare soil (0.15% ± 0.04%), the AN was not significantly different between bare soil and vegetated treatments. The results indicated that short-term artificial revegetation increases the AN/TN ratio. Available N consists of “temporary and slow-acting reservoirs” of SON, which are the main sources of easily mineralized N in soil [45]. As herbaceous vegetation has a relatively short life cycle and turnover, the soil microorganisms use readily decomposable litter from herbaceous vegetation to increase their AN/TN ratios. The increased AN/TN ratio can lead to a relatively rapid rate of soil N cycling [46]. The increase in TK indicated that soil K in an erosion gully could be restored under artificial revegetation in a short time, consistent with the results of Liu and Wang [47]. One reason for the rapid recovery could be that K is not a limiting element in the black soil area. Another reason for the increase could be the high contents of K returned in plant litter leading to soil K enrichment.
4.3. The Evaluation of Herbaceous Species
The goal of our study was to find suitable herbaceous species to prevent soil degradation in a black soil erosion gully based on three aspects. To our surprise, the top-ranked three species (BR, EN, and TR, in Section 3.5) were the same in all aspects evaluated. Vegetation coverage is a critical factor affecting soil and water loss [11]. Yan et al. [23] found that increasing vegetation coverage will reduce soil and water loss in the same place. In that regard, the TR was best in controlling gully development. Improving soil quality is another role of artificial revegetation [48]. TR revegetation increased the SOC contents, reduced soil nutrient loss, and functioned best among the herbaceous species, followed by BR and EN. The vegetation growth status is also very important in controlling gully development [23]. Root characteristics are important vegetation growth indexes that decide the role of herbaceous species in changing soil characteristics (Figure S2). A root density increase leads to the formation of stable macroaggregates because roots and associated fungi form a mesh that entangles fine soil particles. In addition, roots produce exudates that can serve as adhesives and may stimulate the activity of microbes, both of which contribute to soil aggregate stability [49,50]. Based on the above reasons, the BR was best in preventing soil degradation among the herbaceous species, followed by TR and EN. Although BR, EN, and TR were the top-ranked three species in all aspects evaluated, the TR was the best of them based on the germination rate, clarity, and resume growth ratio.
Artificial revegetation is typically accomplished with trees and shrubs in degraded areas [51]. However, comparing the results with herbaceous species with those with trees and shrubs, herbaceous species played a more important role in reducing soil and water loss, soil nutrient loss, and soil carbon loss [13,52]. Especially in some serious eroding environments like erosion gully slopes, trees and shrubs have been difficult to grow, with few nutrients and poor soil structure [53]. Herbaceous species were demonstrated to be a viable alternative in our study.
5. Conclusions
The effects of short-term artificial revegetation with herbaceous species in preventing soil degradation in an erosion gully of a black soil area were evaluated. A field runoff scouring experiment verified that artificial revegetation conserved soil and water, conserving soil by decreasing sediment yields. There were significant differences in soil TN, TK, and AP between vegetated treatments and bare soil. With a decrease in CEC, soil TK and AN/TN increased under short-term vegetated treatments. Although WR0.25 decreased under vegetated treatments, the silt plus clay fraction (<0.053 mm) was greater than that with bare soil. On the basis of a comprehensive evaluation of the effects on soil and water conservation, soil quality, and vegetation growth, TR is recommended as the most suitable herbaceous species to prevent soil degradation on an erosion gully slope. Although short-term revegetation did not improve soil quality in gullies, continuous vegetation growth will strengthen the potential to regulate gully formation and soil degradation. Leguminosae herbaceous species such as TR, which have a high vegetation coverage, are excellent alternatives for gully restoration. Artificial revegetation with herbaceous species has been shown to be an effective method for reducing soil erosion in gullies. Given the cost and time involved with herbaceous species, we believe that artificial revegetation with herbaceous species or a combination of trees, shrubs, and herbaceous species is a sustainable strategy to minimize soil degradation in a black soil erosion gully in Northeast China.
Supplementary Materials
The following supporting information can be downloaded at: https://www.mdpi.com/article/10.3390/land13091486/s1, Figure S1: Soil nutrient properties expressed as the difference between vegetated treatments and bare soil at the 0–10-cm depth under different herbaceous species. (a) Total potassium (TK), (b) available phosphorus (AP), (c) available nitrogen (AN), (d) cation exchange capacity (CEC), (e) total N (TN), (f) AN/TN ratio, and (g) soil organic carbon (SOC). Values are Mean ± SE (n = 3). RH: Rheum palmatum L., AS: Asparagus officinalis L., ET: Elymus dahuricus Turcz. ME: Medicago sativa L., GL: Glycyrrhiza pallidiflora Maxim., EN: Elytrigia repens (L.) Desv.ex Nevski, TR: Trifolium repens L., BR: Bromus inermis Leyss.; Figure S2: Correlation matrix for vegetation treatments and related soil and vegetation characteristics. The color of each square is proportional to the value of Pearson’s correlation coefficient. red indicates a positive correlation (dark green, r = 1); blue indicates a negative correlation (dark red, r = 1). * p < 0.05; ** p < 0.01; *** p < 0.001. Abbreviations: VC, vegetation covergae; SDW, shoot dry weight; SRL, specific root length; R/S, root shoot ratio; RLD, root length density; RSAD, root surface area density; RV, root volume; TN, soil total nitrogen; SOC, soil organic carbon; BD, soil bulk density; SWC, soil water content; FC, field capacity; SP, soil porosity; TK, soil total potassium; AP, soil avaliable phosphorus; AN, soil avaliable N; CEC, cation exchange capacity; WR0.25, water stable aggregates (>0.25 mm); MWD, aggregate mean weight diameter; GWD, aggregate mean geometric diameter volume; Table S1: Species and characteristics of herbaceous vegetation planted on an erosion gully slope with 12° gradient; Table S2: Dates of growth stages of herbaceous species used in vegetation restoration of a gully slope (2018–2019); Table S3: Soil erosion and flow hydraulic parameters under different herbaceous species.
Author Contributions
Methodology, J.L. (Jielin Liu) and X.Z.; Validation, X.K.; Investigation, X.W.; Resources, X.Z.; Data curation, Y.Z., J.L. (Jianye Li) and X.W.; Writing—original draft, J.L. (Jianye Li); Writing—review & editing, Y.Z. and J.L. (Jianye Li); Visualization, Q.Z.; Supervision, D.P.; Project administration, D.P.; Funding acquisition, J.L. (Jielin Liu) and X.Z. All authors have read and agreed to the published version of the manuscript.
Funding
This research was funded by the National Key Research & Development Program of China (2021YFD1500800) and the Provincial Key Research and Development Program of Heilongjiang (GA23B004), with further joint support by the Program of Scientific and Technological Innovation Project in the Heilongjiang Academy of Agricultural Science (CX23GG08), the Scientific Research Operation Expenses for Provincial Scientific Research Institutes in Heilongjiang Province (CZKYF2024-1-A004), and the Young Scientist Group Project of Northeast Institute of Geography and Agroecology, Chinese Academy of Sciences (2023QNXZ03).
Data Availability Statement
The original contributions presented in the study are included in the article, further inquiries can be directed to the corresponding author.
Conflicts of Interest
The authors declare that they have no known competing financial interests or personal relationships that may have affected the research presented in this article.
References
- Wen, H.; Ni, S.; Wang, J.; Cai, C. Changes of soil quality induced by different vegetation restoration in the collapsing gully erosion areas of southern China. Int. Soil Water Conserv. Res. 2021, 9, 195–206. [Google Scholar] [CrossRef]
- Chen, Y.; Jiao, J.; Yan, X.; Li, J.; Vanmaercke, M.; Wang, N. Response of gully morphology and density to the spatial and rainy-season monthly variation of rainfall at the regional scale of the Chinese Loess Plateau. Catena 2024, 236, 107773. [Google Scholar] [CrossRef]
- Liu, X.; Li, H.; Zhang, S.; Cruse, R.M.; Zhang, X. Gully Erosion Control Practices in Northeast China: A Review. Sustainability 2019, 11, 5065. [Google Scholar] [CrossRef]
- Valentin, C.; Poesen, J.; Li, Y. Gully erosion: Impacts, factors and control. Catena 2005, 63, 132–153. [Google Scholar] [CrossRef]
- Rickson, R.J. Water induced soil erosion. In Encyclopedia of Soils in the Environment, 2nd ed.; Goss, M.J., Oliver, M., Eds.; Academic Press: Oxford, UK, 2023; pp. 193–207. [Google Scholar]
- Wei, B.; Li, Z.; Duan, L.; Gu, Z.; Liu, X. Vegetation types and rainfall regimes impact on surface runoff and soil erosion over 10 years in karst hillslopes. Catena 2023, 232, 107443. [Google Scholar] [CrossRef]
- Chen, H.; Zhang, X.; Abla, M.; Lü, D.; Yan, R.; Ren, Q.; Ren, Z.; Yang, Y.; Zhao, W.; Lin, P.; et al. Effects of vegetation and rainfall types on surface runoff and soil erosion on steep slopes on the Loess Plateau, China. Catena 2018, 170, 141–149. [Google Scholar] [CrossRef]
- Kou, M.; Jiao, J. Structure of Erosion-Resistant Plant Community in the Hill-Gully Region of the Loess Plateau. Res. Soil Water Conserv. 2018, 25, 7. [Google Scholar]
- Vásquez-Méndez, R.; Ventura-Ramos, E.; Oleschko, K.; Hernández-Sandoval, L.; Parrot, J.-F.; Nearing, M.A. Soil erosion and runoff in different vegetation patches from semiarid Central Mexico. Catena 2010, 80, 162–169. [Google Scholar] [CrossRef]
- Michaelides, K.; Lister, D.; Wainwright, J.; Parsons, A.J. Vegetation controls on small-scale runoff and erosion dynamics in a degrading dryland environment. Hydrol. Process. 2009, 23, 1617–1630. [Google Scholar] [CrossRef]
- Zuazo, V.H.D.; Pleguezuelo, C.R.R. Soil-erosion and runoff prevention by plant covers: A review. Agron. Sustain. Dev. 2008, 28, 65–86. [Google Scholar] [CrossRef]
- Yu, Y.; Wei, W.; Chen, L.; Feng, T.; Daryanto, S. Quantifying the effects of precipitation, vegetation, and land preparation techniques on runoff and soil erosion in a Loess watershed of China. Sci. Total. Environ. 2019, 652, 755–764. [Google Scholar] [CrossRef] [PubMed]
- Li, J.; Fu, B.; Liu, S.; Dargush, P.; Gao, G.; Liu, J.; Wei, F. Vegetation restoration changes topsoil biophysical regulations of carbon fluxes in an eroding soil landscape. Land Degrad. Dev. 2018, 29, 4061–4070. [Google Scholar] [CrossRef]
- Mohammad, A.G.; Adam, M.A. The impact of vegetative cover type on runoff and soil erosion under different land uses. Catena 2010, 81, 97–103. [Google Scholar] [CrossRef]
- Bochet, E.; Poesen, J.; Rubio, J.L. Runoff and soil loss under individual plants of a semi-arid Mediterranean shrubland: Influence of plant morphology and rainfall intensity. Earth Surf. Process. Landforms 2006, 31, 536–549. [Google Scholar] [CrossRef]
- Gyssels, G.; Poesen, J.; Bochet, E.; Li, Y. Impact of plant roots on the resistance of soils to erosion by water: A review. Prog. Phys. Geogr. 2005, 29, 189–217. [Google Scholar] [CrossRef]
- Li, Y.; Zhu, X.M.; Tian, J.Y. Effectiveness of plant roots to increase the anti-scouribility of soil on the Loess Plateau. Chin. Sci. Bull. 1991, 36, 2077–2082. [Google Scholar]
- Lin, J.; Huang, Y.; Wang, M.-K.; Jiang, F.; Zhang, X.; Ge, H. Assessing the sources of sediment transported in gully systems using a fingerprinting approach: An example from South-east China. Catena 2015, 129, 9–17. [Google Scholar] [CrossRef]
- Guo, S.; Han, X.; Li, H.; Wang, T.; Tong, X.; Ren, G.; Feng, Y.; Yang, G. Evaluation of soil quality along two revegetation chronosequences on the Loess Hilly Region of China. Sci. Total. Environ. 2018, 633, 808–815. [Google Scholar] [CrossRef]
- Wu, C.; Deng, L.; Huang, C.; Chen, Y.; Peng, C. Effects of vegetation restoration on soil nutrients, plant diversity, and its spatiotemporal heterogeneity in a desert–oasis ecotone. Land Degrad. Dev. 2020, 32, 670–683. [Google Scholar] [CrossRef]
- Raiesi, F.; Kabiri, V. Identification of soil quality indicators for assessing the effect of different tillage practices through a soil quality index in a semi-arid environment. Ecol. Indic. 2016, 71, 198–207. [Google Scholar] [CrossRef]
- Wang, S.; Zhang, Z.; McVicar, T.R.; Zhang, J.; Zhu, J.; Guo, J. An event-based approach to understanding the hydrological impacts of different land uses in semi-arid catchments. J. Hydrol. 2012, 416–417, 50–59. [Google Scholar] [CrossRef]
- Yan, Y.; Zhang, X.; Liu, J.; Li, J.; Ding, C.; Qi, Z.; Shen, Q.; Guo, M. The effectiveness of selected vegetation communities in regulating runoff and soil loss from regraded gully banks in the Mollisol region of Northeast China. Land Degrad. Dev. 2021, 32, 2116–2129. [Google Scholar] [CrossRef]
- Marcos, M.S.; Bertiller, M.B.; Cisneros, H.S.; Olivera, N.L. Nitrification and ammonia-oxidizing bacteria shift in response to soil moisture and plant litter quality in arid soils from the Patagonian Monte. Pedobiologia 2016, 59, 1–10. [Google Scholar] [CrossRef]
- Holliday, V.T. Methods of Soil Analysis, Part 1, Physical and Mineralogical Methods. In American Society of Agronomy, Agronomy Monographs; Klute, A., Ed.; Wiley Online Library: Madison, WI, USA, 1986; 1188p. [Google Scholar]
- Shi, P.; Arter, C.; Liu, X.; Keller, M.; Schulin, R. Soil aggregate stability and size-selective sediment transport with surface runoff as affected by organic residue amendment. Sci. Total. Environ. 2017, 607–608, 95–102. [Google Scholar] [CrossRef]
- Obalum, S.; Uteau-Puschmann, D.; Peth, S. Reduced tillage and compost effects on soil aggregate stability of a silt-loam Luvisol using different aggregate stability tests. Soil Tillage Res. 2019, 189, 217–228. [Google Scholar] [CrossRef]
- Liu, B.; Xie, G.; Zhang, X.; Zhao, Y.; Yin, X.; Cheng, C. Vegetation root system, soil erosion and ecohydrology system: A review. In Proceedings of the 2015 International Forum on Energy, Environment Science and Materials, Shenzhen, China, 25–26 September 2015; Choi, S.B., Ed.; Atlantis Press: Paris, France, 2015; pp. 271–279. [Google Scholar]
- Bronick, C.J.; Lal, R. Soil structure and management: A review. Geoderma 2005, 124, 3–22. [Google Scholar] [CrossRef]
- Lucas, M.; Schlüter, S.; Vogel, H.-J.; Vetterlein, D. Roots compact the surrounding soil depending on the structures they encounter. Sci. Rep. 2019, 9, 16236. [Google Scholar] [CrossRef]
- Sullivan, P.; Billings, S.; Hirmas, D.; Li, L.; Zhang, X.; Ziegler, S.; Murenbeeld, K.; Ajami, H.; Guthrie, A.; Singha, K.; et al. Embracing the dynamic nature of soil structure: A paradigm illuminating the role of life in critical zones of the Anthropocene. Earth-Sci. Rev. 2022, 225, 103873. [Google Scholar] [CrossRef]
- Colombi, T.; Torres, L.C.; Walter, A.; Keller, T. Feedbacks between soil penetration resistance, root architecture and water uptake limit water accessibility and crop growth—A vicious circle. Sci. Total Environ. 2018, 626, 1026–1035. [Google Scholar] [CrossRef]
- Chen, W.; Chen, Y.; Siddique, K.H.; Li, S. Root penetration ability and plant growth in agroecosystems. Plant Physiol. Biochem. 2022, 183, 160–168. [Google Scholar] [CrossRef]
- Hallett, P.D.; Marin, M.; Bending, G.D.; George, T.S.; Collins, C.D.; Otten, W. Building soil sustainability from root–soil interface traits. Trends Plant Sci. 2022, 27, 688–698. [Google Scholar] [CrossRef] [PubMed]
- Lu, J.; Zhang, Q.; Werner, A.D.; Li, Y.; Jiang, S.; Tan, Z. Root-induced changes of soil hydraulic properties—A review. J. Hydrol. 2020, 589, 125203. [Google Scholar] [CrossRef]
- Liu, J.; Wang, J.; Morreale, S.J.; Schneider, R.L.; Li, Z.; Wu, G.-L. Contributions of plant litter to soil microbial activity improvement and soil nutrient enhancement along with herb and shrub colonization expansions in an arid sandy land. Catena 2023, 227, 107098. [Google Scholar] [CrossRef]
- Liu, R.; Wang, D. C:N:P stoichiometric characteristics and seasonal dynamics of leaf-root-litter-soil in plantations on the loess plateau. Ecol. Indic. 2021, 127, 107772. [Google Scholar] [CrossRef]
- Zhang, Y.; Xu, X.; Li, Z.; Liu, M.; Xu, C.; Zhang, R.; Luo, W. Effects of vegetation restoration on soil quality in degraded karst landscapes of southwest China. Sci. Total. Environ. 2019, 650, 2657–2665. [Google Scholar] [CrossRef]
- Deng, L.; Kim, D.; Peng, C.; Shangguan, Z. Controls of soil and aggregate-associated organic carbon variations following natural vegetation restoration on the Loess Plateau in China. Land Degrad. Dev. 2018, 29, 3974–3984. [Google Scholar] [CrossRef]
- Six, J.; Bossuyt, H.; Degryze, S.; Denef, K. A history of research on the link between (micro)aggregates, soil biota, and soil organic matter dynamics. Soil Tillage Res. 2004, 79, 7–31. [Google Scholar] [CrossRef]
- Six, J.; Guggenberger, G.; Paustian, K.; Haumaier, L.; Elliott, E.T.; Zech, W. Sources and composition of soil organic matter fractions between and within soil aggregates. Eur. J. Soil Sci. 2001, 52, 607–618. [Google Scholar] [CrossRef]
- Zheng, J.; Zhao, J.; Shi, Z.; Wang, L. Soil aggregates are key factors that regulate erosion-related carbon loss in citrus orchards of southern China: Bare land vs. grass-covered land. Agric. Ecosyst. Environ. 2021, 309, 107254. [Google Scholar] [CrossRef]
- Cheng, H.; Zhou, X.; Dong, R.; Wang, X.; Liu, G.; Li, Q. Priming of soil organic carbon mineralization and its temperature sensitivity in response to vegetation restoration in a karst area of Southwest China. Sci. Total. Environ. 2022, 851 Pt 2, 158400. [Google Scholar] [CrossRef]
- Blagodatskaya, E.; Kuzyakov, Y. Mechanisms of real and apparent priming effects and their dependence on soil microbial biomass and community structure: Critical review. Biol. Fertil. Soils 2008, 45, 115–131. [Google Scholar] [CrossRef]
- Lü, H.; He, H.; Zhao, J.; Zhang, W.; Xie, H.; Hu, G.; Liu, X.; Wu, Y.; Zhang, X. Dynamics of fertilizer-derived organic nitrogen fractions in an arable soil during a growing season. Plant Soil 2013, 373, 595–607. [Google Scholar] [CrossRef]
- Wang, C.; Yang, Q.; Zhang, C.; Zhou, B.; Li, X.; Zhang, X.; Chen, J.; Liu, K. Soil Organic Nitrogen Components and N−Cycling Enzyme Activities Following Vegetation Restoration of Cropland in Danxia Degraded Region. Forests 2022, 13, 1917. [Google Scholar] [CrossRef]
- Liu, R.; Wang, D. Soil C, N, P and K stoichiometry affected by vegetation restoration patterns in the alpine region of the Loess Plateau, Northwest China. PLoS ONE 2020, 15, e0241859. [Google Scholar] [CrossRef] [PubMed]
- Dong, L.; Li, J.; Zhang, Y.; Bing, M.; Liu, Y.; Wu, J.; Hai, X.; Li, A.; Wang, K.; Wu, P.; et al. Effects of vegetation restoration types on soil nutrients and soil erodibility regulated by slope positions on the Loess Plateau. J. Environ. Manag. 2022, 302 Pt A, 113985. [Google Scholar] [CrossRef]
- Bast, A.; Wilcke, W.; Graf, F.; Lüscher, P.; Gärtner, H. The use of mycorrhiza for eco-engineering measures in steep alpine environments: Effects on soil aggregate formation and fine-root development. Earth Surf. Process. Landf. 2014, 39, 1753–1763. [Google Scholar] [CrossRef]
- Rillig, M.C.; Aguilar-Trigueros, C.A.; Bergmann, J.; Verbruggen, E.; Veresoglou, S.D.; Lehmann, A. Plant root and mycorrhizal fungal traits for understanding soil aggregation. New Phytol. 2015, 205, 1385–1388. [Google Scholar] [CrossRef]
- Lázaro-González, A.; Andivia, E.; Hampe, A.; Hasegawa, S.; Marzano, R.; Santos, A.M.; Castro, J.; Leverkus, A.B. Revegetation through seeding or planting: A worldwide systematic map. J. Environ. Manag. 2023, 337, 117713. [Google Scholar] [CrossRef]
- Feng, Q.; Zhao, W.; Wang, J.; Zhang, X.; Zhao, M.; Zhong, L.; Liu, Y.; Fang, X. Effects of Different Land-Use Types on Soil Erosion Under Natural Rainfall in the Loess Plateau, China. Pedosphere 2016, 26, 243–256. [Google Scholar] [CrossRef]
- Xiao, T.; Li, P.; Fei, W.; Wang, J. Effects of vegetation roots on the structure and hydraulic properties of soils: A perspective review. Sci. Total. Environ. 2023, 906, 167524. [Google Scholar] [CrossRef]


Disclaimer/Publisher’s Note: The statements, opinions and data contained in all publications are solely those of the individual author(s) and contributor(s) and not of MDPI and/or the editor(s). MDPI and/or the editor(s) disclaim responsibility for any injury to people or property resulting from any ideas, methods, instructions or products referred to in the content. |
© 2024 by the authors. Licensee MDPI, Basel, Switzerland. This article is an open access article distributed under the terms and conditions of the Creative Commons Attribution (CC BY) license (https://creativecommons.org/licenses/by/4.0/).