Article

Understanding How People Perceive and Interact with Public Space through Social Media Big Data: A Case Study of Xiamen, China

by
Shuran Li
1,*,
Chengwei Wang
2,
Liying Rong
2,
Shiqi Zhou
1 and
Zhiqiang Wu
3,*
1
College of Design and Innovation, Tongji University, No. 281 Fuxin Road, Yangpu District, Shanghai 200093, China
2
Future City (Shanghai) Design Consulting Co., Ltd., No. 568 Dalian Road, Yangpu District, Shanghai 200082, China
3
College of Architecture and Urban Planning, Tongji University, Shanghai 200093, China
*
Authors to whom correspondence should be addressed.
Land 2024, 13(9), 1500; https://doi.org/10.3390/land13091500
Submission received: 14 August 2024 / Revised: 6 September 2024 / Accepted: 9 September 2024 / Published: 15 September 2024

Abstract

:
Public space is a crucial forum for public interaction and diverse activities among urban residents. Understanding how people interact with and perceive these spaces is essential for public placemaking. With billions of users engaging in social media expression and generating millions of data points every second, Social Media Big Data (SMBD) offers an invaluable lens for evaluating public spaces over time, surpassing traditional methods like surveys and questionnaires. This research introduces a comprehensive analytical framework that integrates SMBD with placemaking practices, specifically applied to the city of Xiamen, China. The result shows the social sentiment, vibrancy heatmaps, leisure activities, visitor behaviors, and preferred visual elements of Xiamen, offering urban designers valuable insights into the dynamic nature of citizen experiences. The findings underscore the potential of SMBD to inform and enhance public space design, providing a holistic approach to creating more inclusive, vibrant, and functional urban environments.

1. Introduction

What makes a city good to live in? Besides its cleanliness, open business environment, and modern infrastructure, a city that is good to live in also emphasizes social interaction and human connection. Public spaces play a crucial role as primary arenas for public engagement and many activities among city dwellers. High-quality public spaces constitute a vital factor in enhancing urban residents’ social activities, physical activities, mental health, and overall well-being. These spaces optimize urban functionality, foster a positive urban image, promote health and social inclusivity, and mitigate adverse effects such as crime, social anxiety, and congestion. Placemaking, which refers to the process of creating quality places that people want to live, work, play, and learn in, is an important means for public space design [1]. It is a growing global movement that aims to improve not only the physical elements of a space, but also the way people think and feel about the world around them [2]. To have people engage with the space and benefit from their services, it is crucial to investigate people’s uses, experiences, satisfactions, perceptions, and interactions through the placemaking process. Urban designers and researchers have developed many methods to gain insights into how people utilize and perceive the spaces, from field studies and interviews to post-occupation evaluations [3,4,5,6]. However, these methods are often restricted in time and scope [7] and unable to capture the dynamic nature of urban life. In the information age, as global cities grow increasingly complex, conventional methods face inherent limitations. Therefore, the reliance on static approaches for decision-making purposes, which involve only a limited number of citizens and stakeholders, has become increasingly inadequate.
In 2023, an estimated 4.9 billion people use social media worldwide [8]. The massive number of users provides vivid data sources to observe how citizens interact with the city. Compared to traditional research methods, social media allows researchers to quickly access a vast amount of user information. The high-dimension and fine-grained nature can open up new venues to learn about the usage of public spaces. Extracting spatial, temporal, and demographic content from social media data could support research on how people value and interact with public spaces. Various urban planning researchers have started to embrace social media big data (SMBD) and artificial intelligence in public space design. The SMBD helps them understand the multiple aspects of users’ activities and interests [9], urban functions [10,11], and social interactions [12,13].
However, utilizing SMBD to understand public space perception and interaction is complex. First, the SMBD are often “loose”, “noisy”, and “scattered” due to the user-generated and self-motivated content [14]. This differs from typical surveys, which often have focused sample groups and ask targeted questions. Therefore, SMBD does not necessarily equate to high-quality data that can directly contribute to the design process. Furthermore, while using social media to aid learning perception and interaction in public spaces holds tremendous potential, there is currently a lack of examples demonstrating how to effectively integrate the various dimensions of SMBD with accessing attributes of placemaking. Much of the existing methodology only focuses on a single area of public spaces. For instance, SMBD can facilitate sentiment analysis to help designers understand people’s sentiments or opinions toward entities such as topics, places, and events [15]. Social media and street-level imagery can help designers understand urban functions [16]. Social media has the potential to empower designers’ understanding of urban vibrancy, leisure activities, exercise, and various other aspects [17,18,19]. However, there is limited research that provides an all-around framework for demonstrating a concrete picture of accessing attributes, social media data, and analysis methods. Designers often need to combine various datasets and analysis techniques independently, making it challenging to understand the space holistically. As the potential of social media data for placemaking grows, there is a need to develop integrated frameworks to support designers in their placemaking process.
This study aims to achieve the following objectives: (1) To analyze social sentiment, vibrancy heatmaps, leisure activities, visitor activities, and preferred visual elements in Xiamen using SMBD; (2) To develop a comprehensive analytical framework that integrates SMBD with placemaking practices. These analyses will enable designers to gain a deeper understanding of citizens’ perceptions and preferences regarding various places. By examining variations in activities throughout different times of the day, we can also reveal how these dynamics shift. Additionally, identifying preferred visual elements will assist designers in selecting resonant visual features during the placemaking process. Through this comprehensive examination, we seek to enhance our understanding of the dynamic nature of citizen experiences and contribute valuable insights to the field of placemaking. Figure 1 visualizes the present research scheme regarding how the evaluation of Xiamen could mediate the process of understanding the perception of places and contribute to public placemaking.
The definition of public space varies widely. Generally, public space is defined as the unenclosed areas between architectural structures within urban settings, such as plazas and parks [6]. However, as private property plays an increasingly significant role in urban settings, many privately owned spaces, such as shopping malls, commercial pedestrian streets, and food courts, have also become important venues for public activities. In this study, public space is not confined to purely public areas; it broadly encompasses any accessible location, excluding gated places such as communities and office buildings.
The present research makes significant contributions to the relevant field through the following avenues: 1. Investigation of perception and interaction in Xiamen, China. The author uses SMBD to analyze five crucial aspects, including social sentiment, vibrancy heatmaps, leisure activities, visitor activities, and preferred visual elements. The results of these analyses provide crucial support and information for placemaking. 2. Development of an analytical framework for placemaking: Using Xiamen as a case study, this paper presents a comprehensive analytical framework that integrates SMBD with various analytical methods. It provides valuable support for designers by enabling them to work with high-dimensional SMBD, thus allowing them to leverage data from diverse perspectives in their design processes to gain insights and make informed decisions for enhancing public spaces. As urban environments continue to evolve, understanding how citizens interact with public spaces is more important than ever. This study not only addresses critical gaps in current research but also offers practical tools for urban designers to create more inclusive, vibrant, and functional public spaces.
This paper is organized as follows: We begin with a review of the traditional methods and roles of social media data in the context of accessing public spaces and placemaking. Next, we conduct preliminary interviews to identify the critical aspects for evaluating perceptions and interactions within public spaces. Subsequently, we propose an analytical framework for employing SMBD to evaluate public spaces. This is followed by an analysis of perceptions and interactions in Xiamen, China, using the proposed framework. Finally, we provide a comprehensive discussion on the potential applications and limitations of the study.

2. Literature Review

2.1. Evaluating Perception and Interaction of Public Spaces

Public space is a crucial part of urban design. These spaces are purposefully established and sustained for the benefit of citizens, contributing to the common welfare and promoting social cohesion. They serve as places where individuals convene, engage in interactions, socialize, uncover shared interests, and assert their collective entitlement to the city [20]. Public spaces are not merely physical locations but also arenas for social life and democratic engagement, making them essential for the vitality and identity of urban communities.
Understanding the problems, usage status, and issues surrounding public spaces is a prerequisite for the design and management of public spaces [21]. Evaluating public spaces can shed light on what makes these spaces successful in providing future direction for public space design and iteration [22]. Understanding issues such as accessibility, usability, safety, and inclusivity is a prerequisite for creating spaces that truly serve the public good [23,24]. For example, accessibility is not just about physical access but also concerns how welcoming and usable a space is for different social groups, including marginalized communities [25,26]. Safety, both perceived and actual, significantly affects how public spaces are used, particularly by women and vulnerable populations [27]. A successful public space not only meets the physical and social needs of its users but also fosters an inclusive environment where diverse populations can coexist and thrive [28].
Researchers are already dispensing invaluable insights to inform urban practices and appraise site performances [28]. By employing interviews and video recordings, designers can gain insights into the unique utilization dynamics of specific demographic groups within public spaces [29]. These methods help reveal patterns of use, user satisfaction, and areas needing improvement, which are essential for ongoing public space management and redesign [30]. In evaluating a building’s function and use, Post-occupancy Evaluation (POE) is commonly employed to assess if the outcomes of the design, construction, and facilities management teams align with the anticipated needs of the end-users and the project’s sponsors [5]. POE has been instrumental in bridging the gap between design intent and actual user experience, ensuring that spaces remain functional and relevant over time [31].
However, conducting these studies on a large scale remains challenging, as methods including observations, surveys, and interviews pose challenges that require high costs and a significant time commitment [7]. Traditional methods fall short due to the constraints of sample selection and time frame, which hinder the collection of comprehensive datasets [32]. The evolution of design practices calls for exploring novel analytical methods and approaches to ensure more comprehensive and accurate data collection and interpretation [33].

2.2. SMBD in Public Placemaking

By 2024, there were 5 billion social media users worldwide, representing 62.3% of the global population [34]. For years, social media platforms like WeChat, X, and Instagram have already become a part of the everyday lives of millions of people who constantly share their opinions about life, information, knowledge, interests, and so on every second [35,36,37]. According to Mishra and Rastogi [38] and Uma Maheswari and Dhenakaran [39], these large unstructured SMBD remain the most significant source of knowledge discovery in many areas of big data analytics.
Urban planning researchers and designers increasingly integrate social media data into their placemaking process. Compared to traditional research methods, social media data allow them to quickly access tens of thousands of user data points, offering real-time insights into public space usage and perceptions [40]. Emerging evidence indicates that social media analytics, including sentiment analysis, can surpass the constraints of traditional methods like surveys and interviews by providing more dynamic and context-rich data [41].
Leveraging SMBD, such as X, enables the investigation of seasonal variations in physical activities and engagement within green urban spaces [42]. SMBD could facilitate analysis of how citizens interact with the city, such as the relationship between sentiment and the built environment [43,44]. Concerning the overall urban image, the wealth of information within social media data allows for examining intangible facets of urban existence associated with specific locations [45]. As for individual experiences, social media data create a virtual trail tied to geographical positions, offering a more comprehensive analysis of users’ experiences and city perceptions [32,46].
Whether it is sentiment [15,47], street scene analysis [14,48], or usage patterns [49], most of the existing research has primarily concentrated on the development of one single strategy. However, the design of public spaces necessitates consideration of multifaceted concerns. This demands designers skillfully combine diverse analytical approaches, posing challenges in data handling and method selection [44]. This paper aims to introduce an analytical framework that harnesses the potential of social media in empowering public space design. It equips designers to comprehend the various data types that social media can provide and facilitates the alignment of analytical methods with design inquiries. This integrated approach and detailed instructions aid designers in conducting social media data analysis.

3. Materials and Methods

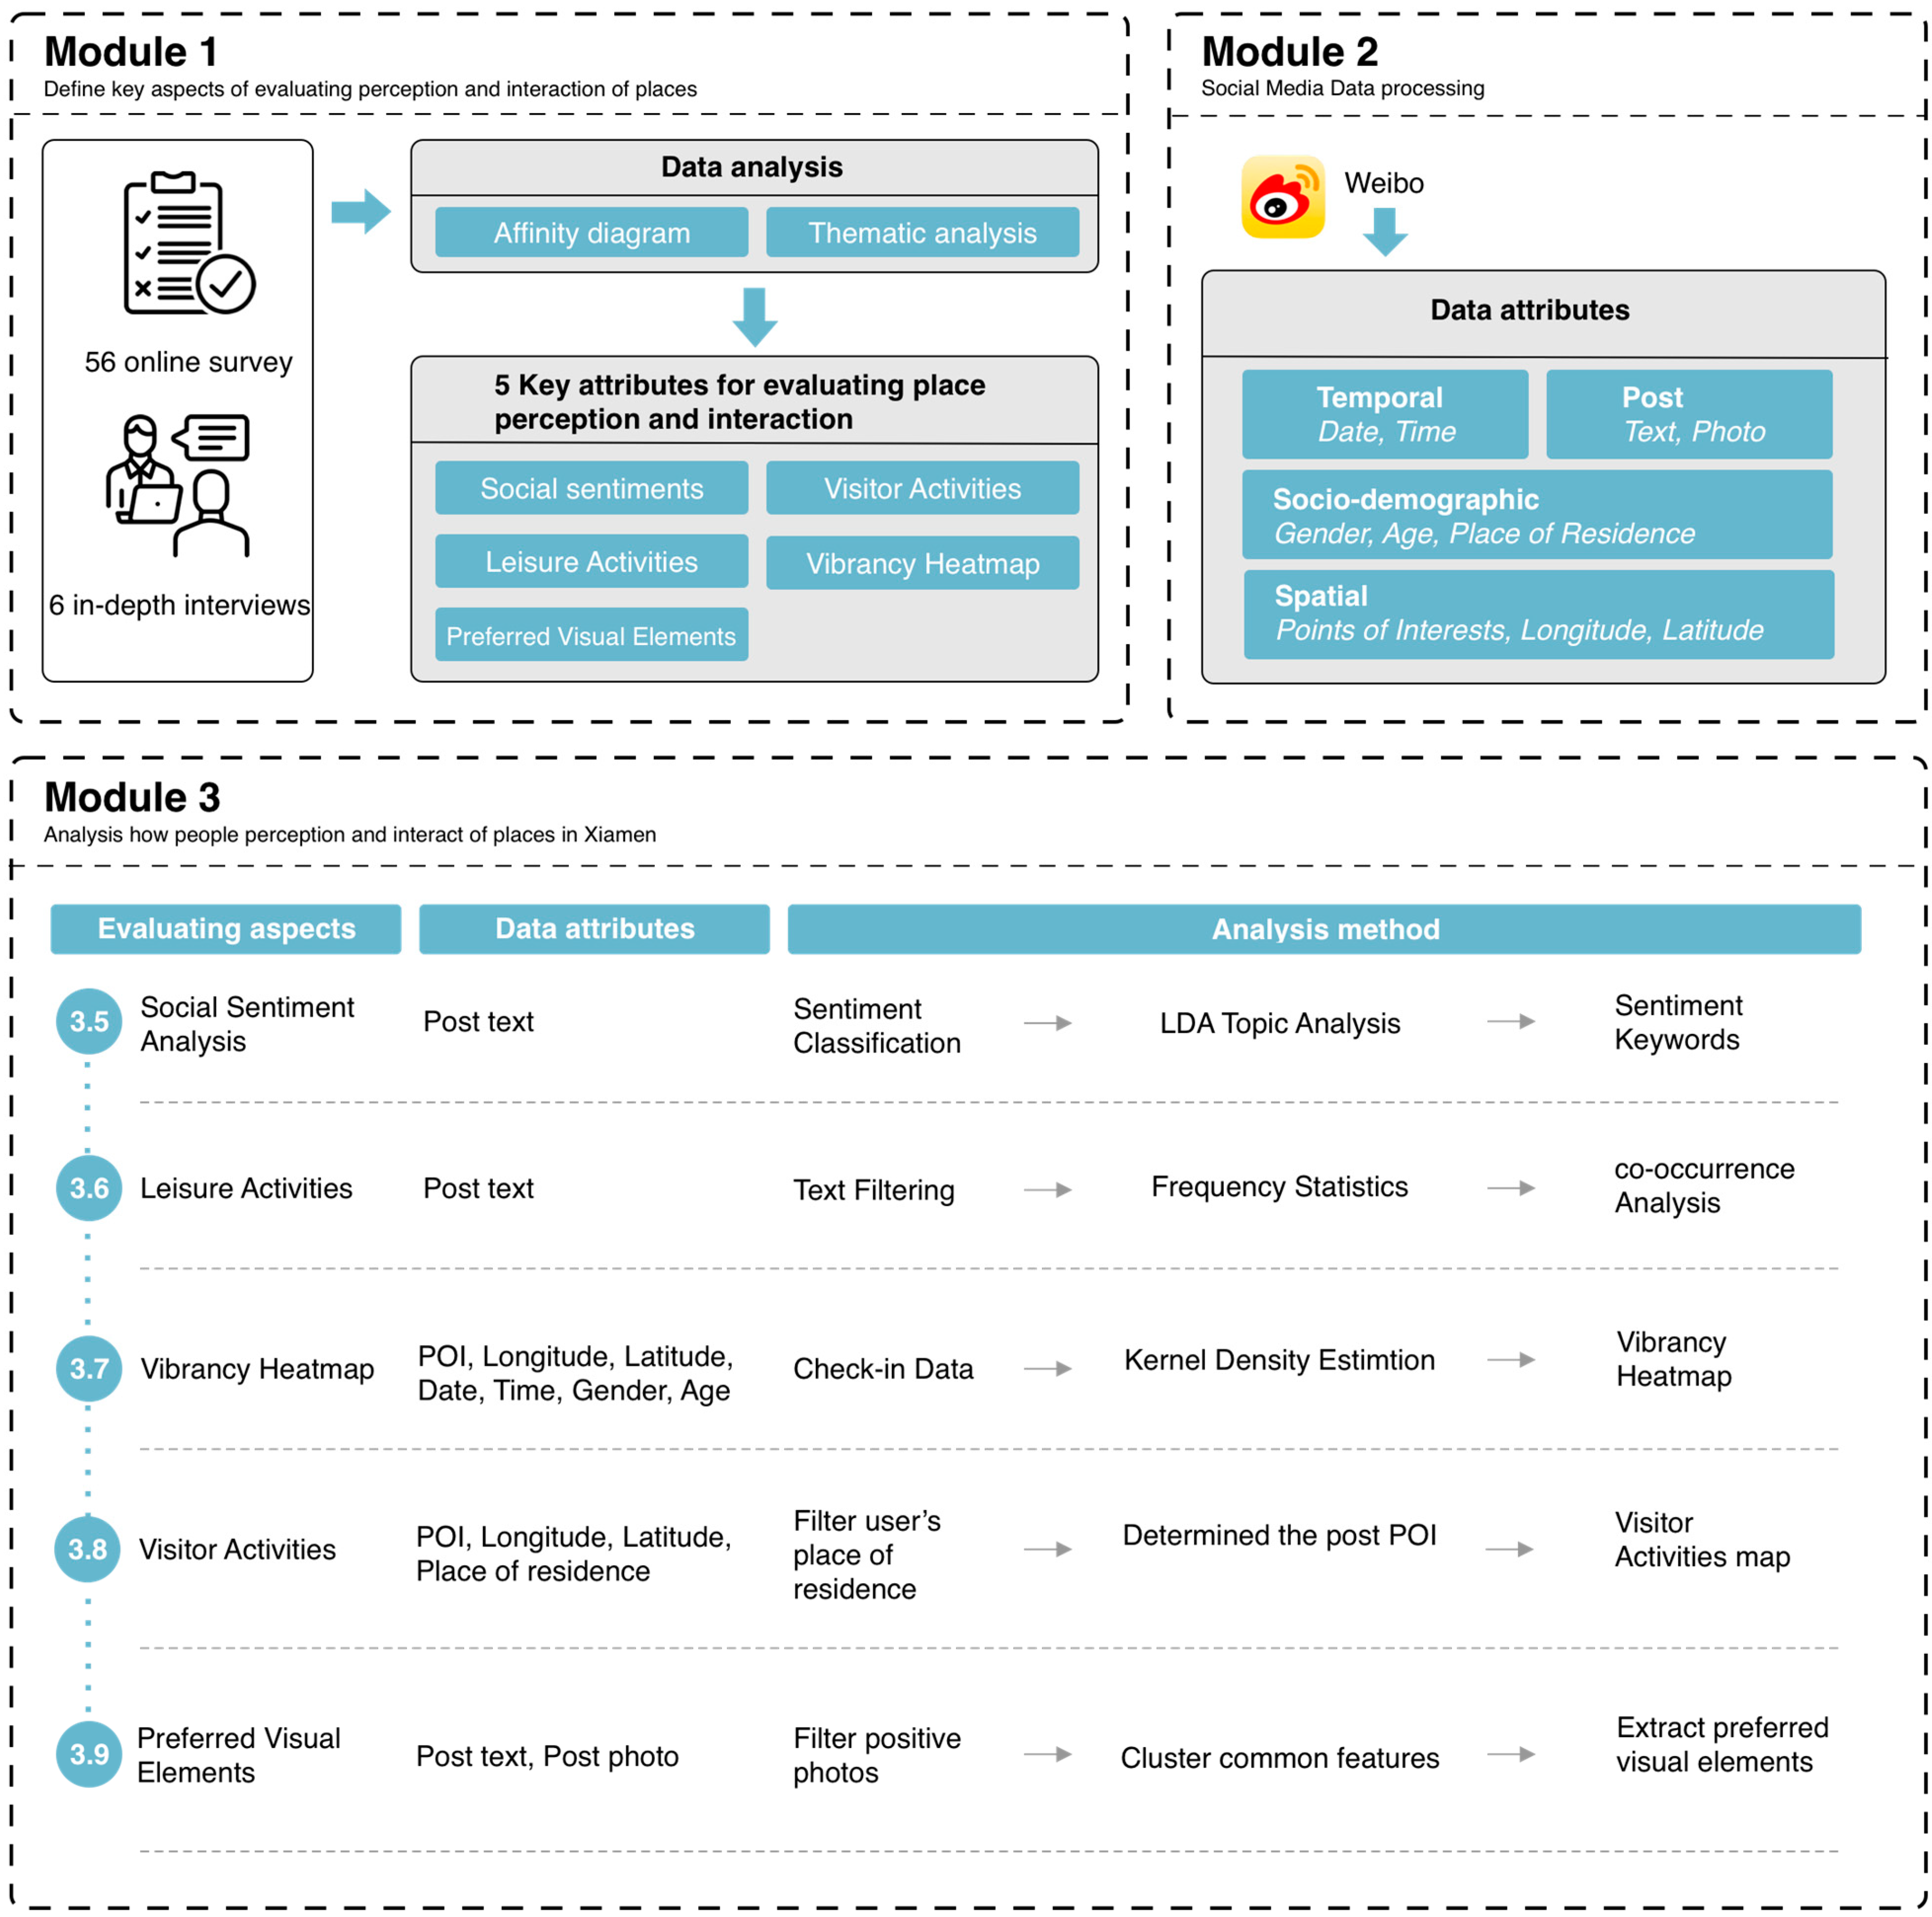
3.1. Overall Methods

As illustrated in Figure 2, the novel approach for evaluating public space perception and interaction can be classified into three steps: Module 1: This module analyzes the key concerns of designers when evaluating the perception and interaction of public spaces through online surveys and interviews. Module 2: This module classifies the available data from the social media platform Weibo. Module 3: This module analyzes the public space perception and interaction in Xiamen based on the five aspects identified in Module 1 and the data obtained from Module 2.

3.2. Preliminary Survey and Interview

Public space evaluation encompasses various aspects, including spatial vitality, form, accessibility, safety, and inclusivity. We aimed to identify the key concerns of designers during the evaluation process through surveys and interviews, thereby determining the crucial aspects that social media data should inform. To achieve this goal, we conducted a series of online surveys and interviews with expert designers. The survey helps us gather a broad understanding of designers’ perspectives, while the expert interviews allow for an in-depth exploration of these ideas based on the survey findings. Given the gradual unfolding of actual design cases and the often-confidential nature of commercial designs, diverse design research employs expert interviews to gain insights into the practical work of designers. All methods were conducted following relevant guidelines and regulations, and informed consent was obtained from all participants.
First, an online survey was conducted to identify the most crucial aspects of evaluating perception and interaction in public spaces. The experiment invited 64 participants, all with over one year of experience in urban design, landscape architecture, or related fields. Incomplete responses and those with unusually short completion times were excluded, resulting in 58 valid responses (32 female). Participants were asked to name the top three questions they considered most important during the evaluation of perception and interaction of public spaces in the pre-design stages, as well as whether they had used SMBD in their designs and if they were interested in incorporating SMBD into the design process (the full survey content is provided in Appendix A).
Following the online survey, six participants were invited for in-depth interviews. These participants were all esteemed designers from prominent design firms in China, with at least three years of experience in public space and urban planning and advanced degrees in relevant fields. Table 1 provides a concise summary of the participants’ backgrounds. Throughout these interviews, we explored the methodologies these designers frequently employ and the specific aspects they emphasize when understanding the use of public spaces in their previous design projects. We focused on addressing two key questions: which aspects of evaluation are most crucial for design, and which research methods previously employed by designers can be enhanced through social media data?
Every interview session was recorded and transcribed, with all participants giving informed consent. To protect anonymity, personal details and the interviewees’ original voices were removed from the data. Through thematic analysis [50] and the use of affinity diagrams [51], the first author synthesized the insights gathered from surveys and interviews into five aspects.

3.3. Study Area

This case study focuses on the central area of Xiamen, China, located in the southeastern coastal region of Fujian Province in eastern China (24°23′ to 24°54′ N, 117°52′ to 118°26′ E). Figure 3 illustrates the study area. In Figure 3, the red dots indicate the location of the study area on the map of China. By 2020, the city had over 300 parks with a total area of nearly 8000 hectares. Xiamen’s location provides diverse public space forms, including waterfront parks and tropical botanical gardens, catering to diverse needs such as tourism, leisure, exercise, and social interactions. Thus, offering high-quality and attractive public spaces has always been a crucial focus for urban planners in Xiamen. Therefore, this study selects Xiamen as a case study to investigate and analyze the usage patterns of its public spaces. This study selected the central urban area of Xiamen, which encompasses over 60% of the city’s GDP and includes the most popular tourist attractions. It serves as the core region of urban life in Xiamen.

3.4. Dataset

The dataset used in this study was collected from Sina Weibo, one of China’s most popular social media platforms [52]. Weibo is a microblogging service with an active user base of nearly half a billion people, often called “Chinese Twitter”. Users can post text and images on the platform. When a user posts, the platform records relevant information such as gender, posting location, date, time, registration location, and attached point of interest (POIs). Table 2 describes potential data attributes we could obtain from Weibo.
The Date and Time attributes indicate the creation timestamps of the data. Gender, age, and place of residence provide user identity information, which offers socio-demographic data. The text attribute constitutes the primary content of social media posts, offering insights into the thoughts and perspectives of users. Additionally, some users may include photos as supplementary elements to their posts. The spatial data provides geospatial information, such as longitude, latitude, and points of interest, illustrating the locations where the posts were made.
The dataset was created by gathering posts on every POI in the study area. First, based on statistical data from Xiamen, the authors identified all POIs in the study area. Since this study focuses on public spaces or private areas freely accessible to the public, POIs such as private residences and office buildings were removed from the list. Additionally, service-oriented places like schools, hospitals, and post offices were also excluded. For this research, Weibo posts in Xiamen from 2017 to 2022 were collected. The resulting dataset consists of approximately 250,000 microblog posts and 5000 POIs from over 125,000 users.

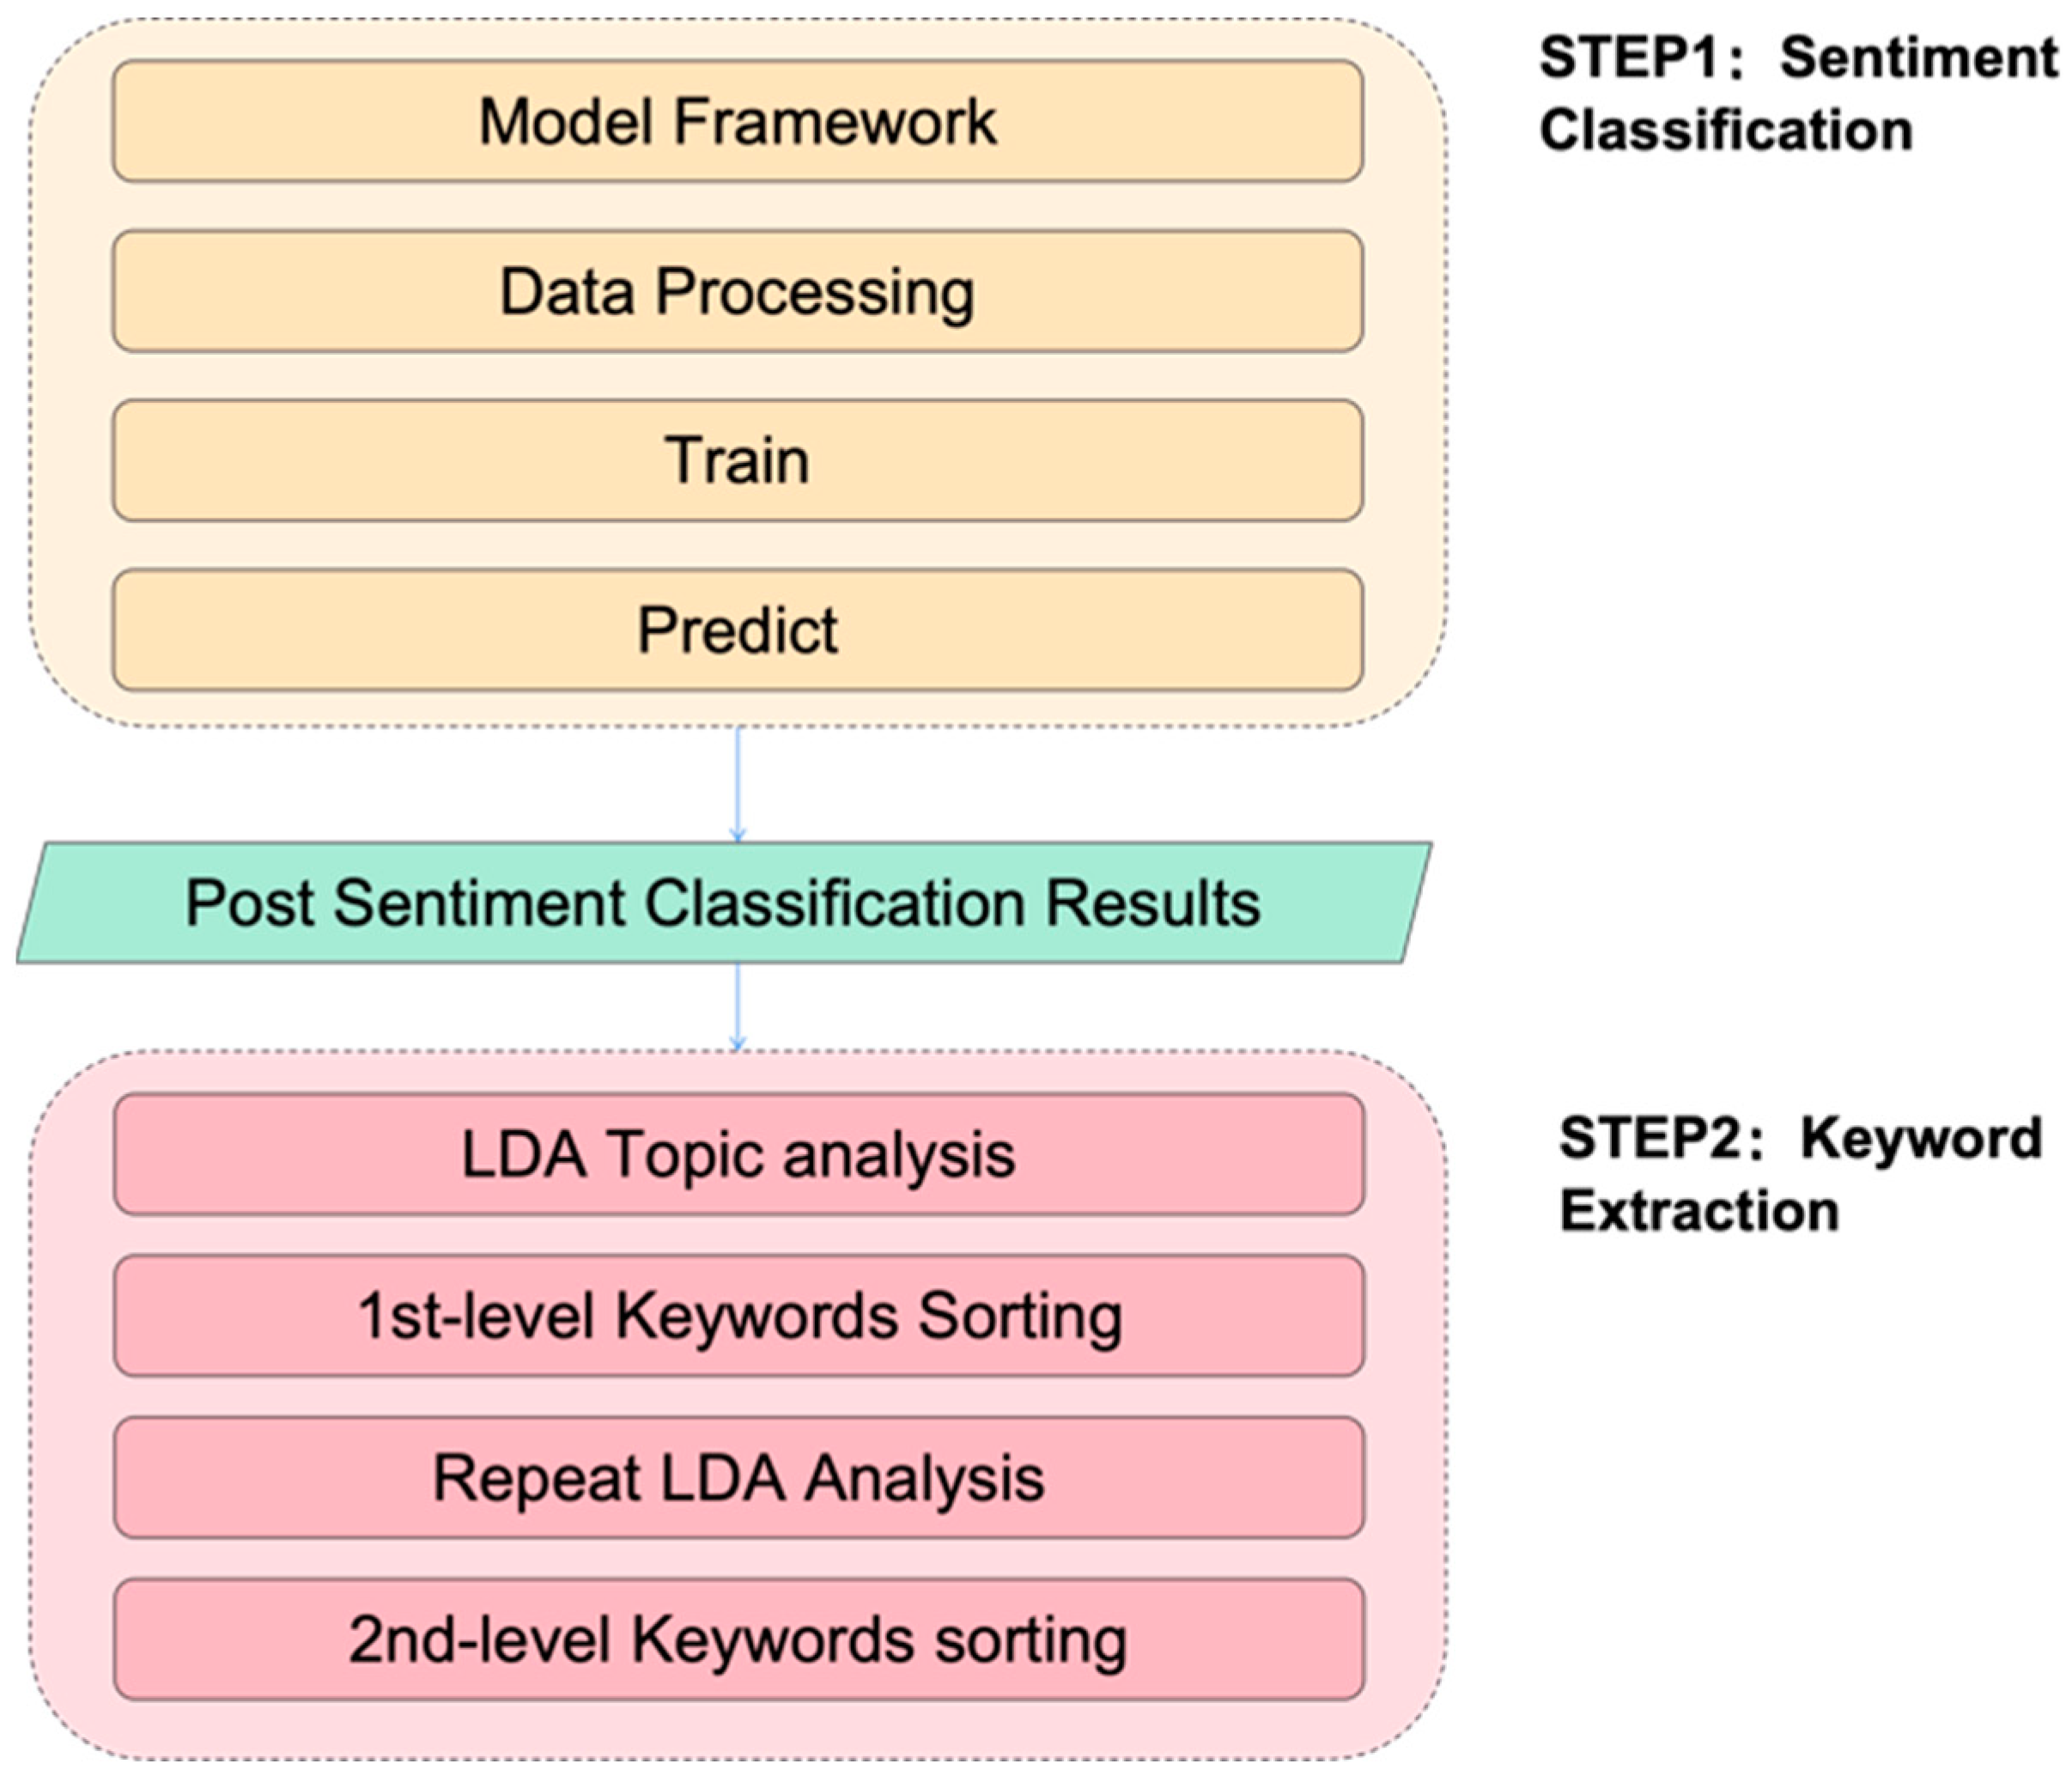
3.5. Social Sentiment

This section employs a two-step approach to discern social media sentiments: sentiment classification and keyword extraction.
Firstly, we analyzed the emotional tendencies in the check-in texts. In this study, we selected the Ernie [53] model from PaddlePaddle to classify the sentiments of the check-in texts. Ernie, developed by Baidu, is a semantic representation model based on the Transformer Encoder. Because the model could learn and model prior semantic knowledge units, it excels in accurately expressing relationships between vocabulary and the implicit logic of sentences. Compared to SnowNLP models [54], Erine has open-sourced the code for its sentiment classification model on the PaddlePaddle platform. This allows users to upload training datasets and adjust neural network parameters actively. Users can customize vocabulary that is not part of the original model, such as trending internet terms or current hot topics, enhancing emotion recognition accuracy in the analysis process. Even short posts can contain surprisingly varied emotions, often combining even conflicting ones. To distinguish the sentiments, the Latent Dirichlet Allocation (LDA) distinguishes topics on a pre-sentence basis. Through this process, we can discern the emotional tendencies of each post and establish a corpus for positive and negative emotions. Table 3 provides an example of the data after emotional tendency analysis.
Beyond identifying posts with positive and negative emotions, it is crucial to investigate the origins of these emotions within the content. To achieve this, we conducted separate analyses on the positive and negative emotion corpora extracted from the posts. The framework utilized LDA modeling to extract keywords related to positive and negative emotions. LDA is one of the most commonly used methods to perform topic modeling tasks. It is a generative algorithm that can reveal the hidden relationships in a corpus set [55]. We can obtain keywords associated with positive and negative sentiments by employing the LDA model to analyze two datasets. Subsequently, we cleaned the lists to remove duplicate and irrelevant terms. We ranked the words based on their frequency of occurrence to identify the top five keywords that most strongly evoke positive and negative emotions. The posts related to the keywords were developed as well. Performing another round of LDA analysis on each sub-dataset allows for identifying sources for positive and negative sentiments, offering further design guidance. Figure 4 illustrates the comprehensive analysis process.

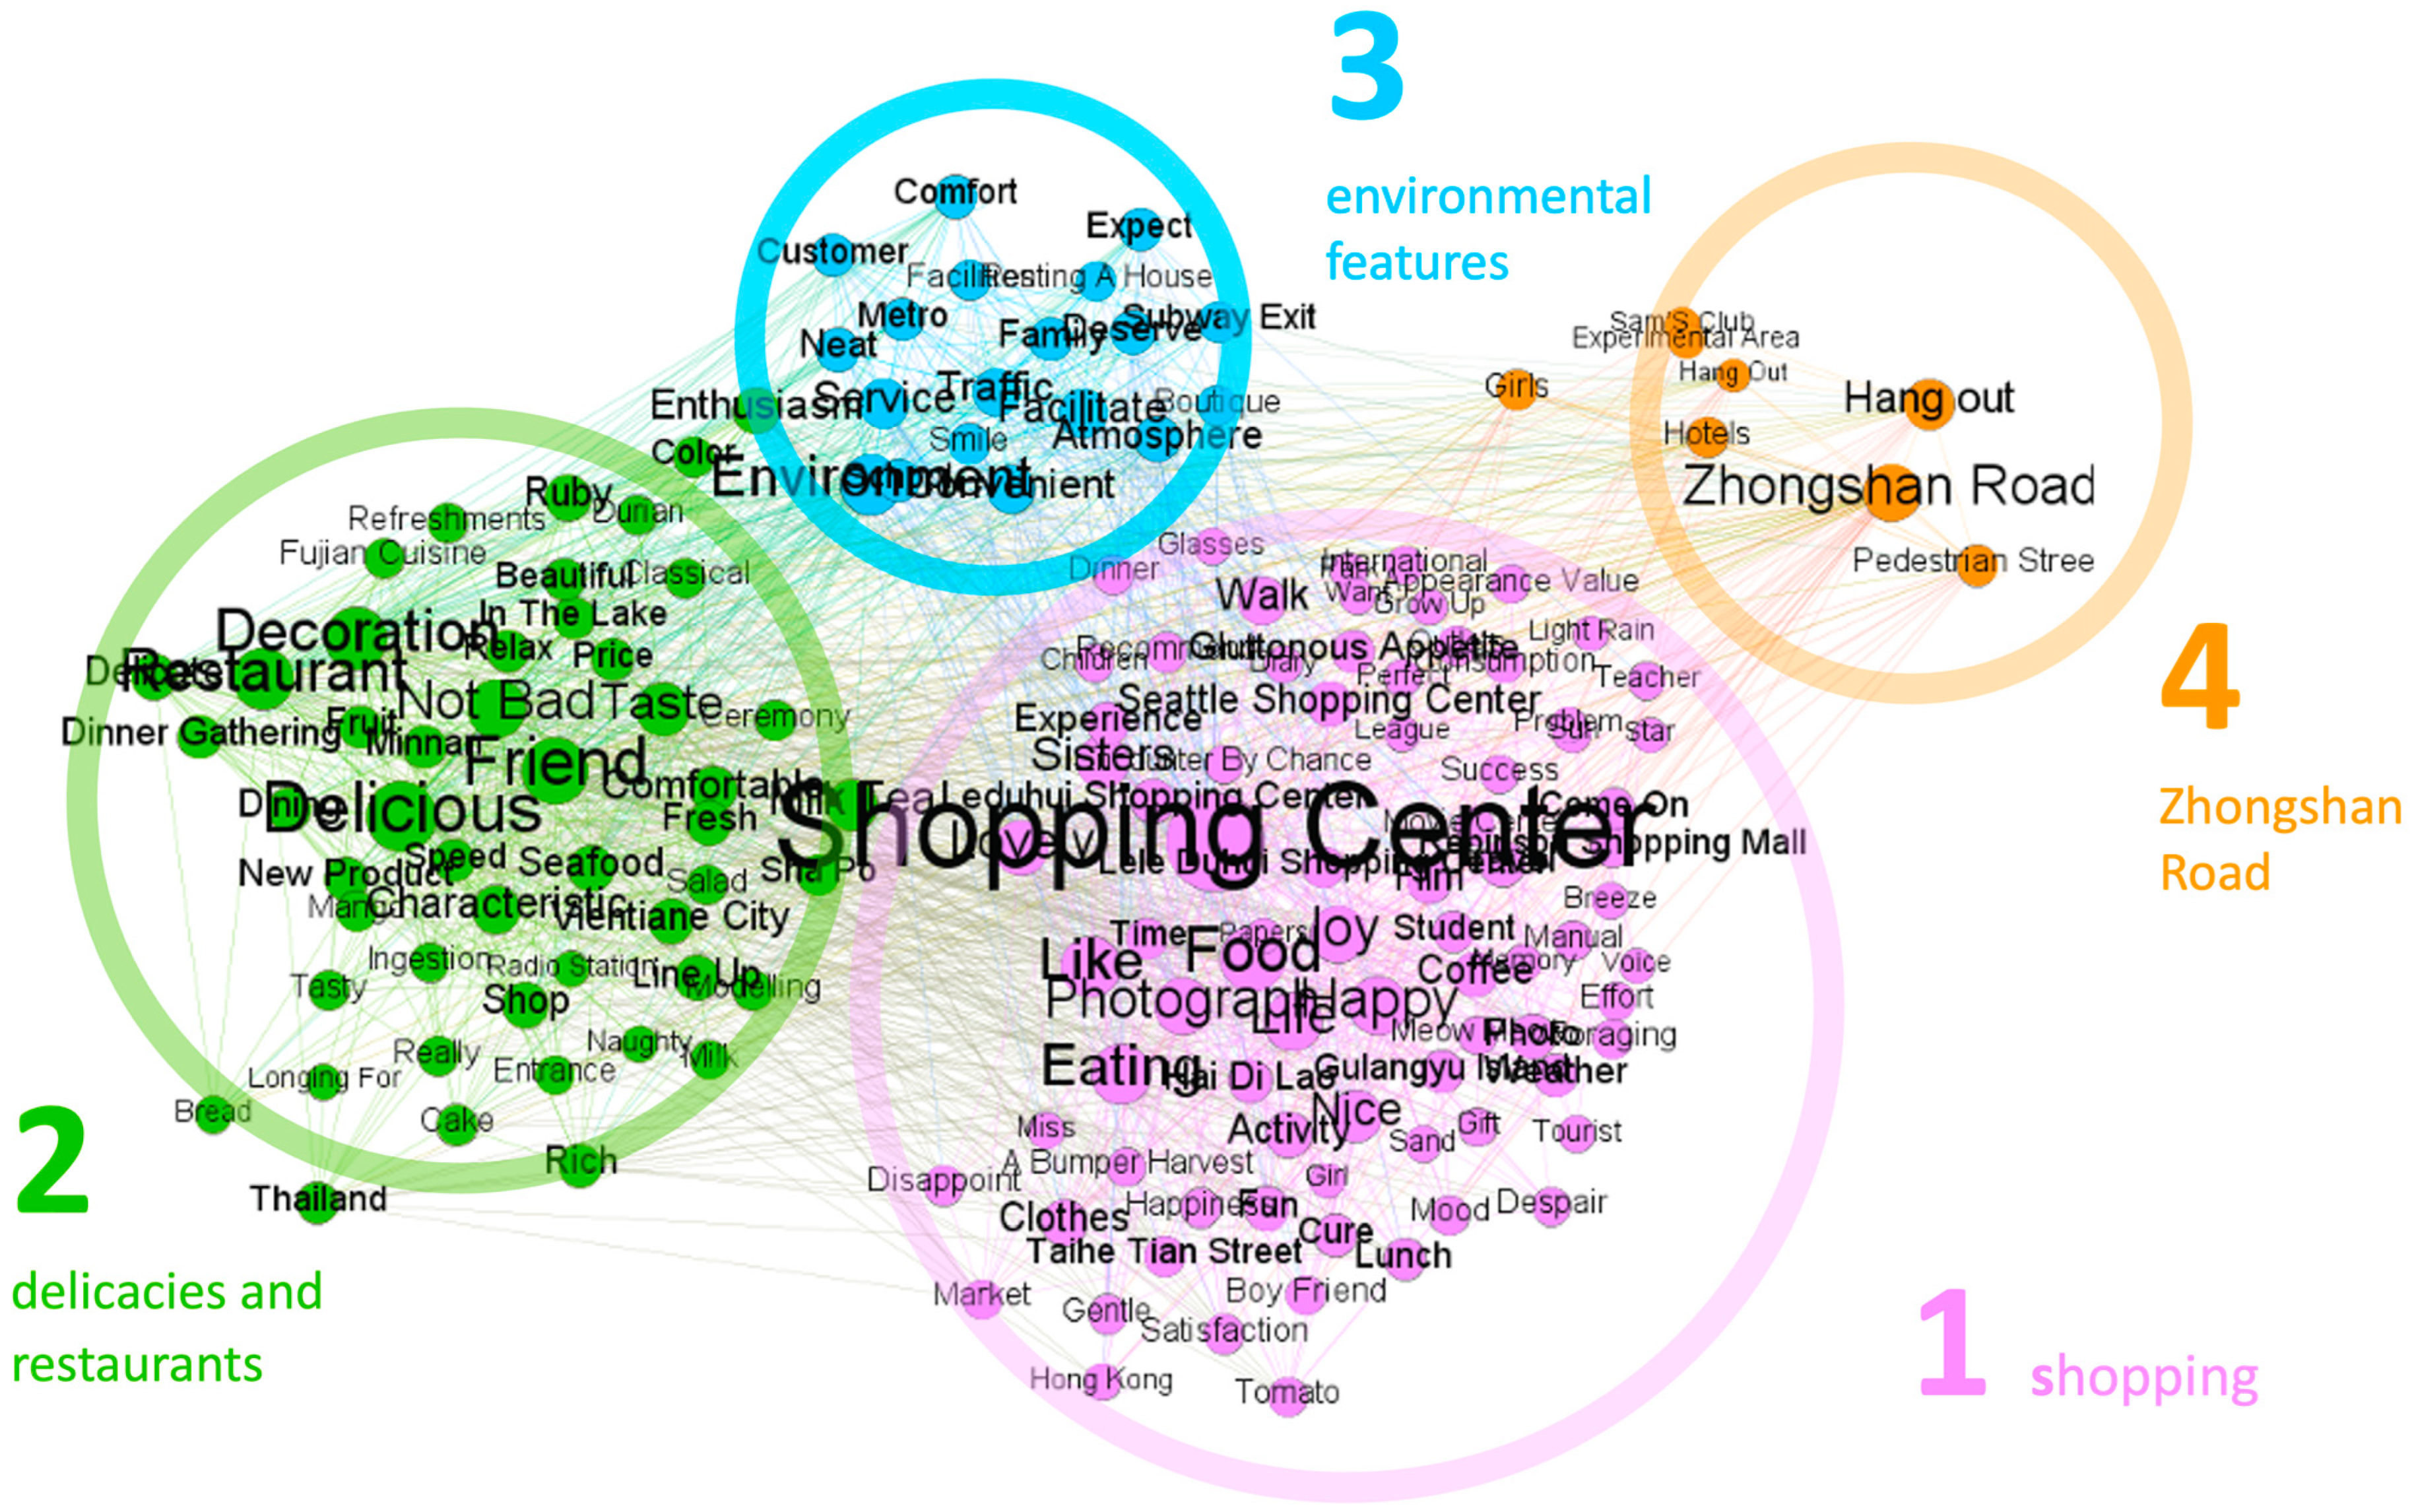
3.6. Leisure Activities

Supporting leisure activities is vital to urban public spaces [30]. To analyze leisure activities, we utilized the open-source Chinese synonyms query toolkit called “Chinese Synonyms” [56] as our retrieval tool. Chinese Synonyms is a highly regarded synonym database for the Chinese language, containing over one hundred thousand entries and trained using extensive data and machine learning techniques. Using the term “leisure” and employing the vector-based semantic recall technique called Approximate Nearest Neighbor Search (ANN), we retrieved a set of phrases synonymous with leisure, such as “leisure travel”, “experiential”, “catering”, “vacations”, “shopping”, and others. We filtered the text data to establish relevant microblog entries related to leisure behaviors by referring to the retrieved synonymous phrases. The Chinese word segmentation and sentiment analysis software GooSeeker (V9.0) [57] was used to facilitate automatic word segmentation, frequency analysis, and co-occurrence matching functions. After the automatic word segmentation, we filtered out pronouns, adverbs, and other irrelevant terms. Then, we sorted and matched the keywords based on their frequency and co-occurrence, resulting in a co-occurrence matrix data table for leisure behavior data.

3.7. Vibrancy Heatmap

Geo-tagged social media data serve as an adept avenue for gauging city vibrancy. It represents micro-level spatial–temporal behavioral patterns and signifies instances where users engage in specific activities at distinct times and locations. We discern the spatial source bolstering urban vitality through the POI within check-in data. In this context, Kernel Density Estimation (KDE) was adopted to scrutinize check-in behaviors’ spatial and temporal distribution patterns [58]. Kernel density analysis calculates the density of point elements around each output raster image element. Within this study, KDE transformed discrete check-in points, accompanied by their respective check-in counts, into continuous surfaces representing their spatial density. The following equation determines the predicted density of the new (x,y) location:
Density   =   1 ( radius ) 2 i = 1 n [ 3 π · pop i ( 1 ( dist i radius ) 2 ) 2 ] For   dist i < radius ,
where i = 1,…, n are the input points. Only points in the sum are included if they lie within a radius distance of the (x,y) position. disti is the distance between point i and the (x,y) position.
By segmenting the dataset based on other attributes of check-in data, such as age, gender, date, and time, vitality maps across distinct demographics and periods can be generated. This allows for dissecting the relationship between urban functionalities and vitality across different demographic groups. A Vibrancy Heatmap can be created using a coordinate visualization tool to better understand the spatial distribution of vibrancy.

3.8. Visitor’s Activities

The composition of urban residents is diverse, including residents and temporary visitors from outside the city, all of whom comprise the user groups of public spaces. Due to their different identities and purposes, their demands and preferences for public spaces can be different. Gaining a deeper understanding of how these diverse groups use public spaces is crucial for designers, as it helps better meet their needs and create more inclusive and various public spaces.
We can determine whether the user is a local or out-of-town visitor by comparing the posting locations with the “Place of residence” information in social media data. By filtering data where the “Place of residence” differs from the posting city, we can establish a dataset for posts made by out-of-town visitors. By analyzing the location of posts and associated POI, we can classify popular visiting spots for out-of-town visitors and understand their patterns of using public spaces. By importing these data into a geographic coordinate visualization platform like ArcGIS, we can create a distribution map to visualize the activity patterns of the visiting population across different locations.

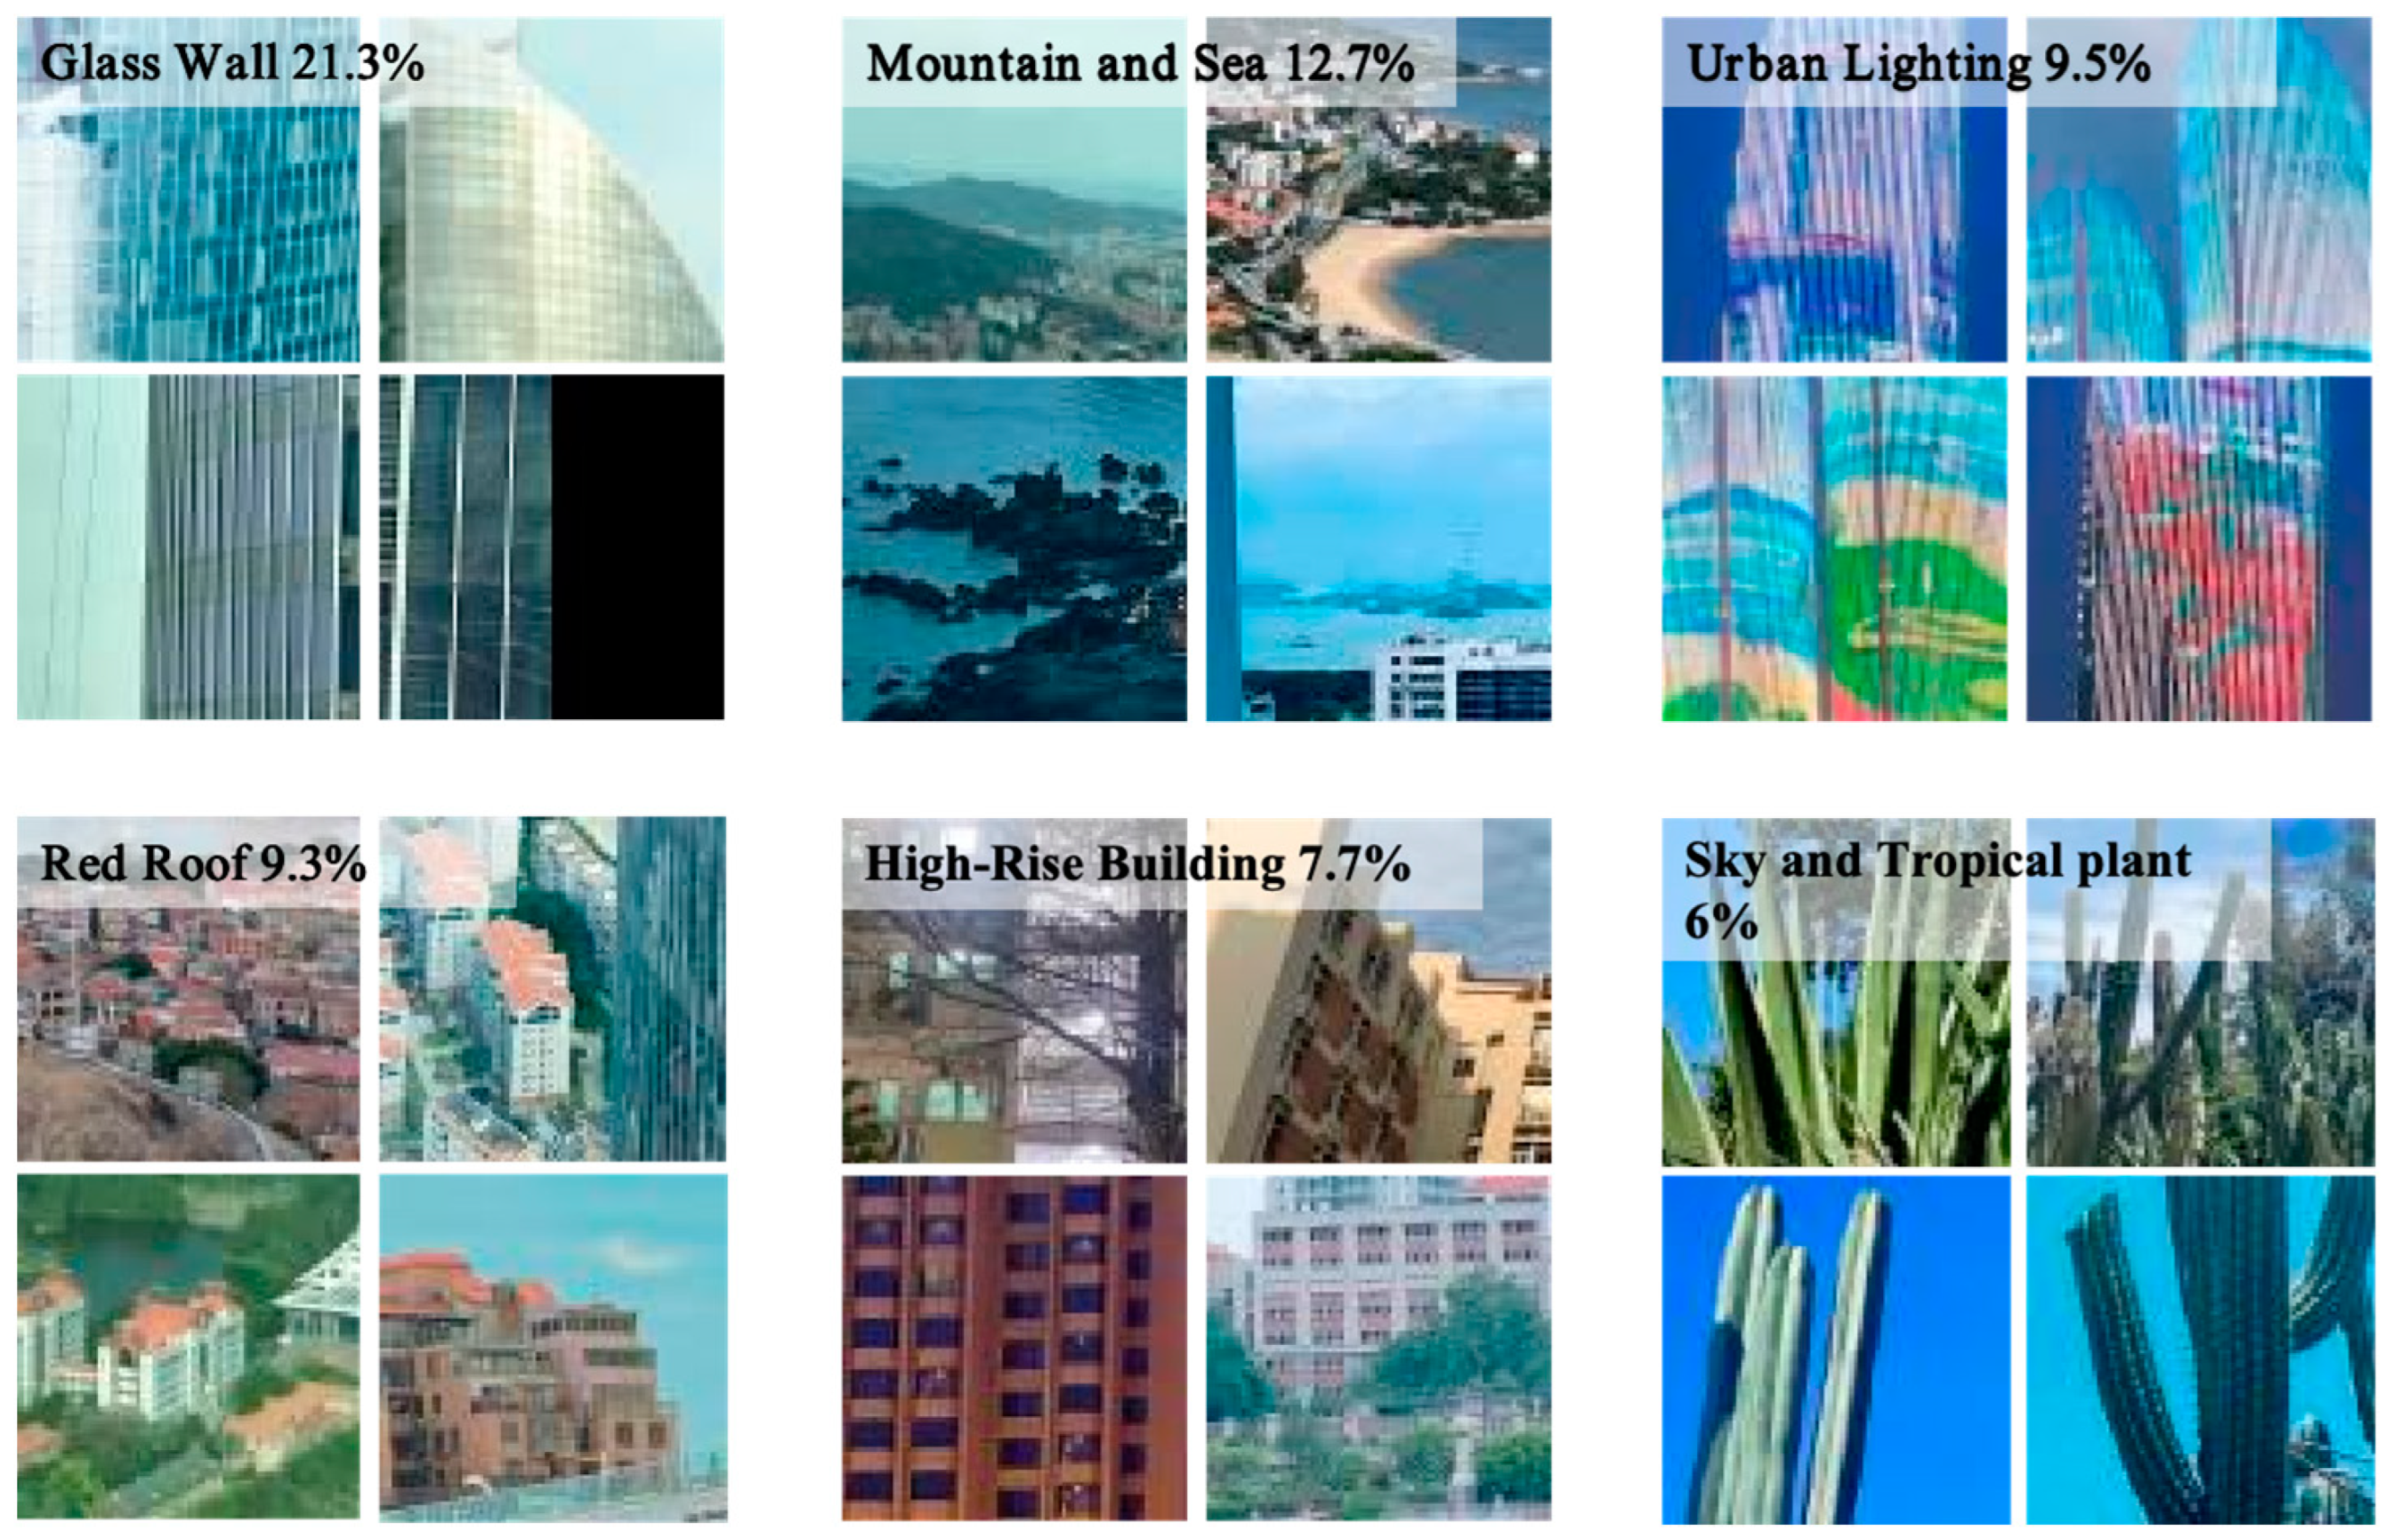
3.9. Preferred Visual Elements

Beyond functionality and location, the aesthetic of public spaces is equally important. Various elements can trigger a range of feelings in individuals. This section seeks to identify the visual elements of public spaces that elicit the most positive emotional responses by analyzing images from social media platforms. Figure 5 demonstrates the process of extracting preferred visual elements.
The first step of preferred visual elements is to establish the dataset. We obtained posts and images from the designated area. First, using the sentiment analysis tool mentioned in Section 3.5, we filter out images with positive posts to create a dataset of positively emotive images. Second, each image in the dataset is then cropped into an 80 * 80-pixel square patch, and both gradient and color histograms are extracted as features from these patches. Using the gradient histogram as an example, Gx and Gy are calculated using the following formulas for each pixel value.
Gx(r,c) = I(r, c + 1) − I(r,c − 1)
Gy(r,c) = I(r − 1,c) − I(r + 1,c)
After calculating Gx, the magnitude and angle of each pixel are calculated using the formulas mentioned below.
Magnitude(μ) = sqrt(Gx^2 + Gy^2)
Angle(θ) = abs(arctan(Gy/Gx))
After obtaining the gradient of each pixel, the gradient matrix (magnitude and angle matrix) is divided into cells of size 8 × 8. Each cell is sliced into nine bins according to the angle to map the gradient intensities into different gradient direction ranges. After obtaining the histogram of each cell, the 2 × 2 cells are combined into a block, and the gradient histograms computed in this block are concatenated to obtain a vector of length 4 × 9 = 36 as the feature vector of this block. Finally, all the feature vectors of the blocks are concatenated to obtain the final feature vector.
Additionally, deep convolution features of the patches are obtained using the VGG network and concatenated into a new matrix. Subsequently, the authors construct classifiers for image patches and train SVM classifiers for each visual element based on the cosine similarity of image features to identify visually similar images.
For the cosine similarity of each two images, the procedure is calculated as follows:
cos _ s i m ( a , b ) = a · b T | | a | | · | | b | |
where
a and b are the input image vectors.
bT denotes the transpose matrix of b.
||a||, ||b|| denote the modulus of the vectors a, b.
The above process identifies visually prominent elements frequently appearing in the dataset of positively emotive images. These elements can provide spatial references for designers when designing public spaces in the same region.

4. Results

4.1. Five Key Aspects of Evaluating Perception and Interaction of Public Spaces

This section outlines the five key aspects that designers focus on during the evaluation of the perception and interaction of public spaces. Through an analysis of the survey responses, the author identified the five most critical aspects of evaluating perception and interaction in public spaces that concern designers the most. Although only 58 surveys were collected, the results demonstrated a high level of consistency, with these five aspects encompassing 71% of the data. The five key questions are as follows: (1) Social sentiments indicate how people value the spaces; (2) Popular leisure activities that were desired; (3) Vibrancy map that represents micro-level spatial–temporal behavior; (4) Visitors’ activities that suggest different groups’ needs in the city; (5) Preferred visual elements that guide the city image constructions.
(1) Social sentiment: Social sentiment provides an essential social reference for urban management and planning [47]. The discussion of social sentiment can be traced back to the 1960s when Lynch introduced the concept of a “mental map” to represent people’s perceptions of the surrounding built environment [59]. In our survey, 50% of respondents indicated that users’ sentiments—such as likes and dislikes—are important considerations in their evaluations. All interviewees mentioned that they seek to understand citizens’ opinions of public spaces before design. “During my interviews, a standard question I asked was, “What do you like and dislike about your current neighborhood?” Answers to this question provide me with a tangible grasp of residents’ thoughts and the sources of their satisfaction or dissatisfaction,” said Interviewee No. 5. Positive sentiment fosters community engagement and social cohesion, while negative sentiment highlights areas that require attention to create more inclusive and user-friendly environments. Analyzing sentiments helps identify areas for improvement and allows for the customization of spaces to better align with community preferences and needs.
(2) Leisure activity: Public spaces play a vital role in hosting a variety of civic activities, thereby enhancing their usefulness and appeal. These activities can range from physical exercise and sports to social gatherings, cultural events, and passive pastimes like reading or observing nature [60,61]. When these spaces are designed to reflect citizens’ preferences and interests, they are more likely to be frequented and engaged with [62]. Public spaces that accommodate leisure activities provide opportunities for relaxation, entertainment, and exercise. 83.3% of survey participants identified “the leisure activities preferred by users” as a key consideration in their design evaluations.
Effectively designing public spaces requires a deep understanding of the activities that people in the area enjoy. Interviewees No. 4, No. 5, and No. 6 emphasized that understanding citizens’ leisure activities is crucial for public space design. As interviewee No. 4 stated, “Vibrancy in public spaces is achieved by creating spaces that support citizens in doing what they love.” The types of activities that resonate with people can vary greatly depending on the location and individual preferences, making it essential to tailor public space designs to the specific needs and desires of the community.
(3) Urban vibrancy: Urban vibrancy describes the allure, diversity, and accessibility of a locale, constituting an elemental facet in achieving an enhanced urban quality of life [63]. Jacobs first described the concept as “liveliness and variety attract more liveliness; deadness and monotony repel life” [64]. By analyzing urban vibrancy, planners can identify successful design elements that contribute to the liveliness of public spaces and apply these insights to create more inclusive, accessible, and engaging environments [65,66]. In our survey, 73% of participants identified “users’ time distribution in public spaces” as a key research focus.
The interviews further suggest that designers are keen to understand the vibrancy of existing public spaces. As interviewee No. 3 noted, “If I were to design a park, I would want to know which existing parks are popular, whether they are pocket parks within the city or more extensive, organized green areas.” Research into urban vibrancy reveals the characteristics that make certain city spaces appealing. For example, residents in one city might prefer small pocket parks situated within busy commercial districts for plaza design, while another city may favor the expansive development of large green spaces. Understanding these preferences is crucial for designing public spaces that resonate with the local community [67].
(4) Visitor’s activities: Public spaces are inherently inclusive, serving as a platform for diverse activities that cater to various demographic segments. In addition to residents, urban populations include transient individuals such as tourists, business professionals, and scholars, each of whom represents a vital component of the urban fabric. By analyzing the activities and preferences of visitors, urban planners can design public spaces that not only meet the needs of local residents but also enhance the overall attractiveness and functionality of the city [68]. In our survey, 18% of participants indicated that they consider the activities of tourists and non-residents in their evaluations.
Several interviewees emphasized the importance of addressing the diverse needs of different groups in public space design (Interviewees No. 2, No. 4, and No. 6). As Participant No. 4 remarked, “For instance, last year while designing a convention and exhibition complex, I observed that visitors from out of town and residents exhibited entirely different behaviors and requirements.” When crafting public spaces, a comprehensive understanding of the distinct needs of various demographics is essential to fostering the diversity and inclusiveness of these communal areas. This approach ensures that public spaces can accommodate a wide range of activities and meet the needs of all users, contributing to the vibrancy and utility of the urban environment [69]. Ultimately, designing public spaces with visitors in mind contributes to the vibrancy and inclusivity of urban areas, creating environments that are dynamic, resilient, and capable of supporting a diverse array of activities and interactions [70].
(5) Preferred visual elements: Selecting the appropriate form and visual elements is essential when designing a public space, as these components can evoke various emotions and sensations in users, thereby influencing their sense of attachment and overall experience within the space. Numerous studies have already delved into the built environment’s impact on individuals. For example, there have been investigations into how each dimension of color influences customers’ aesthetic perceptions of luxury hotel rooms [71] and studies exploring the psychophysiological responses to green spaces concerning factors such as behavior and per capita area [72]. Additionally, the visual coherence and aesthetic appeal of a space can foster a sense of place and belonging, encouraging repeated use and community engagement [73]. In our survey, 44% of participants indicated that they focus on identifying popular and distinctive visual elements in their design considerations.
Interviewees No. 1, No. 2, and No. 5 highlighted the importance of understanding unique visual elements as a critical aspect of the evaluation. The demand for specific visual forms in public spaces can vary significantly based on factors such as the cultural background of the design site, its geographic location, and the demographics of its users. By carefully considering these elements, designers can create spaces that resonate with the local community, enhance the user experience, and foster a strong sense of place and identity [74].

Discussion of the Survey and Interview

In addition to asking about the key aspects they are interested in learning while evaluating perception and interaction in the pre-design phase, we also questioned participants about their applied methods. As anticipated, the most commonly used methods mentioned in the survey included interviews (86%), desk research (75%), survey questionnaires (77%), and field studies (70%). However, all interviewees claimed that collecting data from the traditional method is challenging. Conducting street interviews provides only a limited sample size, and the time and cost constraints often prohibit designers from investing significant resources in interviewing many citizens. As a result, they often turn to secondary data sources, like consultations with relevant authorities or incorporating insights from news articles and reports, to complement their research. Yet, these secondary data sources can diminish the credibility and depth of the data.
Although four out of six interviewees were familiar with the concept of using SMBD in design, none had applied it in practice. The primary obstacle they cited was a lack of understanding of data and coding. The survey data echoed this finding: 65% of designers expressed uncertainty about data sources, 54% were unsure about data analysis techniques, and 60% were unclear on how to integrate analytical results into design considerations.
The combination of survey and interview results identified the five key aspects of evaluating public space perception and interaction. This process also reaffirmed the limitations of traditional methods such as surveys and interviews, as discussed in the literature review. Additionally, it highlighted the challenges designers face in integrating various analytical approaches for SMBD analysis, underscoring the need for greater accessibility and understanding of these tools within the design community.

4.2. Perception and Interaction of Public Spaces in Xiamen

In this section, we analyze the collected Weibo data to examine the five key aspects of perception and interaction within the study area.

4.2.1. Social Sentiment

Firstly, we employ the Erine model’s social media dataset to discern the emotional undertones within the Xiamen Weibo texts. A snapshot of the sentiment-labeled data corpus is furnished in Table 4. Secondly, we engage in two successive rounds of LDA analysis, distinctively focusing on positive and negative emotional attributes. This endeavor yields pivotal topics and subtopics that evoke positive and negative sentiments. Beyond the topics, designers could further peruse the original microblog texts beneath each topic, fostering a more direct apprehension of the sources engendering emotions.
The analysis of social sentiment has indicated that for the people of Xiamen, three primary topics evoke positive emotions: gourmet, travel, and business. Analysis of microblog texts reveals that representative culinary delights of Xiamen are “Satay Noodles” and “seafood”, aligning perfectly with the city’s traditional reputation. The resonance with travel is equally evident; Xiamen’s status as a picturesque coastal city naturally elevates travel-related sentiments. In travel narratives, words such as “scenery”, “record”, and “check-in” emerge as triggers for positive emotions. Similarly, themes related to business highlight the city’s vibrant urban atmosphere, including mentions of “plazas”, “city life”, and “communication”.
Analyzing social sentiment also reveals the sources of negative emotions in the city. The city’s weather, particularly during “summer”, is often perceived as “hot”, and the presence of “mosquitoes” is annoying. According to citizens, the design of pedestrian walkways does not seem tailored to local conditions. The term “disturbance” stands out as a prevalent negative emotional factor, encapsulating the disruption caused by public space construction and the influence of public spaces on neighboring residents during usage.

4.2.2. Leisure Activities

The co-occurrence matrix for keywords related to leisure activities in Xiamen was generated through the analytical method mentioned above. As a result, a network visualization based on leisure activities was created. Figure 6 demonstrates the clustered activities theme at Xiamen.
Through visual analysis of the results, we can discern the leisure activity patterns of the people of Xiamen. The modularized outcomes categorize the leisure activities into four clusters with different colors. Cluster 1, signifying the most favored leisure activity, is shopping-related. The associated keyword network provides insights into the shopping behavior of Xiamen residents, such as popular shopping locations (SM Shopping Center, the MixC, Robinson Shopping Center, etc.) and the attributes or functions that attract people (rejuvenating, visually appealing, etc.). The second cluster pertains to delicacies and restaurants. The analytical findings delve more extensively into culinary preferences. This encompasses food types (Fujian cuisine, tea-time snacks, desserts, bubble tea, etc.) and attributes (ambiance, aesthetics, finesse, service, etc.).
Moreover, it is notable that Xiamen residents enjoy gathering with friends and family. The third cluster concerns the environmental features of leisure activities. Beyond comfort and tidiness, transportation emerges as a crucial aspect of leisure activities for people. Residents of Xiamen are interested in strolling and shopping along the pedestrian streets. The fourth cluster highlights Zhongshan Road, one of the most famous pedestrian streets in Xiamen. Linking seaside attractions and shopping venues, Zhongshan Road provides a prime spot for both tourists and locals to enjoy strolls and shopping experiences.

4.2.3. Vibrancy Heatmap

In the case study of Xiamen, we segmented the dataset based on time to capture the vibrancy heat map. KDE estimates the check-in density distributions to determine the check-in heatmap for each cell in 2 h intervals. Figure 7 demonstrates Xiamen’s check-in heatmap, which reveals the patterns of people’s activities. Regarding spatial distribution, the main agglomeration areas with high frequencies and densities are evident in Jimei School Villiage, Zhongshan Road, Xiamen Train Station, Xiamen Airport, and Aluohai City Square.
To analyze the factors underlying urban vibrancy, the author extracted the list of POIs from areas with high vibrancy levels. The analysis reveals that from 6 a.m. to 9 a.m., the city’s vibrancy is concentrated around recreational, residential, and transportation-related POIs, with hotspots around airports, stations, and terminals. From 9 a.m. to 12 p.m., there is an increase in check-ins around corporate offices and eateries, with landmarks like office buildings, parks, cafes, and shopping malls being prominent. The period between 12 p.m. and 3 p.m. shows a similar vibrancy distribution to the morning, but there is a rapid increase in check-ins at eateries and outdoor venues. From 3 p.m. to 6 p.m., the vibrancy pattern remains consistent with the previous segment, yet check-in numbers continue to rise. Between 6 p.m. and 9 p.m., residential areas, dining establishments, sports and leisure facilities, and educational and cultural sites experience heightened vibrancy. Xiamen boasts an active nightlife, as evident in the 9 p.m. to 12 a.m. period, with bars, restaurants, theatres, and shopping centers bustling with activity.
This aids designers in comprehending the diverse functional demands of Xiamen residents across different periods. Beyond basic commuting requirements on weekdays, dining options, especially cafés, are crucial in office area public spaces. Furthermore, given Xiamen’s vibrant nightlife, public space designs should also account for the distinctive requirements and scenarios during nighttime hours.

4.2.4. Visitor’s Activities

As the core of the Xiamen–Zhangzhou–Quanzhou metropolitan area, Xiamen draws residents from nearby cities for a variety of activities. By employing the methods provided in Section 3.8, the researchers filtered posts from users registered in Zhangzhou and Quanzhou in the dataset. An analysis of the POIs mentioned in their posts indicates that visitors from these cities participate in consumption, education, housing, and sightseeing activities in Xiamen. Figure 8 showcases a map of the POIs related to these activities, offering designers a visual understanding of the interplay between city functions and activity distribution.
The allure of shopping is the primary attraction for residents from Zhangzhou and Quanzhou who want to visit Xiamen. Despite having considerable purchasing power, these neighboring cities have a relatively limited selection of shopping malls. In contrast, Xiamen has emerged as a hub for a wide variety of international fashion and trendsetting brands, with many opting to open their first store in Fujian Province there. The city’s varied retail environments, from the culturally unique Zhongshan Road pedestrian street to the high-end brands found in MixC Mall and SM Shopping Center, attract shoppers from neighboring cities.
Beyond retail, Xiamen is a repository of rich educational resources, from prestigious universities to vocational colleges. Centered around Jimei School Village, the city has become a hub for academic exchange and research discussions, attracting scholars from afar.
As the central city within the Xiamen–Zhangzhou–Quanzhou metropolitan area, Xiamen draws a considerable influx of exceptional talent seeking employment opportunities. Consequently, residential and hotel locales related to housing have become popular gathering spots for individuals from Zhangzhou and Quanzhou.
Xiamen’s reputation as a famed tourist destination in Fujian also draws residents from nearby areas for sightseeing and leisure travel. Tourist spots are primarily scattered along the coast of Siming District’s Huandao South Road and Jimei District’s coast, offering picturesque landscapes and a wealth of cultural experiences.
Through the above analysis, designers can better understand the interests and needs of visitors from outside the city. Consequently, in public space design, they can implement more targeted functional arrangements within districts attracting out-of-town visitors or those intended to attract such visitors in the future. This approach fosters synergistic development between Xiamen and its neighboring cities.

4.2.5. Preferred Visual Elements

In the case study, the authors obtained 82,390 check-in images within Xiamen. We categorized the collected images into four classes: outdoor spaces, portraits, food, and indoor spaces. Based on the sentiment of the corresponding posts, we filtered 20,145 images with positive emotions from the outdoor spaces category as training materials for extracting preferred visual elements. Following the analysis process described in Section 3.9, Xiamen’s top six preferred visual elements were successfully extracted. Figure 9 demonstrates the top 6 visual elements, including the percentage and the sample elements.
The top six preferred visual elements are glass walls (21.3%), mountains and seas (12.7%), urban lighting (9.5%), red roofs (9.3%), high-rise buildings (7.7%), and sky and tropical plants (6%). The extraction of these six preferred visual elements reflects the city’s distinctive charm and cultural ambience that captivates people. It unveils residents’ needs and aesthetic inclinations, offering an abundant source of reference and inspiration for urban public space design in Xiamen.

4.2.6. Overall Result Analysis

Examining these five facets provides a comprehensive guide for designing public spaces that encompasses functionality, layout, and aesthetics. This multidisciplinary strategy ensures the creation of spaces that are not only visually appealing but also cater to the community’s practical needs and preferences, ultimately enriching the user experience.
The keywords from social sentiment analysis representing people’s positive or negative sentiments reflect diverse impressions of Xiamen. These sentiments offer designers valuable insights for public space design. For instance, in answering “What functionalities should public spaces in Xiamen integrate?” designers might consider incorporating features like satay noodle restaurants, seafood spots, shopping centres, and social gathering places. When contemplating “What types of environments are most appealing?” designers could opt for scenic views and memorable places. To avoid design flaws, it is essential to steer clear of overly hot or open areas, mosquito-infested zones, inadequate or absent sidewalks, or activity areas that negatively impact local residents. The leisure activities of Xiamem can offer design inspiration for public space design. For instance, Xiamen residents prefer food districts that offer leisurely pedestrian pathways. In contrast to driving, they prefer using the subway or walking for leisure activities.
In the realm of design, practitioners can synthesize different analytical outcomes. For instance, the vibrancy heatmap illustrates Xiamen as a city of early risers and late sleepers, evidenced by a substantial volume of Weibo check-in data between 8 p.m. and midnight. The preferred visual element analysis also underscores the local affinity for bright and colorful nighttime illumination. Collectively, these insights unveil Xiamen’s enthusiasm for nightlife activities. In urban planning, this could be translated into considerations for providing citizens with nightlife amenities such as culinary streets and shopping plazas for evening entertainment.
The analytical results of the framework reveal how citizens perceive and interact with public spaces at a granular level. This is evidenced by creating a vibrancy heatmap meticulously validated across temporal (daily) and spatial (city-wide) dimensions. Furthermore, the findings indicate that check-in data mirrors and uncovers more nuanced phenomena than traditional datasets, achieving both temporal and spatial precision.
Beyond the enhanced accuracy in time and space, the framework’s methodology encompasses a broader spectrum of demographic categories and temporal scopes. This case study focuses on Weibo posts published in Xiamen from 2017 to 2022. The dataset comprises approximately 250,000 microblog entries and 5000 Points of Interest (POIs), originating from over 125,000 users. In the preliminary interviews of this study, several designers highlighted the significant time and financial costs associated with increasing the number of interviewees and diversifying their profiles. Consequently, practical constraints often necessitate reducing the number of interview participants. The broader temporal range and diverse social media data user base compensate for potential biases in the early-stage data collection for public space design.

5. Discussion

From Gehl Institute’s 12 quality criteria for public lives to the Project for Public Spaces Power of 10 theory and its placemaking process, various frameworks exist for creating and assessing public space. The primary aim of this study is to integrate the strengths of SMBD with advanced big data analytics techniques, thereby developing a comprehensive and innovative framework. This framework not only synthesizes existing methodologies but also provides urban designers with a powerful tool to capture and interpret the nuanced perceptions and interactions of citizens within public spaces. This framework represents a significant advancement in urban design methodology by offering a novel approach to navigating and interpreting the complex, multi-dimensional data derived from SMBD. Unlike traditional methods, which often suffer from time and resource constraints, this framework enables a more comprehensive and dynamic analysis of public space usage and sentiment. This is consistent with the findings of Townsend [75], who highlighted the growing importance of big data in urban planning, noting that such data can lead to more responsive and adaptive planning processes. Similarly, our framework empowers designers to extract insights into social sentiment, vibrancy, leisure activities, and preferred visual elements, which can directly inform and enhance the design process. This integration facilitates a more nuanced understanding of public space dynamics, aligning with the broader trend toward data-driven urban design.
This study continues previous research that aims to use SMBD to understand interactions in public spaces. Specifically, this study advances existing knowledge in two directions.
Firstly, this study contributes knowledge by investigating the perception and interactions of public spaces in Xiamen. The proposed methods allow designers to sample millions of opinions easily and remotely through SMBD with fewer resources over a short period. This is not easy when using traditional methods like surveys and interviews. This echoes various works [18,40,76], which demonstrated the potential of social media as a valuable tool in urban planning by providing feedback from citizens. Beyond the case study, in the practical experiences of the author’s team, this framework has already been successfully applied to public space design projects in various cities, including Qingdao, Beijing, and Wuhan, all of which have yielded promising results.
Second, this study successfully achieves its objective of presenting an analytical framework that harnesses SMBD and the essential factors for evaluating the perception and interaction within public spaces. From the literature review and interview, the study identifies five aspects to consider when evaluating perceptions and interactions within public spaces. Within the framework, SMBD are seamlessly integrated with these attributes, and viable analysis methods with detailed explanations accompany each aspect.
It is important to note that while this article employs the Weibo dataset, the framework is highly adaptable and can be applied to other similar social media datasets, such as X (formerly Twitter) or Facebook. This adaptability allows the framework to be extended to encompass the integration and analysis of multiple data sources, as suggested by recent studies in urban informatics [33,77]. This flexibility makes it possible to cross-validate findings across different platforms and contexts, enhancing the robustness and generalizability of the insights generated.
In summary, this research holds significant potential for enhancing placemaking. For instance, it can facilitate understanding citizens’ preferences, the current utilization patterns of existing public spaces, and the visually appealing elements specific to certain locations. These insights can directly inform the design of new public spaces by offering data-driven guidance on elements such as spatial layout, visual appeal, and functional zoning. Regarding existing public spaces, leveraging the data provided by SMBD allows for a deeper comprehension of citizen opinions and sentiments. This aligns with the broader trend in urban studies toward leveraging big data for more responsive and adaptive urban planning, as noted by Townsend [75] and Shelton et al. [78]. This wealth of information in urban planning, including insights into citizens’ activity zones and heat maps, can offer valuable guidance for structuring functional zones within a city.

6. Conclusions

The study developed a methodology framework to analyze the interaction with and perception of public spaces. The framework is initially defined by five key access attributes from interviews and literature reviews. The framework includes detailed instructions about using SMBD for analysis.

6.1. Limitation

Although the current study breaks new ground in several ways, we acknowledge some limitations, which should be addressed in future research.
This research provides a detailed explanation of the data and analysis methods used in the framework, making efforts to choose open-source tools to facilitate designers’ use. However, for designers lacking programming knowledge, using each tool in the framework can still be challenging. In future, there is hope to integrate the tools from the framework into a platform with an interactive graphic interface to reduce the learning curve, helping designers quickly gain design insights without spending time on programming. In addition to the data types mentioned in the text, the emergence of short video platforms such as TikTok has elevated video content to a significant form of social media data. However, this study did not incorporate video as a data source. Including user information from videos will constitute a future direction for this research. Integrating such dynamic and rich media could offer deeper insights into user behavior and preferences, enriching the study’s comprehensiveness and applicability in urban design and social space analysis.
Despite the effectiveness of SMBD as a source of social analysis, it should not be considered the sole data source for placemaking. The user demographics of social media platforms may not accurately reflect the actual population composition of a location. For example, usage data indicate that 80% of Weibo users are between the ages of 18 and 35, reflecting only a segment of the population [79]. However, for placemaking, it is essential to consider the needs and attitudes of diverse groups, including the elderly, children, and low-income populations. While Social Media Big Data (SMBD) may be more readily available in large cities or urban areas with a younger or more transient population, its applicability may be limited in smaller-scale settings such as pocket parks or town center pedestrian streets. In these cases, the potential biases in SMBD can be further magnified. Therefore, SMBD should be viewed as a supplement to, rather than a replacement for, traditional research methods. Designers should select the analysis approach that best fits the specific context, while integrating traditional methods such as surveys and field studies with SMBD where appropriate.

6.2. Future Research Direction

Although this framework involved interviews with designers during its development, it did not extensively gather feedback from designers on the final output. Future research will focus on extending the application of this framework to a more diverse group of designers for assessing its practical utility and effectiveness in real-world design scenarios. It aims to compare the pros and cons of using this framework with designers’ traditional design methods and identify areas for improvement. This comparison aims to highlight areas where the framework excels or requires refinement, thereby enhancing its overall applicability and combining the framework into the design process.
As noted in the limitations, SMBD should be considered a supplement to traditional research methods. Therefore, it is crucial to explore how SMBD can be effectively integrated with established research techniques. This will help in developing a new public placemaking design process that leverages both traditional and social media data sources.
In addition to evaluating the current capabilities of the framework, future research will investigate the incorporation of video data from emerging social media platforms such as TikTok. The growing prominence of short-form video content as a data format presents an opportunity to enrich the framework with dynamic, contextually rich information. Integrating video data could provide more nuanced insights and support for design decisions, potentially transforming how designers engage with and interpret data related to public spaces.

Author Contributions

Conceptualization: S.L.; data collection: S.L. and C.W.; data analysis: S.L., C.W., L.R. and S.Z.; results, interpretation, and visualization: S.L. and L.R.; manuscript preparation: S.L., C.W., L.R. and S.Z.; supervision: Z.W. All authors have read and agreed to the published version of the manuscript.

Funding

This research received no external funding.

Data Availability Statement

The datasets generated and/or analyzed during the current study are available from the corresponding author on reasonable request. The data are not publicly available due to privacy restrictions.

Acknowledgments

We are grateful for the support from Jingyi Yang and Yue Qi and their valuable insights and feedback during the research.

Conflicts of Interest
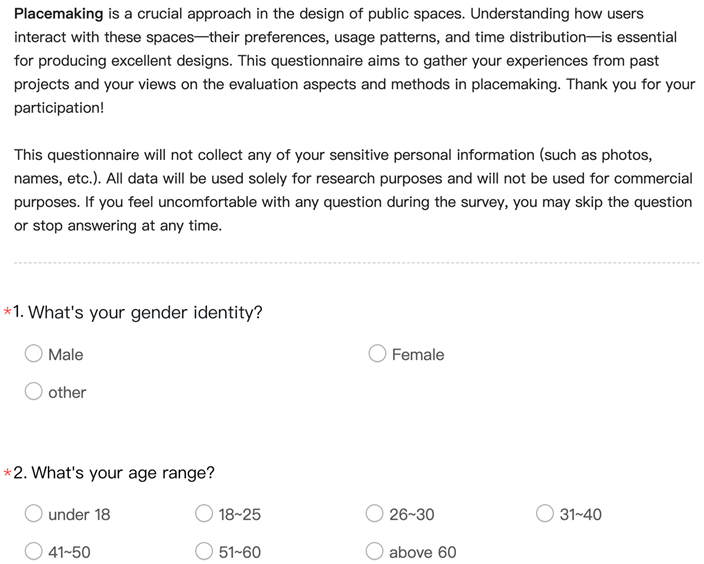
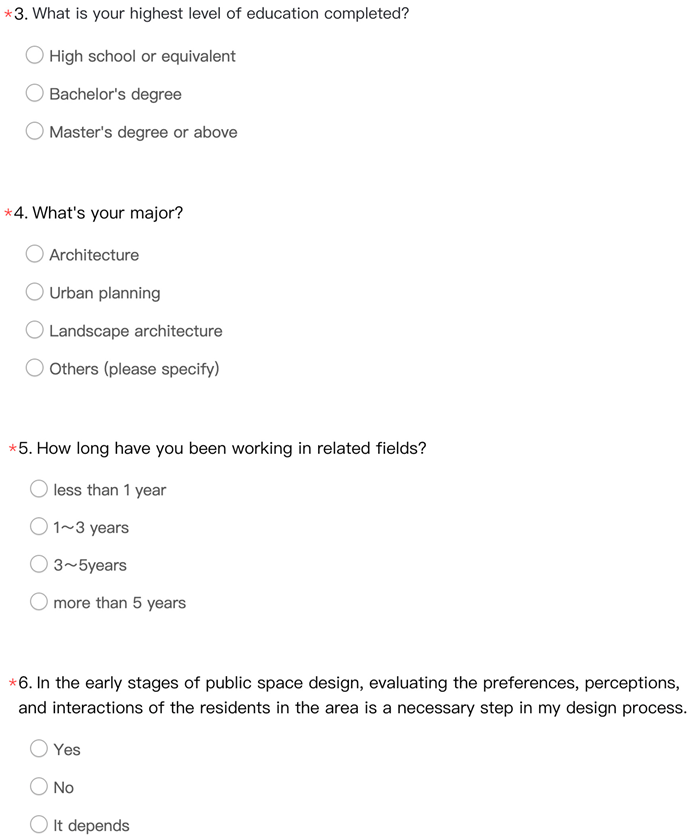
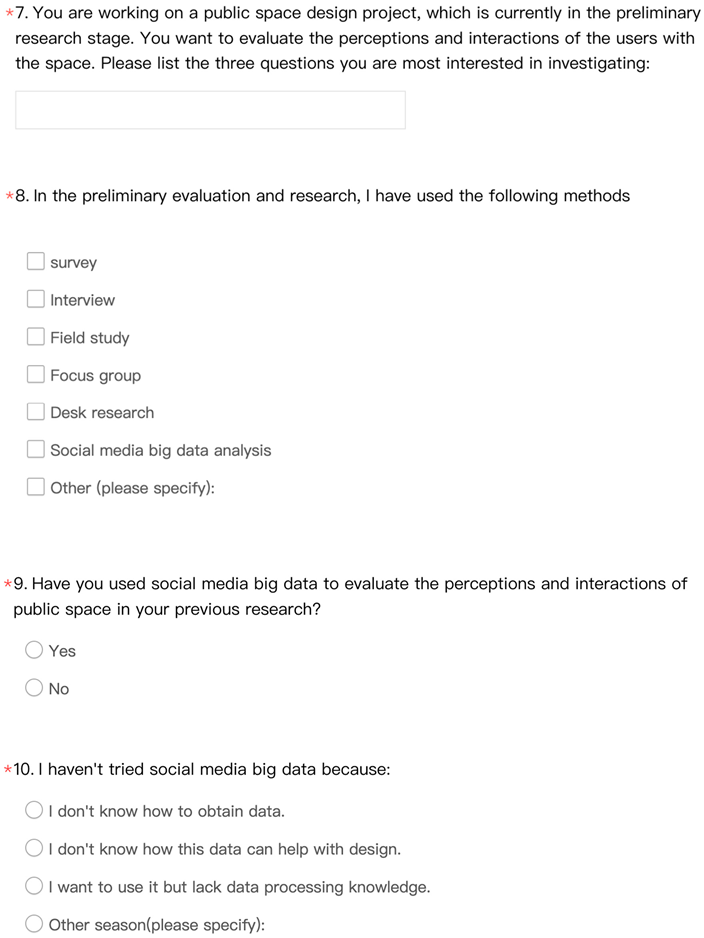
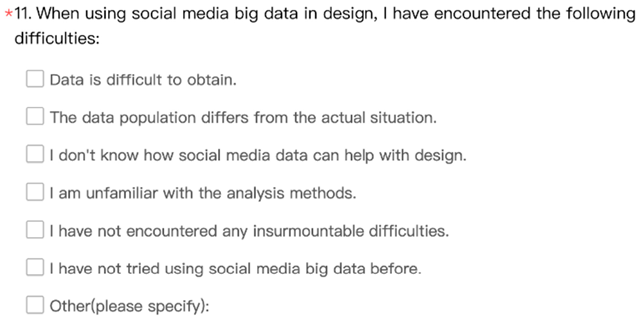
Authors Chengwei Wang and Liying Rong were employed by the company Future City (Shanghai) Design Consulting Co., Ltd. The remaining authors declare that the research was conducted in the absence of any commercial or financial relationships that could be construed as a potential conflict of interest.

Appendix A

  • Online Survey
    Land 13 01500 i001
    Land 13 01500 i002
    Land 13 01500 i003
    Land 13 01500 i004

References

  1. Wyckoff, Y.M.A. Definition of Placemaking: Four Different Types. Planning & Zoning News, 2014. Available online: https://yieldpro.com/pdf/issues/2024/4typesplacemaking_pzn_wyckoff_january2014.pdf (accessed on 1 August 2024).
  2. Cracknell, D. What Is Placemaking? Placemaking Education. Available online: https://placemaking.education/p/whatisplacemaking (accessed on 1 August 2024).
  3. Burgess, R.G. In the Field: An Introduction to Field Research; Unwin Hyman: London, UK, 2002. [Google Scholar]
  4. Marry, S.; Defrance, J. Analysis of the perception and representation of sonic public spaces through on site survey, acoustic indicators and in-depth interviews. Appl. Acoust. 2013, 74, 282–292. [Google Scholar] [CrossRef]
  5. Li, P.; Froese, T.M.; Brager, G. Post-occupancy evaluation: State-of-the-art analysis and state-of-the-practice review. Build. Environ. 2018, 133, 187–202. [Google Scholar] [CrossRef]
  6. Ren, K.; Sun, X.; Cenci, J.; Zhang, J. Assessment of public open space research hotspots, vitalities, and outlook using CiteSpace. J. Asian Archit. Build. Eng. 2023, 22, 3799–3817. [Google Scholar] [CrossRef]
  7. Rodiek, S.D.; Fried, J.T. Access to the outdoors: Using photographic comparison to assess preferences of assisted living residents. Landsc. Urban. Plan. 2005, 73, 184–199. [Google Scholar] [CrossRef]
  8. Wong, B. Top Social Media Statistics and Trends of 2023. Forbes Advisor. 2023. Available online: https://www.forbes.com/advisor/business/social-media-statistics/ (accessed on 1 August 2024).
  9. Huang, Q.; Wong, D.W.S. Modeling and Visualizing Regular Human Mobility Patterns with Uncertainty: An Example Using Twitter Data. Ann. Assoc. Am. Geogr. 2015, 105, 1179–1197. [Google Scholar] [CrossRef]
  10. Chen, T.; Hui, E.C.M.; Wu, J.; Lang, W.; Li, X. Identifying urban spatial structure and urban vibrancy in highly dense cities using georeferenced social media data. Habitat Int. 2019, 89, 102005. [Google Scholar] [CrossRef]
  11. Zhang, Y.; Li, Q.; Tu, W.; Mai, K.; Yao, Y.; Chen, Y. Functional urban land use recognition integrating multi-source geospatial data and cross-correlations. Comput. Environ. Urban Syst. 2019, 78, 101374. [Google Scholar] [CrossRef]
  12. Ardi, Z.; Putri, S.A. The analysis of the social media impact on the millennial generation behavior and social interactions. Southeast Asian J. Technol. Sci. 2020, 1, 70–77. [Google Scholar]
  13. Sun, R.; Rieble, C.; Liu, Y.; Sauter, D. Connected Despite Lockdown: The Role of Social Interactions and Social Media Use in Wellbeing. Collabra Psychol. 2022, 8, 37061. [Google Scholar] [CrossRef]
  14. Honorato, J.I.; Cypriano, L.O.; Goveia, F.; Carreira, L. Colors of the street: Color as an image visualization parameter of Twitter pictures from Brazil’s 2013 protests. CEUR Workshop Proc. 2014, 1210. [Google Scholar]
  15. Yue, L.; Chen, W.; Li, X.; Zuo, W.; Yin, M. A survey of sentiment analysis in social media. Knowl. Inf. Syst. 2019, 60, 617–663. [Google Scholar] [CrossRef]
  16. Ye, C.; Zhang, F.; Mu, L.; Gao, Y.; Liu, Y. Urban function recognition by integrating social media and street-level imagery. Environ. Plan. B Urban Anal. City Sci. 2021, 48, 1430–1444. [Google Scholar] [CrossRef]
  17. Wu, C.; Ye, X.; Ren, F.; Du, Q. Check-in behaviour and spatio-temporal vibrancy: An exploratory analysis in Shenzhen, China. Cities 2018, 77, 104–116. [Google Scholar] [CrossRef]
  18. Kim, H.J.; Chae, B.K.; Park, S.B. Exploring public space through social media: An exploratory case study on the High Line New York City. Urban Des. Int. 2018, 23, 69–85. [Google Scholar] [CrossRef]
  19. Viner, R.M.; Gireesh, A.; Stiglic, N.; Hudson, L.D.; Goddings, A.L.; Ward, J.L.; Nicholls, D.E. The role of cyberbullying, sleep and physical activity in mediating the impact of social media use on mental health and wellbeing: Findings from a national cohort of English young people. Lancet Child Adolesc. Health 2019, 3, 685–696. [Google Scholar] [CrossRef]
  20. Carmona, M. Re-theorising contemporary public space: A new narrative and a new normative. J. Urban. 2015, 8, 373–405. [Google Scholar] [CrossRef]
  21. Praliya, S.; Garg, P. Public space quality evaluation: Prerequisite for public space management. J. Public Space 2019, 4, 93–126. [Google Scholar] [CrossRef]
  22. Mehta, V. Evaluating Public Space. J. Urban Des. 2013, 19, 53–88. [Google Scholar] [CrossRef]
  23. Carmona, M. Public Places Urban Spaces: The Dimensions of Urban Design. In Public Places Urban Spaces: The Dimensions of Urban Design; Routledge: London, UK, 2021. [Google Scholar] [CrossRef]
  24. Madanipour, A.; Knierbein, S.; Degros, A. Public Space and the Challenges of Urban Transformation in Europe. In Public Space and the Challenges of Urban Transformation in Europe; Routledge: London, UK, 2013. [Google Scholar] [CrossRef]
  25. Iveson, K. Cities within the City: Do-It-Yourself Urbanism and the Right to the City. Int. J. Urban Reg. Res. 2013, 37, 941–956. [Google Scholar] [CrossRef]
  26. Low, S.; Iveson, K. Propositions for more just urban public spaces. City 2016, 20, 10–31. [Google Scholar] [CrossRef]
  27. Yavuz, N.; Welch, E.W. Addressing fear of crime in public space: Gender differences in reaction to safety measures in train transit. Urban Stud. 2010, 47, 2491–2515. [Google Scholar] [CrossRef] [PubMed]
  28. Gehl, J. Life between Buildings: Using Public Space; Danish Architectural Press: Copenhagen, Denmark, 1971. [Google Scholar]
  29. Tuncer, S.; Laurier, E.; Brown, B.; Licoppe, C. Notes on the practices and appearances of e-scooter users in public space. J. Transp. Geogr. 2020, 85, 102702. [Google Scholar] [CrossRef]
  30. Peters, K. Being together in urban parks: Connecting public space, leisure, and diversity. Leis. Sci. 2010, 32, 418–433. [Google Scholar] [CrossRef]
  31. Andargie, M.S.; Azar, E. An applied framework to evaluate the impact of indoor office environmental factors on occupants’ comfort and working conditions. Sustain. Cities Soc. 2019, 46, 101447. [Google Scholar] [CrossRef]
  32. Silva, T.H.; De Melo, P.O.S.V.; Almeida, J.M.; Salles, J.; Loureiro, A.A.F. Revealing the city that we cannot see. ACM Trans. Internet Technol. 2014, 14, 1–23. [Google Scholar] [CrossRef]
  33. Batty, M. The New Science of Cities; MIT Press: Cambridge, MA, USA, 2013. [Google Scholar] [CrossRef]
  34. Kemp, S. Digital 2024: Global Overview Report. 2024. Available online: https://datareportal.com/reports/digital-2024-global-overview-report (accessed on 1 August 2024).
  35. Carlos, M.A.; Nogueira, M.; Machado, R.J. Analysis of dengue outbreaks using big data analytics and social networks. In Proceedings of the 2017 4th International Conference on Systems and Informatics, ICSAI 2017, Hangzhou, China, 11–13 November 2017; Institute of Electrical and Electronics Engineers Inc.: Shenzhen, China, 2017; Volume 2018, pp. 1592–1597. [Google Scholar]
  36. Ghani, N.A.; Hamid, S.; Targio Hashem, I.A.; Ahmed, E. Social media big data analytics: A survey. Comput. Hum. Behav. 2019, 101, 417–428. [Google Scholar] [CrossRef]
  37. Rahman, M.S.; Reza, H. A Systematic Review Towards Big Data Analytics in Social Media. Big Data Min. Anal. 2022, 5, 228–244. [Google Scholar] [CrossRef]
  38. Mishra, G.; Rastogi, S. A Survey on Opinion Mining of Real Time Data Using Big Data Analytics. Int. J. Comput. Appl. Technol. 2016, 7, 247–252. [Google Scholar]
  39. Uma Maheswari, S.; Dhenakaran, S.S. Sentiment analysis on social media big data with multiple tweet words. Int. J. Innov. Technol. Explor. Eng. 2019, 8, 3429–3434. [Google Scholar] [CrossRef]
  40. Evans-Cowley, J.S.; Griffin, G. Microparticipation with Social Media for Community Engagement in Transportation Planning. Transp. Res. Rec. 2012, 2307, 90–98. [Google Scholar] [CrossRef]
  41. Heikinheimo, V.; Tenkanen, H.; Bergroth, C.; Järv, O.; Hiippala, T.; Toivonen, T. Understanding the use of urban green spaces from user-generated geographic information. Landsc. Urban Plan. 2020, 201, 103845. [Google Scholar] [CrossRef]
  42. Chen, D.; Long, X.; Li, Z.; Liao, C.; Xie, C.; Che, S. Exploring the determinants of urban green space utilization based on microblog check-in data in Shanghai, China. Forests 2021, 12, 1783. [Google Scholar] [CrossRef]
  43. Duan, S.; Shen, Z.; Luo, X. Exploring the Relationship between Urban Youth Sentiment and the Built Environment Using Machine Learning and Weibo Comments. Int. J. Environ. Res. Public Health 2022, 19, 4794. [Google Scholar] [CrossRef] [PubMed]
  44. Resch, B.; Summa, A.; Sagl, G.; Zeile, P.; Exner, J.P. Urban Emotions—Geo-Semantic Emotion Extraction from Technical Sensors, Human Sensors and Crowdsourced Data. In Progress in Location-Based Services 2014; Lecture Notes in Geoinformation and Cartography; Springer: New York, NY, USA, 2015. [Google Scholar] [CrossRef]
  45. De Nadai, M.; Staiano, J.; Larcher, R.; Sebe, N.; Quercia, D.; Lepri, B. The death and life of great Italian cities: A mobile phone data perspective. In Proceedings of the 25th International World Wide Web Conference, WWW 2016, Montreal, QC, Canada, 11–15 April 2016. [Google Scholar] [CrossRef]
  46. Frias-Martinez, V.; Frias-Martinez, E. Spectral clustering for sensing urban land use using Twitter activity. Eng. Appl. Artif. Intell. 2014, 35, 237–245. [Google Scholar] [CrossRef]
  47. Plunz, R.A.; Zhou, Y.; Vintimilla, M.I.C.; Mckeown, K.; Yu, T.; Uguccioni, L.; Sutto, M.P. Twitter sentiment in New York City parks as measure of well-being. Landsc. Urban Plan. 2019, 189, 235–246. [Google Scholar] [CrossRef]
  48. Du, R.; Varshney, A. Social street view: Blending immersive street views with geo-Tagged social media. In Proceedings of the 21st International Conference on Web3D Technology, Web3D 2016, Anaheim, CA, USA, 22–24 July 2016. [Google Scholar] [CrossRef]
  49. Psyllidis, A.; Yang, J.I.E.; Bozzon, A. Regionalization of Social Interactions and Points-of-Interest Location Prediction with Geosocial Data. IEEE Access 2018, 6, 34334–34353. [Google Scholar] [CrossRef]
  50. Braun, V.; Clarke, V.; Braun, V.; Clarke, V. Applied Qualitative Research in Psychology; Red Globe Press: New York, NY, USA, 2017. [Google Scholar]
  51. Tomitsch, M.; Wrigley, C.; Borthwick, M.; Ahmadpour, N.; Frawley, J.; Kocaballi, A.B.; Nunez-Pacheco, C.; Straker, K. Design. Think. Make. Break. Repeat. A Handbook of Methods; BIS Publishers: Amsterdam, The Netherlands, 2018. [Google Scholar]
  52. 2023 Top Chinese Social Media Platforms, Sites and Apps You Need to Know. Azoya, 2023. Available online: https://www.azoyagroup.com/page/view/top-chinese-social-media-platform-you-need-to-know/#_ftn1 (accessed on 1 August 2024).
  53. Ernie. Available online: https://github.com/PaddlePaddle/ERNIE (accessed on 1 August 2024).
  54. SnowNLP. Available online: https://github.com/isnowfy/snownlp (accessed on 1 August 2024).
  55. Guo, Y.; Barnes, S.J.; Jia, Q. Mining meaning from online ratings and reviews: Tourist satisfaction analysis using latent Dirichlet allocation. Tour. Manag. 2017, 59, 467–483. [Google Scholar] [CrossRef]
  56. Synonyms. Available online: https://www.chinese-tools.com/tools/synonyms.html (accessed on 1 August 2024).
  57. GooSeeker. Available online: https://www.gooseeker.com/ (accessed on 1 August 2024).
  58. Bailey, T.C.; Gatrell, A.C. Interactive Spatial Data Analysis; Longman Scientific & Technical: Essex, UK, 1995. [Google Scholar]
  59. Lynch, K. The Image of the City; MIT Press: Cambridge, MA, USA, 1960. [Google Scholar]
  60. Veal, A.J. The Serious Leisure Perspective and the Experience of Leisure. Leis. Sci. 2017, 39, 205–223. [Google Scholar] [CrossRef]
  61. Wang, R.; Yang, B.; Yao, Y.; Bloom, M.S.; Feng, Z.; Yuan, Y.; Zhang, J.; Liu, P.; Wu, W.; Lu, Y.; et al. Residential greenness, air pollution and psychological well-being among urban residents in Guangzhou, China. Sci. Total Environ. 2020, 711, 134843. [Google Scholar] [CrossRef]
  62. Cohen, D.A.; Han, B.; Derose, K.P.; Williamson, S.; Marsh, T.; Raaen, L.; McKenzie, T.L. The Paradox of Parks in Low-Income Areas: Park Use and Perceived Threats. Environ. Behav. 2016, 48, 230–245. [Google Scholar] [CrossRef]
  63. John, M. Making a City: Urbanity, Vitality and Urban Design. J. Urban Des. 1998, 3, 93–116. [Google Scholar]
  64. Jacobs, J. The Death and Life of Great American Cities; Vintage: New York, NY, USA, 1961. [Google Scholar]
  65. Shokry, G.; Connolly, J.J.; Anguelovski, I. Understanding climate gentrification and shifting landscapes of protection and vulnerability in green resilient Philadelphia. Urban Clim. 2020, 31, 100539. [Google Scholar] [CrossRef]
  66. Yin, L.; Cheng, Q.; Wang, Z.; Shao, Z. ‘Big data’ for pedestrian volume: Exploring the use of Google Street View images for pedestrian counts. Appl. Geogr. 2015, 63, 337–345. [Google Scholar] [CrossRef]
  67. Barreca, A.; Curto, R.; Rolando, D. Urban vibrancy: An emerging factor that spatially influences the real estate market. Sustainability 2020, 12, 346. [Google Scholar] [CrossRef]
  68. Wang, K.Y. Sustainable Tourism Development Based upon Visitors’ Brand Trust: A Case of “100 Religious Attractions”. Sustainability 2022, 14, 1977. [Google Scholar] [CrossRef]
  69. Edwards, D.; Griffin, T.; Hayllar, B. Urban Tourism Research. Developing an Agenda. Ann. Tour. Res. 2008, 35, 1032–1052. [Google Scholar] [CrossRef]
  70. Timur, S.; Getz, D. Sustainable tourism development: How do destination stakeholders perceive sustainable urban tourism? Sustain. Dev. 2009, 17, 220–232. [Google Scholar] [CrossRef]
  71. Geng, Z.; Le, W.; Guo, B.; Yin, H. Analysis of factors affecting visual comfort in hotel lobby. PLoS ONE 2023, 18, e0280398. [Google Scholar] [CrossRef]
  72. Lin, W.; Chen, Q.; Jiang, M.; Zhang, X.; Liu, Z.; Tao, J.; Wu, L.; Xu, S.; Kang, Y.; Zeng, Q. The effect of green space behaviour and per capita area in small urban green spaces on psychophysiological responses. Landsc. Urban Plan. 2019, 192, 103637. [Google Scholar]
  73. Brady, E.; Prior, J. Environmental aesthetics: A synthetic review. People Nat. 2020, 2, 254–266. [Google Scholar] [CrossRef]
  74. Qi, J.; Mazumdar, S.; Vasconcelos, A.C. Understanding the Relationship between Urban Public Space and Social Cohesion: A Systematic Review. Int. J. Community Well-Being 2024, 7, 155–212. [Google Scholar] [CrossRef]
  75. Townsend, A.M. Smart Cities: Big Data, Civic Hackers, and the Quest for a New Utopia; W. W. Norton & Company: New York, NY, USA, 2014. [Google Scholar] [CrossRef]
  76. Fernandez, J.; Song, Y.; Padua, M.; Liu, P. A Framework for Urban Parks: Using Social Media Data to Assess Bryant Park, New York. Landsc. J. 2022, 41, 15–29. [Google Scholar] [CrossRef]
  77. Martini, B. The Data Revolution. Big Data, Open Data, Data Infrastructures and Their Consequences. Reg. Stud. 2016, 50, 553–554. [Google Scholar] [CrossRef]
  78. Shelton, T.; Zook, M.; Wiig, A. The ‘actually existing smart city’. Camb. J. Reg. Econ. Soc. 2015, 8, 13–25. [Google Scholar] [CrossRef]
  79. Sina Finance. Weibo User Development Report. Available online: https://finance.sina.cn/tech/2021-03-12/detail-ikkntiak9143019.d.html?fromtech=1 (accessed on 1 August 2024).
Figure 1. Research Scheme.
Land 13 01500 g001
Figure 2. The framework of the study.
Land 13 01500 g002
Figure 3. Case study area.
Land 13 01500 g003
Figure 4. The social sentiment analysis diagram.
Land 13 01500 g004
Figure 5. The working flow for preferred visual elements analysis.
Land 13 01500 g005
Figure 6. Leisure Activities in Xiamen.
Land 13 01500 g006
Figure 7. Temporal Vibrancy Heat Map of Study Area.
Land 13 01500 g007
Figure 8. Activities of people from Zhangzhou and Quanzhou.
Land 13 01500 g008
Figure 9. Top 6 preferred visual elements of Xiamen.
Land 13 01500 g009
Table 1. Summary information of the participants.
Participant
Number
AgeEducationProfessional
Role
Professional Experience
No. 137Landscape
Architecture
Landscape
Architect
7 years
No. 227ArchitectureArchitect3 years
No. 330Urban PlanningUrban Planner4 years
No. 431Urban PlanningUrban Planner6 years
No. 527Urban PlanningUrban Planner4 years
No. 636Urban PlanningUrban Planner10 years
Table 2. Data attribute and proxy from mainstream social media platforms, Weibo.
Type of VariableAttributeProxy
TemporalDateThe date of posting (Year/Month/Day).
TimeThe time of posting.
Socio-demographicGenderThe gender of the user.
AgeThe age of the user.
Place of ResidenceThe geographical location where the user registered.
PostTextThe textual content of the posts.
PhotoThe photo of the posts.
SpatialPoints of InterestsThe location-based Points of Interest associated with the posts.
Longitude The longitude coordinates are associated with the posts.
LatitudeThe latitude coordinates are associated with the posts.
Table 3. Identify the emotional tendency of the posts.
SentimentText
Positive“Lifting my head, I see the dappled shadow of the sun weaving through the tree canopy”.
“Craving for satay noodles!”
Negative“It’s TOOOOOOO hot!!”
“I hate the traffic at the Xiang’an South Road”.
Table 4. A snapshot of the sentiment-labeled data corpus.
Pivotal TopicsSubtopicsText Example
Gourmet
(Positive)
Satay noodles“It’s brimming with the flavours of childhood”.
Seafood“The right way to enjoy summer is at Xiamen’s seafood market”.
Travel
(Positive)
Scenery“Every street and alley in Xiamen is a picture”.
Record“Capturing the beauty of life is a beautiful thing in itself”.
Check-in“Checking in the new recommended delicacies from social media influencers”!
Business
(Positive)
Plaza“Xiamen is evolving into a fashionable and creative urban hub, leaving a different impression with every visit”.
City“Xiamen is the city filled with the spirit of cultural creativity”.
Communication“I will visit Xiamen more often for business collaborations”!
Weather
(Negative)
Hot“The temperature on the beach could probably roast potatoes”!
Summer“Summer can be a frustrating season with its heat and humidity”.
Mosquito“So many mosquitoes, and the weather is scorching hot”!
Transportation
(Negative)
pedestrian walkways“Why isn’t there a sidewalk for such a beautiful view”?
City Management
(Negative)
Disturbance“The road next to my home was under construction forever”.
Disclaimer/Publisher’s Note: The statements, opinions and data contained in all publications are solely those of the individual author(s) and contributor(s) and not of MDPI and/or the editor(s). MDPI and/or the editor(s) disclaim responsibility for any injury to people or property resulting from any ideas, methods, instructions or products referred to in the content.

