Abstract
Enhancing regional ecosystem stability and managing land resources effectively requires identifying ecological function zones and understanding the factors that influence them. However, most current studies have primarily focused on ecosystem service bundles, paying less attention to the trade-offs, synergies, and ecological sensitivity, leading to a more uniform approach to functional zoning. This study aimed to analyze and describe the spatial and temporal patterns of four essential ecosystem services, including water yield (WY), net primary productivity (NPP), soil conservation (SC), and habitat quality (HQ), in the Sichuan-Yunnan ecological buffer area over the period from 2005 to 2019. Spatial overlay analysis was used to assess ecological sensitivity, trade-offs, synergies, and ecosystem service bundles to define ecological functional zones. Geographic detectors were then applied to identify the primary drivers of spatial variation in these zones. The findings showed a progressive improvement in ecosystem service functions within the Sichuan-Yunnan ecological buffer zone. Between 2005 and 2019, NPP, soil conservation, and water yield all demonstrated positive trends, while HQ displayed a declining trend. There was significant spatial heterogeneity and distinct regional patterns in ecosystem service functions, with a general decrease from southwest to northeast, particularly in NPP and HQ. Trade-offs were evident in most ecosystem services, with the most significant between WY and HQ and most in the northeast and east regions. Ecological sensitivity decreased from southwest to northeast. Regions with a higher ecological sensitivity were primarily situated in the southwestern region, and their spatial distribution pattern was comparable to that of high habitat quality. The spatial overlay analysis categorized areas into various types, including human production and settlement zones, ecologically vulnerable zones, ecological transition zones, and ecological conservation zones, accounting for 17.28%, 22.30%, 7.41%, and 53.01% of the total area, respectively. The primary environmental factor affecting ecological function zoning was identified as precipitation, while the main social variables were human activity and population density. This study enhances the understanding of ecological functions and supports sustainable development in the Sichuan-Yunnan ecological buffer area, offering important guidance for ecological zoning.
1. Introduction
Ecosystem services provide essential benefits to humans, both directly and indirectly [1,2,3]. However, the accelerated pace of global economic growth and unsustainable land use practices have exacerbated environmental challenges, intensifying the degradation of already vulnerable ecosystems [4]. The Chinese government has addressed these increasing environmental concerns by advancing sustainable development and refining spatial governance and planning. These efforts focus on conserving the environment and preserving natural ecosystems [5]. Therefore, effective assessment and management of ecosystem services are crucial for sustainable development. Implementing ecological functional zoning can help mitigate regional conflicts and address resource and environmental challenges effectively [6,7]. The ecological spatial differentiation principles served as the foundation for the regional-level geographical segmentation of ecological functions, which is crucial for the development of ecosystem policy and management. In 1976, American ecologist Bailey assessed global research and proposed a comprehensive ecological zoning scheme focused on ecosystems [8]. The United States Environmental Protection Agency (USEPA) established specific terminology for various levels of ecological zoning [9]. Research on ecological zoning has increased globally [10,11,12], leading to significant progress in both theoretical and methodological aspects of the field [13,14,15]. A framework for ecological zoning in China has been proposed, thereby establishing a robust foundation for future national-scale implementation [16,17,18]. Furthermore, numerous studies on ecological function zoning have provided significant findings [19,20,21]. The frameworks and methods for ecological functional zoning vary considerably, reflecting the diverse management objectives for ecosystems. Recent research on ecological zoning at the county and watershed levels, as well as in mountainous regions, has increasingly employed spatial overlay techniques [22,23,24,25]. Methodologically, various techniques have been employed, including self-organizing maps (SOM) [26], hierarchical analysis, partitioning around medoids (PAM), and K-means clustering [27]. The primary approaches to ecological zoning in current studies are as follows: (1) zoning based on ecological risk, ecosystem services, and ecosystem sensitivity [28,29,30,31]; (2) analysis of supply–demand relationships in ecosystem services [32]; and (3) classification based on ecosystem service indicators, ecological connectivity, and ecosystem service bundling [33,34]. However, there is limited research focusing on ecosystem service zoning in unique geological and geomorphological contexts, such as those found in the Sichuan-Yunnan Ecological Buffer Area. Addressing this gap could offer valuable insights into the management of such distinctive terrains.
The core objective of ecological function zoning is to balance social development with ecological protection, enhancing the management and efficiency of regional ecosystems. Therefore, determining the most effective and scientifically grounded approach to spatially aggregate and implement these zones is a critical and urgent issue. In summary, recent research on functional zoning has primarily focused on characterizing ecosystem services within specific study areas, often neglecting spatial variability in ecosystem types, the natural environment, and the effects of disruptive elements [35]. Improving the scientific basis for functional area classification is crucial. Ecological sensitivity measures the likelihood and severity of environmental issues arising from external disturbances in a region’s natural environment under particular conditions. Generally, greater ecological sensitivity indicates increased vulnerability to external disturbances. It serves as a crucial basis for ecological functional zoning, providing a valuable indicator of potential regional ecological challenges. Recent studies on functional zoning have integrated ecosystem services and ecological sensitivity, highlighting the comprehensive role of ecosystem services in effective zoning practices [36,37]. However, these studies frequently neglect the spatial variability of these services, resulting in a lack of sufficient rationality. By identifying ecosystem service trade-offs and synergies, decision-makers can better manage regional ecosystem services, minimize conflicts, and enhance synergies, ultimately improving human well-being. Integrating ecological sensitivity with ecosystem service trade-offs and synergies is crucial for enhancing the scientific validity and rationality of zoning outcomes. Functional zoning should prioritize the key regional ecosystem services while taking into account the current ecological and environmental conditions. This approach allows for the identification of the main factors influencing spatial patterns in each ecological function, thus providing essential indicators for regional environmental remediation and spatial planning. For example, an ecological security zoning plan for China’s natural resources was developed using the Self-Organizing Feature Map (SOFM) network [38]. The plan identified twenty-seven second-level zones and eight first-level zones. However, most previous studies have concentrated on zoning outcomes, often overlooking the key driving factors behind these divisions [39,40]. The primary research methods used to investigate driving mechanisms included the geographical detector (Geo-Detector) [41], partial least squares structural equation modeling (PLS-SEM) [42], ordinary least squares (OLS) [43], and geographically weighted regression (GWR) [44]. Geoprobe techniques are considerably more effective than other methods for analyzing the factors influencing these systems, leading to enhanced detection and interpretation of their interactions [45]. Therefore, regional ecological environment planning and development can greatly benefit from quantitative assessments of the impact of various driving forces on ecological functional regions using a geo-detector.
The Sichuan-Yunnan ecological buffer zone, referred to as the “ecological buffer area” in this study, plays a crucial role in the “Overall Plan for National Important Ecological Protection and Restoration of Major Projects (2021–2035)” [46]. This plan signifies “three zones and four belts”, with the ecological buffer area being pivotal in establishing ecological security buffer zones, specifically in the Western Plateau, the Yangtze River Basin, and the Pearl River Basin. The strategic importance of these buffer zones in maintaining ecological security on regional, national, and global levels highlights their value. However, unsustainable human development and accelerating urbanization are intensifying various ecological challenges within these buffer zones, thereby undermining their effectiveness. These challenges include severe soil erosion, which compromises the ecological stability of the middle and lower Yangtze Rivers, as well as a decline in biodiversity due to inadequate grazing management [47]. Therefore, scientifically zoning the study area is essential for promoting sustainable regional development. This study aimed to analyze the spatiotemporal changes in various ecosystem services in the Sichuan-Yunnan ecological buffer area from 2005 to 2019, taking into account ecosystem service trade-offs and synergies with ecological sensitivity to delineate ecological functional zones. Specifically, the study aimed to (1) characterize the spatiotemporal variations in four key ecosystem services including WY, NPP, SC, and HQ; (2) use the SOM methodology to identify clusters of these ecosystem services; and (3) integrate ecosystem service trade-offs and synergies with ecological sensitivity to delineate ecological functional zones and pinpoint key factors affecting each zone. The results provide essential guidance for ecological conservation and land management in the ecological buffer area.
2. Materials and Methods
2.1. Overview of the Study Area
The Sichuan-Yunnan ecological buffer zone, located between 26°32′−34°19′ N and 98°03′–104°58′ E, includes 76 and 17 counties in Sichuan Province and Yunnan Province, respectively, covering an area of 236,700 km2 (Figure 1). The area is situated within a subtropical monsoon climate zone, experiencing annual rainfall ranging from 500 to 1400 mm and significant variations in average temperatures, which exceed 20 °C. The landscape of the study area is fragmented and ecologically sensitive, marked by substantial elevation differences and complex topography, serving as a geographical transition zone. The region is significant due to its intricate river system, characterized by dendritic and feathery spatial patterns. This system includes prominent rivers such as the Jinsha, Yalong, Dadu, and Minjiang rivers. The temperate climate of the plateau mountains in the zone is primarily driven by the cool temperate monsoon conditions characteristic of these elevations [48]. In recent years, the ecological sensitivity and complexity of the Sichuan-Yunnan ecological buffer zone have increased due to growing human activities and unusual climate variations, leading to intensified ecological and environmental concerns.
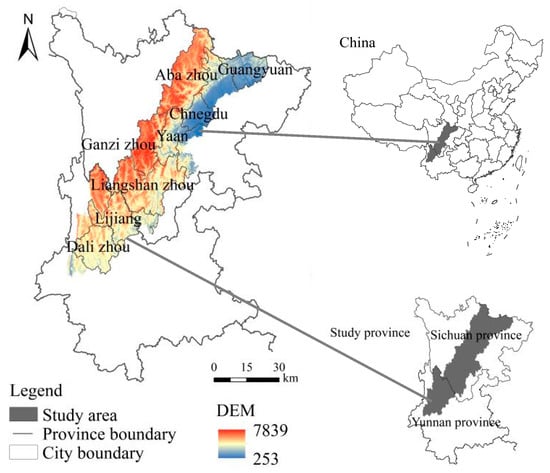
Figure 1.
Study area.
2.2. Data Sources and Processing
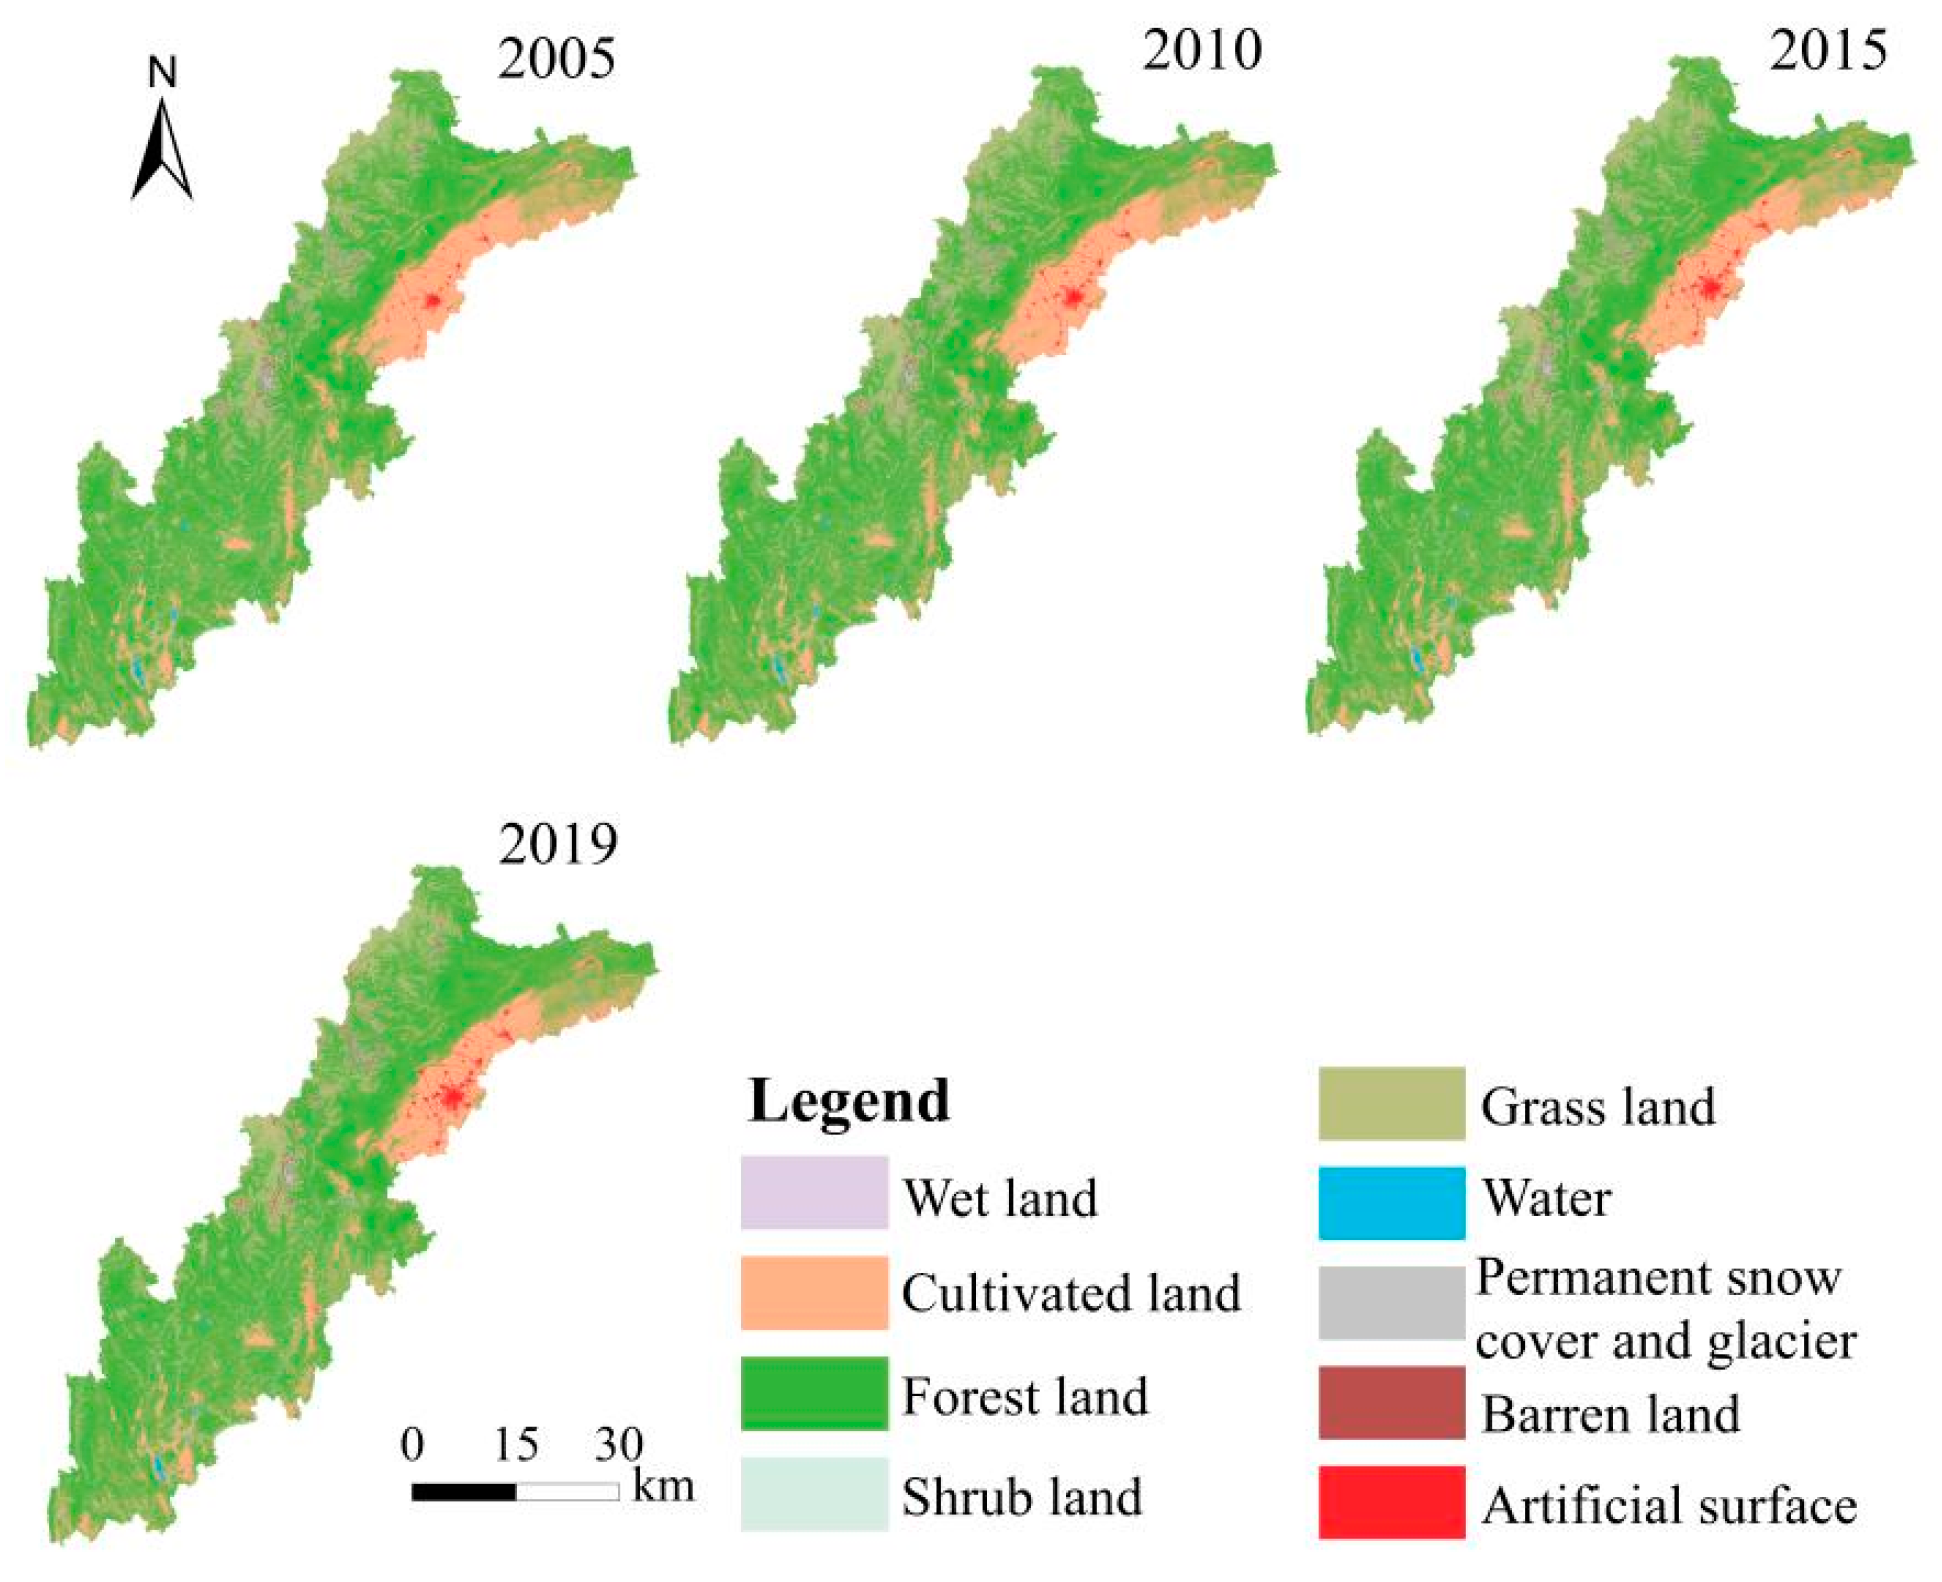
The names, formats, and origins of the data used in the current study are summarized in Table 1. A total of nine categories were established for land use (Figure 2). The Revised Universal Soil Loss Equation was implemented to assess SC, taking into account soil erodibility factors and land use data. The InVEST and CASA models have been extensively adopted for the evaluation of ecosystem services because of their global applicability, low data demands, and minimal parameter requirements. Incorporating rainfall and land use data, the InVEST model was implemented to compute WY and HQ. The CASA model was employed to estimate NPP, incorporating land use and solar radiation data. All data were standardized to 1 km × 1 km grids to ensure consistency in the analysis.

Table 1.
Description and sources of data.

Figure 2.
Land cover type.
2.3. Methodology
2.3.1. Research Framework
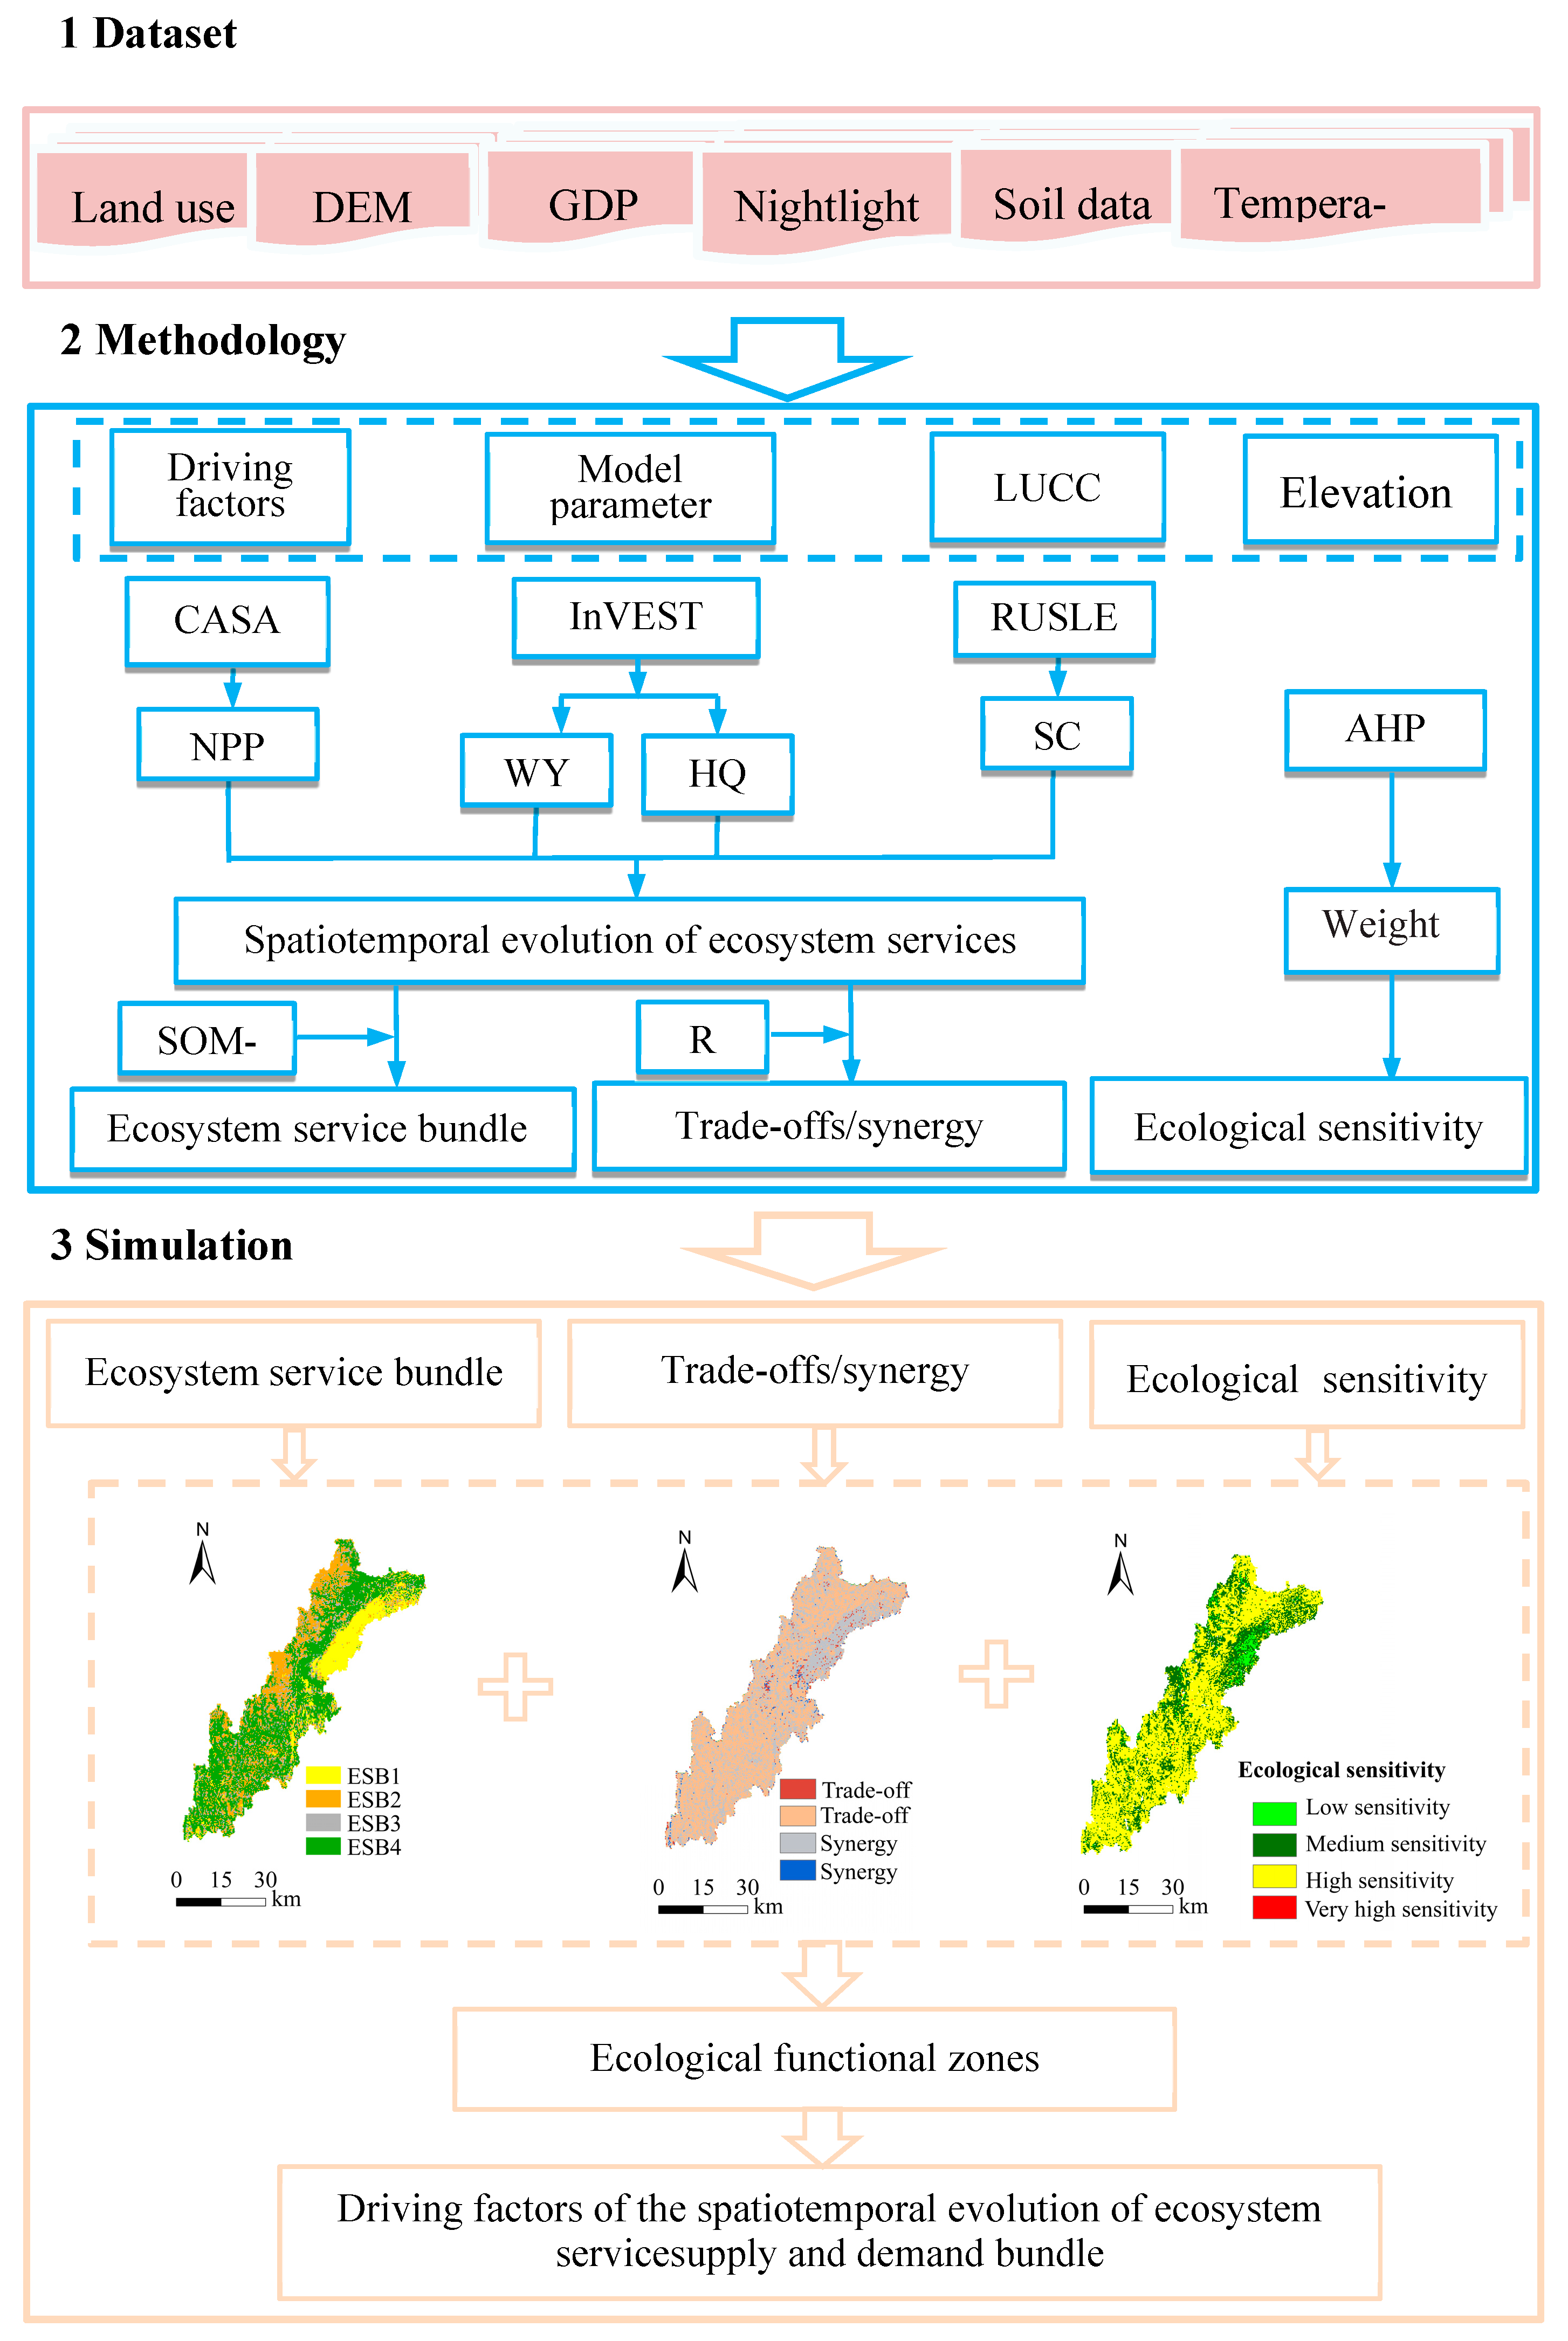
In this study, ecological sensitivity and ecosystem service bundles were spatially mapped to define ecological functional areas. Geo-detectors were used to identify the primary factors driving spatial differentiation within these areas. Figure 3 illustrates the comprehensive research framework, comprised of four key steps: (1) quantitatively evaluating the values of the four principal ecosystem services, including WY, NPP, SC, and HQ from 2005 to 2019; (2) analyzing the spatio-temporal patterns of each ecosystem service, including their trade-offs and synergies; (3) using R to examine these trade-offs and synergies and integrating the findings with spatial analyses of ecosystem services to guide the delineation of ecological functional zones; and (4) applying geo-detectors to identify the dominant factors influencing each ecological functional zone (Figure 3).
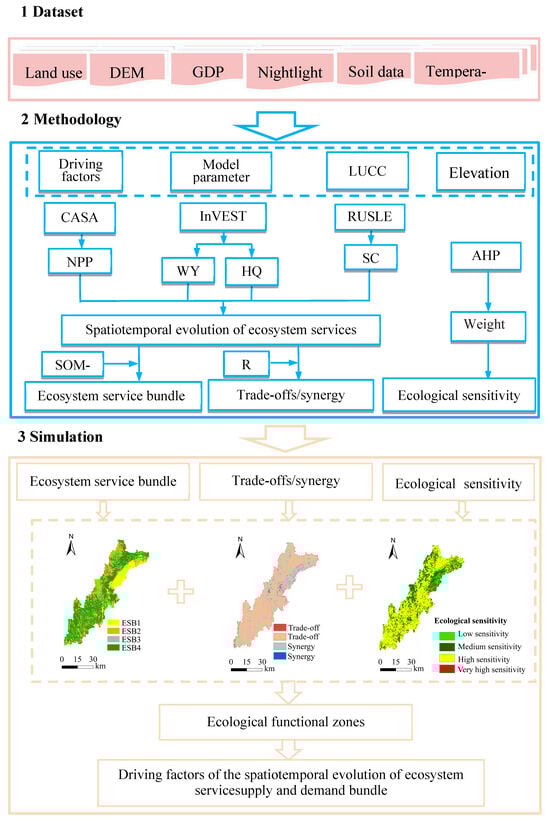
Figure 3.
Research framework. (AHP: the analytical hierarchy process; R: R language; GDP: gross domestic product).
2.3.2. Estimation of Ecosystem Services
The current study integrated the results of previous significant research and considered the inherent ecosystem vulnerabilities, following the ecosystem service classification framework established by the Millennium Ecosystem Assessment (MA) [49,50,51]. The CASA, RUSLE, and InVEST models were used for the evaluation of four ecosystem services: WY, NPP, SC, and HQ. Soil erosion in the research region affects water supplies, downstream water quality, and agriculture. WY and SC are considered crucial for regional production and livelihoods. NPP plays a fundamental role in regional material and energy cycles, significantly enhancing the regional environment [11]. HQ represents support services, taking into account the negative effects of deforestation and habitat destruction on ecosystems, biodiversity, habitat quality, and species survival.
(1) Vegetation net primary productivity
The Carnegie–Ames–Stanford Approach (CASA) model represents efficiency of light use and integrates various variables, including normalized difference vegetation index (NDVI), precipitation, temperature, and solar radiation. The CASA also uses parameters derived from remote sensing inversion. The present study employed the CASA model to estimate NPP. The carbon sequestration capacity of the ecosystem was then estimated by using NPP to calculate carbon sequestration [52]:
where APAR(x,t) represents the quantity of photosynthetically active radiation absorbed by pixel x in month t (MJ/m2) and ε(x,t) is the actual rate of light energy utilization of pixel x in month t (gC/m2).
(2) The water yield function was measured through an assessment of the water conservation function of the ecosystem using the precipitation storage method. Water supply was estimated according to the water balance, where water supply equates to the rainfall of a specific grid cell after subtracting actual evapotranspiration. The water supply considers surface runoff, soil water content, litter water holding capacity, and canopy interception [53]:
In the formula, Y(x) represents the water production on pixel x (mm); AET(x) is the actual evapotranspiration on pixel x (mm); P(x) denotes the average annual rainfall on pixel x (mm).
(3) Habitat quality accounting
The InVEST model evaluates habitat quality to provide an assessment of the current state of biodiversity. The habitat quality module calculates the indices of habitat degradation and habitat quality according to the sensitivity of different land use or habitat types to threat factors and the intensity of external threats. This calculation considers various factors, including the distances over which threat factors have an impact and spatial weights. The level of biodiversity is then represented by the quality and scarcity of habitats, with a positive correlation between habitat quality and biodiversity [54]:
where Qxj is the habitat quality of land use type j at raster unit x; Dxj denotes the score for the habitat type associated with land use type j; K2 indicates the habitat stress level.
(4) Soil conservation accounting
The Revised Universal Soil Loss Equation (RUSLE) is a pixel-scale universal soil loss equation that is widely used to assess potential soil loss under different land use/cover types in the absence of vegetation cover. The soil conservation function is inversely proportional to the quantity of soil loss [55]:
where SC denotes the soil retention capacity (t·hm−2·a−1); R is the rainfall erodibility factor (MJ·mm·hm−2·h−1·a−1); K represents the soil erodibility factor (t·ha·h·ha−1·MJ−1·mm−1); L and S are slope length and slope factors, respectively; C and P represent the vegetation coverage factor and the soil and water conservation factor, respectively.
2.3.3. Synergy of Spatial Trade-Offs in Ecosystem Services
In the current study, the four ecosystem services were first standardized, and their interrelationships were then analyzed using the R ‘corrplot’ package. Spatial mapping was employed to better understand the relationships between these services [56]. Statistically significant negative and positive correlation coefficients between any two services (p < 0.05) indicated significant trade-offs and synergistic interaction among the services, respectively [57]. Using the natural fracture classification (Jenks) approach, the aforementioned findings were further classified into four levels: strong trade-off, weak trade-off, strong synergy, and weak synergy. The spatial superposition method was used to accomplish comprehensive synergy in the trade-off of ecosystem services [58].
2.3.4. Selection and Grading of Ecological Sensitivity Evaluation Factors
This research selected four sensitivity indicators to assess the level of ecological sensitivity. Considering findings from previous research and the ecological characteristics of the area, the geomorphology of the study region was predominantly characterized by alpine valleys and plateaus, playing a crucial role as a water source and ecological barrier in the Yangtze River Basin. Therefore, elevation, slope, aspect, and water buffer zones were selected as key indicators. Furthermore, due to significant ecological degradation, including grassland ecosystem deterioration and localized soil erosion, vegetation cover was selected as an indicator [59,60]. The indicators used were as follows: (1) elevation; (2) normalized difference vegetation index; (3) slope; (4) slope orientation; and (5) water area buffer. Given that ecosystem evaluation incorporates subjective and objective features, the present study applied an integrated subjective–objective Analytic Hierarchy Process (AHP) to determine the weights of various indicators. The AHP proposed by Professor Saaty integrates qualitative and quantitative approaches and applies an assessment matrix to determine the relative importance of each factor [61]. This relative importance of each factor is translated into a factor weight, and these weights are used within the quantification of subjective decisions involving the factors. The analytical hierarchy process (AHP) was used to ascertain the effect of the weights of these indicators:
where Z represents the sensitivity index of the evaluation indicator; Wi denotes the comprehensive weight of the i-th indicator, and Li assigns a value to the sensitivity level of the i-th indicator. The natural discontinuity method in ArcGIS was used to classify the sensitivity of each factor into four levels (Table 2). Afterwards, the weights were calculated to ascertain the total ecological sensitivity of the study area.
Table 2.
Evaluation factors and grading standards of ecological sensitivity.
2.3.5. Functional Partitioning of Ecosystem Services
Initially, the present study conducted a thorough examination of the ecological spatial characteristics and cell size of the study area, ultimately selecting a 1 km × 1 km grid cell as optimal. After that, the data associated with the four ecosystem services were standardized to eliminate dimensional differences. The data analysis was conducted using a SOM, and stable clustering results were obtained after multiple iterations of training. SOM is an unsupervised learning technique. It creates a network model that captures similar associations between data points by mapping high-dimensional datasets to a lower-dimensional space. This model automatically preserves the topology of the dataset during the bottom-up clustering process. Furthermore, it reveals the contribution of input indicators in determining cluster types, based on the vector characteristics of the winning nodes [28,62,63]. Therefore, this study used SOM to determine the optimal number of clusters for ecosystem services. These service clusters were then spatially overlaid with ecological sensitivity using ArcGIS. The ecological buffer area was classified into four distinct ecological functional zones based on the ecological sensitivity levels and the functional structural characteristics of the ecosystem service bundles.
2.3.6. Driver Identification
In the ecological buffer area, the study identified eight indicators across five categories, including land use, topography, and human activities, for driving factor analysis. The natural breakpoint method was used to classify various natural and socioeconomic driving factors. Furthermore, the factor detection module of the geographical detector was employed to assess the impact of each factor on the ecological function zoning pattern.
3. Results
3.1. Temporal Changes in Ecosystem Services in the Buffer Area
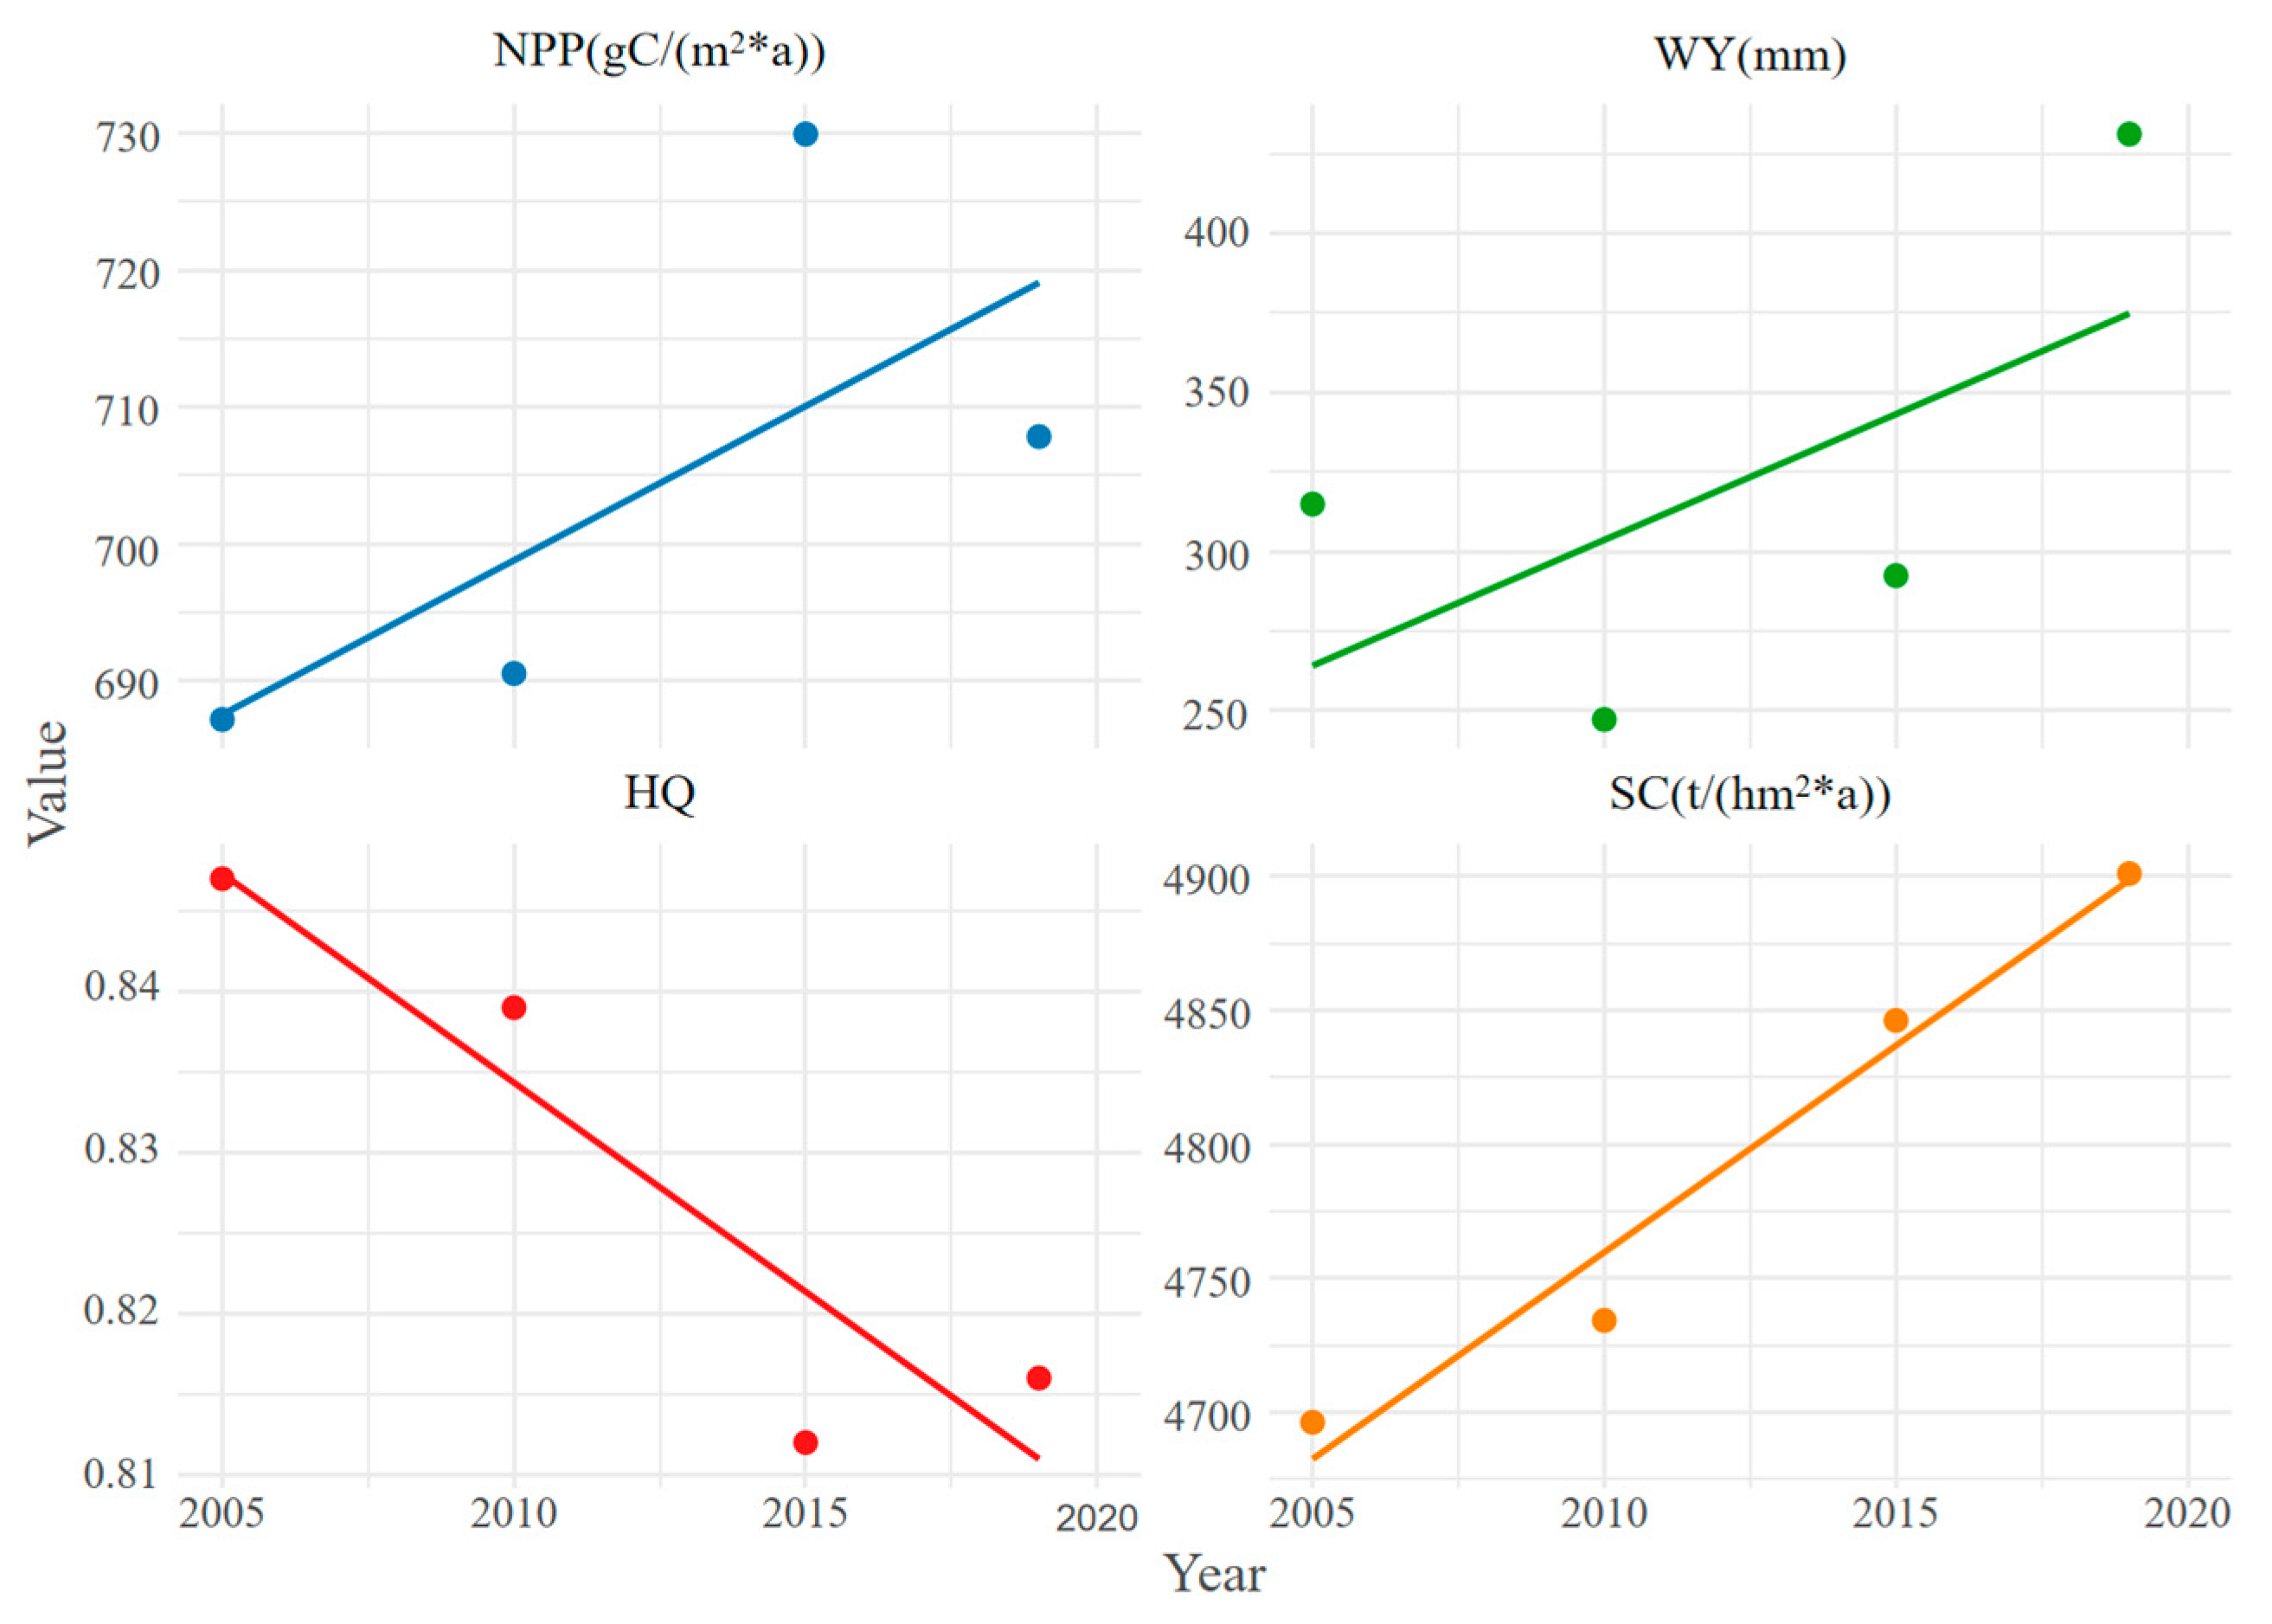
NPP showed a typically increasing trend from 2005 to 2019, with periods of both initial increases followed by subsequent decreases. However, habitat quality services showed an overall downward trend with small fluctuations. Water production services initially decreased before increasing, with a significant change occurring between 2015 and 2019. Conversely, soil conservation services showed a consistent increasing trend. Overall, the annual average values of most ecosystem services increased from 2005 to 2019, except for habitat quality services, showing a decrease in their annual average value (Figure 4).
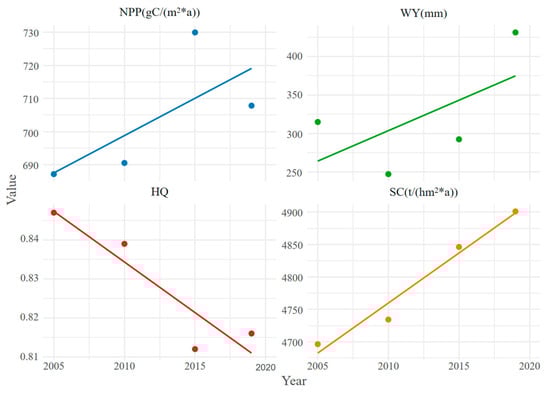
Figure 4.
The annual average value of four ecosystem services in the ecological conservation area of Sichuan-Yunnan provinces from 2005 to 2019. (HQ: habitat quality).
3.2. Changes in Spatial Patterns of Ecosystem Services in Buffer Areas
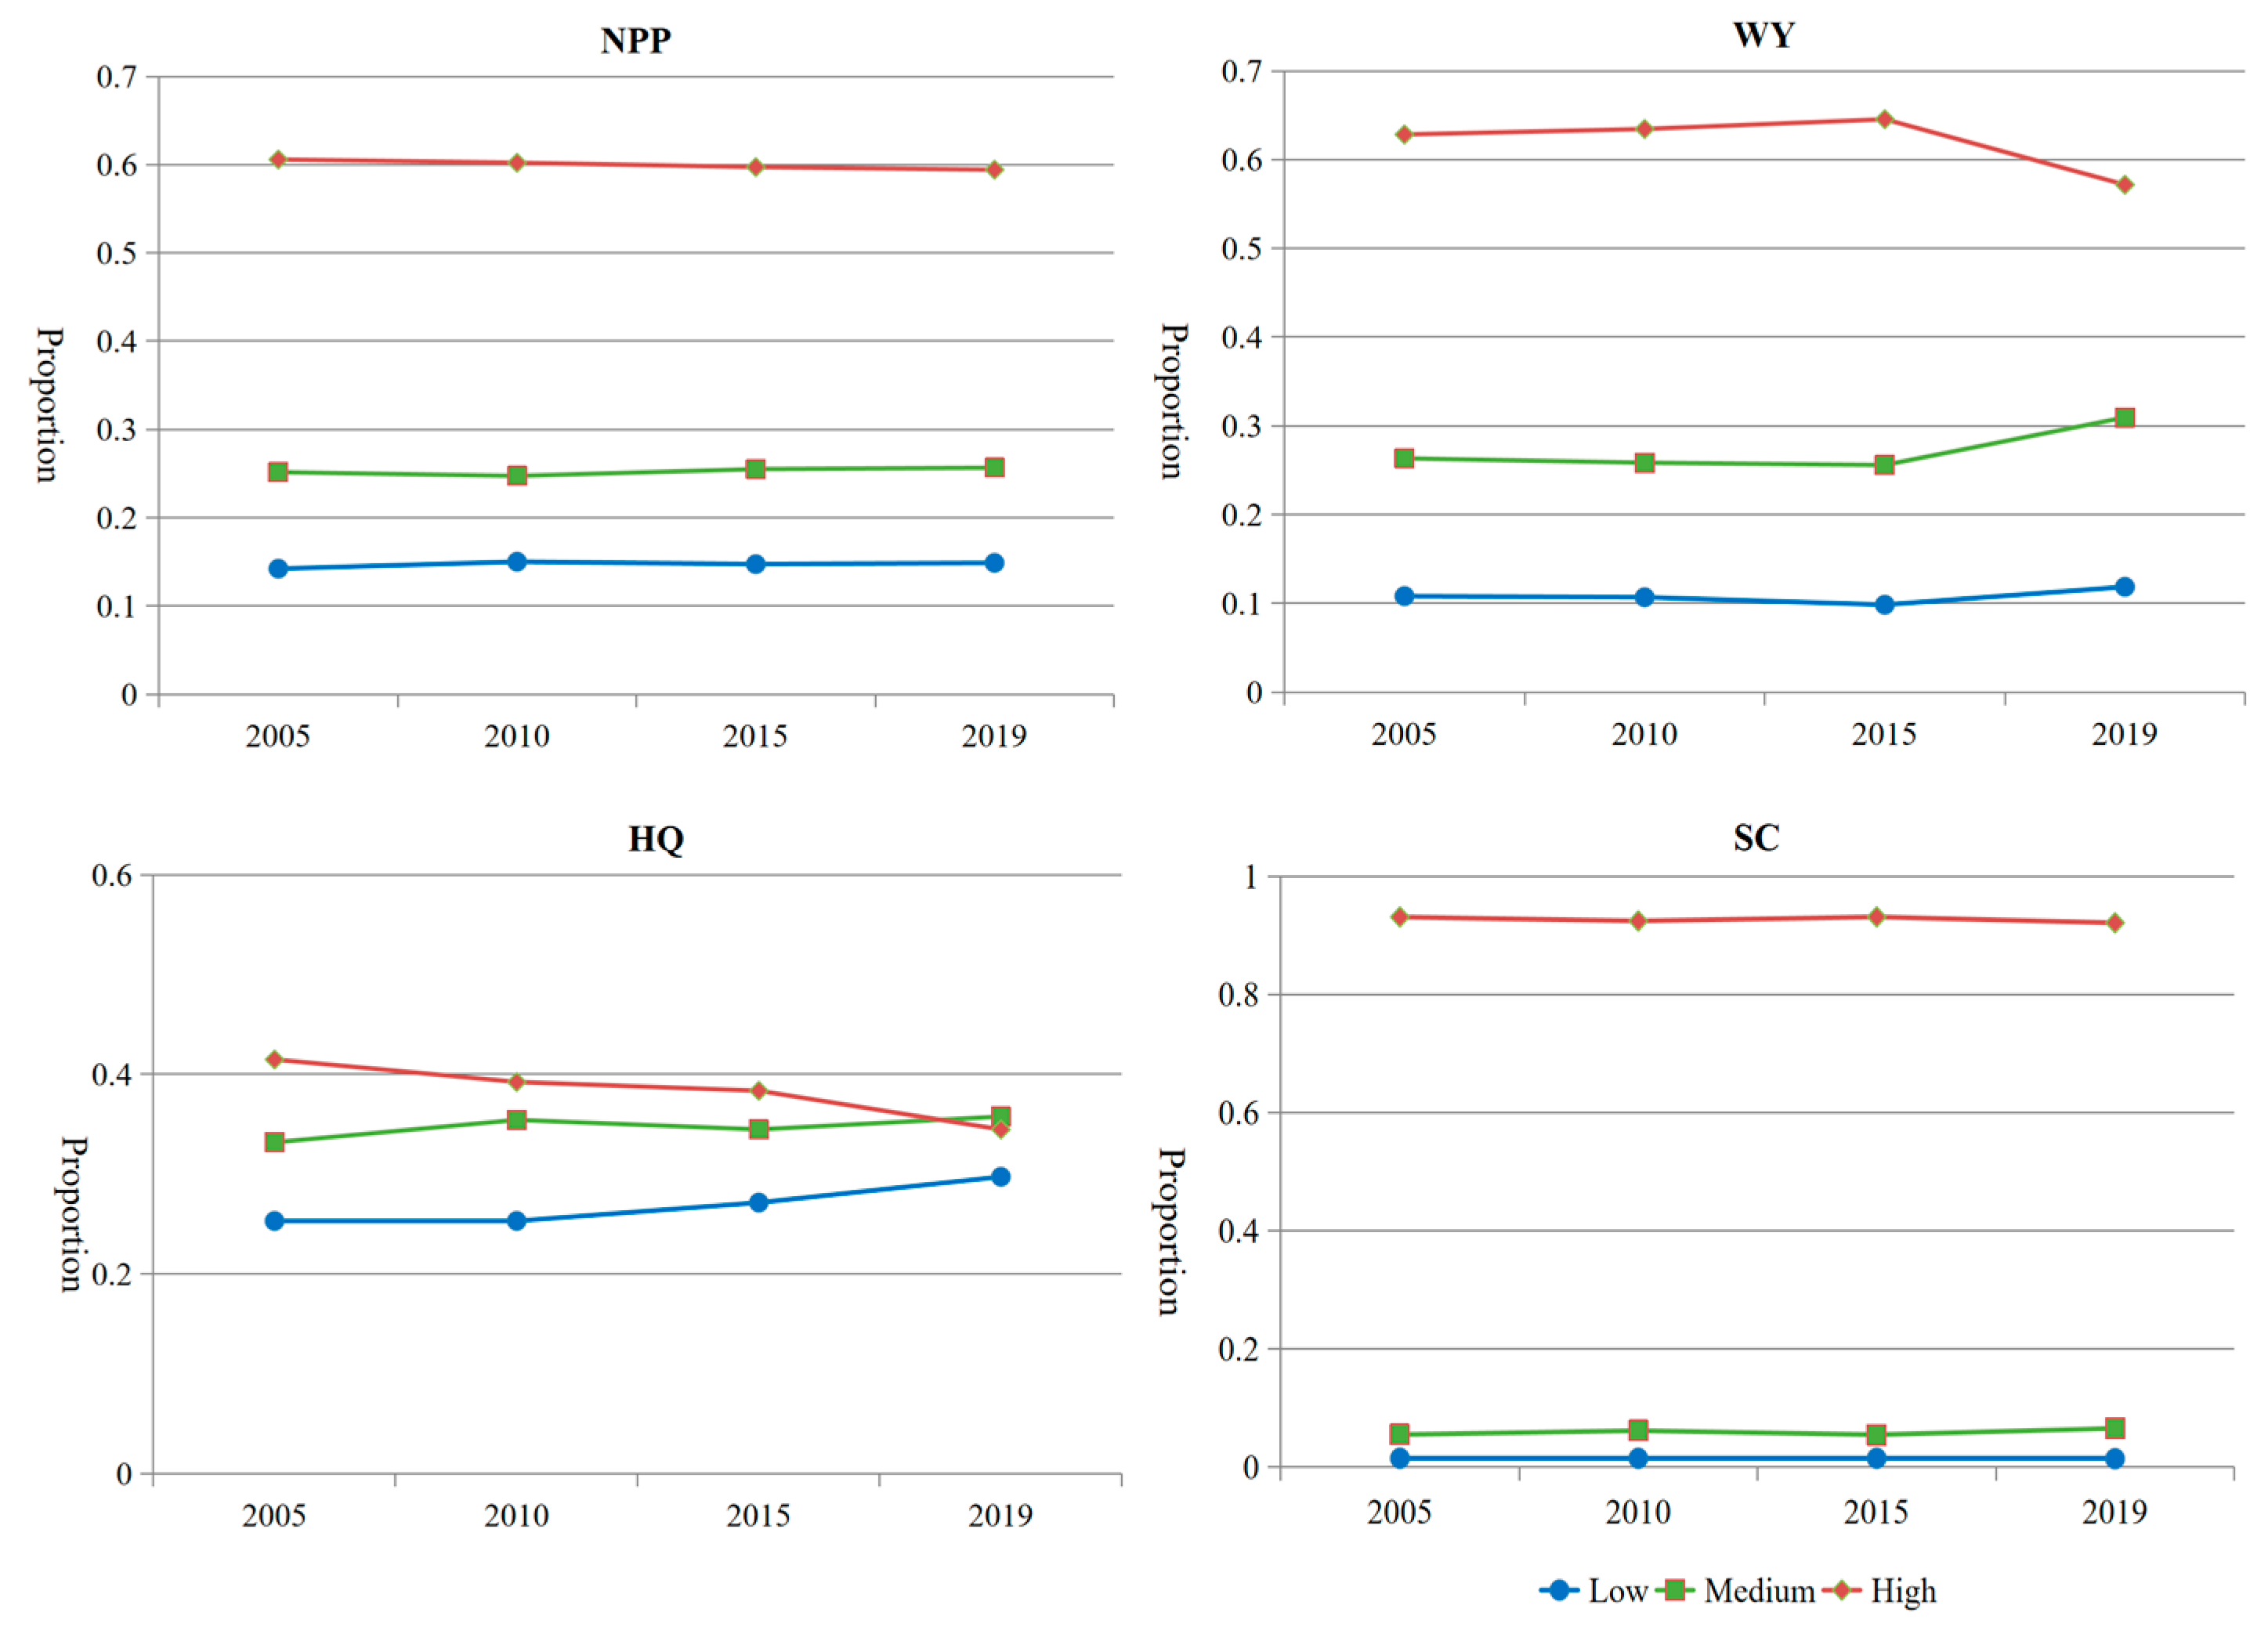
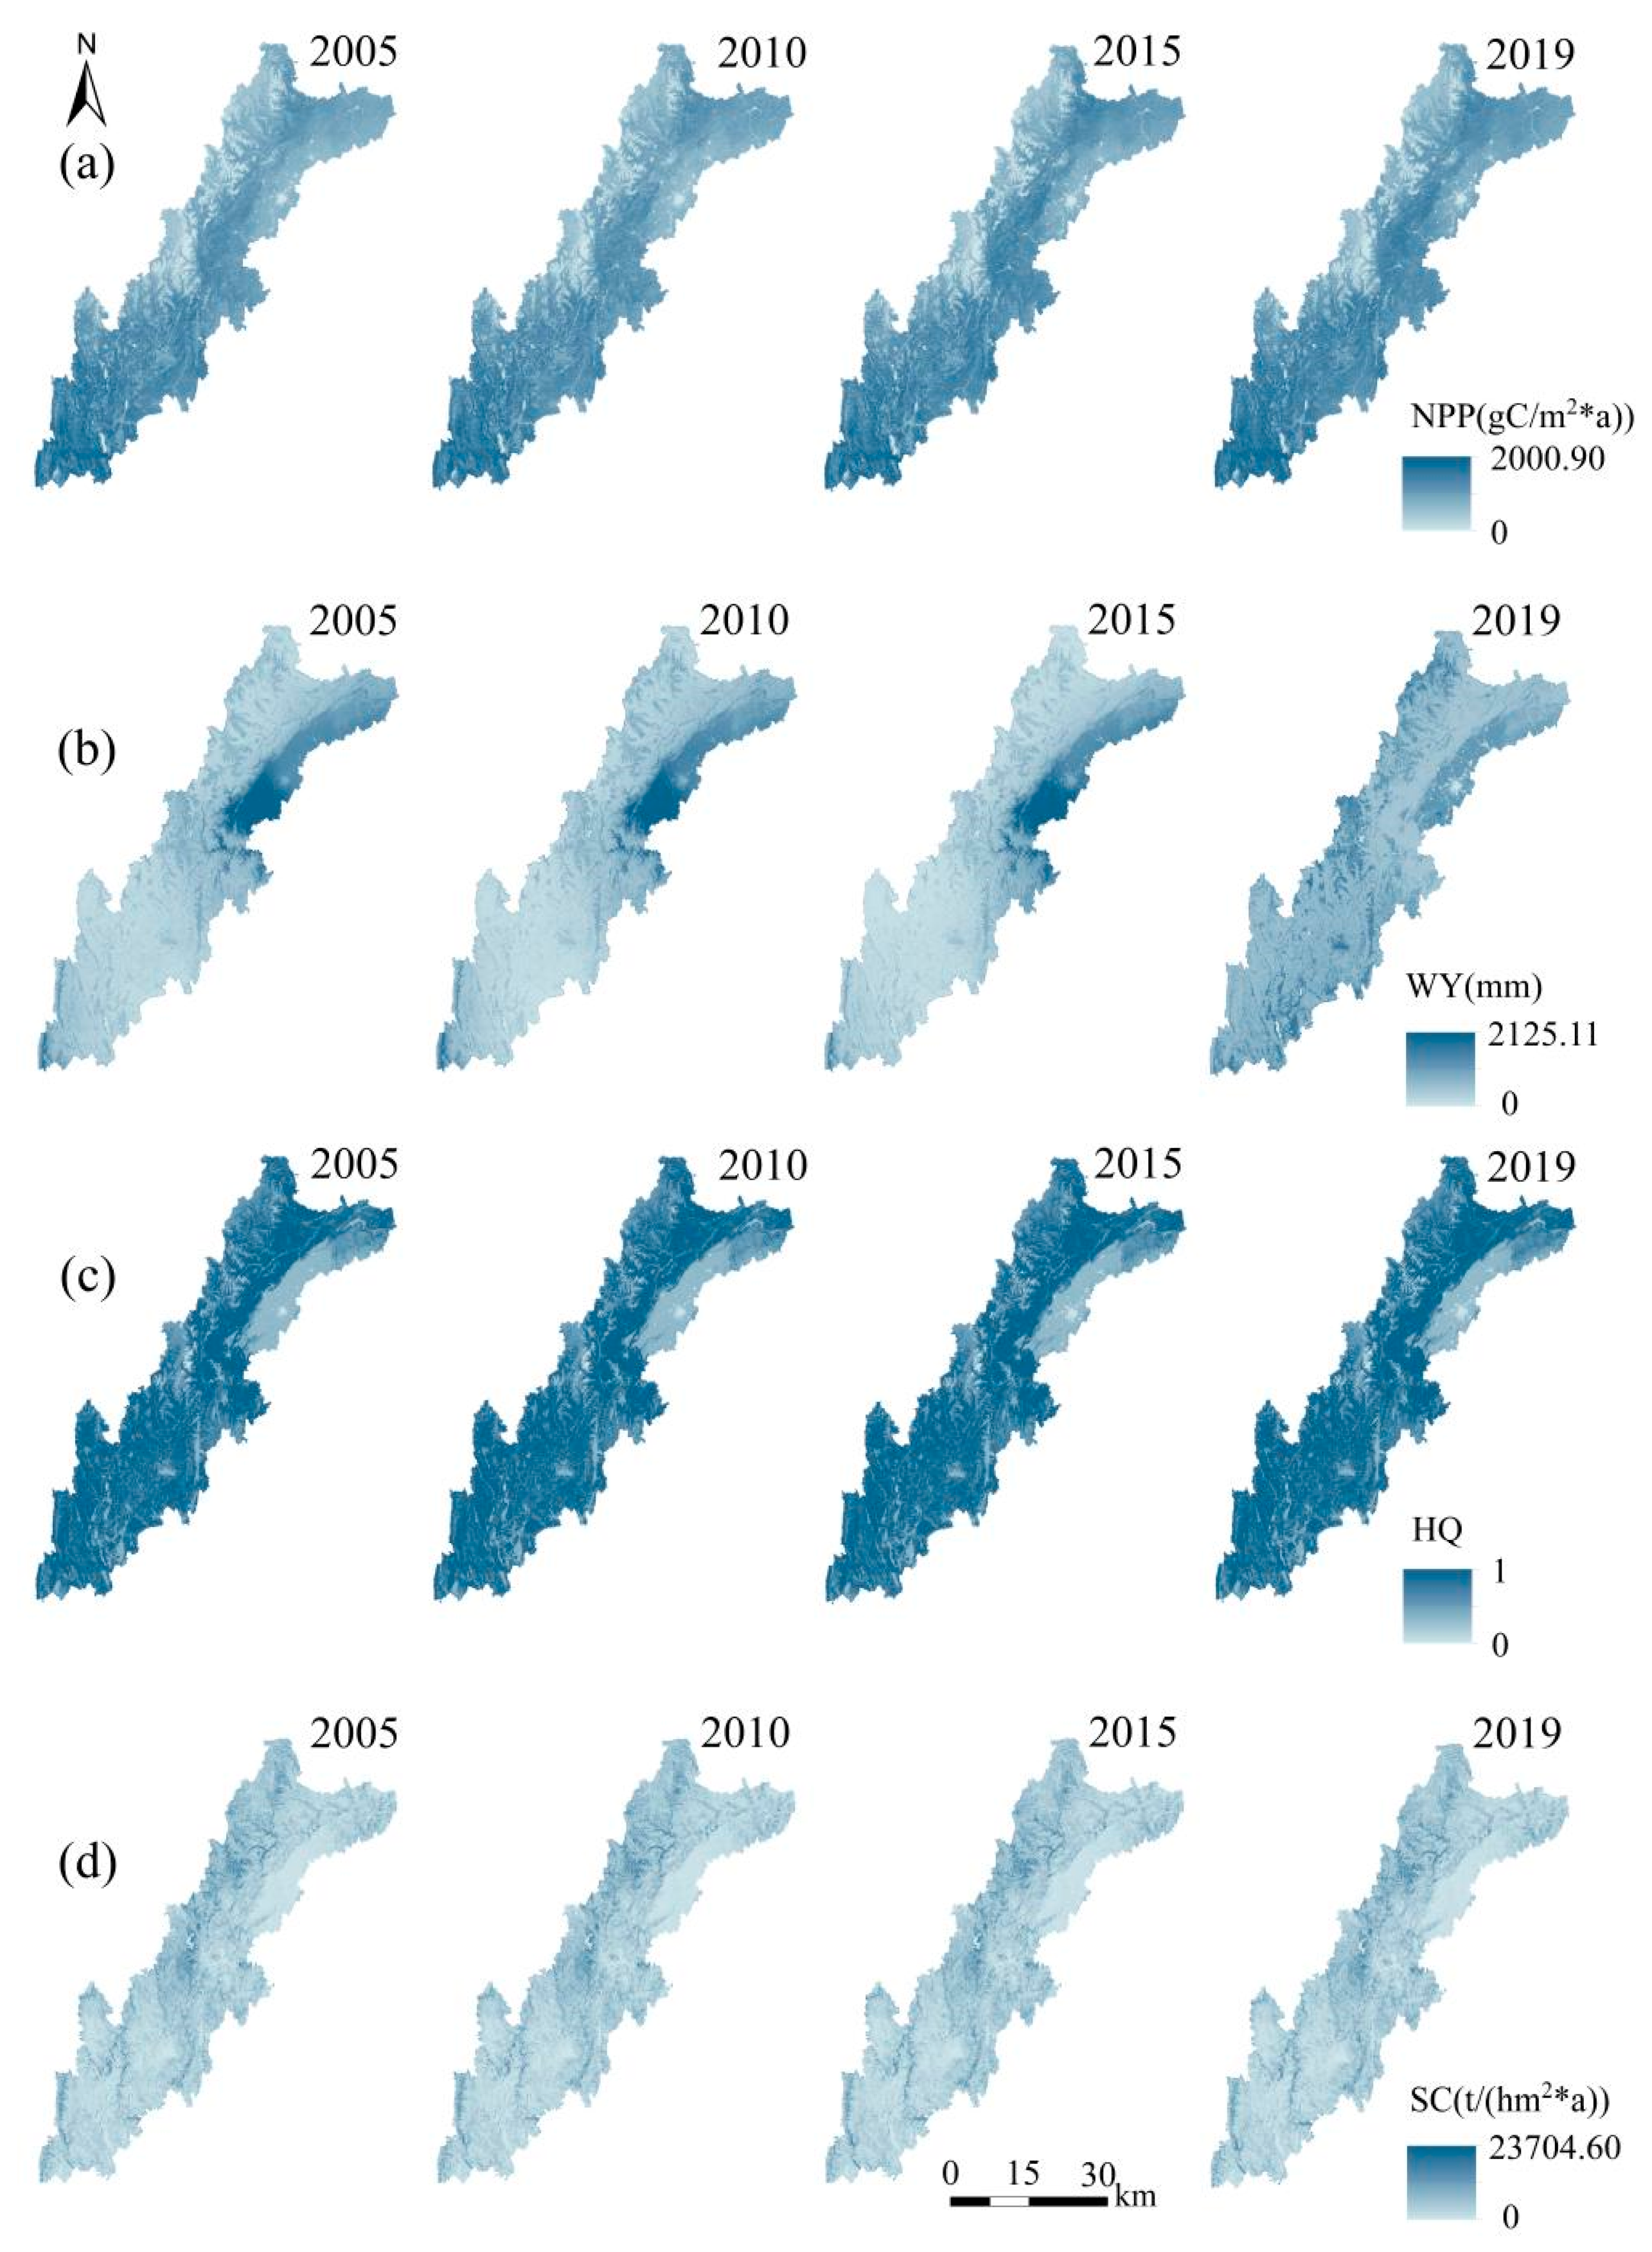
From 2005 to 2019, the study area demonstrated high NPP values mainly in the central and southwestern regions, which were characterized by extensive forests and significant vegetation coverage. Conversely, the low NPP in the north-central and eastern regions is primarily due to the presence of artificial surfaces, barren lands, and grasslands (Figure 2). Areas containing high NPP and HQ within the ecological buffer zone were predominantly concentrated in the central and southwestern regions. In the east-central region, a higher proportion of artificial surfaces, which increased the impermeable surface, led to a higher WY. The values of NPP and WY were predominantly high, accounting for approximately 60%. WY remained stable between 2005 and 2015, but it displayed a declining trend from 2015 to 2019, whereas NPP revealed minimal variation (Figure 5). Higher SC values were observed in the central and southwestern regions, due to the extensive forested and grassland areas with dense vegetation cover, which enhance the rainfall interception efficiency. Conversely, the eastern and southeastern regions of the study area showed a higher incidence of low SC values (Figure 6). This is probable due to the poor soil and water conservation capabilities of artificial surfaces and barren lands (Figure 2). Meanwhile, the distribution of HQ values was relatively balanced with predominantly high SC values, accounting for approximately 90%, and remained stable (Figure 5).
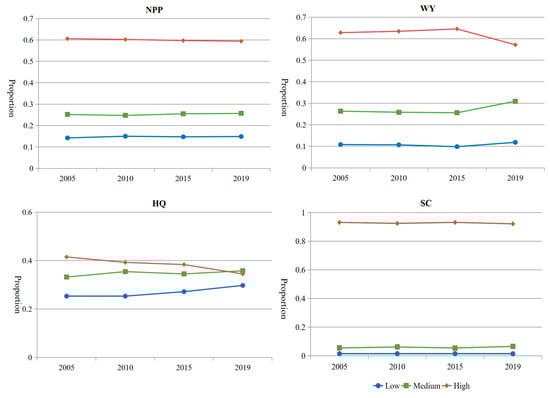
Figure 5.
Ecosystem service proportion trends over time. (HQ: habitat quality).
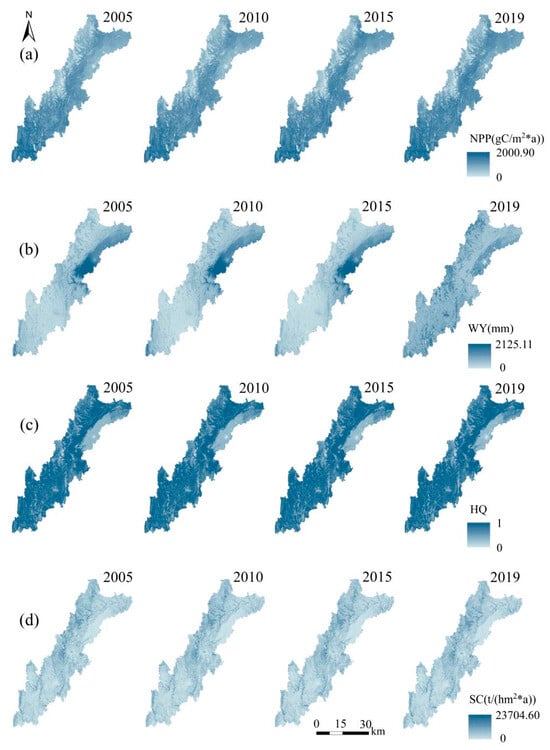
Figure 6.
Spatio-temporal distribution and variations of ecosystem services in the ecological conservation area of Sichuan-Yunnan provinces from 2000 to 2019. Note: (a) NPP (net primary productivity), (b) WY (water yield), (c) HQ (habitat quality), (d) SC (soil conservation).
3.3. Trade-Off and Synergy Analysis of Ecosystem Services in Buffer Areas
3.3.1. Synergy and Trade-Off Analyses of Temporal Variations in Ecosystem Services
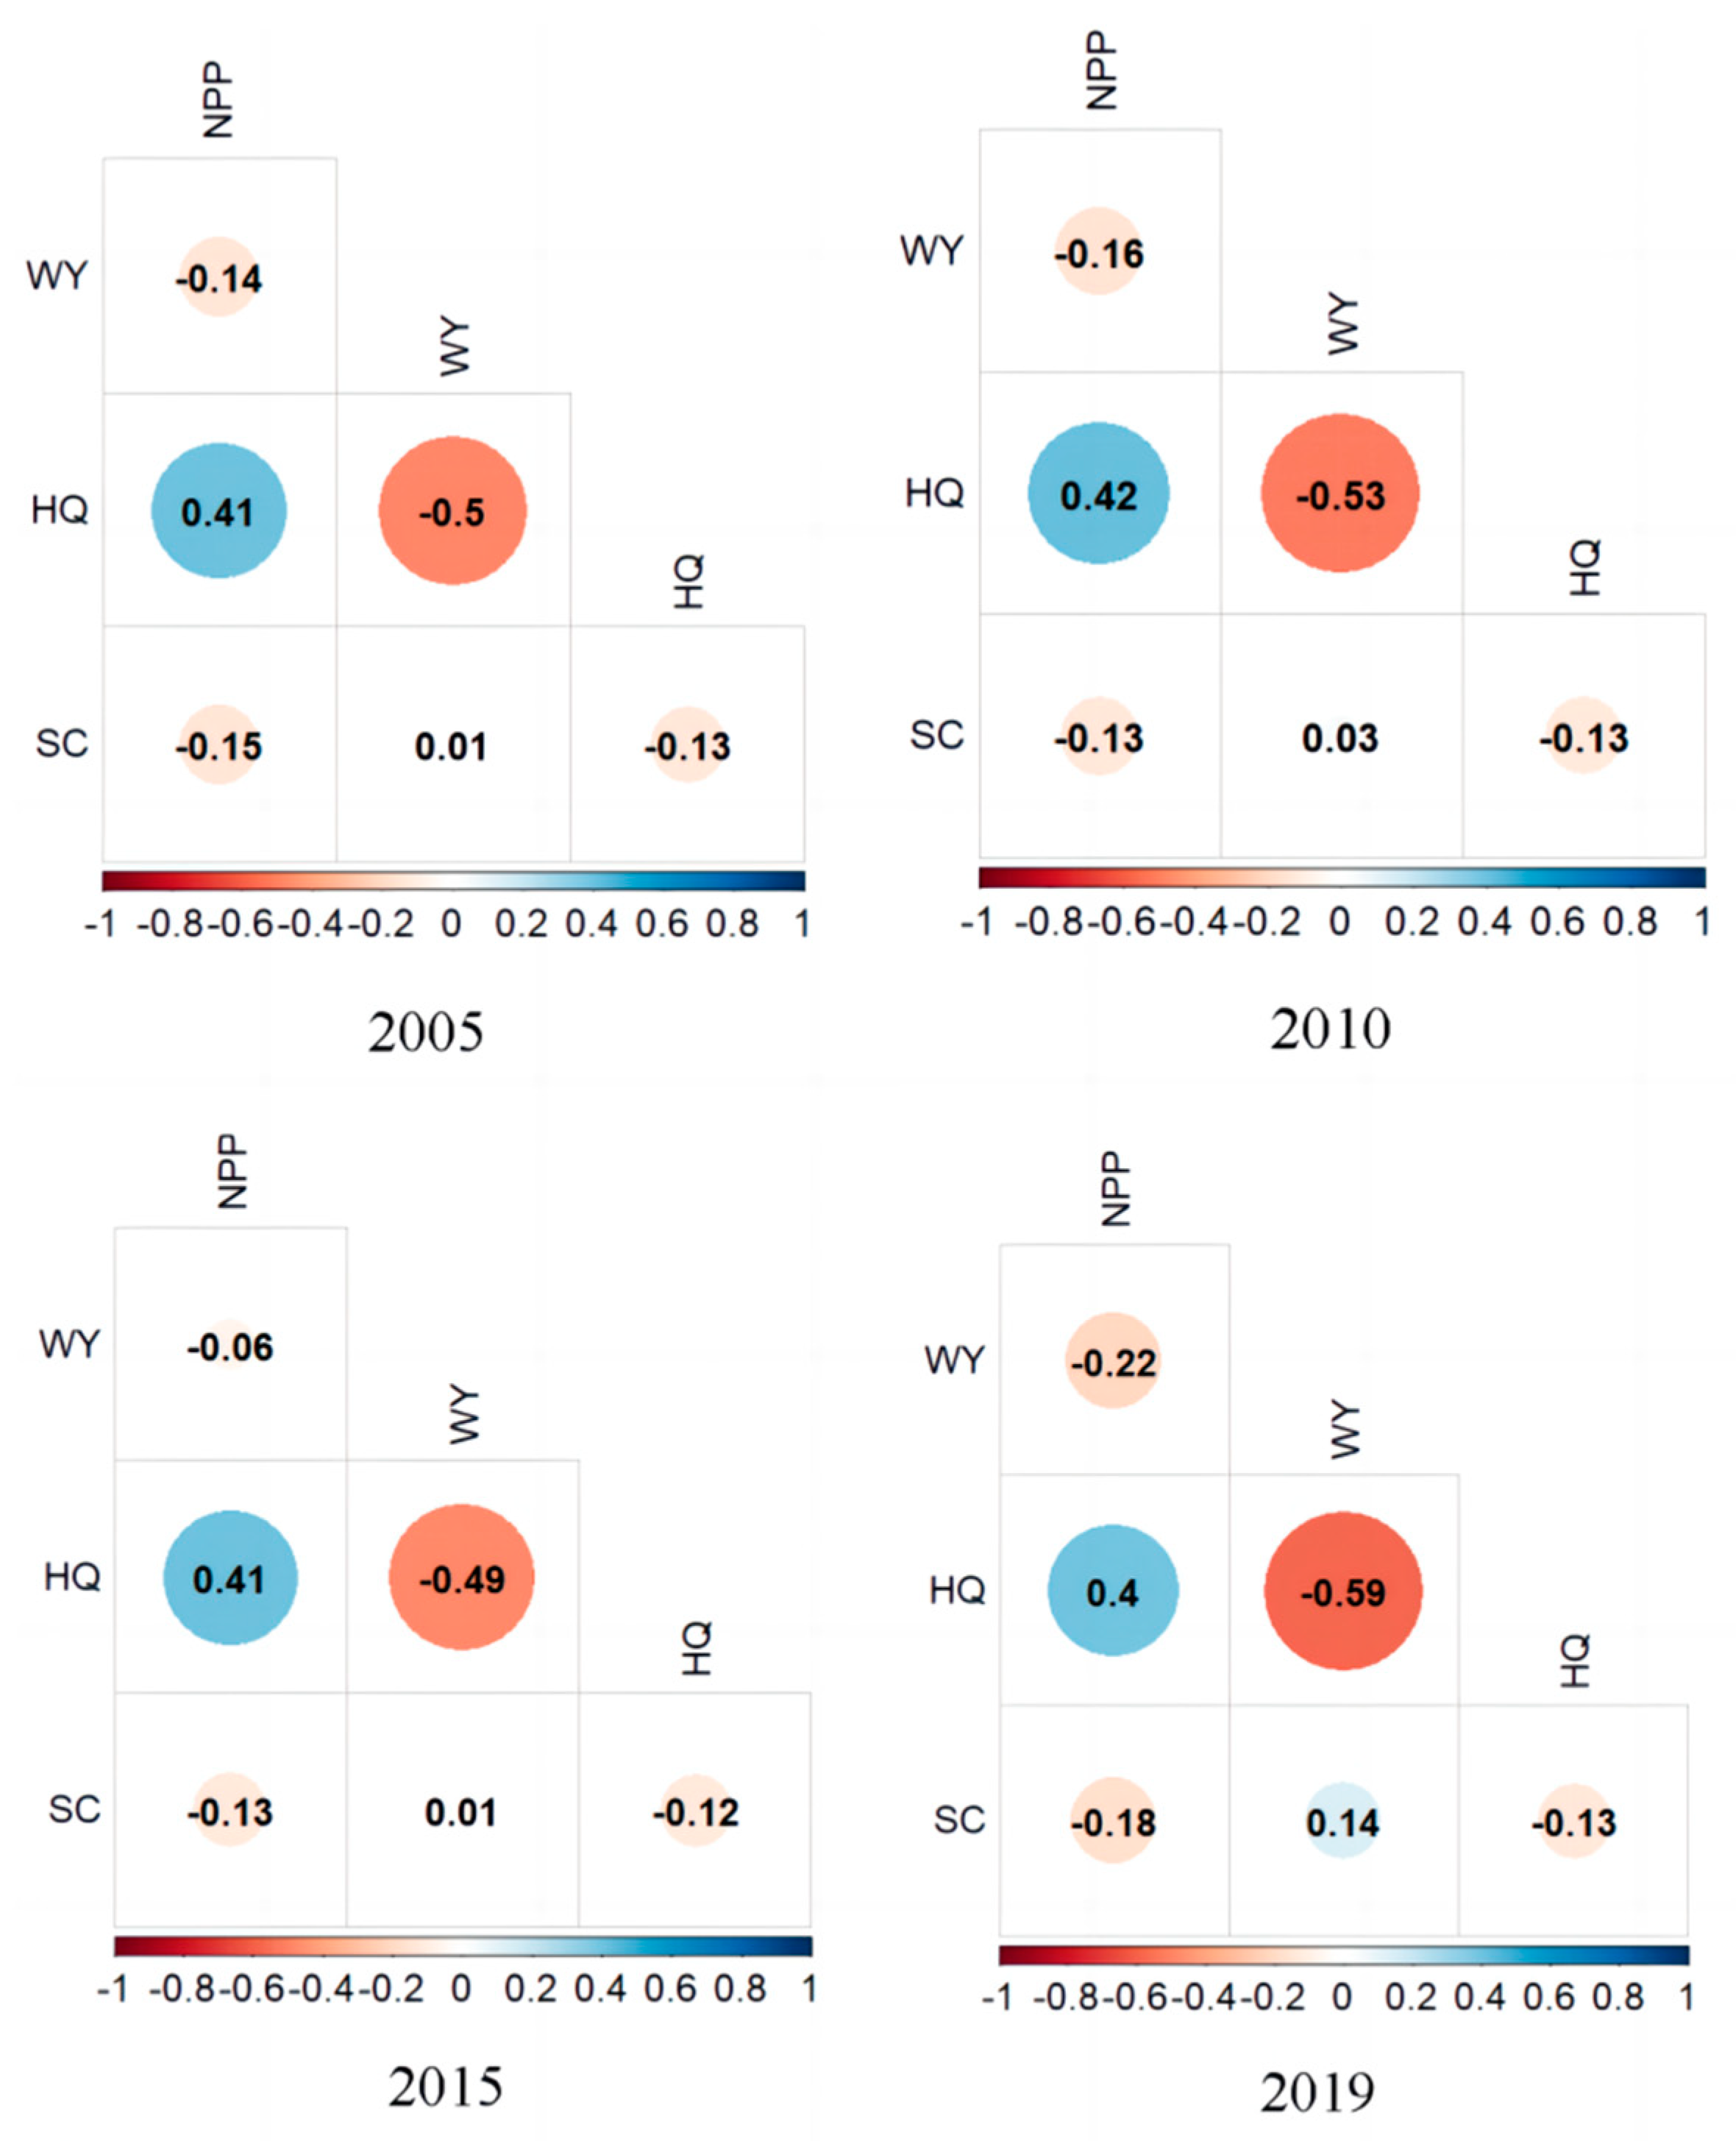
The correlation coefficients for each ecosystem service were either highly statistically significant (p < 0.01) or statistically significant (p < 0.05). From 2005 to 2019, negative correlations were observed between WY and NPP, as well as SC and HQ, indicating trade-offs between these services (Figure 7). Conversely, a positive correlation between NPP and HQ suggests a synergistic relationship (Figure 7). The correlation coefficient between WY and HQ was found to be −0.59, indicating a strong negative relationship. This is primarily attributable to the high HQ in forested areas, which have low WY, and the low HQ in built-up areas, which have high WY. The highest correlation, with a coefficient of 0.42, was observed between HQ and NPP. This is primarily due to their common association with dense vegetation in areas like woodlands and grasslands, reinforcing their positive relationship.
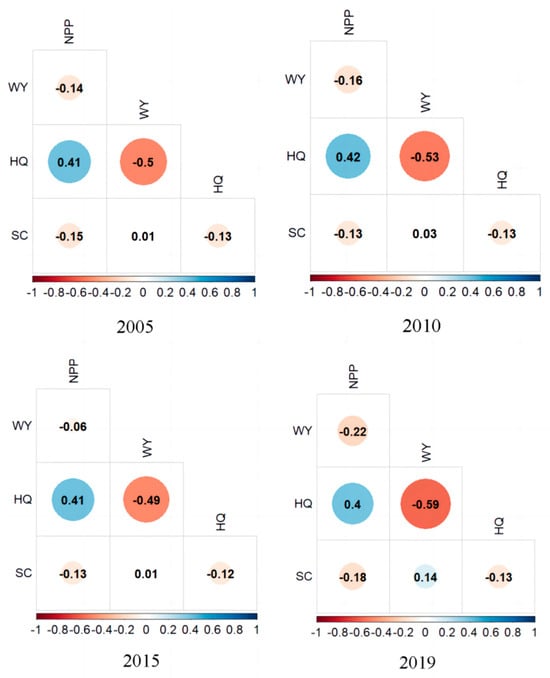
Figure 7.
Trade-offs/synergy analysis of temporal changes in ecosystem services.
3.3.2. Trade-Off and Synergy Analyses of Spatial Changes in Ecosystem Services
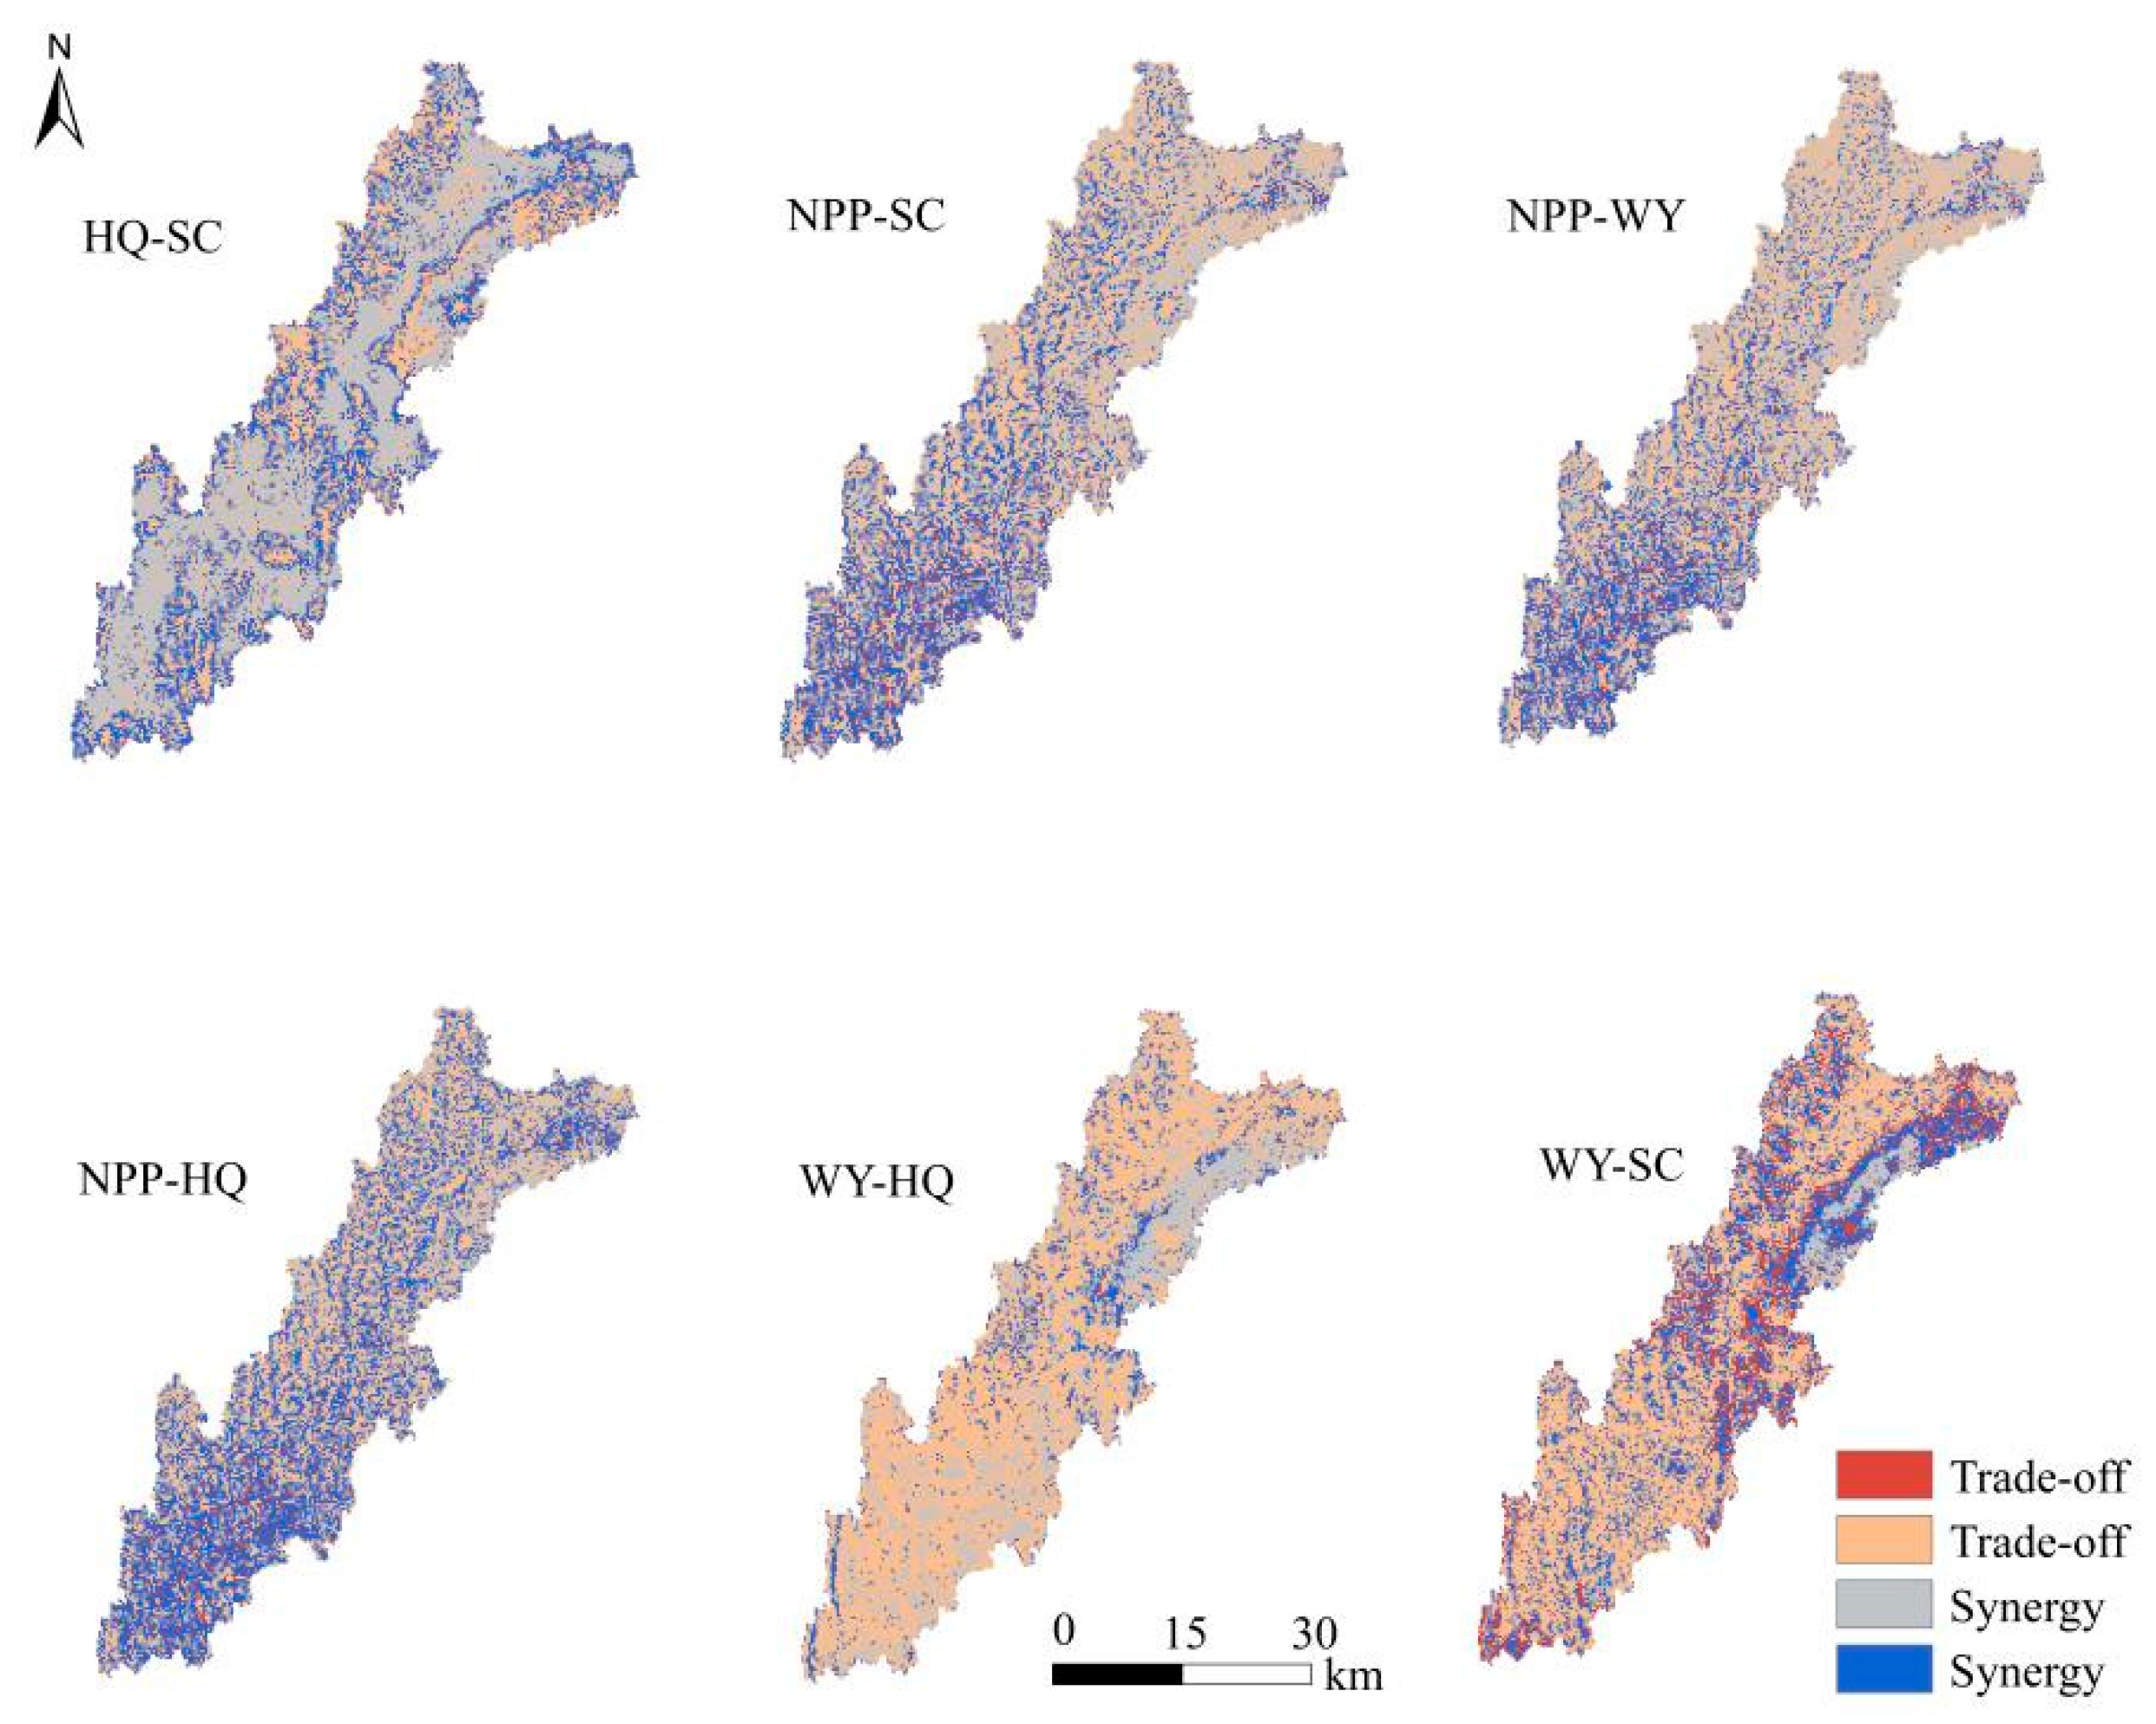
Trade-offs were primarily concentrated in the northeast and east, while the most significant synergistic relationships in the study area were observed in the southwest from 2005 to 2019. Sporadic trade-offs were also observed in other regions (Figure 8). The trade-off between NPP and SC was observed in 62.40% of the study area, primarily concentrated in the northern, north-central, and northeast regions. Similarly, the trade-off between NPP and WY was observed in 54.35% of the study area, with a primary concentration observed in the southwest. The trade-off between HQ and SC was observed in 72.14% of the study area, with a dispersed distribution and significant concentrations in the north and central regions. The trade-off between HQ and WY was observed in 68.88% of the study area, with a strong concentration identified in the north, north-central, and northeast zones.

Figure 8.
Trade-offs/synergy analysis of spatial changes in ecosystem services. (HQ: habitat quality).
3.4. Spatial Patterns in Ecological Sensitivity and Functional Zoning of the Buffer Area
3.4.1. Spatial Patterns in Ecological Sensitivity
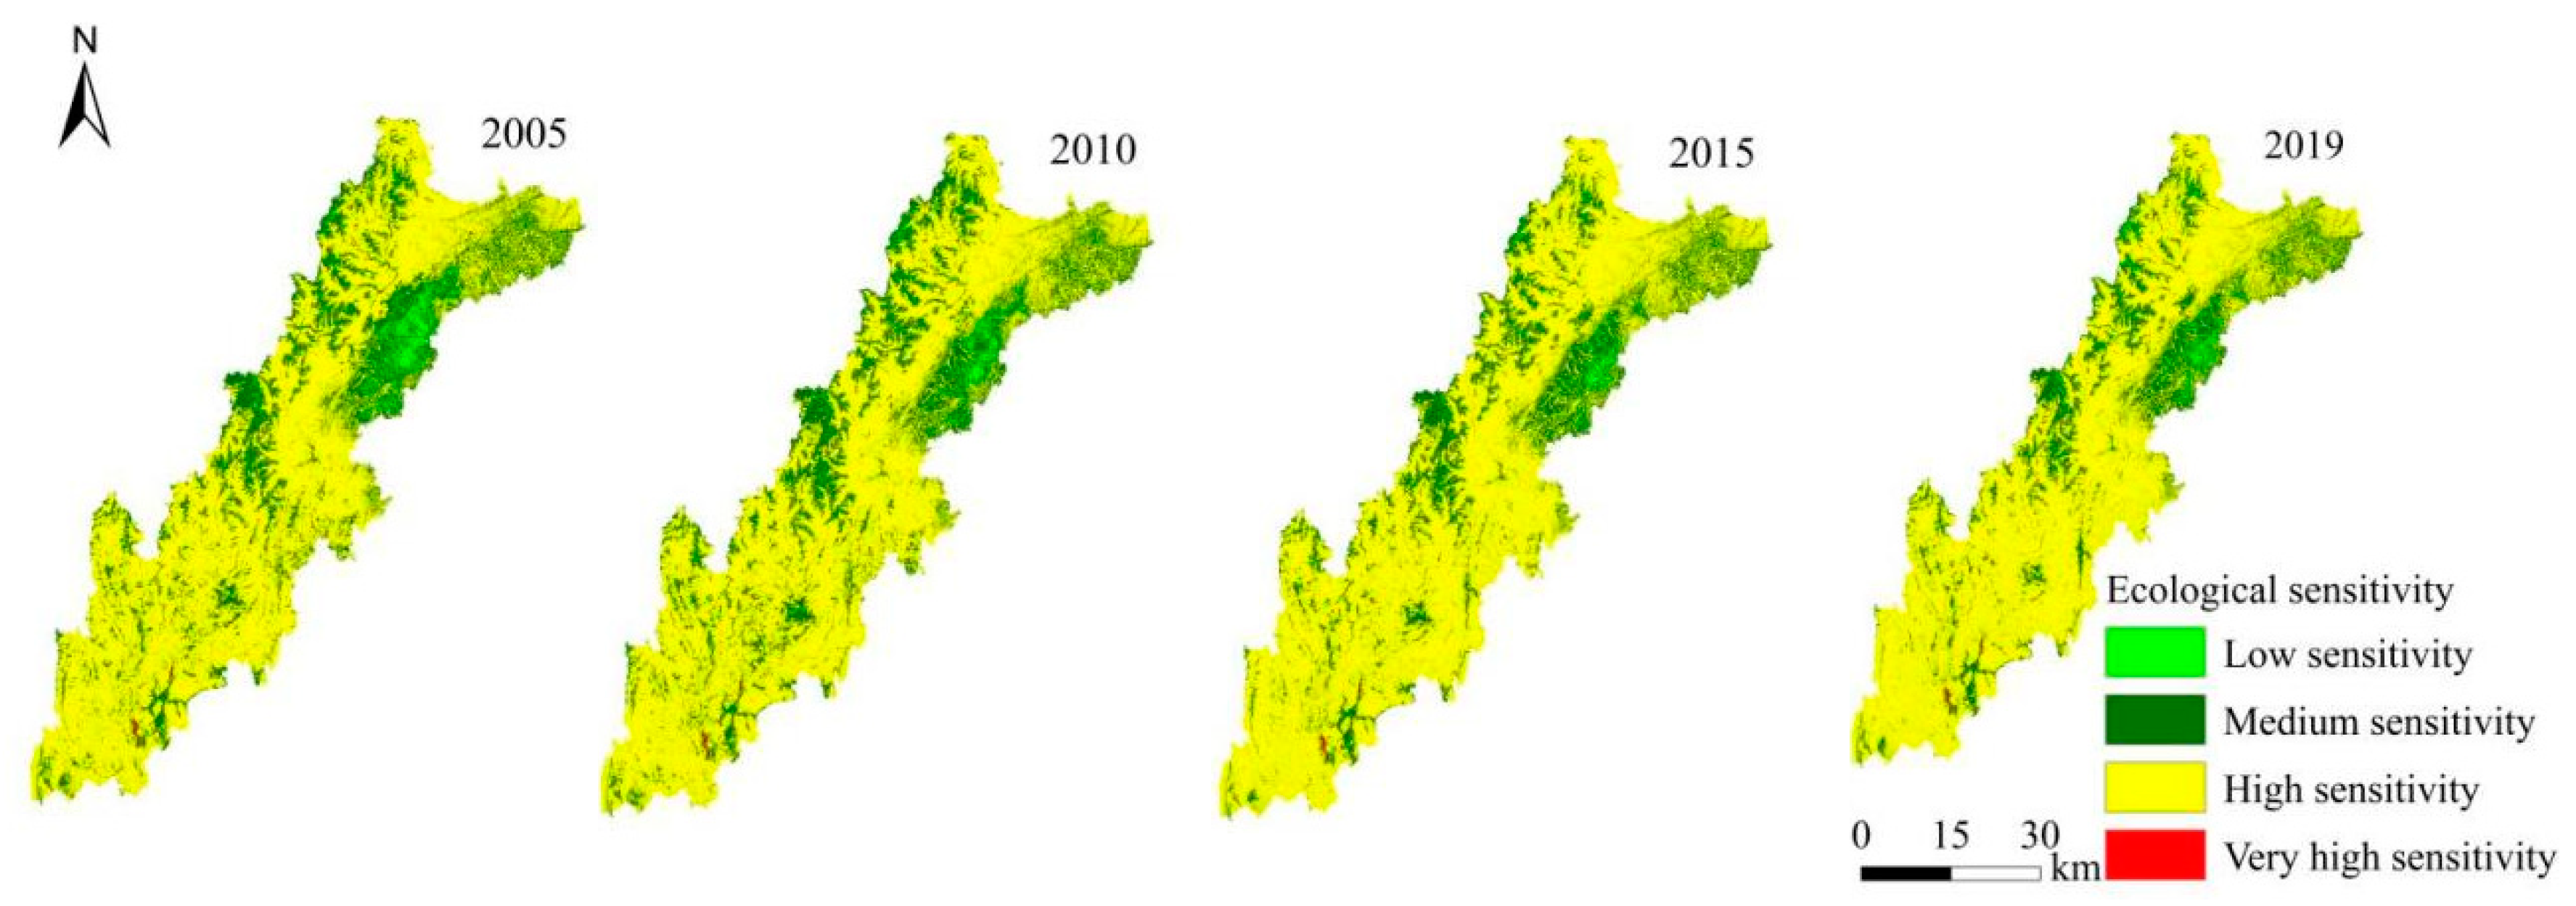
This study evaluated the ecological sensitivities of individual factors within the buffer area. The distribution of ecological sensitivity was obtained after evaluating the five parameters, as shown in Figure 9. From 2005 to 2019, the sensitivity level shifted from low in the northeast to higher in the southwest. Overall, environmental sensitivity was predominantly moderate to high throughout the regions. Areas with medium sensitivity are primarily located in the eastern, northern, and north-central regions. These areas were characterized by low vegetation cover, consisting primarily of grasslands and unused land, along with significant terrain variations. Consequently, they are more prone to soil erosion and geological hazards. The observed results suggest that these regions require more intensive conservation efforts. On the other hand, high-sensitivity areas were primarily located in the southwestern and southern regions, characterized by favorable conditions, abundant forests, grasslands, and other resources that contribute to high-quality ecological products. Furthermore, these regions should be prioritized for conservation efforts to ensure the sustainable supply of ecological products (Figure 9).
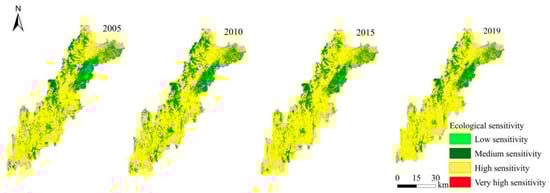
Figure 9.
Comprehensive spatial pattern of ecological sensitivity.
3.4.2. Ecosystem Service Cluster Classification Results
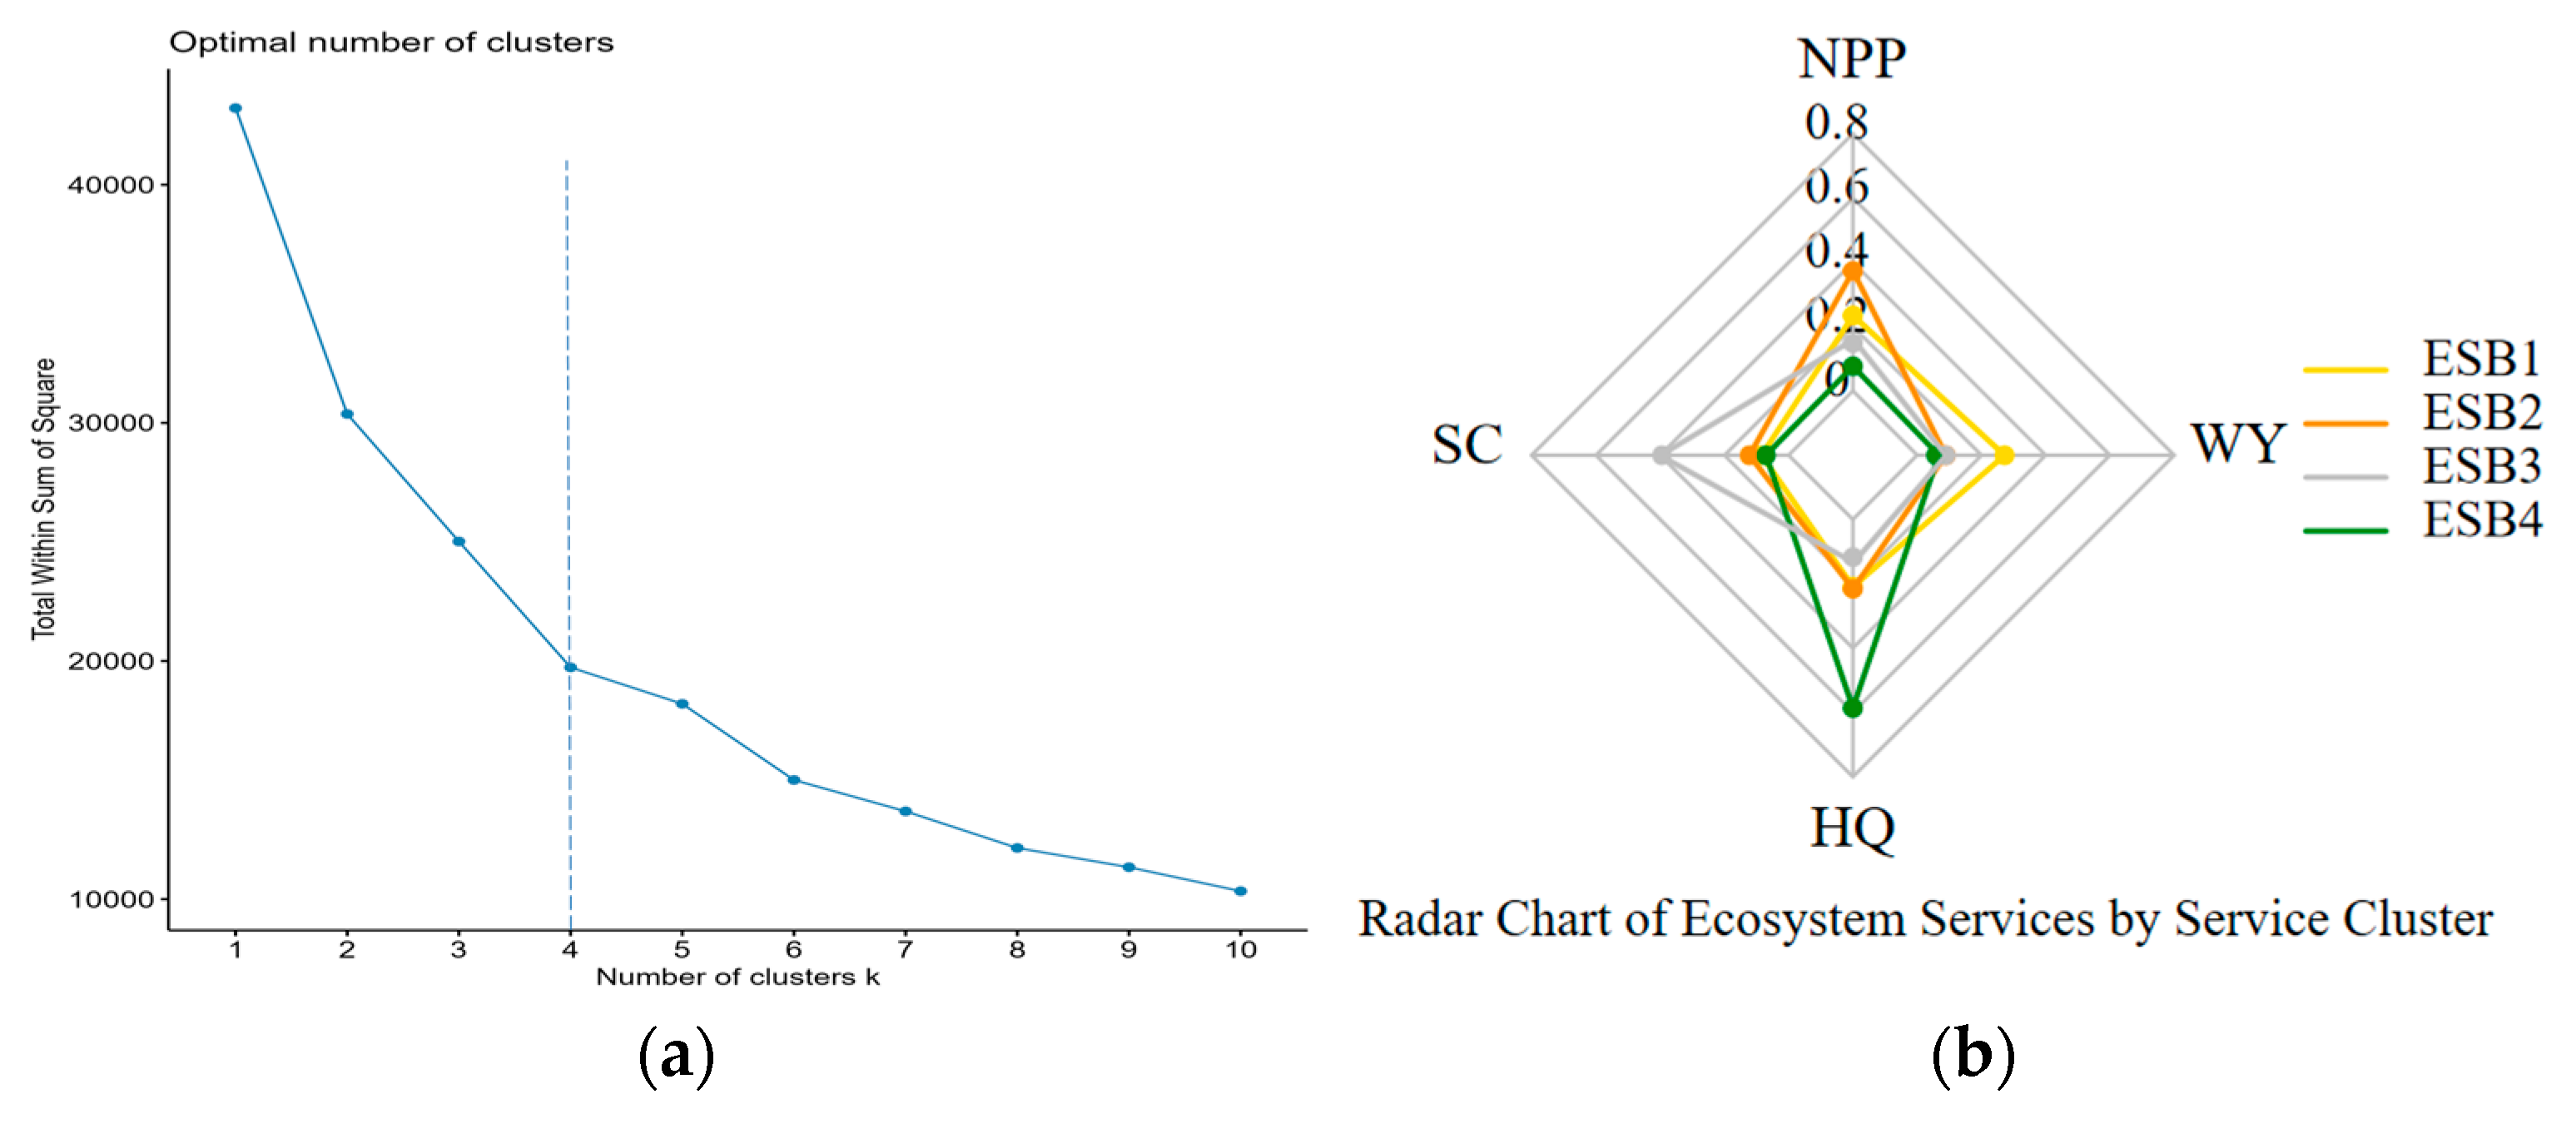
This study applied SOM to identify clusters of ecosystem services [10]. R was employed to determine the optimal number of clusters, using the change curve of the intra-group sum of squares of ecosystem services as the key parameter. An inflection point was observed in the curve starting from an initial k of 4, as shown in Figure 10a. Consequently, the study area was divided into four distinct clustering regions, each demonstrating statistically significant results.
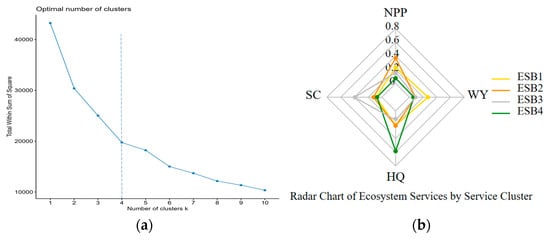
Figure 10.
Classification results of ecosystem service bundles (a) and radar chart of ecosystem services by service cluster (b).
3.4.3. Functional Partitioning of Ecosystem Services
The study area was divided into four distinct clusters, with the clustering results showing statistical significance (Figure 11). The delineation of ecological functional areas was achieved by overlaying the results of ecosystem service trade-offs with ecological sensitivity. Service Bundle 1 was primarily characterized by water production services (Figure 10b). Water conservation services significantly exceeded those of other services and largely overlapped with low-sensitivity areas. Service Bundle 1, primarily located in the northeast region of the study area, as shown in Figure 11, demonstrated an expanding trend, particularly in construction and arable land areas. The observed result suggests that the expansion of constructed land was the primary factor driving changes in Service Bundle 1, which increased the area suitable for human occupation. Low ecosystem service extents (except NPP) and overlap with medium sensitivity areas constituted the primary characteristics of Service Bundle 2 (Figure 10b). Service Bundle 2, classified as an ecologically vulnerable zone, was predominantly composed of grasslands and unused land. Service Bundle 3, characterized by low extents of ecosystem services except for SC, was associated with medium to high ecological sensitivity (Figure 10b). Service Bundle 3, which primarily comprised grasslands and shrublands, functioned as a transitional zone between Service Bundles 2 and 4. Consequently, it was identified as an ecological transition zone. Lastly, Service Bundle 4, dominated by HQ and associated with high to extreme ecological sensitivity (Figure 10b), comprised primarily forest land characterized by extensive vegetation cover and minimal human disturbance. Therefore, this cluster was classified as a zone requiring ecological conservation (Figure 12).
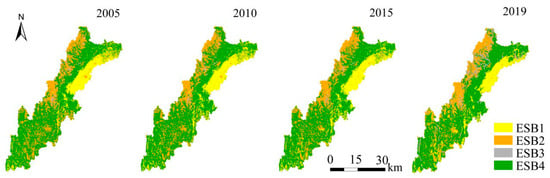
Figure 11.
Spatial distribution and pattern of ecosystem service clusters in the ecological conservation area in Sichuan-Yunnan provinces from 2005 to 2019 (ESB: Ecosystem service bundles).
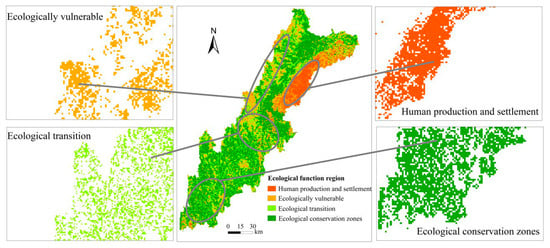
Figure 12.
Ecosystem service function divisions in ecological conservation areas in Sichuan-Yunnan provinces.
3.5. Identification of Factors Driving the Functional Areas within the Ecological Buffer Zone
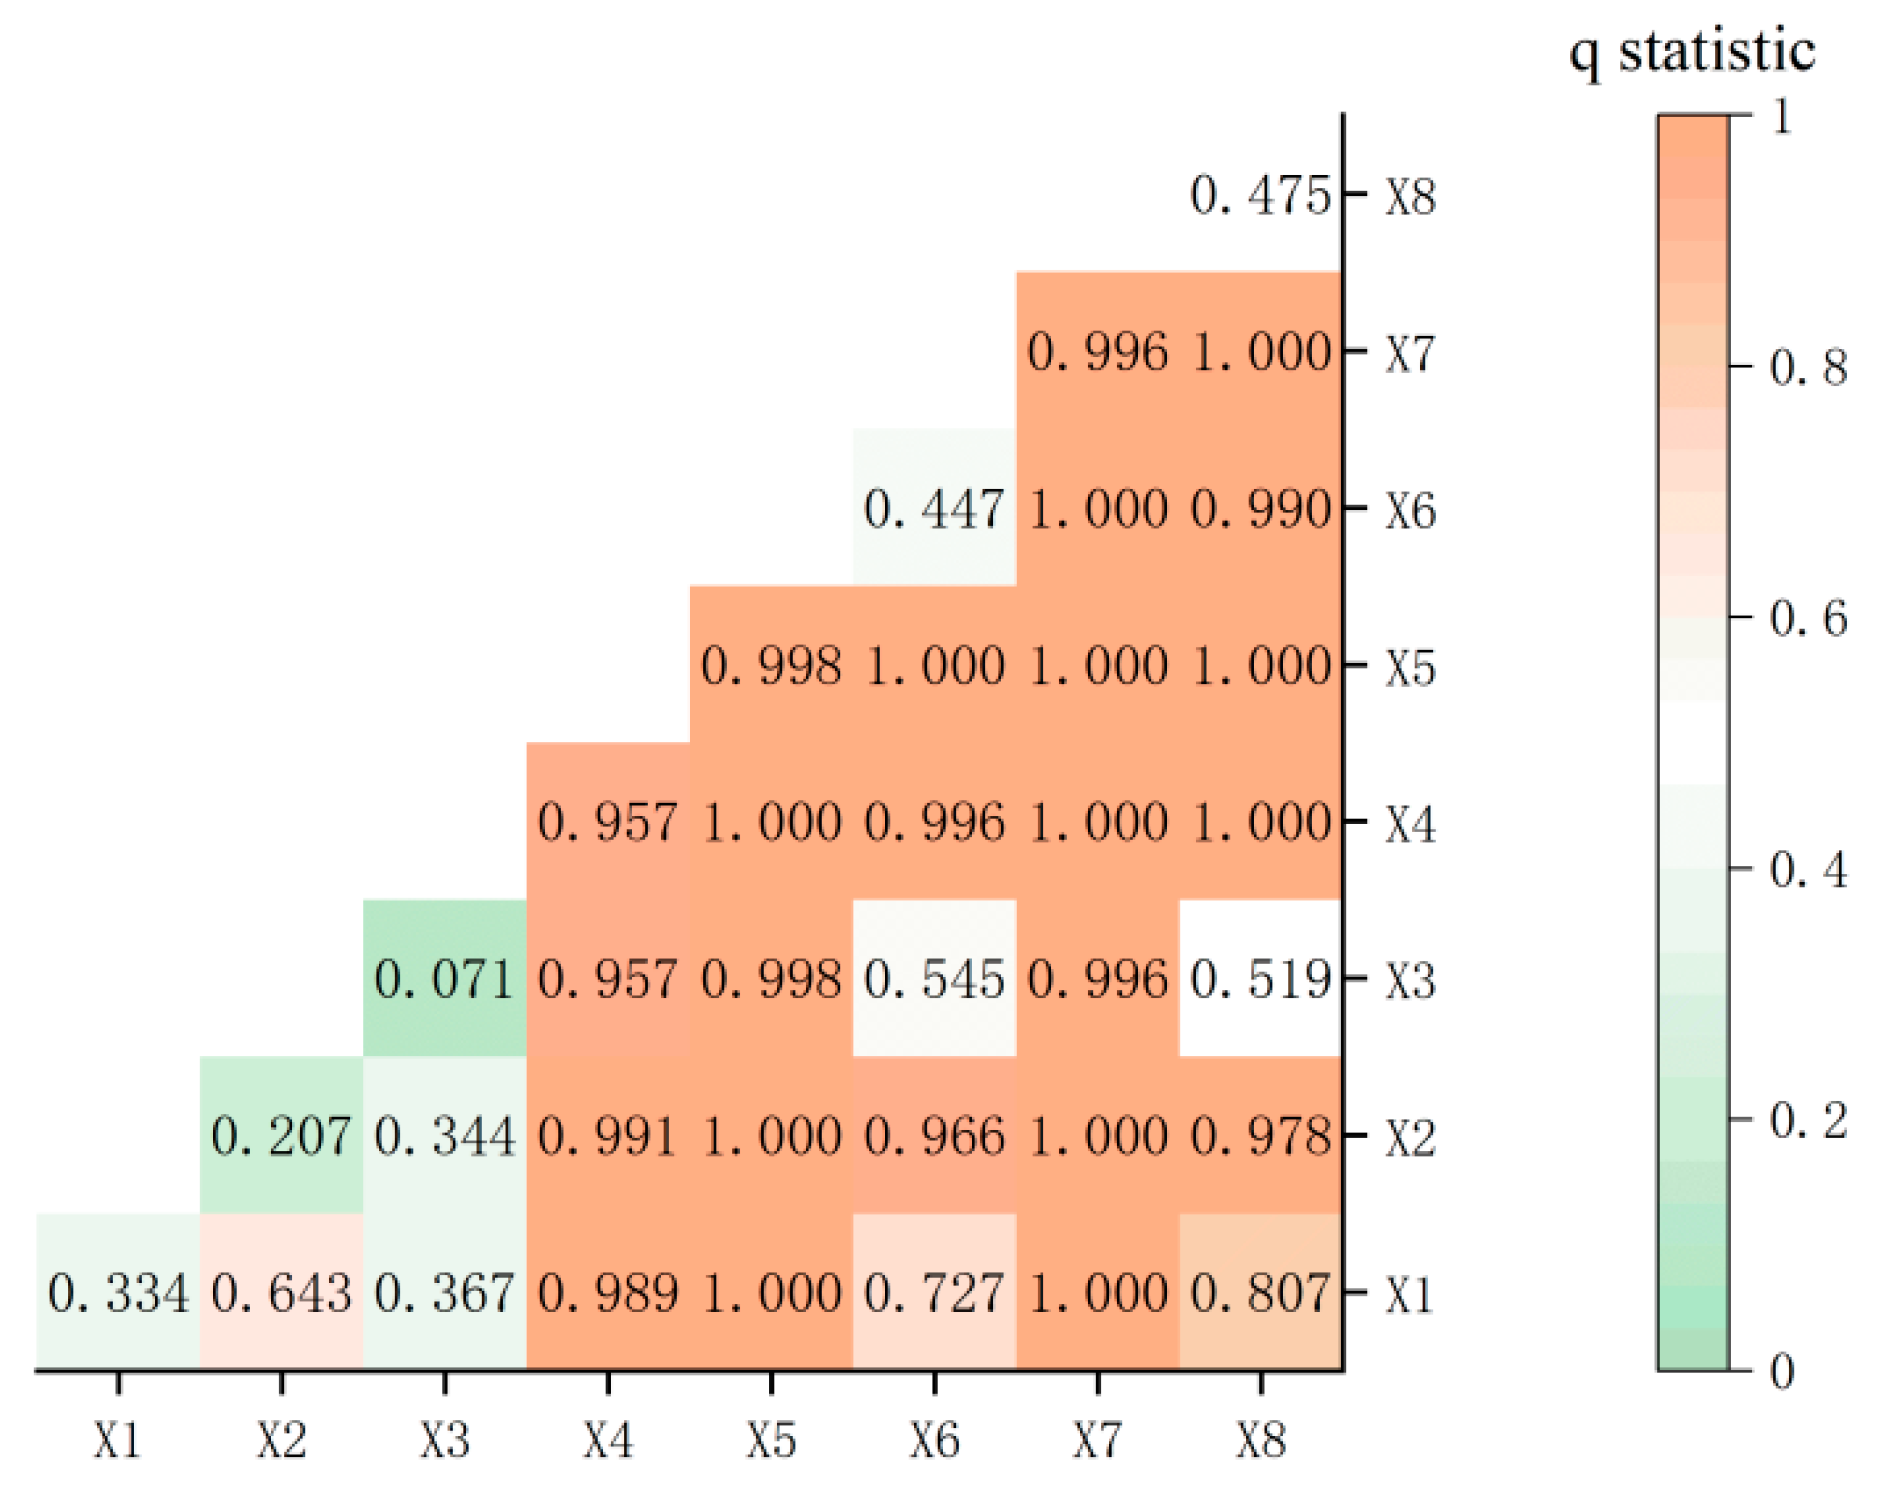
The eight driving factors for functional zoning of the ecological buffer region were found to have statistically significant explanatory capabilities (p < 0.05), as demonstrated by factor detection analysis (Table 1). However, the extent to which these factors predicted functional zoning varied significantly. Population density, human activities, and precipitation were identified as significant influential factors, accounting for over 95% of the spatial heterogeneity in the study area. Therefore, these characteristics were identified as the primary determinants of the spatial distribution of the functional zones. Moreover, studies demonstrated that 95% of the observed variance was accounted for by a variety of factors, such as population density, the human activity index, and precipitation. However, the normalized difference vegetation index (NDVI), night light, and interactions between land use categories accounted for less than 50% of the observed variability. Therefore, population density, human activities, and precipitation emerged as the key determinants influencing ecosystem services in the study area. Overall, the functional zoning of the ecological buffer area was influenced by the intricate interactions between human activities and natural processes, as evidenced by a variety of influential drivers (Figure 13).
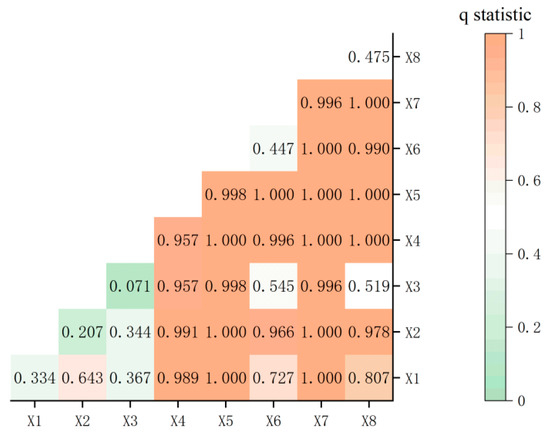
Figure 13.
Results of the interaction between factors in the study area. [X1–X8 for each of the eight impact factors: land use type, normalized difference vegetation index (NDVI), nighttime lighting, population density, human activities, temperature, precipitation, and topographic relief].
4. Discussion
4.1. Validation of Ecosystem Service, Trade-Offs, Synergies, and Ecological Sensitivity Results in the Buffer Zone Area
This study analyzed the temporal and spatial trends of four ecosystem services including WY, NPP, SC, and HQ. It highlights the critical need to validate the modeling results for these services, as the accuracy of these assessments will have a direct impact on future research endeavors. Using the CASA model, the estimated four-period annual average NPP was estimated to be 435.45 gC/(m2·a) in the Sichuan-Yunnan ecological buffer area from 2000 to 2015. The aforementioned value was slightly different but generally consistent with the results of the present study. The annual average WY for the same period was 339.04 mm/a, closely aligning with the results of this study. The annual average soil retention findings over four periods were consistent with those reported by Li [31] who used the same soil erosion equation for the Sichuan-Yunnan ecological buffer zone from 2010 to 2015. The current study further validated its findings, revealing that zones with evenly distributed habitat quality were primarily located in the extensive forested areas. In the study area, evaluating ecosystem services proved to be valuable, as localized human activities have contributed to habitat quality degradation over the past 14 years. Future research should aim to enhance the accuracy of ecosystem service assessment models by adjusting parameters to reflect local conditions according to field data collection and observation. Furthermore, the study of ecosystem service demand should be strengthened. This can be accomplished by improving the alignment of the supply and demand of ecosystem services through the optimization of ecological functional zoning.
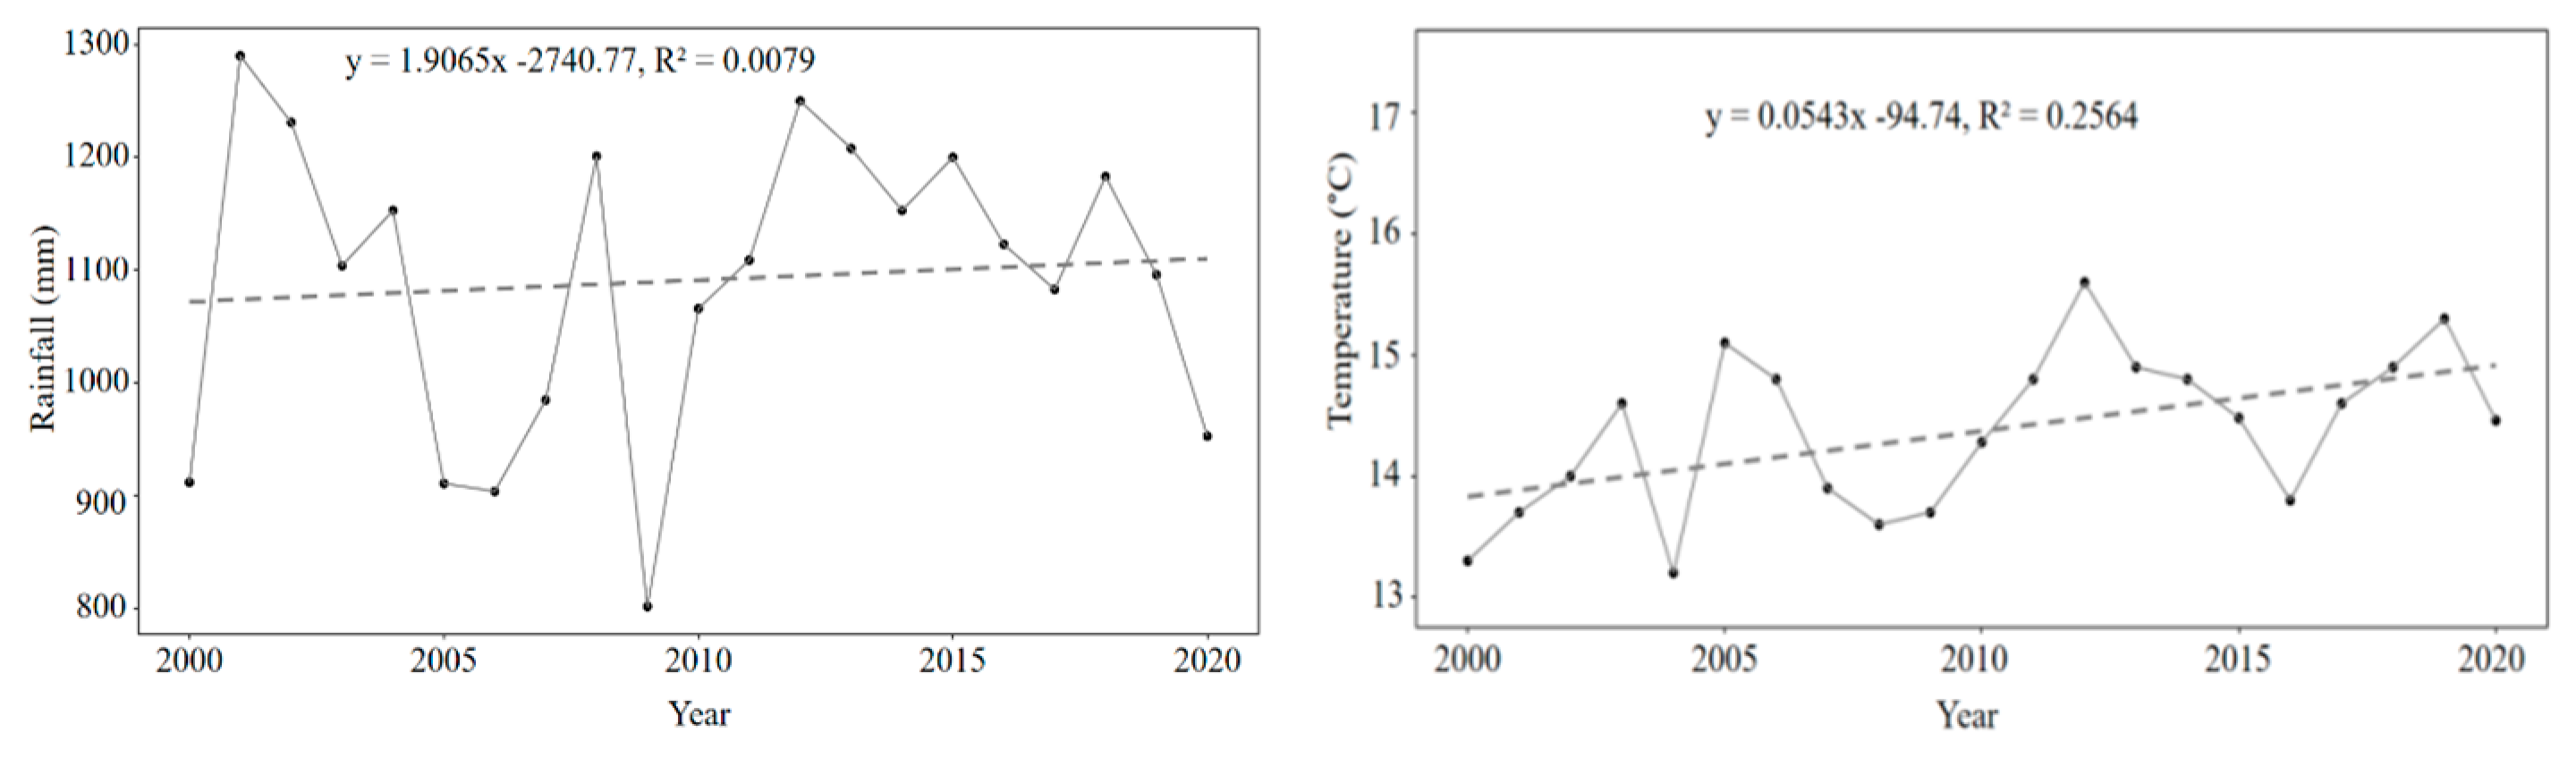
There were increases in the annual averages of other ecosystem services, except for a decrease in habitat quality services from 2005 to 2019 (Figure 4). An increase in temperature may enhance NPP services by accelerating nutrient breakdown and photosynthesis through increased metabolic activity. Conversely, a decrease in temperature may have the opposite effect. Increased precipitation can enhance soil moisture availability for vegetation [51], thereby promoting photosynthesis and leading to an increase in NPP (Figure 14). Temperature and rainfall were the main factors driving interannual variation in water yield (Figure 14). The change in soil conservation services was found to be closely associated with a variety of soil erosion factors [64]. Rainfall is a key factor influencing soil erosion. The rainfall erosivity factor (i.e., the R factor of RUSLE) is directly affected by the quantity of rainfall [65]. Typically, the R factor is positively related to rainfall frequency (Figure 14). The quality of habitat was found to be closely related to the suitability of land types and the level of disturbance from surrounding human activities. Habitats in the study area declined due to the ongoing expansion of construction land, a significant increase in cultivated land area (Figure 2), increased human activity, and landscape fragmentation.
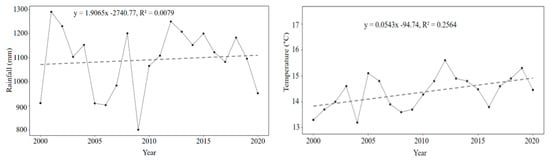
Figure 14.
Rainfall and temperature changes in Sichuan-Yunnan provinces from 2005 to 2019.
The spatial interactions among ecological services resulted in the development of diverse functional cluster forms. Establishing ecosystem service functional zoning is crucial for developing a regional ecological security framework and for effective ecosystem management. Although previous research has considered ecological sensitivity and ecosystem services in zoning, most studies have neglected the trade-off and synergy relationships as well as the spatial clustering effects inherent to ecosystem services. Identifying trade-offs and synergies among ecosystem services allows decision-makers to manage regional ecosystem services more effectively, minimizing conflicts and enhancing beneficial interactions. In the Sichuan-Yunnan ecological buffer zone, a trade-off has been identified between NPP and WY [66]. A study examining the spatial heterogeneity of ecosystem service trade-offs and their associated driving factors across different climatic zones within the Sichuan-Yunnan buffer zone found a synergistic relationship between HQ and NPP, while a trade-off was identified between WY and SC [67]. These findings align with the results of the present study, which highlights the interrelationships among regulating services and acknowledges that trade-offs and synergies also occur among other ecosystem services. Therefore, future studies should focus on conducting a more comprehensive and detailed evaluation of ecosystem services within these buffer zones.
Ecological sensitivity refers to the probability and intensity of environmental problems resulting from external disturbances within a region’s natural ecological environment under specific natural conditions. A study conducted in the western Sichuan Plateau revealed that regions with higher ecological sensitivity were predominantly located in the southern part of the study area [68]. Another analysis using the SRP model of ecological vulnerability in Sichuan Province found that regions with high ecological sensitivity were primarily concentrated in the northern part, particularly across most of the Aba Prefecture [69]. Research on ecological sensitivity in Northwestern Sichuan showed that the study area is predominantly characterized by medium to high sensitivity levels [70]. These findings align closely with the results of the present study. The spatial distribution pattern of ecological sensitivity from 2005 to 2019 in this study demonstrated a gradual increase in sensitivity from the southwest to the northeast, with a decreasing pattern in low-sensitivity areas and an overall moderate to high level of ecological sensitivity. However, the analysis is limited by factors such as data availability and method selection, highlighting the need for further refinement in future research.
The primary goal of this study was to address the knowledge gap by integrating ecosystem service clusters, trade-offs, and synergies with ecological sensitivity to delineate ecological functional zones. Service Bundle 1 was primarily characterized by water production services; Service Bundle 2 represented an ecologically vulnerable zone, mainly consisting of grasslands and unused land; Service Bundle 3 comprised mainly grasslands and shrublands and represented the zone of transitional between Service Bundles 2 and 4; Service Bundle 4 was dominated by HQ. The methodology employed in this study identified the spatial differences in ecosystems across several spatiotemporal dimensions, which guided the proposed priorities and strategies for conservation [30].
4.2. Ecological Functional Zoning of the Ecological Buffer Area
In China, ecological buffer zones significantly affected the ecological security strategy and framework. Ecosystem service bundles showed specific landscape patterns within these interactions. The SOM method is regarded as a more objective approach compared to other available methods for identifying ecosystem service bundles [28]. The current study employed SOM to classify ecosystem service bundles in the Sichuan-Yunnan ecological buffer zone. The study area was divided into four functional zones, including human production and settlement, ecologically fragile, ecological transition, and ecological conservation areas, by incorporating ecosystem service trade-offs and synergies with ecological sensitivity, hence providing specific recommendations for ecological management for each sub-area. The approach and findings of the present study can also serve as a guide for land management in these areas to promote sustainable development and ecological restoration.
The human production and settlement area in the study region, comprising 17.28% of the total area, is characterized by a strong capability for WY but limited capacity for HQ and NPP (Figure 12). This region, dominated by arable and construction lands, has flat terrain, high average annual rainfall, and sporadic distribution of watersheds and reservoirs, contributing to relatively abundant water resources. However, other ecosystem services in this area exhibit comparatively limited strengths. It is crucial to mitigate the effects of agricultural production and human activities on the region’s ecological services. The results of the current investigation indicate that the following should be the primary focus of future development: (1) the active establishment of urban green corridors to facilitate regional biological flows; and (2) the development of environmentally favorable but economically viable agriculture, tourism, and related industries.
The ecologically vulnerable zone, comprising 22.30% of the study area, demonstrated extremely low levels of all ecosystem services (Figure 12). It is distinguished by limited vegetation cover and substantial human interference, resulting in a landscape with scattered grasslands and unused land. For future sustainable development in this region, it is essential to revise current pastoral practices by adopting advanced grazing management techniques. Furthermore, it is essential to prioritize the preservation of natural grasslands and the enhancement of grassland biodiversity to facilitate ecological rehabilitation.
The ecological transition zone was identified as the smallest, constituting 7.41% of the total study area. SC was the sole ecosystem service that was observed to be present at a high level in this zone (Figure 12). This zone, consisting mostly of grasslands and shrublands, is crucial for the exchange and flow of ecological elements, thus contributing significantly to maintaining ecological stability. Therefore, specialized ecological rehabilitation and conservation strategies are considered essential for this region. In areas currently experiencing ecological damage, it is necessary to restrict large-scale development and construction to preserve ecological balance. Furthermore, the establishment of an ecological buffer zone is essential for the relationship of this region to the broader ecological conservation zone. The stability of the ecological buffer zone can be maintained via the implementation of certain strategies including enhancing corridor protection facilities and expanding greening efforts.
The ecological conservation area, which made up 53.01% of the study region, exhibited strong habitat quality and NPP (Figure 12). This region, predominantly covered by woodlands with high vegetation density and minimal human intervention, serves as a crucial ecological buffer zone and a core component of the overall ecological environment. The zone is essential for maintaining the ecological equilibrium of the region. Future development should focus on this zone by implementing customized conservation strategies that consider factors such as land use, topography, and climate to preserve its ecological integrity. These strategies should aim to enhance the ecological service functions, such as HQ, SC, and WY, to ensure the ecological safety of the middle and lower reaches of the Yangtze River.
4.3. Driving Factors of the Ecological Buffer Area
The spatial differentiation of functional areas in ecological buffer regions was investigated in the present study using detectors to investigate the effect of both natural and human factors. The analysis revealed that precipitation significantly affected the eight geo-environmental elements examined, while human activity and population density were identified as the key social determinants. Ecological conservation and ecological transition zones were characterized by minimal human disturbance and higher vegetation cover, where precipitation demonstrated a crucial role in supporting vegetation growth and development. In contrast, human production and settlement areas, along with ecologically vulnerable zones, were primarily influenced by factors such as population density and human activities. Although the current study initiates a discussion on the impacts of natural and human factors on spatial differentiation within these zones, it is essential to consider additional factors to gain a comprehensive understanding. The analysis was constrained to eight variables owing to data acquisition limitations while neglecting the spatiotemporal variations in their influences. Future research should address these additional factors to provide a more comprehensive understanding.
5. Conclusions
Ecological function zoning is of great practical significance for maintaining regional ecosystem services, enhancing human well-being, and supporting sustainable development. This study adopted a spatial overlay analysis approach, integrating ecological sensitivity, trade-offs, synergies, and ecosystem service clusters to define ecological functional zones. The primary drivers of spatial variation in ecological functional zones were identified using geographic detectors. The primary findings of the current investigation are as follows: from 2005 to 2019, NPP, soil conservation, and water yield demonstrated positive trends, consistent with observed increases in precipitation and temperature in the study area. In contrast, there was a decline in HQ attributable to the ongoing expansion in construction land, a significant increase in cultivated land (Figure 2), increased human activity, and landscape fragmentation. There was significant spatial heterogeneity and distinct regional patterns in ecosystem functions, with a general decrease from southwest to northeast, particularly evident in NPP and HQ. Trade-offs were evident in most ecosystem services, with the most significant between WY and HQ and most concentrated in the northeast and east. The intensity of ecological sensitivity was observed to be gradually decreased from the southwest to the northeast. Incorporating ecosystem service clusters, trade-offs, and synergies with ecological sensitivity enables the precise delineation of ecological functional zones. The ecological buffer zone was classified into four distinct functional zones: human production and settlement, ecologically fragile, ecological transition, and ecological conservation areas. There is a critical need to mitigate the effects of agricultural production and human activities on regional ecological services, while concurrently conserving and rehabilitating natural grasslands through maintaining grassland biodiversity. The stability of the ecological transition zone can be maintained through the implementation of specific strategies, including enhancing corridor conservation and expanding greening efforts. The ecological conservation area should be managed by implementing customized conservation strategies that integrate land use, topography, and climate. Precipitation emerged as a key natural factor affecting the distribution of ecological functions, whereas population density and human activity were identified as the primary social determinants. These findings offer valuable insights for guiding future sustainable land management practices.
Author Contributions
Conceptualization, C.L. and X.Z. (Xiaoqing Zhao); Methodology, P.M., C.L., C.Z. and Y.C.; Software, B.X., X.Z. (Xiaoqing Zhao), C.Z., P.H. and Y.C.; Validation, P.M., X.Z. (Xiaoqing Zhao) and X.Z. (Xiongfei Zhang); Formal analysis, P.M., B.X., Y.W., F.C. and J.P.; Investigation, C.L., Y.W., C.Z. and P.H.; Resources, B.X., Y.W., J.W., J.P., P.H. and X.Z. (Xiongfei Zhang); Data curation, C.L., J.W., J.P. and X.Z. (Xiongfei Zhang); Writing—original draft, P.M.; Writing—review & editing, P.M.; Visualization, F.C.; Supervision, B.X. All authors have read and agreed to the published version of the manuscript.
Funding
This work was supported by the Yunnan Provincial Philosophy and Social Science Innovation Team (2023CX02), Yunnan Provincial Reserve Talents for Young and Middle-aged Academic and Technical Leaders Project (202105AC160059), National Natural Science Foundation of China (32160280), Natural Science Foundation of Yunnan Province (202201AT070040), Open Funding from CAS Key Laboratory of Tropical Forest Ecology (22-CAS-TFE-04), National Natural Science Foundation of China project (42361065), the Undergraduate Teaching Quality Improvement Project of the Department of Geography (01300205020516080/059/), and the Key Basic Research Project of Yunnan Province (202401AS070037).
Data Availability Statement
The original contributions presented in the study are included in the article, further inquiries can be directed to the corresponding author.
Conflicts of Interest
The authors declare no conflict of interest.
References
- Chaplin-Kramer, R.; Sharp, R.P.; Weil, C.; Bennett, E.M.; Pascual, U.; Arkema, K.K.; Brauman, K.A.; Bryant, B.P.; Guerry, A.D.; Haddad, N.M.; et al. Global modeling of nature’s contributions to people. Science 2019, 366, 255–258. [Google Scholar] [CrossRef] [PubMed]
- Chen, H.; Costanza, R.; Kubiszewski, I. Land use trade-offs in China’s protected areas from the perspective of accounting values of ecosystem services. J. Environ. Manag. 2022, 315, 115178. [Google Scholar] [CrossRef] [PubMed]
- Kok, M.T.J.; Kok, K.; Peterson, G.D.; Hill, R.; Agard, J.; Carpenter, S.R. Biodiversity and ecosystem services require IPBES to take novel approach to scenarios. Sustain. Sci. 2017, 12, 177–181. [Google Scholar] [CrossRef]
- Albert, C.; Schröter-Schlaack, C.; Hansjürgens, B.; Dehnhardt, A.; Döring, R.; Job, H.; Köppel, J.; Krätzig, S.; Matzdorf, B.; Reutter, M.; et al. An economic perspective on land use decisions in agricultural landscapes: Insights from the TEEB Germany Study. Ecosyst. Serv. 2017, 25, 69–78. [Google Scholar] [CrossRef]
- Kaya, E.; Agca, M.; Adiguzel, F.; Cetin, M. Spatial data analysis with R programming for environment. Hum. Ecol. Risk Assess. Int. J. 2019, 25, 1521–1530. [Google Scholar] [CrossRef]
- Fu, B.J.; Lv, Y.H.; Gao, G.Y.; Liu, Y.; He, C.; Zhou, H.; Zhang, R.; Zhang, H. Important progress in the study of major terrestrial ecosystem services and ecological security in China. Nature 2012, 34, 261–272. [Google Scholar]
- Costanza, R.; de Groot, D.; Braat, L.; Kubiszewski, I.; Fioramonti, L.; Sutton, P.; Farber, S.; Grasso, M. Twenty years of ecosystem services: How far have we come and how far do we still need to go? Ecosyst. Serv. 2017, 28 Pt A, 1–16. [Google Scholar] [CrossRef]
- Bailey, S.C.; Zoltai, S.C.; Wiken, E.B. Ecological regionalization in Canada and the United States. Geoforum 1985, 16, 265–275. [Google Scholar] [CrossRef]
- Omernik, J.M. Ecoregions: A spatial framework for environmental management. In Biological Assessment and Criteria: Tools for Water Resource Planning and Decision Making; Lewis Publishers: Boca Raton, FL, USA, 1995; pp. 49–62. [Google Scholar]
- de Groot, R. What Are Ecosystem Services? In Treatise on Estuarine and Coastal Science; Wolanski, E., McLusky, D., Eds.; Academic Press: Cambridge, MA, USA, 2011; pp. 15–34. ISBN 9780080878850. [Google Scholar]
- Peng, J.; Hu, X.X.; Liu, Y.X.; Liu, Y.; Wu, J.S. Multifunctional landscapes identification and associated development zoning in a mountainous area. Sci. Total Environ. 2019, 660, 765–775. [Google Scholar] [CrossRef]
- Mo, W.B.; Zhao, Y.L.; Yang, N.; Xu, Z.G. Ecological function zoning based on ecosystem service bundles and trade-offs: A study of Dongjiang Lake basin, China. Environ. Sci. Pollut. Res. 2023, 30, 40388–40404. [Google Scholar] [CrossRef]
- Schneider, A.; Friedl, M.A.; Potere, D. Mapping global urban areas using MODIS 500-m data: New methods and datasets based on ‘urban ecoregions’. Remote Sens. Environ. 2010, 114, 1733–1746. [Google Scholar] [CrossRef]
- Mayor, J.R.; Sanders, N.J.; Classen, A.T.; Bardgett, R.D.; Clement, J.C.; Fajardo, A.; Lavorel, S.; Sundqvist, M.K.; Bahn, M.; Chisholm, C.; et al. Elevation alters ecosystem properties across temperate treelines globally. Nature 2017, 542, 91. [Google Scholar] [CrossRef] [PubMed]
- Petersen, T.K.; Vuorinen, K.E.M.; Bendiksby, M.; Speed, J.D.M. Climate and land use drive the functional composition of vascular plant assemblages across Norway. Nord. J. Bot. 2022, 2022, e03470. [Google Scholar] [CrossRef]
- Fu, B.J.; Chen, L.D.; Liu, G.H.; Liu, S.L.; Lu, Y.H.; Qiu, Y.; Wang, Y.F.; Li, S.G.; Zhou, H.F. Purpose, task, and characteristics of ecological zoning in China. Ecol. J. 1999, 19, 3–7. [Google Scholar]
- Fu, B.J.; Liu, Y.; Liu, Y.; Hu, X. Assessment of Land Use in National Ecological Barrier Zones; Science Publishing House: Beijing, China, 2017. [Google Scholar]
- Liu, J.; Xi, P.; Zhang, Q.; Liu, S.; Tang, Y. Scenario modeling of ecosystem service trade-offs and bundles in a semi-arid valley basin. Sci. Total Environ. 2023, 896, 166413. [Google Scholar] [CrossRef]
- Bryan, B.A.; Gao, L.; Ye, Y.; Sun, X.; Connor, J.D.; Crossman, N.D.; Stafford-Smith, M.; Wu, J.; He, C.; Yu, D.; et al. China’s response to a national land-system sustainability emergency. Nature 2018, 559, 193–204. [Google Scholar] [CrossRef]
- Li, C.; Wu, Y.; Gao, B. Multi-scenario simulation of ecosystem service value for optimization of land use in the Sichuan-Yunnan ecological barrier. China. Ecol. Indic. 2021, 132, 108328. [Google Scholar] [CrossRef]
- Cai, Y.; Zhang, F.; Duan, P.; Jim, C.Y.; Chan, N.W.; Shi, J.; Liu, C.; Wang, J.; Bahtebay, J.; Ma, X. Vegetation cover changes in China induced by ecological restoration-protection projects and land-use changes from 2000 to 2020. CATENA 2022, 217, 106530. [Google Scholar] [CrossRef]
- Wang, B.Y.; Wang, L.; Chen, J.C.; Wang, X.; Hu, Y.; Liu, Y. Identification of ecological functional zoning and its influencing factors in the Sihu Lake Basin, China. Chin. J. Appl. Ecol. 2023, 34, 2757–2766. [Google Scholar]
- Liu, Y.; Wang, L.; Wang, X.; Xiao, Y. Identification and optimization methods for delineating ecological red lines in Sichuan Province of southwest China. Ecol. Indic. 2022, 146, 2023. [Google Scholar] [CrossRef]
- Fang, J.; Liu, Y.; Wu, M.; Liu, Q.; Xu, M. New practices of land-sea coordination in coastal zone ecological security integration: A case study of Nantong. Ecol. Eng. 2024, 202, 107238. [Google Scholar] [CrossRef]
- Zhang, F.; Jia, Y.; Liu, X.; Yan, L.; Liu, S.; Gao, B. Application of MSPA-MCR models to construct ecological security pattern in the basin: A case study of Dawen River basin. Ecol. Indic. 2024, 160, 111887. [Google Scholar] [CrossRef]
- Gong, J.; Jin, T.T.; Liu, D.Q.; Lin, Z.; Xie, X.; Zhong, R.; Wang, H. Are ecosystem service bundles useful for mountainous landscape function zoning and management? A case study of Bailongjiang watershed in western China. Ecol. Indic. 2022, 134, 108495. [Google Scholar] [CrossRef]
- Zhao, X.; Shi, X.; Li, Y.; Hu, Y.; Liu, S.; Wang, Z. Spatiotemporal pattern and functional zoning of ecosystem services in the karst mountainous areas of southeastern Yunnan. Acta Geogr. Sin. 2022, 77, 736–756. [Google Scholar]
- Zou, Y.; Meng, J.J.; Wu, Y.D.; Wei, C.J.; Cheng, H.R. Ecological security regionalization of natural resources in China based on Self-organizing Feature Map neural network. Acta Ecol. Sin. 2024, 44, 171–182. [Google Scholar]
- Cui, X.F.; Deng, W.; Yang, J.X.; Huang, W.; de Vries, W.T. Construction and optimization of ecological security patterns based on a social equity perspective: A case study in Wuhan, China. Ecol. Indic. 2022, 136, 108714. [Google Scholar] [CrossRef]
- Gong, Z.; Yuan, Y.; Qie, L.; Huang, S.; Xie, X.; Zhong, R.; Pu, L. Spatiotemporal Differentiation and Coupling Coordination Relationship of the Production–Living–Ecological Function at County Scale: A Case Study of Jiangsu Province. Land 2023, 12, 2027. [Google Scholar] [CrossRef]
- Li, C.; Qiao, W.; Gao, B.; Chen, Y. Unveiling spatial heterogeneity of ecosystem services and their drivers in varied landform types: Insights from the Sichuan-Yunnan ecological barrier area. J. Clean. Prod. 2024, 442, 141158. [Google Scholar] [CrossRef]
- Fan, S.; Yan, M.; Yu, L.; Chen, B.; Zhang, L. Integrating ecosystem service supply–demand and ecological risk assessment for urban planning: A case study in Beijing, China. Ecol. Indic. 2024, 161, 111950. [Google Scholar] [CrossRef]
- Gao, C.; Pan, H. Identifying priority areas for ecological conservation and restoration based on circuit theory and dynamic weighted complex network: A case study of the Sichuan Basin. Ecol. Indic. 2023, 155, 111064. [Google Scholar] [CrossRef]
- Kim, J.; Song, Y. Integrating ecosystem services and ecological connectivity to prioritize spatial conservation on Jeju Island, South Korea. Landsc. Urban Plan. 2023, 239, 104865. [Google Scholar] [CrossRef]
- Luo, M.; Jia, X.; Zhao, Y. Ecological vulnerability assessment and its driving force based on ecological zoning in the Loess Plateau, China. Ecol. Indic. 2024, 159, 111658. [Google Scholar] [CrossRef]
- Shao, Y.; Xiao, Y.; Sang, W. Significance of ecosystem service changes indicative of territorial spatial planning in southern hilly areas. J. Ecol. 2022, 42, 8702–8712. [Google Scholar]
- Wang, L.; Li, Q.; Qiu, Q.; Hou, L.; Ouyang, J.; Zeng, R.; Huang, S.; Li, J.; Tang, L.; Liu, Y. Assessing the ecological risk induced by PM2.5 pollution in a fast developing urban agglomeration of southeastern China. J. Environ. Manag. 2022, 324, 116284. [Google Scholar] [CrossRef] [PubMed]
- Xu, A.; Hu, M.; Shi, J.; Bai, Q.; Li, X. Construction and optimization of ecological network in inland river basin based on circuit theory, complex network and ecological sensitivity: A case study of Gansu section of Heihe River Basin. Ecol. Model. 2024, 488, 110578. [Google Scholar] [CrossRef]
- Gao, M.; Hu, Y.; Liu, X.; Liang, M.; Kong, F.; Bai, Y. Delimiting Water Ecological Restoration Zones from a Multidimensional Perspective: A Case Study of Hechi City in a Typical Karst Region. J. Appl. Ecol. 2024, 35, 1661–1670. [Google Scholar]
- Wang, W.; Zhang, F.; Zhao, Q.; Liu, C.; Jim, C.Y.; Johnson, V.C.; Tan, M.L. Determining the main contributing factors to nutrient concentration in rivers in arid northwest China using partial least squares structural equation modeling. J. Environ. Manag. 2023, 343, 118249. [Google Scholar] [CrossRef]
- Lu, Y.; Yang, X.; Bian, D.; Chen, Y.; Li, Y.; Yuan, Z.; Wang, K. A novel approach for quantifying water resource spatial equilibrium based on the regional evaluation, spatiotemporal heterogeneity and geodetector analysis integrated model. J. Clean. Prod. 2023, 424, 138791. [Google Scholar] [CrossRef]
- Shi, H.; Wang, P.; Zheng, J.; Deng, Y.; Zhuang, C.; Huang, F.; Xiao, R. A comprehensive framework for identifying contributing factors of soil trace metal pollution using Geodetector and spatial bivariate analysis. Sci. Total Environ. 2023, 857, 159636. [Google Scholar] [CrossRef]
- Chang, X.; Xing, Y.; Gong, W.; Yang, C.; Guo, Z.; Wang, D.; Wang, J.; Yang, H.; Xue, G.; Yang, S. Evaluating gross primary productivity over 9 ChinaFlux sites based on random forest regression models, remote sensing, and eddy covariance data. Sci. Total Environ. 2023, 875, 162601. [Google Scholar] [CrossRef]
- Ali, S.; Ran, J.; Luan, Y. The GWR model-based regional downscaling of GRACE/GRACE-FO derived groundwater storage to investigate local-scale variations in the North China Plain. Sci. Total Environ. 2024, 908, 168239. [Google Scholar] [CrossRef] [PubMed]
- Wang, Z.; Li, X.; Zhao, H. Identifying spatial influence of urban elements on road-deposited sediment and the associated phosphorus by coupling Geodetector and Bayesian Networks. J. Environ. Manag. 2022, 315, 115170. [Google Scholar] [CrossRef] [PubMed]
- Zhao, M.Y.; Peng, J.; Liu, Y.X.; Liu, Y.; Wang, Y.L.; Zhang, L.; Hu, L.H.; Xie, C.D.; Zhao, Y. Mapping watershed-level ecosystem service bundles in the Pearl River Delta, China. Ecol. Econ. 2018, 152, 106–117. [Google Scholar] [CrossRef]
- Huang, X.; Yang, Y.; Wu, Y.; Bai, L.; Tang, S. Land use change and its impact on habitat quality in Karst Nature Reserve from 1990 to 2017. Bull. Soil Water Conserv. 2018, 38, 345–351. [Google Scholar]
- Wang, X.; Zhang, M.; Zhang, M. Changes in the ecosystem pattern of “two screens and three belts” and their influencing factors. J. Ecol. 2019, 38, 2138–2148. [Google Scholar]
- Deng, Z.Y.; Cao, J.S. Incorporating ecosystem services into functional zoning and adaptive management of natural protected areas as case study of the Shennongjia region in China. Sci. Rep. 2023, 13, 18870. [Google Scholar] [CrossRef]
- Yuan, Y.; Bai, Z.; Zhang, J.; Huang, Y. Investigating the trade-offs between the supply and demand for ecosystem services for regional spatial management. J. Environ. Manag. 2023, 325 (Pt A), 116591. [Google Scholar] [CrossRef]
- Liu, Y.; Jing, Y.; Han, S. Ecological function zoning of Nansi Lake Basin in China based on ecosystem service bundles. Environ. Sci. Pollut. Res. 2023, 30, 77343–77357. [Google Scholar] [CrossRef]
- Malinga, R.; Gordon, L.J.; Jewitt, G.; Lindborg, R. Mapping ecosystem services across scales and continents: A review. Chang. Ecosyst. Serv. 2015, 13, 57–63. [Google Scholar] [CrossRef]
- Xiao, C.; Wang, Y.; Yan, M.; Chiaka, J.C. Impact of cross-border transportation corridors on changes of land use and landscape pattern: A case study of the China-Laos railway. Landsc. Urban Plan. 2024, 241, 104924. [Google Scholar] [CrossRef]
- Yue, Z.; Xiao, C.; Feng, Z.; Wang, Y.; Yan, H. Accelerating decline of habitat quality in Chinese border areas. Resour. Conserv. Recycl. 2024, 206, 107665. [Google Scholar] [CrossRef]
- Li, J.; Peng, X.; Tang, R.; Geng, J.; Zhang, Z.; Xu, D.; Bai, T. Spatial and Temporal Variation Characteristics of Ecological Environment Quality in China from 2002 to 2019 and Influencing Factors. Land 2024, 13, 110. [Google Scholar] [CrossRef]
- Deafalla, T.H.; Csaplovics, E.; El Abbas, M.M.; Deifalla, M.H. Spatial distribution and simulation of non-timber forest products for food security in conflict areas. In The Climate-Conflict-Displacement Nexus from a Human Security Perspective; Springer: Cham, Switzerland, 2022; pp. 225–250. [Google Scholar]
- Deng, X.; Li, Z.; Gibson, J. A review on trade-off analysis of ecosystem services for sustainable land-use management. J. Geogr. Sci. 2016, 26, 953–968. [Google Scholar] [CrossRef]
- Zhou, D.; Xu, J.; Lin, Z. Conflict or coordination? Assessing land use multifunctionalization using production-living-ecology analysis. Sci. Total Environ. 2017, 577, 136–147. [Google Scholar] [CrossRef] [PubMed]
- Chen, N. A GIS-based approach for mapping direct use value of ecosystem services at a county scale: Management implications. Ecol. Econ. 2009, 68, 2768–2776. [Google Scholar] [CrossRef]
- Xu, G.; Xiong, K.; Shu, T.; Chen, L.; Li, J. Evaluating changes in ecosystem service under karst rocky desertification restoration projects: A case study of Huajiang-Guanling, Guizhou province, Southwest China. Environ. Earth Sci. 2022, 81, 302. [Google Scholar] [CrossRef]
- Gou, M.; Li, L.; Ouyang, S.; Zhang, L.; Wang, L.; Zhao, Y. Identifying and analyzing ecosystem service bundles and their socioecological drivers in the Three Gorges Reservoir Area. J. Clean. Prod. 2021, 307, 127208. [Google Scholar] [CrossRef]
- Huang, Y.; Cao, Y.; Wu, J. Evaluating the spatiotemporal dynamics of ecosystem service supply-demand risk from the perspective of service flow to support regional ecosystem management: A case study of yangtze river delta urban agglomeration. J. Clean. Prod. 2024, 460, 142598. [Google Scholar] [CrossRef]
- Huang, Z.; Li, S.; Peng, J.; Ma, X.; Ding, H.; Cheng, F.; Bi, R. Assessing ecosystem service dynamics and drivers for sustainable management in the Agro-pastoral ecotone of northern China: A spatiotemporal analysis. Ecol. Indic. 2024, 165, 112213. [Google Scholar] [CrossRef]
- Pan, Y.; Xu, Z.R.; Wu, J.X. Spatial differences of the supply of multiple ecosystem services and the environmental and land use factors affecting them. Ecosyst. Serv. 2013, 5, 4–10. [Google Scholar] [CrossRef]
- Wang, X.; Liu, X.; Long, Y.; Zhang, Y.; Liang, W.; Hong, M.; Yu, X. Spatial- temporal changes and influencing factors of ecosystem services in Shaoguan city based on improved InVEST. Res. Soil Water Conserv. 2020, 27, 381–388. [Google Scholar]
- Yin, L.; Wang, X.; Zhang, K.; Xiao, F.; Cheng, C.; Zhang, X. Ecosystem service trade-offs and synergies in national barrier areas. Geogr. Res. 2019, 38, 2162–2172. [Google Scholar]
- Yin, Y.; Li, H.; Zhang, M.; Wang, L.; Jiang, J. Spatial heterogeneity of ecosystem service trade-offs and their drivers in different climatic zones—A case study of the ecological barrier zone on the Loess Plateau in Sichuan and Yunnan. J. Ecol. 2024, 44, 107–116. [Google Scholar]
- Lu, Y.; Liu, Z.; Ye, B. Evaluation of refined ecological sensitivity on the western Sichuan Plateau. Res. Soil Water Conserv. 2016, 23, 272–277. [Google Scholar]
- Yao, K.; Yu, L.; Liu, G.; Liu, H. Evaluation of ecological environment vulnerability in Sichuan province based on SRP model. Comput. Technol. Phys. Chem. Explor. 2017, 39, 291–295. [Google Scholar]
- Sun, R.; Hu, J.; Yang, Y.; Chen, Y.; Yan, W.; Dai, X. Research on Ecological Sensitivity in Northwestern Sichuan. In Proceedings of the 5th International Conference on Resources and Environmental Research-ICRER 2023—ICRER 2023, Hong Kong, China, 2–4 December 2023; Environmental Science and Engineering. Yuan, C., Ed.; Springer: Cham, Switzerland, 2024. [Google Scholar]


Disclaimer/Publisher’s Note: The statements, opinions and data contained in all publications are solely those of the individual author(s) and contributor(s) and not of MDPI and/or the editor(s). MDPI and/or the editor(s) disclaim responsibility for any injury to people or property resulting from any ideas, methods, instructions or products referred to in the content. |
© 2024 by the authors. Licensee MDPI, Basel, Switzerland. This article is an open access article distributed under the terms and conditions of the Creative Commons Attribution (CC BY) license (https://creativecommons.org/licenses/by/4.0/).