Abstract
Regional integration strategically reorganizes spatially heterogeneous resources to maximize the overall benefits. Ecosystem services (ESs) are promising targets for regional integration due to their inherent heterogeneity and mobility, yet research in this area remains limited. This study quantifies crop production (CP), water yield (WY), carbon storage (CS), and habitat quality (HQ) for the years 2000, 2010, and 2020 using the InVEST model and identifies four ES bundles through a K-means cluster analysis. A conceptual ecosystem service flow (ESF) network at the service cluster scale is constructed based on county-level ESF data. The results reveal the following: (1) there is an upward trend in the ES budget for all services from 2000 to 2020, coupled with spatial mismatches between supply and demand; (2) deficit nodes for CP and CS services are concentrated in densely populated districts, while deficits in WY and HQ services are mainly in western Jilin Province; (3) Bundles I and II act as “sources” of ES, Bundle IV serves as a “sink”, and Bundle III is the only cluster with a CP surplus, balancing CP services across the province. In addition, this study provides ecological perspectives for understanding regional integration by suggesting differentiated integrated management for different ecosystem bundles.
1. Introduction
Over the past few decades, global economic development and urbanization have led to a continuous expansion of land for construction and an increase in human activities. These changes have caused significant alterations in various regions’ natural ecosystems, giving rise to a range of urbanization-related issues, such as population concentration and encroachment on ecological land [1]. This trend has intensified disparities in economic development across regions and widened the gap between the supply and demand of ecosystem services (ESs). As a result, areas with concentrated populations are increasingly reliant on ecological benefits from other regions. It is therefore essential to analyze the correlation between the supply and demand of ESs in each region, identify the direction of ecosystem service flows (ESFs), and provide targeted theoretical support for integrated ecological management.
The concept of regional integration can be traced back to the term “city-region”, introduced by Geddes in 1915 [2]. It is commonly used to describe the process through which spatially or administratively distinct cities within a region become increasingly interconnected [3,4], aiming to optimize overall regional benefits [5]. As a highly promising strategy for regional development, regional integration has been extensively examined from three main perspectives: physical infrastructure (such as transportation networks), functional aspects (including people, capital, services, and information) [6,7], and the integration of innovation and knowledge [8]. However, the integration of ecological resources remains less explored [5]. With the formal adoption of the United Nations Sustainable Development Goals (SDGs), harmonizing high-quality economic development with ecological environmental protection has become a pressing issue [9]. The future trajectory of sustainable environmental management is shifting from a static, resource-based approach to a more dynamic, ES-based framework [10]. By focusing on ESs, integrated management can effectively address imbalances between ecological resources and their demand [11], working towards the sustainable goal of maximizing ecological benefits [3].
As an integral part of China’s historic industrial base, a key grain-producing region, and a critical northern ecological barrier, Jilin Province plays a vital role in ensuring the nation’s five major security priorities: national defense, food security, ecological sustainability, energy reliability, and industrial resilience [12]. However, the misalignment between the province’s industrial structure and its resource distribution has hindered the full realization of its resource advantages [1]. This misalignment has exacerbated the supply–demand imbalance of ecosystem services in certain areas, complicating resource allocation. Therefore, it is crucial to assess the current status of ecosystem service supply–demand matching and to analyze potential flow trends within Jilin Province.
Currently, domestic and international scholars have extensively studied the quantification of ESs, leading to a more refined and well-established theoretical framework. Some of the resulting ES concepts can help to present the potential and distribution of different ESs and provide a basis for decision making in integrated regional ecological management [13,14]. (1) ES supply, demand, and budget. ESs are commonly understood as nature’s contributions to human well-being, encompassing a broad spectrum of goods and services derived from biodiversity to fulfill human needs [15,16]. The interplay between the supply and demand of ESs fundamentally represents the interaction between human well-being and natural resources [9]. The ES budget is defined as “the difference between the supply and demand of ESs measured in a consistent unit” [5,17], which reflects the surplus or deficit of these services within a region. (2) ESFs. As the research deepens, many studies have recognized that ESFs are key to understanding the whole process of ESs from production to consumption and to identifying the potential and actual outputs of ESs [10,18]. Considering the concept of ESF explored by scholars in the field [5,19,20], this study defines ESF as ‘the potential spatial movement of ESs from service provisioning areas to service benefiting areas, driven by natural or social factors’. (3) ES bundles. ES bundles are combinations of various ES types with the same spatial distribution, pattern characteristics, and compositional structure [21,22], which can help regional managers to simplify the confusing information carried by a large number of spatial entities (e.g., administrative units) and become the basic unit of regional ecological management [5].
Since entering the 21st century, scholars have begun to explore the theory and practice of ecosystem supply and demand services, and quantitative research on ecosystem supply and demand services has become a hot topic [12,23]. Researchers at home and abroad generally adopt multi-source data, such as remote sensing images and statistical data, to quantify ESs and reveal the characteristics of the spatial distribution of supply and demand and the matching situation through mainstream methods, such as model construction, land use estimation, spatial superposition of data, value assessment, ecological process simulation, and experts’ empirical judgment [12,24,25,26,27]. However, the existing studies mainly focus on the quantification of ESs and model optimization, and the degree of attention paid to the characteristics of ESFs is still relatively low [5]. Currently, quantitative assessments based on ESFs can be broadly classified into two categories [28]. The first is to use artificial intelligence models and SPAN algorithms to spatially simulate the transmission process of different ESs between supplying and benefiting areas, so as to visually represent and accurately measure key attributes such as the paths, flow rates, flow directions, and attenuation of regional ES transmission [29,30,31]. However, such simulations and measurements require a high degree of accuracy in data selection and model design, and previous empirical studies have mostly focused on hydrological, atmospheric, and other well-established abiotic service flows, while a general modeling framework suitable for crop production services and other types of ESs has not yet been developed. The second approach is to use matrix scoring to quantitatively evaluate the spatial and temporal status of ES supply and demand and then compare and judge their dynamic changes [17]. However, the accuracy and stability of the evaluation results are relatively low because the matrix setup is subjective and highly influenced by experts’ perceptions and preferences [32,33]. Therefore, it is of great research value to clearly and intuitively demonstrate the service flow paths and discuss how to solve the imbalance between the supply and demand of ESs through regional coordination to achieve ecological integrated development.
Given the adaptability of the relational network model and the complex, multi-objective, and multi-directional nature of ESFs [10,34], the model was employed to visualize the dynamic evolution of these flows across Jilin Province. We constructed ESF networks at the county and service bundle scales, revealed the supply–demand matching status of various ESs, as well as the direction of service flows, and determined the ecological roles played by counties/districts and service clusters in the overall scope of Jilin Province. Finally, we chose service clusters as the basic unit of management zoning and proposed differentiated management measures. Our goal is to offer comprehensive, practical guidance on ecological governance, framed within the context of regional integration.
2. Materials and Methods
2.1. Study Area
Jilin Province (121°38′–131°19′ E, 40°52′–46°18′ N) is located in the central region of Northeast China. It benefits from its strategic position along the border and proximity to the sea, sharing borders with Russia to the east and North Korea to the southeast. By 2020, Jilin Province will have a population of 25.77 million, a total area of 1.87 × 10⁵ km2, and jurisdiction over 8 prefecture-level cities, 1 autonomous prefecture, and a total of 60 districts/counties (Figure 1). The geomorphological pattern slopes distinctly from southeast to northwest, exhibiting a clear topographical gradient of higher elevations in the southeast and lower elevations in the northwest. Quantitatively, in terms of quantity alone, Jilin Province is undeniably rich in natural resources. More than four-fifths of its territory is covered by various types of vegetation, with only about 10.3% of the land classified as construction land, which possesses weak ecological functions. Land use is characterized by extensive forested areas in the east and predominantly arable land in the central and western regions. Forested land comprises nearly half of the province’s total area, making it a crucial ecological barrier in Northeast China. From the perspective of resource distribution, Jilin Province exhibits a markedly heterogeneous spatial pattern, characterized by significant economic disparities among cities. The provincial capital, Changchun, stands out with a much stronger economy compared to other areas, along with a pronounced population concentration. According to the results of grid calculation, 55.63% of the population in the study area is concentrated in three prefectural-level cities in central Jilin Province, sharing 22.84% of the forest land, 12.84% of the grassland, and 34.25% of the water bodies. These observations suggest that urban development-induced population agglomeration leads to a mismatch between the supply and demand of ESs. Consequently, in the context of regional integration, it is imperative to facilitate the flow of ecological elements and explore integrated management strategies for ecological zones. This will become a vital direction for the future practice of regional ecological governance.
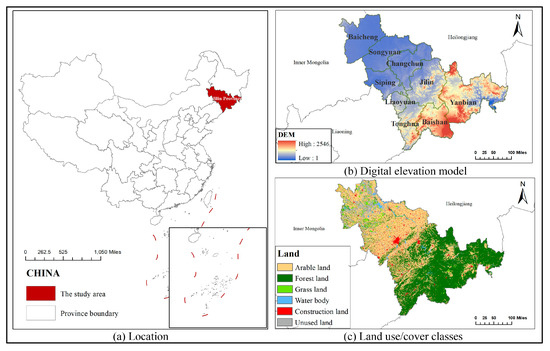
Figure 1.
Basic information of Jilin Province.
2.2. Data Source
This study utilized multi-source datasets to quantify ESs, including vector, raster, and statistical datasets. All spatial data were generated or converted into raster format (1 km × 1 km grid) using ArcGIS 10.8 and projected onto the WGS_1984_Albers coordinate system to ensure consistency across the different datasets. A detailed description of the data sources is provided in Table 1.

Table 1.
Summary of the primary data.
2.3. Research Design
With increasing levels of urbanization and industrialization, the ecological environment faces more severe challenges. We have developed a research framework to address these challenges and enhance the regional ecological governance system and its capacity. This framework aims to support the sustainable development of Jilin Province (Figure 2). First, based on the United Nations Sustainable Development Goals (SDGs), and considering the development orientation of Jilin Province and existing ecological issues, we selected four ESs. We then employed relevant methods to quantify the supply, demand, and matching of ES supply and demand at the district/county scale for the years 2000, 2010, and 2020. Second, we posited that areas with a surplus of ESs could compensate neighboring areas with a deficit of ESs. On this basis, we constructed ESF networks using counties and ES bundles as units, respectively, to reveal the overall synergistic status of regional ES supply and demand. Finally, we integrated the basic characteristics of ES bundles and ESFs and proposed differentiated management measures by initially dividing functional zones. This approach provides detailed practical guidance for ecological governance from the perspective of regional integration.
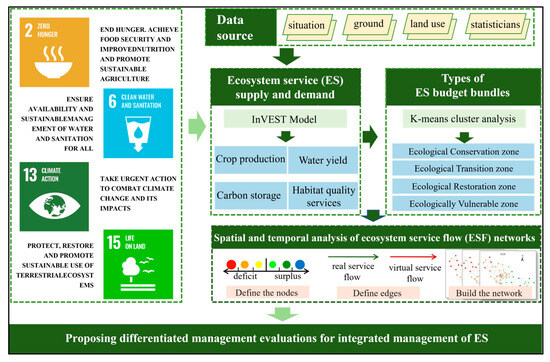
Figure 2.
The research framework of this study.
2.4. ES Supply and Demand Measurement
2.4.1. Crop Production
- Supply
As the main grain producing area in China, Jilin Province is of great research significance for quantifying the supply and demand of its crop production services. Relevant studies have shown that there is a significant linear relationship between regional crop yields and normalized vegetation index (NDVI) values [42,43]. Leveraging this relationship, we utilized maximum NDVI datasets from 2000, 2010, and 2020. To spatially allocate annual grain yields within each county, we calculated the ratio of the gridded NDVI value to the total NDVI value of the county’s cropland and used this as a coefficient to distribute the yields across grid cells.
Here, denotes food service supply (t/km2); represents the vegetation cover index of the -th raster unit; is the sum of vegetation cover indices for cropland in each county; and is the total county grain production (t).
- 2.
- Demand
Demand for crop production services mainly consists of demand for food rations and indirect food demand, of which indirect food demand includes food for feed, food for industry, food for seeds, etc. [44,45], which is closely related to the size and spatial distribution of the population. We define crop production demand by multiplying population density by an ideal per capita crop consumption quota. The per capita crop consumption quota for Jilin Province is derived from the per capita food consumption of households in Jilin Province as reported in the China Statistical Yearbook [46].
Here, denotes the demand for crop production (t/km2), represents per capita food consumption (t/person), and denotes the population density (person/km2).
2.4.2. Carbon Storage
- Supply
We utilized the Carbon Storage and Sequestration module of the InVEST model to quantify the supply capacity of carbon storage services in the study area. This model is widely regarded as a common and reliable tool for ES studies and is extensively used globally [47,48,49].
Here, CS denotes carbon stock (t/km2), and Cabove, Cbelow, Csoil, and Cdead represent aboveground biogenic, belowground biogenic, soil organic, and dead organic matter carbon, respectively (t/km2). In this study, the density values of the four major carbon pools in Jilin Province and its neighboring areas [1,12,50], taken from previous research results, were selected and collated to obtain the carbon density values of the six major land use types in Jilin Province, as shown in Table 2 below.
Table 2.
Carbon density value of each land use type (t/hm2).
- 2.
- Demand
Human activities generate carbon emissions, and in this study, the demand for carbon storage services relates to regional carbon emissions. We use regional carbon emissions as a conservative estimate of the demand for carbon storage, expressed as the product of per capita standard coal consumption and population density for each year in the Statistical Yearbook of Jilin Province [5,51].
Here, CD denotes the demand for carbon sequestration services (t/km2), and fi denotes carbon emissions per capita (t/person).
2.4.3. Water Yield
- 1.
- Supply
We utilized the Annual Water Yield module of the InVEST model to quantify regional water yield. Based on the water balance method, the water yield of each grid cell is calculated based on the precipitation, surface evaporation, plant transpiration, soil depth, and plant root depth in the study area to quantify the regional water yield [52].
Here, WS () denotes the annual water yield (mm/km2) of grid cell x for land use type i; P(x) denotes the rainfall (mm/km2) of grid cell x; and AET() denotes the actual annual average evapotranspiration (mm/km2) of grid cell x for land use type i.
- 2.
- Demand
Based on the land use data, we used the water use quota method to calculate the demand for provincial water yield services in Jilin Province. Water demand encompasses agricultural, industrial, and domestic usage. We used land use data (agricultural land, building land) and population density data to assign statistical data on these three types of water use from the Jilin Water Resources Bulletin [39] to raster cells.
Here, denotes the annual water demand (mm/km2), and , , and denote the one-year water consumption for industry, agriculture, and domestic use in the study area (mm/km2), respectively.
2.4.4. Habitat Quality
- Supply
We utilized the Habitat Quality module of the InVEST model to quantify the capacity to supply habitat quality services in the study area. Regional biodiversity was assessed using the Habitat Quality Index and Habitat Quality Degradation calculations. According to the InVEST model user manual and related literature [53,54,55], urban land, rural settlement land, and arable land are used as habitat threat factors, and the maximum impact distance and impact weight of the three types of threat factors are determined, as shown in Table 3.
Table 3.
The weight of the threat factor and maximum impact distance.
Here, represents the habitat quality of raster x in land use type i; represents the habitat suitability of land use type i; k is the half-saturation constant; and is the total threat to the habitat of raster x in land use type i.
- 2.
- Demand
To date, the calculation of habitat quality demand has not yet been accurately measured by academics. Referring to existing research [56], we set the habitat quality demand standard as the average habitat quality value for the entire area of Jilin Province. The difference between this demand standard and the habitat quality of each raster cell represents its habitat quality service demand.
2.5. Analysis of ESFs and Bundles
2.5.1. Ecosystem Service Flows (ESFs)
We incorporated the following simplifying assumptions into the ESFs model: ① the study area is regarded as a closed system, and the spatial spillover effect of the flow process of ESFs is not considered; ② taking into account the spatial mismatch between the supply and demand of ESs among counties in the study area, the areas with insufficient supply of ESFs are considered to be able to obtain the shortfall of ESs in the form of service flow from the neighboring areas; ③ this study ignores the utility loss of ESFs in the flow process; ④ the four types of ESF conditions in 2000, 2010, and 2020 are portrayed to explore the specific changes in the regional supply and demand of ESs in time and space during the stage of high-speed urban development, to further support the integrated management of regional ecology [5].
Step 1: Define the nodes. Nodes are the basis for network formation. We choose to construct the nodes of the service flow network in terms of districts/counties. There are a total of 60 districts/counties in Jilin Province, among which there is a geospatial split in the administrative area of Longjing City and Tonghua County, which are both split into 2 nodes to ensure the integrity of the network; finally, 62 nodes are obtained. At the same time, the node serial number, size, and color of the three types of features show the attribute differences between the nodes. The node number indicates the overall ranking of the ES budget of this district/county unit among all 62 districts/county units (Figure 3).
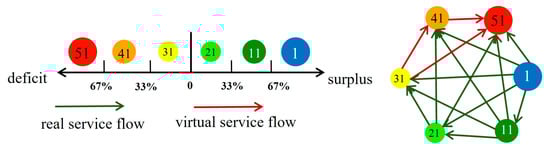
Figure 3.
Node and edge forms in the ESF network construction.
Step 2: Define edges. Edges are used to represent the connectivity of ESFs between two neighboring nodes. In this study, edges are set to exist in two forms: a real service flow, which is the flow from a node with a large surplus of the ecosystem service budget to a node with a deficit or a small surplus, and a virtual service flow, which is the flow from a node with a small deficit of the ES budget to a node with a large deficit because the source node itself is in the state of supply exceeding demand and is unable to provide additional ESFs outward. This kind of service flow is defined as virtual service flow.
Step 3: Build the network. Based on the above definitions and assumptions, we use the Gephi 0.10.1 software to map the conduction networks of different types of ESFs.
2.5.2. ES Bundles
To further realize the integrated management of supply and demand of ESs, this study generalizes district/county units with similar ES characteristics into ES bundles. We introduce a K-means cluster analysis method to analyze and identify different clustering characteristics of the ES budgets of the 62 nodes [57,58], and we determine the zoning scheme and related governance practices based on the average value of each type of ecosystem budget in each ecosystem cluster [59].
3. Results
3.1. Distributional Characteristics of the ES Budgets
3.1.1. Characteristics of Temporal Evolution
Table 4 indicates that for crop production services, the budget for food services exhibits a pattern of initially decreasing and then increasing, primarily influenced by supply factors. Overall, the supply of crop production services demonstrates a fluctuating upward trend, with a slight decline in 2010. This decline is closely linked to changes in arable land in Jilin Province. Meanwhile, shifts in dietary patterns and diversification have led to a general decline in the demand for crop production services [60,61]. Consequently, with a rising supply and decreasing demand, the budget for crop production services has generally trended upwards. The budget for carbon storage services exhibits a pattern of an initial decline followed by subsequent increases. During the first phase, both the supply and demand of carbon storage services rose, though supply growth was relatively modest. In the second phase, the demand for carbon storage services dropped significantly and the budget increased as a result. The budget for water yield services, on the other hand, shows a trend in increasing and then decreasing changes and is greatly affected by annual precipitation fluctuations, while the demand for water yield services has always shown a decreasing trend, which is related to the phenomenon of population loss in Jilin Province to a certain extent. The budget for habitat quality services has undergone a process of decreases followed by increases, with the decreases being smaller than the increases. The overall habitat quality has been somewhat enhanced and improved.
Table 4.
The overall level of supply and demand of ESs.
3.1.2. Characteristics of Spatial Evolution
The spatial distribution of the supply and demand of ESs exhibits notable differentiation (Figure 4). In terms of crop production services, cultivated land in Jilin Province is primarily located in the central and western regions, where the terrain is relatively flat. The central region also benefits from more favorable precipitation and other climatic conditions compared to the western region. Consequently, the spatial distribution of crop production services supply generally follows a pattern of being “high in the center and low in the east and west”. However, the central region is also characterized by a significant population concentration, which results in demand exceeding supply in some areas despite the relatively high provision of crop production services. The spatial distribution of the carbon storage services budget shows a gradual increase from the west to the east, with the highest levels found in the forested areas of eastern Jilin Province. However, the extent of forested land in this region is gradually decreasing, necessitating enhanced protection and management efforts. Additionally, there is minimal overlap between areas of carbon storage and carbon emissions, leading to an increasing imbalance between the supply and demand of carbon storage services as carbon emissions rise in socio-economic hubs. The budget for water yield services is relatively constrained in the central and western parts of Jilin, with higher budgets in the east. In addition, spatially, there is a tendency for the highest budget for water yield services to move from southeast to southwest from 2000 to 2010. The spatial distribution of the habitat quality services budget is markedly higher in the eastern region compared to the central and western regions. The highest budgets are concentrated in the contiguous forested areas of eastern Jilin Province, characterized by diverse and complex natural ecosystem types and structures that provide robust habitat quality services [62].

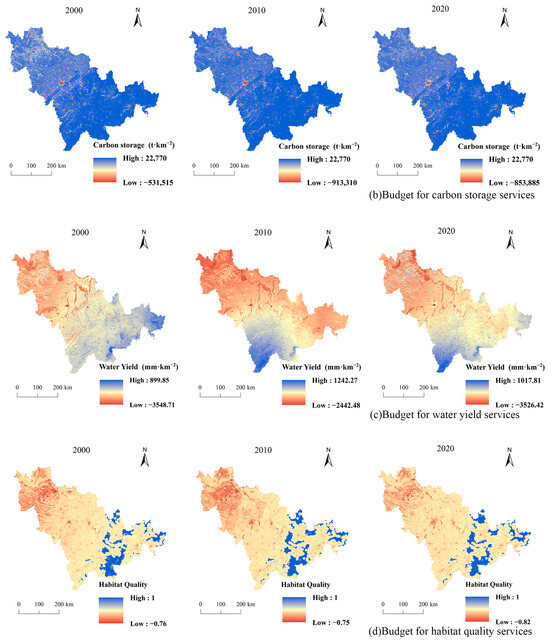
Figure 4.
Spatial distribution of the budget for ESs.
3.2. Characteristics of the Spatial and Temporal Distribution of ESF Networks
Based on the definitions and assumptions outlined in Section 2.5.1, the service flow network was visualized using Gephi software (Figure 5). The network comprises 62 nodes, each representing the surplus or deficit status of ESs within districts/counties, and 185 edges that denote the status and direction of these service flows. Notably, crop production services displayed significant geographical variability, with the western region outperforming the eastern part of Jilin Province. Throughout the study period, the number of deficit nodes initially decreased, followed by an increase. However, by 2020, the budget for crop production services across Jilin Province had generally improved, and the number of surplus nodes with service budgets greater than 9 × 10⁵ t increased from 10 to 15, all of which are concentrated in west-central Jilin Province. Regarding carbon sequestration services, Jilin Province maintained a relatively balanced state during the study period, with the most effective carbon sequestration observed in the southwestern part of the province. Notably, Tongyu County, in the northern region, identified as a key area in China’s “Three Norths” shelterbelt construction, exhibited one of the highest carbon sequestration service budgets in the province. In contrast, the urban area of Changchun City presented carbon deficit nodes, with Kuangcheng District experiencing changes in deficit status over the study period, and the imbalance of carbon storage services in this area further intensified. In addition, Jilin Province boasts extensive vegetation cover, leading to a sufficient supply of water yield services. Between 2000 and 2020, the number of deficit nodes consistently decreased, but the supply and demand of habitat quality services in Jilin Province are marked by pronounced regional disparities. Habitat quality services budgets are significantly better in the eastern region than in the western region, but in terms of nodes, the budget for habitat quality services in the western part of Jilin Province improved significantly by 2020, with the number of deficit nodes of less than −500 reduced from seven to three. Nonetheless, there are still consecutive habitat deficit nodes, resulting in an interrupted phase of habitat quality service flows in western Jilin Province, which is yet to be restored.

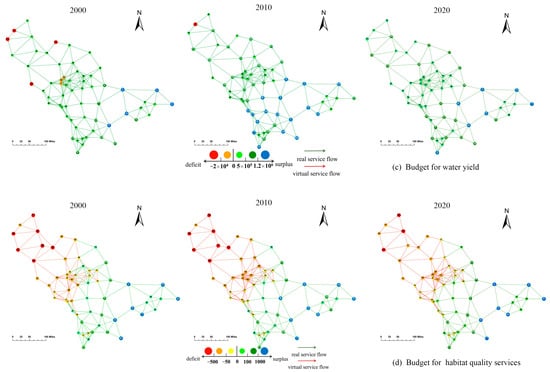
Figure 5.
Schematic diagram of the network pattern of ESFs.
3.3. Characterizing ESFs at the Cluster Scale
3.3.1. Types of ES Budget Bundles
In this study, a K-means clustering analysis was performed on 62 nodes, and four service clusters with different budget compositions were finally identified (Figure 6).
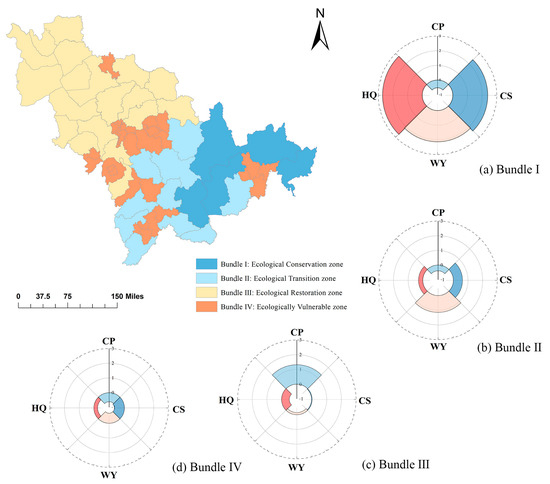
Figure 6.
Spatial patterns and wind rose diagrams of ES budget bundles in Jilin Province.
- Bundle I: Ecological Conservation Zone
Bundle I comprises five districts/counties, representing 20.54% of the area and 5.38% of the population of Jilin Province. These districts are situated in the southeastern part of the study area, within the Changbai mountainous region. The mountainous and hilly topography results in abundant natural forest resources and limited human activity, leading to a surplus of all three ESs, excluding crop production services. This region serves as a crucial ecological barrier, and we therefore designate this service bundle as an ecosystem conservation area, providing various ESs to nearby beneficiary regions.
- 2.
- Bundle II: Ecological Transition Zone
Bundle II encompasses 10 districts/counties, accounting for 20.92% of the area and 10.45% of the population of Jilin Province. This cluster is predominantly located in the transitional zone between urban development areas and ecosystem conservation zones. It consists mainly of hilly and mountainous areas rich in forest resources. While this cluster still exhibits a surplus in carbon sequestration, water yield services, and habitat quality services, the spillover of ESs is less pronounced compared to that in the ecosystem conservation areas.
- 3.
- Bundle III: Ecological Restoration Zone
Bundle III consists of 19 districts/counties, encompassing 43.05% of the area and 41.80% of the population of Jilin Province. This region is primarily situated in the central and western parts of the province, encompassing the central tableland plains as well as meadows, lakes, wetlands, and sandy areas in the west. The flat terrain and fertile soil make it a major grain-producing area, playing a critical role in balancing the province’s grain supply and demand and serving as a key commercial grain production base for China.
- 4.
- Bundle IV: Ecologically Vulnerable Zone
Bundle IV, comprising 28 districts/counties, covers 15.50% of the area and 42.37% of the population of Jilin Province. This bundle is located within the urban development centers of the province, boasting the highest population density (107,456 people/km2). It is the only cluster where all four types of ESs are in deficit, resulting in a high demand that significantly exceeds supply. This makes Bundle IV a deficit area for ESs in Jilin Province, necessitating support from adjacent regions’ ESFs.
3.3.2. The Interaction of ESs at the Cluster Scale
Additionally, we mapped the ESF network at the cluster scale (Figure 7). The spatial network relationships indicate significant potential for addressing the spatial mismatch between the supply and demand of ESs and for implementing differentiated ecological integration management in Jilin Province. Bundles I and II, which have surpluses in all three ESs except for crop production services, can provide various ESs to other clusters experiencing deficits. In contrast, Bundle IV serves as the “sink of ESs” in the province, experiencing shortages across all services and relying on inputs from other clusters to meet its ES needs. Bundle III is the only cluster with a surplus in food services, playing a crucial role in balancing crop production services across the province. The presence of surpluses or deficits in different ES budgets within these clusters indicates their roles as either providers or beneficiaries in inter-cluster relationships. For instance, Bundle III, as a beneficiary, receives carbon storage, water yield, and habitat quality services from Bundles I and II, while also supplying crop production services to meet the needs of Bundles I, II, and IV. In conclusion, the classification and visualization of ESFs can facilitate broader ES cooperation at the county scale and provide differentiated governance units for ecological integration and sustainable environmental management in Jilin Province.
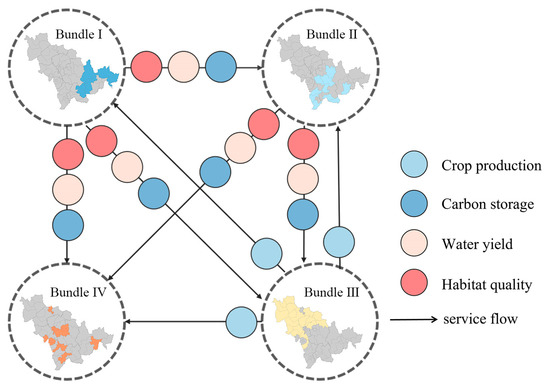
Figure 7.
ESs provider–beneficiary relationships at cluster scale.
4. Discussion
4.1. Accuracy Validity of the Model
The InVEST model is widely used and well established in the assessment of ES provisioning both domestically and internationally [12,63]. Therefore, water yield services and carbon storage services were evaluated in this study with the help of the InVEST model. However, uncertainties can arise in water production simulations due to the selection of crop coefficient (Kc) parameters which are influenced by geographical characteristics. To ensure the accuracy of the annual water yield model, this study references its results with those from previous studies [12,63,64,65]. According to the Jilin Province Water Resources Bulletin, the annual runoff volumes for the years 2000, 2010, and 2020 were 352.36, 686.67, and 58.614 billion m3, respectively. The annual average water production volumes estimated using the InVEST model in this study were 352.73, 680.36, and 58.179 billion m3, with relative errors of 0.11%, −0.92%, and −0.74%, respectively. A comparison of the results of other scholars found that the simulation results of water production in this study are close to the actual values, such as those in An Zhiying et al. [12], who reported a relative error of 1.90% for water conservation results in Northeast China using the InVEST model, and in Liu Meijuan et al. [66], who found relative errors of −4.27% and 4.15% for the Qinghai Lake Basin’s water production for the periods 1997–2009 and 2010–2020, respectively. For carbon storage services, we utilized carbon density data from comparable study areas [1,64,67]. Xiang et al. [64] reported the carbon sequestration potential in northeastern China, using net ecosystem productivity (NEP) as a model to quantify supply. The spatial distribution of NEP closely matches our findings, further supporting the credibility of the carbon density parameters used in this study.
Quantitative research on the demand for ESs often faces challenges due to data limitations and insufficient theoretical frameworks for analyzing the supply–demand balance [12]. Existing studies frequently use indicators such as population density, GDP, and land use to estimate ES demand [68,69]. However, these indicators may not fully capture the nuances of ES demand across different regions and demographic groups. In this study, we utilized data on water consumption from the Water Resources Bulletin and energy and food consumption data from the Statistical Yearbook as quantitative indicators for assessing the demand for water, carbon sequestration, and crop production services. This approach, which considers human consumption behavior, enhances the accuracy of this study’s findings and aligns with the perspectives of scholars such as Wang Xiaofeng [70] and An Zhiying [12].
4.2. Spatial and Temporal Analysis of the ES Budgets
The results of the study indicate that from 2000 to 2020, the budget for crop production services exhibited a distinct spatial distribution, with significantly higher values in the central and western regions compared to the eastern region. Over time, the supply of crop production services followed a general trend of an initial decline followed by an increase, though it fluctuated upwards overall, with a notable dip in 2010. This decline is largely due to the rapid development of Jilin Province between 2000 and 2010, characterized by the emergence of an economic model focused on ‘land finance’. This model facilitated substantial land appreciation revenues by converting arable land into construction sites, leading to both quantitative and qualitative reductions in arable land. However, the implementation of the Regulations on the Protection of Cultivated Land Quality in Jilin Province in 2010, along with the widespread promotion of soil testing, formula fertilizer application, conservation tillage technology, and the strict enforcement of the ‘Balance of Cultivated Land Occupation and Compensation’ policy during the 13th Five-Year Plan period, led to improvements in both the quality and quantity of cultivated land. Despite these advancements, it should be acknowledged that due to the limitations of many factors, the protection of arable land in Jilin Province is still plagued by such common problems as the lack of awareness of arable land protection among some farmers and the low-quality replenishment of arable land, which require the relevant departments to formulate targeted measures to further improve the quality of the work performed within the policy framework.
Spatially, the budget for carbon storage services remained relatively stable throughout the study period, with no significant shifts in node types. The highest budget was consistently observed in the Eastern Forest Region. Quantitatively, the budget exhibited a trend of an initial decline followed by an increase. During the first stage, both the supply and demand for carbon storage services grew, although the increase in supply was modest. In Jilin Province, an old industrial base in Northeast China, the pace of urbanization accelerated, leading to higher energy consumption and a corresponding rise in demand for carbon storage services. However, after 2010, as the industrial transition towards a low-carbon economy progressed, the consumption of crude coal and crude oil in the province began to decline, while the use of natural gas and primary electricity increased. This shift contributed to initial successes in carbon emission reduction, with per capita carbon emissions gradually decreasing. Consequently, the sustained reduction in demand led to a steady increase in the budget for carbon storage services.
Spatially, the budget for water yield services is markedly higher in the eastern regions compared to the central and western areas of Jilin Province. This disparity is primarily driven by two factors: the gradual decline in precipitation from east to west, and the predominance of arable land in the central and western regions, where substantial quantities of water are required for agricultural irrigation, further intensifying the pressure on water use. In terms of quantity, Jilin Province benefits from extensive vegetation cover, resulting in a generally sufficient supply of water yield services. Notably, the number of deficit nodes steadily decreased from 2000 to 2020, a trend which is attributable, on one hand, to the sustained efforts in ecological governance within the province, and on the other hand, to the reduced demand for water source containment due to population loss.
Habitat quality services exhibit a spatial distribution pattern similar to that of water yield and carbon storage services, with significantly higher values in the eastern regions compared to the central and western parts of Jilin Province. Quantitatively, habitat quality has experienced a period of decline followed by subsequent improvement. Following the reform and opening up, urban expansion in cities like Changchun, Jilin, and Songyuan led to a marked increase in construction land and farmland, while the areas of grassland and unused land significantly decreased. This shift caused a rise in the extent of very-low-quality habitats and a reduction in both high- and low-quality habitats, resulting in a continuous decline in the overall habitat quality. However, in recent years, the implementation of ecological protection policies, such as the water, forest, field, lake, and grass ecological restoration projects in the Changbai Mountain area and Chagan Lake, has mitigated the decline in habitat quality. Consequently, the reduction in the budget for habitat quality services has been outweighed by subsequent gains, leading to a significant overall enhancement and improvement in habitat quality across the province.
4.3. Integrated Management of ESs
Identifying distinct functional areas is crucial for effective planning and management [71]. In this study, we categorized the 62 study units into four distinct service bundles based on their similar ES budget characteristics. These bundles serve as foundational units for applying integrated management strategies aimed at addressing regional ecological sustainability challenges. Based on this study’s findings, we offer recommendations for the integrated management of ESs in two main areas: (1) enhancing the budget of ESs within each bundle by either increasing the service supply or reducing the service demand; (2) improving the flow of ESs and fostering effective ecological cooperation among the different service clusters.
From the former perspective, each service bundle can optimize its ES budget by managing its supply/demand. Bundle IV, encompassing districts and counties with concentrated economic development in Jilin Province, faces significant ecological deficits due to its high population density. Given the limited ecological land in these areas, we recommend that government interventions employ diversified strategies. Continuously promote the low-carbon transformation of leading industries, such as automobiles, based on the advantages of the Changbai Mountain ecological resources and other characteristics of the industry, to build a multi-point support, multi-industry, and multi-development of the new pattern of industry. Additionally, policies such as residential space restrictions and the development of public transportation networks can help mitigate environmental pressures by decentralizing population density and reducing congestion. It should be noted, however, that such policies need to be implemented with rigorous urban planning to avoid urban sprawl and encroachment on natural or semi-natural areas. For Bundle III, which plays a critical role in regional food security, spatial planning should prioritize crop production. Conservation tillage practices, such as the “Li Shu model”, should be further expanded to capitalize on the unique characteristics of the black soil region. Widely implemented in Northeast China, this model utilizes no-tillage sowing combined with full straw cover to deliver multiple ecological and agricultural benefits. These include retaining soil moisture, preventing wind and water erosion, enhancing soil fertility, and reducing cultivation costs. By promoting these methods, the “Li Shu model” plays a crucial role in driving the sustainable transformation and modernization of agricultural production systems. In the western part of Jilin, where wetlands are prevalent, ongoing ecological protection is essential. Implementing key projects such as river and lake connectivity, afforestation, and wetland restoration will improve carbon storage and habitat quality services and support the development of an ecological economy [72,73]. Bundles I and II, situated in the eastern mountainous regions of Jilin Province, serve as key “sources of ESs” due to their abundant forest resources. High-quality forestry in these clusters not only provides substantial supporting and regulating services but also holds significant economic value. Therefore, it is advisable to implement integrated forestry policies in these areas to balance developmental needs with conservation efforts.
In addition, the spatial heterogeneity caused by urbanization, such as differences in population and resources, appears to be an inevitable challenge [3]. Therefore, it is crucial to establish mechanisms that facilitate the smooth flow and sharing of ecological resources, ensuring sustainable ecosystem development through their exchange and circulation. Crop production services flow mainly in the form of the transportation of crops from rural areas to areas with high population concentrations. Efforts should be focused on enhancing food storage, logistics, and emergency response capabilities, as well as constructing a modern food storage and logistics infrastructure system. Additionally, the government can encourage crop branding certification and the development of rural e-commerce through targeted policy measures. Although Jilin Province has a relatively strong capacity for water resource output, urban challenges such as flooding, river pollution, and black, odorous water bodies persist. There is a need to address deficiencies in drainage infrastructure and actively explore a “conservation-first, function-first, effect-first” approach to developing sponge cities in the northeastern region. Regarding habitat quality services and carbon storage services, which are non-competitive and non-exclusive in nature, local governments should employ public governance strategies to protect the interests of surplus areas and prevent free-rider problems. For example, an ecological compensation mechanism could be established, providing administrative incentives or financial subsidies to surplus or deficit zones and counties based on predetermined compensation standards and methods. In addition, the government could consider piloting a carbon emissions trading system in the region to address the imbalance between carbon emissions and absorption through market-based mechanisms. Simultaneously, it is crucial to establish a robust regulatory framework to ensure that the policy is implemented effectively and without deviation from its intended goals. These initiatives would not only incentivize local governments to actively participate in ecological protection but also reinforce the principle that “clear waters and green mountains as invaluable assets”.
4.4. Limitations
Our study addresses the imbalances between ES supply and demand within the framework of regional integrated management. Despite our comprehensive discussion and analysis, some limitations warrant further investigation.
Firstly, due to data availability and measurement tool limitations, the ESFs we mapped are preliminary descriptions of transport directions rather than precise representations of real-world dynamics. For instance, the reduction in carbon storage and habitat quality during transport was not deeply explored in this study. Additionally, it is important to recognize that ESFs are not confined by narrow administrative or biophysical boundaries [15]. However, in this research, we focused solely on the spatial and temporal movement patterns of ESFs within Jilin Province and did not account for interactions with external systems. This may lead to discrepancies, particularly in the depiction of large-scale and extensive flows, such as those related to crop production services.
Moreover, we did not consider the interactions between different ESs when formulating integrated management recommendations. For example, while road infrastructure development facilitates the transport of crop production services, it can also pose a significant barrier to biodiversity. The effects of various management measures on ESFs are complex and dynamic, requiring further exploration by researchers across multiple disciplines.
5. Conclusions
In this study, we address the supply–demand mismatches between ESs from the perspective of regional integrated management. Taking Jilin Province as the study area, we reflect the mismatches between the supply and demand of ESs, potential flows, and zonal management units from the three dimensions of ES budgets, service flows, and service bundles, respectively, and ultimately put forward policy recommendations for the integrated management of ecosystems. The key conclusions are as follows:
(1) Over time, the supply, demand, and budget for water yield services and crop production services have shown increases of varying magnitudes. The demand and budget for carbon storage services are also on an upward trend, while the supply is decreasing. For habitat quality services, the supply has remained relatively stable, with a decreasing trend in demand and an increasing trend in the budget.
(2) In terms of the spatial distribution pattern, the spatial distribution of crop production services in Jilin Province exhibits a “high in the middle, low in the east and west” pattern. However, due to significant population concentrations in certain central areas, there remains a shortfall in the supply of these services. The budget for carbon storage services shows a gradual increase from the western to the eastern parts of the province. Notably, there is a trend of decreasing forest land area in eastern Jilin, indicating the need for enhanced forest protection and management. The budget for water yield services is particularly strained in the central and western regions, a situation exacerbated by relatively low rainfall and substantial water usage for irrigation. Lastly, the budget for habitat quality services is considerably higher in the eastern part of Jilin compared to the central and western regions. The flow of habitat quality services in the western part of the province is currently disrupted, with contiguous deficit nodes, indicating significant potential for improvement in these areas.
(3) Under an ecologically integrated management approach, diverse ESs can extend benefits to surrounding districts/counties through potential service flows. By categorizing the four service bundles and identifying two types of service flows, we developed a conceptual ESF network at both the district/county and cluster scales. Based on this framework, we propose two key dimensions for the integrated management of ESs: (1) increasing the budget of ESs within clusters, and (2) enhancing the efficiency of ESFs. The first dimension focuses on optimizing ES budgets by managing the internal supply and demand, while the second dimension aims to improve the flow and exchange efficiency of ecological elements through streamlined ecological flow and sharing mechanisms. This dual approach fosters effective ecological cooperation among service clusters, thereby promoting the sustainable development of ESs. Our methodology not only provides a theoretical basis for regional ecological integration in Jilin Province but also holds potential for replicability in other regions of China and beyond, offering practical insights into achieving the development goal of “clear waters and green mountains as invaluable assets”.
Author Contributions
Conceptualization, J.W. and S.L.; data curation, J.W., X.J., Y.Z. and G.W.; formal analysis, X.J., D.L., Y.Z. and G.W.; funding acquisition, S.L. and D.L.; methodology, J.W.; project administration, S.L.; resources, X.J., D.L. and J.W.; software, J.W.; supervision, J.W., D.L. and S.L.; validation, X.J., Y.Z. and G.W.; visualization, X.J., Y.Z. and G.W.; writing—original draft, X.J.; writing—review and editing, D.L. and J.W. All authors have read and agreed to the published version of the manuscript.
Funding
This research was funded by Natural Science Foundation of Jilin Province, China (Grant No. 20210101395JC).
Data Availability Statement
The original contributions presented in the study are included in the article material, further inquiries can be directed to the corresponding author.
Conflicts of Interest
The authors declare no conflicts of interest.
References
- Li, Y.; Liu, Z.; Li, S.; Li, X.; Wang, W. Spatiotemporal Patterning and Matching of Ecosystem Services’ Supply and Demand in Changchun, China. Land 2023, 12, 2101. [Google Scholar] [CrossRef]
- Cities in Evolution: An Introduction to the Town Planning Movement and to the Study of Civics. Geogr. J. 1916, 47, 309–311. [CrossRef][Green Version]
- Cao, Z.; Derudder, B.; Peng, Z. Comparing the physical, functional and knowledge integration of the Yangtze River Delta city-region through the lens of inter-city networks. Cities 2018, 82, 119–126. [Google Scholar] [CrossRef]
- Meijers, E. Polycentric urban regions and the quest for synergy: Is a network of cities more than the sum of the parts? Urban Stud. 2005, 42, 765–781. [Google Scholar] [CrossRef]
- Lyu, Y.; Wu, C. Managing the supply-demand mismatches and potential flows of ecosystem services from the perspective of regional integration: A case study of Hangzhou, China. Sci. Total Environ. 2023, 902, 165918. [Google Scholar] [CrossRef]
- Camagni, R.; Capello, R.; Caragliu, A. The Rise of Second-Rank Cities: What Role for Agglomeration Economies? Eur. Plan. Stud. 2015, 23, 1069–1089. [Google Scholar] [CrossRef]
- Manuel Redondo, J.; Olivar, G.; Ibarra-Vega, D.; Dyner, I. Modeling for the regional integration of electricity markets. Energy Sustain. Dev. 2018, 43, 100–113. [Google Scholar] [CrossRef]
- Kraetke, S.; Brandt, A. Knowledge Networks as a Regional Development Resource: A Network Analysis of the Interlinks between Scientific Institutions and Regional Firms in the Metropolitan region of Hanover, Germany. Eur. Plan. Stud. 2009, 17, 43–63. [Google Scholar] [CrossRef]
- Liu, J. Leveraging the metacoupling framework for sustainability science and global sustainable development. Natl. Sci. Rev. 2023, 10, nwad090. [Google Scholar] [CrossRef]
- Wang, Z.; Zhang, L.; Li, X.; Li, Y.; Frans, V.F.; Yan, J. A network perspective for mapping freshwater service flows at the watershed scale. Ecosyst. Serv. 2020, 45, 101129. [Google Scholar] [CrossRef]
- Cai, W.; Wu, T.; Jiang, W.; Peng, W.; Cai, Y. Integrating Ecosystem Services Supply-Demand and Spatial Relationships for Intercity Cooperation: A Case Study of the Yangtze River Delta. Sustainability 2020, 12, 4131. [Google Scholar] [CrossRef]
- An, Z.; Sun, C.; Hao, S. Matching relationship between supply and demand of ecosystem services from the perspective of water-energy-food nexus in Northeast China. Acta Ecol. Sin. 2024, 44, 4170–4186. [Google Scholar] [CrossRef]
- Hou, Y.; Ding, S.; Chen, W.; Li, B.; Burkhard, B.; Bicking, S.; Mueller, F. Ecosystem service potential, flow, demand and their spatial associations: A comparison of the nutrient retention service between a human- and a nature-dominated watershed. Sci. Total Environ. 2020, 748, 141341. [Google Scholar] [CrossRef] [PubMed]
- Li, K.; Hou, Y.; Andersen, P.S.; Xin, R.; Rong, Y.; Skov-Petersen, H. An ecological perspective for understanding regional integration based on ecosystem service budgets, bundles, and flows: A case study of the Jinan metropolitan area in China. J. Environ. Manag. 2022, 305, 114371. [Google Scholar] [CrossRef] [PubMed]
- Shakya, B.; Uddin, K.; Shaoliang, Y.; Bhatta, L.D.; Lodhi, M.S.; Htun, N.Z.; Yongping, Y. Mapping of the ecosystem services flow from three protected areas in the far-eastern Himalayan Landscape: An impetus to regional cooperation. Ecosyst. Serv. 2021, 47, 101222. [Google Scholar] [CrossRef]
- Wainger, L.A.; King, D.M.; Mack, R.N.; Price, E.W.; Maslin, T. Can the concept of ecosystem services be practically applied to improve natural resource management decisions? Ecol. Econ. 2010, 69, 978–987. [Google Scholar] [CrossRef]
- Burkhard, B.; Kroll, F.; Nedkov, S.; Mueller, F. Mapping ecosystem service supply, demand and budgets. Ecol. Indic. 2012, 21, 17–29. [Google Scholar] [CrossRef]
- Serna-Chavez, H.M.; Schulp, C.J.E.; van Bodegom, P.M.; Bouten, W.; Verburg, P.H.; Davidson, M.D. A quantitative framework for assessing spatial flows of ecosystem services. Ecol. Indic. 2014, 39, 24–33. [Google Scholar] [CrossRef]
- Bagstad, K.J.; Johnson, G.W.; Voigt, B.; Villa, F. Spatial dynamics of ecosystem service flows: A comprehensive approach to quantifying actual services. Ecosyst. Serv. 2013, 4, 117–125. [Google Scholar] [CrossRef]
- Schirpke, U.; Candiago, S.; Vigl, L.E.; Jager, H.; Labadini, A.; Marsoner, T.; Meisch, C.; Tasser, E.; Tappeiner, U. Integrating supply, flow and demand to enhance the understanding of interactions among multiple ecosystem services. Sci. Total Environ. 2019, 651, 928–941. [Google Scholar] [CrossRef]
- Wu, F.; Shui, W.; Ma, Y.; Wu, Y.; Guo, M.; Yang, C.; Wang, Z. Ecological function zoning of the Pearl River source area based on ecosystem service clusters. J. Hydroecol. 2024, 1–14. [Google Scholar] [CrossRef]
- Peng, L.; Deng, W.; Huang, P.; Liu, Y. Evaluation of multiple ecosystem services landscape index and identification of ecosystem services bundles in Sichuan Basin. Acta Ecol. Sin. 2021, 41, 9328–9340. [Google Scholar]
- Larondelle, N.; Lauf, S. Balancing demand and supply of multiple urban ecosystem services on different spatial scales. Ecosyst. Serv. 2016, 22, 18–31. [Google Scholar] [CrossRef]
- Kroll, F.; Mueller, F.; Haase, D.; Fohrer, N. Rural-urban gradient analysis of ecosystem services supply and demand dynamics. Land Use Policy 2012, 29, 521–535. [Google Scholar] [CrossRef]
- Palomo, I.; Martin-Lopez, B.; Potschin, M.; Haines-Young, R.; Montes, C. National Parks, buffer zones and surrounding lands: Mapping ecosystem service flows. Ecosyst. Serv. 2013, 4, 104–116. [Google Scholar] [CrossRef]
- Jager, H.I.; Nair, S.S.; Efroymson, R.A.; DeRolph, C.R.; Parish, E.S.; Wang, G. Ecosystem services from partially harvested riparian buffers can offset biomass production costs. Sci. Total Environ. 2023, 889, 164199. [Google Scholar] [CrossRef]
- Aziz, T. Accounting impacts of renewable energy expansions on ecosystem services to balance the trade-offs. Sci. Total Environ. 2023, 879, 162990. [Google Scholar] [CrossRef]
- Yao, J.; He, X.; Chen, W. The latest progress in ecosystem service flow research methods. Chin. J. Appl. Ecol. 2018, 29, 335–342. [Google Scholar] [CrossRef]
- Zank, B.; Bagstad, K.J.; Voigt, B.; Villa, F. Modeling the effects of urban expansion on natural capital stocks and ecosystem service flows: A case study in the Puget Sound, Washington, USA. Landsc. Urban Plan. 2016, 149, 31–42. [Google Scholar] [CrossRef]
- Funk, A.; Martinez-Lopez, J.; Borgwardt, F.; Trauner, D.; Bagstad, K.J.; Balbi, S.; Magrach, A.; Villa, F.; Hein, T. Identification of conservation and restoration priority areas in the Danube River based on the multi-functionality of river-floodplain systems. Sci. Total Environ. 2019, 654, 763–777. [Google Scholar] [CrossRef]
- Bagstad, K.J.; Semmens, D.J.; Ancona, Z.H.; Sherrouse, B.C. Evaluating alternative methods for biophysical and cultural ecosystem services hotspot mapping in natural resource planning. Landsc. Ecol. 2017, 32, 77–97. [Google Scholar] [CrossRef]
- Hou, Y.; Burkhard, B.; Mueller, F. Uncertainties in landscape analysis and ecosystem service assessment. J. Environ. Manag. 2013, 127, S117–S131. [Google Scholar] [CrossRef] [PubMed]
- Campagne, C.S.; Roche, P.; Gosselin, F.; Tschanz, L.; Tatoni, T. Expert-based ecosystem services capacity matrices: Dealing with scoring variability. Ecol. Indic. 2017, 79, 63–72. [Google Scholar] [CrossRef]
- Field, R.D.; Parrott, L. Multi-ecosystem services networks: A new perspective for assessing landscape connectivity and resilience. Ecol. Complex. 2017, 32, 31–41. [Google Scholar] [CrossRef]
- China Soil Map Based Harmonized World Soil Database (HWSD)(v1.1) (2009). Available online: https://poles.tpdc.ac.cn/zh-hans/ (accessed on 13 August 2024).
- Yan, F.; Wei, S.; Zhang, J.; Hu, B. Depth-to-bedrock map of China at a spatial resolution of 100 meters. Sci. Data 2020, 7, 2. [Google Scholar] [CrossRef]
- World Pop Hub. Available online: https://hub.worldpop.org/ (accessed on 13 August 2024).
- Jilin Statistical Yearbook. Available online: http://tjj.jl.gov.cn/zwgk/ (accessed on 13 August 2024).
- Jilin Water Resources Bulletin. Available online: http://slt.jl.gov.cn/zwgk/szygb/ (accessed on 13 August 2024).
- Resource and Environment Science Data Center of the Chinese Academy of Science. Available online: https://www.resdc.cn/ (accessed on 13 August 2024).
- National Earth System Science Data Center, National Science & Technology Infrastructure of China. Available online: http://www.geodata.cn (accessed on 13 August 2024).
- Panek, E.; Gozdowski, D. Analysis of relationship between cereal yield and NDVI for selected regions of Central Europe based on MODIS satellite data. Remote Sens. Appl.-Soc. Environ. 2020, 17, 100286. [Google Scholar] [CrossRef]
- Zhao, W.; He, Z.; He, J.; Zhu, L. Remote sensing estimation for winter wheat yield in Henan based on the MODIS-NDVl data. Geogr. Res. 2012, 31, 2310–2320. [Google Scholar]
- Tang, H.; Li, Z. Study on Per Capita Grain Demand Based on Chinese Reasonable Dietary Pattern. Sci. Agric. Sin. 2012, 45, 2315–2327. [Google Scholar]
- Meng, Z.; Li, G. An empirical analysis of the fluctuation of food demand trends and structural changes in China. Stat. Decis. 2021, 37, 69–72. [Google Scholar] [CrossRef]
- National Bureau of Statistics. Available online: https://www.stats.gov.cn/sj/ndsj/ (accessed on 13 August 2024).
- Huang, W.; Guo, L.; Zhang, T.; Chen, T.; Chen, L.; Li, L.; Zhang, X. The Impact of Territorial Spatial Transformation on Carbon Storage: A Case Study of Suqian, East China. Land 2024, 13, 348. [Google Scholar] [CrossRef]
- Li, L.; Song, Y.; Wei, X.; Dong, J. Exploring the impacts of urban growth on carbon storage under integrated spatial regulation: A case study of Wuhan, China. Ecol. Indic. 2020, 111, 106064. [Google Scholar] [CrossRef]
- Nelson, E.; Sander, H.; Hawthorne, P.; Conte, M.; Ennaanay, D.; Wolny, S.; Manson, S.; Polasky, S. Projecting Global Land-Use Change and Its Effect on Ecosystem Service Provision and Biodiversity with Simple Models. PLoS ONE 2010, 5, e14327. [Google Scholar] [CrossRef] [PubMed]
- Feng, L.; Lei, G. Study on Spatial-temporal Evolution Characteristics and Functional Zoning of Ecosystem Services and Trade-offs/Synergies Relationships in Northeastern China. China Land Sci. 2023, 37, 100–113. [Google Scholar]
- Chen, J.T.; Zhou, C.Y.; He, N.; Wu, Y.P. Optimal acquisition time to discriminate between breast cancer subtypes with contrast-enhanced cone-beam CT. Diagn. Interv. Imaging 2020, 101, 391–399. [Google Scholar] [CrossRef] [PubMed]
- Sharps, K.; Masante, D.; Thomas, A.; Jackson, B.; Redhead, J.; May, L.; Prosser, H.; Cosby, B.; Emmett, B.; Jones, L. Comparing strengths and weaknesses of three ecosystem services modelling tools in a diverse UK river catchment. Sci. Total Environ. 2017, 584, 118–130. [Google Scholar] [CrossRef]
- Huang, M.; Yue, W.; Feng, S.; Zhang, J. Spatial-temporal evolution of habitat quality and analysis of landscape patterns in Dabie Mountain area of west Anhui province based on InVEST model. Acta Ecol. Sin. 2020, 40, 2895–2906. [Google Scholar]
- Shang, J.; Cai, H.; Long, Y.; Zeng, J.; Chen, Y.; Zhang, X. Temporal-Spatial Distribution and Transition of Habitat Quality in PoyancLake Region Based on InVEST Model. Resour. Environ. Yangtze Basin 2021, 30, 1901–1915. [Google Scholar]
- Liu, Y.; Zhou, Y.; Du, Y. Study on the Spatio-Temporal Patterns of Habitat Quality and its TerrainGradient Effects of the Middle of the Yangtze River Economic Belt Based onInVEST Model. Resour. Environ. Yangtze Basin 2019, 28, 2429–2440. [Google Scholar]
- Yang, Y.; Li, J.; Wang, L.; Wang, Z.; Yao, C.; Wang, Y. Impact of urbanization on supply and demand of typical ecosystem services in Yangtze River Delta. J. Nat. Resour. 2022, 37, 1555–1571. [Google Scholar] [CrossRef]
- Raudsepp-Hearne, C.; Peterson, G.D.; Bennett, E.M. Ecosystem service bundles for analyzing tradeoffs in diverse landscapes. Proc. Natl. Acad. Sci. USA 2010, 107, 5242–5247. [Google Scholar] [CrossRef]
- Hamann, M.; Biggs, R.; Reyers, B. Mapping social-ecological systems: Identifying ‘green-loop’ and ‘red-loop’ dynamics based on characteristic bundles of ecosystem service use. Glob. Environ. Change-Hum. Policy Dimens. 2015, 34, 218–226. [Google Scholar] [CrossRef]
- Cao, Y.; Li, G.; Tian, Y.; Fang, X.; Li, Y.; Tan, Y. Linking ecosystem services trade-offs, bundles and hotspot identification with cropland management in the coastal Hangzhou Bay area of China. Land Use Policy 2020, 97, 104689. [Google Scholar] [CrossRef]
- Huang, J.; Xie, W. China’s Future Food Supply and Demand: Prospects and Policies. Front. Sci. Technol. Eng. Manag. 2022, 41, 17–25. [Google Scholar]
- Zeng, X.; Zhang, Z.; Wang, J.; Zhao, Y. Analysis and Prospect of China’s Food Consumption. Agric. Outlook 2021, 17, 104–114. [Google Scholar]
- Deng, G.; Yang, X.; Xu, G.; Fu, J.; Mo, L.; Yang, M.; Ling, Y.; Li, L.; Li, W.; Cai, Z. Land use change and habitat quality evolution in county level in Nanxiong Basin, northern Guangdong Province. J. Chin. Urban For. 2024, 1–11. [Google Scholar]
- Yin, D.; Yu, H.; Shi, Y.; Zhao, M.; Zhang, J.; Li, X. Matching supply and demand for ecosystem services in the Yellow River Basin, China: A perspective of the water-energy-food nexus. J. Clean. Prod. 2023, 384, 135469. [Google Scholar] [CrossRef]
- Xiang, H.; Zhang, J.; Mao, D.; Wang, Z.; Qiu, Z.; Yan, H. Identifying spatial similarities and mismatches between supply and demand of ecosystem services for sustainable Northeast China. Ecol. Indic. 2022, 134, 108501. [Google Scholar] [CrossRef]
- Zhao, Y.; Zhou, J.; Lei, L.; Xiang, J.; Huang, M.; Feng, W.; Zhu, G.; Wei, W.; Wang, j. Identification of drivers for water yield in the upstream of Shiyang River based on InVEST model. Chin. J. Ecol. 2019, 38, 3789–3799. [Google Scholar] [CrossRef]
- Liu, M.; Zhong, J.; Wang, B.; Mi, W. Spatiotemporal change and driving factor analysis of the Qinghai LakeBasin based on InVEST mode. Sci. Geogr. Sin. 2023, 43, 411–422. [Google Scholar] [CrossRef]
- Li, X.; Liu, Z.; Li, S.; Li, Y.; Wang, W. Urban Land Carbon Emission and Carbon Emission Intensity Prediction Based on Patch-Generating Land Use Simulation Model and Grid with Multiple Scenarios in Tianjin. Land 2023, 12, 2160. [Google Scholar] [CrossRef]
- Zhai, T.; Wang, J.; Jin, Z.; Qi, Y. Change and correlation analysis of the supply-demand pattern of ecosystem services in the Yangtze River Economic Belt. Acta Ecol. Sin. 2019, 39, 5414–5424. [Google Scholar]
- Zhuang, S.; Gong, J.; Chen, K.; Li, J. Supply and demand matching characteristics of cultural ecosystem services of small parks and greenbelts in the Guangdong-Hong Kong-MacaoGreater Bay Area. Acta Ecol. Sin. 2023, 43, 5714–5725. [Google Scholar]
- Wang, X.; Yao, W.; Feng, X.; Jia, Z.; Zhang, X.; Ma, J.; Zhou, j.; Tu, Y.; Sun, Z. Changes and driving factors of ecosystem services supply and demand on the Tibetan plateau. Acta Ecol. Sin. 2023, 43, 6968–6982. [Google Scholar] [CrossRef]
- Lyu, Y.; Wang, M.; Zou, Y.; Wu, C. Mapping trade-offs among urban fringe land use functions to accurately support spatial planning. Sci. Total Environ. 2022, 802, 149915. [Google Scholar] [CrossRef] [PubMed]
- Fagerholm, N.; Eilola, S.; Arki, V. Outdoor recreation and nature’s contribution to well-being in a pandemic situation-Case Turku, Finland. Urban For. Urban Green. 2021, 64, 127257. [Google Scholar] [CrossRef]
- Johnson, J.A.; Jones, S.K.; Wood, S.L.R.; Chaplin-Kramer, R.; Hawthorne, P.L.; Mulligan, M.; Pennington, D.; DeClerck, F.A. Mapping Ecosystem Services to Human Well-being: A toolkit to support integrated landscape management for the SDGs. Ecol. Appl. 2019, 29, e01985. [Google Scholar] [CrossRef]


Disclaimer/Publisher’s Note: The statements, opinions and data contained in all publications are solely those of the individual author(s) and contributor(s) and not of MDPI and/or the editor(s). MDPI and/or the editor(s) disclaim responsibility for any injury to people or property resulting from any ideas, methods, instructions or products referred to in the content. |
© 2024 by the authors. Licensee MDPI, Basel, Switzerland. This article is an open access article distributed under the terms and conditions of the Creative Commons Attribution (CC BY) license (https://creativecommons.org/licenses/by/4.0/).