
A Cost–Benefit Analysis for the Economic Evaluation of Ecosystem Services Lost Due to Erosion in a Mediterranean River Basin

 , , , and
Abstract
:1. Introduction
- All European soils are healthy and more resilient and can continue to provide their fundamental services (ecosystem services);
- Net land consumption is reduced to zero, and soil pollution is brought back to levels that are not harmful to people’s health or ecosystems;
- The soils are protected and managed in a sustainable way, also restoring those currently degraded.
- The presentation of a European law for the protection of soil health, which incorporates all the contents of the strategy;
- Sustainable soil management, i.e., a European soil management practice, promoted through specific actions of the Community Agricultural Policy, aimed at sharing and developing the best agronomic management practices, and through free soil analysis agricultural campaigns;
- Encourage the accumulation of organic carbon in soils to mitigate the effects of climate change, including through legislative actions that protect and constrain wetlands and organic soils;
- The prevention of desertification through the development of a common methodology to evaluate its level and prevent land degradation [10].
2. Materials and Methods
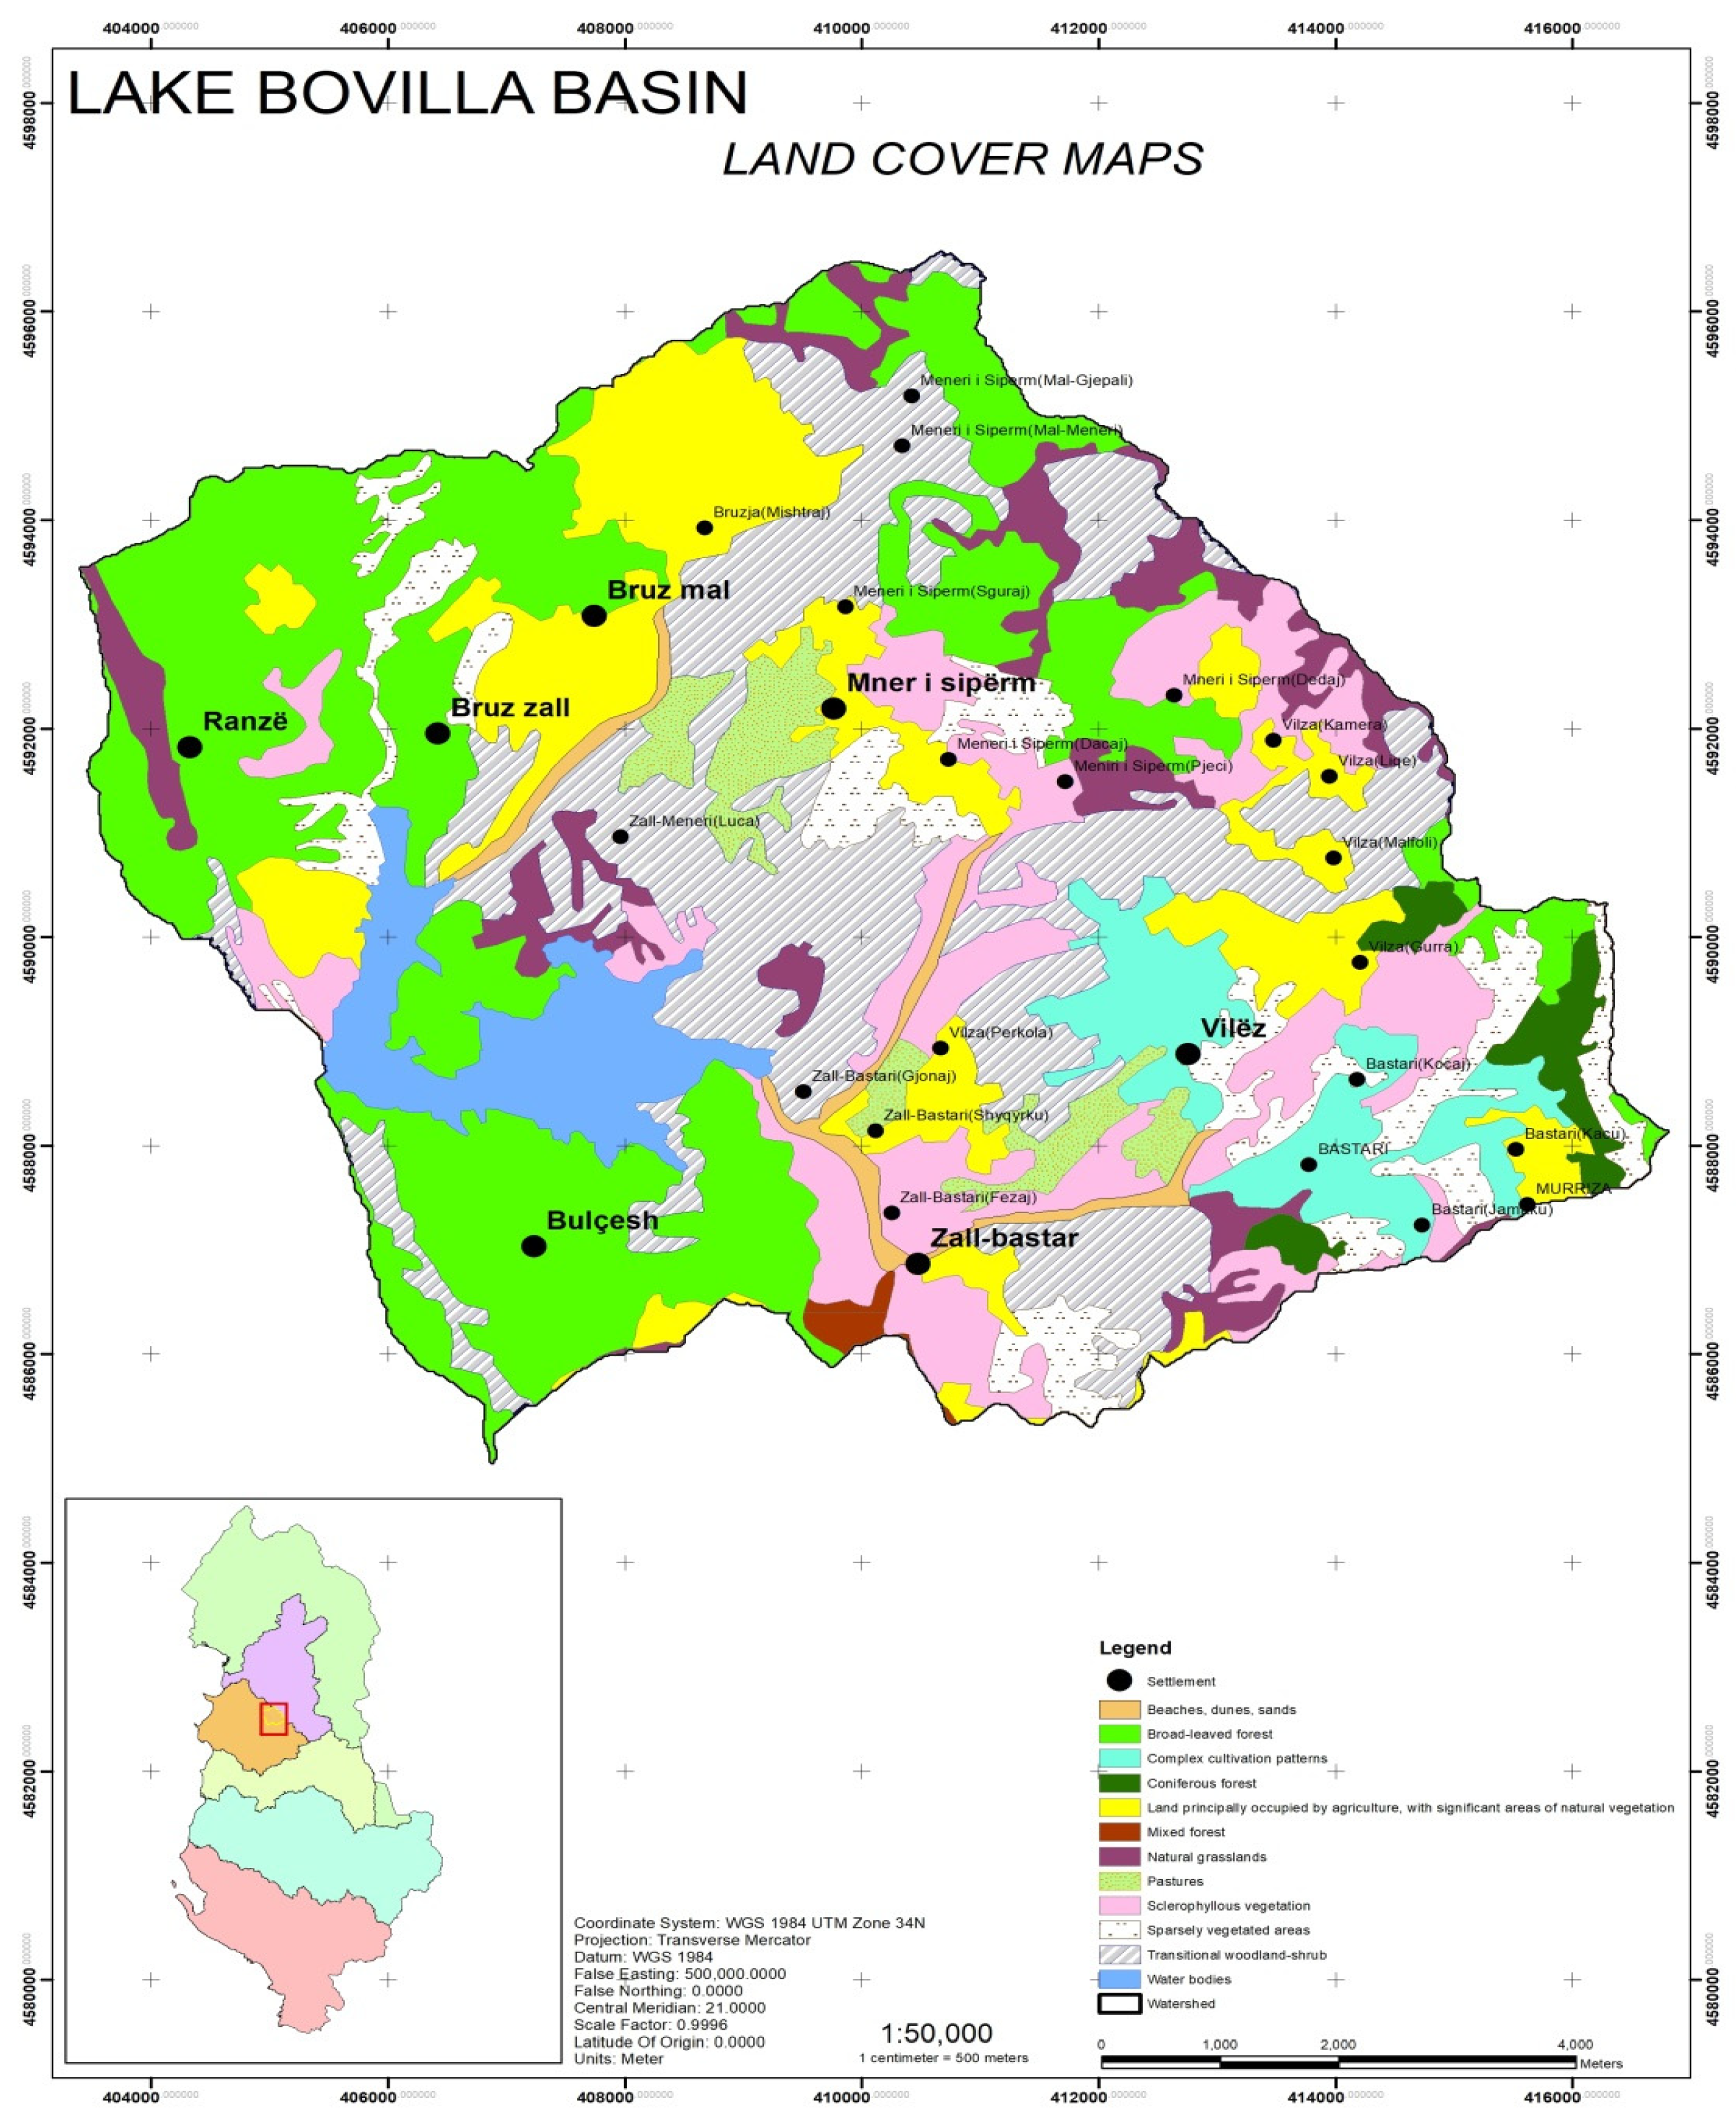
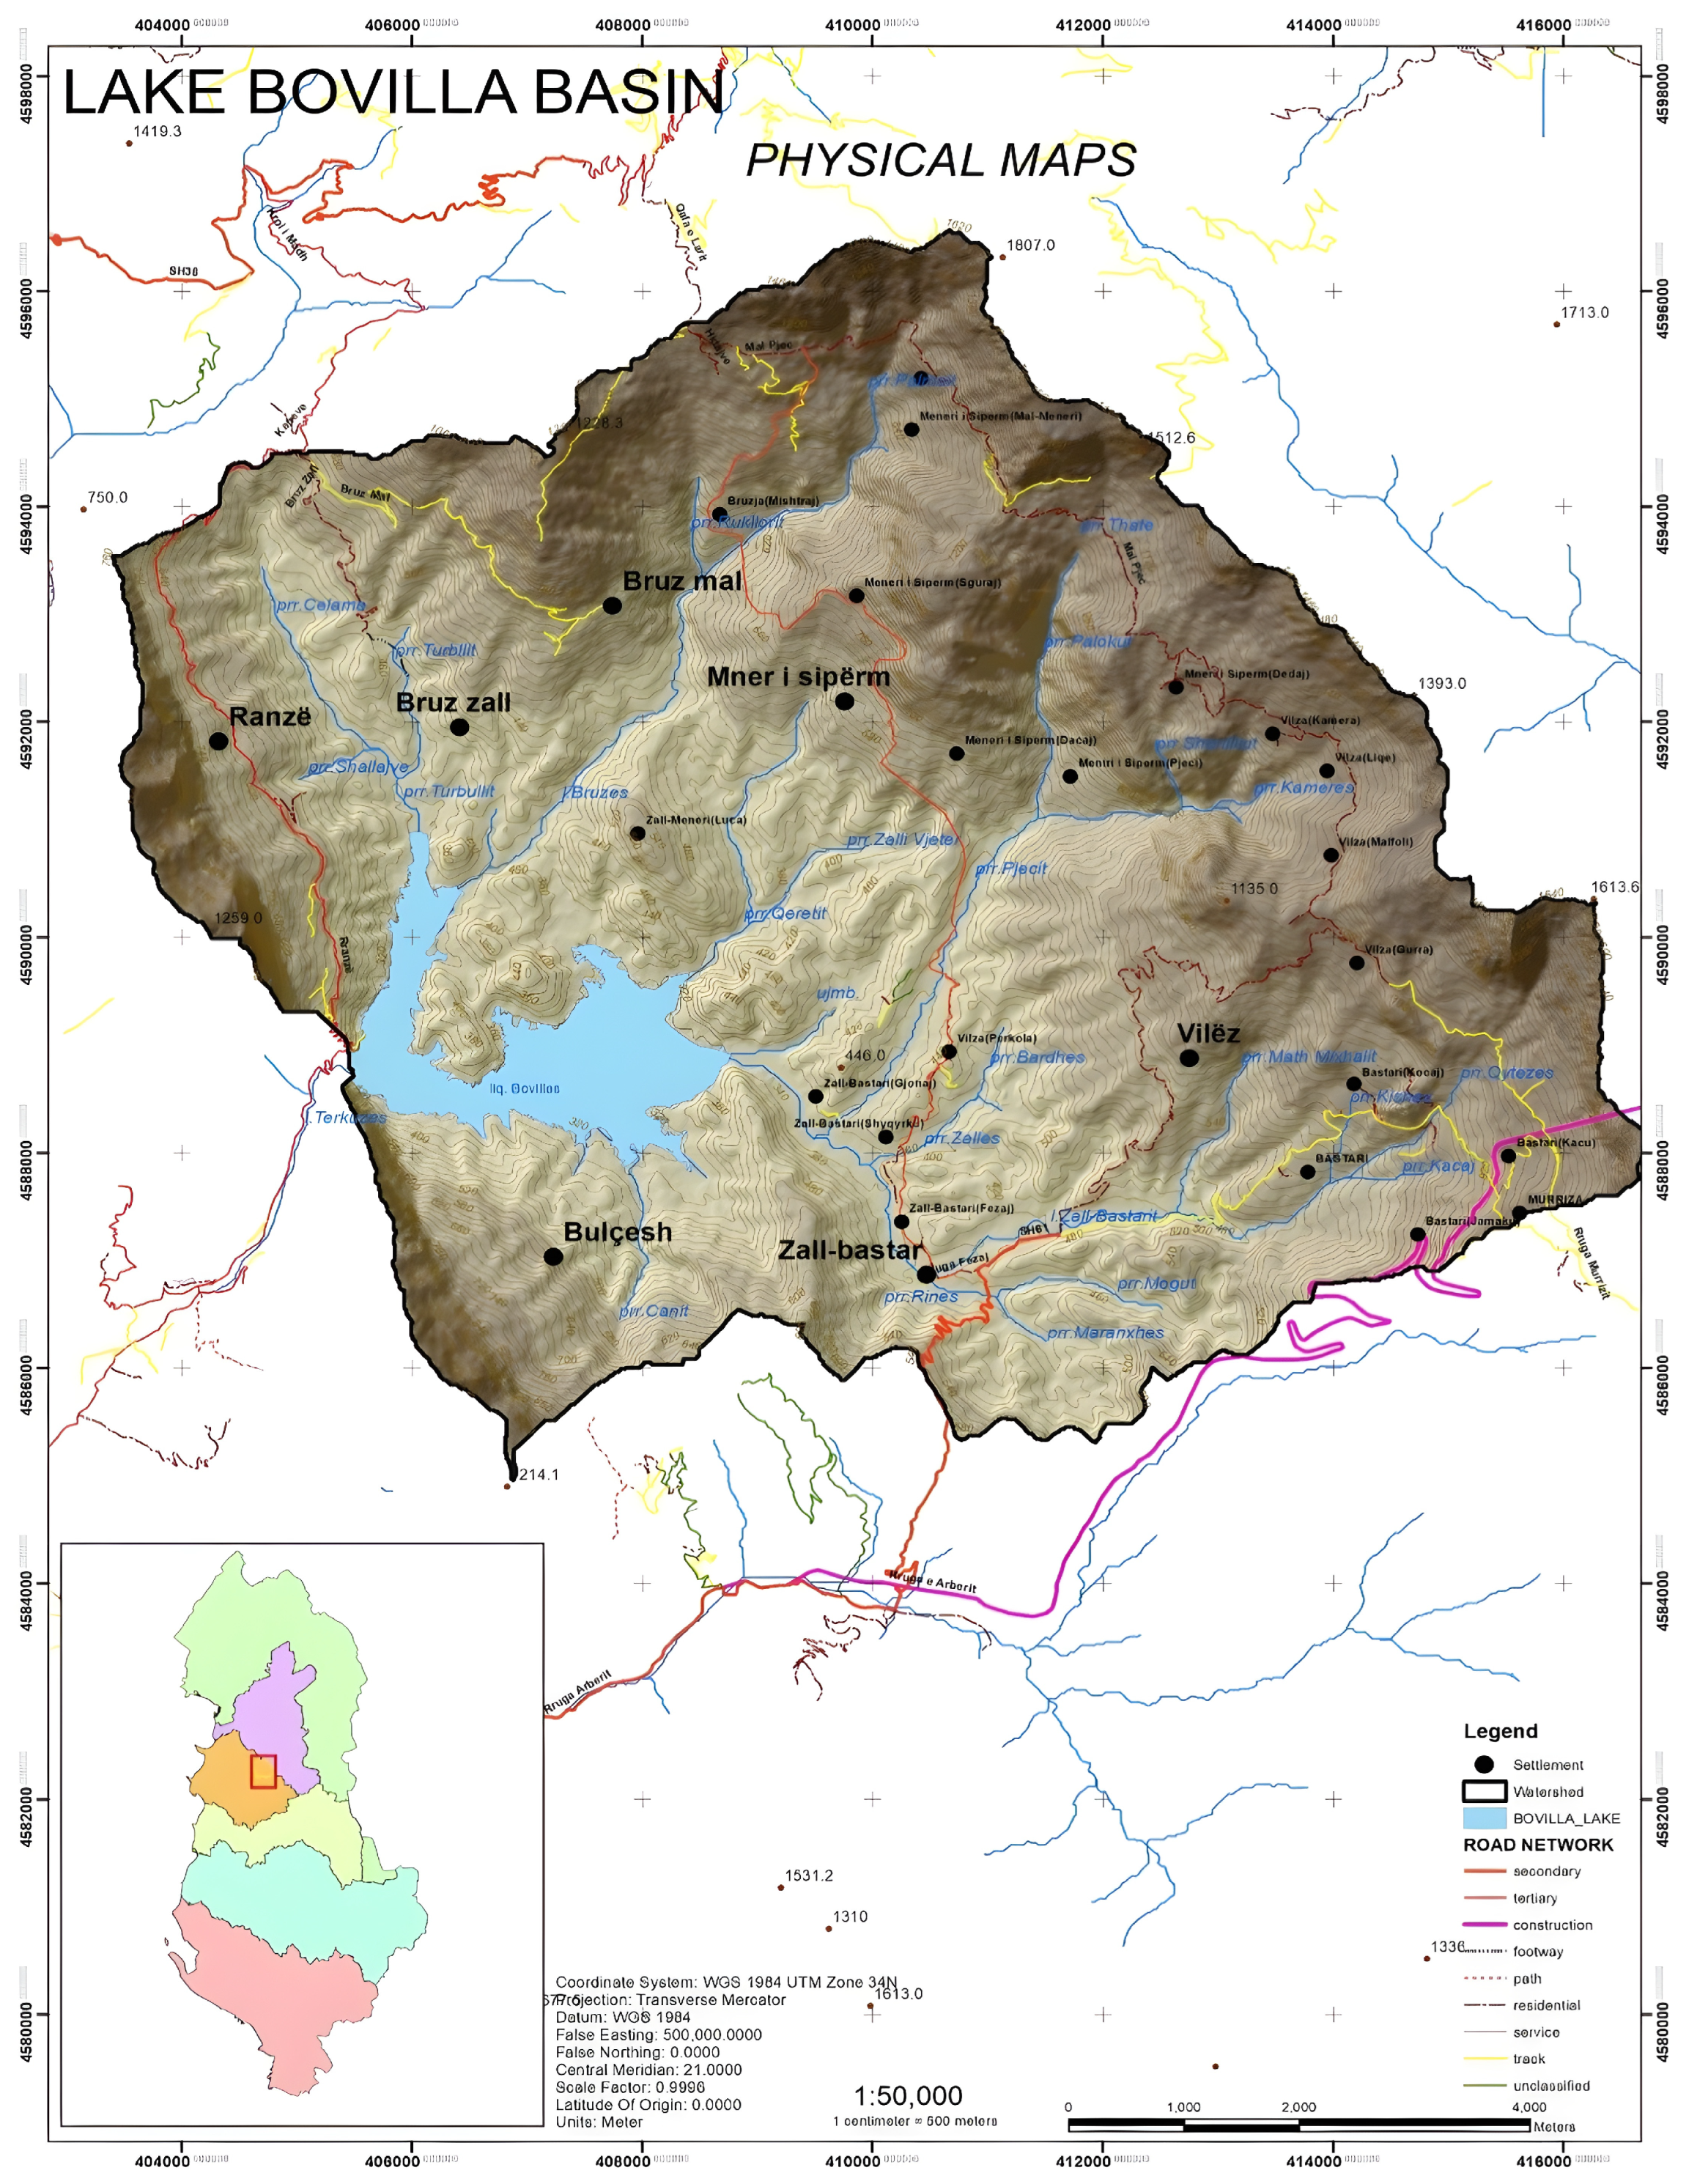
2.1. Study Area
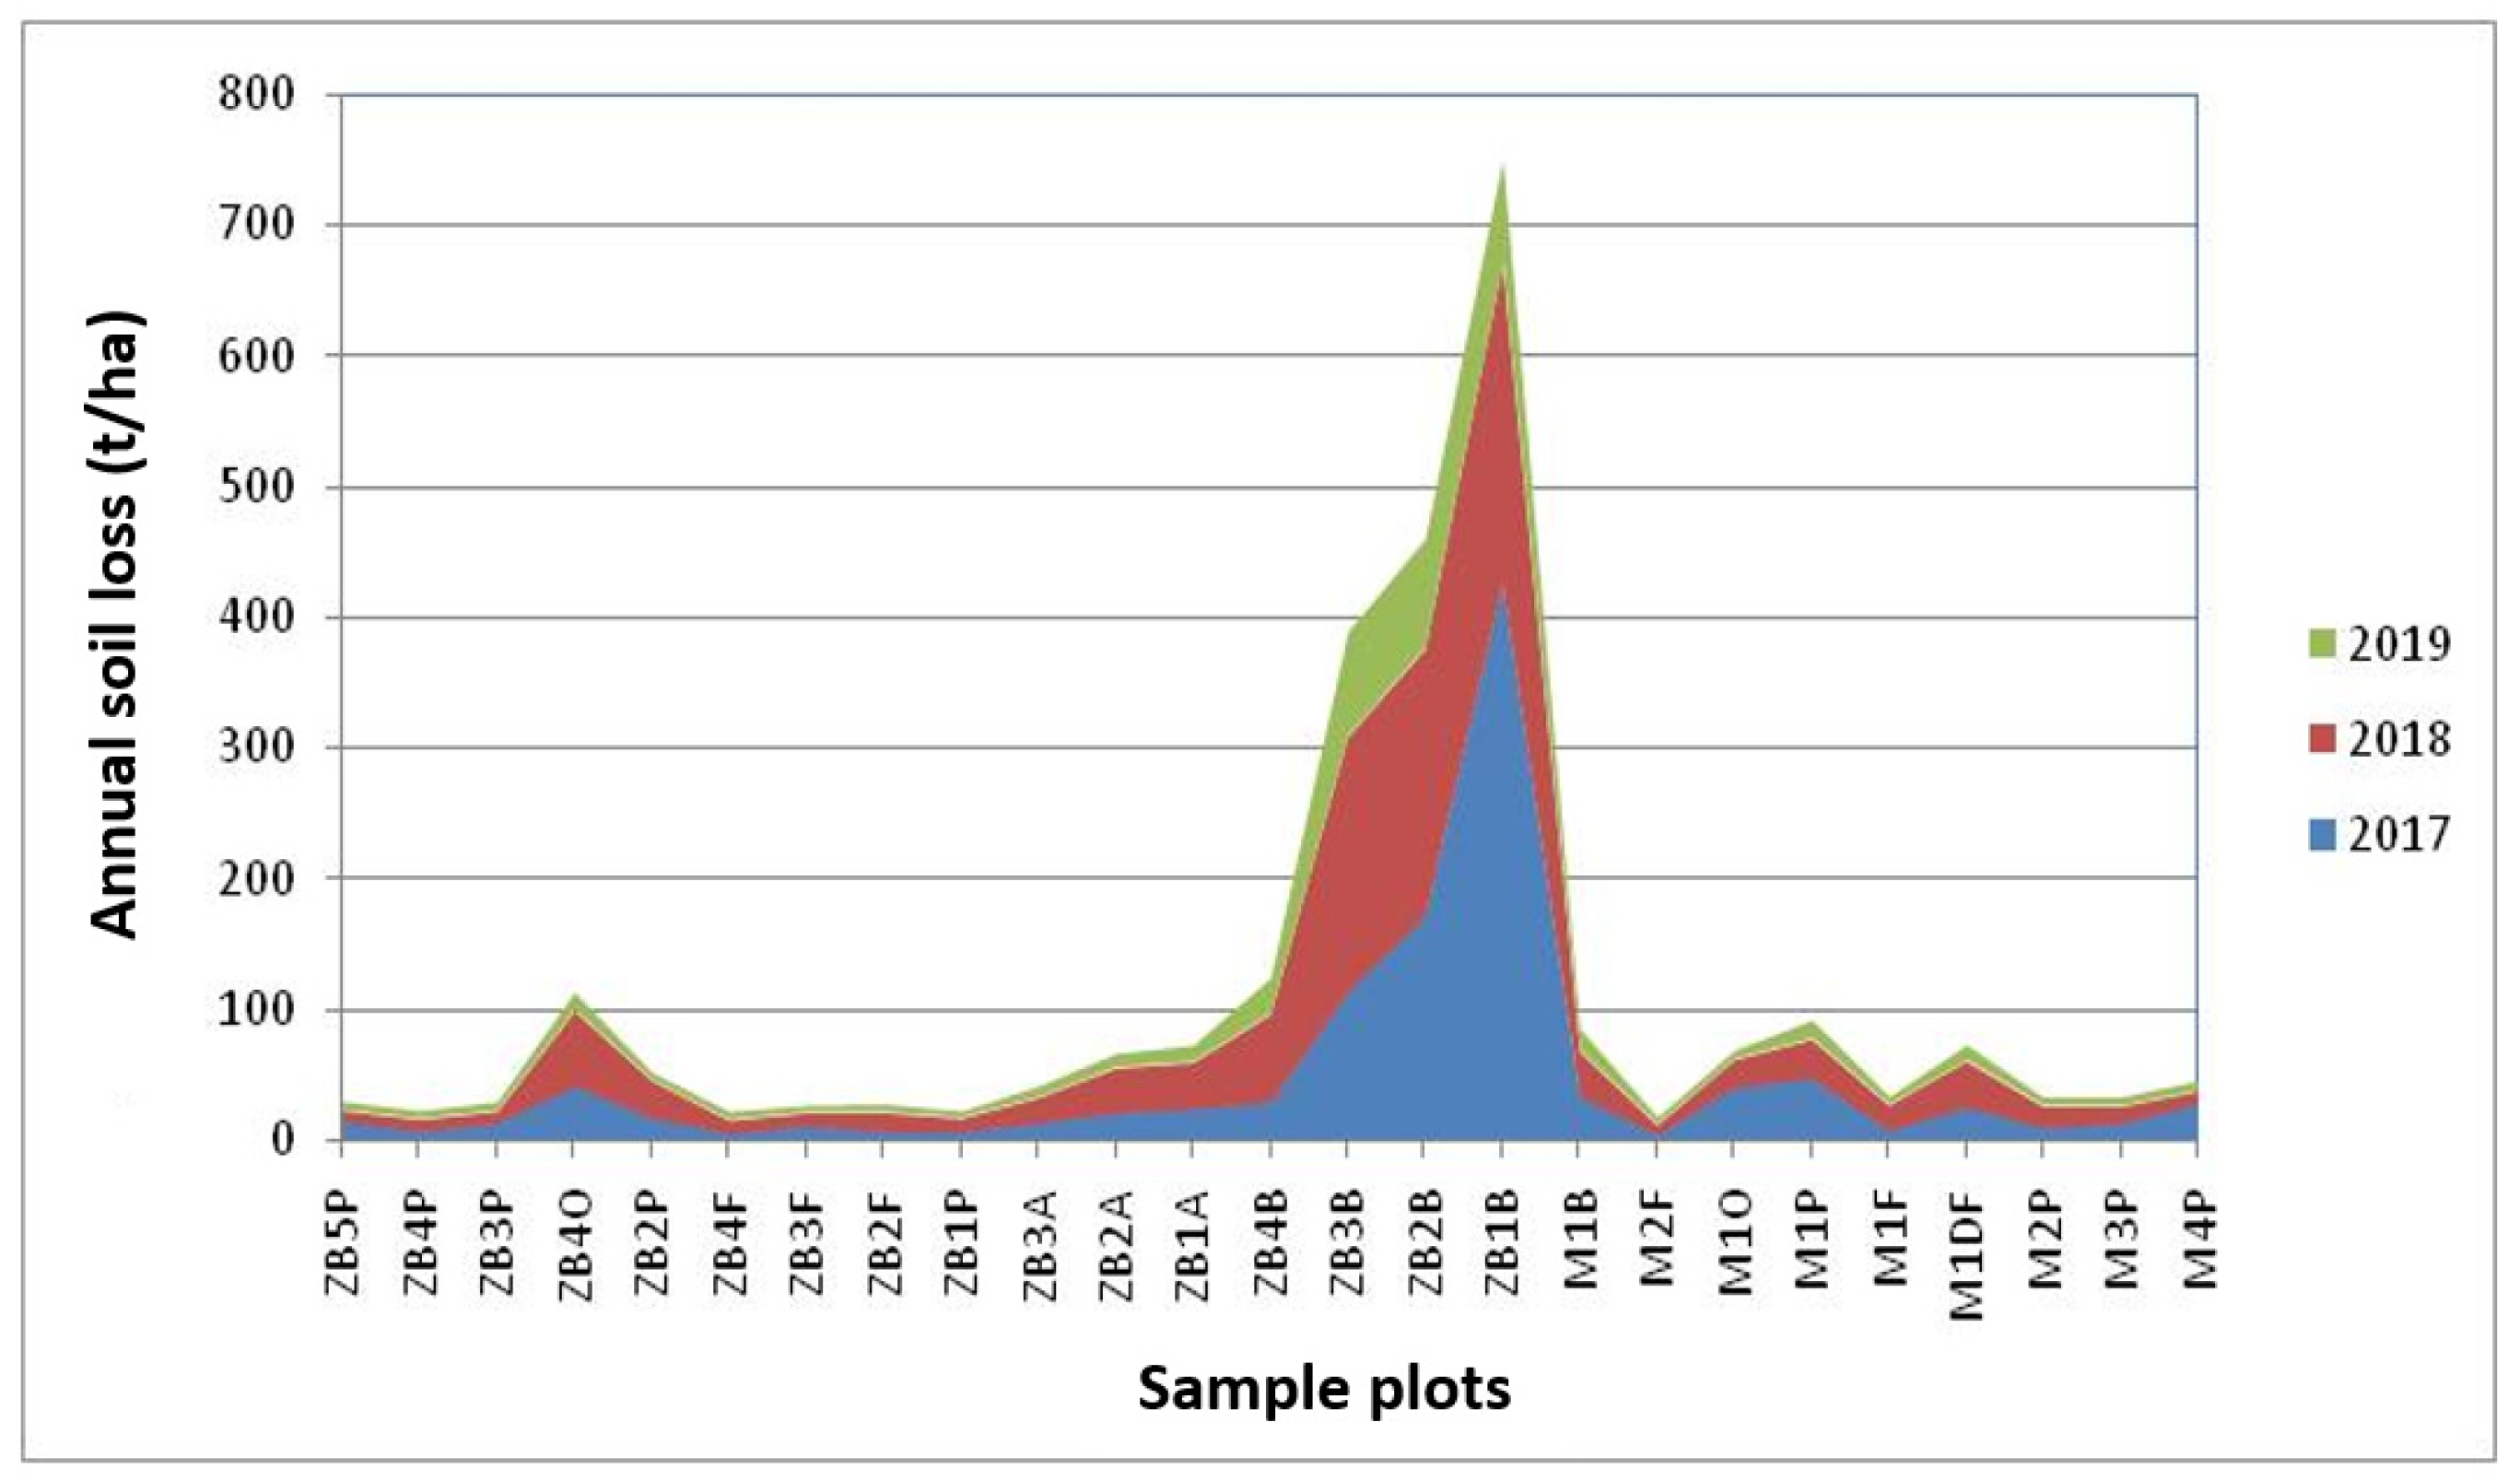
2.2. Determination of Soil Loss
2.3. Identification of Ecosystem Services Correlated to Soil Erosion
2.4. Application of Monetary Evaluation for Ecosystem Services Linked to Erosion
- Loss of carbon (regulating services): The starting data are represented by the values expressed in average t/year (three-year period 2017–2019) of sediment loss due to the erosive process. Starting from these data, it was possible to quantify the percentage of organic substances [46] and therefore the content in kg of organic matter/ha. The transition from kg of organic matter per kg of carbon was carried out using the value of 58% (application of the inverse formula of the Van Bemmelen factor = 1.74). The transformation of C (kg) into CO2 was carried out with the application of the stoichiometric ratio resulting from the oxidative process of 12 kg of carbon, therefore equal to 3.66 (12 kg of C + 32 kg of O2 = 44 kg of CO2). For the conversion into EUR, the prices (EUR/t CO2) [47] for the year 2023 were used and compared with the average data for 2023 for the last 52 weeks [48] = 60.86 + 98.43 (average 79.45 EUR/t CO2).
- Loss of mineral elements (K and P—supporting functions): The content of K and P was evaluated from an economic point of view using the prices of mineral fertilizers (monopotassium phosphate and potassium nitrate), which contain a higher content of K and P, respectively. Starting from the values expressed in average t/year (three-year period, 2017–2019) of sediment loss due to the erosive process, the potassium and phosphorus contents were calculated (obtained from laboratory analyses for the 25 plots using the Mehlich 3-Extrable Elements Soil Analysis method), expressed in mg/100 g of analyzed soil, subsequently converted into kg/ha. The result expressed in kg was multiplied by the average trading values (EUR), obtained from market analyses relating to monopotassium phosphate and potassium nitrate. The indicative amount is around 3–4 EUR/kg. It should be noted that this study estimates the loss of P and K by analyzing the soil and not the sediment. It is known that there is usually an enrichment of nutrients in the sediments compared to the soils (sediment enrichment). Therefore, in this study, there is an underestimation of the concentrations of P and K and, therefore, of the performance in terms of the loss of the specific ecosystem service.
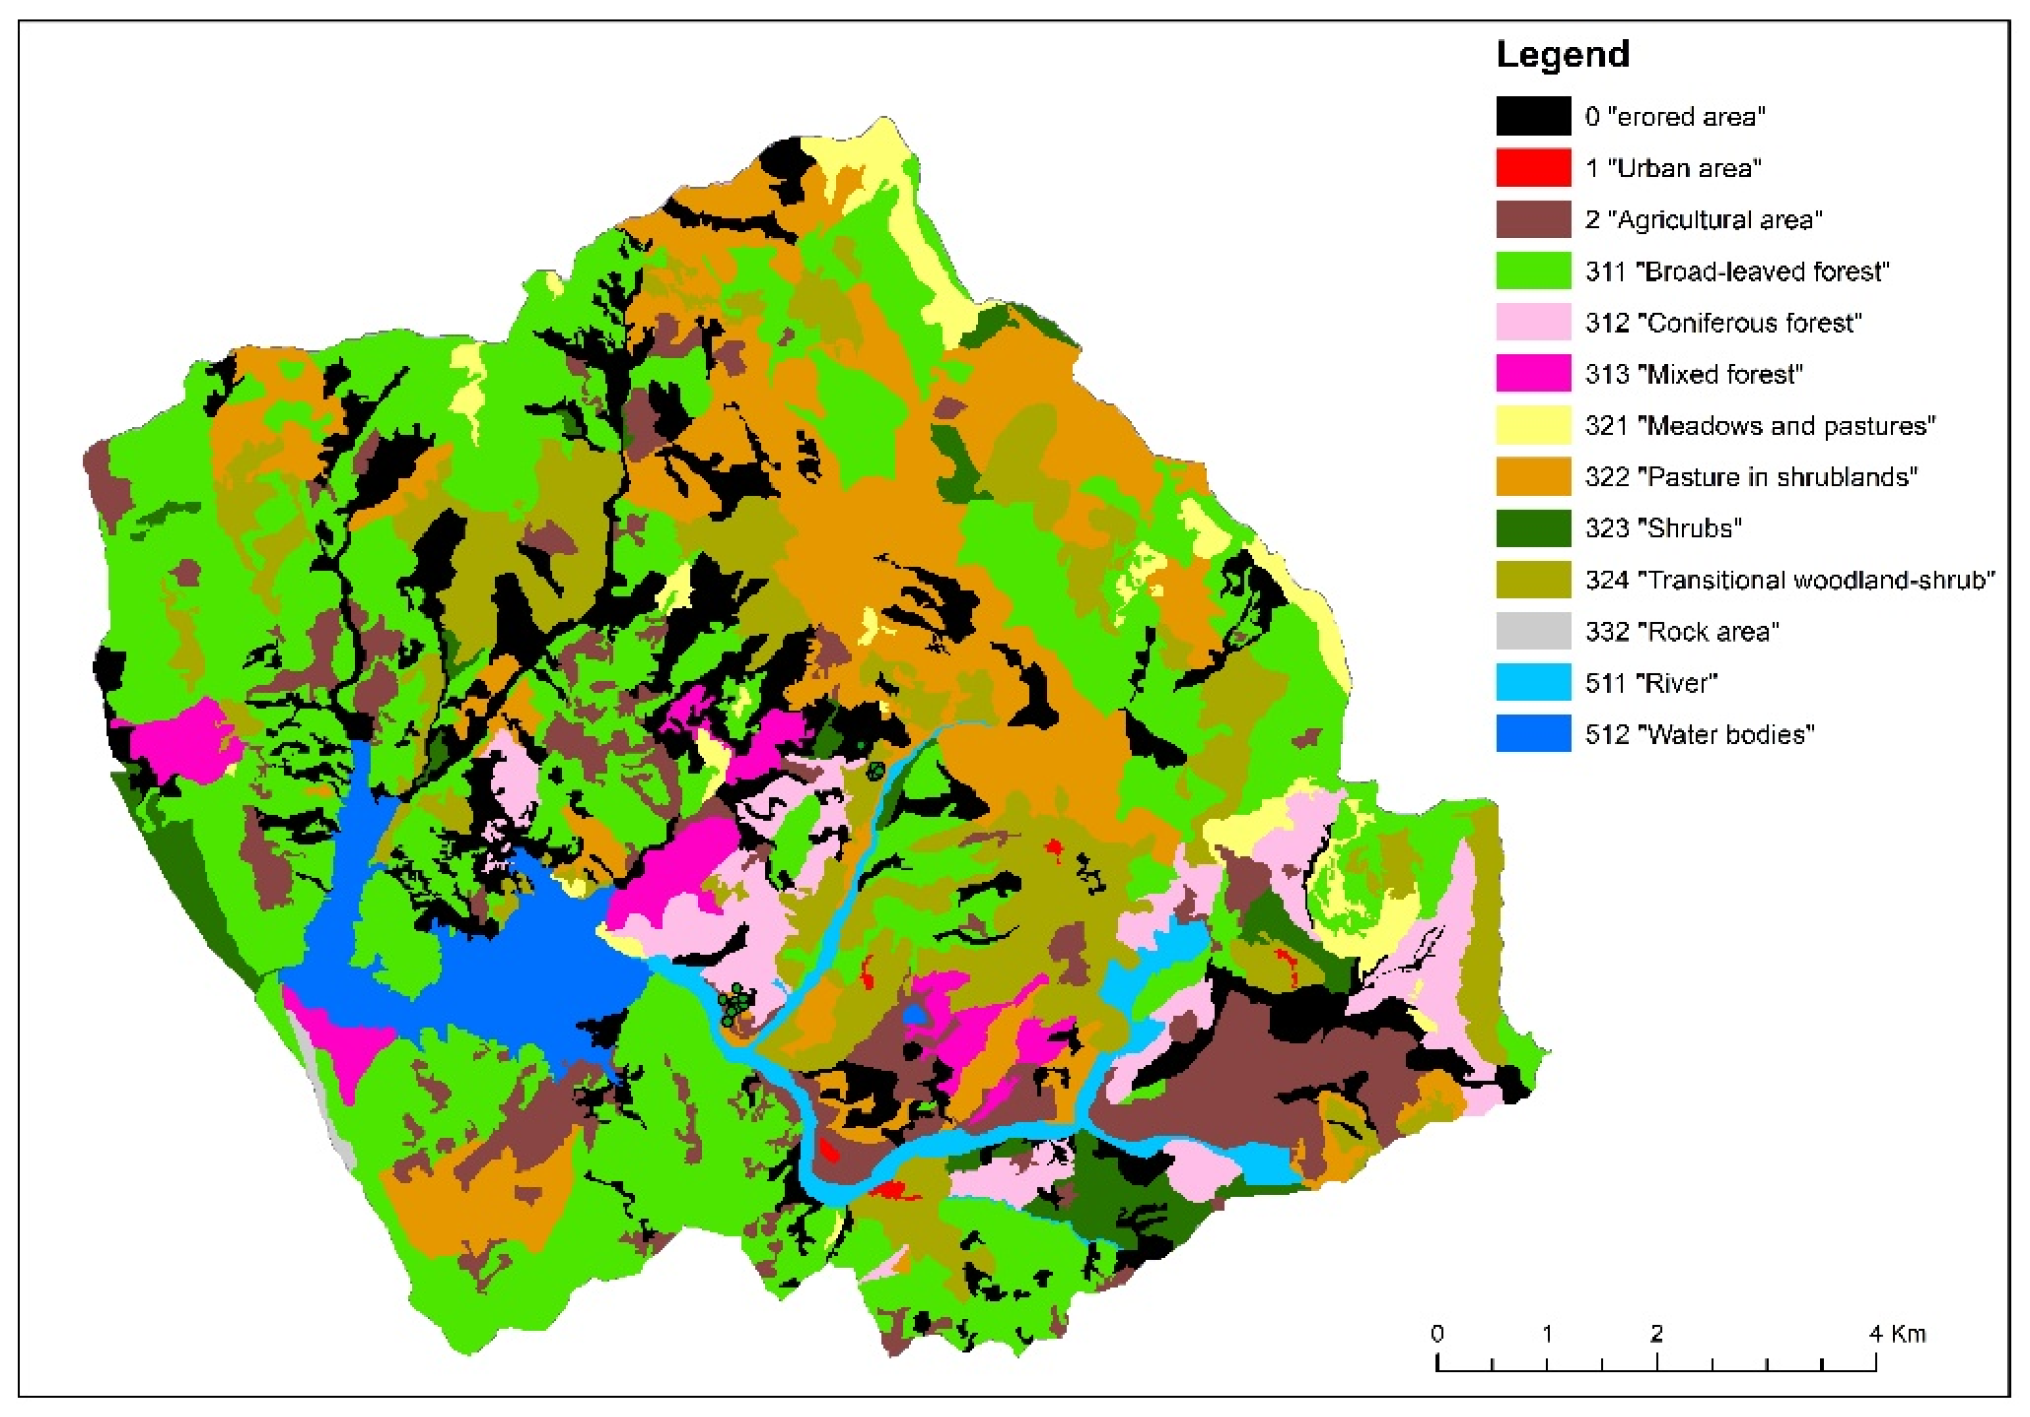
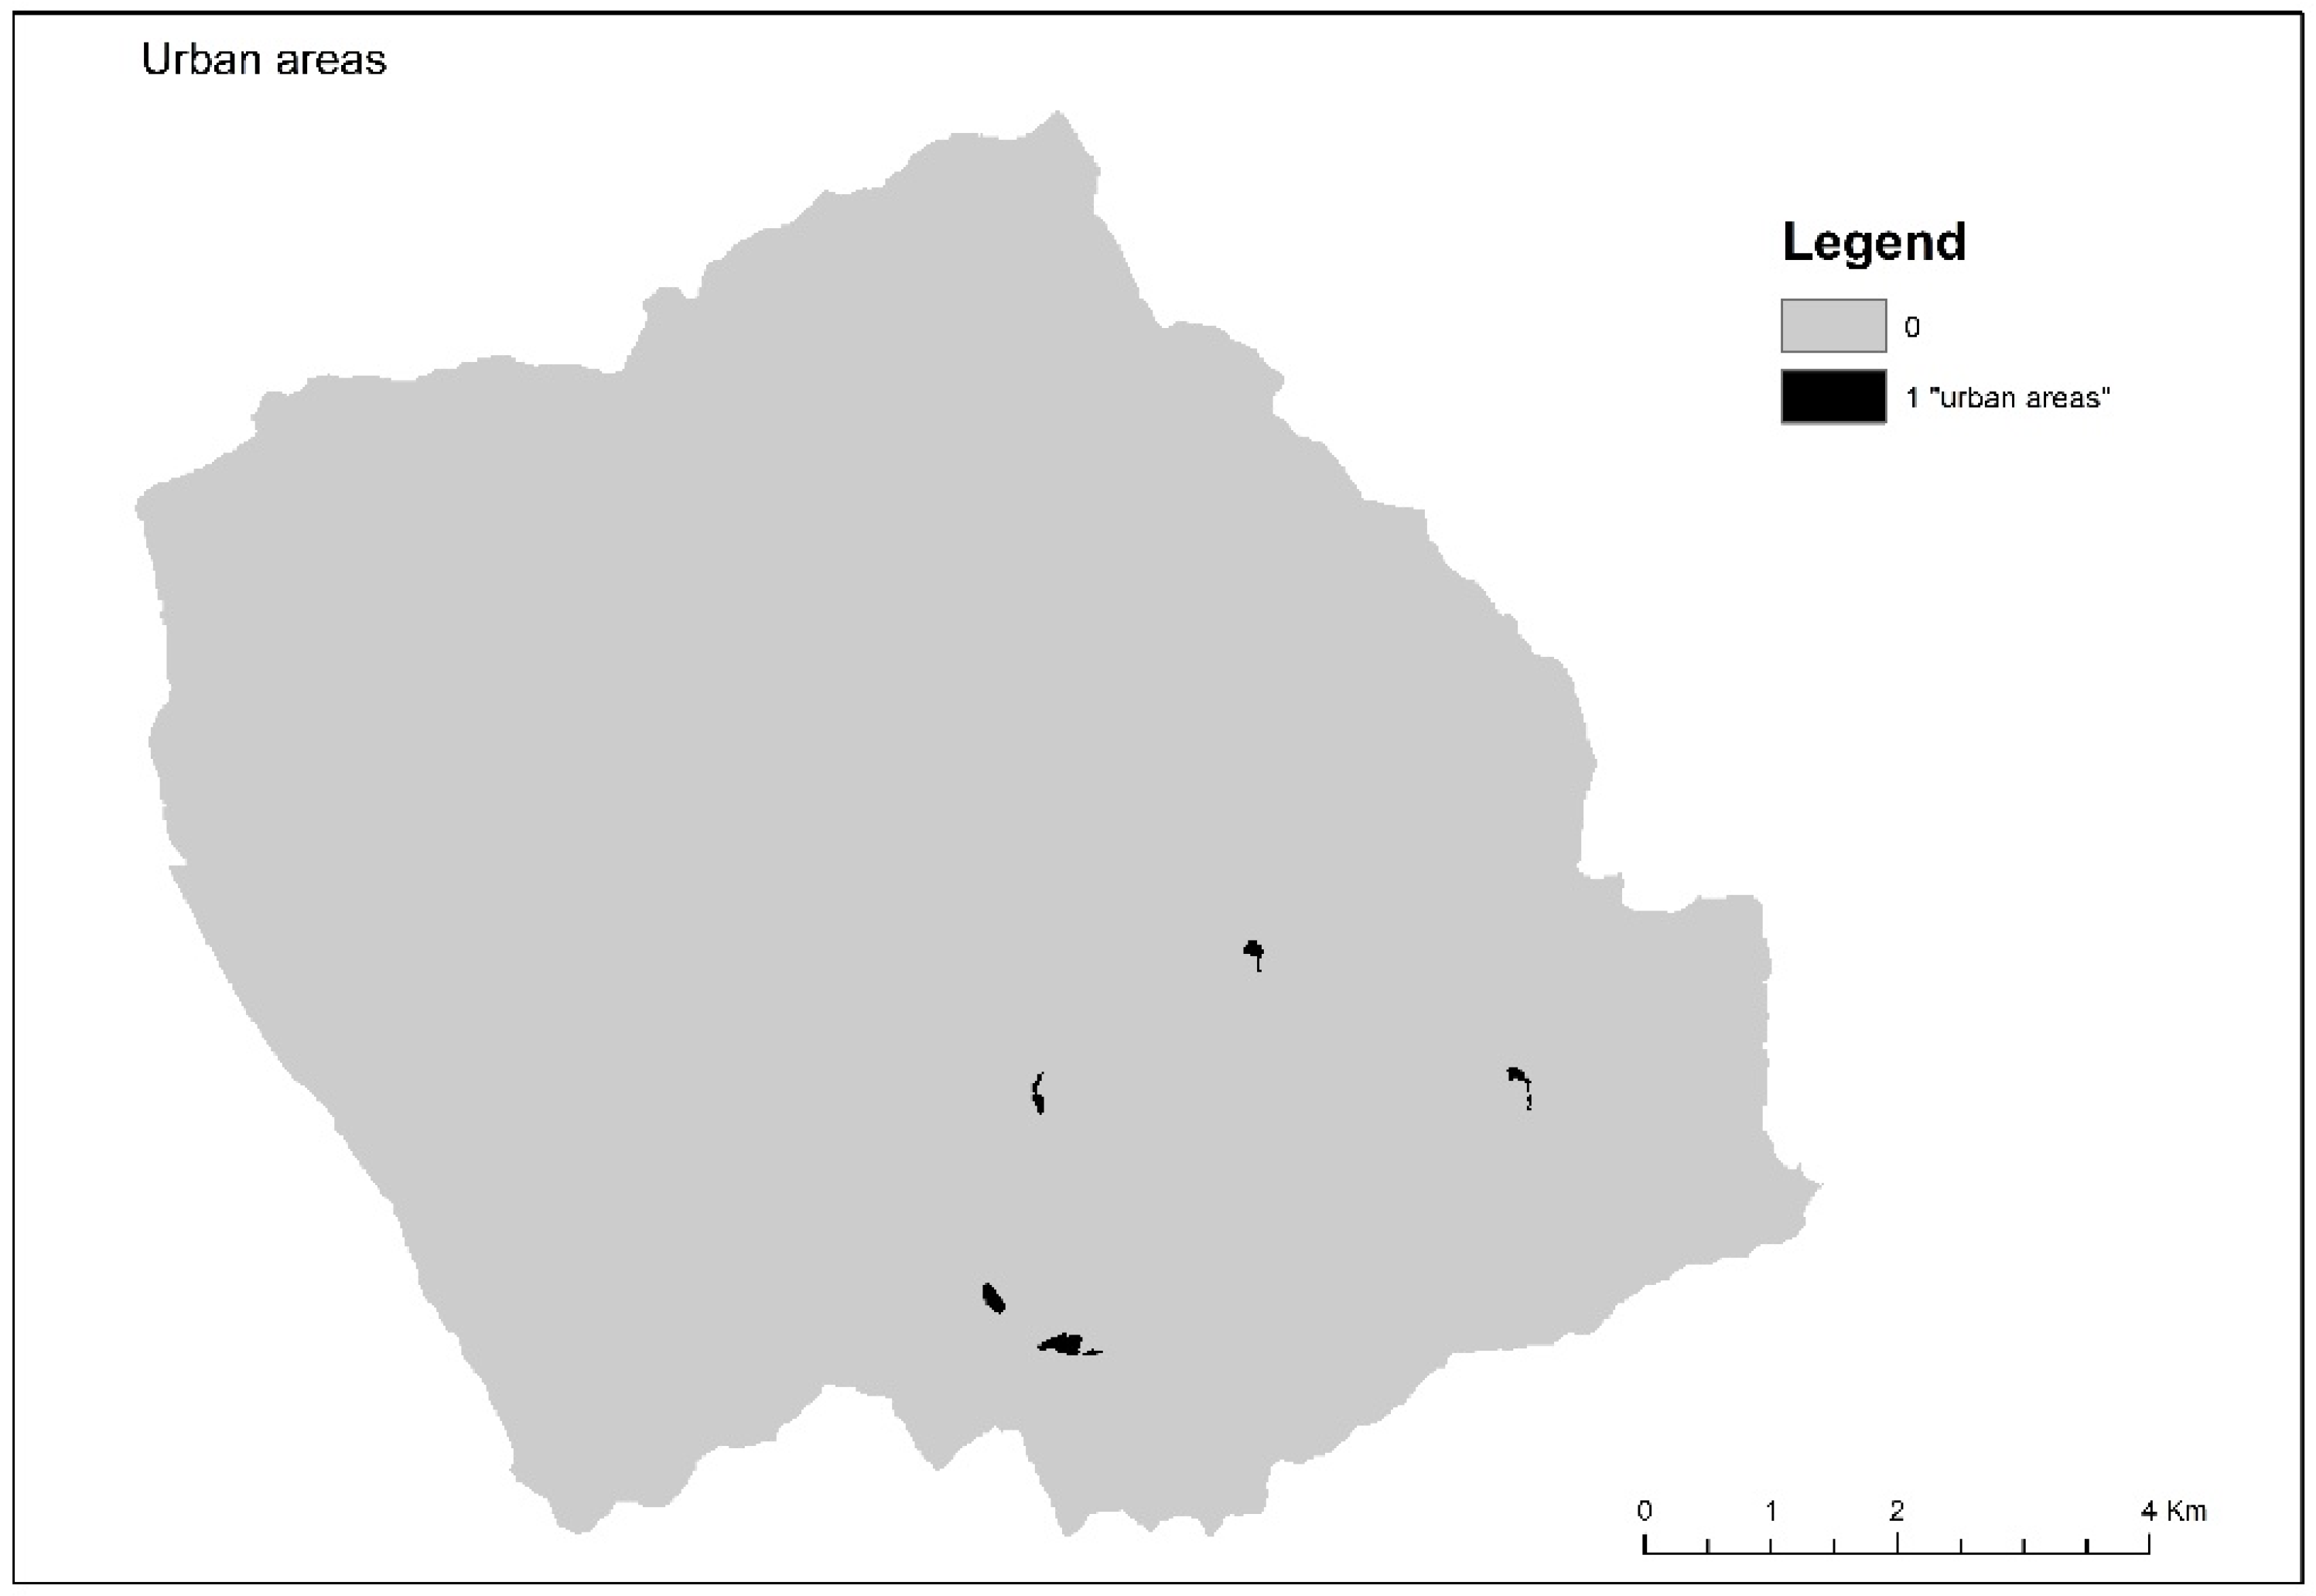
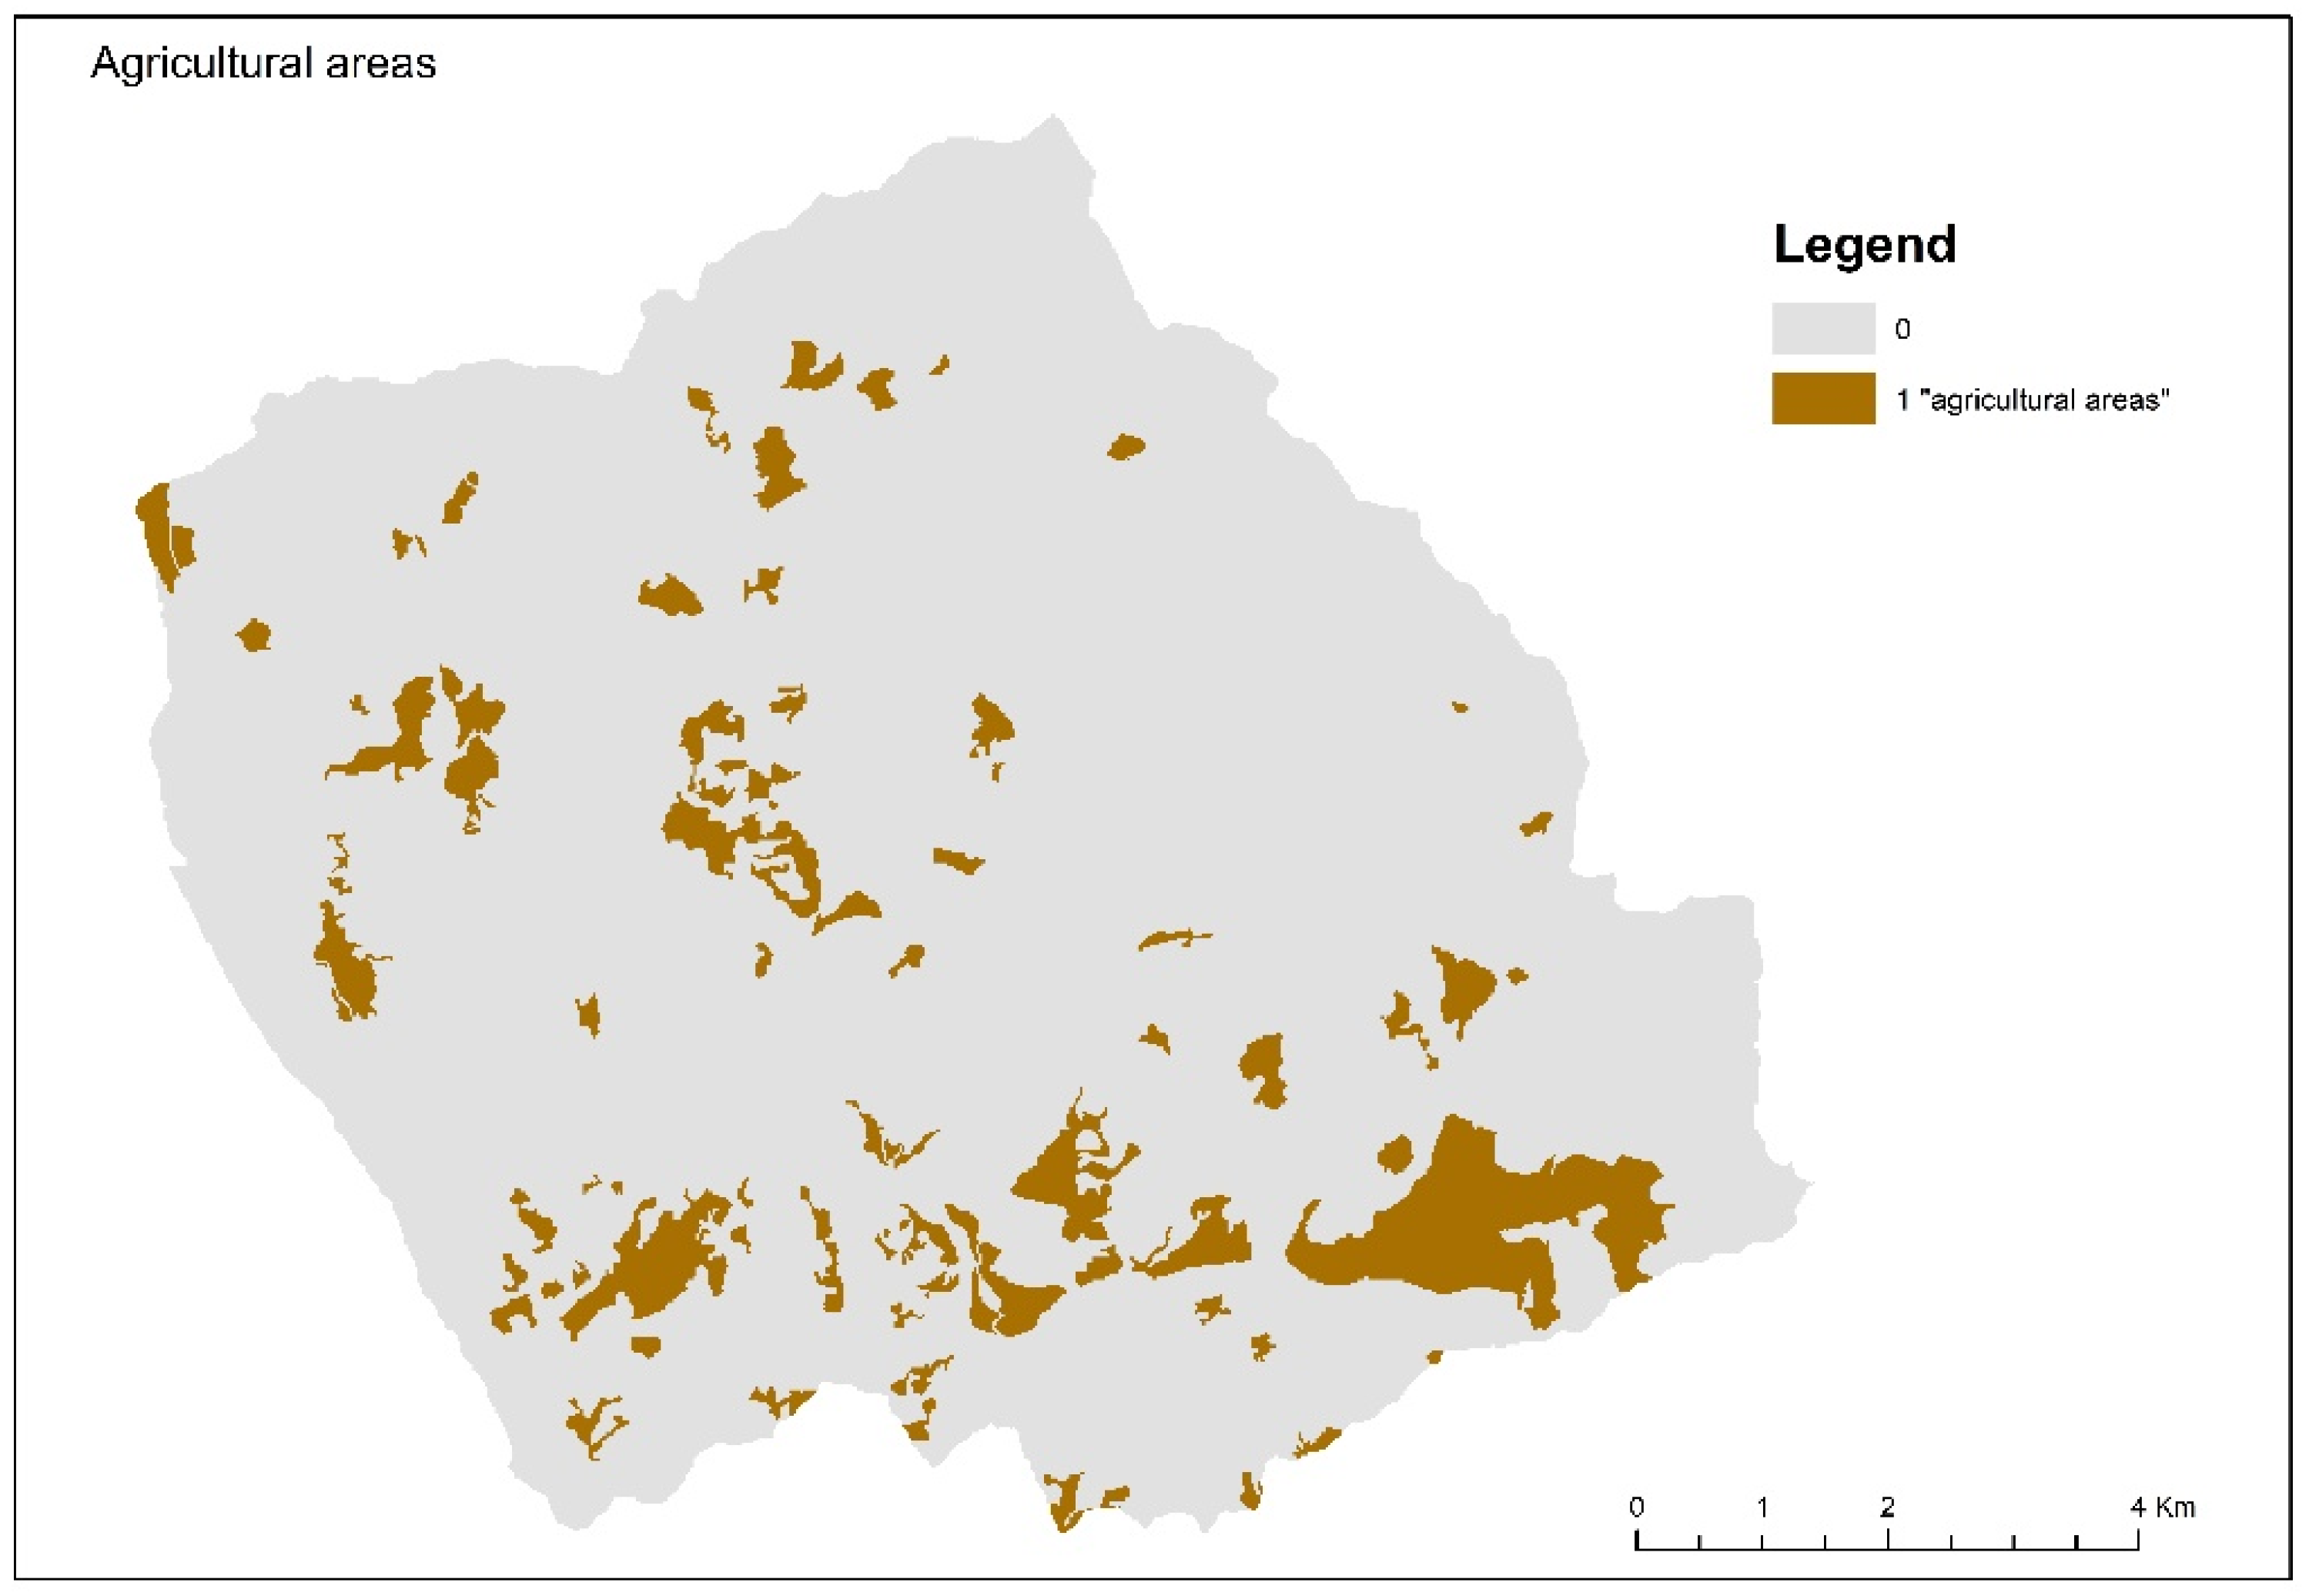
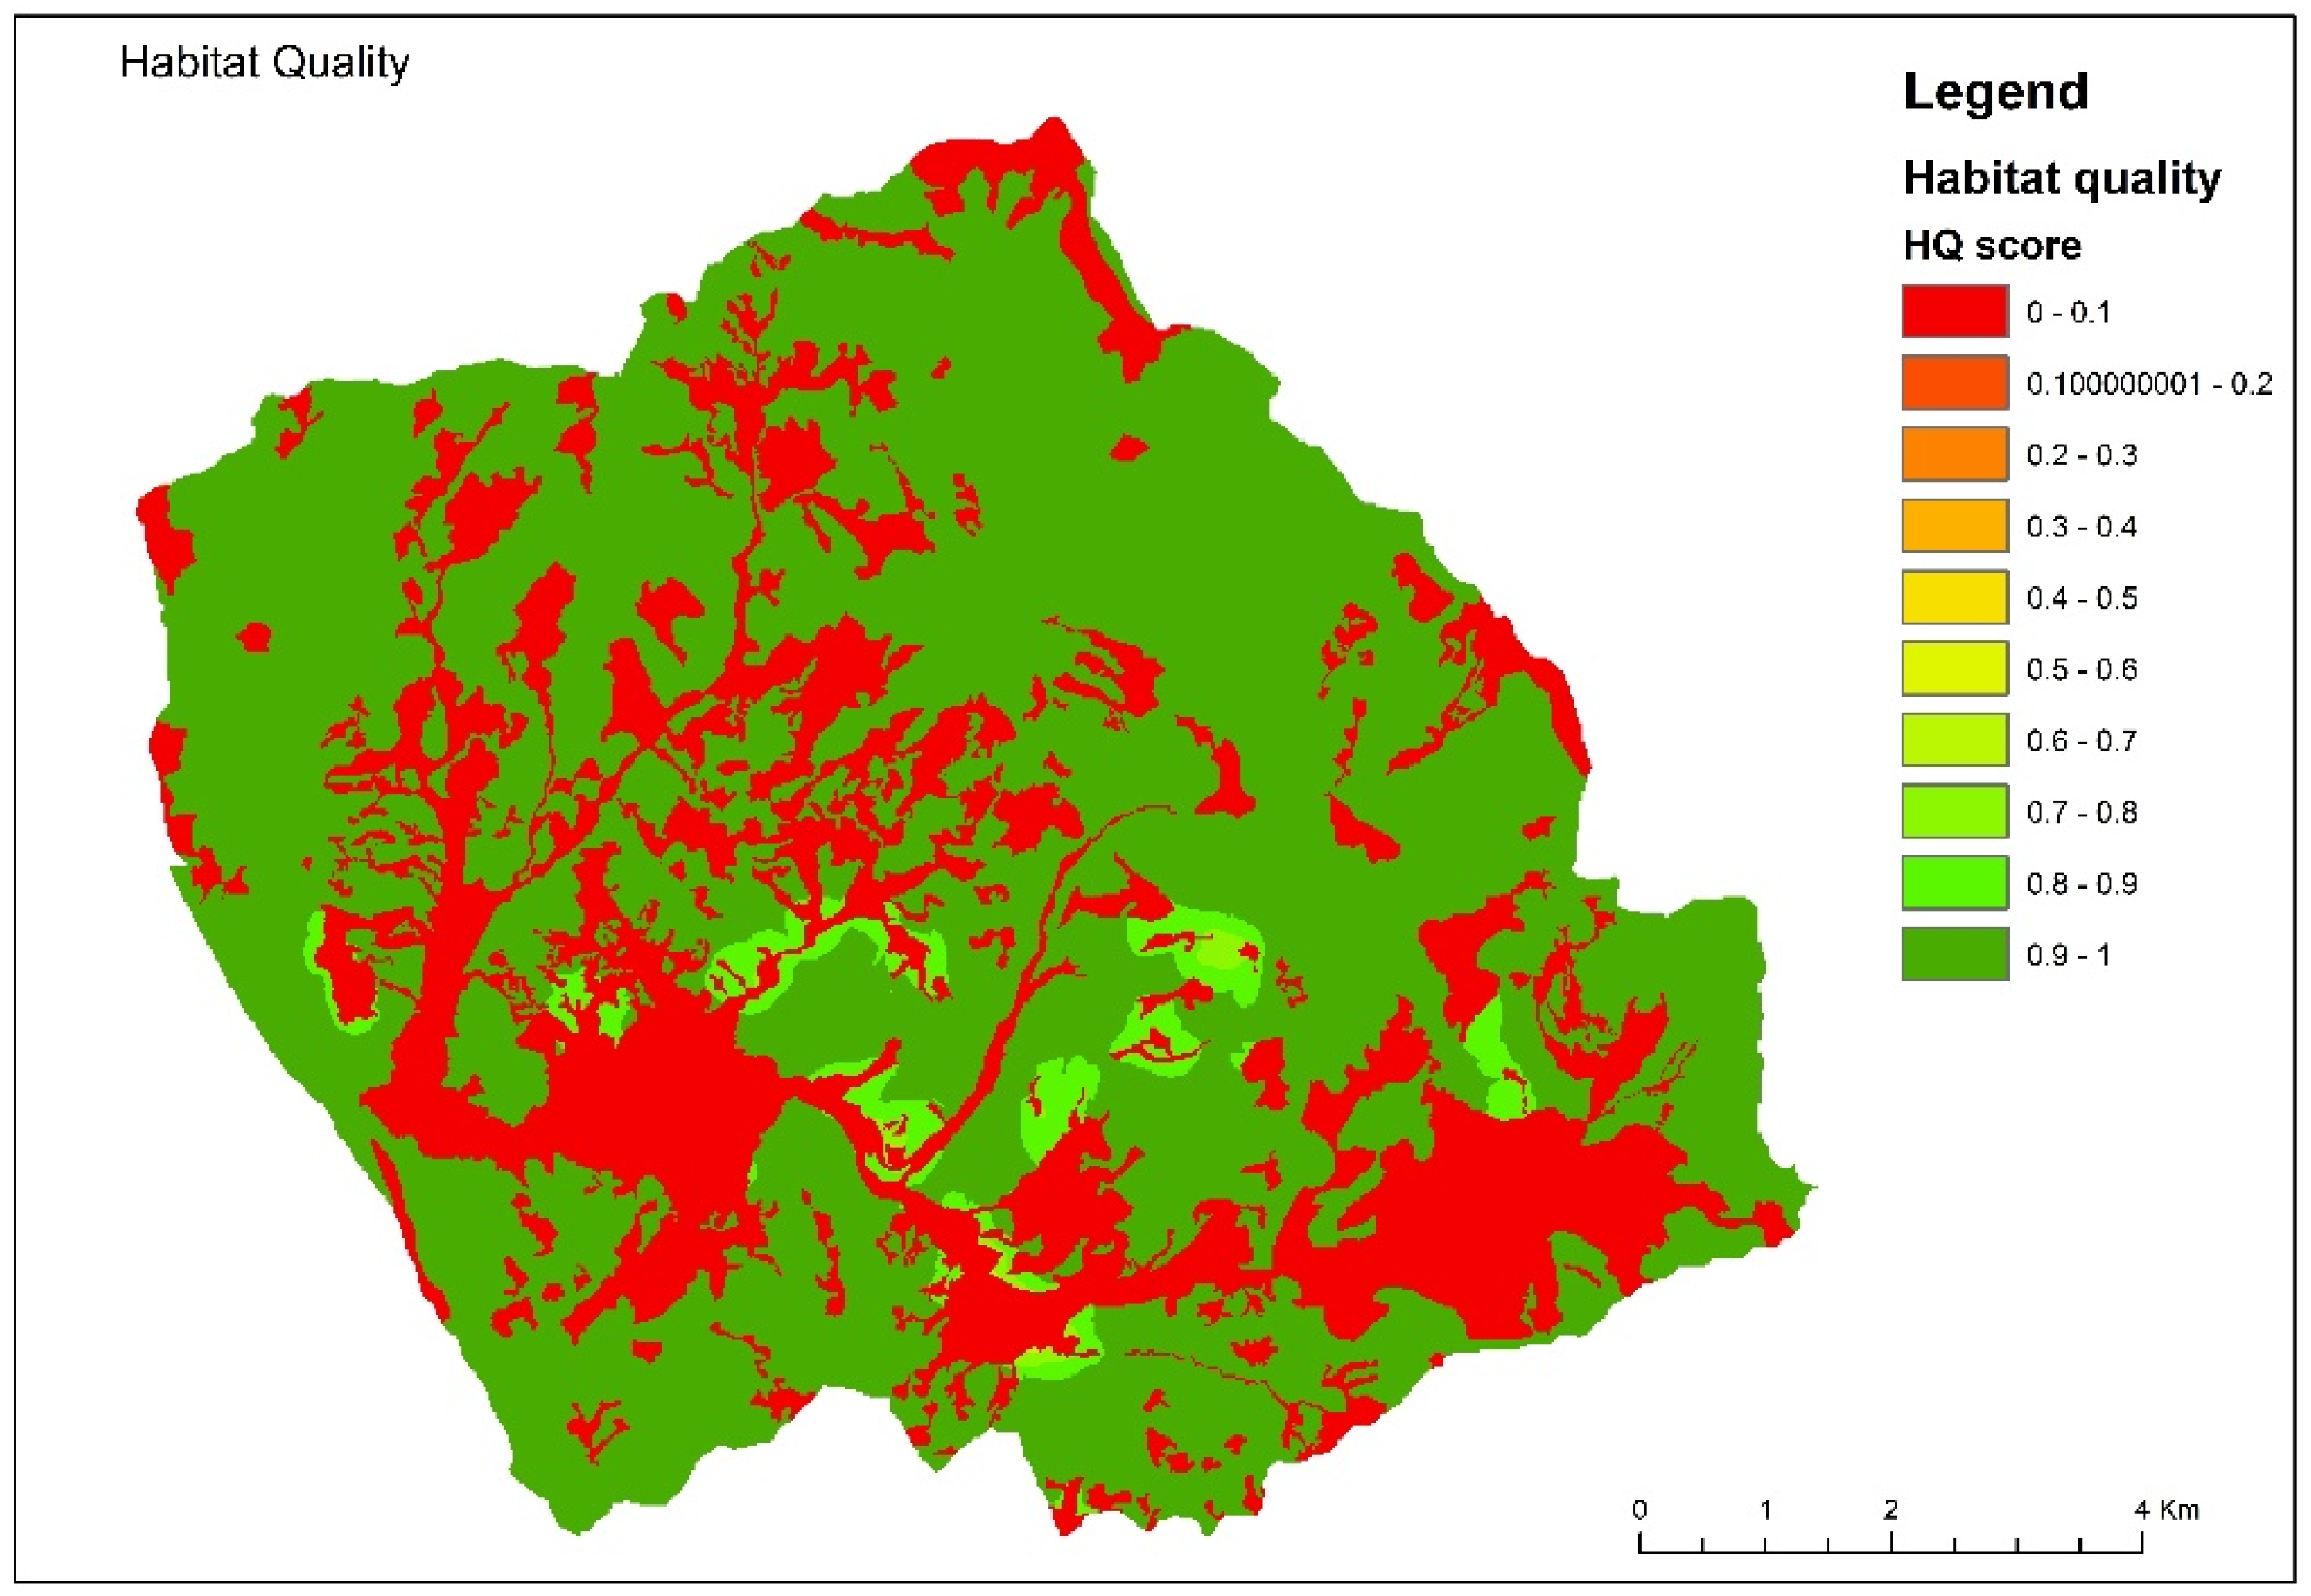
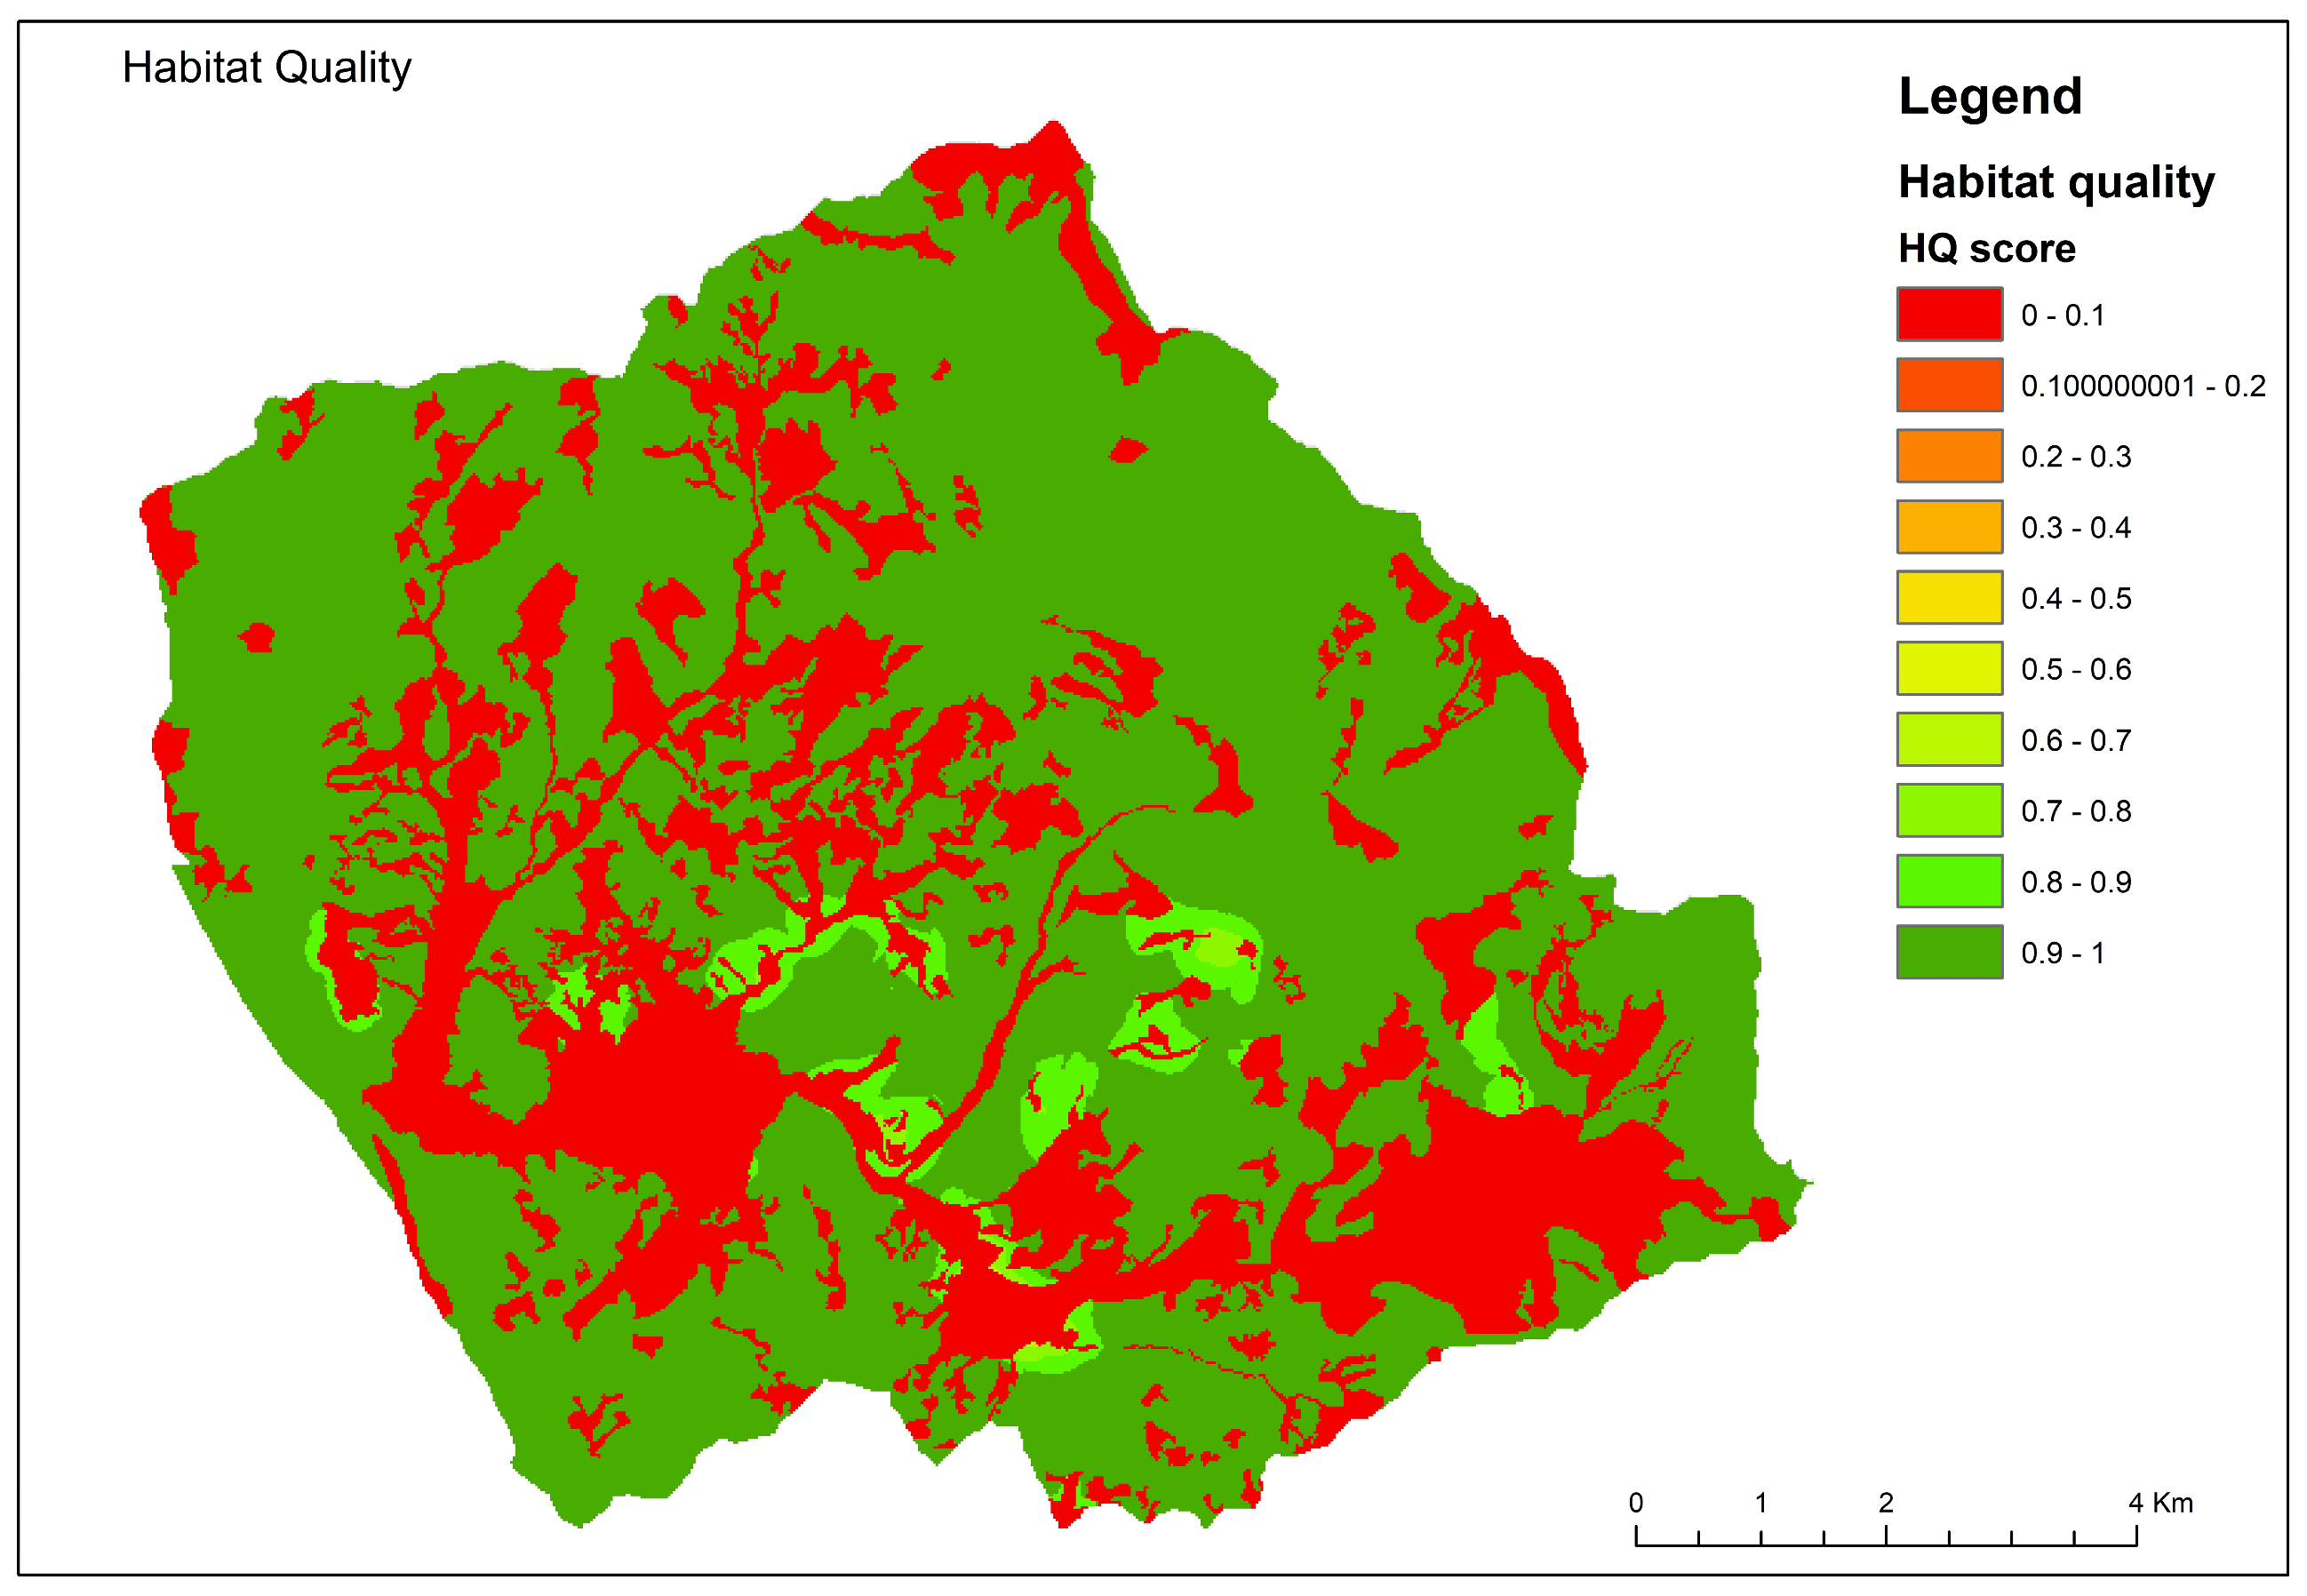
- Economic assessment of habitat quality (supporting functions): In this study, the habitats present in the basin were evaluated in terms of “habitat quality”, and a monetary value was subsequently attributed to them. “Habitat quality” was assessed using the Invest software (version 3.14.2), developed by the University of Stanford—Natural Capital Project [49]. The Invest software considers “habitat quality” as the ability of the ecosystem to provide conditions appropriate for individual and population persistence, and it is considered a continuous variable in the model, ranging from low to medium to high, based on the resources available for survival, reproduction, and population persistence, respectively [50]. Habitats with a high quality are relatively intact and have a structure and function within the range of historic variability. “Habitat quality” depends on a habitat’s proximity to human land uses and the intensity of these land uses. Generally, “habitat quality” is degraded as the intensity of nearby land use increases [51,52,53]. The model runs using raster data, where each cell in the raster is assigned a Land Use Land Cover (LULC) class, which can be a natural (unmanaged) class or a managed class. LULC types can be given at any level of classification detail. Besides a map of LULC and data that relate LULC to habitat suitability, the model also requires data on the habitat threat density and its effects on habitat quality. In general, we consider threats to be human-modified LULC types that cause habitat fragmentation, edge, and degradation in neighboring habitats. The following inputs were used for the case study: (i) the land use map (current landcover map) and (ii) the threat maps. All maps used in the Invest software have a cell size of 20 m. The characteristics of “habitat” or “no-habitat” were attributed to each LULC type. As regards the threats, this study considered the presence of roads, the presence of crops and agricultural activities, the presence of urbanized areas, and the proximity to contexts affected by erosion.
- The result of the processing is a habitat quality map in which each cell is given a score ranging from 0 (low HQ) to 1 (high HQ). The input maps and the resulting “habitat quality map” are shown in the following figures (Figure 3, Figure A2, Figure A3, Figure A4, Figure A5 and Figure A6). The HQ values obtained (range 0–1) were then multiplied by the economic value given by the authors of [54] which assigns an economic amount to each area with different land use. The assigned value, expressed in 2007 USD/ha/year, was converted into EUR 2018 (intermediate year of this work) through the purchasing power parities (PPPs) [55], subsequently adjusted to 2018 by consulting the data available from the Italian Statistics Institute [56].
- Crop productivity (provisioning services): The economic value of the agricultural production obtainable from the plots under investigation was quantified through the application of the Italian Ministerial Decree no. 236,537 of 5 May 2023 that established the identification of the standard values for plant production to determine the value of the average annual production and the maximum values that can be insurable on the subsidized market and to join mutual funds (EUR/ha). For forestry crops, however, the formula 0.5*d2*H (Bouvard formula) was applied. The diameters, heights, and number of plants per hectare divided by age were reported in the Bovilla database simple plot—forest info (not published). The total volume (q/ha) was multiplied by 6 EUR/q (for coniferous trees) and by 14 EUR/q (for broadleaved trees, average purchase and sale value of coniferous and broadleaved forests expressed in EUR).
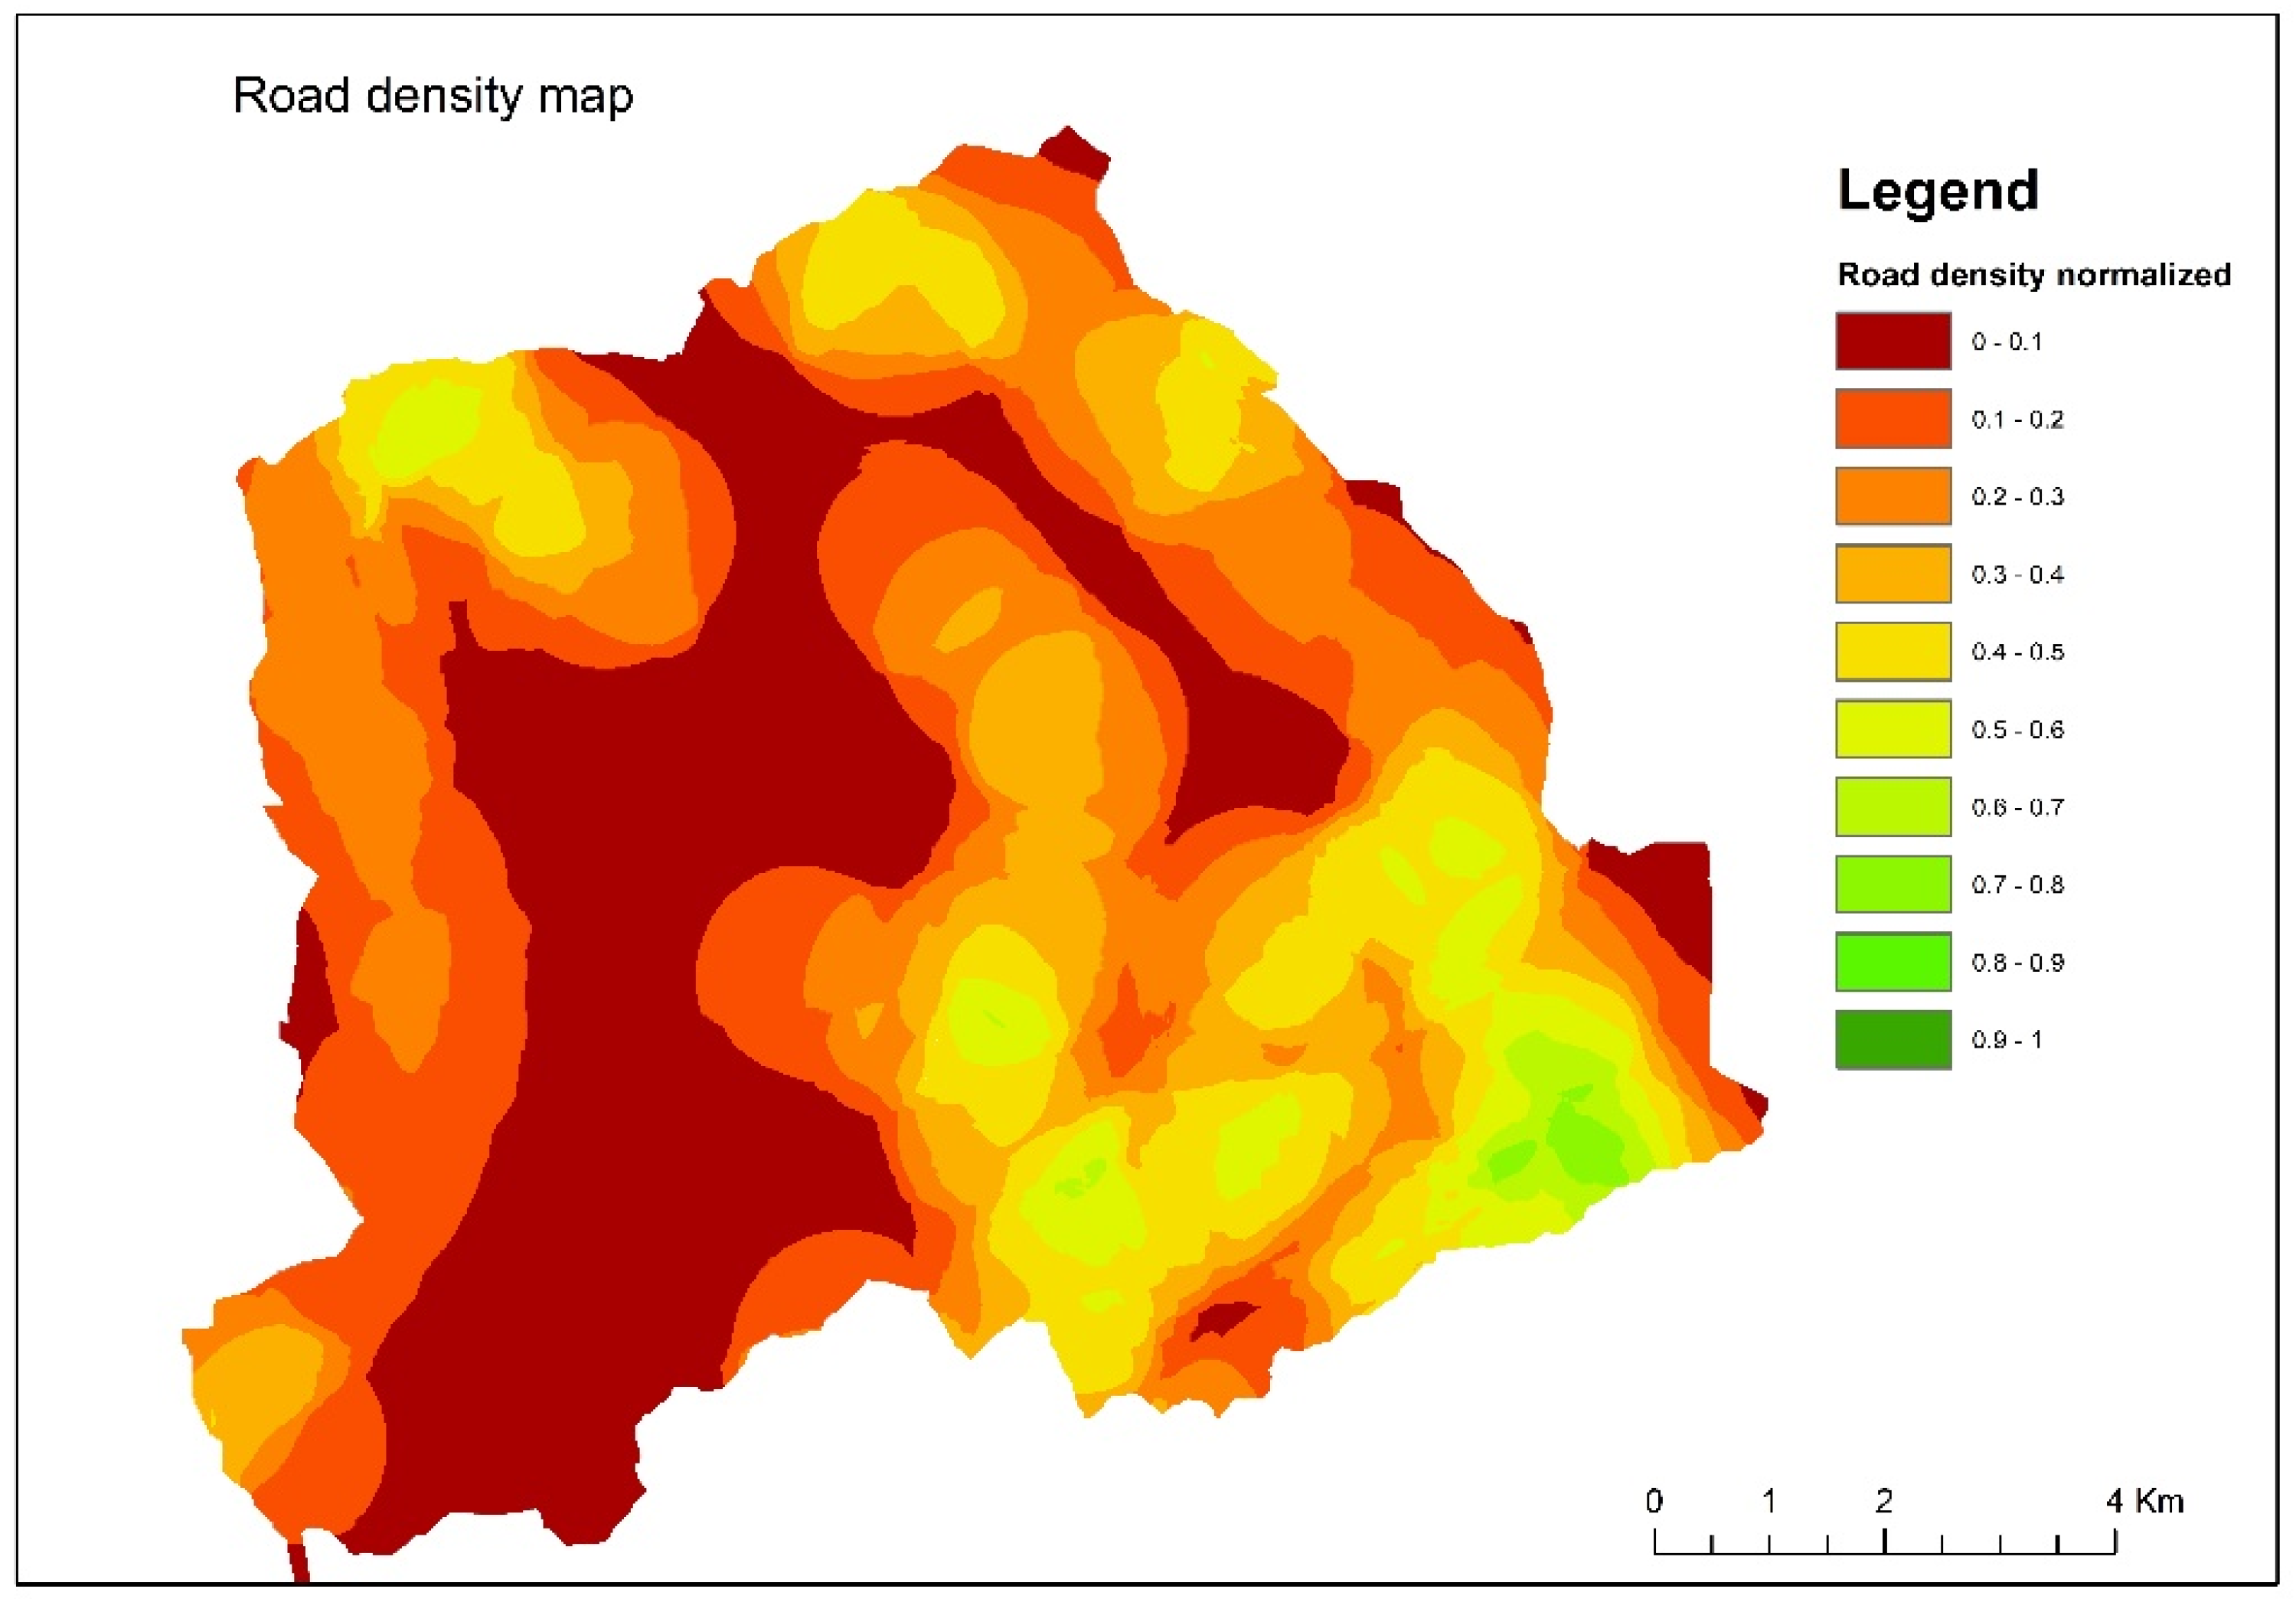
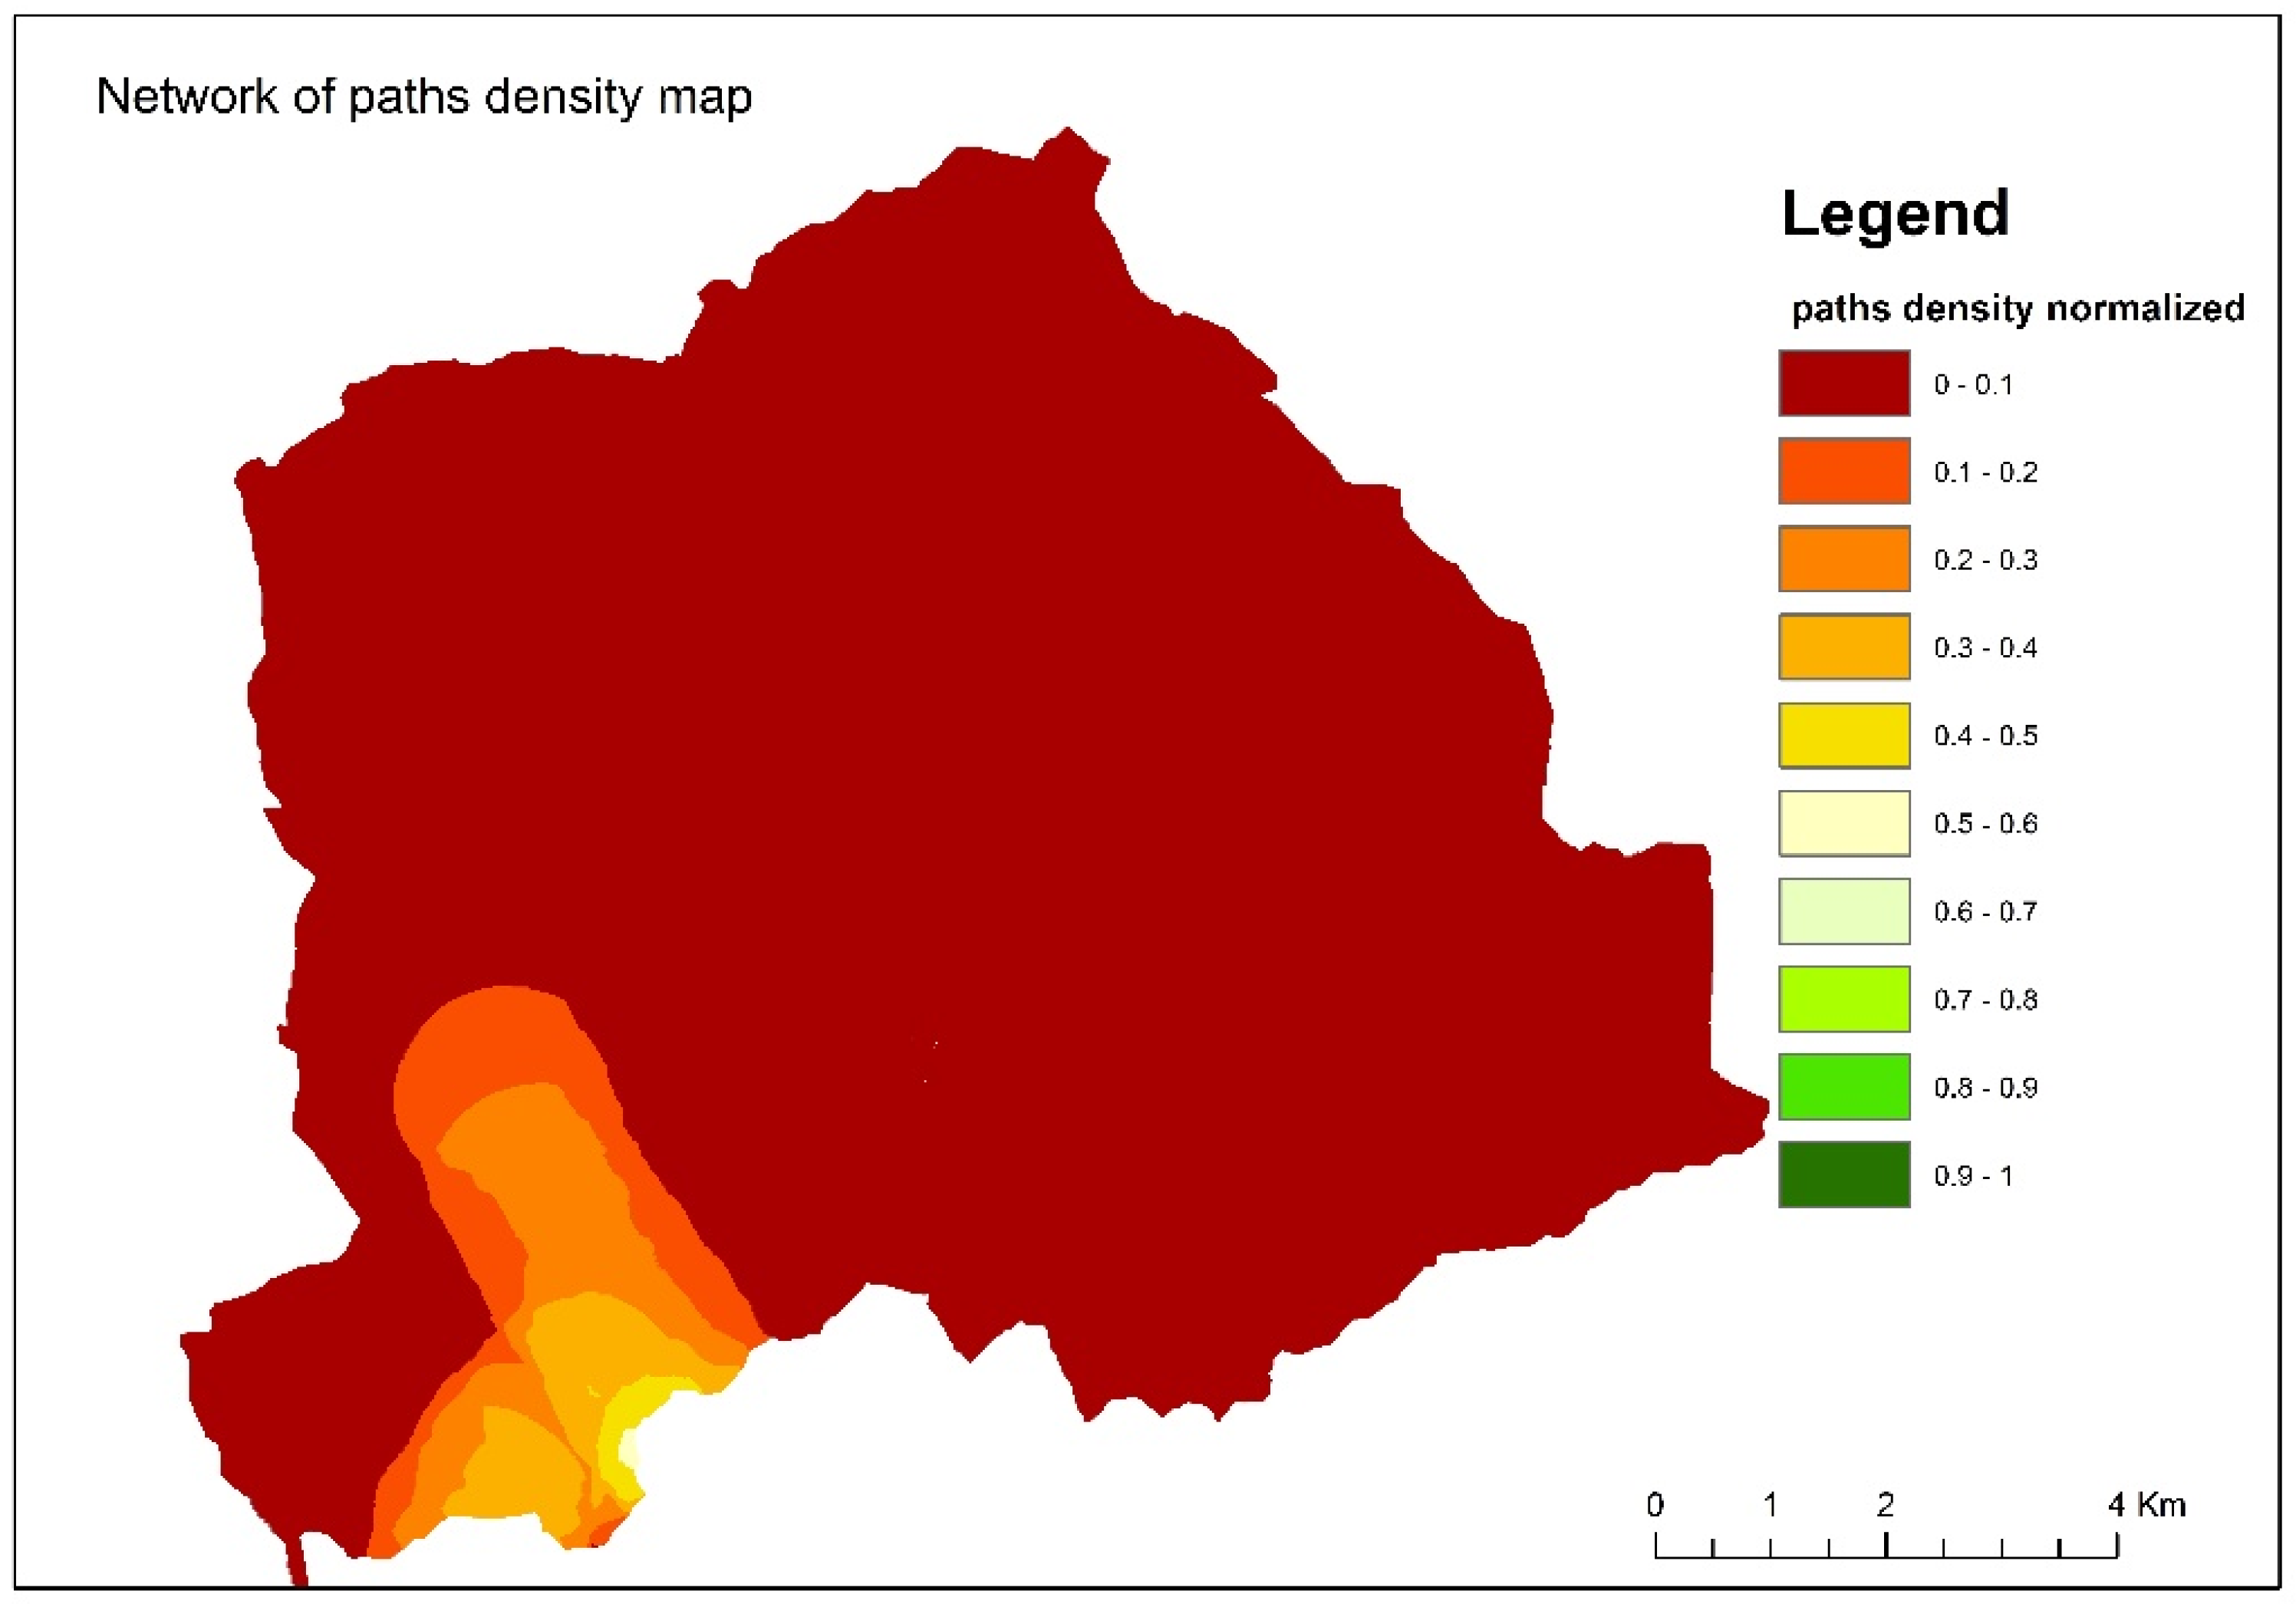
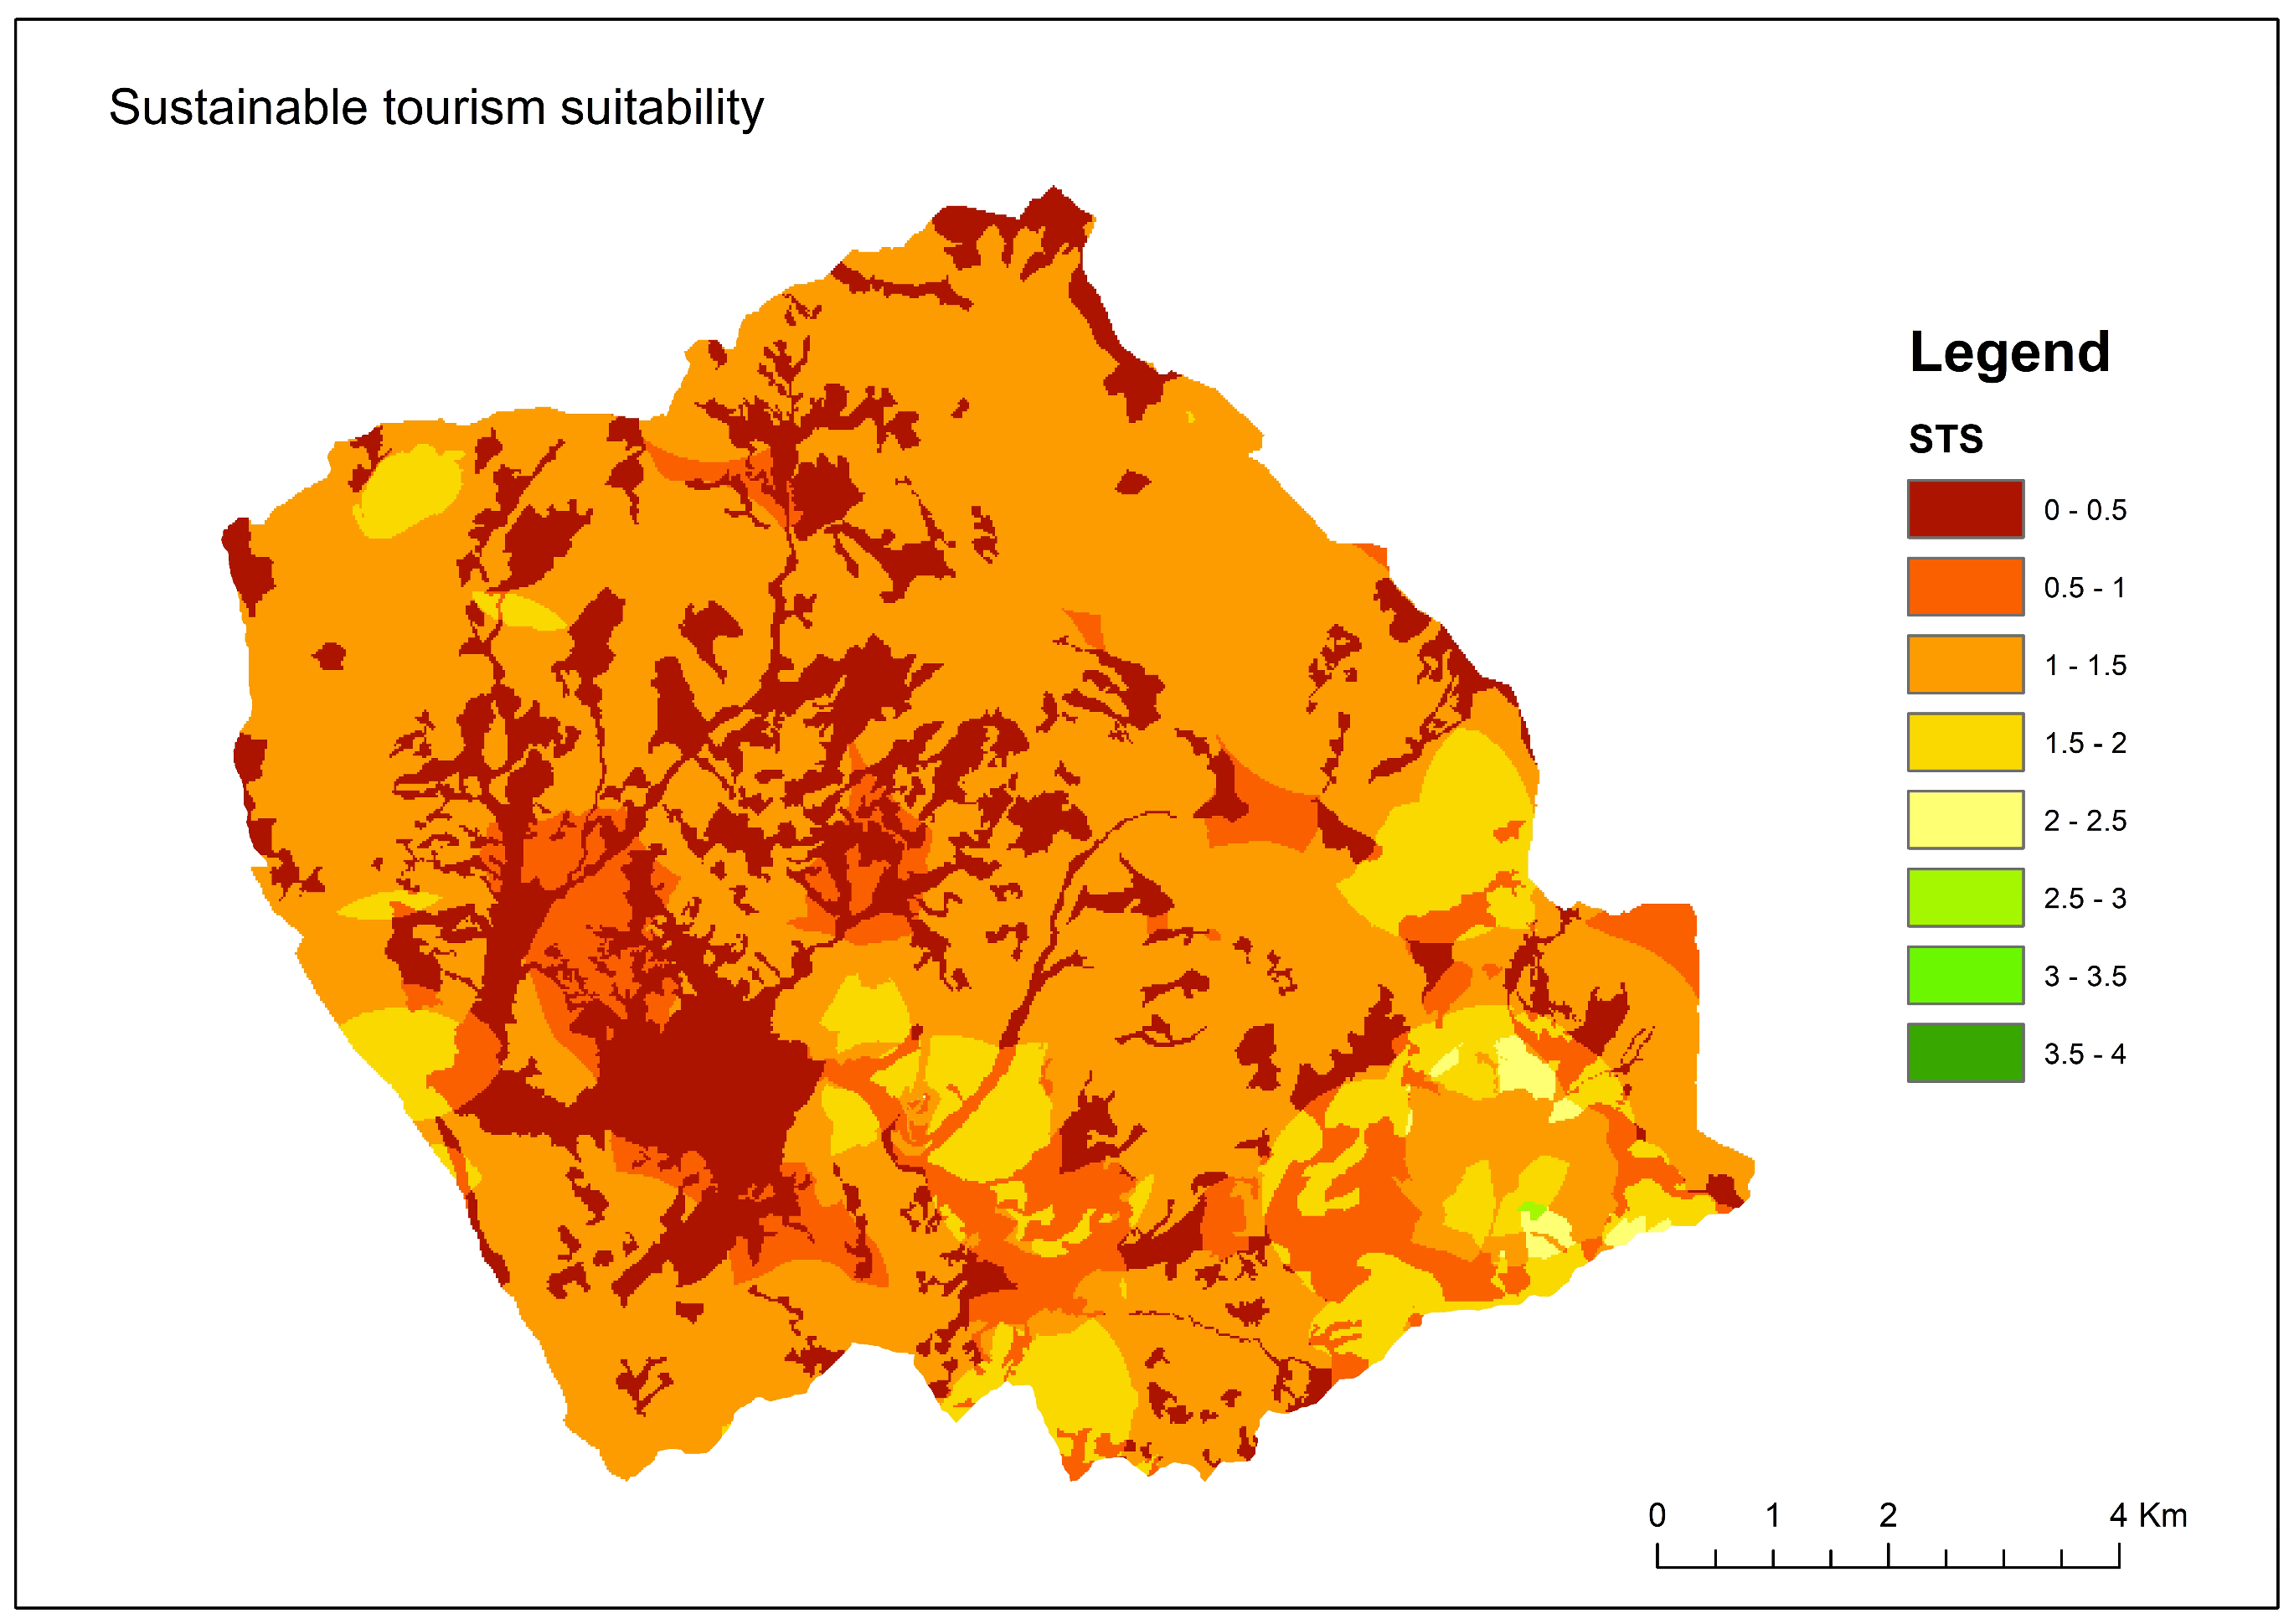
- Sustainable tourism suitability (cultural ecosystem services): For the evaluation of this ecosystem service, we considered the “sustainable tourism suitability” (STS) defined as the potential of the territory to offer services for sustainable tourism. To estimate the performance of this service within the park territory, we started from the following assumption: a territory, or parts of it, can have a performance in terms of tourism suitability depending on the presence or absence of some territorial elements: roads, hiking trails, habitat/naturalistic areas, restaurants, bar, hotels, sports facilities, and historical–cultural elements. A total of 4 macro-groups of territorial elements were defined and are shown in Table 5.
- To evaluate the spatial distribution of the ecosystem service, we then proceeded to evaluate the spatial distribution of each characteristic by carrying out a density analysis in a GIS environment. The density map of each feature was normalized (Figure A7, Figure A8, Figure A9 and Figure A10). An overlay analysis was then performed to obtain a performance map of STS for which each cell (cell size of 20 m) was attributed with a value within the range of 0–4 (low–high STS) as a result of the sum of the spatial density values of the individual territorial elements (Figure 4).
- The values of direct tourist flows within the “Parku Kombetar Mali i Dajtit” National Park provided by the National Agency for Protected Areas were used. The average annual flow (three-year period, 2021–2023) was 126,057 units that used the cableway to reach the protected area (within which the Bovilla Basin lies), departing from the city of Tirana. Official investigations show that the price of the cableway ticket is around 2 EUR/each. Therefore, the economic value in terms of tourist attractiveness of the entire protected area, considering only the value of the public transport ticket, is equal to 252,115 EUR/year. The extent of the entire protected area is 29,193.27 ha; thus, each single area can be standardized to the value of EUR 8.63.
2.5. Application of the Replacement Cost Method
3. Results
3.1. Determination of Soil Loss
3.2. Use of Monetary Methods for the Evaluation of Ecosystem Services Linked to Erosion
- The economic value of carbon loss (CO2/ha) varies from 0.01 to 348,94.00 EUR/t;
- The economic value of the loss of chemical elements varies from 0 to 1641.19 EUR/ha for K and from 0 to 224.22 EUR/ha for P;
- The economic value of the habitats varies from 0 to approximately 5000.00 EUR/ha;
- The economic value of crop production varies from 0 to 35,320.50 EUR/ha; thus, the economic weight/ha of this service is more incisive than that of the previous ones.
4. Discussion
4.1. Replacement Cost
4.2. Comparison
- It is always economically convenient to change the intended use of the land from pasture to forest (where possible and not in conflict with current environmental legislation), from agricultural land (corn or fodder) to forest, and from bare land to forest (where possible and not in conflict with current legislation). There is economic convenience if the values derived from the cost–benefit analysis are compared with the economic values of replacement cost from the Puglia Region price list (Table A5, value “Replacement cost”), while there is not economic convenience if the replacement cost values derive from the application of Measure 8.1 of the Rural Development Program of the Puglia Region [57].
- It is possible to compare the values described above for a period of 12 years (minimum period to allow a forestry seedbed to become young and stable, to grant the economic prize for forest maintenance and compensate the loss of income from the previous crop within the RDP of Puglia Region). Also, in this case, the considerations of convenience reported in point 1 are confirmed.
- It is more convenient from an economic point of view to transform bare land or pasture to forest (where in compliance with the legislation), since the bare land and pastures are almost non-productive. It is less convenient if the conversion takes place from productive agricultural land, even simply arable land (Table A5, value “Economic Convenience EUR/ha”), because the value of the ecosystem service of production (supply of products) is calculated with the MASAF 2023 Standard Value [59].
- It is also underlined that for the ZB4O orchard, for the M1O orchard, and for the ZB2A arable land, the convenience of carrying out the intervention is uneconomical even considering the replacement cost values and the values of ordinary maintenance that are higher than the price list of the Puglia Region (Table A5).
- It is not economically convenient to transform highly productive land (vineyards, plum orchards, horticultural crops, etc.), which is characterized by ecosystem services of very high economic value and not appropriately compensated by the replacement costs, maintenance prize, and income loss. The maintenance prize should be raised from EUR 2846.00 to at least EUR 7566.20 [57], as described in Table A5 (column “Total cost”). This is due to more frequent extreme weather events that drastically reduce the rooting of new plants, especially in the summer period, with the need to carry out at least six irrigations per year.
5. Conclusions
Author Contributions
Funding
Data Availability Statement
Conflicts of Interest
Appendix A

| No. | Sample Plot Code | Location | Elevation a.s.l (m) | Slope | Area (m2) | Soil Type | ||
|---|---|---|---|---|---|---|---|---|
| N | E | Degree | % | |||||
| 1 | ZB1A | N 41°26′31.71″ | E 19°54′55.79″ | 325 | 2.8 | 5 | 69.3 | Fluvic Kambisols |
| 2 | ZB2A | N 41°26′34.71″ | E 19°54′57.47″ | 327.6 | 2.5 | 4.6 | 89.5 | Fluvic Kambisols |
| 3 | ZB3A | N 41°26′38.18″ | E 19°54′53″ | 321.5 | 7 | 13.2 | 145.3 | Regosols Eutric |
| 4 | ZB1F | N 41°26′42.45″ | E 19°54′51.23″ | 329 | 18.4 | 34.6 | 72.9 | Haplic Kambisol |
| 5 | ZB1B | N 41°26′41.57″ | E 19°54′59.25″ | 357 | 31.8 | 62 | 42.5 | Haplic Leptosols |
| 6 | ZB2B | N 41°26′38.50″ | E 19°55′01.79″ | 358 | 35.7 | 72 | 46 | Haplic Leptosols |
| 7 | ZB3B | N 41°26′38.76″ | E 19°55′01.91″ | 360 | 36.5 | 74 | 41.9 | Haplic Leptosols |
| 8 | ZB3F | N 41°26′37.62″ | E 19°55′03.04″ | 363 | 237 | 44 | 66.9 | Haplic Leptosols |
| 9 | ZB4F | N 41°26′38.40″ | E 19°55′01.79″ | 353 | 32.6 | 64 | 74.5 | Haplic Kambisols |
| 10 | ZB4B | N 41°26′36.63″ | E 19°55′02.05″ | 350 | 23.3 | 43 | 66.7 | Haplic Leptosols |
| 11 | ZB2P | N 41°26′35.97″ | E 19°54′58.94″ | 340 | 19.8 | 36 | 70 | Kambisols Eutric |
| 12 | ZB3P | N 41°26′36.97″ | E 19°54′57.89″ | 336 | 13.6 | 24.2 | 85 | Kambisols Eutric |
| 13 | ZB4P | N 41°26′36.23″ | E 19°55′00.00″ | 341 | 19.8 | 36 | 65.6 | Kambisols Eutric |
| 14 | ZB5P | N 41°26′36.64″ | E 19°55′00.98″ | 346 | 7.4 | 13 | 85.5 | Kambisols Eutric |
| 15 | ZB4O | N 41°26′37.52″ | E 19°54′58.55″ | 342 | 15.8 | 28 | 72.3 | Kambisols Eutric |
| 16 | ZB2F | N 41°26′35.70″ | E 19°54′59.23″ | 337 | 31.8 | 62 | 59.3 | Kambisols Eutric |
| 17 | M1O | N 41°27′45.42″ | E 19°55′51.39″ | 491 | 20.2 | 41 | 74.9 | Haplic Luvisols |
| 18 | M1P | N 41°27′44.86″ | E 19°55′51.97″ | 474 | 29 | 55 | 19.4 | Haplic Luvisols |
| 19 | M1F | N 41°27′47.20″ | E 19°55′53.49″ | 473 | 21.6 | 40 | 63.6 | Haplic Luvisols |
| 20 | M1DF | N 41°27′47.16″ | E 19°55′54.35″ | 467 | 17.8 | 32 | 73.8 | Kambisols Eutric |
| 21 | M2P | N 41°27′47.34″ | E 19°55′52.22″ | 484 | 21.7 | 40 | 72.9 | Haplic Luvisols |
| 22 | M1B | N 41°27′54.53″ | E 19°55′47.63″ | 507.5 | 25.6 | 48 | 159.2 | Kambisols Eutric |
| 23 | M2F | N 41°27′53.72″ | E 19°55′46.83″ | 497 | 15.4 | 28 | 72.9 | Haplic Leptosols |
| 24 | M3P | N 41°27′45.14″ | E 19°55′53.18″ | 468 | 32.2 | 63 | 78.5 | Kambisols Eutric |
| 25 | M4P | N 41°27′46.25″ | E 19°55′54.15″ | 465 | 33.0 | 65 | 39.4 | Haplic Luvisols |
| Sample Plot Code | K (Mehlich 3-Extrable Elements Soil Analysis) (kg/ha) | P (Mehlich 3-Extrable Elements Soil Analysis) (kg/ha) | Organic Matter Converted into CO2 1 (kg/ha) |
|---|---|---|---|
| ZB5P | 124.882 | 2.287 | 384.509 |
| ZB4P | 94.398 | 1.729 | 289.138 |
| ZB3P | 123.179 | 2.256 | 385.254 |
| ZB4O | 820.593 | 140.137 | 4183.873 |
| ZB2P | 222.307 | 4.072 | 688.056 |
| ZB4F | 100.963 | 2.088 | 768.651 |
| ZB3F | 122.960 | 2.544 | 11.441 |
| ZB2F | 117.022 | 2.143 | 4.075 |
| ZB1P | 101.732 | 2.104 | 10.868 |
| ZB3A | −306.432 | 13.574 | 10.401 |
| ZB2A | 495.352 | 21.943 | 10.571 |
| ZB1A | 543.460 | 24.074 | 10.741 |
| ZB4B | 462.358 | 21.145 | 0.679 |
| ZB3B | 502.351 | 19.135 | 0.424 |
| ZB2B | 92.284 | 1.9473 | 0.382 |
| ZB1B | 94.874 | 3.997 | 0.148 |
| M1B | 267.073 | 3.373 | 2.717 |
| M2F | 7.009 | 7.009 | 4.818 |
| M1O | 295.57 | 4.965 | 7.854 |
| M1P | 317.65 | 4.840 | 3.545 |
| M1F | 125.81 | 0.759 | 4.818 |
| M1DF | 203.467 | 4.906 | 4.670 |
| M2P | 110.355 | 1.68 | 5.455 |
| M3P | 111.856 | 1.704 | 5.307 |
| M4P | 155.431 | 2.368 | 5.349 |


| Sample Plot Code | Land Use Classes (Corine Land Cover 2012) | I (Regulating) | II (Regulating) | III (Provisioning) | IV (Supporting) | V (Cultural) | |
|---|---|---|---|---|---|---|---|
| CO2 (EUR/t) | Habitat Quality (EUR/ha) | Agricultural and Forestry Production (EUR/ha) | K (EUR/ha) | P (EUR/ha) | CES (EUR/ha) | ||
| ZB5P | Pasture | 32.07 | 2892.09 | 326.00 | 249.76 | 3.66 | 5.57 |
| ZB4P | Pasture | 24.11 | 2930.39 | 326.00 | 188.80 | 2.77 | 5.51 |
| ZB3P | Pasture | 32.13 | 2923.44 | 326.00 | 246.36 | 3.61 | 5.42 |
| ZB4O | Orchard | 348.94 | 0.00 | 35,320.50 | 1641.19 | 224.22 | 2.20 |
| ZB2P | Pasture | 57.38 | 2931.38 | 326.00 | 444.61 | 6.52 | 5.45 |
| ZB4F | Conifer forests | 64.11 | 0.00 | 2600.88 | 201.93 | 3.34 | 2.45 |
| ZB3F | Conifer forests | 0.95 | 2377.92 | 2600.88 | 245.92 | 4.07 | 6.00 |
| ZB2F | Oak forest with pasture | 0.34 | 2203.63 | 326.00 | 234.04 | 3.43 | 5.46 |
| ZB1P | Conifer forests | 0.91 | 2524.45 | 2701.08 | 203.46 | 3.37 | 6.39 |
| ZB3A | Agricultural land (corn) | 0.87 | 0.00 | 3948.00 | 612.86 | 21.72 | 3.11 |
| ZB2A | Agricultural land (corn and beans) | 0.88 | 0.00 | 5757.50 | 990.71 | 35.11 | 2.20 |
| ZB1A | Forage | 0.90 | 0.00 | 2086.00 | 1086.92 | 38.52 | 2.20 |
| ZB4B | Bare lands | 0.06 | 0.00 | 0.00 | 0.00 | 0.00 | 5.89 |
| ZB3B | Bare lands | 0.04 | 0.00 | 0.00 | 0.00 | 0.00 | 2.49 |
| ZB2B | Bare lands | 0.03 | 0.00 | 0.00 | 0.00 | 0.00 | 2.45 |
| ZB1B | Bare lands | 0.01 | 0.00 | 0.00 | 0.00 | 0.00 | 6.39 |
| M1B | Bare earth with renaturalization | 0.23 | 0.00 | 0.00 | 534.15 | 5.40 | 1.47 |
| M2F | Broadleaved forests | 0.40 | 0.00 | 1147.93 | 14.02 | 11.22 | 1.48 |
| M1O | Orchard | 0.66 | 5156.14 | 32,843.33 | 0.00 | 0.00 | 5.60 |
| M1P | Cultivated meadow (alfalfa) | 0.30 | 3867.06 | 2114.00 | 635.31 | 7.74 | 5.64 |
| M1F | Broadleaved forests | 0.40 | 2900.63 | 1147.93 | 251.63 | 1.21 | 5.67 |
| M1DF | Degraded forest | 0.39 | 2905.11 | 653.52 | 0.00 | 0.00 | 5.67 |
| M2P | Cultivated meadow (alfalfa) | 0.45 | 3840.83 | 2114.00 | 220.71 | 2.69 | 5.67 |
| M3P | Pasture—meadow (alfalfa) | 0.44 | 3863.92 | 770.00 | 223.71 | 2.73 | 5.60 |
| M4P | Pasture—meadow (alfalfa) | 0.45 | 3862.22 | 770.00 | 310.86 | 3.79 | 5.60 |
| Sample Plot Code | Sub-Basin Name | Land Use Classes (Corine Land Cover 2012) | Replacement Cost (EUR/ha) | Authorized Costs (RDP Puglia) (EUR/ha) | Loss of Income (EUR/ha) | Loss of Income for 12 Years (EUR/ha) | Maintenance Prize for 12 Years (EUR/ha) | Total Cost 1 (EUR/ha) |
|---|---|---|---|---|---|---|---|---|
| ZB5P | Zall Bastar | Pasture | 18,192.00 | 10,500.00 | 0.00 | 0.00 | 34,154.40 | 52,346.40 |
| ZB4P | Zall Bastar | Pasture | 18,192.00 | 10,500.00 | 0.00 | 0.00 | 34,154.40 | 52,346.40 |
| ZB3P | Zall Bastar | Pasture | 18,192.00 | 10,500.00 | 0.00 | 0.00 | 34,154.40 | 52,346.40 |
| ZB4O | Zall Bastar | Orchard | 18,192.00 | 10,500.00 | 950.00 | 11,400.00 | 34,154.40 | 63,746.40 |
| ZB2P | Zall Bastar | Pasture | 18,192.00 | 10,500.00 | 0.00 | 0.00 | 34,154.40 | 52,346.40 |
| ZB4F | Zall Bastar | Conifer forests | 0.00 | 0.00 | 0.00 | 0.00 | 0.00 | 0.00 |
| ZB3F | Zall Bastar | Conifer forests | 0.00 | 0.00 | 0.00 | 0.00 | 0.00 | 0.00 |
| ZB2F | Zall Bastar | Oak forest with pasture | 0.00 | 0.00 | 0.00 | 0.00 | 0.00 | 0.00 |
| ZB1P | Zall Bastar | Conifer forests | 0.00 | 0.00 | 0.00 | 0.00 | 0.00 | 0.00 |
| ZB3A | Zall Bastar | Agricultural land (corn) | 18,192.00 | 10,500.00 | 700.00 | 8400.00 | 34,154.40 | 60,746.40 |
| ZB2A | Zall Bastar | Agricultural land (corn and beans) | 18,192.00 | 10,500.00 | 700.00 | 8400.00 | 34,154.40 | 60,746.40 |
| ZB1A | Zall Bastar | Forage | 18,192.00 | 10,500.00 | 64.00 | 768.00 | 34,154.40 | 53,114.40 |
| ZB4B | Zall Bastar | Bare lands | 18,192.00 | 10,500.00 | 0.00 | 0.00 | 34,154.40 | 52,346.40 |
| ZB3B | Zall Bastar | Bare lands | 18,192.00 | 10,500.00 | 0.00 | 0.00 | 34,154.40 | 52,346.40 |
| ZB2B | Zall Bastar | Bare lands | 18,192.00 | 10,500.00 | 0.00 | 0.00 | 34,154.40 | 52,346.40 |
| ZB1B | Zall Bastar | Bare lands | 18,192.00 | 10,500.00 | 0.00 | 0.00 | 34,154.40 | 52,346.40 |
| M1B | Mner i Siperm | Bare earth with renaturalization | 18,192.00 | 10,500.00 | 0.00 | 0.00 | 0.00 | 18,192.00 |
| M2F | Mner i Siperm | Broadleaved forests | 0.00 | 0.00 | 0.00 | 0.00 | 0.00 | 0.00 |
| M1O | Mner i Siperm | Orchard | 18,192.00 | 10,500.00 | 950.00 | 11,400.00 | 34,154.40 | 63,746.40 |
| M1P | Mner i Siperm | Cultivated meadow (alfalfa) | 18,192.00 | 10,500.00 | 700.00 | 8400.00 | 34,154.40 | 60,746.40 |
| M1F | Mner i Siperm | Broadleaved forests | 0.00 | 0.00 | 0.00 | 0.00 | 0.00 | 0.00 |
| M1DF | Mner i Siperm | Degraded forest | 0.00 | 0.00 | 0.00 | 0.00 | 0.00 | 0.00 |
| M2P | Mner i Siperm | Cultivated meadow (alfalfa) | 18,192.00 | 10,500.00 | 700.00 | 8400.00 | 34,154.40 | 60,746.40 |
| M3P | Mner i Siperm | Pasture—meadow (alfalfa) | 18,192.00 | 10,500.00 | 700.00 | 8400.00 | 34,154.40 | 60,746.40 |
| M4P | Mner i Siperm | Pasture—meadow (alfalfa) | 18,192.00 | 10,500.00 | 700.00 | 8400.00 | 34,154.40 | 60,746.40 |
| Sample Plot Code | Land Use Classes (Corine Land Cover 2012) | Total Tons of CO2 (EUR) | Monetary Revaluation of Habitat Quality 2007–2018 (EUR) | Agric. and Forestry Production (EUR/ha) | K (EUR/ha) | P (EUR/ha) | CES (EUR/ha) | Total ES 1 (EUR/ha) | Total for 12 Years (EUR/ha) | Replacement Cost (EUR/ha) | Lost Income (EUR/ha) | Lost Income for 12 Years (EUR/ha) | Maintenance (EUR/ha) | Total Cost 2 (EUR/ha) | Economic Convenience (EUR/ha) |
|---|---|---|---|---|---|---|---|---|---|---|---|---|---|---|---|
| ZB5P | Pasture | 32.07 | 2982.09 | 326.00 | 249.76 | 3.66 | 5.57 | 3509.16 | 10,230.01 | 18,192.00 | 0.00 | 0.00 | 34,154.40 | 52,346.40 | 42,116.39 |
| ZB4P | Pasture | 24.11 | 2930.39 | 326.00 | 188.80 | 2.77 | 5.51 | 3477.58 | 9430.53 | 18,192.00 | 0.00 | 0.00 | 34,154.40 | 52,346.40 | 42,915.87 |
| ZB3P | Pasture | 32.13 | 2923.44 | 326.00 | 246.36 | 3.61 | 5.42 | 3537.06 | 10,220.64 | 18,192.00 | 0.00 | 0.00 | 34,154.40 | 52,346.40 | 42,125.76 |
| ZB4O | Orchard | 348.94 | 0.00 | 35,320.50 | 1641.19 | 224.22 | 2.20 | 37,540.37 | 450,418.10 | 18,192.00 | 950.00 | 11,400.00 | 34,154.40 | 63,746.40 | −386,671.70 |
| ZB2P | Pasture | 57.38 | 2931.38 | 326.00 | 444.61 | 6.52 | 5.45 | 3771.34 | 12,945.55 | 18,192.00 | 0.00 | 0.00 | 34,154.40 | 52,346.40 | 39,400.85 |
| ZB4F | Conifer forests | 64.11 | 0.00 | 2600.88 | 201.93 | 3.34 | 2.45 | 2872.70 | 34,443.06 | 0.00 | 0.00 | 0.00 | 0.00 | 0.00 | no |
| ZB3F | Conifer forests | 0.95 | 2377.92 | 2600.88 | 245.92 | 4.07 | 6.00 | 5235.74 | 36,599.82 | 0.00 | 0.00 | 0.00 | 0.00 | 0.00 | no |
| ZB2F | Oak forest with pasture | 0.34 | 2203.63 | 326.00 | 234.04 | 3.43 | 5.46 | 2772.90 | 8969.40 | 0.00 | 0.00 | 0.00 | 0.00 | 0.00 | no |
| ZB1P | Conifer forests | 0.91 | 2524.45 | 2701.08 | 203.46 | 3.37 | 6.39 | 5439.66 | 37,430.27 | 0.00 | 0.00 | 0.00 | 0.00 | 0.00 | no |
| ZB3A | Agric. land (corn) | 0.87 | 0.00 | 3948.00 | 612.86 | 21.72 | 3.11 | 4586.56 | 55,001.41 | 18,192.00 | 700.00 | 8400.00 | 34,154.40 | 60,746.40 | 5744.99 |
| ZB2A | Agric. land (corn and beans) | 0.88 | 0.00 | 5757.50 | 990.71 | 35.11 | 2.20 | 6786.40 | 81,410.36 | 18,192.00 | 700.00 | 8400.00 | 34,154.40 | 60,746.40 | −20,663.96 |
| ZB1A | Forage | 0.90 | 0.00 | 2086.00 | 1086.92 | 38.52 | 2.20 | 3214.54 | 38,548.04 | 18,192.00 | 64.00 | 768.00 | 34,154.40 | 53,114.40 | 14,566.36 |
| ZB4B | Bare lands | 0.06 | 0.00 | 0.00 | 0.00 | 0.00 | 5.89 | 5.95 | 0.68 | 18,192.00 | 0.00 | 0.00 | 34,154.40 | 52,346.40 | 52,345.72 |
| ZB3B | Bare lands | 0.04 | 0.00 | 0.00 | 0.00 | 0.00 | 2.49 | 2.53 | 0.42 | 18,192.00 | 0.00 | 0.00 | 34,154.40 | 52,346.40 | 52,345.98 |
| ZB2B | Bare lands | 0.03 | 0.00 | 0.00 | 0.00 | 0.00 | 2.45 | 2.48 | 0.38 | 18,192.00 | 0.00 | 0.00 | 34,154.40 | 52,346.40 | 52,346.02 |
| ZB1B | Bare lands | 0.01 | 0.00 | 0.00 | 0.00 | 0.00 | 6.39 | 6.40 | 0.15 | 18,192.00 | 0.00 | 0.00 | 34,154.40 | 52,346.40 | 52,346.25 |
| M1B | Bare earth with renaturalization | 0.23 | 0.00 | 0.00 | 534.15 | 5.40 | 1.47 | 541.24 | 6477.26 | 18,192.00 | 0.00 | 0.00 | 0.00 | 18,192.00 | 11,714.74 |
| M2F | Broadleaved forests | 0.40 | 0.00 | 1147.93 | 14.02 | 11.22 | 1.48 | 1175.05 | 14,082.79 | 0.00 | 0.00 | 0.00 | 0.00 | 0.00 | no |
| M1O | Orchard | 0.66 | 5156.44 | 32,843.33 | 0.00 | 0.00 | 5.60 | 38,005.73 | 399,283.96 | 18,192.00 | 950.00 | 11,400.00 | 34,154.40 | 63,746.40 | −335,537.56 |
| M1P | Cultivated meadow (alfalfa) | 0.30 | 3867.06 | 2114.00 | 635.31 | 7.74 | 5.64 | 6630.05 | 36,955.30 | 18,192.00 | 700.00 | 8400.00 | 34,154.40 | 60,746.40 | 23,791.10 |
| M1F | Broadleaved forests | 0.40 | 2900.63 | 1147.93 | 251.63 | 1.21 | 5.67 | 4307.47 | 19,714.71 | 0.00 | 0.00 | 0.00 | 0.00 | 0.00 | no |
| M1DF | Degraded forest | 0.39 | 2905.11 | 653.52 | 0.00 | 0.00 | 5.67 | 3564.69 | 10,752.03 | 0.00 | 0.00 | 0.00 | 0.00 | 0.00 | no |
| M2P | Cultivated meadow (alfalfa) | 0.45 | 3480.83 | 2114.00 | 220.71 | 2.69 | 5.67 | 6184.36 | 31,895.10 | 18,192.00 | 700.00 | 8400.00 | 34,154.40 | 60,746.40 | 28,851.30 |
| M3P | Pasture—meadow (alfalfa) | 0.44 | 3863.92 | 770.00 | 223.71 | 2.73 | 5.60 | 4866.40 | 15,826.51 | 18,192.00 | 700.00 | 8400.00 | 34,154.40 | 60,746.40 | 44,919.89 |
| M4P | Pasture—meadow (alfalfa) | 0.45 | 3862.22 | 770.00 | 310.86 | 3.79 | 5.60 | 4952.92 | 16,883.41 | 18,192.00 | 700.00 | 8400.00 | 34,154.40 | 60,746.40 | 43,862.99 |
References
- Blum, A. Drought Resistance, Water-Use Efficiency, and Yield Potential—Are They Compatible, Dissonant, or Mutually Exclusive? Aust. J. Agric. Res. 2005, 56, 1159. [Google Scholar] [CrossRef]
- Blum, W.E.H. Functions of Soil for Society and the Environment. Rev. Environ. Sci. Biotechnol. 2005, 4, 75–79. [Google Scholar] [CrossRef]
- Costanza, R.; d’Arge, R.; De Groot, R.; Farber, S.; Grasso, M.; Hannon, B.; Limburg, K.; Naeem, S.; O’Neill, R.V.; Paruelo, J.; et al. The Value of the World’s Ecosystem Services and Natural Capital. Nature 1997, 387, 253–260. [Google Scholar] [CrossRef]
- Leemans, R.; De Groot, R.S. Millennium Ecosystem Assessment, Ecosystem and Human Well-Being: A Framework for Assessment; Island Press: Washington, DC, USA, 2005. [Google Scholar]
- European Commission. Thematic Strategy for Soil Protection; European Commission: Brussels, Belgium, 2006. [Google Scholar]
- Steinhoff-Knopp, B.; Kuhn, T.K.; Burkhard, B. The Impact of Soil Erosion on Soil-Related Ecosystem Services: Development and Testing a Scenario-Based Assessment Approach. Environ. Monit. Assess. 2021, 193, 274. [Google Scholar] [CrossRef]
- Guerra, C.A.; Maes, J.; Geijzendorffer, I.; Metzger, M.J. An Assessment of Soil Erosion Prevention by Vegetation in Mediterranean Europe: Current Trends of Ecosystem Service Provision. Ecol. Indic. 2016, 60, 213–222. [Google Scholar] [CrossRef]
- Sartori, M.; Philippidis, G.; Ferrari, E.; Borrelli, P.; Lugato, E.; Montanarella, L.; Panagos, P. A Linkage between the Biophysical and the Economic: Assessing the Global Market Impacts of Soil Erosion. Land Use Policy 2019, 86, 299–312. [Google Scholar] [CrossRef]
- Panagos, P.; Katsoyiannis, A. Soil Erosion Modelling: The New Challenges as the Result of Policy Developments in Europe. Environ. Res. 2019, 172, 470–474. [Google Scholar] [CrossRef]
- EU Soil Strategy for 2030—European Commission. Available online: https://environment.ec.europa.eu/publications/eu-soil-strategy-2030_en (accessed on 10 September 2024).
- Barrios, E. Soil Biota, Ecosystem Services and Land Productivity. Ecol. Econ. 2007, 64, 269–285. [Google Scholar] [CrossRef]
- Brevik, E.C.; Calzolari, C.; Miller, B.A.; Pereira, P.; Kabala, C.; Baumgarten, A.; Jordán, A. Soil Mapping, Classification, and Pedologic Modeling: History and Future Directions. Geoderma 2016, 264, 256–274. [Google Scholar] [CrossRef]
- Adhikari, K.; Hartemink, A.E. Linking Soils to Ecosystem Services—A Global Review. Geoderma 2016, 262, 101–111. [Google Scholar] [CrossRef]
- Balbi, S.; Prado, A.D.; Gallejones, P.; Geevan, C.P.; Pardo, G.; Pérez-Miñana, E.; Manrique, R.; Hernandez-Santiago, C.; Villa, F. Modeling Trade-Offs among Ecosystem Services in Agricultural Production Systems. Environ. Model. Softw. 2015, 72, 314–326. [Google Scholar] [CrossRef]
- FAO. The Future of Food and Agriculture—Trends and Challenges; Food and Agriculture Organization of the United Nations: Rome, Italy, 2017. [Google Scholar]
- Pereira, P.; Brevik, E.C.; Muñoz-Rojas, M.; Miller, B.A.; Smetanova, A.; Depellegrin, D.; Misiune, I.; Novara, A.; Cerdà, A. Soil Mapping and Processes Modeling for Sustainable Land Management. In Soil Mapping and Process Modeling for Sustainable Land Use Management; Elsevier: Amsterdam, The Netherlands, 2017; pp. 29–60. ISBN 978-0-12-805200-6. [Google Scholar]
- Robinson, D.A.; Fraser, I.; Dominati, E.J.; Davíðsdóttir, B.; Jónsson, J.O.G.; Jones, L.; Jones, S.B.; Tuller, M.; Lebron, I.; Bristow, K.L.; et al. On the Value of Soil Resources in the Context of Natural Capital and Ecosystem Service Delivery. Soil Sci. Soc. Am. J. 2014, 78, 685–700. [Google Scholar] [CrossRef]
- Ricci, G.F.; Jeong, J.; De Girolamo, A.M.; Gentile, F. Effectiveness and Feasibility of Different Management Practices to Reduce Soil Erosion in an Agricultural Watershed. Land Use Policy 2020, 90, 104306. [Google Scholar] [CrossRef]
- Ricci, G.F.; D’Ambrosio, E.; De Girolamo, A.M.; Gentile, F. Efficiency and Feasibility of Best Management Practices to Reduce Nutrient Loads in an Agricultural River Basin. Agric. Water Manag. 2022, 259, 107241. [Google Scholar] [CrossRef]
- Turner, R.K.; Daily, G.C. The Ecosystem Services Framework and Natural Capital Conservation. Environ. Resour. Econ. 2008, 39, 25–35. [Google Scholar] [CrossRef]
- Francis, R.A. Peter Kareiva, Heather Tallis, Taylor H. Ricketts, Gretchen C. Daily, and Stephen Polasky (eds), Natural Capital: Theory and Practice of Mapping Ecosystem Services. Oxford: Oxford University Press, 2011; 365 pp.: 9780199588992, £75 (hbk). Prog. Phys. Geogr. Earth Environ. 2011, 35, 701–704. [Google Scholar] [CrossRef]
- Kragt, M.E.; Robertson, M.J. Quantifying Ecosystem Services Trade-Offs from Agricultural Practices. Ecol. Econ. 2014, 102, 147–157. [Google Scholar] [CrossRef]
- Pascual, U.; Termansen, M.; Hedlund, K.; Brussaard, L.; Faber, J.H.; Foudi, S.; Lemanceau, P.; Jørgensen, S.L. On the Value of Soil Biodiversity and Ecosystem Services. Ecosyst. Serv. 2015, 15, 11–18. [Google Scholar] [CrossRef]
- De Groot, R.S.; Wilson, M.A.; Boumans, R.M.J. A Typology for the Classification, Description and Valuation of Ecosystem Functions, Goods and Services. Ecol. Econ. 2002, 41, 393–408. [Google Scholar] [CrossRef]
- Kumar, P. (Ed). The Economics of Ecosystems and Biodiversity: Ecological and Economic Foundations; Routledge: London, UK, 2012; ISBN 978-1-136-53880-3. [Google Scholar]
- Susan, S.; Karlen, D.L.; Cambardella, C.A. The Soil Management Assessment Framework: A Quantitative Soil Quality Evaluation Method. Soil Sci. Soc. Am. J. 2004, 68, 1945–1962. [Google Scholar] [CrossRef]
- Dominati, E.; Patterson, M.; Mackay, A. A Framework for Classifying and Quantifying the Natural Capital and Ecosystem Services of Soils. Ecol. Econ. 2010, 69, 1858–1868. [Google Scholar] [CrossRef]
- Faber, J.H.; Van Wensem, J. Elaborations on the Use of the Ecosystem Services Concept for Application in Ecological Risk Assessment for Soils. Sci. Total Environ. 2012, 415, 3–8. [Google Scholar] [CrossRef] [PubMed]
- Haygarth, P.M.; Ritz, K. The Future of Soils and Land Use in the UK: Soil Systems for the Provision of Land-Based Ecosystem Services. Land Use Policy 2009, 26, S187–S197. [Google Scholar] [CrossRef]
- Lavelle, P.; Decaëns, T.; Aubert, M.; Barot, S.; Blouin, M.; Bureau, F.; Margerie, P.; Mora, P.; Rossi, J.-P. Soil Invertebrates and Ecosystem Services. Eur. J. Soil Biol. 2006, 42, S3–S15. [Google Scholar] [CrossRef]
- Palm, C.; Sanchez, P.; Ahamed, S.; Awiti, A. Soils: A Contemporary Perspective. Annu. Rev. Environ. Resour. 2007, 32, 99–129. [Google Scholar] [CrossRef]
- Smit, E.; Bakker, P.A.H.M.; Bergmans, H.; Bloem, J.; Griffiths, B.S.; Rutgers, M.; Sanvido, O.; Singh, B.K.; Van Veen, H.; Wilhelm, R.; et al. General Surveillance of the Soil Ecosystem: An Approach to Monitoring Unexpected Adverse Effects of GMO’s. Ecol. Indic. 2012, 14, 107–113. [Google Scholar] [CrossRef]
- Wall, D.H.; Bardgett, R.; Covich, A.; Snelgrove, P. The Need for Understanding How Biodiversity and Ecosystem Functioning Affect Ecosystem Services in Soils and Sediments. Sustaining Biodiversity and Ecosystem Services in Soils and Sediments; Wall, D.H., Ed.; Island Press: Washington, DC, USA, 2004; Volume 64. [Google Scholar]
- Warr, B.; Ayres, R. Accounting for Soils: Towards an Integrated Sustainability and Productivity Assessment for Soils; Centre for the Management of Environmental and Social Responsibility (CMER): Fontainbleau, France, 2004. [Google Scholar]
- Weber, J.L. Accounting for Soil in the SEEA; European Environment Agency: Rome, Italy, 2007. [Google Scholar]
- Porter, J.; Costanza, R.; Sandhu, H.; Sigsgaard, L.; Wratten, S. The Value of Producing Food, Energy, and Ecosystem Services within an Agro-Ecosystem. AMBIO J. Hum. Environ. 2009, 38, 186–193. [Google Scholar] [CrossRef]
- Sandhu, H.S.; Wratten, S.D.; Cullen, R. Organic Agriculture and Ecosystem Services. Environ. Sci. Policy 2010, 13, 1–7. [Google Scholar] [CrossRef]
- Sandhu, H.S.; Wratten, S.D.; Cullen, R. The Role of Supporting Ecosystem Services in Conventional and Organic Arable Farmland. Ecol. Complex. 2010, 7, 302–310. [Google Scholar] [CrossRef]
- Swinton, S.M.; Lupi, F.; Robertson, G.P.; Hamilton, S.K. Ecosystem Services and Agriculture: Cultivating Agricultural Ecosystems for Diverse Benefits. Ecol. Econ. 2007, 64, 245–252. [Google Scholar] [CrossRef]
- Zhang, W.; Ricketts, T.H.; Kremen, C.; Carney, K.; Swinton, S.M. Ecosystem Services and Dis-Services to Agriculture. Ecol. Econ. 2007, 64, 253–260. [Google Scholar] [CrossRef]
- Baloshi, V.; Gjoka, V.; Collaku, N.; Toromani, E. The Possibility of Establishing a Scheme for Payments for Ecosystem Services at the Bovilla Watershed (Tirana). Albanian J. Agric. Sci. 2019, 18, 50–57. [Google Scholar]
- Wunder, S. Payments for Environmental Services: Some Nuts and Bolts; Center for International Forestry Research (CIFOR): Bogor, Indonesia, 2005. [Google Scholar]
- Van der Born, G.J.; De Haan, B.J.; Pearce, D.W.; Howarth, A. Technical Report on Soil Degradation in Europe: An Integrated Economic and Environmental Assessment; RIVM: Bilthoven, The Netherlands, 2000. [Google Scholar]
- Baloshi, V.; Gjoka, F.; Çollaku, N.; Toromani, E. Determination of Soil Loss by Erosion in Different Land Covers Categories and Slope Classes in Bovilla Watershed, Tirana, Albania. Int. J. Environ. Ecol. Eng. 2019, 13, 57–61. [Google Scholar] [CrossRef]
- Baloshi, V.; Gjoka, V.; Collaku, N.; Toromani, E. Relationship between Water Quality and Land Use in Bovilla Watershed, Tirana Region (Albania). Fresenius Environ. Bull. 2019, 28, 4435–4441. [Google Scholar]
- ISO 14235:1998; Soil Quality—Determination of Organic Carbon by Sulfochromic Oxidation. ISO: Geneva, Switzerland, 1998. Available online: https://www.iso.org/standard/23140.html (accessed on 20 June 2024).
- Prezzi CO2—Sendeco2. Available online: https://www.sendeco2.com/it/prezzi-co2 (accessed on 20 June 2024).
- Investing.com—Stock Market Quotes & Financial News. Available online: https://www.investing.com/ (accessed on 20 June 2024).
- Habitat Quality|The Natural Capital Project. Available online: https://naturalcapitalproject.stanford.edu/invest/habitat-quality (accessed on 20 June 2024).
- Hall, L.S.; Krausan, P.R.; Morrison, M.L. The Habitat Concept and a Plea for Standard Terminology. Wildl. Soc. Bull. 1997, 25, 173–182. [Google Scholar]
- Nellemann, C.; Thomsen, M.G. Long-Term Changes in Forest Growth: Potential Effects of Nitrogen Deposition and Acidification. Water Air Soil Pollut. 2001, 128, 197–205. [Google Scholar] [CrossRef]
- McKinney, M.L. Urbanization, Biodiversity, and Conservation. BioScience 2002, 52, 883. [Google Scholar] [CrossRef]
- Forman, R.T.T. (Ed.) Road Ecology: Science and Solutions; Island Press: Washington, DC, USA, 2003; ISBN 978-1-55963-932-3. [Google Scholar]
- Costanza, R.; De Groot, R.; Sutton, P.; Van Der Ploeg, S.; Anderson, S.J.; Kubiszewski, I.; Farber, S.; Turner, R.K. Changes in the Global Value of Ecosystem Services. Glob. Environ. Chang. 2014, 26, 152–158. [Google Scholar] [CrossRef]
- Conversion Rates—Purchasing Power Parities (PPP)—OECD Data. Available online: https://data.oecd.org/conversion/purchasing-power-parities-ppp.htm (accessed on 20 June 2024).
- Istat—Rivaluta. Available online: https://rivaluta.istat.it/ (accessed on 20 June 2024).
- Bando Sottomisura 8.1—2022—PSR Puglia. Available online: https://psr.regione.puglia.it/bando-sottomisura-8.1-2022?redirect=%2Fsottomisura-8.1 (accessed on 22 July 2024).
- Elenco Prezzi Opere Pubbliche. 2024. Available online: https://www.regione.puglia.it/web/territorio-mobilita-e-infrastrutture/elenco-prezzi-opere-pubbliche-2024 (accessed on 22 July 2024).
- Masaf—Risultato Della Ricerca. Available online: https://www.politicheagricole.it/flex/cm/FixedPages/Common/Search.v3.php/L/IT/s/1 (accessed on 22 July 2024).
- Madenoğlu, S.; Pınar, M.Ö.; Şahin, S.; Erpul, G. Sustainable Land Management for Mitigating Soil Erosion at the Catchment Scale. Türkiye Tarımsal Araştırmalar Derg. 2024, 11, 176–190. [Google Scholar] [CrossRef]

| Description and Meaning | Category |
|---|---|
| Products people obtain from ecosystems, such as food, fuel, fibers, and fresh water. | Provisioning services |
| The benefits people obtain from the regulation of ecosystem processes, including air quality maintenance, climate regulation, erosion control, regulation of human diseases, and water purification. | Regulating services |
| The non-material benefits people obtain from ecosystems through spiritual enrichment, cognitive development, reflection, recreation, and aesthetic experiences. | Cultural services |
| Services that are necessary for the production of all other ESs, such as primary production, production of oxygen, and soil formation. | Supporting functions |
| Sub-Watershed | Area (ha) | Slope (degree) | Elevation (m) a.s.l. | |
|---|---|---|---|---|
| Min | Max | |||
| Bovilla reservoir | 345.78 | 1.70 | 314.60 | 356.29 |
| Ranxe Bruz-Zall | 1626.26 | 20.45 | 314.60 | 1249.95 |
| Bruz Mal | 1422.95 | 22.99 | 319.82 | 1623.64 |
| Mner i Siperm | 967.41 | 16.86 | 314.60 | 1180.65 |
| Vilez | 2343.93 | 20.00 | 321.57 | 1520.81 |
| Zall Bastar | 1979.42 | 18.11 | 335.58 | 1606.49 |
| Total | 9515.24 | |||
| Sample Code | Soil Type | Laboratory Analysis | |||||||
|---|---|---|---|---|---|---|---|---|---|
| pH H2O | pH CaCl2 | K Available | P Available | Organic Matter (%) | Sand | Silt | Clay | ||
| mg/100 g | % | ||||||||
| M1B | Leptosol | 8.16 | 7.38 | 9.50 | 0.12 | 1.28 | 15.76 | 49.90 | 32.10 |
| ZB1A | Kambisol | 7.60 | 6.95 | 22.80 | 1.01 | 5.06 | 12.46 | 65.66 | 21.89 |
| ZB3F | Leptosol | 8.16 | 7.39 | 14.50 | 0.30 | 5.39 | 16.42 | 52.79 | 30.79 |
| ZB3P | Kambisol | 6.66 | 5.86 | 13.10 | 0.25 | 1.93 | 18.80 | 52.91 | 28.90 |
| ZB4O | Kambisol | 7.42 | 6.90 | 21.90 | 3.74 | 5.26 | 16.70 | 51.65 | 27.43 |
| M1F | Phaeozem | 7.76 | 7.07 | 11.60 | 0.07 | 2.27 | 21.17 | 51.86 | 26.97 |
| M2P | Kambisol | 7.83 | 7.06 | 10.50 | 0.16 | 2.57 | 16.03 | 48.61 | 35.35 |
| M2F | Kambisol | 8.13 | 7.39 | 80.95 | 1.26 | 2.27 | 19.21 | 49.22 | 33.30 |
| Land Use Classes (Corine Land Cover 2012) | Area (ha) |
|---|---|
| Pasture | 302.531 |
| Complex cultivated areas | 453.654 |
| Lands covered with crops and natural vegetation | 1247.31 |
| Broadleaved forests | 2423.62 |
| Conifer forests | 149.153 |
| Mixed forests | 33.012 |
| Herbaceous vegetation | 517.519 |
| Sclerophyll vegetation | 1143.24 |
| Transition areas from forests to shrub lands | 1964.31 |
| Others | 130.525 |
| Bare lands | 0.00 |
| Sparse vegetation areas | 656.366 |
| Aquatic areas (rivers, streams, lakes) | 436.144 |
| Total area | 9457.384 |
| Territorial Element | Description |
|---|---|
| Road network | All roads in the park |
| Network of paths | The network of pedestrian roads and hiking trails |
| Habitat quality | The spatial distribution of elements with high naturalistic value within the park |
| Points of interest | Restaurants, bars, hotels, sports facilities, and historical–cultural elements |
| Land Use | Total Soil Loss by Year (t/ha) | ||
|---|---|---|---|
| 2017 | 2018 | 2019 | |
| Agricultural land | 57.59 | 90.37 | 29.05 |
| Bare land | 773.78 | 747.47 | 283.61 |
| Degraded forest | 25.27 | 35.24 | 11.53 |
| Forest | 33.13 | 63.03 | 26.20 |
| Orchard | 81.63 | 79.30 | 19.36 |
| Pasture | 154.81 | 136.09 | 58.15 |
| Total | 1126.21 | 1151.50 | 427.90 |
| Land Use | Mean Soil Loss by Year (t/ha) | Mean Soil Loss (2017–2019) t/ha | ||
|---|---|---|---|---|
| 2017 | 2018 | 2019 | ||
| Agricultural land | 19.20 | 30.12 | 9.68 | 19.67 |
| Bare land | 154.76 | 149.49 | 56.72 | 120.32 |
| Degraded forest | 25.27 | 35.24 | 11.53 | 24.01 |
| Forest | 6.63 | 12.61 | 5.24 | 8.16 |
| Orchard | 40.82 | 39.65 | 9.68 | 30.05 |
| Pasture | 17.20 | 15.12 | 6.46 | 12.93 |
| Total | 45.04 | 46.06 | 17.12 | 36.07 |
Disclaimer/Publisher’s Note: The statements, opinions and data contained in all publications are solely those of the individual author(s) and contributor(s) and not of MDPI and/or the editor(s). MDPI and/or the editor(s) disclaim responsibility for any injury to people or property resulting from any ideas, methods, instructions or products referred to in the content. |
© 2024 by the authors. Licensee MDPI, Basel, Switzerland. This article is an open access article distributed under the terms and conditions of the Creative Commons Attribution (CC BY) license (https://creativecommons.org/licenses/by/4.0/).
Share and Cite
Romanazzi, G.R.; Ottomano Palmisano, G.; Cioffi, M.; Leronni, V.; Toromani, E.; Koto, R.; De Boni, A.; Acciani, C.; Roma, R. A Cost–Benefit Analysis for the Economic Evaluation of Ecosystem Services Lost Due to Erosion in a Mediterranean River Basin. Land 2024, 13, 1512. https://doi.org/10.3390/land13091512
Romanazzi GR, Ottomano Palmisano G, Cioffi M, Leronni V, Toromani E, Koto R, De Boni A, Acciani C, Roma R. A Cost–Benefit Analysis for the Economic Evaluation of Ecosystem Services Lost Due to Erosion in a Mediterranean River Basin. Land. 2024; 13(9):1512. https://doi.org/10.3390/land13091512
Chicago/Turabian StyleRomanazzi, Giuliano Rocco, Giovanni Ottomano Palmisano, Marilisa Cioffi, Vincenzo Leronni, Ervin Toromani, Romina Koto, Annalisa De Boni, Claudio Acciani, and Rocco Roma. 2024. "A Cost–Benefit Analysis for the Economic Evaluation of Ecosystem Services Lost Due to Erosion in a Mediterranean River Basin" Land 13, no. 9: 1512. https://doi.org/10.3390/land13091512