Article

A Non-Compensatory Index of Community Participation in Cross-Border Tourism Development Processes

Department of Statistical Sciences “Paolo Fortunati” and Center for Advanced Studies on Tourism, University of Bologna, 40126 Bologna, Italy
*
Author to whom correspondence should be addressed.
Land 2024, 13(9), 1519; https://doi.org/10.3390/land13091519
Submission received: 31 August 2024 / Revised: 15 September 2024 / Accepted: 16 September 2024 / Published: 19 September 2024

Abstract

:
We propose a composite index to measure and benchmark community participation in cross-border tourism development processes. The index synthesizes information regarding three dimensions of this construct, deemed as very important by the extant literature: residents’ engagement in the planning process and willingness to proactively welcome tourists and provide tourist services directly through sharing-economy platforms. The latter aspect is crucial to develop a local tourist supply able to combine environmental sustainability and financial feasibility in marginal areas, where public funding is scarce and private investments are unprofitable. This study offers a methodological innovation using response rates to open-ended questions to measure residents’ engagement in tourism planning. By applying the ELECTRE III algorithm, which is non-compensatory and ensures reliability in the presence of a high degree of uncertainty, survey information is aggregated in a single figure, which can be easily interpreted by destination managers and policymakers. After COVID-19, in readying for the next pandemic, decision makers should find our index as a very relevant and useful tool for tourism recovery and innovation planning, including compliance with measures to prevent the spread of future infections. We apply the proposed index to ten Croatian and Italian lands involved in a European development project. Data were collected through face-to-face interviews with residents, according to an availability sampling design. We obtained 879 valid questionnaires. The robustness of the resulting index is tested through an uncertainty and a sensitivity analysis.

1. Introduction

Community participation in land management and in planning land use changes is pivotal to the exercise of democratic citizenship [1]. The active involvement of citizens in solving their own community’s problems can improve the local quality of life [2], social wellbeing [3], and environmental and economic conditions [4]. Moreover, community participation is crucial to achieve sustainable growth [5,6]. Involving residents in sustainable tourism development is increasingly recognized as a privileged means to reconcile the local socio-economic growth with the conservation of both the natural ecosystem and the cultural heritage [7,8]. Along with community participation, cross-border partnerships can be the key for sustainable development [9]. In these contexts, benchmarking tools are particularly useful to devise common objectives, strategies, and action plans. Such tools help to detect relative strengths and weaknesses, as well as the best practices, that can be adapted to other territories in a mutual learning experience [10,11].
The purpose of this study is to develop a benchmarking tool that synthesizes information about community participation in cross-border sustainable tourism development processes. The significance of this work relies on the exploitability of the proposed composite index (CI) for monitoring participation across the various stages of land use changes and management. This task is especially important within the framework of cross-border cooperation, which is becoming a popular path to pursue sustainable development [9]. In fact, cross-border cooperation allows for international partners to concentrate more resources and knowledge on a single process, to cluster international attractions, and to carry out joint actions and functional regionalization [12].
This work originated from EXCOVER, an Interreg Italy–Croatia project, started in 2017, that placed special emphasis on residents’ participation. Destination managers and policymakers of the 10 lands involved in EXCOVER asked scientific partners for a single figure, easy to interpret in a comparative cross-border framework, that highlights the participation level of their community. Building on the tourism literature, we measure three dimensions of community participation deemed as very important also by the policymakers and experts with whom we collaborated in EXCOVER. The three dimensions are (1) residents’ engagement in the land use change planning process [13,14], (2) willingness to welcome tourists warmly [15], and (3) availability to provide tourist services through sharing-economy platforms [16].
Planning tourism development means making decisions about the land use changes that are necessary to attract tourist market segments, selected based on the land’s potential as a tourism destination. A novelty introduced in this study consists of assessing this important dimension (1) by means of response rates to open-ended questions. The latter are interpreted as measures of respondents’ engagement in providing information and suggestions for the sustainability-oriented tourism development planning of their land. Because the questions can pertain to any project theme and goal, using response rates allows for two types of information to be retrieved from each answer: the details about the topic at hand and the respondents’ engagement.
The importance of dimension (2) for tourism growth is widely acknowledged because the tourist experience configurates as a cocreation that stems from the resident–tourist interaction [17]. It has been shown that pleasant social exchanges with the host community, which make visitors feel welcomed, generate affective benefits, which play a crucial role in determining the experiential value of tourism [18]. Thus, the higher the resident–tourist relational quality, the greater the perceived value of the tourist experience and the wider the tourists’ satisfaction [19]. An increase in visitors’ satisfaction is associated with higher revenues and other economic benefits from the tourism sector [20]. In fact, residents’ welcoming and hospitable attitudes toward tourists make the after-trip destination’s image more attractive and increase the probability that visitors will recommend that destination to others [18].
Turning to dimension (3), sharing-economy platforms provide suppliers with information and communication technology tools that allow for them to give users short-term access to different kinds of accommodation, transport, home restaurants, and other services [21]. Sharing-economy-based services can be commercial (i.e., provided by a company) or non-commercial, that is, offered by private citizens as gig work [22]. The economic feasibility of commercial providers of services on a sharing basis depends on the user density, which must allow for this business to scale up quickly [23]. This is not the case in marginal areas, such as those analyzed in this study. There, private investments are not profitable enough, and the public sector does not fund the building of infrastructures and facilities, given the low utility/cost ratio. Indeed, because the potential of marginal areas to develop tourism is mainly constituted by the local natural resources and environmental quality, there, the construction of ‘traditional’ tourism facilities and infrastructures is not even desirable. Thus, non-commercial shared-economy-based solutions appear to be the best way to combine sustainability and tourism growth in the setup of a locally owned and managed tourism supply [16,24].
Because the three dimensions measured are non-interchangeable forms of community participation, which respond to different tourism development needs, we propose a non-compensatory index, that does not allow for high levels of some components to compensate for low levels of others. Thus, in the index’s construction, we employ the ELECTRE III aggregation function because it has been shown to outperform the other non-compensatory functions with highly uncertain data [25,26].
The propounded index will benefit tourism growth, especially in marginal lands, where tourist demand is almost null and a sustainable tourism supply must be built in the absence of large investments, either public or private. In these lands, only the active involvement of residents in the setup of the needed services, motivated by the desire to contribute to their territory rather than by profitability, can make the land use changes required to turn a neglected town into a successful destination or to relaunch a declining area. By quantifying the extent to which developing sustainable tourism is consistent with the local community’s intentions and attitudes and compatible with the availability of underused assets and resources, our index instructs policymakers and destination managers about the feasibility of tourism-based growth. Moreover, being devised as a benchmarking tool, this index facilitates cross-border cooperation by making it straightforward to identify the best practices among international partners and by speeding up the reciprocal knowledge needed to boost synergies. For these reasons, the possibility to monitor community participation through the composite index presented in this paper has been deemed as particularly relevant by policymakers involved in EXCOVER and might be of interest to many further territories worldwide. From a dynamic perspective, thanks to the proposed index, decision makers can efficiently track changes in community participation levels over time and devise timely interventions to compensate for possible declines. In fact, the possibility to build a tourism supply planned, owned, and managed by residents could be jeopardized if the perception of the negative impacts of tourism (like pollution, traffic, and litter, e.g., as in [27]) prevails in the host community. Residents′ perceptions change over time and are influenced by events like the COVID-19 pandemic [15].

2. Literature Review

2.1. Community Participation

Community participation consists of the active involvement of citizens in the decision-making processes, which regard problems and issues that affect their own land and lives, in a cooperative fashion [28,29]. As highlighted by Dahl [30], the concept of participation implies community engagement and social identity, and it builds on the relation among authority, influence, and power. Participation can be either expressive or instrumental [31]. Expressive participation is driven by the individual sense of identity and belonging, and it is aimed at strengthening social ties. Instrumental participation is directed toward the attainment of a political (in a broad sense) goal able to improve the community′s conditions.
Ekman and Amna [32] distinguish three main typologies of participation: political, civil, and disengagement. According to the authors, civil participation is composed of social involvement that is motivated by socio-political interests and civic engagement, which includes concrete actions for the community’s benefit. Talò et al. [33] observe that civic engagement is often set against conventional political participation. Moreno-Jiménez et al. [34] define community participation as one of the two dimensions of civic engagement (the other is socio-political participation). According to these researchers, community participation consists of informal social activities, while socio-political participation is composed of formal behaviors oriented toward social change.
Community participation has been shown to be driven by place attachment [35], a sense of community, community and place identities, social wellbeing, and trust in communities and institutions [33,36,37]. Further determinants of community participation include the perceived cost–benefit ratio [38], affective and reactive emotions [39], political and ethical values [40], as well as motivation [41].

2.2. Community Participation in Tourism

Community participation in tourism development is defined as the active involvement of the people who reside and interact in a certain land in the planning, delivery, and day-to-day management of the local tourism industry [42]. The host community can be involved in all the stages of the development process (as per [6]) or just in some [43]. However, most of the literature agrees that residents’ participation is especially important in the land use planning and profit-sharing phases [13,14,44]. Tosun [45] identified three typologies of residents’ participation in planning: coerced, induced, and spontaneous, pointing out that the locals have actual decision-making power only when they take the initiative.
According to Hung et al. [46], the literature about community participation in tourism can be grouped into two strands: one oriented to “means” and the other to “ends”. The former detects the factors that influence participation; the latter investigates its levels or outcomes. Means-oriented research has found that giving locals the tourism industry’s ownership and favoring communication among them tend to increase participation levels [47]. Adopting an effective method for participatory planning, promoting public awareness, and residents’ education and training are further crucial factors [13,14]. If residents expect that tourism development will comply with environmental sustainability, they should be more willing to participate [48,49]. The decentralization of the administrative, political, and financial powers to local institutions has been recognized as essential for the success of community participation [14,45]. In general, the motivation, opportunity, and ability to take part in the development process can explain this construct [46,50]. Conversely, obstacles to residents’ involvement include an inadequate representation of tourism development [46], attachment to local traditions and fear of losing them by opening to visitors, and resistance to change [42]. Additional hindering factors are the community’s lack of power, coordination, time, and financial resources [14,51]. The peripherality of the community and of its land is also an essential impediment [42,46]. Inadequate government, weak social institutions, and top-down decision making have also been shown to hinder community participation [13]. Further obstacles are residents’ lack of civil duty, initiative, and self-confidence and aversion to risk [42].
Turning to ends-oriented studies, Selin [52] has shown how different typologies of community participation can be characterized by the geographical and temporal scopes of tourism development processes, the legal framework of the collaboration, the perception of participants to have control over decision making, and the size and diversity of the organizations involved. Many authors agree that community participation is necessary to reach sustainability and biodiversity conservation [6,13,53]. Much research has found that residents’ living conditions, community satisfaction, and quality of life are likely to increase if residents actively take part in tourism development. Participation has been shown to boost social support and enhance social capital [13]. Moreover, direct involvement can increase residents’ income by providing new business and employment opportunities [6,53].

2.3. Benchmarking for Tourism Development Partnerships

Benchmarking is a process through which an organization learns the best practices from others, to adapt them to its unique culture and mission [54], or ranks different alternatives among which a choice must be made (e.g., market targeting [55,56]). Introduced in business management studies in the 1980s, to date, benchmarking methods have been applied to tourism destinations primarily for practical use and competitive gap analysis [57]. However, such methods can be helpful not only in competitive frameworks but also in cooperative environments because they allow for relative strengths and weaknesses to be identified and the best practices to emerge to be adapted in other lands in a mutual learning experience [10].
Learning through benchmarking is even more important in transnational cooperation for development, where different languages, values, and cultures represent barriers to communication and to the definition of common objectives and strategies [58,59]. Moreover, cross-border differences in economic, productive, administrative, and taxation systems can feed competition rather than collaboration [60], hindering coordination at the institutional level precisely because of the lack of reciprocal knowledge of transnational partners [58,61]. Thus, for the success of cross-border development projects it is crucial to provide institutional participants with the information they need to understand the specific context of transborder cooperation and to work cohesively in synergia [59].
The tourism literature discusses the benefits and challenges of transborder cooperation from the perspectives of visitors, local governments, or businesses [62]. These benefits include the strengthening of the cross-border regional identity, opportunities for innovation and knowledge transfer processes [9,59], common marketing and communication plans [58], and the joint usage of infrastructures and services (e.g., functional regionalization, see [9]).

3. Materials and Methods

A CI is an arithmetical aggregate of multiple simple indicators (often responses to questionnaire items), each of which is used to evaluate a single dimension of the multidimensional construct that the CI is aimed at measuring [63]. Except for destination competitiveness studies, CIs are very rarely employed in the tourism literature, although they have been widely recognized as helpful tools in tourism planning and management [64]. Various classifications of CIs exist. It is particularly common to distinguish between compensatory and non-compensatory CIs [65]. For compensatory indices, high values of some simple indicators balance the low values of others. For example, if an index has four components, taking the values 1, 2, 10, and 9 for one destination and the values 10, 9, 2, and 1 for another destination, using a compensatory function (such as the mean, ordinary least squares, partial least square, or factor analysis), the index value of the two destinations would be the same. When simple indicators survey non-interchangeable dimensions, compensatory CIs tend to yield erroneous results if employed for benchmarking purposes [66].
As the residents’ participation in the planning process (see Equation (1)), willingness to welcome tourists with a proactive attitude (see Equation (2)), and willingness to provide tourist services directly (see Equation (3)) are non-interchangeable forms of community participation that respond to different land use development needs, we propose a non-compensatory index. Besides combining non-interchangeable dimensions correctly, non-compensatory indices have the advantage that they can also be employed for degenerate indicators (those that take the same value for all the respondents), as opposed to methods based on covariance (like structural equation models, ordinary least squares, and factor analysis, where a degenerate indicator implies an infinite correlation). This aspect is particularly important for our index of community participation because we also use response rates as indicators, that, in some destinations under analysis, are equal to 100%.
The construction of our composite index develops in five steps. First, we define simple indicators (survey instruments, see Section 3.1) and survey residents. Afterward, we aggregate individual survey answers at the area level to build the input matrix (see Section 3.2). Then, we compute a weight for each simple indicator (see Section 3.3). Fourth, we apply the chosen aggregation function to the input matrix and weights to obtain the final rank/index value (see Section 3.4). Finally, we perform robustness checks to ensure the index quality (see Section 3.5).

3.1. Survey Instruments

As highlighted by Lawton and Weaver [67], residents’ surveys based on open-ended questions can be valuable to allow for respondents to express their opinion freely about the issues they consider as truly important to the sustainable use of their land an a way that maximizes benefits and minimizes costs. Thus, we included open-ended questions in our survey (numbers 1–7 in Appendix A). Providing open answers requires a higher degree of cognitive effort and more time and involvement by interviewees compared to rating items [68]. On the one hand, the higher degree of commitment by the respondents tends to reduce the response bias, typically observed when many numerical answers are demanded; thus, it is expected to increase the overall quality of the collected answers. On the other hand, the greater endeavor required may reduce response rates and increase the dropout. To turn this drawback into a strength, we suggest considering the response rates to open-ended questions as proxies of the respondents’ participation in the planning of the sustainability-oriented land use change by providing information and suggestions [69].
In practice, this strategy is especially convenient because the open-ended questions, for which response rates are computed, can regard any topic of interest or specific goals. In this case, they are designed to collect information for a prioritized SWOT analysis. However, to the aim for building the community participation index, any type of open-ended question is sound. Thus, using response rates, we obtain two types of information (about the respondents’ engagement and about the topic asked) from a single question.
In addition, the interviewees rated the welcoming attitude and willingness to participate in tourism and tourism-related skills of their community (questions 8–10 in Appendix A). In this way, we can explore the representation of the residents’ own community from within and try to avoid socially desirable response biases [70]. Questions 11 and 12 are aimed at exploring the availabilities of assets, skills, and spare time to be used for offering tourist services on a non-commercial sharing basis.
Finally, we asked for the interviewees’ e-mail addresses, to re-contact them for further cooperation in the EXCOVER project. This last question is crucial because residents leaving us their address show a deep involvement in and a sincere commitment to local tourism development. In fact, the interviewers made them aware that we will follow up with more questions, meetings, and activities if they leave their contact e-mail.

3.2. Destination-Level Synthesis of Unit-Level Data

The first step after the definition of the conceptual model and indicators of community participation, the data collection and preparation consist of synthesizing individual answers into a single value for each land. We suggest adopting different aggregation equations for different types of questions. As explained above, questions 1–7 and 13 are aggregated by computing the corresponding response rates as follows:
A Q k , d = i = 1 N d I Q i , k , d N A N d
where A Q k , d is the response rate to question Q k , k = {1, 2, 3, 4, 5, 6, 7, 13}, in the dth land; N d is the number of interviewees in land d, i = {1, …, N d }; and I Q i , k , d N A is an indicator function, equal to 1 if the answer is valid and 0 if missing.
For questions 8–10 (regarding the respondents’ opinions about their own community’s intentions), we consider the modal value because, unlike the arithmetic mean, it does not compensate low values of some answers with high values of others. Thus, for k = {8, 9, 10}, if f is the relative frequency of the answer given by the ith interviewee,
A Q k , d = Q i , k , d   : f Q i , k , d = m a x f Q i , k , d
Given W, the maximum number of items that respondents declared to be willing to share, for k = {11, 12}, we compute a potential ‘sharing-economy rate’ as the sum of all the items each respondent is willing to share, # ( Q i , k , d ) , divided by the maximum number as follows:
A Q k , d = i = 1 N d # ( Q i , k , d ) W N d  
In the present case, residents are willing to share five types of items: accommodations, knowledge of the territory (to guide tourists around), knowledge of the local traditions (and related skills, to bring about folkloric activities), home restaurants, and car rides and transport, so W = 5. The aggregated values of the indicators for each destination are shown in Table A1 in Appendix B and constitute the input matrix for the construction of the index of the community’s participation.

3.3. Weighting Scheme

The choice of the indicators’ weights is crucial in the construction of composite indices because the index-implied rankings (of local communities, as a function of their participation in tourism development in this case) can change drastically when changing weights [65]. There is no optimal weighing scheme, so analysts must choose the weights that are the most appropriate for the application in question [71].
We employ a weighting scheme that is data driven and justified by the informative needs of cross-border community-based land development projects. Components AQ1–AQ7 and AQ13 (response rates) are weighted by the corresponding non-response rate, computed for the whole sample as follows:
W A Q k , d = d = 1 D i = 1 N d I Q i , k , d = N A N
where D is the number of destinations considered (10 in this case), and N is the overall sample size. We weight destination-level response rates with the overall response rate to the same question because we assume that the higher the non-response rate, the more the respondents strive to answer the question [68] and the more important the response rate is as an indicator of the community’s participation in the initial phase of its land use change.
For the modal assessments of the host community’s attitudes (AQ8–AQ10), we use as a weight the mean difference analog [72], which measures the between-area variability of the modes as follows:
W A Q k , d = 1 d = 1 D 1 j = d + 1 D | f d f j | N ( D 1 )
This weighting choice is based on the assumption that the more the modal values differ, the more valuable they are (e.g., if all the local communities are equally skillful, AQ10 has little discriminatory power and vice versa).
Potential ‘sharing-economy rates’ (AQ11 and AQ12) are weighted by the overall ‘non-sharing rate’, according to the same rationale underpinning weights for AQ1–AQ7 and AQ13 as follows:
W A Q k , d = 1 d = 1 D i = 1 N d # ( Q i , k , d ) 5 N  
The underlying assumption is that the lower the overall availability to share unused assets, the more valuable both the ‘sharing attitude’ of the local community and the potential of the territory to enrich the tourism supply become, where high levels of AQ11 and AQ12 are recorded. To make the weights of each component of our CI sum to 1, we divide each W A Q k , d value by the sum of the weights.

3.4. Aggregation Function

As there is no absolutely optimal weighting scheme, no aggregation function is free from criticism, as each has pros and cons [65]. Among non-compensatory aggregation functions, ELECTRE and PROMETHEE have long attracted operational researchers’ interest, who have elaborated various versions of these algorithms. The more recent the version, the more complex the features of the phenomenon it can handle. We employ ELECTRE III [73] because it has been shown to outperform the other multi-criteria decision-making approaches when data are characterized by a high degree of uncertainty [25,26].
The chosen approach provides for setting three thresholds for each simple indicator. The indifference threshold (q) is the maximum difference in an index component’s values between two communities, which allows for us to classify their participations, regarding the measured dimension, at the same level. The preference threshold (π) is the minimum difference in an indicator’s values that leads us to consider one community as more participative than the other to which it is being compared. The veto threshold (v) assigns the uttermost importance to one or more index components (AQ*) and ranks the overall participation of a community higher than that of another, even if the second outperforms the former with respect to all the attributes, except for those for which v is defined. Then, π ≤ q ≤ v. It is worthy to note that the willingness to leave a contact e-mail depends mostly on the identity of the local community, including education, traditional culture, economic situation, worldview.
By applying ELECTRE III, the values of each index component (p) undergo pairwise comparisons (between two lands at a time). The result of the comparison is represented by a concordance index, c k d ,   j , as follows:
c k d ,   j = 1 i f   p k d p k j q j ( p k d ) 0 i f   p k d + π j ( p k d ) p k j p k d p k j + π j ( p k d ) π j p k d q j ( p k d ) o t h e r w i s e
So, if the kth indicator level in land d is not less than that for land j, c k d ,   j = 1; if it is not greater than that for land j, c k d ,   j = 0; otherwise, c k d ,   j ∈ ]0, 1[. However, because of the veto threshold, if p k d > p k j + v , the overall concordance index, C (d, j), = 1 independently of the c k d ,   j values for the non-veto attributes; whereas, in general, C (d, j) is the weighted mean of the c k d ,   j values (averaged over all the attributes/indicators). So, the overall concordance index also takes values between 0 and 1.
The prevalence of the veto attribute(s) in case   p k j p k d + q j ( p k d ) is considered in the overall discordance index, Z (d, j). It also takes values between 0 and 1 and is the weighted mean of single indicators’ discordance indices’ z k d ,   j values as follows:
z k d ,   j = 0 i f   p k j p k d + π j ( p k d ) 1 i f   p k j p k d + v j ( p k d ) p k j p k d π j ( p k d ) v j p k d π j ( p k d ) o t h e r w i s e
z k d ,   j is 1 if area j does not outperform land d (with reference to the kth indicator); it is zero in the opposite situation, provided that the difference is greater than the veto threshold; it is between the two extremes otherwise.
The quantities resulting from pairwise comparisons of each simple indicator’s values are used to calculate the degrees of credibility, B d ,   j , of the implied rankings as follows:
B d ,   j = C ( d ,   j ) z k d , j > c k d , j 1 z k d , j 1 C ( d ,   j )
The B d ,   j values are also compared between each pair of communities twice. From these further comparisons, D 2 D values are sorted first in decreasing order (first pre-order) and then in ascending order (second pre-order). The outranking credibility, B d ,   j , of the first land in each pre-order works as the reference for the others: λI,1 m a x { B d ,   j     d , j } in the first pre-order and λII,1 m i n { B d ,   j     d , j } in the second. The other lands are then sorted based on a comparison of their outranking credibility values. For destination d to be placed after j, B d ,   j must be higher (narrower in the second pre-order) than the discrimination threshold (λI,1 for the first pre-order and λII,1 for the second, where r = 2, …, D). Both thresholds are related to the credibility value by a linear function as follows:
λr = α + β λr−1
If B d ,   j > λr−1 and B d ,   j B j ,   d > B ( λr), d is assigned a rating of +1 and j of −1 because the overall community participation of d is greater than that of j. The final ranking is defined by the sum of these ratings [26]. The latter conveys the same information as the final ranks, and they can be interchangeably taken as the composite index values characterizing each land in terms of community participation to sustainable tourism development.

3.5. Robustness Check

Testing the robustness of a composite index constitutes an important ‘quality assurance’ [65,74]. Thus, we carry out uncertainty and sensitivity analyses. The former examines changes in the final ranking caused by variations in the index’s construction methodology, e.g., by considering different sets of indicators, weights, and aggregation functions. However, the sensitivity analysis quantifies the proportion of the overall variance because of each of the mentioned methodological choices. We compared the results obtained by applying the methodology described in Section 3.1, Section 3.2, Section 3.3 and Section 3.4 with those yielded by all the possible combinations of the following methods:
  • as weighting systems: correlation based (COR), principal component based (PCA), and data envelopment analysis based (DEA), along with our ad hoc weights (W);
  • as aggregation functions: arithmetic-weighted average (compensatory), geometric-weighted average (that compensates less for lower values of indicators), and PROMETHEE II (non-compensatory), along with ELECTRE III.
Overall, rankings based on 208 different indices are compared, as we build them using both the whole set of indicators (four aggregation functions, each applied with each one of the four weighting schemes = 16 indices) and subsets obtained by leaving one component out at a time, except for the veto indicator (four aggregation functions, each applied with each one of the four weighting schemes for 12 sets of indicators = 192 indices).
For this comparison, we have chosen very different methodological options, with diverse degrees of complexity and consistency with the practical task at stake, to assess the sensitivity of the results to each option. A low sensitivity would imply that simpler methods should be employed, while a high sensitivity would indicate the necessity for using more complex non-compensatory methods. To make the results comparable, we set the PROMETHEE II thresholds equivalent to the ELECTRE III ones. Because the other aggregation functions (geometric and arithmetic means) do not allow for a veto threshold to be set, we adjust the weights to simulate it by adding the maximum value of the weights to that of the veto indicator (AQ13) and re-normalizing. Because the correlations and principal components can be negative, we transform them by adding the maximum to all the values before increasing the AQ13 weight and normalizing.
We perform the uncertainty analysis by computing the median and average shifts in the rank of each land. Then, we decompose the total variance of the ranking in the partial variance because of the choices of the indicators, weights, weighting functions, and their interactions (backward decomposition) through three-way ANOVA. In this way, we check how sensitive the index of the community’s participation is to each one [75]. Because we compare non-compensative functions with compensative ones, as well as weights obtained parametrically and non-parametrically, we expect quite a large variance. As a last sensitivity test, we run a two-way ANOVA to identify the indicators providing the greatest contribution to discriminate the level of the local communities’ participation (i.e., the one with the largest influence on the final ranks). We recalculate our index of the residents’ participation by leaving out 1, 2, 3, 4, or 5 indicators at a time (except for the threshold indicator) for all 1583 possible combinations to check the sensitivity of the lands’ ranking to each component.

3.6. Data

We apply the proposed index to analyze the communities’ participation in ten small lands involved in EXCOVER, a European Regional Development Fund (ERDF) project. The ten lands, three from Croatia and seven from Italy, have established a cross-border partnership because they have in common the fact that they are practically unknown, not only at a global scale but also in the national tourist market, despite being endowed with valuable natural and cultural heritages. These ten territories also share the absence of public and private investments that would be needed for local regeneration. They are all affected by marginality, depopulation, and a lack of economic opportunities and strive to protect the natural environment and the local identity. Thus, their cooperation proposal (i.e., the EXCOVER project) was selected for funding by the ERDF because developing sustainable tourism through a cross-border process was assessed by the Commission as the most feasible solution to attain both economic growth and sustainability. During project meetings, EXCOVER partners and tourism development experts asked us to benchmark the communities’ participation levels in each area, compared to those of all the others, for a meaningful interpretation of the survey results [64]. In fact, the project realization depends on the possibility to leverage the communities’ participation for building sustainable tourism supplies.
The data were collected through 1010 face-to-face interviews conducted by local experts who know the area and are trusted by the local community. This latter aspect is important because we relied on availability sampling [76], as commonly happens in this kind of survey, and the residents are more willing to answer if interviewed by familiar local people. Destination managers and interviewers jointly identified the places of the greatest tourist interest and the times of the largest turnover to maximize the number of interviews and, consequently, of responses. According to the availability sampling’s design, the interviewers submitted the questionnaire to all the non-residents found at the chosen times and locations. After a brief presentation of the project and of the survey purpose, each interviewee decided whether to answer or not. A total of 879 valid questionnaires were returned.

4. Results

4.1. Data Description

Table 1 shows the sample size and composition for each land. The former is proportional to the dimension of the local population in the most recent year for which the information at the Local Administrative Unit (LAU2) level is available.
The young age class (15–34) is slightly over-represented because we are especially interested in involving young residents in developing the local tourism economy. The extant literature has shown that the youth tend to show lower community participation levels [37]. Nonetheless, we expect young residents to be more proficient and familiar with digital technologies and more open to innovation and cultural exchange.

4.2. Participation-Index-Based Rankings

The lands’ rankings resulting from the application of the proposed index are shown in Table 2. Gospić shows the greatest level of community participation, mainly thanks to the exceptional rate of respondents who left their e-mail address to be re-contacted. Considering the relevant literature [13,14], this evidence can be explained by the higher public awareness of the economic benefits deriving from tourism-related land use compared to the other Croatian destinations considered. In fact, Gospić has already experienced some positive outcomes from tourism development, which has been recognized by public opinion as a crucial driver of the Croatian economy after the 1991–1995 war [77]. The current level of tourist demand in Gospić is supported mainly by its natural heritage. Thus, residents know that a tourism supply can be created in full compliance with environmental sustainability, which is an important motivation of community participation [48,49].
At the other end of the spectrum, Karlovac and Čavle lie at the bottom of the rankings. Residents lack confidence in the possibility for small territories in the hinterland, like theirs, to attract visitors, given their peripherality and the current distribution of tourist flows in Croatia. The latter is dominated by beach tourism, as reported by local destination managers and suggested by the literature [42,46].
Lands in the Italian region of Emilia Romagna display very heterogeneous ranks. Ostellato is in second place, thanks to a very active destination management agency, established here in 1994, to maintain and develop the lands bathed by the Po River delta. This agency has favored communication and partnerships between the territory’s institutional and private entities, promoted by the local awareness of sustainability-based land uses and good practices for the conservation of the marshy environment and its biodiversity. According to the extant literature, these elements should have great positive influences on community participation [46,47,48,49].
Conversely, residents in the mountainous region of Sasso Simone appear to be the least willing to participate in the development project, while Alfonsine is placed at about the middle of the rankings. The very limited accessibility to Sasso Simone, because of its geographical position, undermines the residents’ confidence in the possibility for significantly increasing tourist inflows, which is likely the main reason for their low involvement [42,46]. Moreover, the lack of infrastructure and public services makes this land unattractive to both tourists and natives alike (hence depopulation). According to local policymakers, the Sasso Simone community (different from those in Ostellato and in the very close Alfonsine region) fears that a land use change oriented toward tourism will divert funds from much-needed welfare investments. This evidence expands the finding by some extant literature that satisfaction with social welfare and related amenities increases civic engagement [29,78].
Ovaro, Paularo, Prato Carnico, and Rive d’Arcano all belong to a mountainous region in Friuli Venezia Giulia. Their ranks are close together (except for the presence of Alfonsine, in fourth place) in mid-positions that can be explained by the interplay of at least two opposing forces. On the one hand, these mountain communities are quite resistant to change and fear an ‘invasion of visitors’ that would disrupt their local culture and traditional lifestyle, to which they are strongly attached. This type of conservative nature has already been shown to hinder community participation in tourism development [42]. On the other hand, two local destination management agencies have worked hard to increase public awareness of the benefits of a sustainable tourism that prioritizes environmental protection. The belief that changing land use to attract tourists is possible without damaging the environmental quality exerts a positive effect on residents’ participation, as pointed out by the literature [45,47,48,49]. The proximity of the ranks of areas with a common landscape, geography, history, and traditions may be interpreted as indirect confirmation of the validity of our measurement approach.

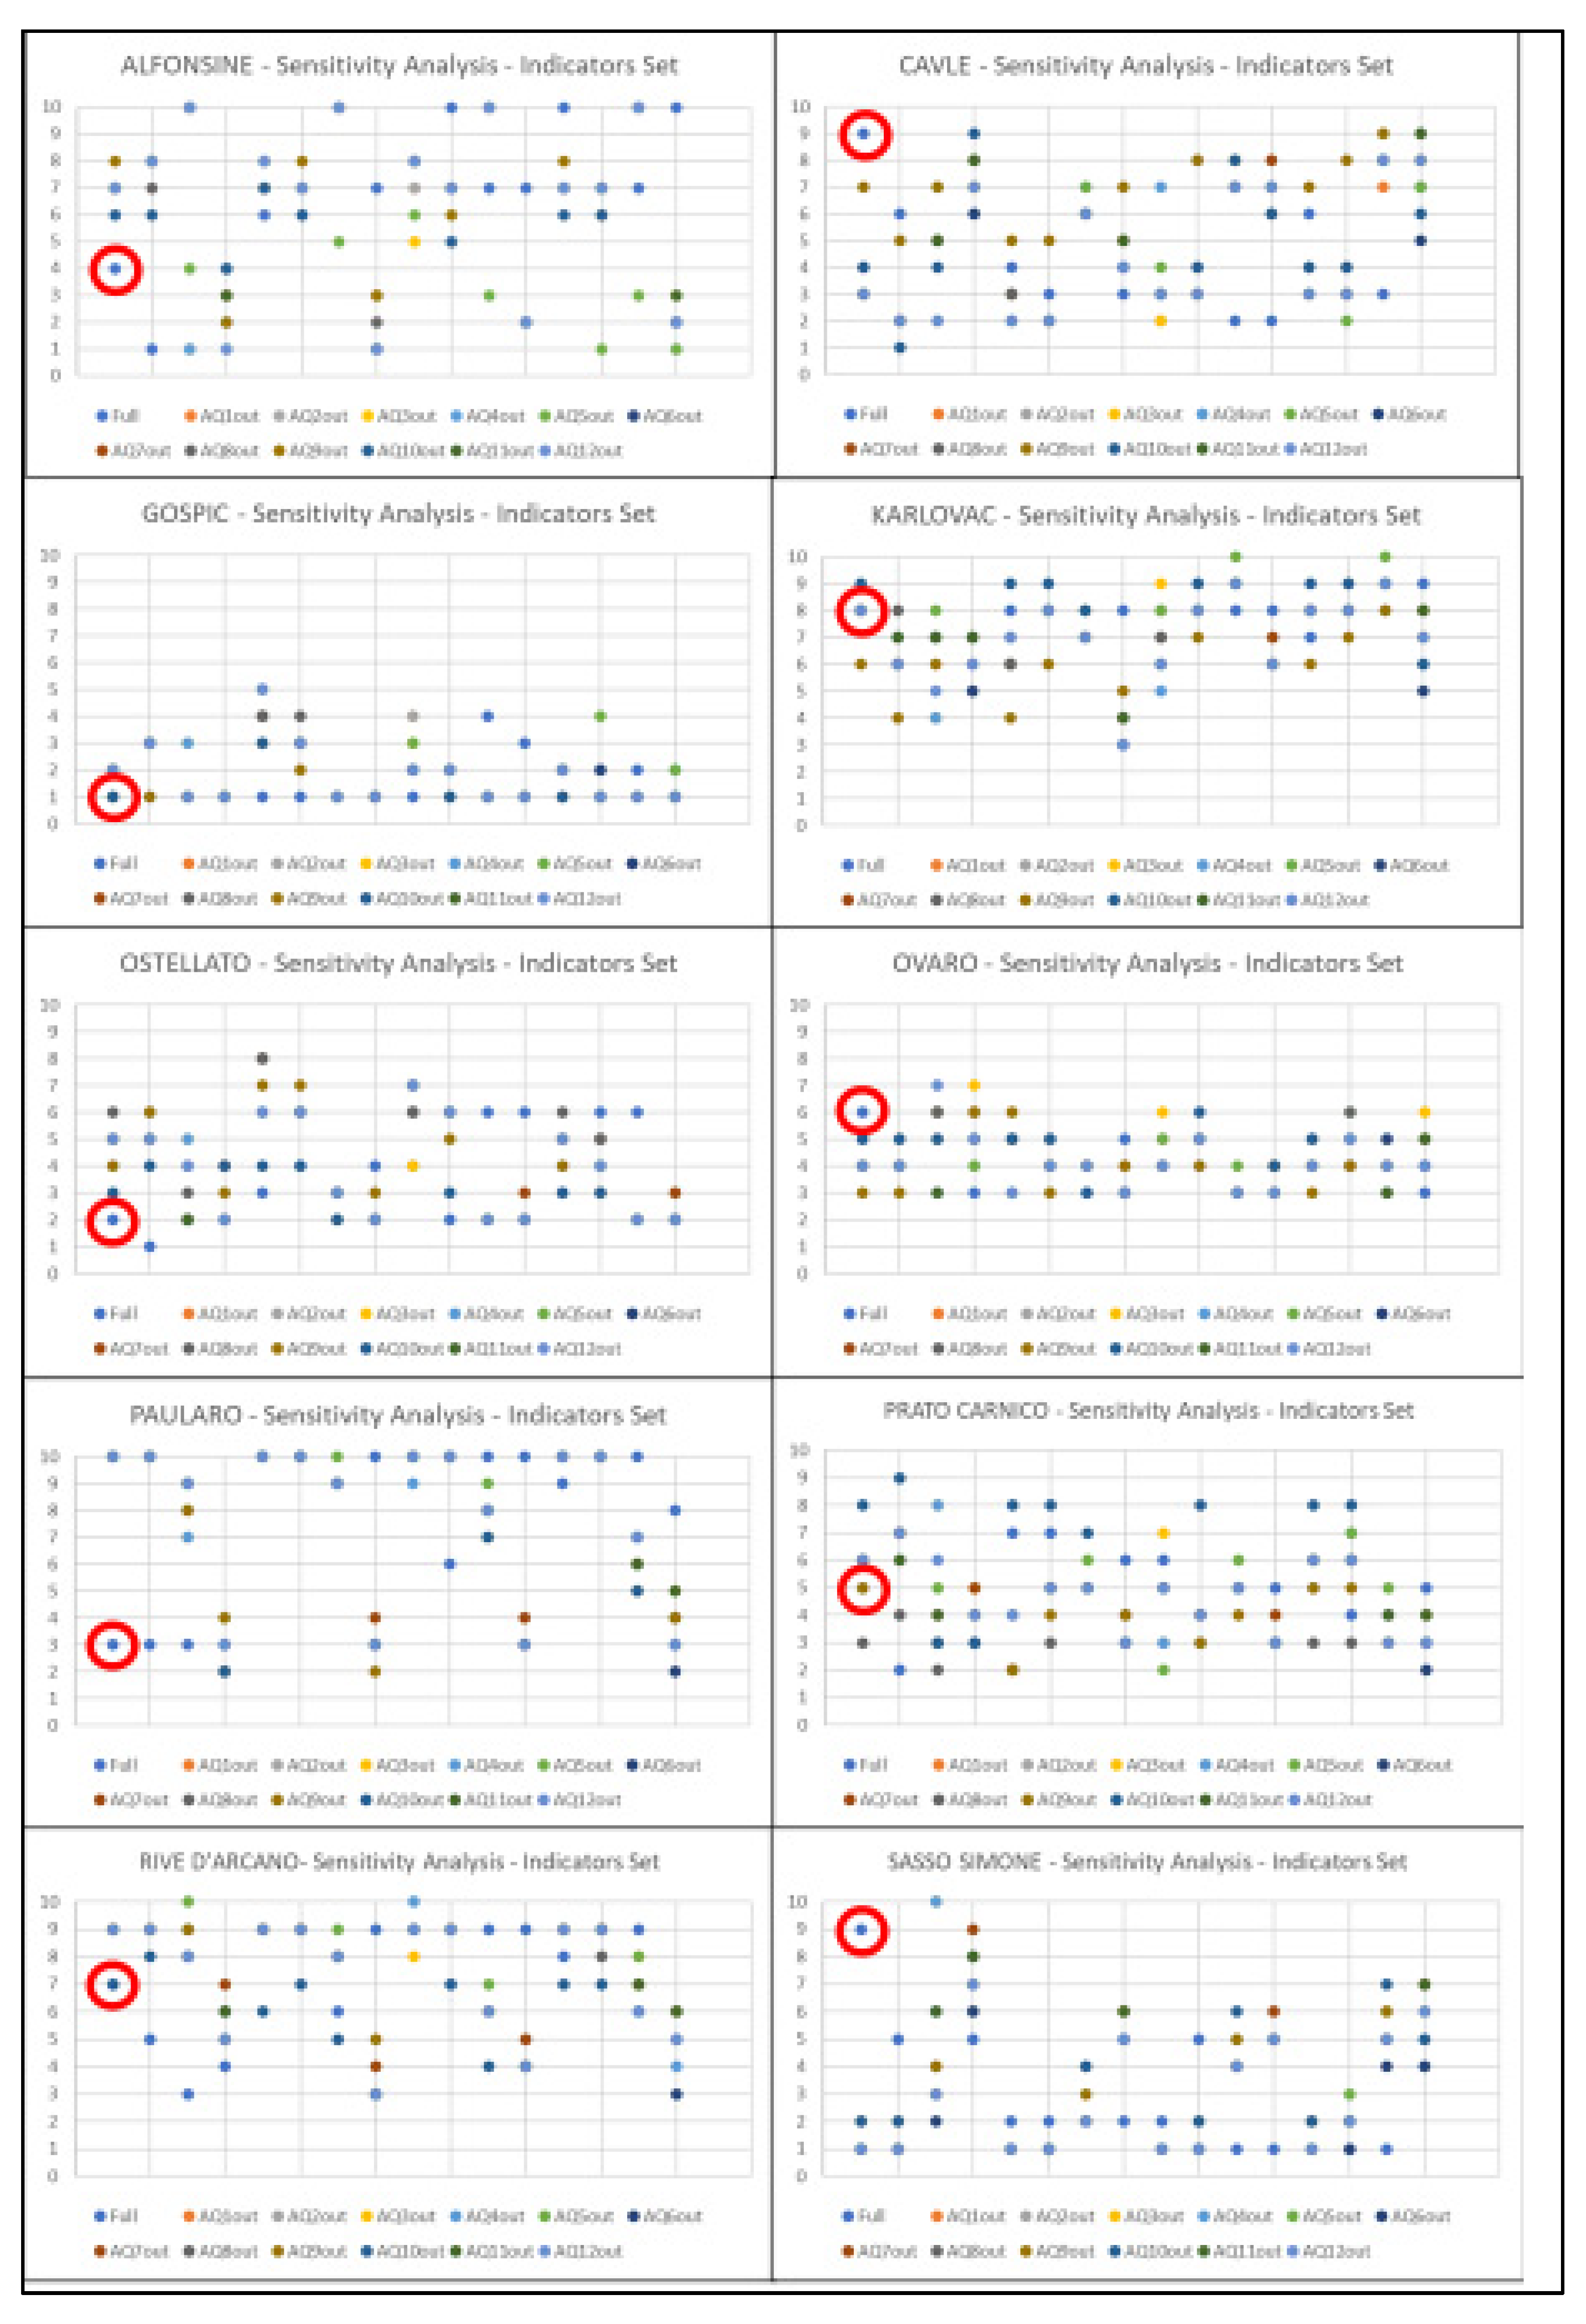
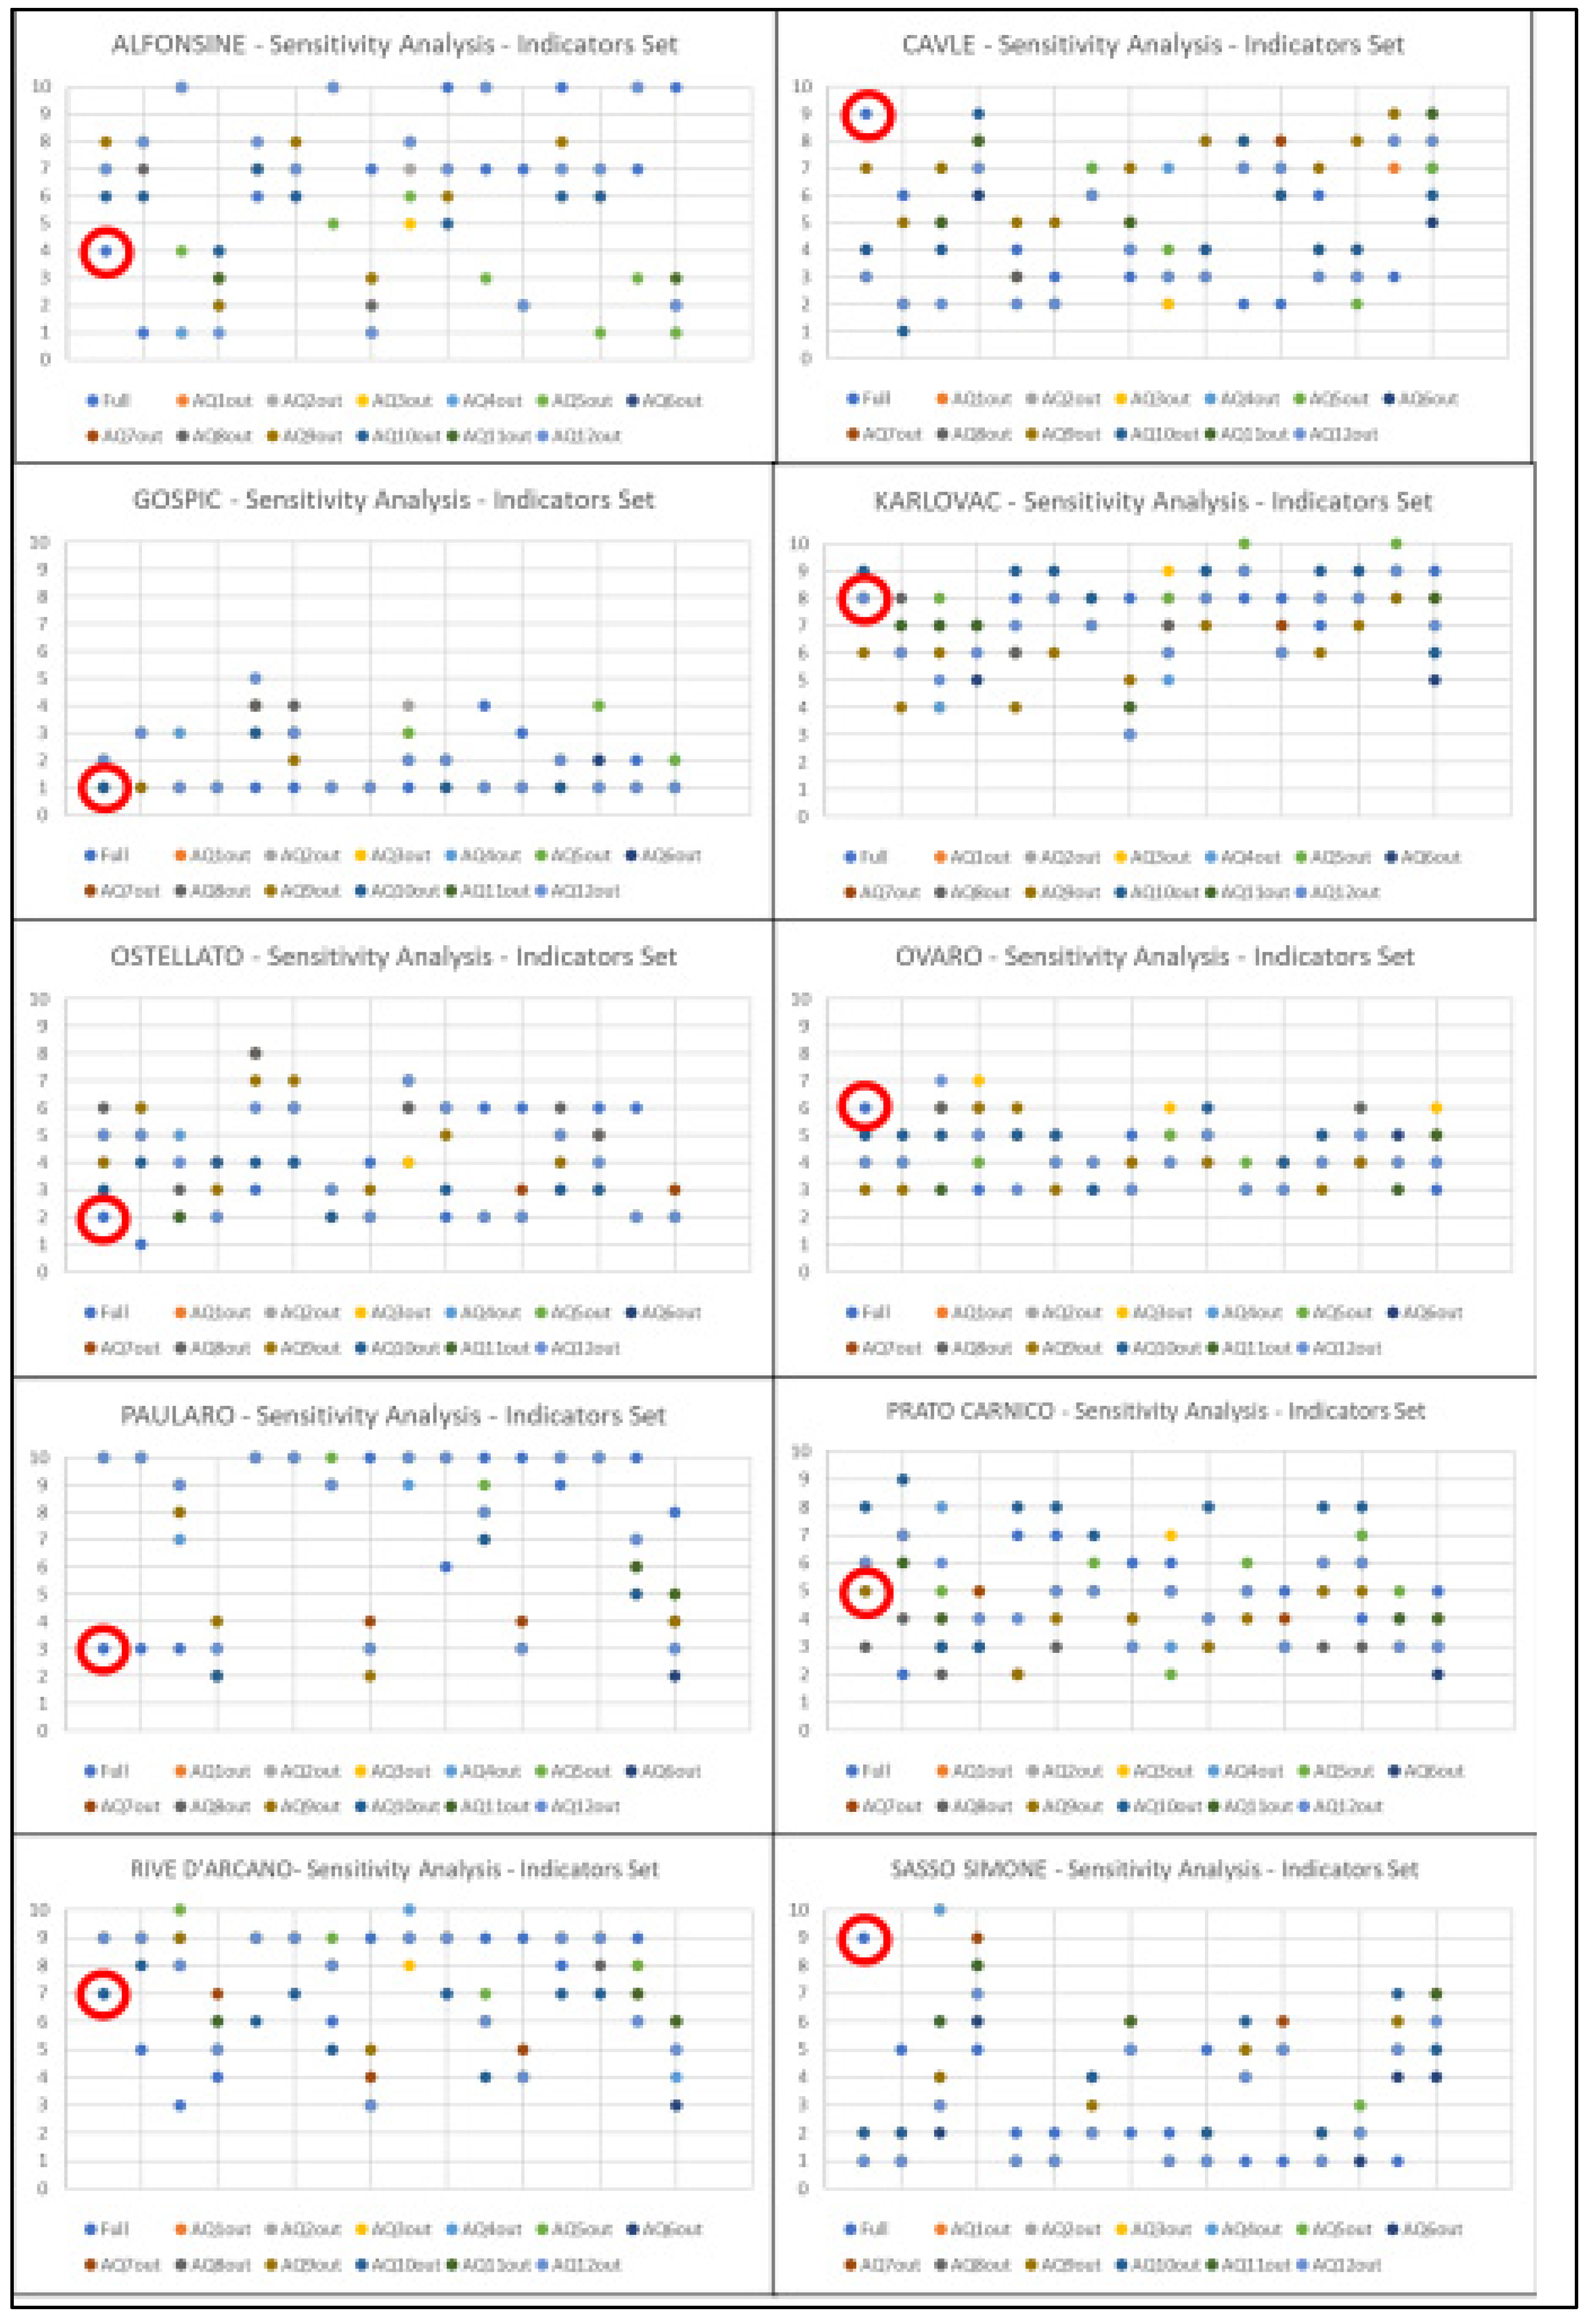
4.3. Robustness Assessment

Turning to our robustness checks, the results of the uncertainty analyses are shown in Table 3 and Table A1 and in Appendix C. The obtained rankings are stable within sets of indices computed with non-compensatory functions, while they tend to vary substantially between compensatory and non-compensatory indices. In fact, lands’ ranks remain constant across more than half of the indices examined, as displayed by the median rank shifts, except in Alfonsine, which, however, has a median difference of only one position.
On average, ranks change by fewer than two points by varying the methodological choices in the construction of the indices. Therefore, the relatively large distance between the average rank and the rank obtained with our CI is because of the heavy influence of extreme values on the average rank in the compensatory indices. In particular, the use of the geometric mean as an aggregation function always places Alfonsine at the bottom of the rankings because there, AQ5 is 0. None of the interviewees from this land was able to identify socio-economic factors or tourism trends that could hinder tourism development there. This evidence could indicate a lack of awareness, education, or training in both the general tourism system and the local potential to develop it, which can hinder participation [13,14]. Yet, it would be misleading to consider this evidence as a deciding factor, as the locals in Alfonsine reach high levels of other index components, including high response rates to other questions.
Overall, this uncertainty analysis highlights the importance for choosing an aggregation function appropriate for the context of the study, as also confirmed by the sensitivity analysis shown in Table 4 and in Figure A2 and Figure A3 in Appendix C. Specifically, simpler methods would not be preferrable to more complex ones when index components are inherently non-compensatory.
Most of the variability in communities’ ranks is because of the difference in the aggregation functions (see Figure A2 and Figure A3 in Appendix C) and, to a lesser extent, the interaction between the latter and the weighting scheme. The exception of Ovaro is explained by the intermediate position of its community participation level, leading no aggregation function to assume extreme values, so it has the lowest variance. This is mainly because of the aggregation–weight interaction, accounting for the manipulation of the latter to represent a veto threshold. The rankings’ sensitivity to the set of indicators employed is the minimum, likely thanks to the relatively high number of index components employed [65]. Overall, considering that we compared the rankings yielded by our index with those produced using extremely different functions and weighting systems, we deem our results to be quite robust.
The analysis of the variance because of the indicators is displayed in Table 5 (we omit the interactions as most are not significant). The ‘host community’s sharing rate’ (AQ11, as described in Equation (3)) appears, by far, to be the most important index component in determining a destination’s rank. This finding confirms that the proposed method is consistent with the information needs of low-budget tourism development projects. In fact, the main element that differentiates the lands under investigation is the availabilities of residents’ unused assets, skills, and knowledge, which are ready to be placed on sharing-economy platforms (confirming the spatial heterogeneity present this sector, see [79]).
The second-greatest contribution to lands’ rankings is made by the level of the residents’ tourism-related skills (AQ10), which are fundamental for sustainability-oriented development [13,14]. The community’s willingness to participate in the local tourism (AQ9), as assessed by the respondents, is the indicator with the next-highest discrimination power. AQ9 might seem to be the best way to measure community participation, as it asks directly and explicitly about the construct of interest, though it turns out to be less important than the preceding two items. This finding suggests that the actual tourism development potential, in terms of material assets and skills available, is, indeed, more decisive than the abstract willingness to participate and confirms the importance for measuring all such aspects.
Furthermore, the fact that the higher the variance of an indicator (between lands) the higher its contribution to the rankings’ variance, along with the previous results, indicates that the host communities’ self-representations differ greatly between territories (as noted in the recent literature, e.g., [80]). This, in addition to objective differences in the willingness to be involved in sharing-economy-based transactions, development initiatives, and positive interactions with tourists, could also reflect different tendencies of the respondents to over/underestimate the characteristics of their fellow citizens. The non-significant F-value of the ‘personal sharing rate’ (AQ12) might confirm the influence of such tendencies.
AQ6 (derived from the open-ended question regarding socio-economic factors and tourism trends that could help the local tourism development) is the most important response rate in determining the local communities’ ranking, followed by AQ2 (computed for the question about the reasons why respondents would not choose their own town for a trip if they did not live there) and AQ7 (from the question concerning the priority for developing tourism). These findings suggest that it is difficult for residents (in lower-ranking lands) to imagine a tourism-oriented land use change and to assess the effects of modifications of the tourist market and the macroeconomic scenario on their territory, which is still quite isolated and pristine. The lack of knowledge and skepticism toward the possibility for developing tourism, also because of the sites’ peripherality, can be major obstacles to community participation [14,42,46,78].

5. Discussion

In this work, we have developed a composite index (CI) to benchmark different local communities’ participation in tourism development processes brought about through cross-border partnerships The results of the illustrative empirical application in an international setting bring some useful contributions to the research practice. First, we showed the importance for choosing an aggregation function appropriate for the study’s context. Functions that weigh extreme values more than proportionally (like geometric ones) penalize destinations with extremely low values, even in only one component and even if the latter was not considered as decisive by the research designer. The effect of such functions can even be greater than that of weighting and, together with their interaction, severely affect the results.
After the COVID-19 pandemic, in preparing for the next pandemic, the audience potentially interested in the proposed method might be increasing. Policymakers should find our index as a very relevant and useful tool for tourism recovery and innovation planning, including compliance with measures to prevent the spread of infections. Our tool can measure the extent to which they can rely on increased entrepreneurial involvement by residents to integrate and adjust the local supply with sharing-economy-based solutions. The sharing economy allows for land use planners to base the future territorial development on products and services that can realistically be provided and sustained by the local community itself over the long term.
More importantly, destination managers may have to deal with the fear of other pathogens spreading, which could jeopardize the host community’s willingness to participate and provide hospitality. The residents’ availability to participate in development projects and to share their own resources and, above all, their spaces with tourists might fluctuate with their perceptions of the danger from infectious agents. In our opinion, this makes it necessary to periodically monitor the dynamics of community participation for helping decision makers to manage pandemic risks and pay respect to the host community’s feelings. This should allow for policymakers to avoid unpleasant resident–tourist interactions, which could compromise visitors’ satisfaction and the destination′s reputation. Informative tools, like our CI, are useful in the suggested monitoring process if periodically updated with new survey data. The latter should be collected frequently enough to track the evolution of pandemic risks by tracking community participation levels over time.
As emphasized by Hoskins and Mascherini [74], in general, a CI is never a goal on its own but a starting point for boosting a discussion. Within the EXCOVER project, the proposed index has, indeed, sparked a fruitful discussion, between the representatives of the communities involved and policymakers, about how to benefit from the recorded levels of participation and improve them. Thus, our CI is not a standalone tool. To make the CI-based results actionable and draw useful implications, the meaning of the obtained ranking must be deepened with local stakeholders, decision makers, and destination managers.

6. Conclusions

This study proposed a composite index (CI) to measure residents’ participation in tourism development processes brought about through cross-border partnerships. This informative tool contextualizes relevant information within the cooperation environment by benchmarking and ranking the participation levels of different host communities through a single number that is easily interpreted by policymakers. Therefore, it is especially useful in cross-border development projects, where a wide reciprocal knowledge of all the international partners involved is essential to devise common objectives and strategies. This makes our work a useful contribution to land use change research and practice.
To the best of our knowledge, the construction of a CI is new in the community participation literature about tourism development, although CIs are widely acknowledged as useful tools in tourism planning and management [64]. Similarly, numerous benchmarking studies have been conducted to assess destination competitiveness [10], but none (to the best of our knowledge) compare residents’ participation levels. Therefore, this paper presents an innovative implementation of the CI methodology, which has an ever-widening scope of application in the growing number of cross-border cooperation initiatives focused on sustainable development [9].
When land use changes cannot rely on sufficient funds to build needed facilities, a local community ready to integrate the land’s endowment with their own assets and initiatives is crucial. Therefore, to construct our CI, we developed a few specific indicators to investigate (1) the residents’ representation of the welcoming attitude and willingness to participate of their own community and (2) their availability to provide new services through sharing-economy platforms. A very convenient innovation of our method consists of including response rates to open-ended questions among the index components. Such questions can relate to any topic of interest or to any specific goal. Using response rates, two types of information (regarding the respondents’ engagement and about the specific topic) are obtained from a single answer, with no need to lengthen an existing questionnaire. To the best of our knowledge, this is the first application of response rates as an indicator of residents’ engagement in the planning process.
On the one hand, non-compensatory CIs are essential when dealing with multidimensional phenomena, where the high performance of one dimension cannot compensate, in practice, for the underperformance of another. On the other hand, the scope of non-compensatory aggregation algorithms is restricted for ranking and benchmarking, as opposed to that of compensatory functions. The latter allows for us to investigate the relationships between the index components, but they cannot be employed for benchmarking in the presence of area-level degenerate distributions of survey responses, as in our empirical setting. The main limitations of this study are that the propounded CI cannot be employed to model the causal relations of the participation with other relevant constructs, contribute to theory, or develop new conceptualizations. Thus, we call for further research to accomplish these tasks, employing appropriate indicators, even the ones proposed in this paper. For example, as we found that an important element of the differentiation between the considered lands is the self-representation of the residents’ own communities’ characteristics, exploring the determinants and truthfulness of such self-representations could bring valuable insights. Moreover, as the statistical units under analysis are communities (not individual citizens), our method sheds no light on the psychological mechanisms that drive residents’ participation. Future research in this direction would make interesting contributions to our understanding of this construct, especially if brought about within a comparative framework able to detect possible factors related to regional cultural specificities.
With reference to empirical applications, we considered just ten lands; thus, our findings cannot be generalized, and the stability of the results may be overestimated. Future research might consider larger sets of areas as well as other aggregation functions and weighting systems. A further limitation of this work consists of the availability sampling employed. Although we initially devised a stratified design, determining the target sample size through Cochran’s formula [81], non-responses forced interviewers to fall back on availability sampling. In this way, we could not compute design weights to remove self-selection and non-response biases from the collected survey data. Finally, given that many countries have applied discriminatory policies toward inbound travelers based on the severity of the COVID-19 pandemic in their home region and might enforce similar measures in the future, the medium-term consequences of such policies for the residents’ support for tourism and destination market shares constitute interesting topics for future studies.

Author Contributions

Conceptualization, A.G.; methodology, A.S.; software, A.S.; validation, S.B. and A.S.; formal analysis, A.S.; investigation, A.G. and A.S.; resources, A.G.; data curation, A.S.; writing—original draft preparation, A.S.; writing—review and editing, A.G. and S.B.; visualization, A.S.; supervision, S.B.; project administration, A.G.; funding acquisition, A.G. All authors have read and agreed to the published version of the manuscript.

Funding

This research was funded by the European Regional Development Fund, grant number Rep. 10 Prot. n.52.

Data Availability Statement

The data are available upon request to the corresponding author.

Acknowledgments

We thank EXCOVER partners, involved policymakers, interviewers, and destination managers.

Conflicts of Interest

The authors declare no conflicts of interest. The funders had no role in the design of the study; in the collection, analyses, or interpretation of the data; in the writing of the manuscript; or in the decision to publish the results.

Appendix A

Survey Questionnaire

  • Imagine that you live in another place and you are considering this town as a possible destination of a trip that you are planning. Why would you choose this town for your trip?
  • Again, imagine that you live in another place and you are considering this town as a possible destination of a trip that you are planning. Why would you NOT choose this town for your trip?
  • Which political, environmental, legal, or infrastructural aspects could HINDER the tourism development of your town?
  • Which political, environmental, legal, or infrastructural aspects could HELP the tourism development of your town?
  • Which Socio-economic factors and tourism trends could HINDER the tourism development of your town?
  • Which Socio-economic factors and tourism trends could HELP the tourism development of your town?
  • If you were to decide, what would you do first of all to promote tourism development in your town?
Express your level of agreement with the following statements (from 1 = ‘strongly disagree’ to 7 = ‘strongly agree’):
8.
Tourists and people with different cultures are welcomed by my local community.
9.
The local community is willing to participate in the local tourism development.
10.
Local inhabitants have high-level tourism-related skills.
11.
Maybe you have heard about the sharing economy. It means sharing something of your own with another person temporarily in exchange for some money through the web. In your opinion, what may your fellow villagers be willing to share?
12.
Are you willing to share something of your own?
13.
Would you agree to be contacted in the near future to provide further information about your town in the context of this development project? (If so, could you please leave me your e-mail address?)

Appendix B

Table A1. Input matrix.
DestAQ1 (Resp.Rate)AQ2 (Resp.Rate)AQ3 (Resp.Rate)AQ4 (Resp.Rate)AQ5 (Resp.Rate)AQ6 (Resp.Rate)AQ7 (Resp.Rate)AQ8 (Mode)AQ9 (Mode)AQ10 (Mode)AQ11 (ShareRate)AQ12 (ShareRate)AQ13 (Resp.Rate)
Alfonsine99%95%98%53%0%96%98%65226%18%29%
Cavle63%61%60%49%60%50%63%77328%10%12%
Gospic98%98%98%87%98%83%97%75353%28%65%
Karlovac65%64%63%50%63%47%62%74332%10%12%
Ostellato100%96%93%60%17%95%99%75219%17%33%
Ovaro73%64%100%94%11%81%89%75311%21%23%
Paularo90%90%99%92%47%61%92%52136%11%14%
Prato Carnico100%75%99%100%16%71%99%55420%22%16%
Rive d’Arcano94%83%85%41%59%31%89%65129%6%19%
SassoSimone96%69%86%62%14%17%87%77544%13%17%

Appendix C

Uncertainty Analysis Figures

In the figures below, the bullet circled in red is the rank obtained by the destination at stake from our participation index, built as described in Section 3.1, Section 3.2, Section 3.3 and Section 3.4, while the other bullets are the ranks obtained by the same destination from the indices resulting from different methodological choices, as explained in Section 3.5. Thus, the more bullets aligned in the same row as the bullet circled in red, the lower the uncertainty of the ranking because of the differences in the construction of the indices.
Figure A1. Uncertainty analysis of the rankings yielded by different methodological choices, leaving one index component out at a time, except for the veto indicator. Data source: EXCOVER project, elaboration by the authors.
Land 13 01519 g0a1
In the figures below, the bullet circled in red is the rank obtained by the destination at stake from our participation index, built as described in Section 3.1, Section 3.2, Section 3.3 and Section 3.4, while the other bullets are the ranks obtained by the same destination from the indices resulting from different methodological choices, as explained in Section 3.5. Thus, the more bullets aligned in the same row as the bullet circled in red, the lower the sensitivity of the ranking because of the differences in the weighting schemes employed in the construction of the indices.
Figure A2. Sensitivity analysis of the rankings yielded by different weighting schemes. Data source: EXCOVER project, elaboration by the authors.
Land 13 01519 g0a2
In the figure below, the bullet circled in red is the rank obtained by the destination at stake from our participation index, built as described in Section 3.1, Section 3.2, Section 3.3 and Section 3.4, while the other bullets are the ranks obtained by the same destination from the indices resulting from different methodological choices, as explained in Section 3.5. Thus, the more bullets aligned in the same row as the bullet circled in red, the lower the sensitivity of the ranking because of the differences in the aggregation algorithms employed in the construction of the indices.
Figure A3. Sensitivity analysis of the rankings yielded by different aggregation functions. Data source: EXCOVER project, elaboration by the authors.
Land 13 01519 g0a3

References

  1. Mannarini, T.; Fedi, A. Using Quali-Quantitative Indicators for Assessing the Quality of Citizen Participation: A Study on Three Citizen Juries. Soc. Indic. Res. 2018, 139, 473–490. [Google Scholar] [CrossRef]
  2. Radcliff, B.; Shufeldt, G. Direct democracy and subjective well-being: The initiative and life satisfaction in the American States. Soc. Indic. Res. 2016, 128, 1405–1423. [Google Scholar] [CrossRef]
  3. Rondinella, T.; Segre, E.; Zola, D. Participative processes for measuring progress: Deliberation, consultation and the role of civil society. Soc. Indic. Res. 2017, 130, 959–982. [Google Scholar] [CrossRef]
  4. Mannarini, T.; Fedi, A.; Trippetti, S. Public involvement: How to encourage citizen participation. J. Community Appl. Soc. Psychol. 2010, 20, 262–274. [Google Scholar] [CrossRef]
  5. Ahmad, M.S.; Abu Talib, N.B. Analysis of Community Empowerment on Projects Sustainability: Moderating Role of Sense of Community. Soc. Indic. Res. 2016, 129, 1039–1056. [Google Scholar] [CrossRef]
  6. Buckley, R.; Shekari, F.; Mohammadi, Z.; Azizi, F.; Ziaee, M. World Heritage Tourism Triggers Urban-Rural Reverse Migration and Social Change. J. Travel Res. 2020, 59, 559–572. [Google Scholar] [CrossRef]
  7. Cuccaro, N.; Wankowicz, E.; de Falco, S.E. Rural tourism and Albergo Diffuso: A case study for sustainable land-use planning. Land Use Policy 2019, 82, 105–119. [Google Scholar] [CrossRef]
  8. Kertész, A.; Nagy, L.A.; Balázs, B. Effect of land use change on ecosystem services in Lake Balaton Catchment. Land Use Policy 2019, 80, 430–438. [Google Scholar] [CrossRef]
  9. Prokkola, E.-K. Regionalization, Tourism Development and Partnership, The European Union’s North Calotte Sub-programme of INTERREG III A North. Tour. Geogr. 2011, 13, 507–530. [Google Scholar] [CrossRef]
  10. Kozak, M. Destination benchmarking. Ann. Tour. Res. 2002, 29, 497–519. [Google Scholar] [CrossRef]
  11. Yu, S.H. Benchmarking and Performance Evaluation Towards the Sustainable Development of Regions in Taiwan: A Minimum Distance-Based Measure with Undesirable Outputs in Additive DEA. Soc. Indic. Res. 2019, 144, 1323–1348. [Google Scholar] [CrossRef]
  12. Le Gales, P. Regulations and governance in European cities. Int. J. Urban Reg. Res. 1998, 22, 482–506. [Google Scholar] [CrossRef]
  13. Koutra, C.; Edwards, J. Capacity Building through Socially Responsible Tourism Development, A Ghanaian Case Study. J. Travel Res. 2012, 51, 779–792. [Google Scholar] [CrossRef]
  14. Bello, F.G.; Lovelock, B.; Carr, N. Enhancing community participation in tourism planning associated with protected areas in developing countries, Lessons from Malawi. Tour. Hosp. Res. 2018, 18, 309–320. [Google Scholar] [CrossRef]
  15. Suess, C.; Woosnam, K.M.; Erul, E. Stranger-danger? Understanding the moderating effects of children in the household on non-hosting residents’ emotional solidarity with Airbnb visitors, feeling safe, & support for Airbnb. Tour. Manag. 2020, 77, 39–52. [Google Scholar] [CrossRef]
  16. Altinay, L.; Taheri, B. Emerging themes and theories in the sharing economy, a critical note for hospitality and tourism. Int. J. Contemp. Hosp. Manag. 2019, 31, 180–193. [Google Scholar] [CrossRef]
  17. Prebensen, N.K.; Kim, L.H.; Uysal, M. Cocreation as Moderator between the Experience Value and Satisfaction Relationship. J. Travel Res. 2016, 55, 934–945. [Google Scholar] [CrossRef]
  18. Stacchini, A.; Guizzardi, A.; Costa, M. The Value of Sustainable Tourism Destinations in the Eyes of Visitors. Highlights Sustain. 2022, 1, 202–223. [Google Scholar] [CrossRef]
  19. Prebensen, N.K.; Xie, J. Efficacy of co-creation and mastering on perceived value and satisfaction in tourists’ consumption. Tour. Manag. 2017, 60, 166–176. [Google Scholar] [CrossRef]
  20. Agyeiwaah, E.; Adongo, R.; Dimache, A.; Wondirad, A. Make a customer, not a sale: Tourist satisfaction in Hong Kong. Tour. Manag. 2016, 57, 68–79. [Google Scholar] [CrossRef]
  21. Shaheen, S.; Cohen, A. Shared mobility: Definitions, industry developments, and early understanding. In Innovative Mobility Research, TSRC; University of California: Berkeley, CA, USA, 2016; Available online: https://innovativemobility.org/wp-contwelvet/uploads/2015/11/SharedMobility_WhitePaper_FINAL.pdf (accessed on 15 September 2024).
  22. Firnkorn, J.; Muller, M. Free-floating electric carsharing-fleets in smart cities: The dawning of a post-private car era in urban environments? Environ. Sci. Policy 2015, 45, 30–40. [Google Scholar] [CrossRef]
  23. Zhang, Z.; Zhang, N. A Novel Development Scheme of Mobility as a Service: Can It Provide a Sustainable Environment for China? Sustainability 2021, 13, 4233. [Google Scholar] [CrossRef]
  24. Szymańska, E.; Panfiluk, E.; Kiryluk, H. Innovative Solutions for the Development of Sustainable Transport and Improvement of the Tourist Accessibility of Peripheral Areas: The Case of the Białowieża Forest Region. Sustainability 2021, 13, 2381. [Google Scholar] [CrossRef]
  25. Salminen, P.; Hokkanen, J.; Lahdelma, R. Comparing multicriteria methods in the context of environmental problems. Eur. J. Oper. Res. 1998, 104, 485–496. [Google Scholar] [CrossRef]
  26. Marzouk, M. ELECTRE III model for value engineering applications. Autom. Constr. 2011, 20, 596–600. [Google Scholar] [CrossRef]
  27. Rezhen, R. Local Residents’ Attitude toward Sustainable Rural Tourism Development. Sustainability 2016, 8, 100. [Google Scholar] [CrossRef]
  28. Gamble, D.; Weil, M. Citizen participation. In Encyclopedia of Social Work, 19th ed.; NASW Press: Washington, DC, USA, 1995; pp. 483–494. [Google Scholar]
  29. Hesari, E.; Moosavy, S.M.; Rohani, A. Investigation the Relationship Between Place Attachment and Community Participation in Residential Areas: A Structural Equation Modelling Approach. Soc. Indic. Res. 2020, 151, 921–941. [Google Scholar] [CrossRef]
  30. Dahl, R.A. Modern Political Analysis; Prentice Hall: Englewood Cliffs, NJ, USA, 1963. [Google Scholar]
  31. Talò, C.; Mannarini, T. Measuring Participation: Development and Validation the Participatory Behaviors Scale. Soc. Indic. Res. 2015, 123, 799–816. [Google Scholar] [CrossRef]
  32. Ekman, J.; Amna, E. Political participation and civic engagement: Towards a new typology. Youth Soc. 2009; Working Paper. [Google Scholar]
  33. Talò, C. Community-Based Determinants of Community Engagement: A Meta-Analysis Research. Soc. Indic. Res. 2018, 140, 571–596. [Google Scholar] [CrossRef]
  34. Moreno-Jiménez, M.P.; Rìos Rodrìguez, M.L.; Martìn, M.V. Construction and validation of the community and socio-political participation scale (SCAP). Span. J. Psychol. 2013, 16, E42. [Google Scholar] [CrossRef]
  35. Mesch, G.S.; Manor, O. Social ties, environmental perception and local attachment. Environ. Behav. 1998, 30, 504–519. [Google Scholar] [CrossRef]
  36. Cicognani, E.; Pirini, C.; Keyes, C. Social Participation, Sense of Community and Social Well Being: A Study on American, Italian and Iranian University Students. Soc. Indic. Res. 2008, 89, 97–112. [Google Scholar] [CrossRef]
  37. Talò, C.; Mannarini, T.; Rochira, A. Sense of Community and Community Participation: A Meta-Analytic Review. Soc. Indic. Res. 2014, 114, 1–28. [Google Scholar] [CrossRef]
  38. Sturmer, S.; Simon, B. Collective action: Towards a dual-pathway model. Eur. Rev. Soc. Psychol. 2004, 15, 59–99. [Google Scholar] [CrossRef]
  39. van Zomeren, M.; Spears, R.; Fischer, A.H.; Leach, C.W. Put your money where your mouth is! Explaining collective action tendencies through group-based anger and group efficacy. J. Pers. Soc. Psychol. 2004, 87, 649–664. [Google Scholar] [CrossRef]
  40. Clarke, N. From ethical consumerism to political consumption. Geogr. Comp. 2008, 2, 1870–1884. [Google Scholar] [CrossRef]
  41. Klandermans, B. Mobilization and participation: Social-psychological expansisons of resource mobilization theory. Am. Sociol. Rev. 1984, 49, 583–600. [Google Scholar] [CrossRef]
  42. Nicely, A.; Sydnor, S. Rural Tourism Development, Tackling a Culture of Local Nonparticipation in a Postslavery Society. J. Travel Res. 2015, 54, 717–729. [Google Scholar] [CrossRef]
  43. Su, M.M.; Wall, G. Community participation in tourism at a world heritage site, Mutianyu Great Wall, Beijing, China. Int. J. Tour. Res. 2014, 16, 146–156. [Google Scholar] [CrossRef]
  44. Simpson, M. Community Benefit Tourism Initiatives-A Conceptual Oxymoron? Tour. Manag. 2008, 29, 1–18. [Google Scholar] [CrossRef]
  45. Tosun, C. Expected Nature of Community Participation in Tourism Development. Tour. Manag. 2006, 27, 493–504. [Google Scholar] [CrossRef]
  46. Hung, K.; Sirakaya-Turk, E.; Ingram, L.J. Testing the Efficacy of an Integrative Model for Community Participation. J. Travel Res. 2011, 50, 276–288. [Google Scholar] [CrossRef]
  47. Ezeuduji, I.O. Strategic event-based rural tourism development for sub-Saharan Africa. Curr. Issues Tour. 2015, 18, 212–228. [Google Scholar] [CrossRef]
  48. Zhang, H.; Lei, S.L. A Structural Model of Residents’ Intention to Participate in Ecotourism, The Case of a Wetland Community. Tour. Manag. 2012, 33, 916–925. [Google Scholar] [CrossRef]
  49. Zhang, Y.; Cole, S.T.; Chancellor, C.H. Facilitation of the SUS-TAS Application with Parsimony, Predictive Validity, & Global Interpretation Examination. J. Travel Res. 2015, 54, 744–757. [Google Scholar] [CrossRef]
  50. Lee, T.H. Influence Analysis of Community Resident Support for Sustainable Tourism Development. Tour. Manag. 2012, 34, 37–46. [Google Scholar] [CrossRef]
  51. Saufi, A.; O’Brien, D.; Wilkins, H. Inhibitors to host community participation in sustainable tourism development in developing countries. J. Sustain. Tour. 2014, 22, 801–820. [Google Scholar] [CrossRef]
  52. Selin, S. Developing a Typology of Sustainable Tourism Partnerships. J. Sustain. Tour. 1999, 7, 260–273. [Google Scholar] [CrossRef]
  53. Lee, T.H.; Jan, F.H. Can community-based tourism contribute to sustainable development? Evidence from residents’ perceptions of the sustainability. Tour. Manag. 2019, 70, 368–380. [Google Scholar] [CrossRef]
  54. Watson, G.H. Strategic Benchmarking, How to Rate Your Company’s Performance against the World’s Best; Wiley: London, UK, 1993. [Google Scholar]
  55. Cuyvers, L.; de Pelsmacker, P.; Rayp, G.; Roozen, I.T.M. A decision support model for the planning and assessment of export promotion activities by government export promotion institutions: The Belgian case. Int. J. Res. Mark. 1995, 12, 173–186. [Google Scholar] [CrossRef]
  56. Konstantakopoulou, I.; Tsionas, M. Identifying Export Opportunities: Empirical Evidence from the Southern Euro Area Countries. Open Econ. Rev. 2024, 35, 41–70. [Google Scholar] [CrossRef]
  57. Vojtko, V.; Štumpf, P.; Rašovská, I.; McGrath, R.; Ryglová, K. Removing Uncontrollable Factors in Benchmarking Tourism Destination Satisfaction. J. Travel Res. 2020, 61, 136–149. [Google Scholar] [CrossRef]
  58. Timothy, D.J. Tourism and Political Boundaries; Routledge: London, UK, 2001. [Google Scholar] [CrossRef]
  59. Park, K.; Mense-Petermann, U. Managing across Borders, Global Integration and Knowledge Exchange in MNCs. Compet. Change 2014, 18, 265–279. [Google Scholar] [CrossRef]
  60. Blasco, D.; Guia, J.; Prats, L. Emergence of governance in cross-border destinations. Ann. Tour. Res. 2014, 49, 159–173. [Google Scholar] [CrossRef]
  61. Durand, F. Challenges of Cross-Border Spatial Planning in the Metropolitan Regions of Luxembourg and Lille. Plan. Pract. Res. 2014, 29, 113–132. [Google Scholar] [CrossRef]
  62. Ruhanen, L. Local government, Facilitator or inhibitor of sustainable tourism development? J. Sustain. Tour. 2013, 21, 80–98. [Google Scholar] [CrossRef]
  63. OECD. Note on Composite Indicators; OECD Publishing: Brussels, Belgium, 2002. [Google Scholar]
  64. Mendola, D.; Volo, S. Building composite indicators in tourism studies, Measurements and applications in tourism destination competitiveness. Tour. Manag. 2017, 59, 541–553. [Google Scholar] [CrossRef]
  65. Greco, S.; Ishizaka, A.; Tasiou, M. On the Methodological Framework of Composite Indices, A Review of the Issues of Weighting, Aggregation and Robustness. Soc. Indic. Res. 2019, 141, 61–94. [Google Scholar] [CrossRef]
  66. Munda, G.; Nardo, M. Noncompensatory/nonlinear composite indicators for ranking countries, A defensible setting. Appl. Econ. 2009, 411, 1513–1523. [Google Scholar] [CrossRef]
  67. Lawton, L.J.; Weaver, D.B. Using residents’ perceptions research to inform planning and management for sustainable tourism, a study of the Gold Coast Schoolies Week, a contentious tourism event. J. Sustain. Tour. 2015, 235, 660–682. [Google Scholar] [CrossRef]
  68. Krosnick, J.A. Response strategies for coping with the cognitive demands of attitude measures in surveys. Appl. Cogn. Psychol. 1991, 5, 213–236. [Google Scholar] [CrossRef]
  69. Geer, J.G. What do open-ended questions measure? Public Opin. Q. 1988, 52, 365–367. [Google Scholar] [CrossRef]
  70. Keillor, B.D.; Owens, D.; Pettijohn, C. A Cross-cultural/cross-national Study of Influencing Factors and Socially Desirable Response Biases. Int. J. Mark. Res. 2001, 43, 1–19. [Google Scholar] [CrossRef]
  71. OECD. Handbook on Constructing Composite Indicators, Methodology and User Guide; OECD Publishing: Paris, France, 2008. [Google Scholar]
  72. Wilcox, A.R. Indices of Qualitative Variation and Political Measurement. West. Political Q. 1973, 26, 325–343. [Google Scholar] [CrossRef]
  73. Roy, B. The outranking approach and the foundations of ELECTRE methods. Theory Decis. 1991, 31, 49–73. [Google Scholar] [CrossRef]
  74. Hoskins, B.L.; Mascherini, M. Measuring Active Citizenship through the Development of a Composite Indicator. Soc. Indic. Res. 2009, 90, 459–488. [Google Scholar] [CrossRef]
  75. Saisana, M.; Saltelli, A.; Tarantola, S. Uncertainty and sensitivity analysis techniques as tools for the quality assessment of composite indicators. J. R. Stat. Soc Ser. A Stat. Soc. 2005, 168, 307–323. [Google Scholar] [CrossRef]
  76. Daniel, J. Preparing to make sampling choices. In Sampling Essentials, Practical Guidelines for Making Sampling Choices; Daniel, J., Ed.; SAGE Publications: Thousand Oaks, CA, USA, 2012; pp. 1–22. [Google Scholar]
  77. Benkovic, A.; Mejía, J.F. An enterprise odyssey. In Proceedings of the 4th International Conference: An Enterprise Odyssey: Tourism—Governance and Entrepreneurship, University of Zagreb, Faculty of Economics and Business, Zagreb, Croatia, 11–14 June 2008; pp. 46–57. [Google Scholar]
  78. Grillo, M.C.; Teixeira, M.A.; Wilson, D.C. Residential Satisfaction and Civic Engagement: Understanding the Causes of Community Participation. Soc. Indic. Res. 2010, 97, 451–466. [Google Scholar] [CrossRef]
  79. Thebault-Spieker, J.; Terveen, L.; Hecht, B. Toward a Geographic Understanding of the Sharing Economy, Systemic Biases in UberX and TaskRabbit. ACM Trans. Comput.-Hum. Interact. 2017, 243, 21–40. [Google Scholar] [CrossRef]
  80. Shahab, N.; Morais, D.B.; Bunds, K.; Baran, P.; Supak, S. Rural tourism microentrepreneurs’ self-representation through photography, a counter-hegemonic approach. Rural Soc. 2019, 281, 29–51. [Google Scholar] [CrossRef]
  81. Cochran, W.G. Sampling Techniques; John Wiley and Sons: New York, NY, USA, 1963. [Google Scholar]
Table 1. Sample size and composition by sex and age.
LandSample SizePercentage FemalePercentage
under 35
Median Age
Alfonsine9965%23%47
Čavle9049%46%35
Gospić10957%35%35
Karlovac13550%30%35
Ostellato8454%23%48
Ovaro7049%17%54
Paularo6650%17%46
Prato Carnico6853%13%54
Rive d’Arcano8060%28%49
Sasso Simone7849%26%50
OVERALL87953%28%45
Table 2. Destination rankings.
LandCommunity-Participation-Index-Based Rank
Alfonsine4
Čavle9
Gospić1
Karlovac8
Ostellato2
Ovaro6
Paularo3
Prato Carnico5
Rive d’Arcano7
Sasso Simone9
Table 3. Uncertainty analysis.
LandRank Statistics *
Average RankMean Rank ShiftMedian Rank Shift
Alfonsine61.080
Čavle51.091
Gospić20.280
Karlovac70.750
Ostellato40.670
Ovaro40.620
Paularo80.60
Prato Carnico50.880
Rive d’Arcano70.750
Sasso Simone30.740
* A total of 208 rankings considered.
Table 4. Sensitivity analysis (three-way analysis of variance).
Analysis of VarianceAlfonsineČavleGospićKarlovacOstellatoOvaroPaularoPrato CarnicoRive
d’Arcano
Sasso Simone
Total variance of ranks1839103320144570317317575008131117
Contribution to total variance by
Indicators set4.5%6.4%4.2%5.7%2.9%4.9%0.2%11.0%3.6%1.7%
Weighting scheme0.1%7.9%12.2%20.0%5.7%13.3%0.5%9.9%3.3%4.6%
Aggregation function 78%63%45%29%71%4%94%24%78%78%
Interactions
Indicator*Weight2.1%2.9%3.9%4.3%2.3%6.4%0.3%7.8%1.1%2.3%
Indicator*Aggregation5.8%5.2%5.0%7.8%3.3%14.3%0.5%13.0%2.6%2.8%
Weight*Aggregation2.3%8.7%21.5%23.8%8.2%36.0%3.5%22.3%8.0%5.4%
Indicator*Weight*Aggregation7.0%6.2%8.5%9.0%6.4%21.4%1.2%12.3%3.1%5.6%
In bold, the largest variance shares.
Table 5. Sensitivity analysis of indicators (two-way analysis of variance).
IndicatorF Value
AQ11.86
AQ214.442***
AQ31.53
AQ40.018
AQ50.949
AQ638.468***
AQ73.918**
AQ823.194***
AQ942.811***
AQ1073.908***
AQ11131.048***
AQ120.189
***: significance level of ≤ 0.01; **: 0.01 ≤ significance level of < 0.05. The most significant statistics are in bold.
Disclaimer/Publisher’s Note: The statements, opinions and data contained in all publications are solely those of the individual author(s) and contributor(s) and not of MDPI and/or the editor(s). MDPI and/or the editor(s) disclaim responsibility for any injury to people or property resulting from any ideas, methods, instructions or products referred to in the content.

