
A Case Study on Children’s Accessibility in Urban Parks in Changsha City, China: Developing an Improved 2SFCA Method


Abstract
:1. Introduction
2. Literature Review
2.1. Children’s Accessibility
2.2. Accessibility Assessment
2.3. Enhancements to the 2SFCA Method
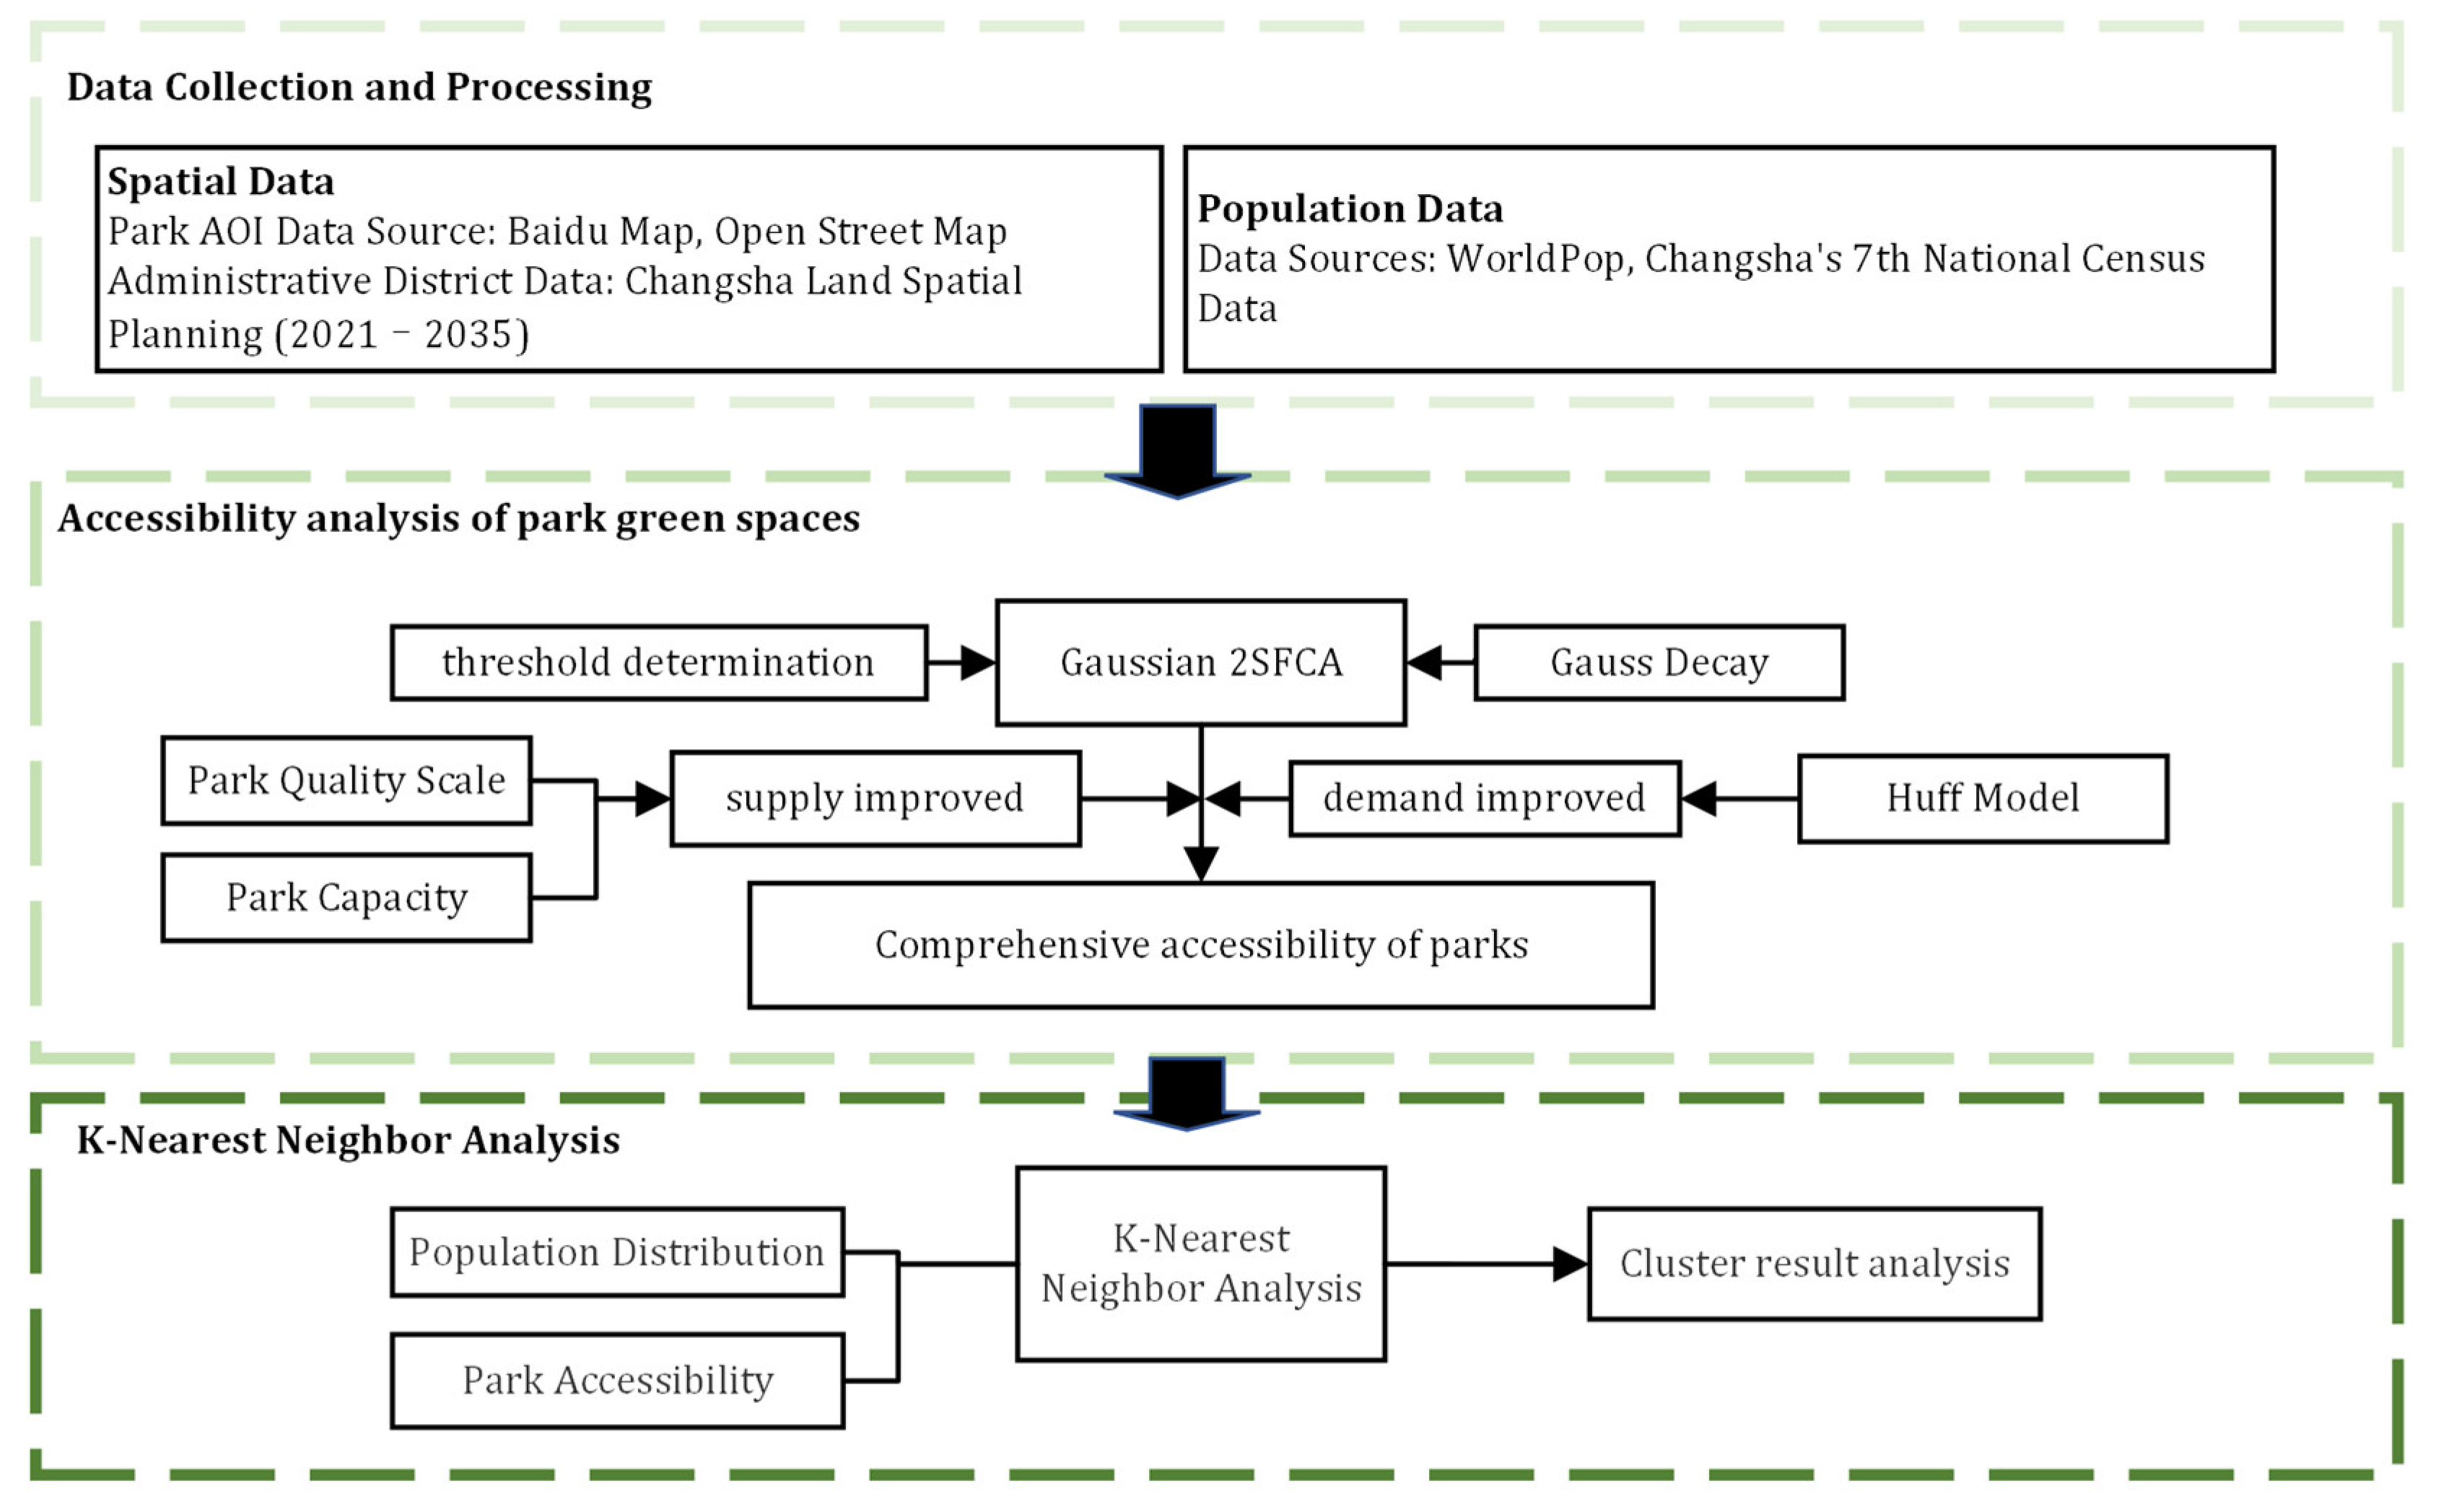
3. Methodology: The Enhanced 2SFCA Method Based on Supply and Demand
3.1. Enhancement of Supply
3.2. Enhancement of Demand
3.3. Spatial Accessibility to Parks
4. Materials
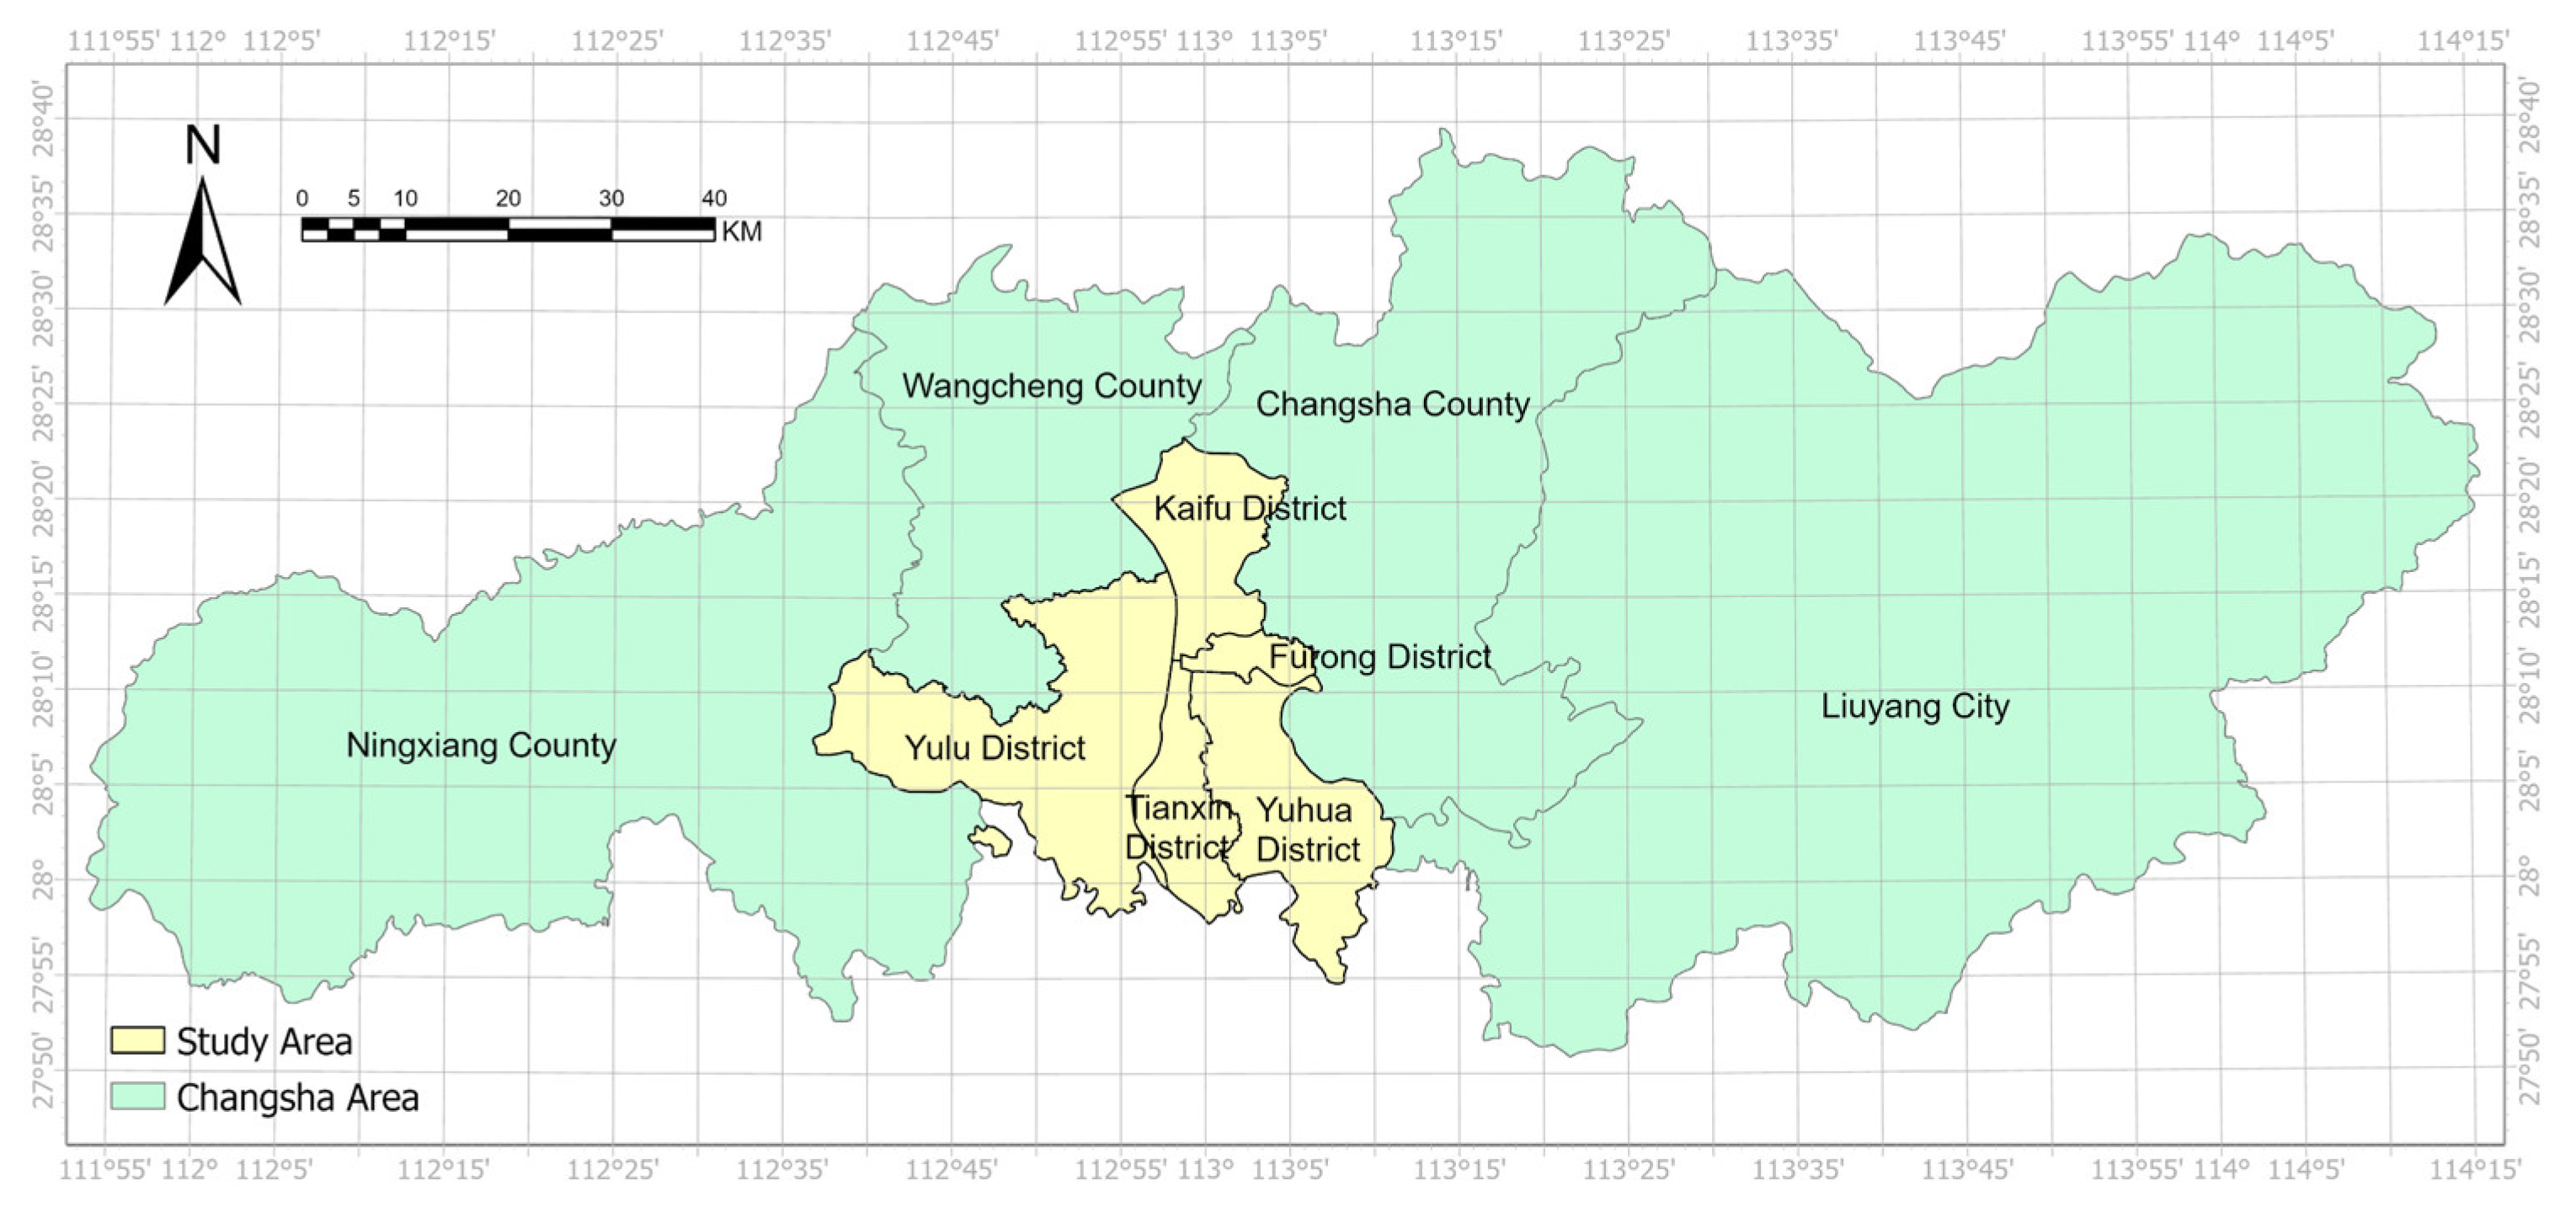
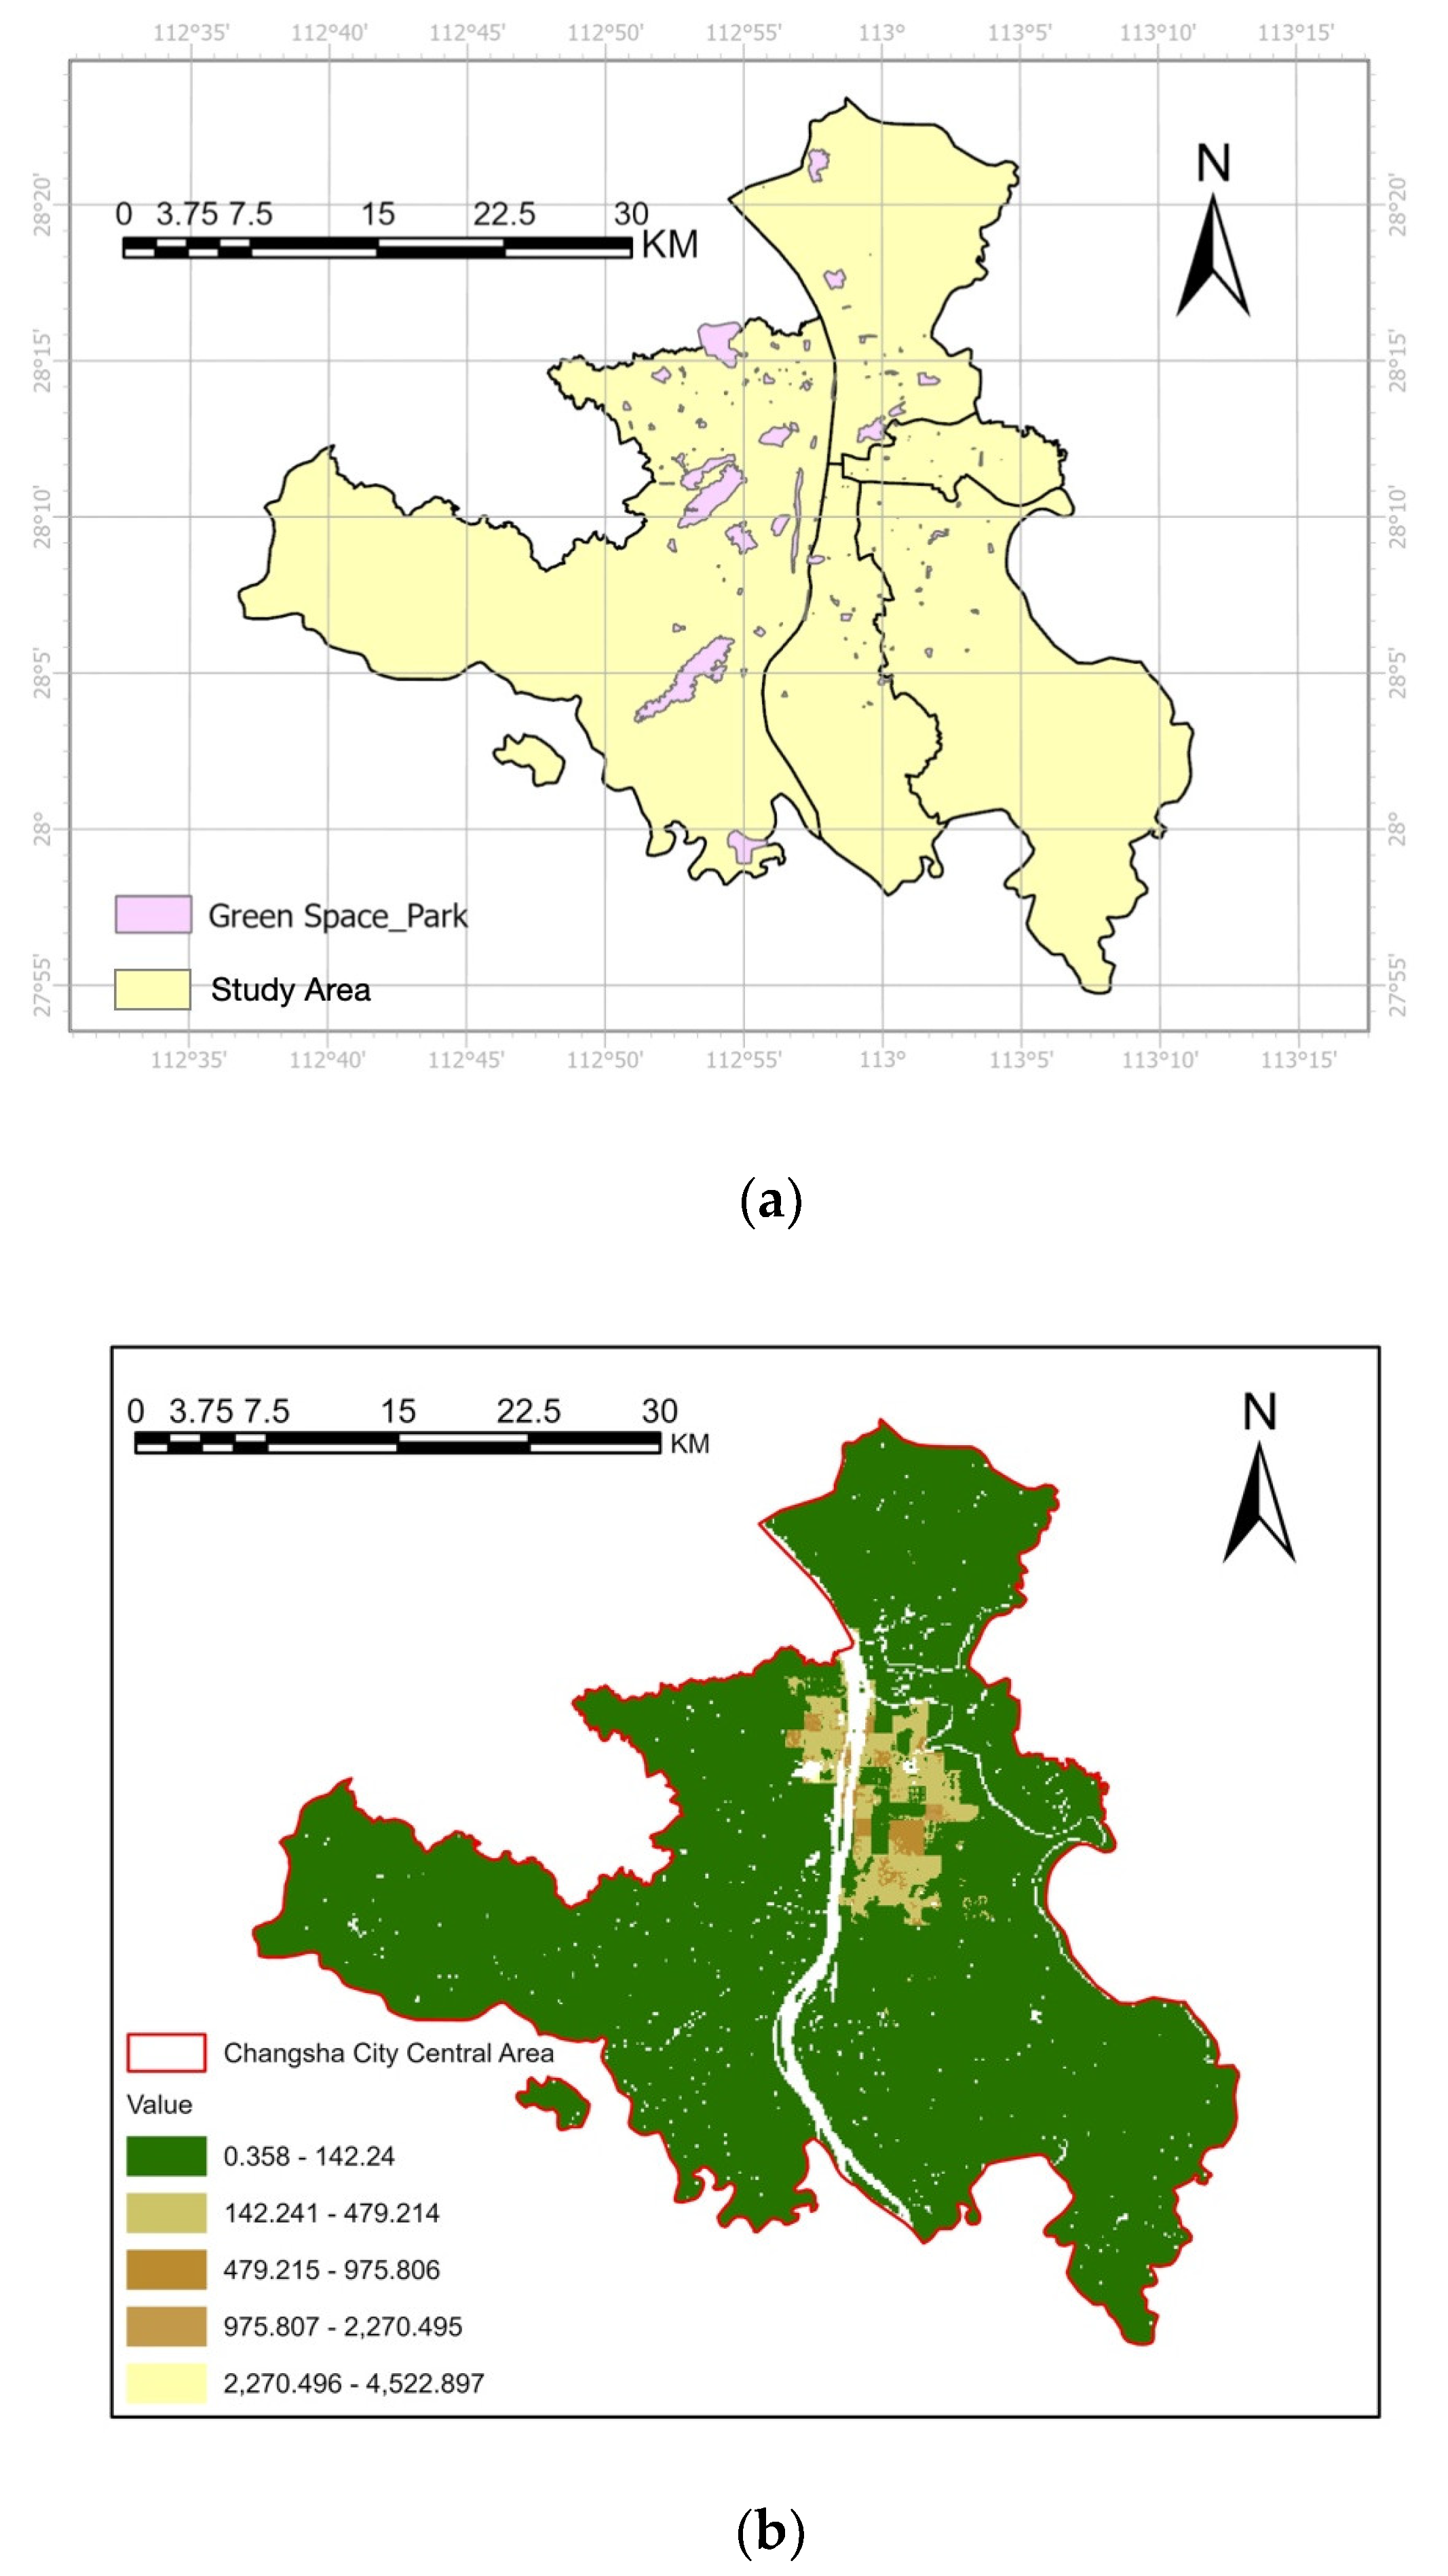
4.1. Study Area
4.2. Data Sources and Data Processing
5. Results
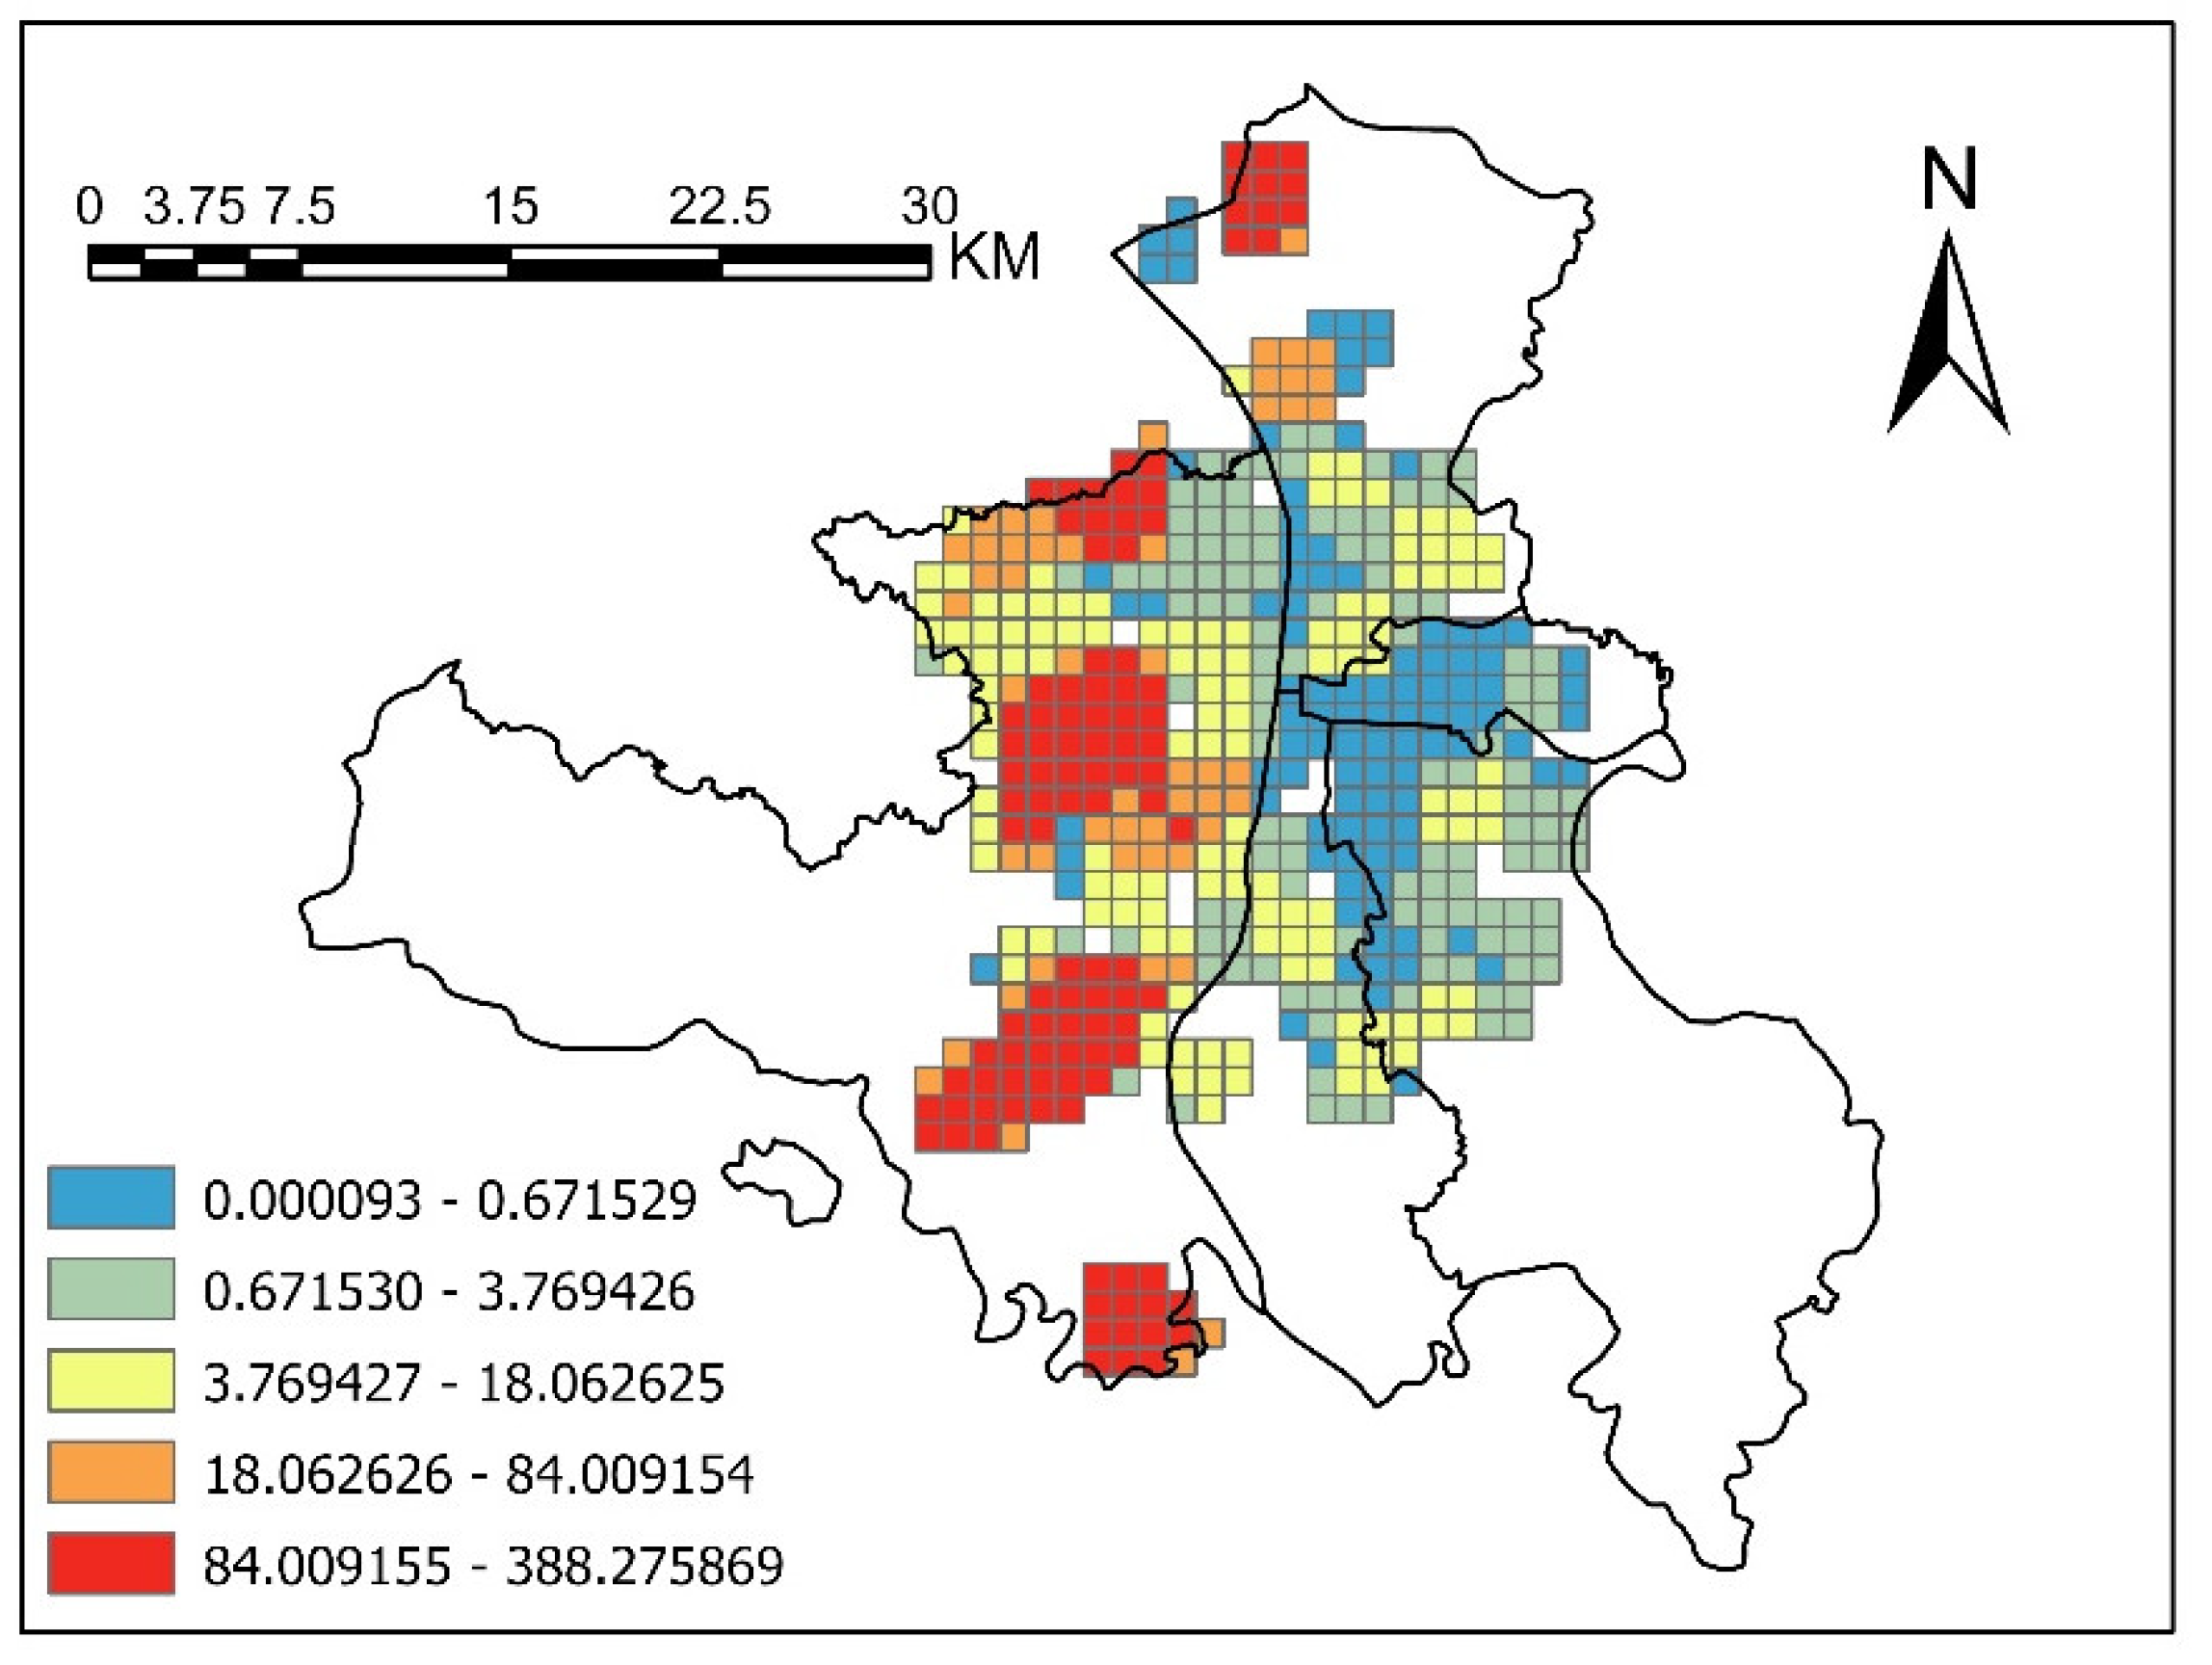
5.1. Evaluation of Park Accessibility
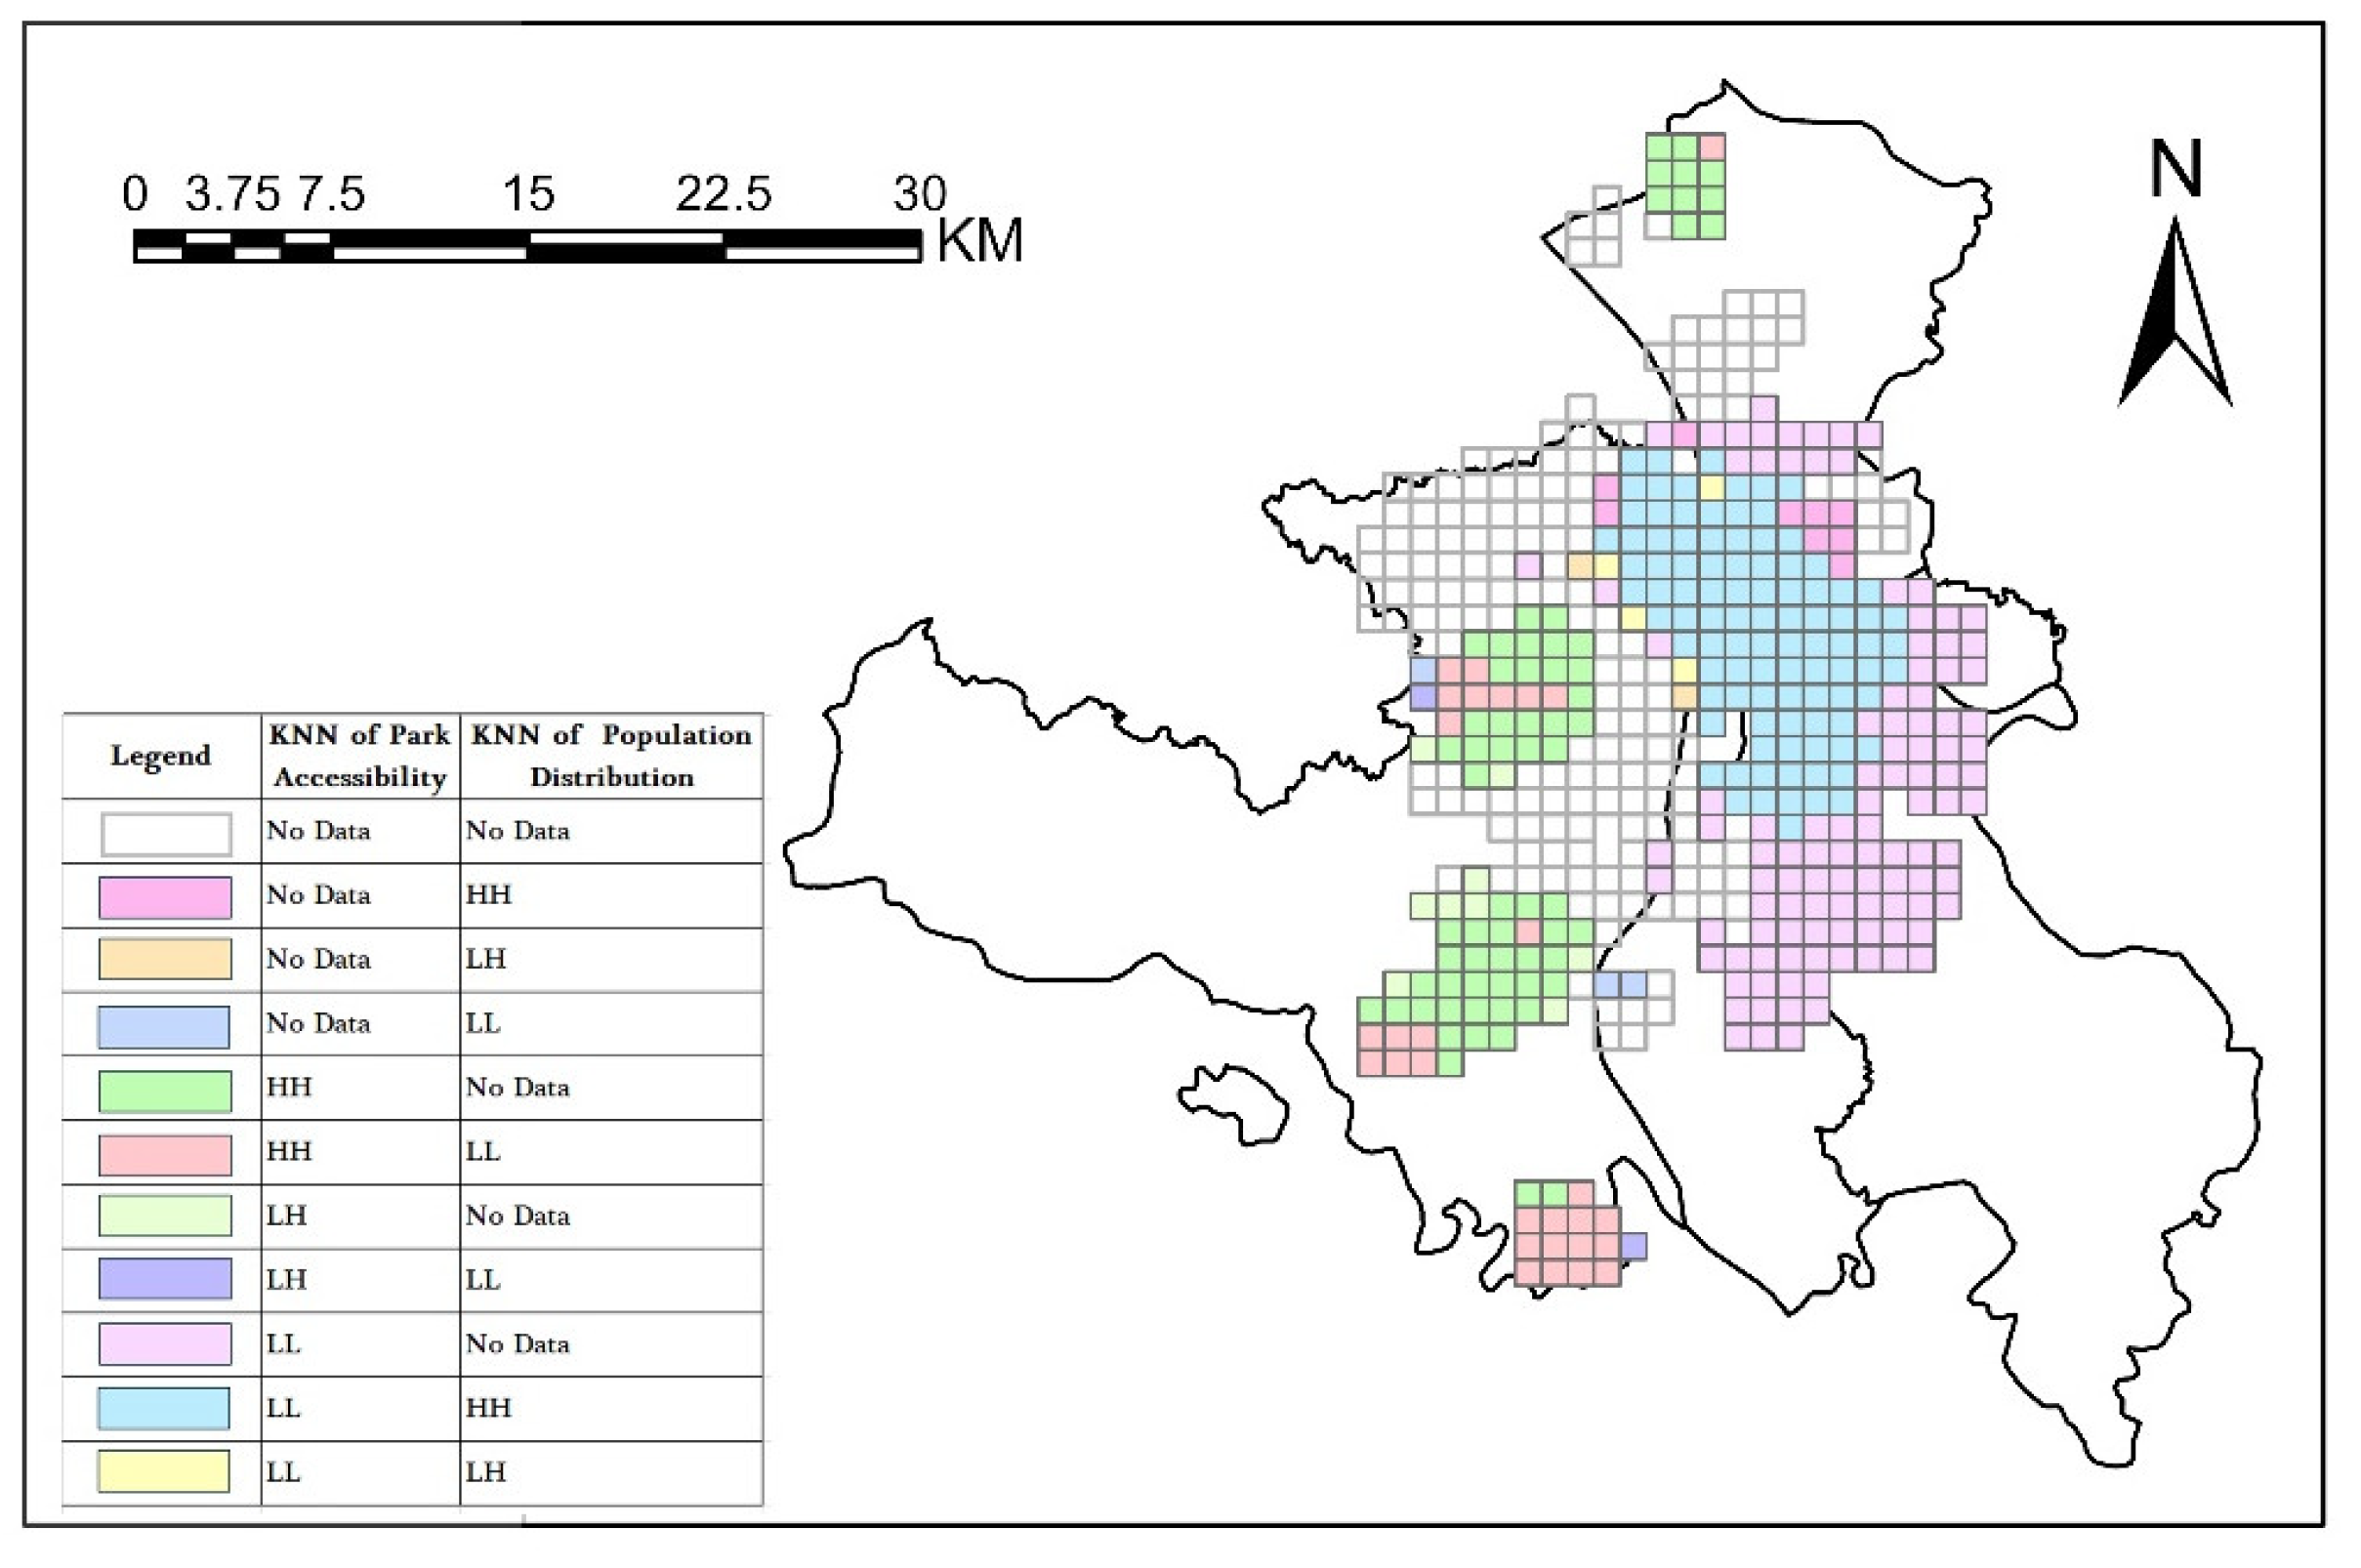
5.2. K-Nearest Neighbor Analysis
6. Discussions
6.1. Research Novelty
6.2. Research Implications
6.2.1. Relationship between Economic Development and Green Space
6.2.2. Multidimensional Assessment of Green Space
6.2.3. Differences in Park Demand between High-Density and Low-Density Areas
6.2.4. Enhancing Park Design for Chlidren Engagement and Activity
6.3. Research Limitations
7. Conclusions
Author Contributions
Funding
Data Availability Statement
Conflicts of Interest
References
- Wu, Y.; Luo, J.; Zhang, X.; Skitmore, M. Urban Growth Dilemmas and Solutions in China: Looking Forward to 2030. Habitat Int. 2016, 56, 42–51. [Google Scholar] [CrossRef]
- What the 2020 Census Can Tell Us about Children in China Facts and Figures. Available online: https://www.unicef.cn/reports/population-status-children-china-2020-census (accessed on 5 August 2024).
- Convention on the Rights of the Child Text|UNICEF. Available online: https://www.unicef.org/child-rights-convention/convention-text (accessed on 20 August 2024).
- Pont, K.; Ziviani, J.; Wadley, D.; Bennett, S.; Abbott, R. Environmental Correlates of Children’s Active Transportation: A Systematic Literature Review. Health Place 2009, 15, 849–862. [Google Scholar] [CrossRef] [PubMed]
- Rigolon, A. Parks and Young People: An Environmental Justice Study of Park Proximity, Acreage, and Quality in Denver, Colorado. Landsc. Urban Plan. 2017, 165, 73–83. [Google Scholar] [CrossRef]
- Tandy, C.A. Children’s Diminishing Play Space: A Study of Inter-generational Change in Children’s Use of Their Neighbourhoods. Aust. Geogr. Stud. 1999, 37, 154–164. [Google Scholar] [CrossRef]
- Zhai, B.X.; Zhu, W. Analysis on spatial-temporal characteristics of children’s outdoor activities in big cities: A case study of Shanghai. City Plan. Rev. 2018, 42, 87–96. [Google Scholar]
- Woolley, H.E.; Griffin, E. Decreasing Experiences of Home Range, Outdoor Spaces, Activities and Companions: Changes across Three Generations in Sheffield in North England. Child. Geogr. 2015, 13, 677–691. [Google Scholar] [CrossRef]
- Karsten, L. It All Used to Be Better? Different Generations on Continuity and Change in Urban Children’s Daily Use of Space. Child. Geogr. 2005, 3, 275–290. [Google Scholar] [CrossRef]
- Steene-Johannessen, J.; Hansen, B.H.; Dalene, K.E.; Kolle, E.; Northstone, K.; Møller, N.C.; Grøntved, A.; Wedderkopp, N.; Kriemler, S.; Page, A.S.; et al. Variations in Accelerometry Measured Physical Activity and Sedentary Time across Europe—Harmonized Analyses of 47,497 Children and Adolescents. Int. J. Behav. Nutr. Phys. Act. 2020, 17, 38. [Google Scholar] [CrossRef]
- Louv, R. Last Child in the Woods: Saving Our Children from Nature-Deficit Disorder; Algonquin Books: Chapel Hill, NC, USA, 2008; ISBN 1-56512-605-X. [Google Scholar]
- Soga, M.; Gaston, K.J. Extinction of Experience: The Loss of Human–Nature Interactions. Front. Ecol. Environ. 2016, 14, 94–101. [Google Scholar] [CrossRef]
- 2011 City Park Facts Report; Trust for Public Land: San Francisco, CA, USA, 2011.
- Xing, L.; Liu, Y.; Wang, B.; Wang, Y.; Liu, H. An Environmental Justice Study on Spatial Access to Parks for Youth by Using an Improved 2SFCA Method in Wuhan, China. Cities 2020, 96, 102405. [Google Scholar] [CrossRef]
- Shan, Y.U. The General Office of the Central Committee of the Communist Party of China and the General Office of the State Council Issued the “Opinions on Further Reducing the Burden of Homework and Off-Campus Training for Students in Compulsory Education”. Available online: https://www.gov.cn/zhengce/2021-07/24/content_5627132.htm (accessed on 14 September 2024).
- Bao, Y.; Gao, M.; Luo, D.; Zhou, X. Urban Parks—A Catalyst for Activities! The Effect of the Perceived Characteristics of the Urban Park Environment on Children’s Physical Activity Levels. Forests 2023, 14, 423. [Google Scholar] [CrossRef]
- Bao, Y.; Gao, M.; Luo, D.; Zhou, X. The Influence of Outdoor Play Spaces in Urban Parks on Children’s Social Anxiety. Front. Public Health 2022, 10, 1046399. [Google Scholar] [CrossRef] [PubMed]
- Gao, M.; Zhu, X.; Cheng, X. Safety—Premise for Play: Exploring How Characteristics of Outdoor Play Spaces in Urban Residential Areas Influence Children’s Perceived Safety. Cities 2024, 152, 105236. [Google Scholar] [CrossRef]
- Kabisch, N.; Haase, D. Green Justice or Just Green? Provision of Urban Green Spaces in Berlin, Germany. Landsc. Urban Plan. 2014, 122, 129–139. [Google Scholar] [CrossRef]
- Chiesura, A. The Role of Urban Parks for the Sustainable City. Landsc. Urban Plan. 2004, 68, 129–138. [Google Scholar] [CrossRef]
- Smith, L.; Case, J.; Smith, H.; Harwell, L.; Summers, J. Relating Ecoystem Services to Domains of Human Well-Being: Foundation for a US Index. Ecol. Indic. 2014, 28, 79–90. [Google Scholar] [CrossRef]
- van Kamp, I.; Leidelmeijer, K.; Marsman, G.; de Hollander, A. Urban Environmental Quality and Human Well-Being: Towards a Conceptual Framework and Demarcation of Concepts; a Literature Study. Landsc. Urban Plan. 2003, 65, 5–18. [Google Scholar] [CrossRef]
- Rothman, L.; Macpherson, A.K.; Ross, T.; Buliung, R.N. The Decline in Active School Transportation (AST): A Systematic Review of the Factors Related to AST and Changes in School Transport over Time in North America. Prev. Med. 2018, 111, 314–322. [Google Scholar] [CrossRef]
- Pang, B.; Kubacki, K.; Rundle-Thiele, S. Promoting Active Travel to School: A Systematic Review (2010–2016). BMC Public Health 2017, 17, 638. [Google Scholar] [CrossRef]
- Robillard, A.; Boisjoly, G.; Waygood, E.O.D. Access to Parks and Green Spaces in Quebec City, Canada: Developing Children-Specific Accessibility Measures. Transp. Res. Rec. 2023, 2677, 464–477. [Google Scholar] [CrossRef]
- Marzi, I.; Reimers, A.K. Children’s Independent Mobility: Current Knowledge, Future Directions, and Public Health Implications. Int. J. Environ. Res. Public Health 2018, 15, 2441. [Google Scholar] [CrossRef] [PubMed]
- Cohen, D.A.; McKenzie, T.L.; Sehgal, A.; Williamson, S.; Golinelli, D.; Lurie, N. Contribution of Public Parks to Physical Activity. Am. J. Public Health 2007, 97, 509–514. [Google Scholar] [CrossRef] [PubMed]
- Vanaken, G.-J.; Danckaerts, M. Impact of Green Space Exposure on Children’s and Adolescents’ Mental Health: A Systematic Review. Int. J. Environ. Res. Public Health 2018, 15, 2668. [Google Scholar] [CrossRef] [PubMed]
- Petraviciene, I.; Grazuleviciene, R.; Andrusaityte, S.; Dedele, A.; Nieuwenhuijsen, M.J. Impact of the Social and Natural Environment on Preschool-Age Children Weight. Int. J. Environ. Res. Public Health 2018, 15, 449. [Google Scholar] [CrossRef] [PubMed]
- Macintyre, S.; Macdonald, L.; Ellaway, A. Do Poorer People Have Poorer Access to Local Resources and Facilities? The Distribution of Local Resources by Area Deprivation in Glasgow, Scotland. Soc. Sci. Med. 2008, 67, 900–914. [Google Scholar] [CrossRef] [PubMed]
- Zhao, J.; Zhang, Y.; Jiang, F.; Ip, P.; Ho, F.K.W.; Zhang, Y.; Huang, H. Excessive Screen Time and Psychosocial Well-Being: The Mediating Role of Body Mass Index, Sleep Duration, and Parent-Child Interaction. J. Pediatr. 2018, 202, 157–162.e1. [Google Scholar] [CrossRef]
- Richardson, E.A.; Pearce, J.; Shortt, N.K.; Mitchell, R. The Role of Public and Private Natural Space in Children’s Social, Emotional and Behavioural Development in Scotland: A Longitudinal Study. Environ. Res. 2017, 158, 729–736. [Google Scholar] [CrossRef]
- England, N. Accessible Natural Green Space Standards in Towns and Cities: A Review and Toolkit for Their Implementation—ENRR526. Available online: https://publications.naturalengland.org.uk/publication/65021 (accessed on 22 August 2024).
- Waygood, E.O.D.; Friman, M.; Olsson, L.E.; Taniguchi, A. Transport and Child Well-Being: An Integrative Review. Travel. Behav. Soc. 2017, 9, 32–49. [Google Scholar] [CrossRef]
- Matthews, H.; Limb, M. Defining an Agenda for the Geography of Children: Review and Prospect. Progress Human Geogr. 1999, 23, 61–90. [Google Scholar] [CrossRef]
- Shaw, B.; Bicket, M.; Elliott, B.; Fagan-Watson, B.; Mocca, E.; Hillman, M.; Fagan-Watson, B. Children’s Independent Mobility: An International Comparison and Recommendations for Action. Available online: https://www.researchgate.net/publication/315755777_Children’s_Independent_Mobility_an_international_comparison_and_recommendations_for_action (accessed on 5 August 2024).
- Hillman, M.; Adams, J.; Whitelegg, J. One False Move … A Study of Children’s Independent Mobility; PSI Publishing: Suwanee, GA, USA, 1990. [Google Scholar]
- Tranter, P.; Whitelegg, J. Children’s Travel Behaviours in Canberra: Car-Dependent Lifestyles in a Low-Density City. J. Transp. Geogr. 1994, 2, 265–273. [Google Scholar] [CrossRef]
- Page, A.S.; Cooper, A.R.; Griew, P.; Davis, L.; Hillsdon, M. Independent Mobility in Relation to Weekday and Weekend Physical Activity in Children Aged 10–11 Years: The PEACH Project. Int. J. Behav. Nutr. Phys. Act. 2009, 6, 2. [Google Scholar] [CrossRef] [PubMed]
- Buliung, R.N.; Larsen, K.; Faulkner, G.; Ross, T. Children’s Independent Mobility in the City of Toronto, Canada. Travel. Behav. Soc. 2017, 9, 58–69. [Google Scholar] [CrossRef]
- Schoeppe, S.; Duncan, M.J.; Badland, H.M.; Oliver, M.; Browne, M. Associations between Children’s Independent Mobility and Physical Activity. BMC Public Health 2014, 14, 91. [Google Scholar] [CrossRef] [PubMed]
- Loukaitou-Sideris, A.; Sideris, A. What Brings Children to the Park? Analysis and Measurement of the Variables Affecting Children’s Use of Parks. J. Am. Plan. Assoc. 2009, 76, 89–107. [Google Scholar] [CrossRef]
- Rigolon, A.; Németh, J. A QUality INdex of Parks for Youth (QUINPY): Evaluating Urban Parks through Geographic Information Systems. Environ. Plan. B Urban Anal. City Sci. 2018, 45, 275–294. [Google Scholar] [CrossRef]
- Talen, E.; Anselin, L. Assessing Spatial Equity: An Evaluation of Measures of Accessibility to Public Playgrounds. Environ. Plan. A 1998, 30, 595–613. [Google Scholar] [CrossRef]
- Smoyer-Tomic, K.E.; Hewko, J.N.; Hodgson, M.J. Spatial Accessibility and Equity of Playgrounds in Edmonton, Canada. Can. Geogr./Géographies Can. 2004, 48, 287–302. [Google Scholar] [CrossRef]
- Nicholls, S. Measuring the Accessibility and Equity of Public Parks: A Case Study Using GIS. Manag. Leis. 2001, 6, 201–219. [Google Scholar] [CrossRef]
- Hewko, J.; Smoyer-Tomic, K.E.; Hodgson, M.J. Measuring Neighbourhood Spatial Accessibility to Urban Amenities: Does Aggregation Error Matter? Environ. Plan. A 2002, 34, 1185–1206. [Google Scholar] [CrossRef]
- Higgs, G.; Fry, R.; Langford, M. Investigating the Implications of Using Alternative GIS-Based Techniques to Measure Accessibility to Green Space. Environ. Plan. B Plan. Des. 2012, 39, 326–343. [Google Scholar] [CrossRef]
- Lu, B.; Charlton, M.; Harris, P.; Fotheringham, A.S. Geographically Weighted Regression with a Non-Euclidean Distance Metric: A Case Study Using Hedonic House Price Data. Int. J. Geogr. Inf. Sci. 2014, 28, 660–681. [Google Scholar] [CrossRef]
- Vaughan, K.B.; Kaczynski, A.T.; Wilhelm Stanis, S.A.; Besenyi, G.M.; Bergstrom, R.; Heinrich, K.M. Exploring the Distribution of Park Availability, Features, and Quality across Kansas City, Missouri by Income and Race/Ethnicity: An Environmental Justice Investigation. Ann. Behav. Med. 2013, 45 (Suppl. 1), S28–S38. [Google Scholar] [CrossRef] [PubMed]
- Moore, L.V.; Diez Roux, A.V.; Evenson, K.R.; McGinn, A.P.; Brines, S.J. Availability of Recreational Resources in Minority and Low Socioeconomic Status Areas. Am. J. Prev. Med. 2008, 34, 16–22. [Google Scholar] [CrossRef] [PubMed]
- Miyake, K.K.; Maroko, A.R.; Grady, K.L.; Maantay, J.A.; Arno, P.S. Not Just a Walk in the Park: Methodological Improvements for Determining Environmental Justice Implications of Park Access in New York City for the Promotion of Physical Activity. Cities Environ. 2010, 3, 1–17. [Google Scholar] [CrossRef] [PubMed]
- Boone, C.G.; Buckley, G.L.; Grove, J.M.; Sister, C. Parks and People: An Environmental Justice Inquiry in Baltimore, Maryland. Ann. Assoc. Am. Geogr. 2009, 99, 767–787. [Google Scholar] [CrossRef]
- Luo, W.; Wang, F. Measures of Spatial Accessibility to Healthcare in a GIS Environment: Synthesis and a Case Study in Chicago Region. Environ. Plan. B Plan. Des. 2003, 30, 865–884. [Google Scholar] [CrossRef]
- Dai, D. Black Residential Segregation, Disparities in Spatial Access to Health Care Facilities, and Late-Stage Breast Cancer Diagnosis in Metropolitan Detroit. Health Place 2010, 16, 1038–1052. [Google Scholar] [CrossRef]
- Langford, M.; Higgs, G.; Fry, R. Using Floating Catchment Analysis (FCA) Techniques to Examine Intra-Urban Variations in Accessibility to Public Transport Opportunities: The Example of Cardiff, Wales. J. Transp. Geogr. 2012, 25, 1–14. [Google Scholar] [CrossRef]
- Dony, C.C.; Delmelle, E.M.; Delmelle, E.C. Re-Conceptualizing Accessibility to Parks in Multi-Modal Cities: A Variable-Width Floating Catchment Area (VFCA) Method. Landsc. Urban Plan. 2015, 143, 90–99. [Google Scholar] [CrossRef]
- Bertram, C.; Rehdanz, K. The Role of Urban Green Space for Human Well-Being. Ecol. Econ. 2015, 120, 139–152. [Google Scholar] [CrossRef]
- Xia, N.; Cheng, L.; Chen, S.; Wei, X.; Zong, W.; Li, M. Accessibility Based on Gravity-Radiation Model and Google Maps API: A Case Study in Australia. J. Transp. Geogr. 2018, 72, 178–190. [Google Scholar] [CrossRef]
- Xia, M.; Li, J. Assessment of Ecological Well-Being Performance and Its Spatial Correlation Analysis in the Beijing-Tianjin-Hebei Urban Agglomeration. J. Clean. Prod. 2022, 362, 132621. [Google Scholar] [CrossRef]
- Chang, H.-S.; Liao, C.-H. Exploring an Integrated Method for Measuring the Relative Spatial Equity in Public Facilities in the Context of Urban Parks. Cities 2011, 28, 361–371. [Google Scholar] [CrossRef]
- Wolff, M. Taking One Step Further—Advancing the Measurement of Green and Blue Area Accessibility Using Spatial Network Analysis. Ecol. Indic. 2021, 126, 107665. [Google Scholar] [CrossRef]
- Radke, J.; Mu, L. Spatial Decompositions, Modeling and Mapping Service Regions to Predict Access to Social Programs. Geogr. Inf. Sci. 2000, 6, 105–112. [Google Scholar] [CrossRef]
- Wu, J.; Chen, H.; Wang, H.; He, Q.; Zhou, K. Will the Opening Community Policy Improve the Equity of Green Accessibility and in What Ways?—Response Based on a 2-Step Floating Catchment Area Method and Genetic Algorithm. J. Clean. Prod. 2020, 263, 121454. [Google Scholar] [CrossRef]
- Xiao, W.; Wei, Y.D.; Wan, N. Modeling Job Accessibility Using Online Map Data: An Extended Two-Step Floating Catchment Area Method with Multiple Travel Modes. J. Transp. Geogr. 2021, 93, 103065. [Google Scholar] [CrossRef]
- Dong, J.; Yang, Y.; Luo, M.; Cheng, Q.; Zhang, X.; Wang, Y. Spatial equity of city public open spaces based on G2SFCA: A case study of Wuhan, China. Int. Arch. Photogramm. Remote Sens. Spat. Inf. Sci. 2022, 43, 501–506. [Google Scholar] [CrossRef]
- Luo, W.; Qi, Y. An Enhanced Two-Step Floating Catchment Area (E2SFCA) Method for Measuring Spatial Accessibility to Primary Care Physicians. Health Place 2009, 15, 1100–1107. [Google Scholar] [CrossRef]
- Dai, D. Racial/Ethnic and Socioeconomic Disparities in Urban Green Space Accessibility: Where to Intervene? Landsc. Urban Plan. 2011, 102, 234–244. [Google Scholar] [CrossRef]
- Luo, W.; Whippo, T. Variable Catchment Sizes for the Two-Step Floating Catchment Area (2SFCA) Method. Health Place 2012, 18, 789–795. [Google Scholar] [CrossRef] [PubMed]
- Wang, F. Inverted Two-Step Floating Catchment Area Method for Measuring Facility Crowdedness. Prof. Geogr. 2018, 70, 251–260. [Google Scholar] [CrossRef]
- Mao, L.; Nekorchuk, D. Measuring Spatial Accessibility to Healthcare for Populations with Multiple Transportation Modes. Health Place 2013, 24, 115–122. [Google Scholar] [CrossRef] [PubMed]
- Xing, L.; Liu, Y.; Liu, X.; Wei, X.; Mao, Y. Spatio-Temporal Disparity between Demand and Supply of Park Green Space Service in Urban Area of Wuhan from 2000 to 2014. Habitat Int. 2018, 71, 49–59. [Google Scholar] [CrossRef]
- Kanuganti, S.; Sarkar, A.K.; Singh, A.P. Evaluation of Access to Health Care in Rural Areas Using Enhanced Two-Step Floating Catchment Area (E2SFCA) Method. J. Transp. Geogr. 2016, 56, 45–52. [Google Scholar] [CrossRef]
- McGrail, M.R.; Humphreys, J.S. Measuring Spatial Accessibility to Primary Health Care Services: Utilising Dynamic Catchment Sizes. Appl. Geogr. 2014, 54, 182–188. [Google Scholar] [CrossRef]
- Tao, Z.; Cheng, Y.; Dai, T.; Rosenberg, M.W. Spatial Optimization of Residential Care Facility Locations in Beijing, China: Maximum Equity in Accessibility. Int. J. Health Geogr. 2014, 13, 33. [Google Scholar] [CrossRef]
- Wan, N.; Zou, B.; Sternberg, T. A Three-Step Floating Catchment Area Method for Analyzing Spatial Access to Health Services. Int. J. Geogr. Inf. Sci. 2012, 26, 1073–1089. [Google Scholar] [CrossRef]
- Luo, J. Integrating the Huff Model and Floating Catchment Area Methods to Analyze Spatial Access to Healthcare Services. Trans. GIS 2014, 18, 436–448. [Google Scholar] [CrossRef]
- Fransen, K.; Neutens, T.; De Maeyer, P.; Deruyter, G. A Commuter-Based Two-Step Floating Catchment Area Method for Measuring Spatial Accessibility of Daycare Centers. Health Place 2015, 32, 65–73. [Google Scholar] [CrossRef]
- Advance Notice of Changsha City Green Space System Planning (2021–2035). Available online: http://cgj.changsha.gov.cn/zfxxgk/tzgg/202304/t20230427_11079084.html (accessed on 9 August 2024).
- Woolley, H.; Lowe, A. Exploring the Relationship between Design Approach and Play Value of Outdoor Play Spaces. Landsc. Res. 2013, 38, 53–74. [Google Scholar] [CrossRef]
- Wang, X.; Woolley, H.; Zhang, J.; Liu, H.; Wang, Q. Scientific Exploration of Outdoor Children’s Play Space Design—Woolley & Lowe Evaluation Tool and Its Application. Chin. Landsc. Archit. 2020, 36, 86–91. [Google Scholar]
- Huff, D.L. A Probabilistic Analysis of Shopping Center Trade Areas. Land Econ. 1963, 39, 81–90. [Google Scholar] [CrossRef]
- Wang, S.; Kong, N.N.; Gao, Y. Use Mobile Location Data to Infer Airport Catchment Areas and Calibrate Huff Gravity Model in the New York Metropolitan Area. J. Transp. Geogr. 2024, 114, 103790. [Google Scholar] [CrossRef]
- Changsha City Seventh National Census Bulletin (No. 4). Available online: http://www.changsha.gov.cn/szf/ztzl/sjfb/tjgb/202106/t20210603_9988552.html?eqid=ab099f3700db0ff600000002647aa64a (accessed on 14 September 2024).
- Public Notice of the Latest Revised Version of the “Changsha City Master Plan (2003–2020). Available online: https://www.hunan.gov.cn/hnszf/xxgk/fzgh/201408/t20140806_4902778.html (accessed on 9 August 2024).
- WorldPop; Bondarenko, M. Global 100m Population Total Adjusted to Match the Corresponding UNPD Estimate; University of Southampton: Southampton, UK, 2020. [Google Scholar]
- National Bureau of Statistics of China. Yearbook. Available online: https://www.stats.gov.cn/english/Statisticaldata/yearbook/ (accessed on 5 August 2024).
- Li, Z.; Zheng, J.; Zhang, Y. Study on the Layout of 15-Minute Community-Life Circle in Third-Tier Cities Based on POI: Baoding City of Hebei Province. Engineering 2019, 11, 592–603. [Google Scholar] [CrossRef]
- Wu, H.; Wang, L.; Zhang, Z.; Gao, J. Analysis and Optimization of 15-Minute Community Life Circle Based on Supply and Demand Matching: A Case Study of Shanghai. PLoS ONE 2021, 16, e0256904. [Google Scholar] [CrossRef]
- Chen, Y.; Liu, Y.; Grekousis, G.; Qian, Z.; Vaughn, M.G.; Bingheim, E.; Yang, B.; Chen, G.; Dong, G. Examining the Non-Linear Association between the Built Environment around Residence and the Risk of Obesity among Children and Adolescents at Different School Stages in Guangzhou and Shenzhen, China. Cities 2024, 145, 104674. [Google Scholar] [CrossRef]
- No, W.; Choi, J.; Kim, Y. Children’s Walking to Urban Services: An Analysis of Pedestrian Access to Social Infrastructures and Its Relationship with Land Use. Int. J. Geogr. Inf. Sci. 2023, 37, 189–214. [Google Scholar] [CrossRef]
- Wang, Y.; Wang, Z.-O. A Fast KNN Algorithm for Text Categorization. In Proceedings of the 2007 International Conference on Machine Learning and Cybernetics, Hong Kong, China, 19–22 August 2007; pp. 3436–3441. [Google Scholar] [CrossRef]
- Andersson, E.; Langemeyer, J.; Borgström, S.; McPhearson, T.; Haase, D.; Kronenberg, J.; Barton, D.N.; Davis, M.; Naumann, S.; Röschel, L.; et al. Enabling Green and Blue Infrastructure to Improve Contributions to Human Well-Being and Equity in Urban Systems. BioScience 2019, 69, 566–574. [Google Scholar] [CrossRef]
- Huang, Y.; Lin, T.; Zhang, G.; Jones, L.; Xue, X.; Ye, H.; Liu, Y. Spatiotemporal Patterns and Inequity of Urban Green Space Accessibility and Its Relationship with Urban Spatial Expansion in China during Rapid Urbanization Period. Sci. Total Environ. 2022, 809, 151123. [Google Scholar] [CrossRef]
- Vaz, E.; Anthony, A.; McHenry, M. The Geography of Environmental Injustice. Habitat Int. 2017, 59, 118–125. [Google Scholar] [CrossRef]
- Zhou, X.; Wang, Y.-C. Spatial–Temporal Dynamics of Urban Green Space in Response to Rapid Urbanization and Greening Policies. Landsc. Urban Plan. 2011, 100, 268–277. [Google Scholar] [CrossRef]
- Tappe, K.A.; Glanz, K.; Sallis, J.F.; Zhou, C.; Saelens, B.E. Children’s Physical Activity and Parents’ Perception of the Neighborhood Environment: Neighborhood Impact on Kids Study. Int. J. Behav. Nutr. Phys. Act. 2013, 10, 39. [Google Scholar] [CrossRef] [PubMed]
- D’Haese, S.; Vanwolleghem, G.; Hinckson, E.; De Bourdeaudhuij, I.; Deforche, B.; Van Dyck, D.; Cardon, G. Cross-Continental Comparison of the Association between the Physical Environment and Active Transportation in Children: A Systematic Review. Int. J. Behav. Nutr. Phys. Act. 2015, 12, 145. [Google Scholar] [CrossRef]
- Jim, C.Y.; Shan, X. Socioeconomic Effect on Perception of Urban Green Spaces in Guangzhou, China. Cities 2013, 31, 123–131. [Google Scholar] [CrossRef]
- Wang, D.; Brown, G.; Zhong, G.; Liu, Y.; Mateo-Babiano, I. Factors Influencing Perceived Access to Urban Parks: A Comparative Study of Brisbane (Australia) and Zhongshan (China). Habitat Int. 2015, 50, 335–346. [Google Scholar] [CrossRef]


| Method | Author(s) | Characteristics | Advantages | Disadvantages | Application Area |
|---|---|---|---|---|---|
| Buffer Analysis | Bertram et al. (2015) [58] | Simple calculation | Simple calculation | Ignores the suppressive effects of spatial road networks | Green space accessibility |
| Gravity Model | Xia et al.(2018) [59]; Xia et al. (2022) [60]; Chang et al. (2011) [61] | Provides a comprehensive method for calculating park area and distance | Considers both distance and park area | Different metrics are chosen | Green space accessibility |
| Network Analysis | Wolff(2021) [62] | Depends on a complete traffic system network with complex calculations | Accurate results | Depends on a complete traffic system network, complex calculations | Transportation accessibility |
| 2SFCA | Radke et al. (2000) [63]; Wu et al. (2020) [64]; Luo et al. (2003) [54] | Considers facility supply capacity, resident demand, and spatial impedance, facilitating accessibility calculation | Considers facility supply capacity, resident demand, and spatial impedance, facilitating accessibility calculation | Ignores distance decay effects and actual resistance within the catchment area | Green space accessibility, medical facility accessibility, commercial facility accessibility |
| Gaussian Two-Step Floating Catchment Area (G2SFCA) | Dai (2010) [55]; Xiao et al. (2021) [65]; Dong et al. (2022) [66] | Introduces Gaussian function, optimizes the 2SFCA method, considers different spatial decay rules and diverse transportation modes | Improves accessibility calculation accuracy, considers different spatial decay rules and diverse transportation modes | Requires consideration of different spatial decay rules and diverse transportation modes | Medical facility accessibility, commercial facility accessibility, urban open space accessibility |
| Improvement Aspect | Method | Proposer(s) | Characteristics | Description |
|---|---|---|---|---|
| Distance Decay Problem | E2SFCA | Luo et al. (2009) [67] | Time Interval Segmentation | Divides service areas into multiple time intervals and assigns different weights. |
| G2SFCA | Dai (2010) [55] | Gaussian Function | Uses a Gaussian function to assess potential accessibility, with a continuously decreasing supply–demand ratio based on distance. | |
| KD2SFCA | Dai (2011) [68] | Kernel Density Function | Uses a kernel density function to assess potential accessibility, with a continuously decreasing supply-demand ratio based on distance. | |
| E2SFCA | Kanuganti et al. (2016) [73] | Distance Decay Impedance Function | Introduces a distance decay impedance function to distinguish the accessibility of medical services in rural areas. | |
| Search Radius Extension | V2SFCA | Luo et al. (2012) [69] | Variable Search Radius | Adjusts the search radius to cover a sufficient supply–demand scale. |
| D2SFCA | McGrail et al. (2014) [74] | Dynamic Search Radius | Sets different search radii based on regional population density. | |
| MC2SFCA | Tao et al. (2014) [75] | Multiple Service Area Radii | Sets different search radii based on the scale of public facilities. | |
| Supply and Demand Quantification | VFCA | Dony et al. (2015) [57] | Variable Width FCA | Calculates attraction coefficients based on park size and facilities but does not consider competition between service sites. |
| 3SFCA | Wan et al. (2012) [76] | Three-Step Floating Catchment Area Method | Reduces the overestimation of population demand by dividing service areas into several sub-zones and assigning Gaussian weights. | |
| Huff Model FCA | Luo (2014) [77] | Huff Model | Quantifies demand by expressing the probability of service choice. | |
| i2SFCA | Wang (2018) [70] | Inverse 2SFCA | Extends from the Huff model to capture the “congestion” of facilities. | |
| Multiple Transportation Modes | MM2SFCA | Mao et al. (2013) [71]; Xing et al. (2018) [72] | Multiple Transportation Modes | Traditional 2SFCA methods consider multiple transportation modes using weighted average travel time. |
| CB2SFCA | Fransen et al. (2015) [78] | Commuting-Based 2SFCA | Assumes that demand is not fixed but varies according to commuting behavior. |
| Categories | Variables | Maximum Value |
|---|---|---|
| Play diversity | Playground number | 2 |
| Sport fields | 2 | |
| Sport courts | 2 | |
| Hiking and walking trails | 1 | |
| Public swimming pool | 1 | |
| Supporting facilities | 2 | |
| Ornamental water features | 1 | |
| Recreational water features | 1 | |
| Environmental characteristic | Entrances | 1 |
| Boundaries | 1 | |
| Supervision areas | 1 | |
| Available for all age groups | 1 |
Disclaimer/Publisher’s Note: The statements, opinions and data contained in all publications are solely those of the individual author(s) and contributor(s) and not of MDPI and/or the editor(s). MDPI and/or the editor(s) disclaim responsibility for any injury to people or property resulting from any ideas, methods, instructions or products referred to in the content. |
© 2024 by the authors. Licensee MDPI, Basel, Switzerland. This article is an open access article distributed under the terms and conditions of the Creative Commons Attribution (CC BY) license (https://creativecommons.org/licenses/by/4.0/).
Share and Cite
Liao, Y.; Furuya, K. A Case Study on Children’s Accessibility in Urban Parks in Changsha City, China: Developing an Improved 2SFCA Method. Land 2024, 13, 1522. https://doi.org/10.3390/land13091522
Liao Y, Furuya K. A Case Study on Children’s Accessibility in Urban Parks in Changsha City, China: Developing an Improved 2SFCA Method. Land. 2024; 13(9):1522. https://doi.org/10.3390/land13091522
Chicago/Turabian StyleLiao, Yuhui, and Katsunori Furuya. 2024. "A Case Study on Children’s Accessibility in Urban Parks in Changsha City, China: Developing an Improved 2SFCA Method" Land 13, no. 9: 1522. https://doi.org/10.3390/land13091522