
The Impacts of Urban Population Growth and Shrinkage on the Urban Land Use Efficiency: A Case Study of the Northeastern Region of China

Abstract
1. Introduction
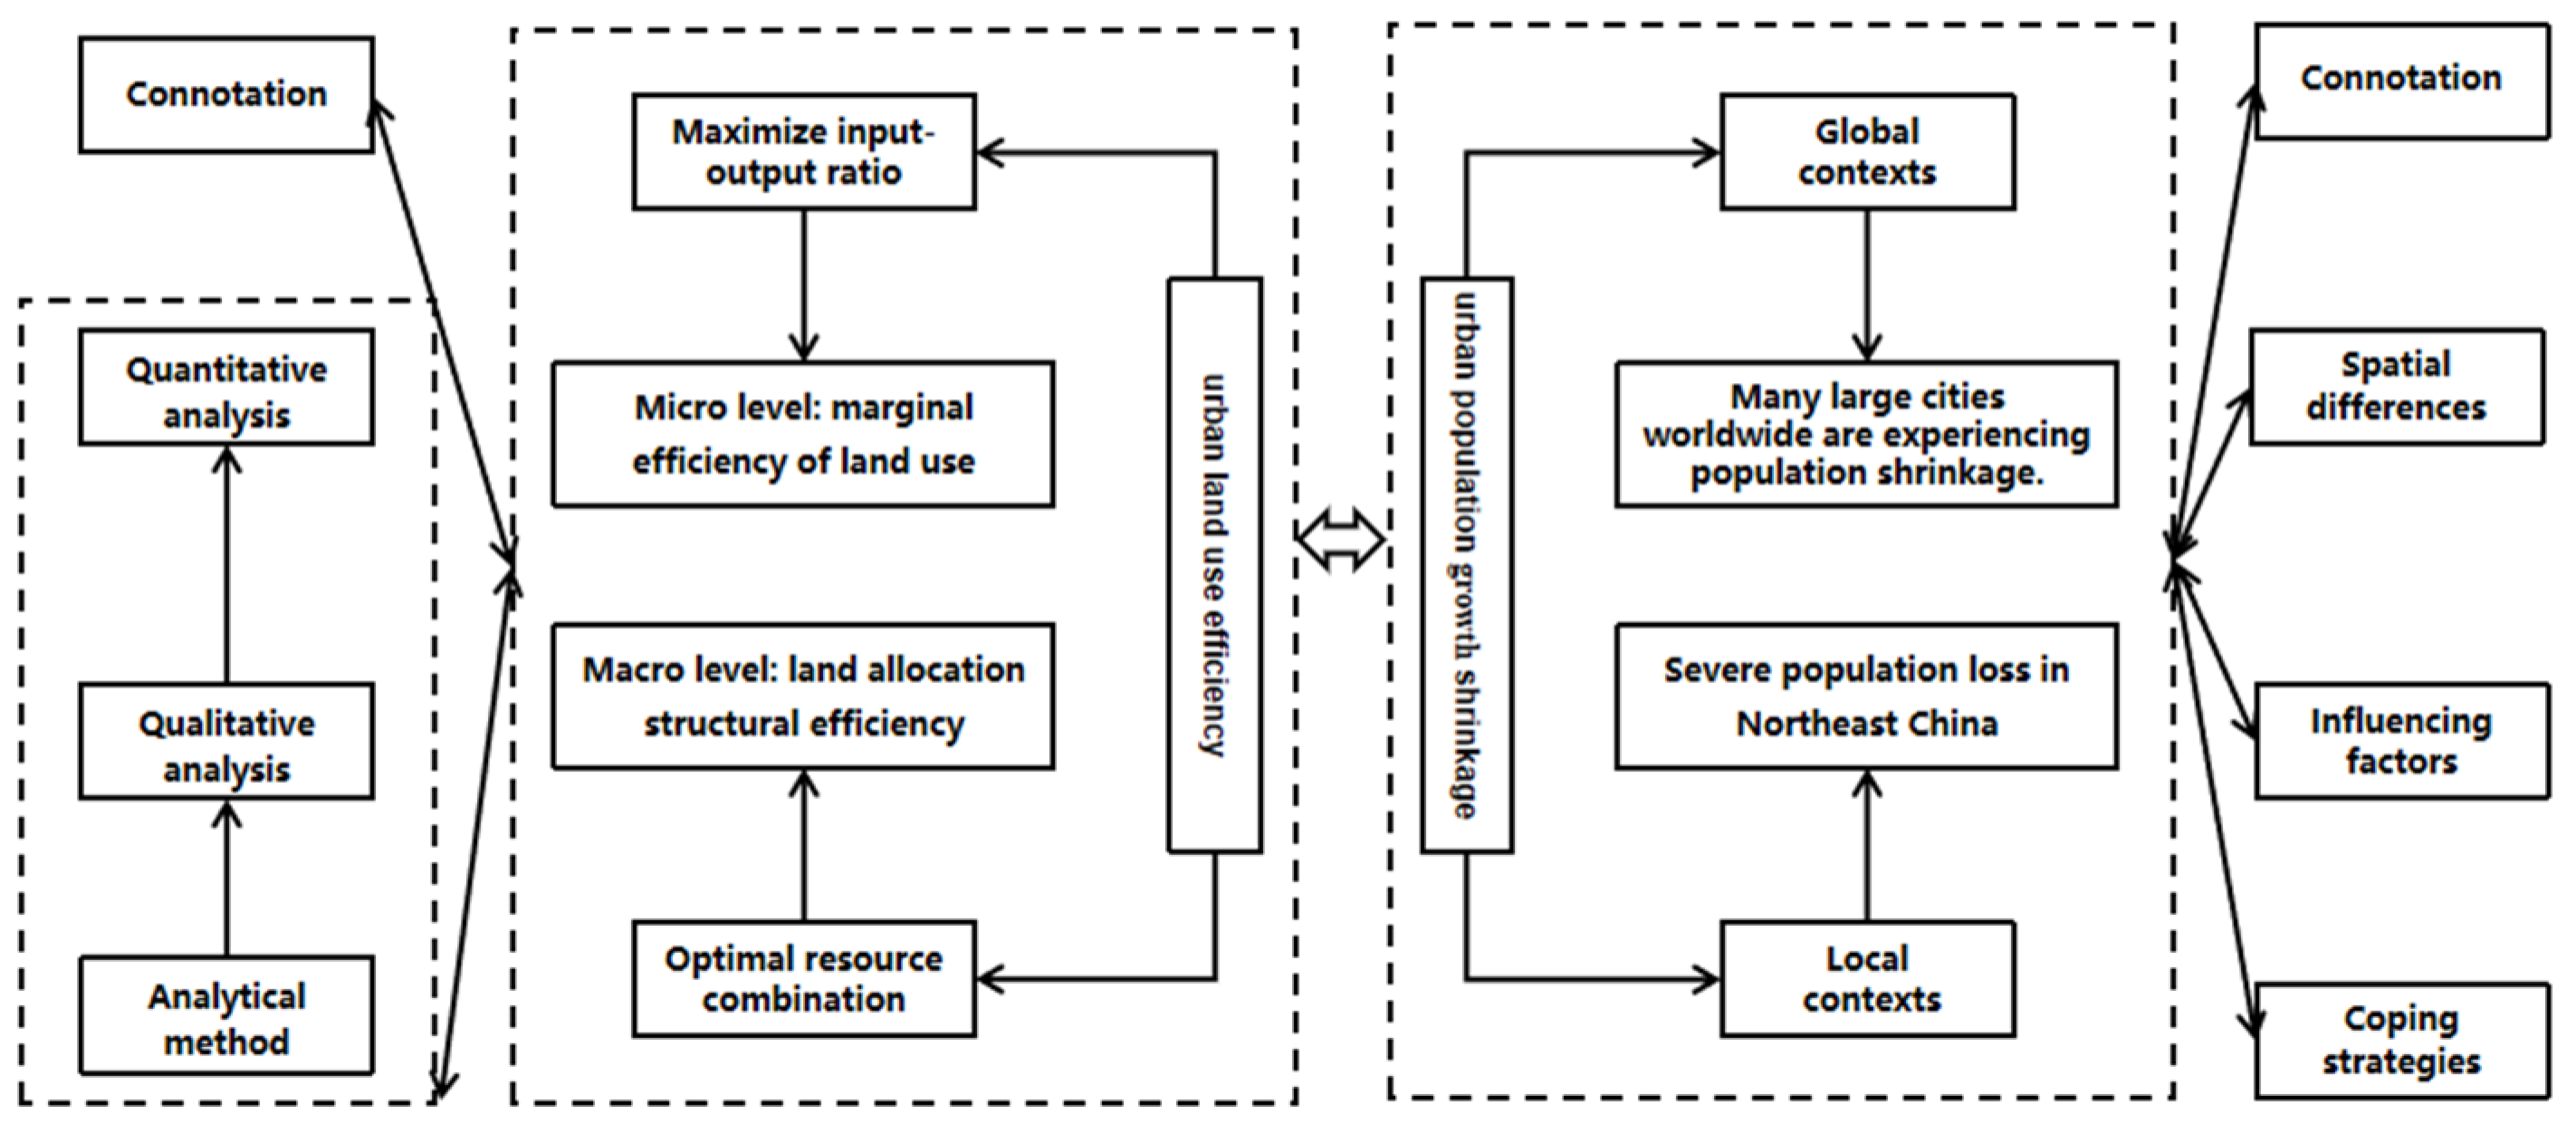
2. Literature Review and Theoretical Framework
2.1. Understanding Urban Population Growth and Shrinkage
2.2. Understanding the Urban Land Use Efficiency
2.3. Understanding the Relationship between UPGS and ULUE
2.3.1. Direct Impacts of UPGS on the ULUE
2.3.2. Mediating Effects of UPGS on the ULUE
2.3.3. Spatial Effects of UPGS on ULUE
3. Materials and Methods
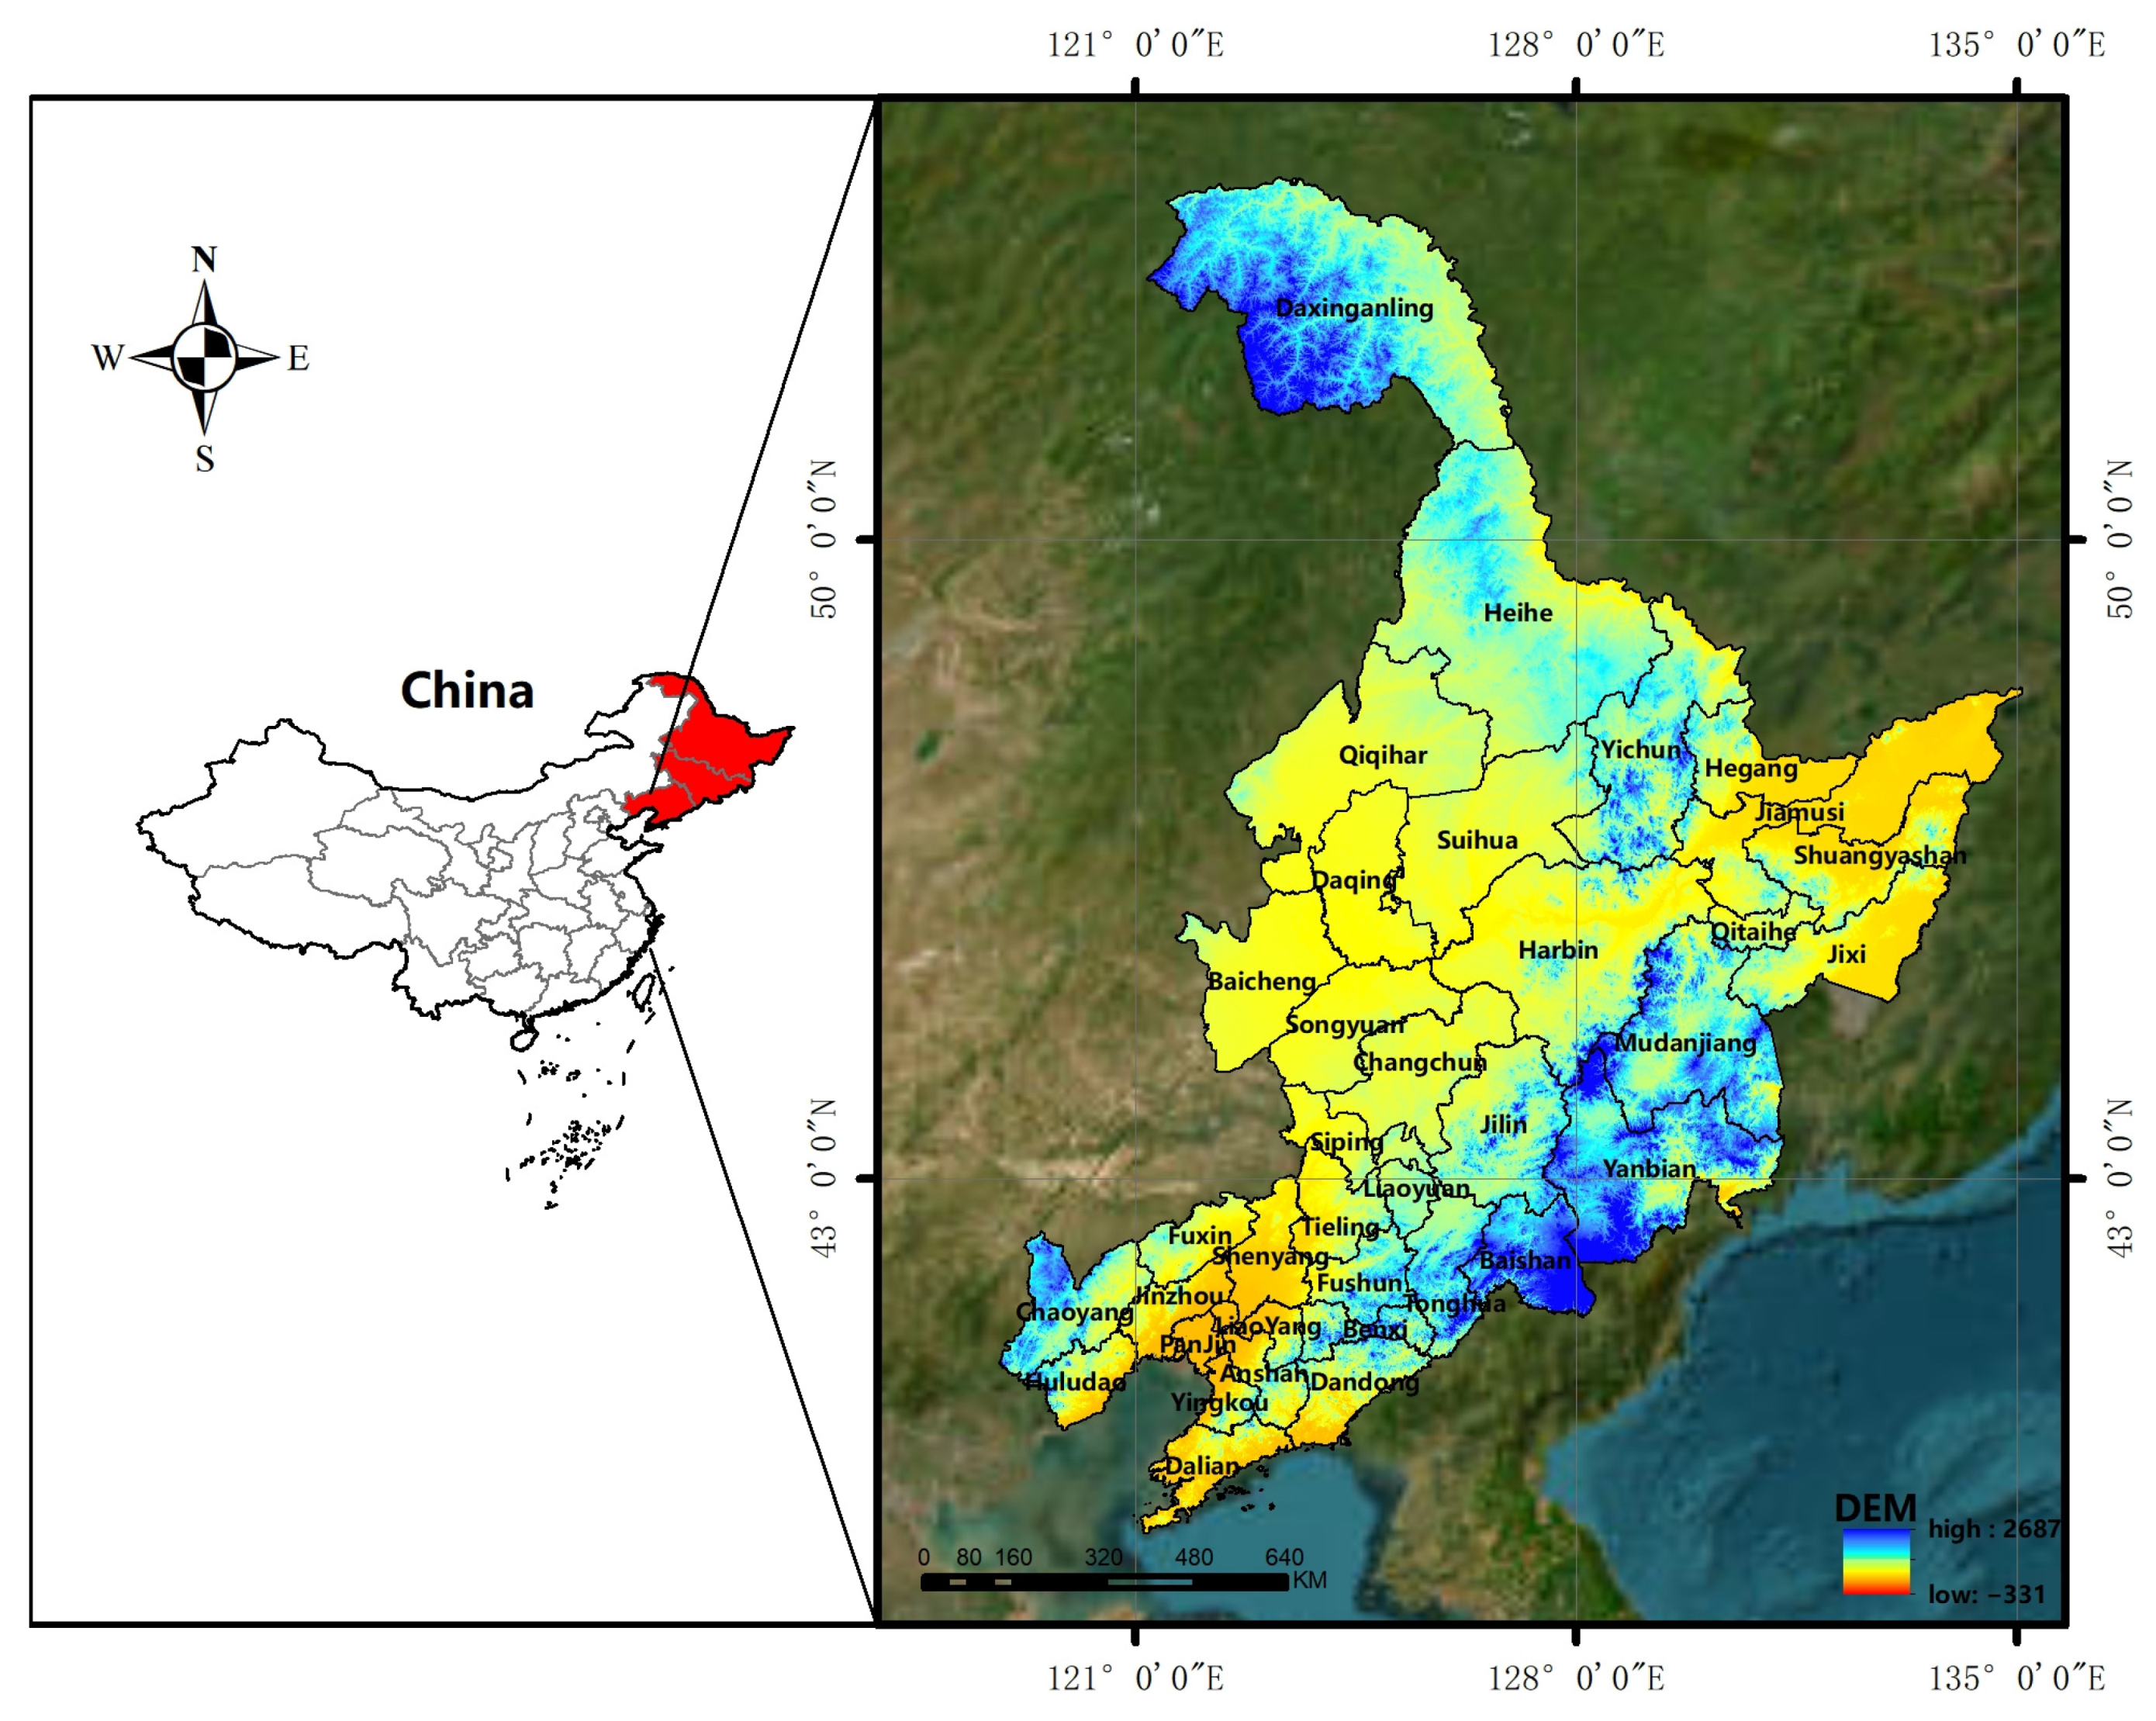
3.1. Study Area
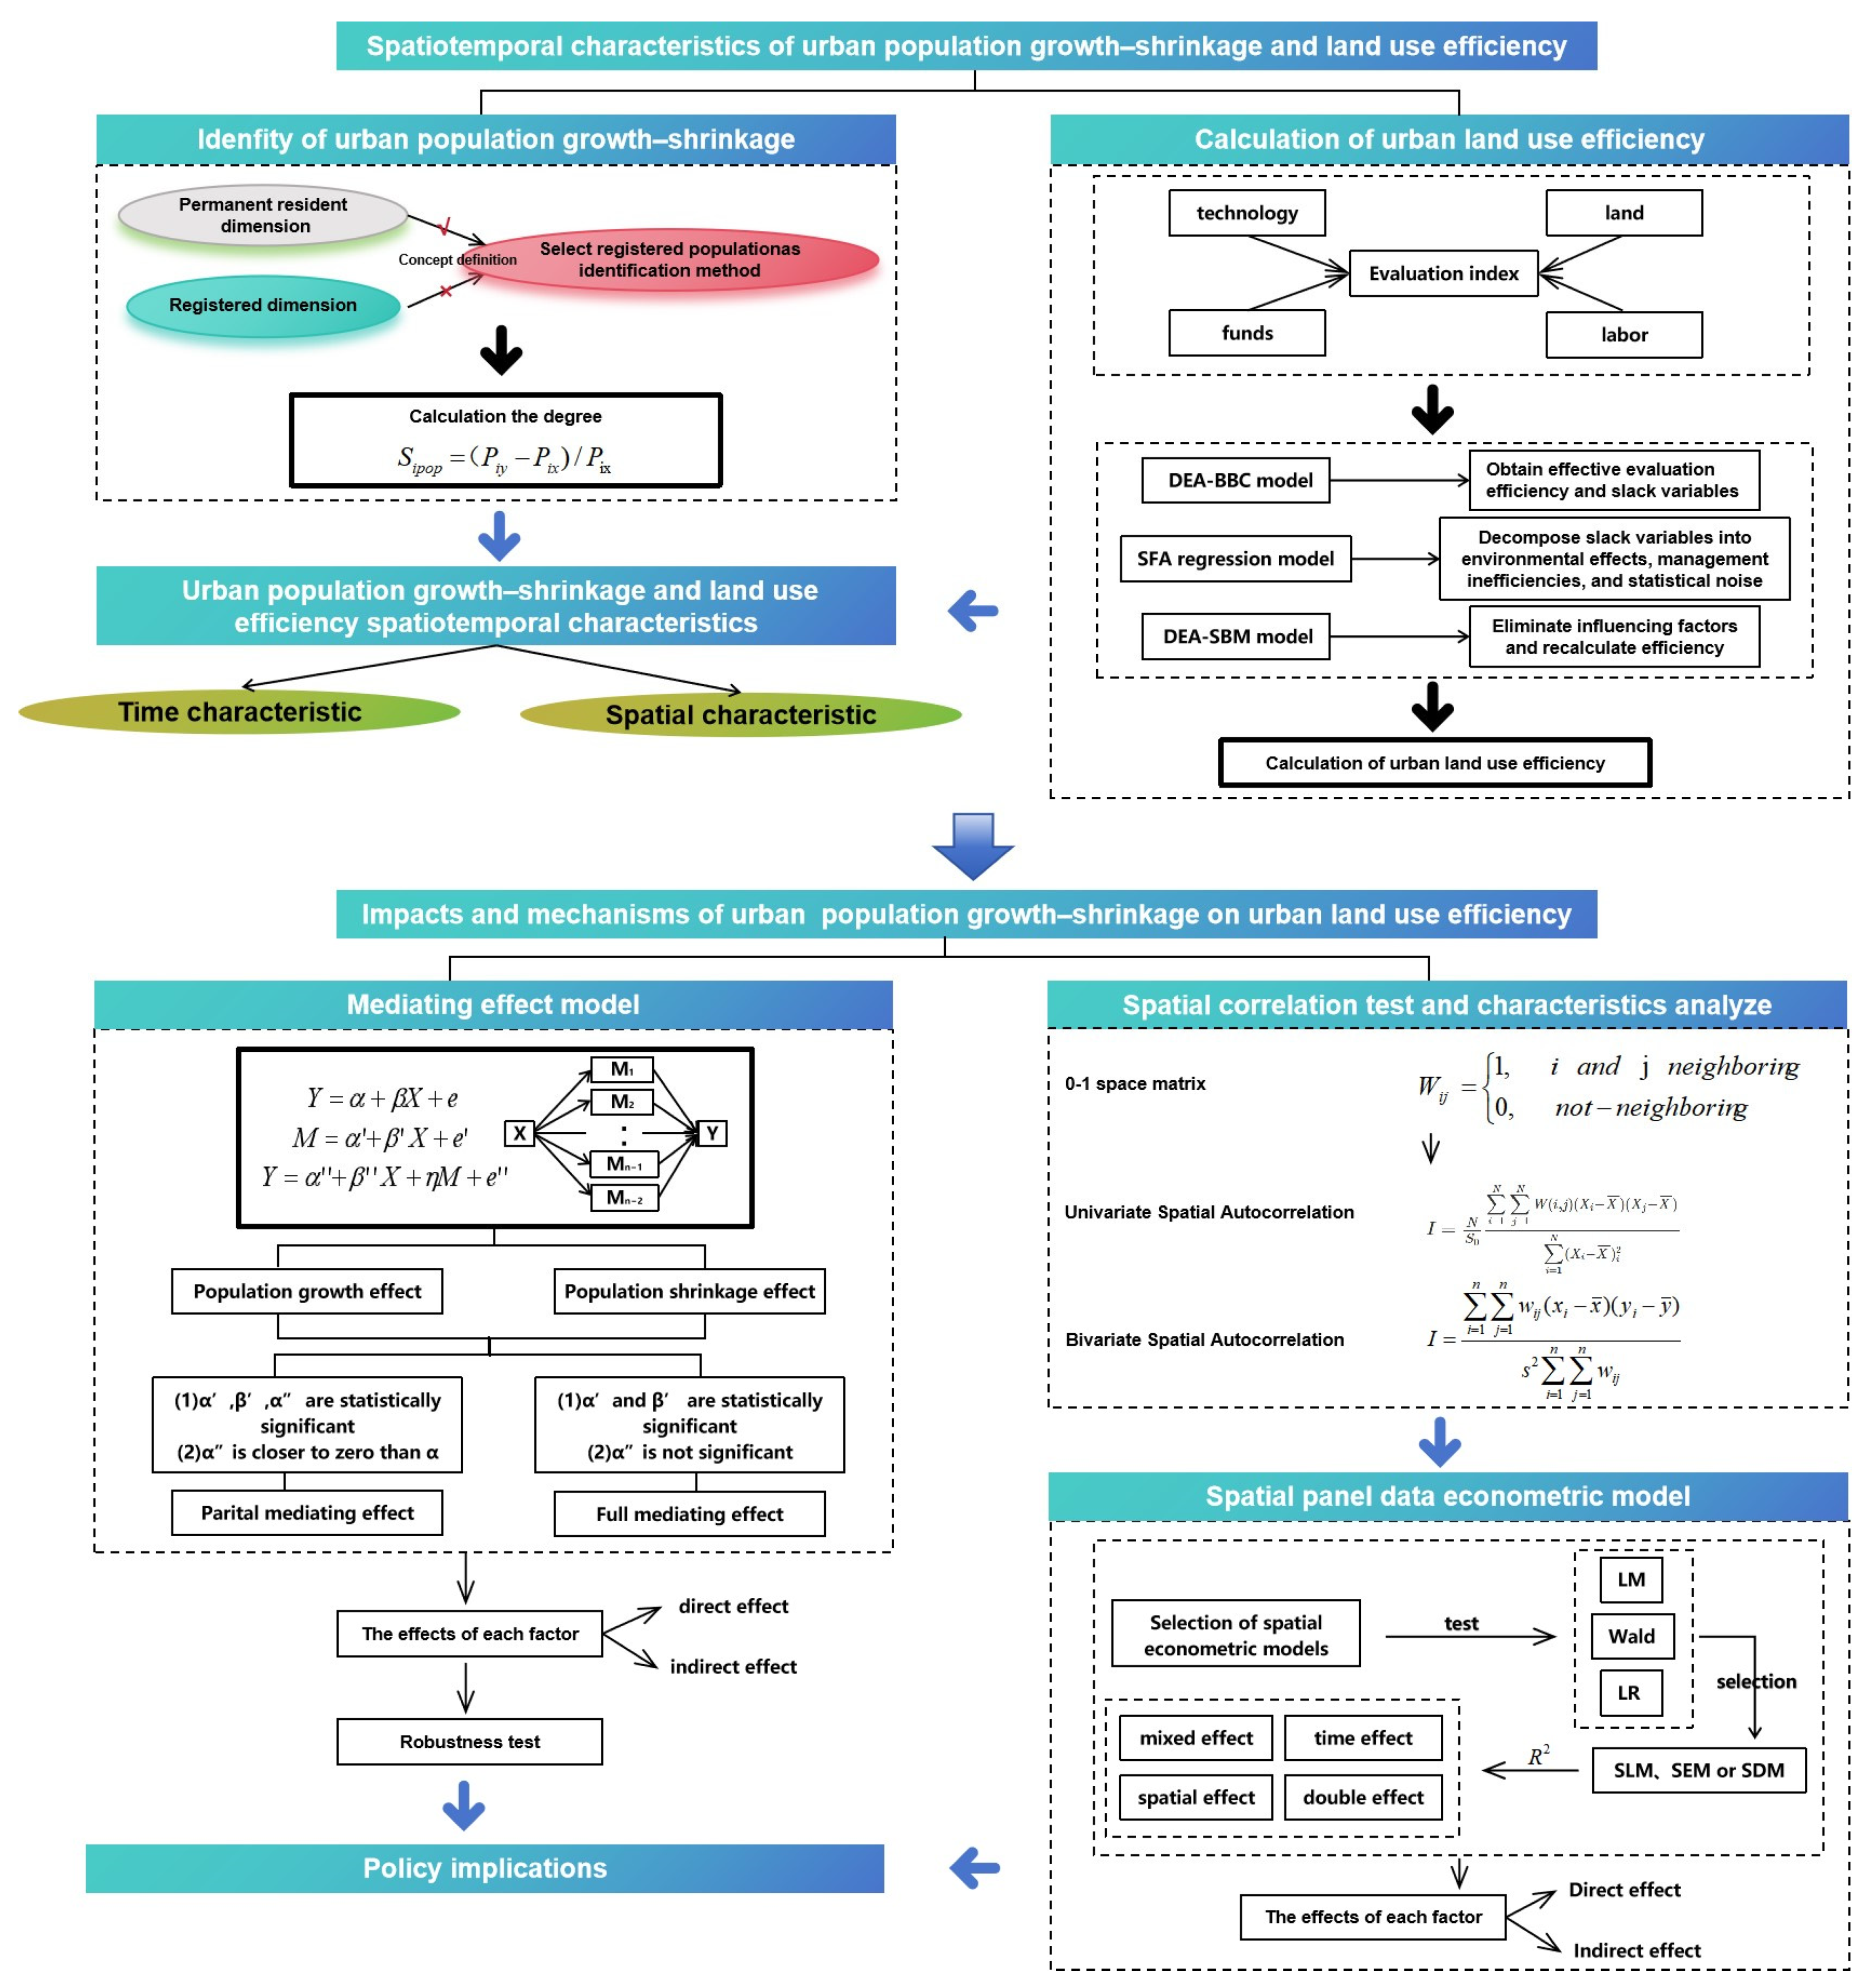
3.2. Methods
3.2.1. Measurement of Population Growth and Shrinkage
3.2.2. Three-Stage SBM-DEA Model for Measuring ULUE
3.2.3. Mediating Effect Model
3.2.4. Spatial Econometric Model
3.3. Data Sources and Processing
4. Results
4.1. Spatiotemporal Characteristics of ULUE and UPGS
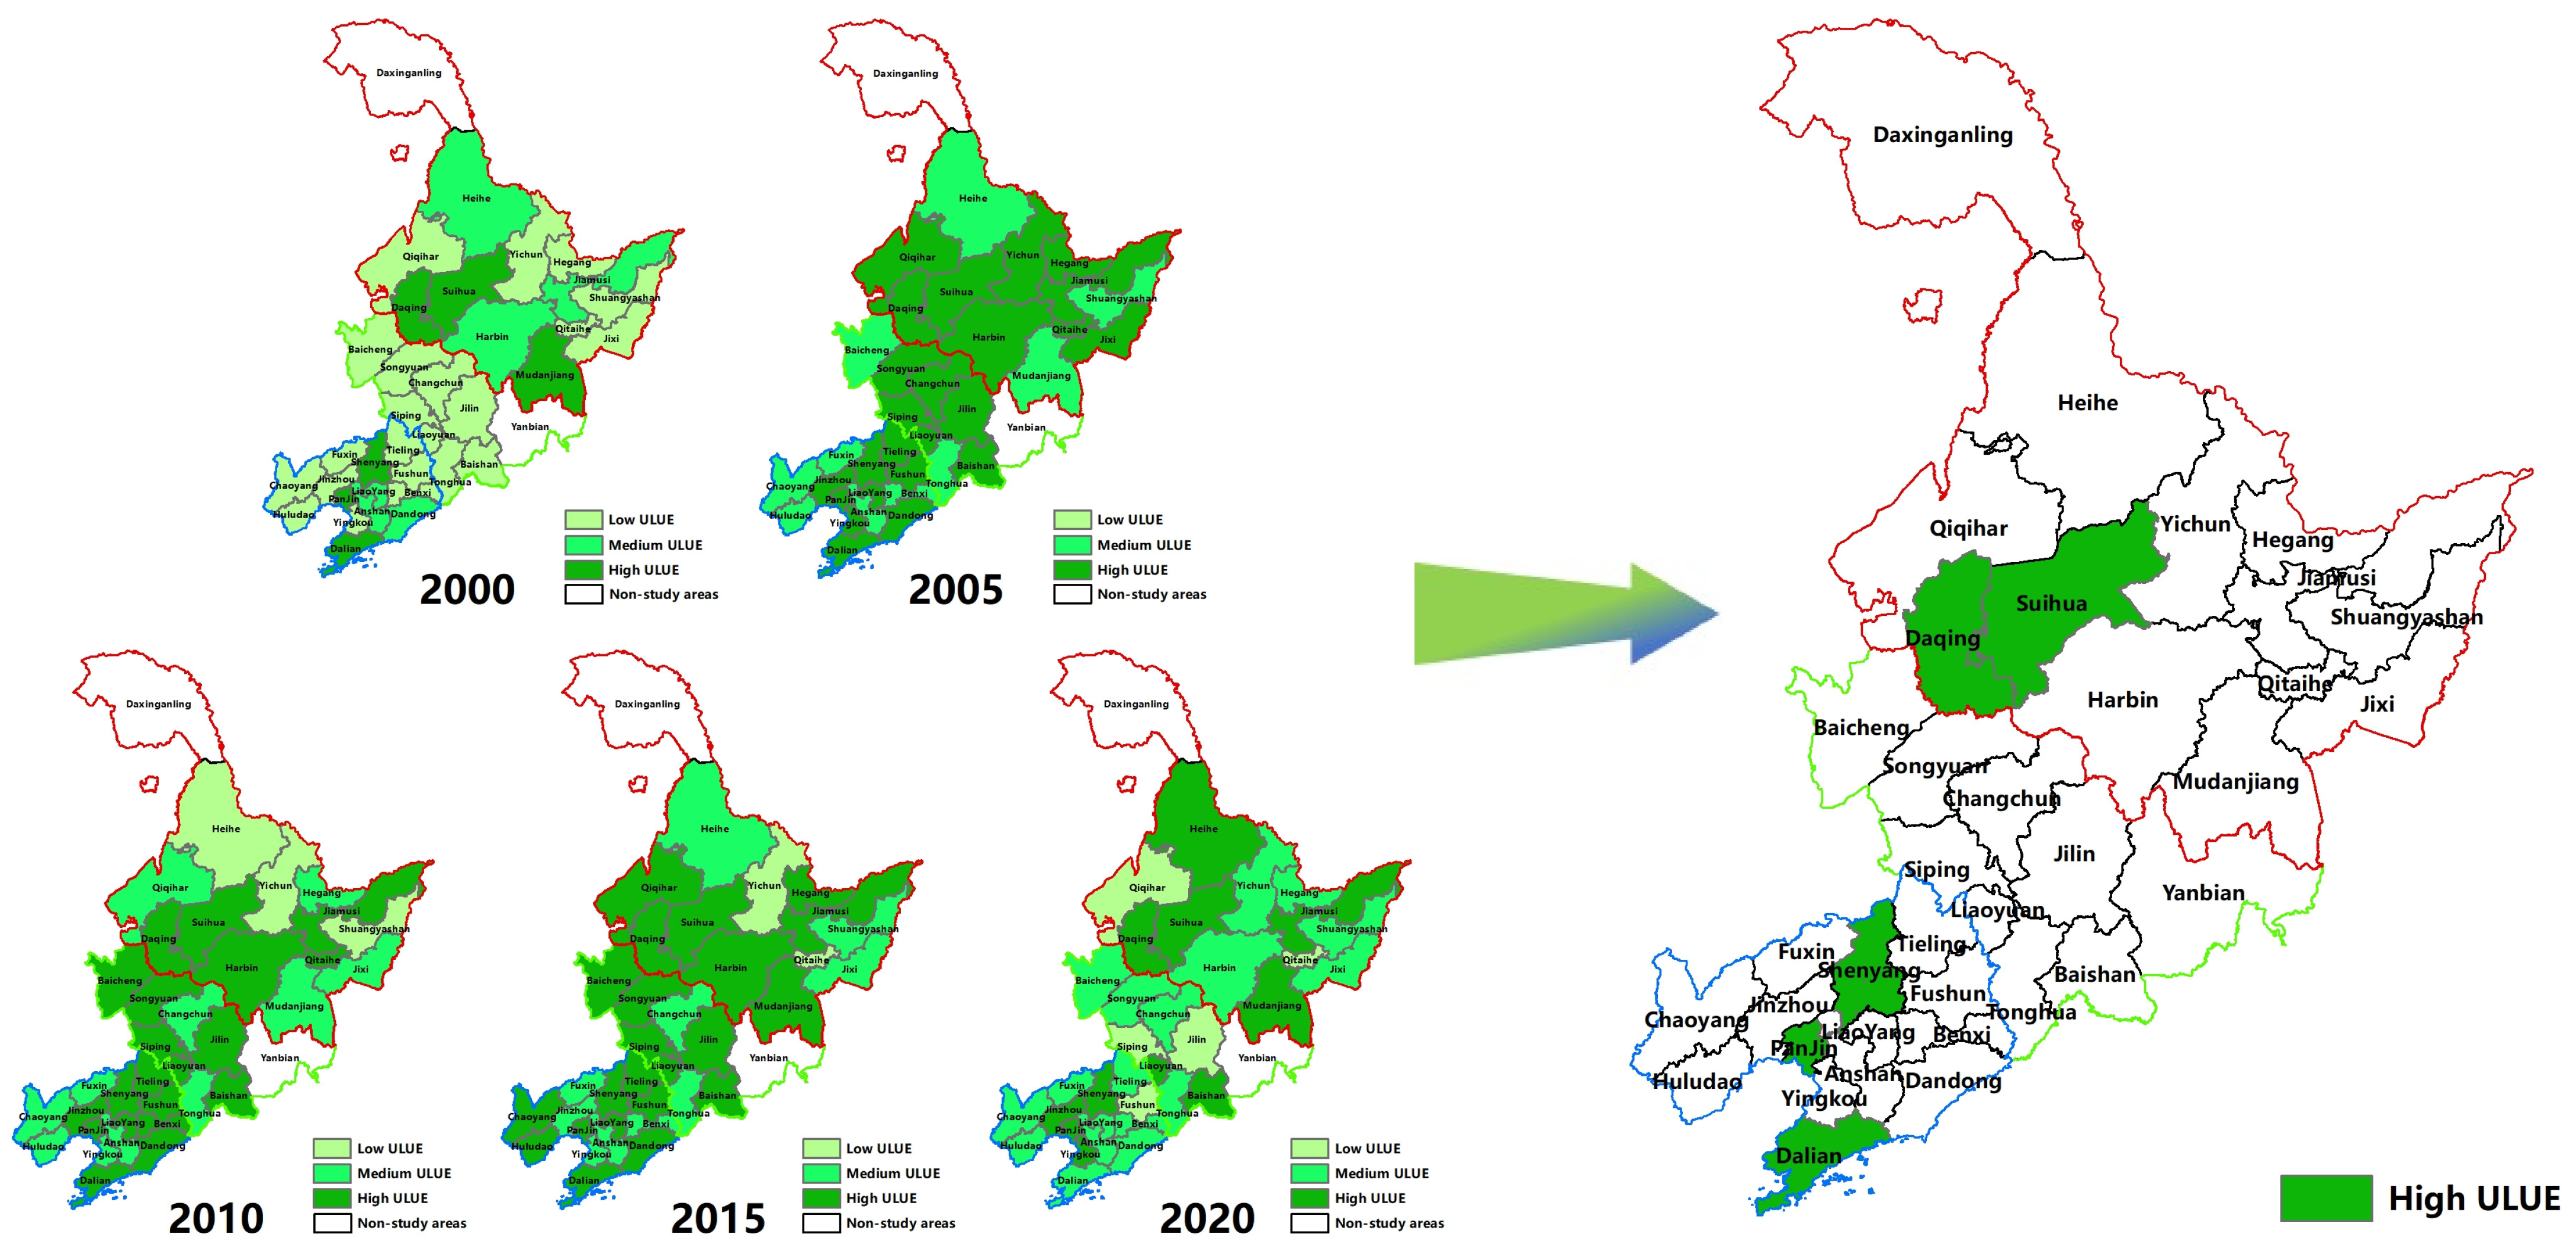
4.1.1. Spatiotemporal Characteristics of ULUE
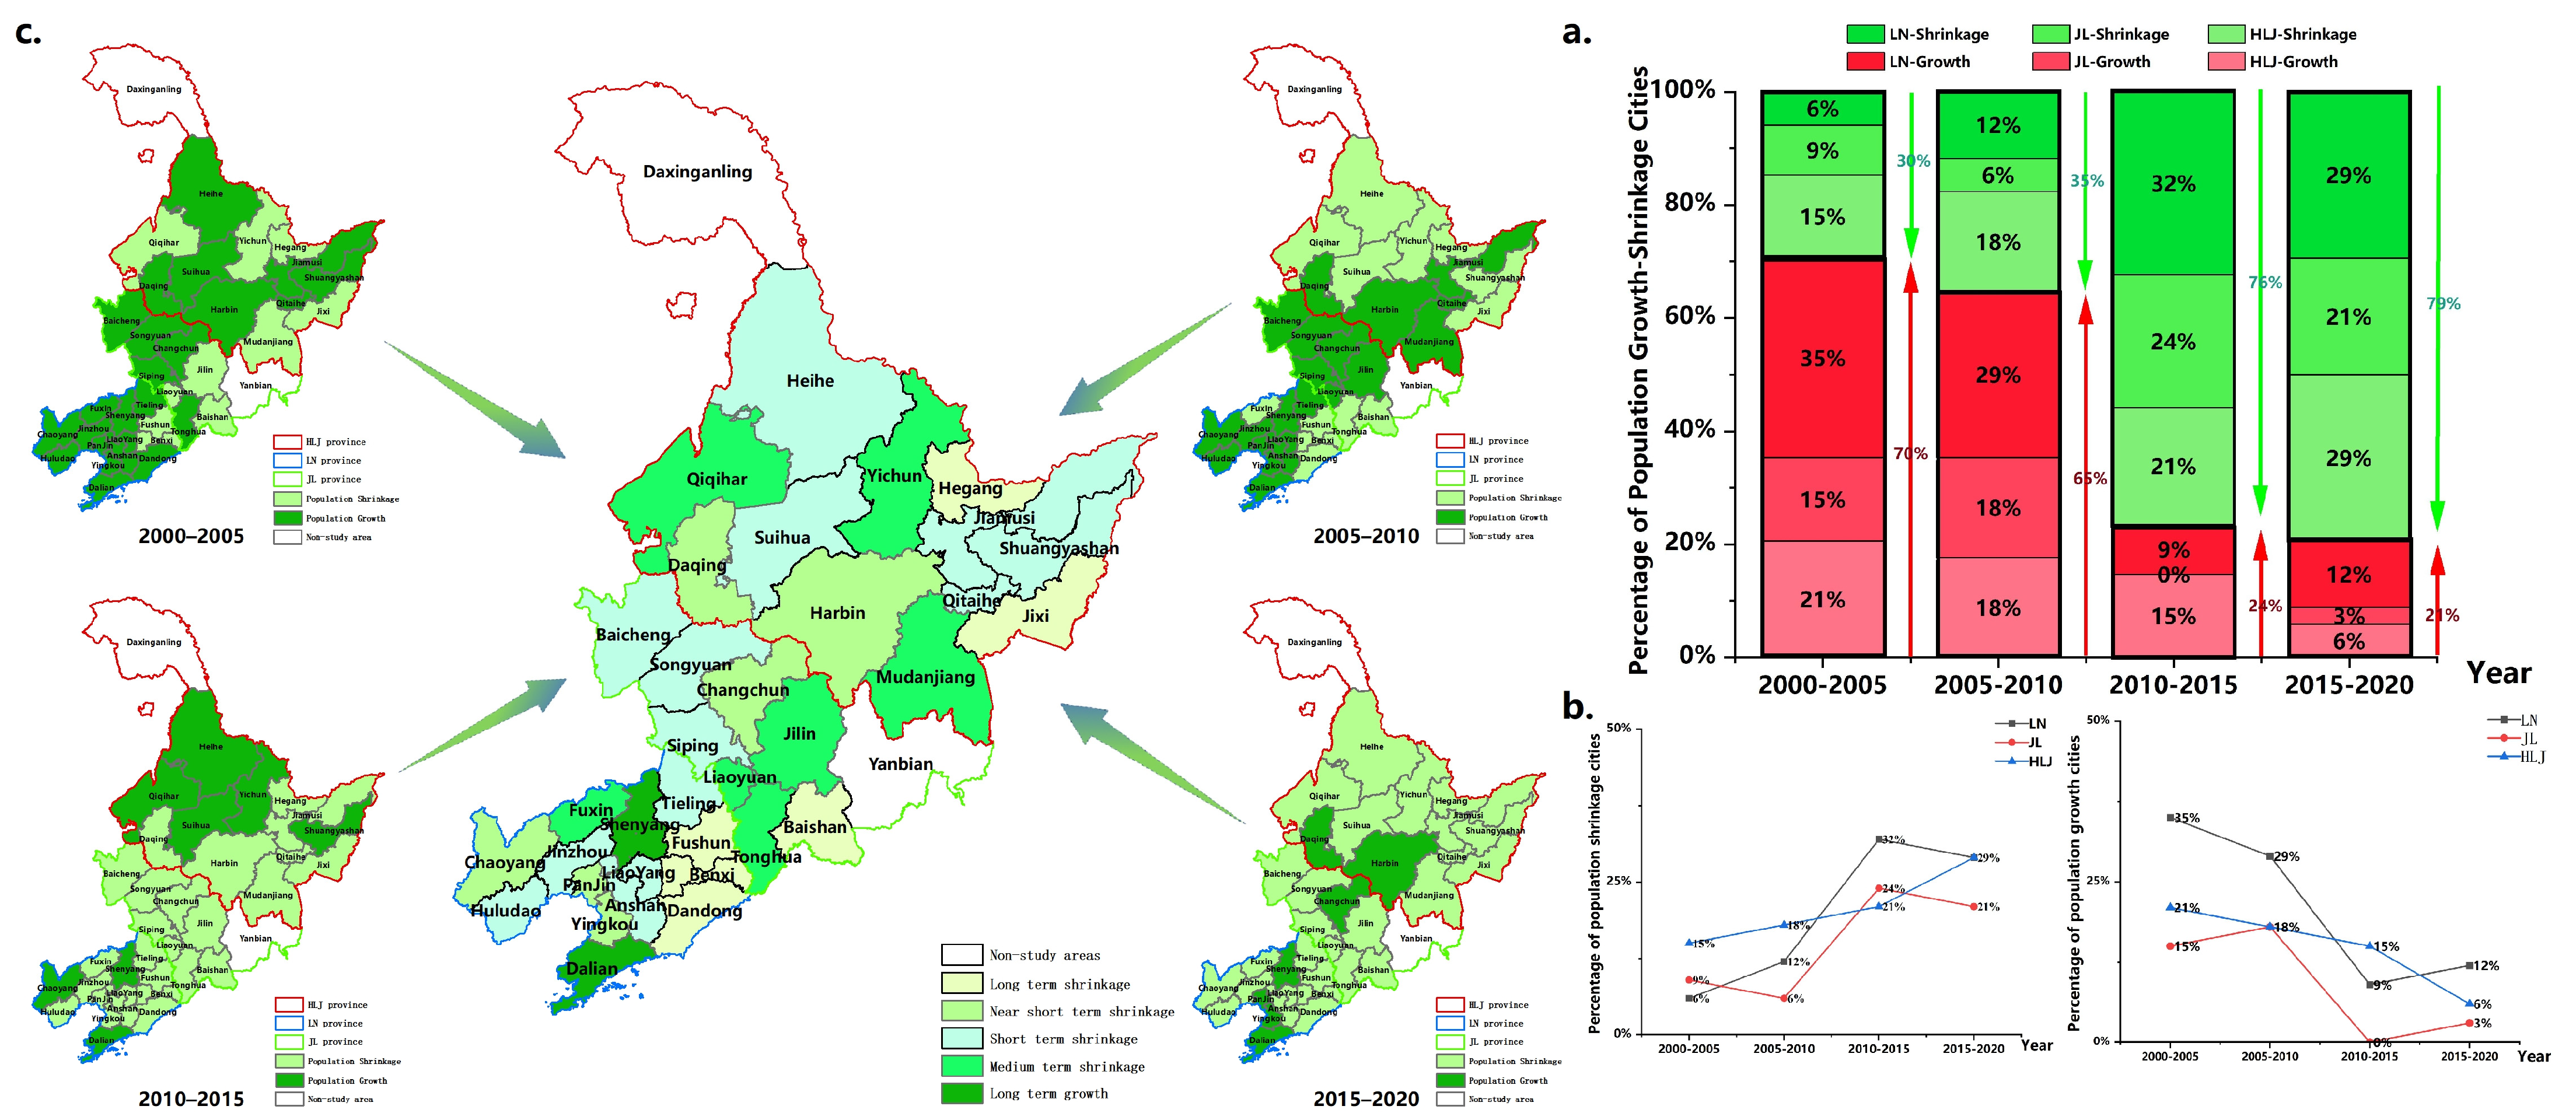
4.1.2. Spatiotemporal Characteristics of UPGS
4.2. Mediating Effects of UPGS on ULUE
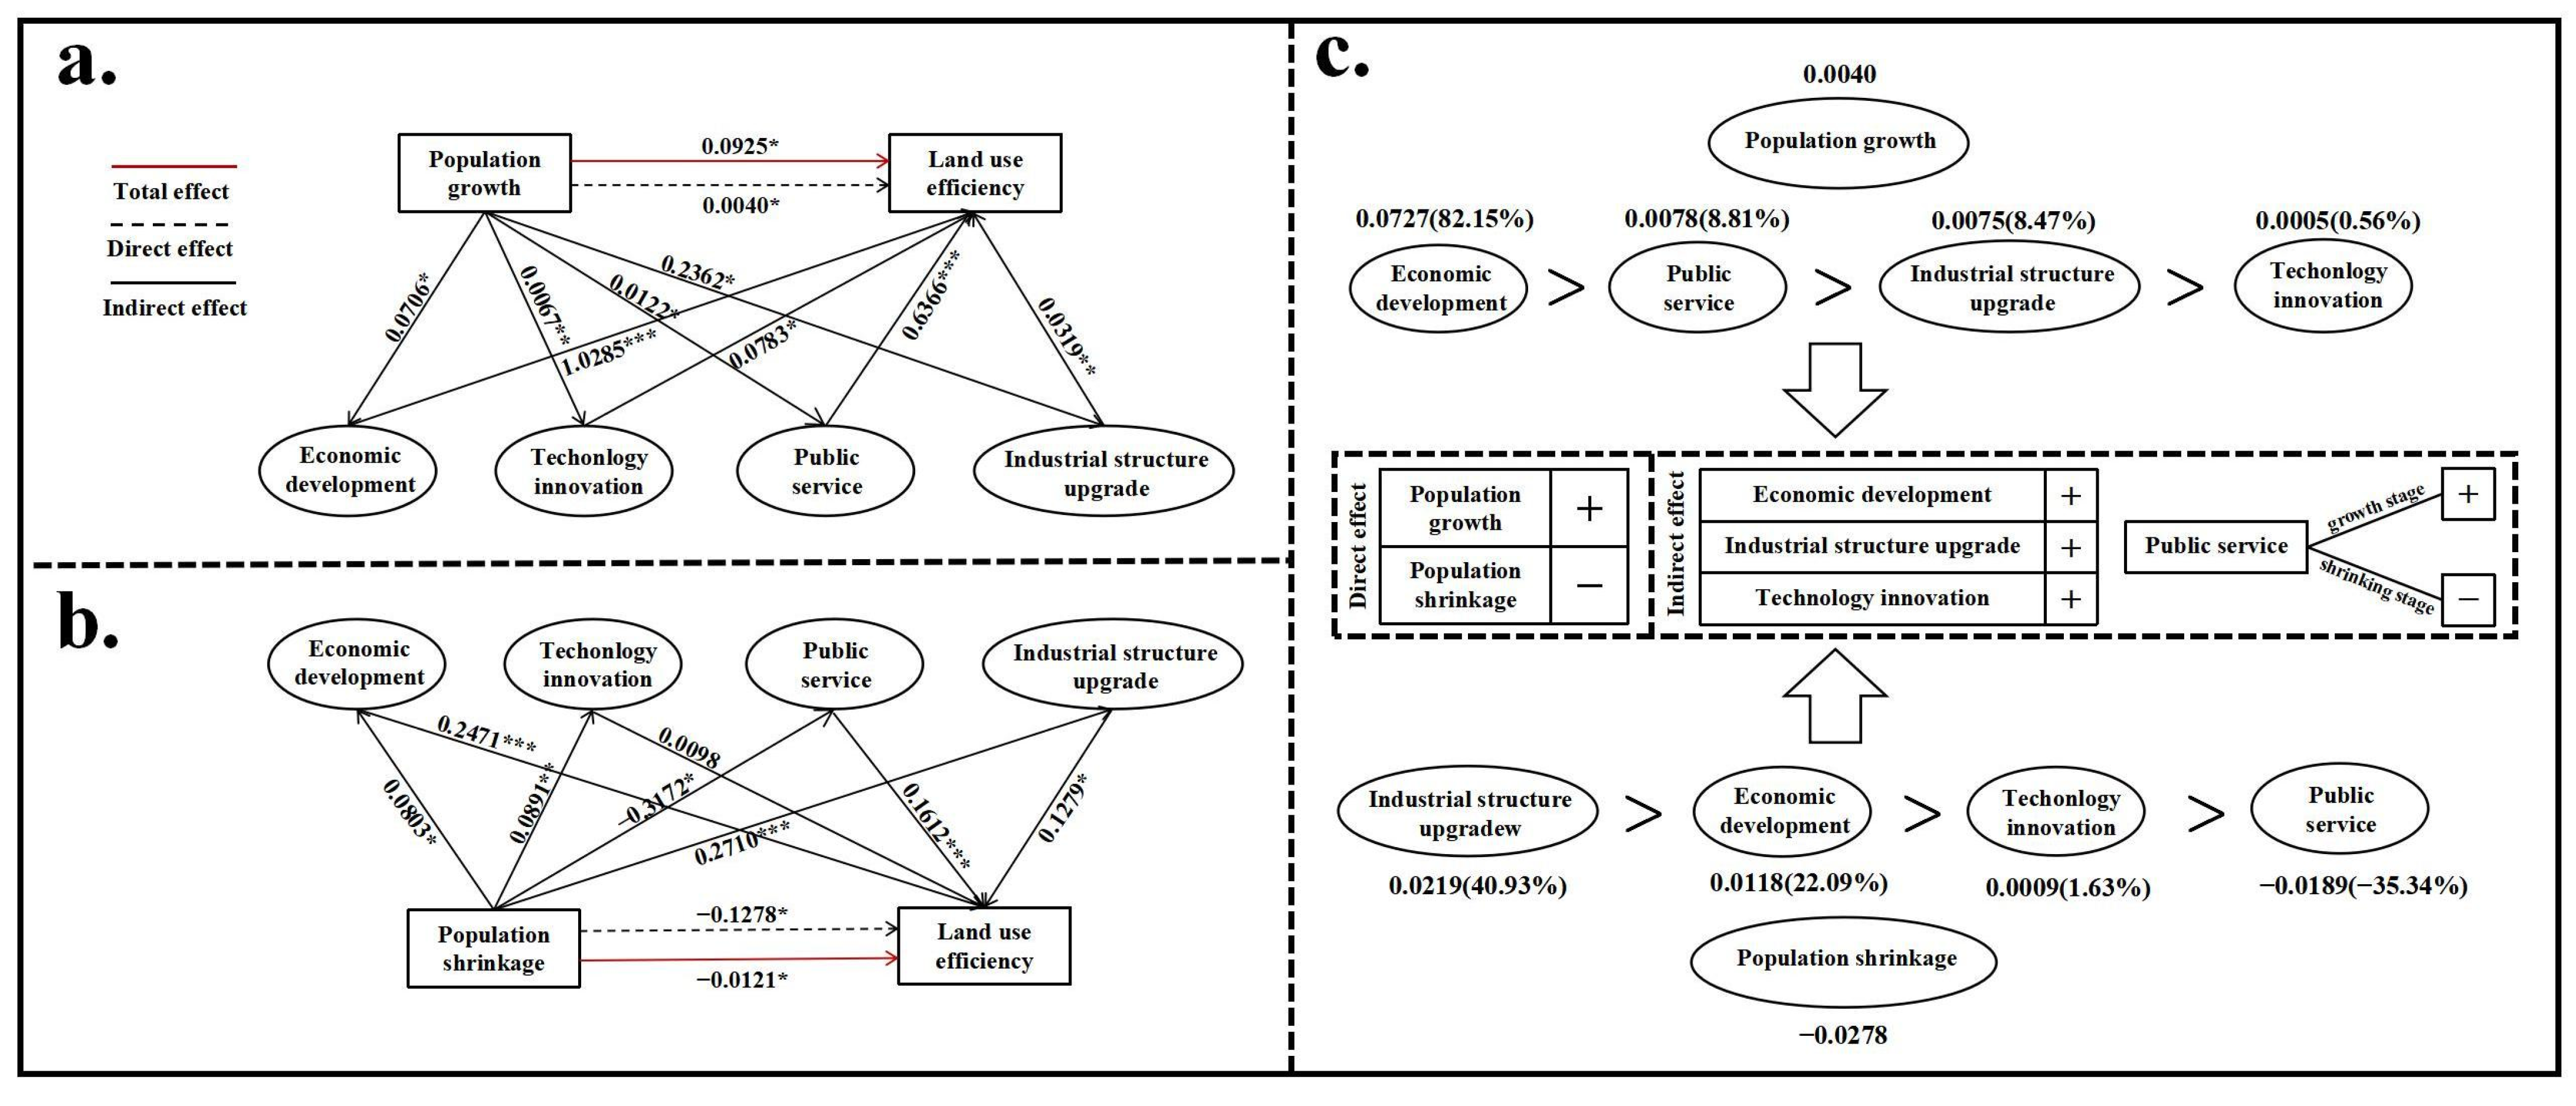
4.2.1. Analysis of the Mediating Effect
4.2.2. Analysis of the Mediating Effect of Urban Population Growth
4.2.3. Analysis of the Mediating Effect of Urban Population Shrinkage
4.2.4. Comparative Analysis of the Direct and Mediating Effects of Urban Population Growth and Shrinkage
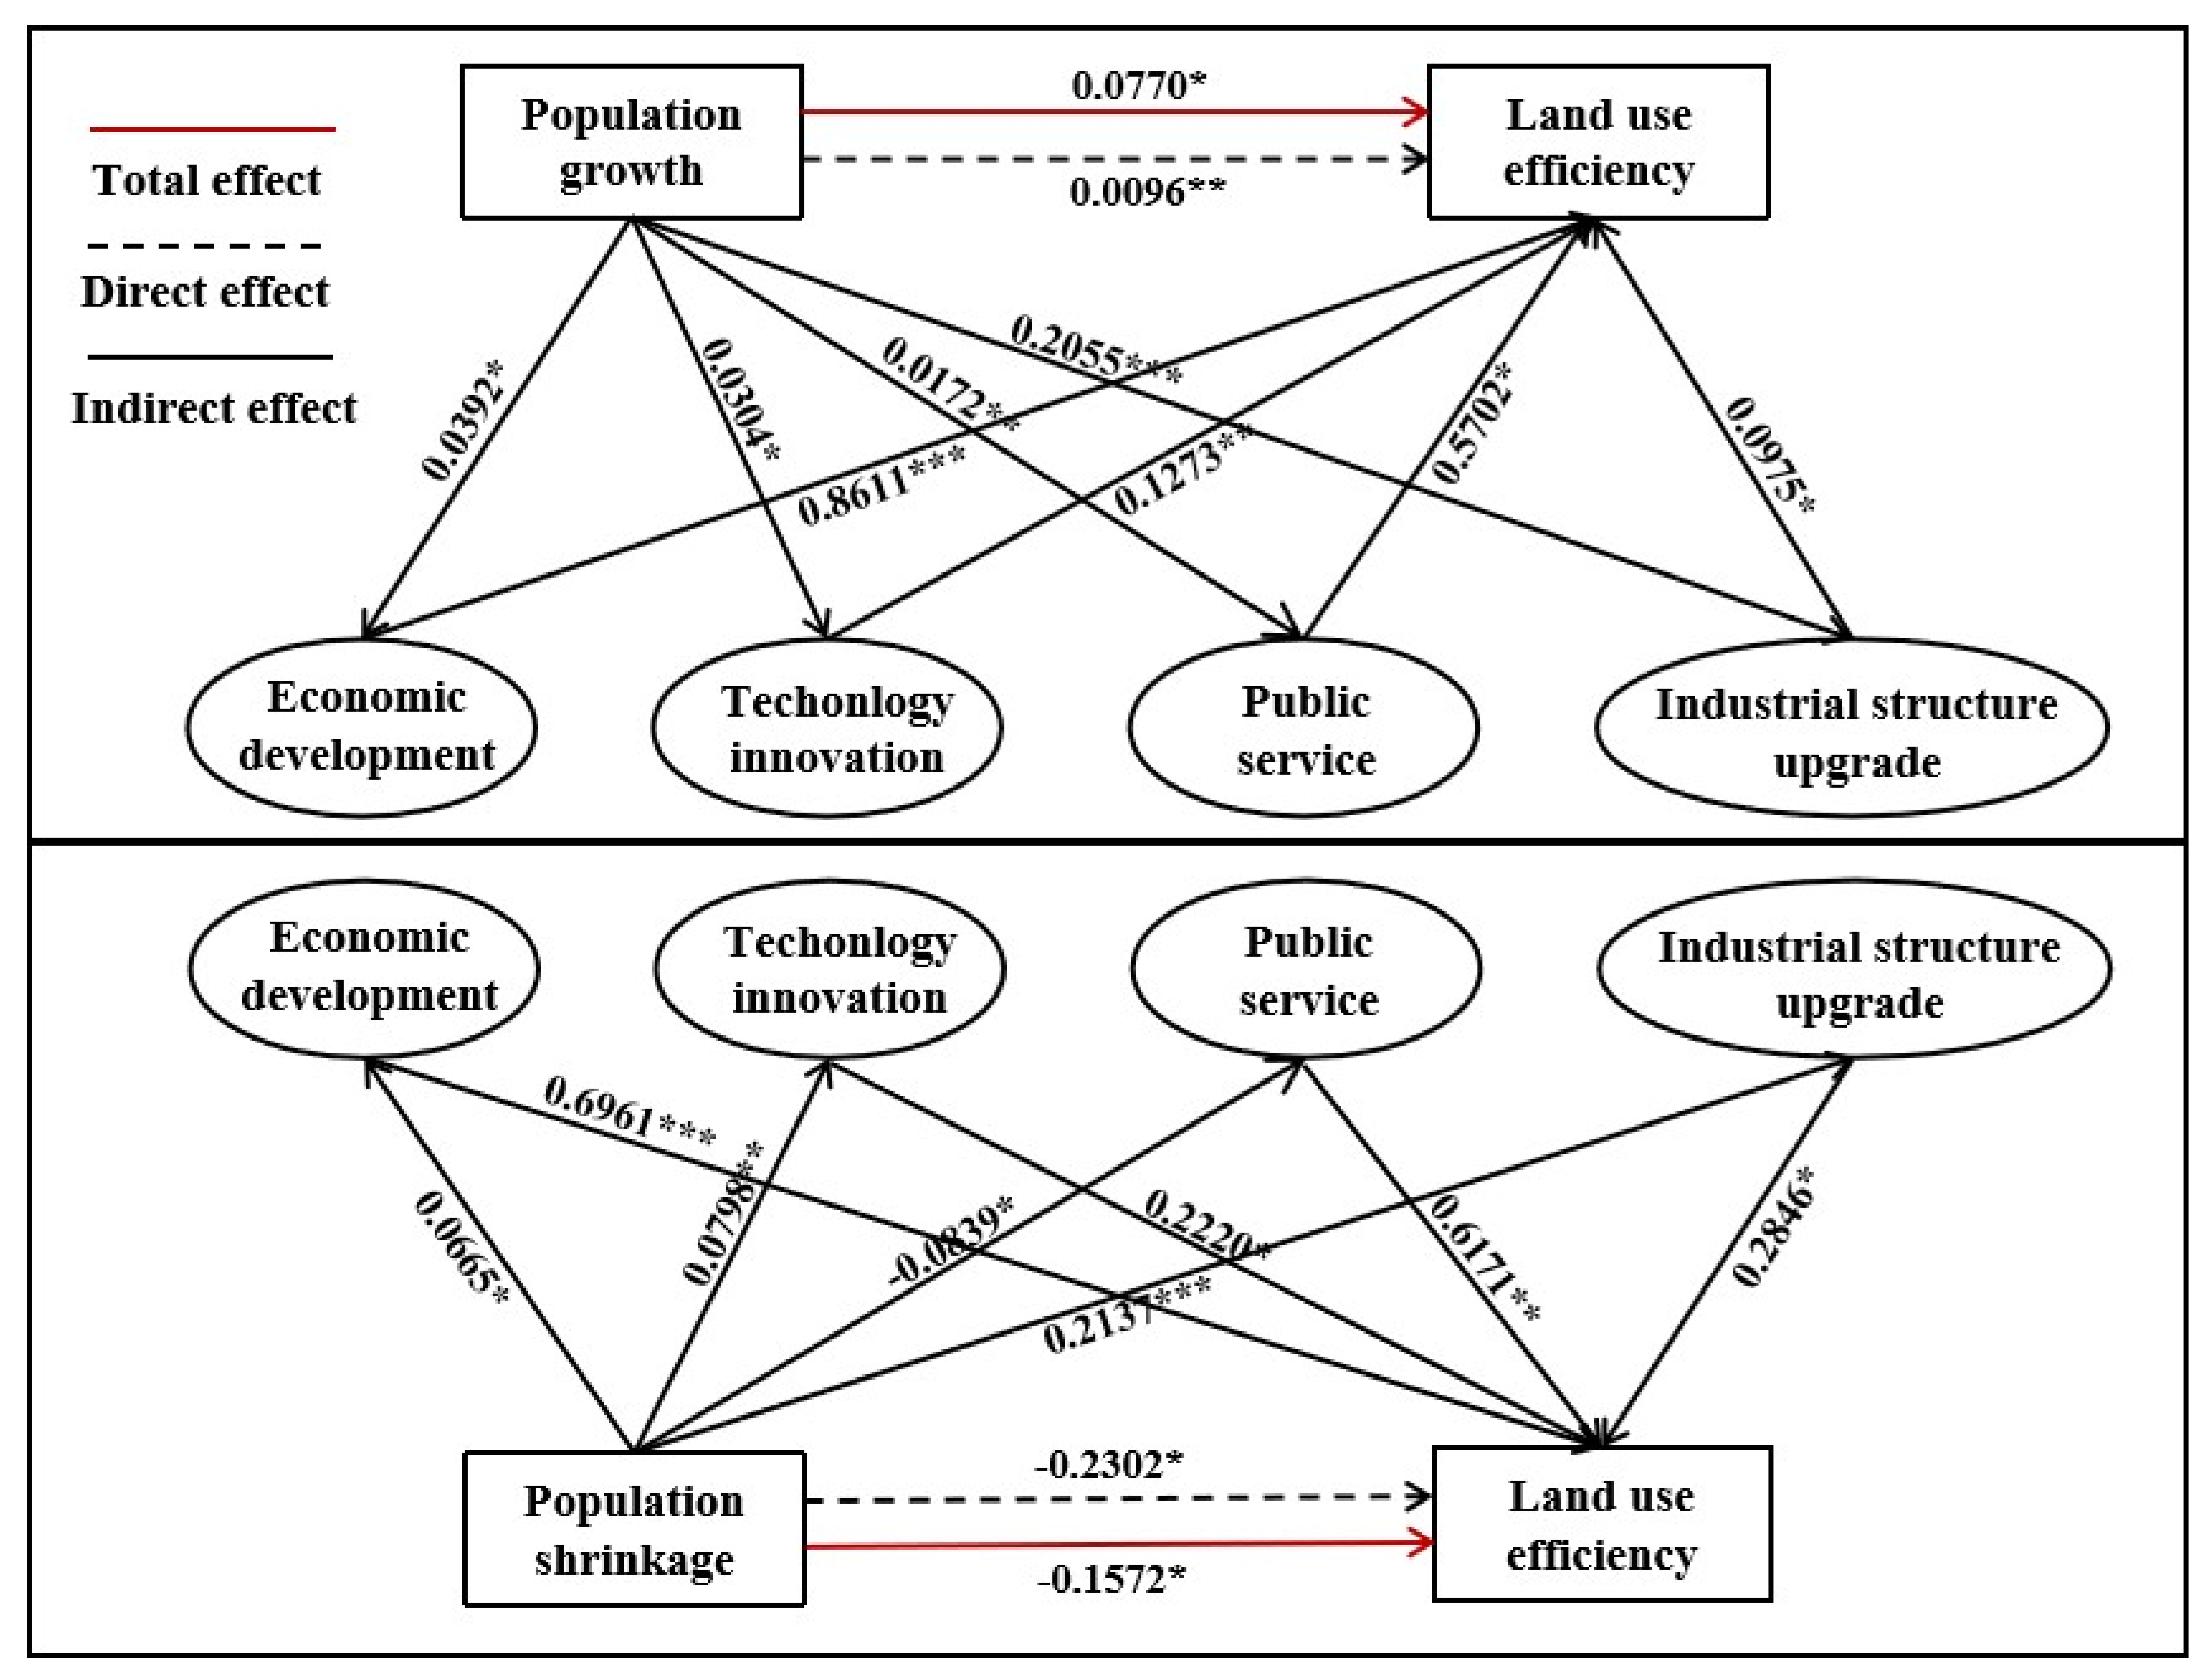
4.2.5. Robustness Tests
4.3. Spatial Effects of UPGS on ULUE
4.3.1. Spatial Correlation Test
Setting of the Spatial Weight Matrix
Spatial Correlation Analysis
4.3.2. Empirical Results and Analysis of the Spatial Econometric Model
Selection and Assessment of Spatial Econometric Models
Analysis of the Spatial Durbin Model Estimation Results
Direct Effects of the SDM
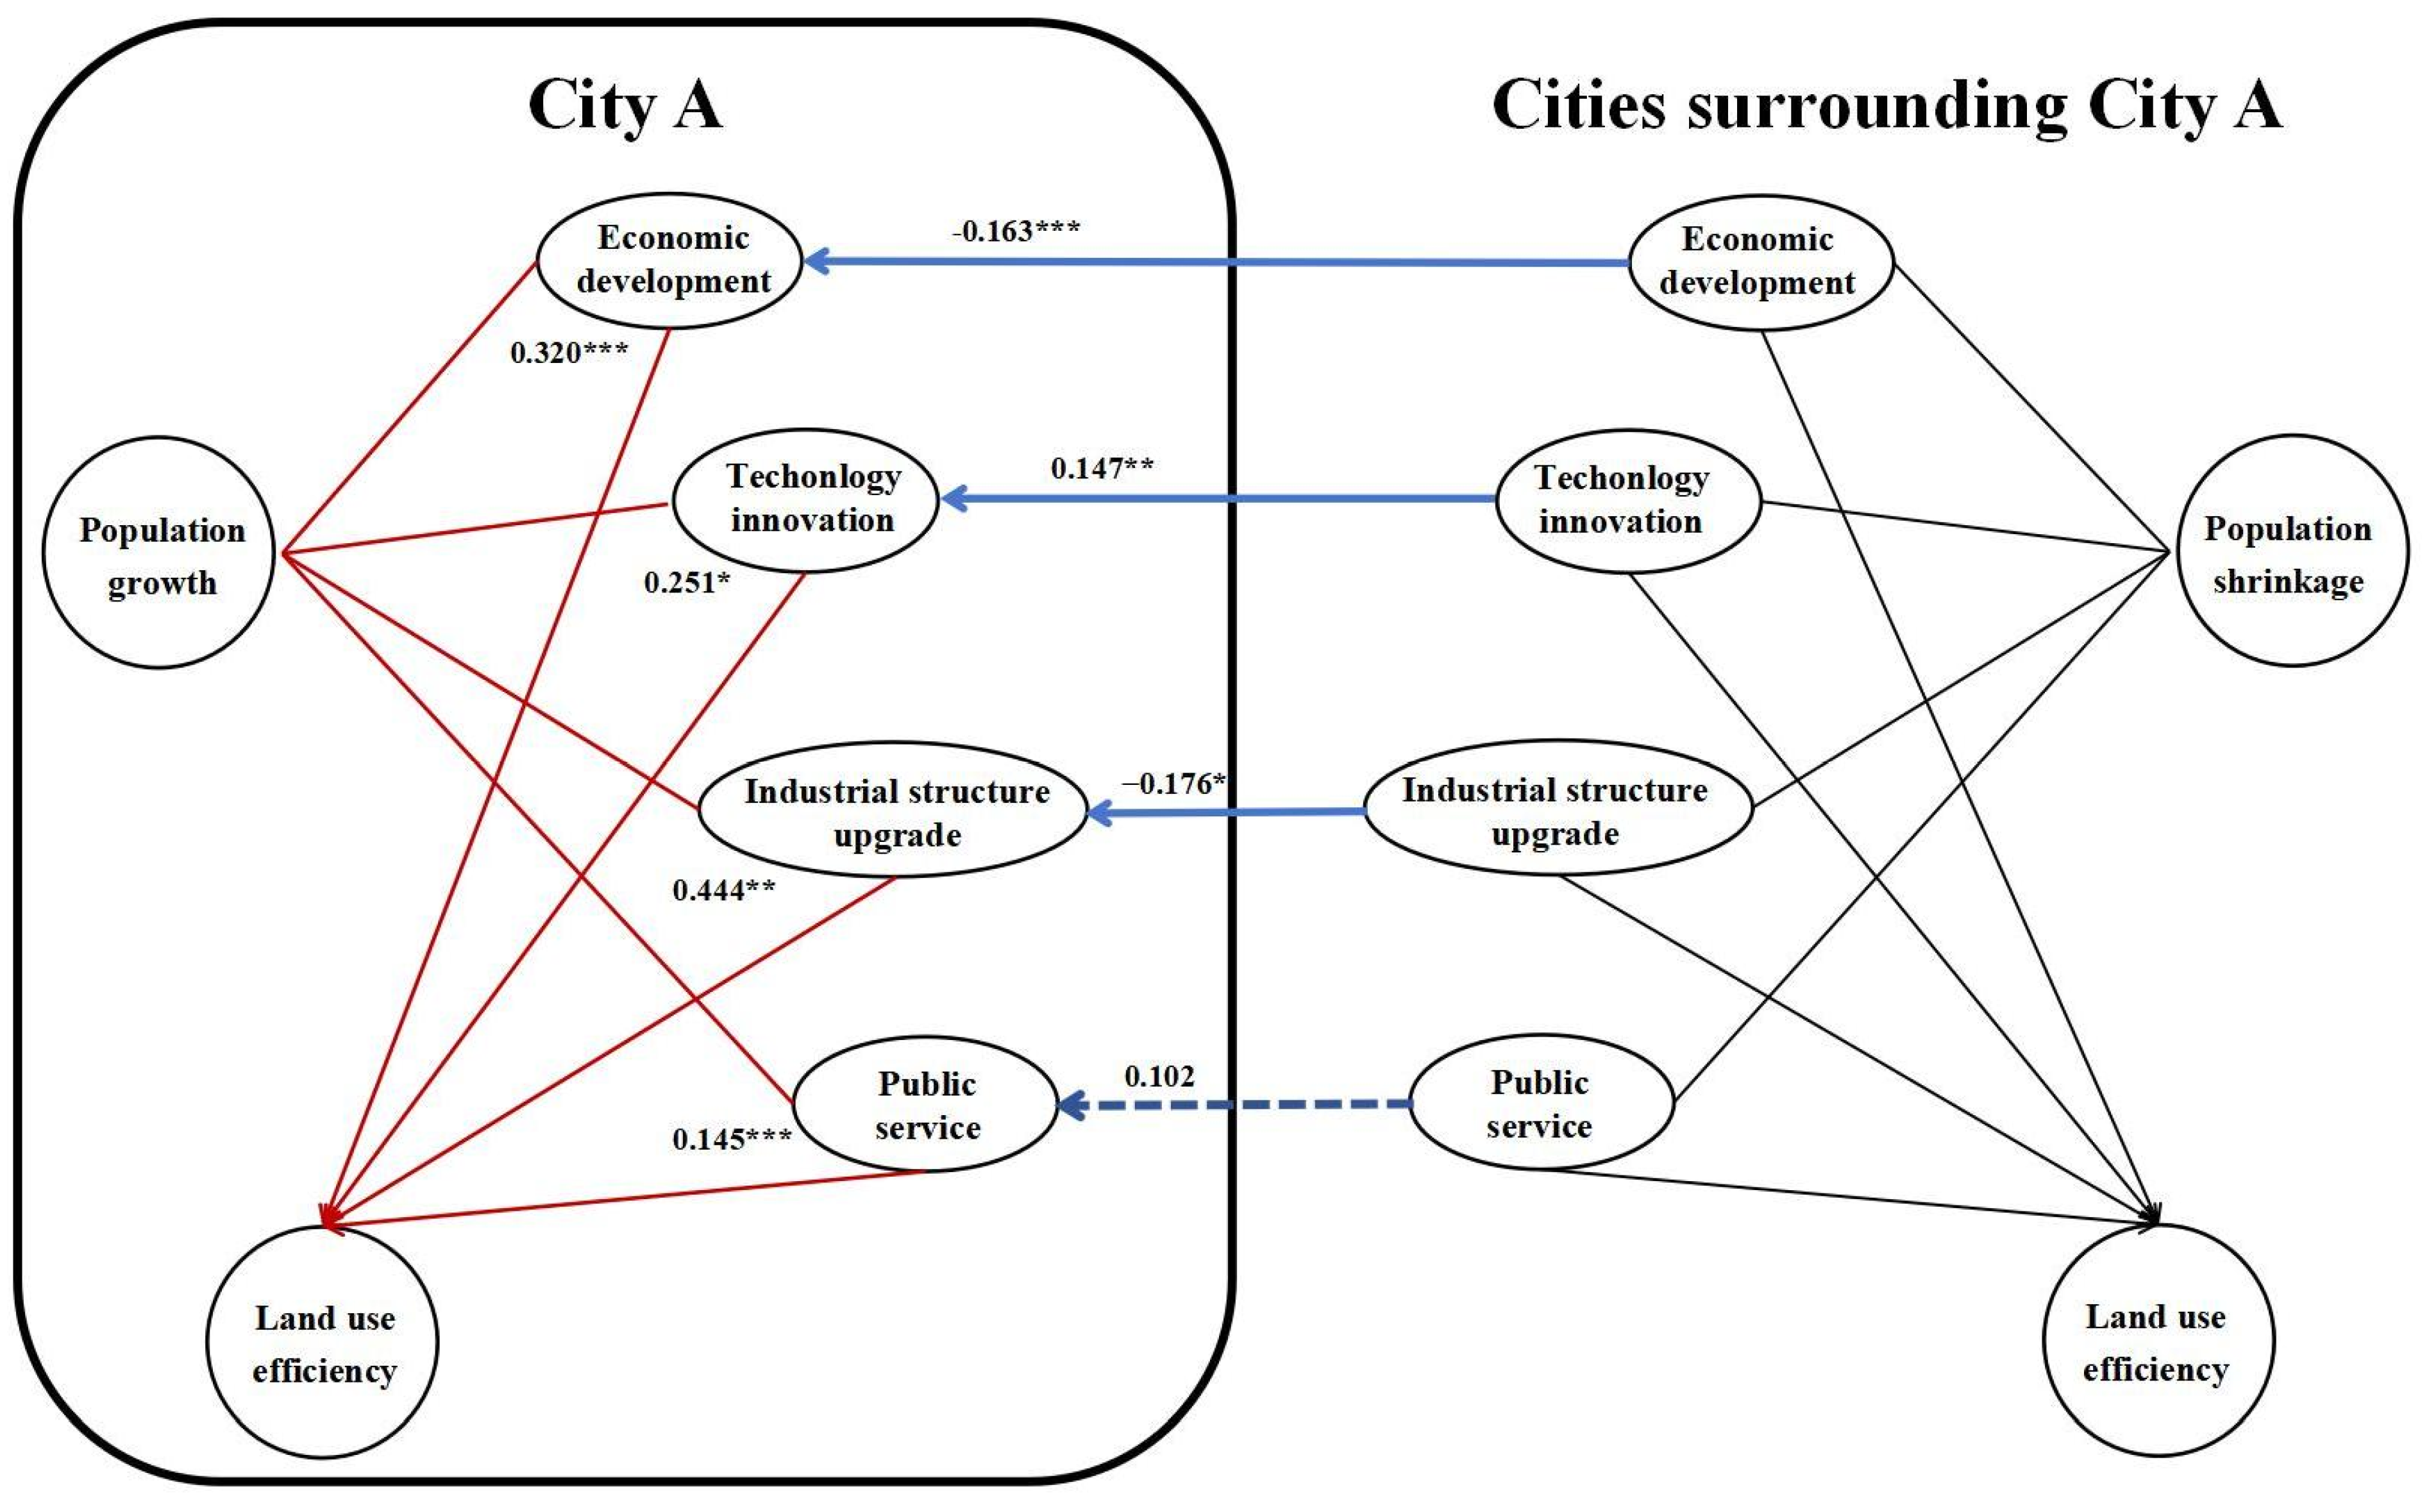
Indirect Effects of the SDM
5. Discussion
5.1. Analysis of the Significant Regional Development Imbalance in Northeast China
5.2. Analysis of the Impacts of UPGS on ULUE
5.3. Analysis of Coordinated Development to Improve ULUE
5.4. Limitation
5.5. Summary
6. Conclusions and Policies Implications
6.1. Conclusions
6.2. Policy Implications
Author Contributions
Funding
Data Availability Statement
Conflicts of Interest
References
- Aral, M.M. Knowledge Based Analysis of Continental Population and Migration Dynamics. Technol. Forecast. Soc. Chang. 2020, 151, 119848. [Google Scholar] [CrossRef]
- Leick, B.; Lang, T. Re-Thinking Non-Core Regions: Planning Strategies and Practices beyond Growth. Eur. Plan. Stud. 2018, 26, 213–228. [Google Scholar] [CrossRef]
- Yang, D.; Long, Y.; Yang, S.; Sun, H. Losing Population with Expanding Space:Paradox of Urban Shrinkage in China. Mod. Urban Res. 2015, 9, 20–25. [Google Scholar]
- Wu, K.; Song, J.; Chen, Y. The Impact Mechanism of Population Growth and Shrinkage on Urban economic Resilience: Based on the Moderating Effects of Industrial Structure and Human Capital. Resour. Sci. 2024, 46, 249–261. [Google Scholar]
- Liu, Y.; Zhang, Y.; Sun, H.; Fu, H. Spatial-Temporal Differentiation and Influence Mechanism of Housing Vacancy in Shrinking Cities: Based on the Perspective of Residential Electricity Consumption. Sci. Geogr. Sin. 2021, 41, 2087–2095. [Google Scholar] [CrossRef]
- Li, X.; Wu, K.; Long, Y.; Li, Z.; Luo, X.; Zhang, X.; Wang, D.; Yang, D.; Kuai, Y.; Li, F.; et al. Academic Debates upon Shrinking Cities in China for Sustainable Development. Geogr. Res. 2017, 36, 1997–2016. [Google Scholar]
- Zhang, H.; Yang, Q. Urban Land Use Efficiency And Influencing Factors of Shrinking Cities in China. Hum. Geogr. 2021, 36, 108–116. [Google Scholar] [CrossRef]
- Wu, D.; Mao, H.; Zhang, X.; Huang, J. Assessment of Urban Land Use Efficiency in China. Acta Geogr. Sin. 2011, 66, 1111–1121. [Google Scholar]
- Zhu, X.; Zhang, P.; Wei, Y.; Li, Y.; Zhao, H. Measuring the Efficiency and Driving Factors of Urban Land Use Based on the DEA Method and the PLS-SEM Model-A Case Study of 35 Large and Medium-Sized Cities in China. Sustain. Cities Soc. 2019, 50, 101646. [Google Scholar] [CrossRef]
- Xie, X.; Fang, B.; Xu, H.; He, S.; Li, X. Study on the Coordinated Relationship between Urban Land Use Efficiency and Ecosystem Health in China. Land Use Policy 2021, 102, 105235. [Google Scholar] [CrossRef]
- Ma, Y.; Zheng, M.; Zheng, X.; Huang, Y.; Xu, F.; Wang, X.; Liu, J.; Lv, Y.; Liu, W. Land Use Efficiency Assessment under Sustainable Development Goals: A Systematic Review. Land 2023, 12, 894. [Google Scholar] [CrossRef]
- Li, S.; Fu, M.; Tian, Y.; Xiong, Y.; Wei, C. Relationship between Urban Land Use Efficiency and Economic Development Level in the Beijing–Tianjin–Hebei Region. Land 2022, 11, 976. [Google Scholar] [CrossRef]
- Song, Y.; Yeung, G.; Zhu, D.; Xu, Y.; Zhang, L. Efficiency of Urban Land Use in China’s Resource-Based Cities, 2000-2018. Land Use Policy 2022, 115, 106009. [Google Scholar] [CrossRef]
- Xie, M.; Feng, Z.; Song, Y.; Guan, H.; Wang, S. How Does Urban Shrinkage Affect Land Use Efficiency? A Case Study of Shrinking Cities in Northeast China. Chin. Geogr. Sci. 2024, 34, 34–51. [Google Scholar] [CrossRef]
- Liu, Z.; Wei, W.; Wang, X.; Liu, S. A literature research on population shrinking. World Reg. Stud. 2019, 28, 13–23. [Google Scholar]
- Shangguan, X.; Hashmi, S.M.; Hu, H.; Wong, W.-K. Tax Competition, Environmental Regulation and High-Quality Economic Development: An Empirical Test Based on Spatial Durbin Model. Front. Public Health 2022, 10, 982159. [Google Scholar] [CrossRef] [PubMed]
- Lu, Y.; Hu, J. Spatial Impact of Digital Economy on the Upgrading of Industrial Structure: Evidence From Chinese Cities. SAGE Open 2024, 14, 21582440241233940. [Google Scholar] [CrossRef]
- Gu, C. Urbanization Studies: An International Approach. City Plan. Rev. 2003, 6, 19–24. [Google Scholar]
- Turok, I.; Mykhnenko, V. The Trajectories of European Cities, 1960–2005. Cities 2007, 24, 165–182. [Google Scholar] [CrossRef]
- Schilling, J.; Logan, J. Greening the Rust Belt A Green Infrastructure Model for Right Sizing America’s Shrinking Cities. J. Am. Plan. Assoc. 2008, 74, 451–466. [Google Scholar] [CrossRef]
- Chen, H.; Yi, J.; Chen, A.; Peng, D.; Yang, J. Green Technology Innovation and CO2 Emission in China: Evidence from a Spatial-Temporal Analysis and a Nonlinear Spatial Durbin Model. Energy Policy 2023, 172, 113338. [Google Scholar] [CrossRef]
- Batunova, E.; Gunko, M. Urban Shrinkage: An Unspoken Challenge of Spatial Planning in Russian Small and Medium-Sized Cities. Eur. Plan. Stud. 2018, 26, 1580–1597. [Google Scholar] [CrossRef]
- Sun, P. Urban shrinkage: Connotation-sinicization-framework of analysis. Prog. Geogr. 2022, 41, 1478–1491. [Google Scholar] [CrossRef]
- Chen, R. On the Efficiency of Urban Land Utilization. Urban Plan. Trans. 1995, 4, 28–33. [Google Scholar]
- Liu, C.; Gao, G.; Zhuang, J. Empirical analysis of urban economic development and land use efficiency in Shandong Province. China Econ. 2005, 8, 257–259. [Google Scholar]
- Chen, Y.; Chen, Z.; Xu, G.; Tian, Z. Built-up Land Efficiency in Urban China: Insights from the General Land Use Plan (2006–2020). Habitat Int. 2016, 51, 31–38. [Google Scholar] [CrossRef]
- Bao, X.; Liu, C.; Zhang, J. Comprehensive appraise to the efficiency of urban land use. Urban Probl. 2009, 165, 46–50. [Google Scholar]
- Bi, X. Review and Prospect of Research on Urban Land Use Efficiency. In Proceedings of the 2016 6th Intertional Conference On Mangagement, Education, Information And Control (MEICI 2016), Shenyang, China, 24–26 September 2016; Volume 135, pp. 1049–1052. [Google Scholar]
- Li, X.; Xu, X.; Chen, H. Spatial and temporal changes in urban efficiency in China in the 1990s. Acta Geogr. Sin. 2005, 60, 615–625. [Google Scholar]
- Zhao, D.; Hu, Y. Analysis of Coordinative and Harmonious Degree Between Urban Land Use Efficiency and Urbanization-A Case Study on 285 Cities at Prefecture Level or Above. Res. Soil Water Conserv. 2017, 24, 291–297. [Google Scholar] [CrossRef]
- Yang, Y.; Lang, Y. Impacts of Urbanization on Land Use Efficiency and Its RegionalDifference in Inland Area of China Regarding the Opening Reform. China Land Sci. 2011, 25, 19–26. [Google Scholar] [CrossRef]
- Li, J.; Luo, N. The Double Threshold Effects of the Urbanization Process on Urban Land Use Efficiency. Econ. Geogr. 2015, 35, 156–162. [Google Scholar] [CrossRef]
- Yang, Q.; Duan, X.; Ye, L.; Zhang, W. Efficiency Evaluation of City Land Utilization in the Yangtze River Delta Using a SBM-Undesirable Model. Resour. Sci. 2014, 36, 712–721. [Google Scholar]
- Zhou, L.; Qiu, T.; Zhou, D.; Shi, X.; Ma, X. The lmpact of Labor Force Aging on Land Use Efficiency in the Hilly Area:Based on theRecognition of Direct Effect and Indirect Effect. China Land Sci. 2015, 29, 35–41. [Google Scholar]
- Fried, H.O.; Lovell, C.A.K.; Schmidt, S.S.; Yaisawarng, S. Accounting for Environmental Effects and Statistical Noise in Data Envelopment Analysis. J. Product. Anal. 2002, 17, 157–174. [Google Scholar] [CrossRef]
- Feng, M.; Li, X. Evaluating the Efficiency of Industrial Environmental Regulation in China:A Three-Stage Data Envelopment Analysis Approach. J. Clean. Prod. 2020, 242, 118535. [Google Scholar] [CrossRef]
- Lu, L.; Zhang, J.; Yang, F.; Zhang, Y. Evaluation and Prediction on Total Factor Productivity of Chinese Petroleum Companies via Three-Stage DEA Model and Time Series Neural Network Model. Sustain. Comput. -Inform. Syst. 2020, 27, 100397. [Google Scholar] [CrossRef]
- Liu, Y.; Feng, C. What Drives the Fluctuations of “Green” Productivity in China’s Agricultural Sector? A Weighted Russell Directional Distance Approach. Resour. Conserv. Recyling 2019, 147, 201–213. [Google Scholar] [CrossRef]
- Yin, J.-Y.; Cao, Y.-F.; Tang, B.-J. Fairness of China’s Provincial Energy Environment Efficiency Evaluation: Empirical Analysis Using a Three-Stage Data Envelopment Analysis Model. Nat. Hazards 2019, 95, 343–362. [Google Scholar] [CrossRef]
- Yang, K.; Wen, Q.; Zhong, T. Assessment of urban land use efficiency in the Yangtze River Economic Belt. Resour. Sci. 2018, 40, 2048–2059. [Google Scholar]
- Lauf, S.; Haase, D.; Kleinschmit, B. The Effects of Growth, Shrinkage, Population Aging and Preference Shifts on Urban Development-A Spatial Scenario Analysis of Berlin, Germany. Land Use Policy 2016, 52, 240–254. [Google Scholar] [CrossRef]
- Hu, Y.; Wang, Z.; Deng, T. Expansion in the Shrinking Cities: Does Place-Based Policy Help to Curb Urban Shrinkage in China? Cities 2021, 113, 103188. [Google Scholar] [CrossRef]
- Gao, X. Research Progress on Shrinking Cities. Econ. Perspect. 2021, 3, 145–158. [Google Scholar]
- Pang, J.; Li, N.; Mu, H.; Jin, X.; Zhang, M. Asymmetric Effects of Urbanization on Shadow Economy Both in Short-Run and Long-Run:New Evidence from Dynamic Panel Threshold Model. Technol. Forecast. Soc. Chang. 2022, 177, 121514. [Google Scholar] [CrossRef]
- Zuo, X. The Role of Population Growth in Economic Development. Int. Econ. Rev. 2010, 6, 127–135. [Google Scholar]
- Hartt, M. The Prevalence of Prosperous Shrinking Cities. Ann. Am. Assoc. Geogr. 2019, 109, 1651–1670. [Google Scholar] [CrossRef]
- Mallach, A. Shrinking Cities: Understanding Urban Decline in the United States. Pap. Reg. Sci. 2018, 97, 1443–1444. [Google Scholar] [CrossRef]
- Hospers, G.-J. Policy Responses to Urban Shrinkage: From Growth Thinking to Civic Engagement. Eur. Plan. Stud. 2014, 22, 1507–1523. [Google Scholar] [CrossRef]
- Zhang, W.; Wu, Q.; Wang, B.; Huang, J. Multidimensional study of specialized agglomeration and diversified agglomeration onurban land use efficiency. China Popul. Resour. Environ. 2019, 29, 100–110. [Google Scholar]
- Zhang, S.; Wang, L.; Wu, X. Population Shrinkage, Public Service Levels, and Heterogeneity in Resource-Based Cities: Case Study of 112 Cities in China. Sustainability 2022, 14, 15910. [Google Scholar] [CrossRef]
- Chen, D.; Lu, X.; Liu, X.; Wang, X. Measurement of the Eco-Environmental Effects of Urban Sprawl: Theoretical Mechanism and Spatiotemporal Differentiation. Ecol. Indic. 2019, 105, 6–15. [Google Scholar] [CrossRef]
- Deng, Y.; Zhang, M. Heterogeneous City Shrinkage and Urban Public Service LevelAlso on theRegulatory Role of Economic Development Level. Soft Sci. 2020, 34, 96–103. [Google Scholar] [CrossRef]
- Liu, Y.; Li, J.; Xiao, S.; Su, T. How Does Urban Shrinkage Affect the Supply of Local Public Services? Urban Dev. Stud. 2020, 27, 11–18. [Google Scholar]
- Osman, T.; Divigalpitiya, P.; Arima, T. Driving Factors of Urban Sprawl in Giza Governorate of Greater Cairo Metropolitan Region Using AHP Method. Land Use Policy 2016, 58, 21–31. [Google Scholar] [CrossRef]
- Song, L. Will urbanization promote the upgrading of industrial structure?—An empirical analysis based on panel data of 30 provinces from 1998 to 2014. Inq. Into Econ. Issues 2017, 8, 70–78. [Google Scholar]
- Carlino, G.A.; Chatterjee, S.; Hunt, R.M. Urban Density and the Rate of Invention. J. Urban Econ. 2007, 61, 389–419. [Google Scholar] [CrossRef]
- Song, Y.; He, C.; Godfrey, Y.; Xu, Y. Industrial structure upgrading and urban land use efficiency: Evidence from 115 resource. based cities in China, 2000–2019. Geogr. Res. 2023, 42, 86–105. [Google Scholar]
- Yu, B.; Su, Y. Research on the impact of Industrial Structure Adjustment on Land Use Efficiency and Spillover Effect: An Empirical Analysis Based on PSDM Model and PTR Model. China Land Sci. 2020, 34, 57–66. [Google Scholar]
- Sun, X. On the Development of Tourism Industry in Yanbian—From the Perspective of Cross-border Nationality. Tour. Trib. 2009, 24, 31–35. [Google Scholar]
- Xin, Y.; Liu, Y.; Liu, L. The influence of population growth and shrinkage on carbon emission intensity in old industrial cities of China. Geogr. Res. 2024, 43, 558–576. [Google Scholar]
- Li, Q.; Zhang, F.; Su, W.; Yang, Q.; Sun, C.; Wei, Z. Measurement of Green Efficiency of Agricultural Water in the Yangtze River Economic Belt and Analysis of Influencing Factors—Based on the Super-Efficiency EBM-Geodetector Model. Chin. J. Agric. Resour. Reg. Plan. 2022, 43, 40–52. [Google Scholar]
- Zhao, L.; Sun, C.; Liu, F. Two-stage utilization efficiency of the interprovincial water resources under environmental constraint and its influence factors in China. China Popul. Resour. Environ. 2017, 27, 27–36. [Google Scholar]
- Chen, J.; Xu, L. Utilization efficiency of Chinese agricultural green water resources based on panel three. stage DEA-Malmquist model. Sci. Geogr. Sin. 2023, 43, 709–718. [Google Scholar] [CrossRef]
- Wen, Z.; Zhang, L.; Hou, J.; Liu, H. Testing and Application of the Mediating Effects. Acta Psychol. Sin. 2004, 36, 614–620. [Google Scholar]
- Liu, S.; Ling, W. Multiple Mediation Models and Their Applications. J. Psychol. Sci. 2009, 32, 433–435. [Google Scholar] [CrossRef]
- Wen, Z.; Ye, B. Analyses of Mediating Effects: The Development of Methods and Models. Adv. Psychol. Sci. 2014, 22, 731–745. [Google Scholar] [CrossRef]
- Zhang, R.; Wen, L.; Wang, N.; Mou, S. China Impact of scientific and technological innovation on green use efficiency of urban land: A case study of 48 districts and counties in the Wuhan Metropolitan Area. Resour. Sci. 2023, 45, 264–280. [Google Scholar] [CrossRef]
- Zhou, Y.; Kong, Y.; Sha, J.; Wang, H. The Role of Industrial Structure Upgrades in Eco-Efficiency Evolution: Spatial Correlation and Spillover Effects. Sci. Total Environ. 2019, 687, 1327–1336. [Google Scholar] [CrossRef]
- Zhang, M.; Li, Y.; Deng, X. The influence of national priority support policies on innovation efficiency of oldrevolutionary base areas. Urban Probl. 2024, 2, 90–101. [Google Scholar] [CrossRef]
- Sheng, Y.; Xu, S.; Li, Q.; Xu, L. Environmental regulation enabling industrial structure upgrading in the Yellow River Basin: Supply optimization or demand driven. Prog. Geogr. 2023, 42, 1039–1054. [Google Scholar] [CrossRef]
- Yi, J. A study of sports public services in China. J. Phys. Educ. 2012, 19, 1–10. [Google Scholar] [CrossRef]
- Liu, R.; Huang, Y.; He, C. Mechanism and Empirical Test of High Quality Integrated Development of Urban andRural Areas to Affect Land Use Efficiency. Urban Dev. Stud. 2021, 28, 128–136. [Google Scholar]
- Wang, H.; Cui, H.; Zhao, Q. Effect of Green Technology Innovation on Green Total Factor Productivity in China: Evidence from Spatial Durbin Model Analysis. J. Clean. Prod. 2021, 288, 125624. [Google Scholar] [CrossRef]
- Wang, J.; Sun, X. The Mechanism of Industrial Transformation and Upgrading Driven by Government Subsidie. China Ind. Econ. 2017, 10, 99–117. [Google Scholar] [CrossRef]
- Sun, Y.; Liang, H.; Jin, X.; Fu, H.; Fan, Y.; Zhang, Y. The impact of labor force shrinkage on urban land use efficiency. Resour. Sci. 2024, 46, 1074–1085. [Google Scholar]
- Chen, Y.; Mei, L. Quantitative Analysis of Population Distribution and Influencing Factors of Resource-based Cities in Northeast China. Sci. Geogr. Sin. 2018, 38, 402–409. [Google Scholar] [CrossRef]
- Zhao, Y.; Wang, Y.; Lyu, X. Spatio-Temporal Pattern of Land Development Intensity and Its Driving Mechanism in Northeast China. Geogr. Geo-Inf. Sci. 2022, 38, 76–83. [Google Scholar]
- Zhou, W.; Xu, L. On New Quality Productivity: Connotative Characteristics and important Focus. Reform 2023, 10, 1–13. [Google Scholar]
- Li, L.; Fu, M.; Zhu, Y.; Kang, H.; Wen, H. The Current Situation and Trend of Land Ecological Security Evaluation from the Perspective of Global Change. Ecol. Indic. 2024, 167, 112608. [Google Scholar] [CrossRef]
- Samper, J.A.; Schockling, A.; Islar, M. Climate Politics in Green Deals: Exposing the Political Frontiers of the European Green Deal. Politics Goverance 2021, 9, 8–16. [Google Scholar] [CrossRef]


| Type | Indicators | Indicator Meaning |
|---|---|---|
| Input indicators | R&D cost input | Technical investment |
| Number of employees | Labor input | |
| Built-up area | Land input | |
| Fixed asset investment | Capital investment | |
| Electricity consumption of the whole society | Energy input | |
| Desirable output indicators | GDP per capital | Material output |
| Total retail sales of consumer goods | Material output | |
| Undesirable output indicators | CO2 emissions | Undesirable output |
| Indicator Name | Abbreviation | MIN | MAX | AV | SD | CV | VIF | Tolerance |
|---|---|---|---|---|---|---|---|---|
| Urban Land Use Efficiency | ULUE | 0.390 | 1.740 | 0.844 | 0.235 | 0.278 | —— | —— |
| Urban Population Growth and Shrinkage | UPGS | −0.350 | 0.260 | −0.024 | 0.084 | −3.509 | 1.425 | 0.702 |
| Economic Development | ED | 4370 | 106,846 | 31,710.633 | 22,025.296 | 0.695 | 2.659 | 0.376 |
| Technology Innovation | TI | 0.040 | 462.540 | 28.639 | 67.409 | 2.354 | 2.957 | 0.338 |
| Industrial Structure Upgrading | ISU | 9.780 | 60.990 | 39.039 | 7.726 | 0.198 | 5.370 | 0.186 |
| Public Services | PS | 4.440 | 100 | 23.067 | 22.264 | 0.965 | 1.673 | 0.598 |
| Ecological Environment Quality | EEQ | 7.050 | 51.800 | 35.780 | 7.769 | 0.217 | 1.349 | 0.741 |
| Environment Governance Level | EGL | 27.000 | 76,381.250 | 1915.802 | 10,838.006 | 5.657 | 1.062 | 0.941 |
| Resource Utility | RU | 12,455 | 4,840,417 | 641,738.871 | 748,699.945 | 1.167 | 2.842 | 0.352 |
| Foreign Investment | FI | 0.040 | 462.540 | 28.639 | 67.409 | 2.354 | 2.939 | 0.340 |
| ULUE | UPGS | |||||
|---|---|---|---|---|---|---|
| Global Moran’s I | Z Score | p Value | Global Moran’s I | Z Score | p Value | |
| 2000–2005 | 0.072 | 1.427 | 0.081 | 0.113 | 1.288 | 0.006 |
| 2005–2010 | 0.120 | 1.333 | 0.090 | 0.218 | 2.333 | 0.017 |
| 2010–2015 | 0.143 | 1.551 | 0.070 | 0.192 | 2.171 | 0.025 |
| 2015–2020 | −0.132 | −1.012 | 0.161 | 0.133 | 1.496 | 0.047 |
| Model | Test | Statistic | p Value |
|---|---|---|---|
| SLM and SEM selection | LM error | 7.899 | 0.005 |
| R-LM error | 17.952 | 0.000 | |
| LM lag | 4.344 | 0.037 | |
| R-LM lag | 14.396 | 0.000 | |
| SDM simplification | Wald lag | 26.510 | 0.002 |
| LR lag | 6.680 | 0.083 | |
| Wald error | 30.220 | 0.000 | |
| LR error | 182.07 | 0.000 | |
| Random and fixed effects tests | Hausman | 80.720 | 0.000 |
| Main | Mixed Effect | Time Fixed | Spatial Fixed | Double Fixed | Mixed Effect | Time Fixed | Spatial Fixed | Double Fixed | |
|---|---|---|---|---|---|---|---|---|---|
| R2 | 0.3943 | 0.7863 | 0.4459 | 0.5988 | Wx | ||||
| ED | 0.046 | 0.322 *** | 0.368 * | 0.153 ** | ED | −0.326 *** | −0.182 *** | −0.195 * | 0.339 *** |
| ISU | −0.193 * | 0.575 ** | 0.306 ** | 0.221 ** | ISU | −0.851 *** | −0.216 * | −0.211 *** | 0.596 *** |
| PS | −0.190 | 0.154 *** | 0.209 * | 0.115 ** | PS | −0.041 | 0.034 | 0.012 | 0.200 * |
| TI | −0.105 | 0.244 * | 0.158 * | 0.199 * | TI | −0.461 ** | 0.203 ** | 0.385 ** | 0.436 ** |
Disclaimer/Publisher’s Note: The statements, opinions and data contained in all publications are solely those of the individual author(s) and contributor(s) and not of MDPI and/or the editor(s). MDPI and/or the editor(s) disclaim responsibility for any injury to people or property resulting from any ideas, methods, instructions or products referred to in the content. |
© 2024 by the authors. Licensee MDPI, Basel, Switzerland. This article is an open access article distributed under the terms and conditions of the Creative Commons Attribution (CC BY) license (https://creativecommons.org/licenses/by/4.0/).
Share and Cite
Kang, H.; Fu, M.; Kang, H.; Li, L.; Dong, X.; Li, S. The Impacts of Urban Population Growth and Shrinkage on the Urban Land Use Efficiency: A Case Study of the Northeastern Region of China. Land 2024, 13, 1532. https://doi.org/10.3390/land13091532
Kang H, Fu M, Kang H, Li L, Dong X, Li S. The Impacts of Urban Population Growth and Shrinkage on the Urban Land Use Efficiency: A Case Study of the Northeastern Region of China. Land. 2024; 13(9):1532. https://doi.org/10.3390/land13091532
Chicago/Turabian StyleKang, Haoyang, Meichen Fu, Haoran Kang, Lijiao Li, Xu Dong, and Sijia Li. 2024. "The Impacts of Urban Population Growth and Shrinkage on the Urban Land Use Efficiency: A Case Study of the Northeastern Region of China" Land 13, no. 9: 1532. https://doi.org/10.3390/land13091532
APA StyleKang, H., Fu, M., Kang, H., Li, L., Dong, X., & Li, S. (2024). The Impacts of Urban Population Growth and Shrinkage on the Urban Land Use Efficiency: A Case Study of the Northeastern Region of China. Land, 13(9), 1532. https://doi.org/10.3390/land13091532