Article

Assessing Land-Cover Change Trends, Patterns, and Transitions in Coalfield Counties of Eastern Kentucky, USA

1
College of Agriculture, Health and Natural Resources, Kentucky State University, 400 E. Main Street, Frankfort, KY 40601, USA
2
Martin-Gatton College of Agriculture, Food and Environment, University of Kentucky, 1405 Veterans Dr, Lexington, KY 40503, USA
*
Author to whom correspondence should be addressed.
Land 2024, 13(9), 1541; https://doi.org/10.3390/land13091541
Submission received: 29 July 2024 / Revised: 6 September 2024 / Accepted: 17 September 2024 / Published: 23 September 2024

Abstract

:
Surface coal mining and reclamation have greatly reshaped eastern Kentucky’s landscape affecting its socioeconomic, environmental and climatic aspects. This study examined the land-cover changes, trends and patterns in Floyd, Knott, Letcher, Magoffin, Martin, Perry, and Pike counties from 2004 to 2019. Using a random forest classifier, land cover was categorized into seven major classes, i.e., water, barren land, developed land, forest, shrubland, herbaceous, and planted/cultivated, majorly based on Landsat images. The Kappa accuracy ranged from 75 to 89%. The results showed a notable increase in forest area from 5052 sq km to 5305 sq km accompanied by a substantial decrease in barren land from 179 sq km to 91 sq km from 2004 to 2019. These findings demonstrated that reclamation activities positively impacted the forest expansion and reduced the barren land of the study area. Key land-cover transitions included barren land to shrubland/herbaceous, forest to shrubland, and shrubland to forest, indicating vegetation growth from 2004 to 2019. An autocorrelation analysis indicated similar land-cover types clustered together, showing effective forest restoration efforts. As surface coal mining and reclamation significantly influenced the landscapes of the coalfield counties in eastern Kentucky, this study provides a holistic perspective for understanding the repercussions of these transformations, including their effects on humans, society, and environmental health.

1. Introduction

Eastern Kentucky, renowned for its abundant coal reserves and extensive coal mining history, has experienced significant transformations in its land cover as a direct consequence of mining activities. Commercially, coal has been mined in Kentucky for about two centuries [1]. As a result of the 20th century’s extensive industrialization, the coal industry in eastern Kentucky grew, and bituminous coal became the main energy source. Over time, the landscape in this region has been shaped by both natural and anthropogenic factors, including the conversion of land types, soil erosion, the growth and emergence of new forests, the expansion of residential areas, alterations in mining areas, and reclamation efforts [2,3].
Surface coal mining is a laborious operation in which the topsoil is preserved and the rock over the ore’s mineral-bearing layer is removed. In mined regions, the topsoil is subsequently used in the reclamation process to support the growth of later-planted natural grasses and trees, reassessing the original landscape [4,5]. Since the Surface Mining Control and Reclamation Act (SMCRA) was enacted in 1977, mine reclamation methods have evolved significantly. The purpose of the SMCRA is to regulate the mined areas with proper compliance in planting grasses and trees to recover vegetation and reduce erosion. Reclamation focuses on restoring flora or grasslands in formerly mined areas while minimizing potential erosion risks. Planting vegetation such as timothy grass, perennial ryegrass, alfalfa, clover, trefoil, etc., can help restore the mined lands’ condition and make it more productive [6].
Moreover, reclamation efforts restore the lost environment by attracting animals, birds, and insects, in addition to restoring the soil [7,8]. Over the past few decades, the study region has gone through substantial land-cover changes, as extensive tracts of forest and other flora were cleared to extract coal from the surface [9]. Many biological and environmental effects have resulted from this, including modifications to water quality and aquatic habitats as well as adjustments to the make-up and structure of terrestrial ecosystems [10]. The amount of forest cover in eastern Kentucky has significantly decreased because of surface mining and has been replaced by grasslands and shrublands [11]. Modifications in hydrological processes have also been connected to changes in land cover because of surface mining [12]. On the other hand, reclamation operations in the area have been effective in recovering vegetation cover, although the restored plant communities often differs from pre-mining ecosystems [13,14]. Mining companies are required to deposit a bond before commencing coal mining activities. This bond is only refunded upon the completion of mining operations if the landscape or mined areas are restored to their original or improved conditions in terms of vegetation cover. To expedite the release of this bond, companies often choose to plant fast-growing exotic species [11]. Examples include autumn olive, Paulownia, and sericea lespedeza, which are frequently used for their rapid growth, whereas timothy, perennial ryegrass, alfalfa, clover, trefoil, oaks, hickories, tulip polar, eastern hemlock, yellow birch, sugar maple and spruce are the native common species of this region and are rarely planted for reclamation activities in the study area [15]. However, these exotic plants have dense canopies that block sunlight, hindering the growth of native seedlings. Some of these species also produce biochemical compounds that inhibit the establishment of native plants [11,15].
Despite the long history of coal mining operations in eastern Kentucky, research into land-cover change trends and patterns in the study area remains limited. Studying these land-cover change trends, patterns, and relationships is crucial for understanding the environmental, ecological, and socioeconomic impacts of mining and reclamation activities in the region over time. Changes in land cover can significantly affect the availability of resources like water and timber, which are vital for the survival of local communities who depend on these resources [16]. Analyzing land-cover trends and patterns provides insights into how mining activities affect the environment over time, helping develop effective mitigation plans for sustainable land use [17]. By considering the complexity of land-cover changes through transition matrices, this research contributes to a deeper understanding of the drivers and implications of land-cover transformations in eastern Kentucky. Land-cover change studies are important for several reasons. Firstly, it facilitates the understanding of the environmental effects of mining and reclamation activities over time. Through the monitoring of land-cover trends, the success of reforestation efforts can be assessed, and areas in need of further restoration work can be identified [17]. Additionally, investigating the relationships between environmental conditions and land-cover patterns helps pinpoint areas requiring conservation or restoration [15,16]. This information is crucial for the development of effective mitigation plans and the promotion of sustainable land-use practices [17]. Moreover, studying land-cover trends and patterns aids in making well-informed policy decisions. By examining the impacts of mining on land cover and water resources, specific policies can be developed to reduce environmental consequences and promote responsible natural resource management [15,16]. Understanding the social and economic dynamics of local land-cover changes also helps in assessing their impacts on community resilience and well-being. Changes in land-cover patterns can affect resource availability and property values, which can significantly impact local communities [16].
Remote sensing and GIS technologies are widely employed to uncover land-cover patterns, driving forces, and their impacts on the landscape [17,18,19]. Satellite imagery is classified to detect changes in vegetation, water bodies, and urban areas over time [20]. Spatial statistics further help to identify and understand localized variations in land-cover patterns caused by natural (climate, topography, geology) and anthropogenic factors [21,22]. Using transition matrices derived from remote sensing tools to analyze land-cover changes provides valuable insights into the trends, patterns, and transitions among different land-cover classes [20,23]. The construction of transition matrices enables the identification of dominant conversion patterns, transition hot spots, and trends in land-cover dynamics [24,25]. These insights support evidence-based decision making, enhancing the efficacy of reclamation efforts to restore vegetation, identifying areas needing conservation or restoration, and understanding the other social and economic implications of land-cover changes [7,11,26].
This study explores land-cover changes in coalfield counties of the Appalachian region of eastern Kentucky ranging from 2004 to 2019. By examining the how, where, and when aspects of these changes, this study delves deep into the trends and patterns characterizing land-cover shifts of the study area through the detailed examination of the transition of land-cover classes across seven coalfield counties. This study leveraged the random forest classifier technique and meticulously conducted statistical analysis at 191 normalized Census Block Groups (CBG) boundaries. The Census Block Group boundaries were purchased from Geolytics Inc. based in C-200 Brier Hill Court, East Brunswick, New Jersey 08816, USA. We used the same consistent normalized CBG boundaries, which had 191 normalized CBGs for all years that are considered for the study. Despite the prevalence of coal mining in eastern Kentucky since the late 1800s, there has been a notable lack of research on the effects that mining operations and subsequent reclamation attempts have had on land-cover changes. By utilizing random forest classification and incorporating intricate topographic data, this study fills this critical gap by offering a comprehensive examination of the changing dynamics of the terrain throughout seven coalfield counties. This study explains these complex relationships, which advances our knowledge of the environmental changes occurring in the area and emphasizes the pressing need for future land management plans. The integration of diverse environmental factors (topographic data), including aspect, slope, DEM (digital elevation model), topographic position index, land capability classes, and curvatures as supplemental data for image classification in this study enhanced the accuracy and robustness of the image classification processes. This study synthesizes a more comprehensive understanding of the factors influencing land-cover changes in coalfield counties of eastern Kentucky.

2. Methods

2.1. Study Area

The study area includes seven counties of eastern Kentucky (Pike, Knott, Letcher, Martin, Magoffin, Perry, and Floyd), shown in Figure 1. The study area falls in the two ecoregions of Central Appalachia denoted by (69) in ecoregions map: (1) the Dissected Appalachian Plateau, denoted by (69 d), and (2) the Cumberland Mountain Thrust Block, denoted by (69 e) [27]. Most of the study area falls in the Dissected Appalachian Plateau, and only a small portion (Letcher County) falls in the Cumberland Mountain Thrust Block ecoregion [28]. The Dissected Appalachian Plateau ecoregion constitutes primarily forested land with narrow ridges, valleys, and deep coves. This region has a higher presence of Pennsylvanian-age shale, silt, conglomerate, siltstone, sandstone, and coal [28]. The Cumberland Mountain Thrust Block ecoregion consists of high, steep ridges, hills, coves, narrow valleys, and Pine Mountain. Oaks, hickories, tulip poplar, eastern hemlock, yellow birch, sugar maple, and spruce are common tree species in the study area [29]. This region has a higher altitude than anywhere in Kentucky. The Letcher (1134 m a.s.l), Pike 27 (960 m a.s.l), and Perry (762 m a.s.l) counties are the highest elevation points of the eastern Kentucky region. Here, m a.s.l denotes meters above sea level. The surface waters of this region have been degraded, mostly due to surface coal mining [2,30]. These coalfield counties have poverty rates ranging from 23.9% in Pike to 39.1% in Martin [27,28]. Surface coal mining puts the health of communities near coal mines at risk. The production of harmful gases such as nitrogen oxides, heavy metals, sulfur dioxides, and particulate matter during the coal mining process is associated with increased incidents of black lung, cancer, pulmonary infections, and an overall increase in the mortality rate [29,31].

2.2. Data Preparation

Changes in the landscape were derived from the classification of Landsat 5 Thematic Mapper Plus (TM+), downloaded from Earth Explorer for the corresponding path/rows 18/34 and 19/34 for 2004, 2006, and 2010, and the Landsat 8 Operational Land Imager (OLI) sensor for 2016 and 2019. These dates were specifically chosen because, in addition to the downloaded Landsat data, generating training samples required reference datasets such NLCD and NAIP data. Landsat, NAIP, and NLCD data only strongly aligned and, for the most part, coincided during the years 2004 to 2019. For example, we classified land cover using Landsat data and combined it with NAIP 2004 and basemaps to generate training samples for the 2004 classification. Likewise, we employed 2006 NAIP and NLCD data for the Landsat classification. This strategy enabled us to obtain training samples by making use of the NLCD maps and NAIP images that were closest to or coincided with the same year. To capture seasonal variations and different agricultural and vegetation growth patterns, fall, winter, and summer Landsat datasets were compiled for all five years, representing leaf-off, leaf-on, and green-up seasons, respectively [32]. The study considered specific periods for different seasons: November–December for winter, April–July for summer, and August–October for fall, considering the objective of capturing the seasonal variation with a cloud cover of less than 20% [32,33,34]. A multiband raster was created, combining multiple Landsat imageries for each season and the respective year. The Thermal band (band 6) in the Landsat Thematic Mapper ™, and the Panchromatic band (band 8), Cirrus band (band 9), and Thermal band (band 10) in Landsat OLI (Operational Land Imager) were not included in the study. For both sensors, Landsat L2C2 (Level 2 Landsat Collection 2) imagery was used, as it had undergone atmospheric correction [35], resulting in more uniform spectral and geometric properties [36]. National Agriculture Imagery Program (NAIP) data, the National Land Cover dataset (NLCD), base maps from multiple years, and surface mined and corporate boundaries were utilized to create training samples and validation samples for each of the five years for all seven coalfield counties. Digital elevation model (DEM) data were acquired from Kentucky Above for 2011 [37] to derive aspect, slope, curvature, and the topographic position index (TPI) and land capability classes (LCCs) to assist in land-cover classification. The layer of land capability classes was extracted from Kentucky Soil data for 2012 [38]. Multi-seasonal Landsat images combined with topographic layers have improved land-cover classification with higher accuracies [36,37,38]. The final imagery was standardized to a uniform spatial resolution of 30 m before they were used to create a multiband image for classification. The datasets used in the study are mentioned in Table 1 below.

2.3. Image Classification

Random forest classifier (RFC) was utilized to classify the Landsat imagery from multiple years. The RFC is a supervised machine-learning approach that uses a group of decision trees [39,40]. By creating several decision trees, a large amount of data is sampled [41]. RFC produces higher accuracy than the traditional supervised classification method [42,43]. The trees in a random forest are generated by splitting the dataset in half at every node [44]. Random forest classifier comes with three major attributes: (a) maximum number of trees, (b) maximum tree depth, and (c) maximum number of samples per class. The higher the maximum number of trees, the higher the expected accuracy of the algorithm/classifier. Maximum tree depth represents the number of rules each tree is allowed to take to come to a conclusive decision by voting, and the maximum number of samples per class denotes the number of samples that are used to define a particular class [45]. The maximum number of trees, maximum tree depth, and maximum number of samples per class were set as default as 50, 30, and 1000, as provided by the classifier.
Multiband Landsat images were created for each of the seasons for the years 2004, 2006, 2010, 2016, and 2019 of the study area for each county. The resulting images consisting of 24 bands for Landsat TM (2004, 2006 and 2010) and 27 bands for Landsat OLI (2016 and 2019) were classified into seven major classes using the random forest classifier (RFC) as shown in Table 2 [45]. NLCD and NAIP images, and topographic layers such as the DEM, slope, aspect, slope curvature, TPI, and the LCCs and National Hydrology Dataset, as well as mined area polygons as close as possible to the acquisition years, were utilized to create training and validation samples for each county. This allowed us to analyze the trend in land-cover change with better precision [44,45,46]. Ballanti et al. (2016)’s approach was followed to obtain the number of training pixels required for each class [47]. For determining the number of training samples needed for each class, the number of bands are multiplied by ten [48]. As a result, for the years 2004, 2006, and 2010, at least 60 training samples for each class of land cover were produced utilizing the six bands of Landsat TM images and, for the years 2016 and 2019, at least 70 training samples for each class of land cover were generated using the seven bands of Landsat OLI images. Those samples that represented the same land cover classes in NAIP imagery, NLCD maps, and the visual observation of Landsat imagery were considered for the final training samples for RFC and accuracy assessment. The final land-cover maps for each year were made by merging the separate land-cover maps of seven individual counties.
In land-cover classification, incorporating aspect, curvature, slope, DEM, TPI, LCC, and Landsat images alongside the Random Trees classifier yields significant insights [49]. Aspect provides insights into the solar radiation effects on vegetation patterns, aiding in understanding microclimatic conditions. Curvature helps distinguish landforms, identifying areas with distinct hydrological and biological properties. Slope influences water movement, soil erosion, and vegetation distribution, aiding in differentiating land-cover types [50]. DEM depicts elevation impacts on land-cover patterns, such as temperature gradients and habitat preferences. TPI characterizes local topographic variability, facilitating the identification of microhabitats influenced by topography [51]. LCC evaluates land viability for agricultural purposes, aiding in identifying land-cover categories associated with various land capacities [50]. Landsat images provide multispectral data for the spectral characterization of land-cover types. Integrating these variables enhances prediction accuracy by considering topographic, spectral, and environmental factors, thereby improving land-cover classification efficiency [52]. When paired with the Random Trees classifier, using aspect, curvature, slope, DEM, TPI, LCC, and Landsat images as additional inputs improves the land-cover categorization process. This integration has improved classification accuracy and efficiency by utilizing topographic, spectral, and environmental factors.
Table 2. Land-cover classes modified from Anderson level 1 land-cover classes [49,51].
Serial NumberLand-Cover Class ValueLand-Cover Class NameDescription
12DevelopedAreas with constructed materials, an impervious surface, a mixture of some vegetation, housing units, commercial and industrial buildings, roads, golf courses, etcetera.
28Planted/CultivatedLand used broadly for food and fiber; pastureland
37Herbaceous Land where the natural vegetation is grasses, grass-like plants and herbaceous vegetation
44Forest landAreas generally dominated by trees and a vegetation cover greater than 20%
55ShrublandAreas dominated by shrubs
63Barren landAreas where less than one-third of the area has vegetation, thin soil, sand or rocks and mine lands present
71WaterAreas of open water generally with less than a 25% cover of vegetation or soil

2.4. Transition Matrix Analysis

The post-classification comparison was conducted between the two classified maps from 2004 to 2019 for each county, and a transition matrix was created, showing changes in land-cover classes over the two time periods. Transitions in land-cover classes were computed using change detection analysis, which measured the land-cover area which changed from one class to another in the study area between 2004 and 2019. We used the post-comparison tool in ArcGIS Pro-3.0, 3.1.1 and 3.1.2 versions, to create a transition matrix, which is popular in land-cover change studies [53]. The post-comparison approach does not need data normalization between the periods for comparison [54,55].

2.5. Spatial Autocorrelation

A spatial autocorrelation test was conducted to reveal the clustering patterns of land-cover classes using Moran’s I [45]. The importance of computing spatial autocorrelation lies in its ability to determine if land-cover changes occur randomly or if it possesses unique spatial patterns. Moran’s I value varies between −1 (indicating perfect dispersion) and 1 (reflecting perfect clustering), where a value of 0 suggests the absence of spatial autocorrelation [56]. This analysis provides valuable insights into the primary patterns of land-cover change observed in the coalfield counties. Moreover, it helps identify localized clustering impacts on urbanization, deforestation, mining activities, and flood hazards [57,58].

2.6. Accuracy Assessment

Reference data points were randomly generated in the classified maps of each of the seven counties to calculate the accuracy of the land-cover maps. We followed a stratified random sampling method to generate those points in the maps, to make it consistent according to seven land-cover classes. The reference data points on the classified maps (50 random points for each class) were compared against the same data points in the NLCD and NAIP datasets through visual inspection to assess the accuracy of the land-cover classes obtained from image classification. Physical, built, natural or permanent structures such as roads, monuments, historical sites, mine sites, bridges, rivers, and grazing land in each county were also visited on-site as part of the ground-truthing for accuracy assessment. User and producer accuracies and Kappa statistics were computed for the classified maps of each county and year. A Kappa coefficient of more than 70% was used as the acceptable value, as recommended by previous studies [56,59,60]. The accuracy assessment was carried out separately for seven counties. Hence, Kappa statistics of all seven counties were computed separately for each year, i.e., for 2004, 2006, 2010, 2016 and 2019.

2.7. Hot Spot Analysis

The hot spot analysis serves as a valuable method for identifying statistically significant hot spots and cold spots within spatial data. This analytical technique computes the Getis-Ord Gi* statistic for each feature present in a dataset, enabling the assessment of the extent of spatial clustering in terms of high or low values [61]. High positive G values indicate locations where land-cover change is more intense or significant than neighboring areas [62,63]. A negative G value, on the other hand, denotes a grouping of low values (i.e., cold spots), representing locations where the land-cover change intensity is minimal or different from adjacent areas [61,62,63]. The determination of hot spots and cold spots would identify areas with high or low intensities of land-cover change, which may be associated with specific driving factors at the local level, such as demographics and topographic attributes, policies, zoning regulations, etc.

2.8. Paired t-Tests

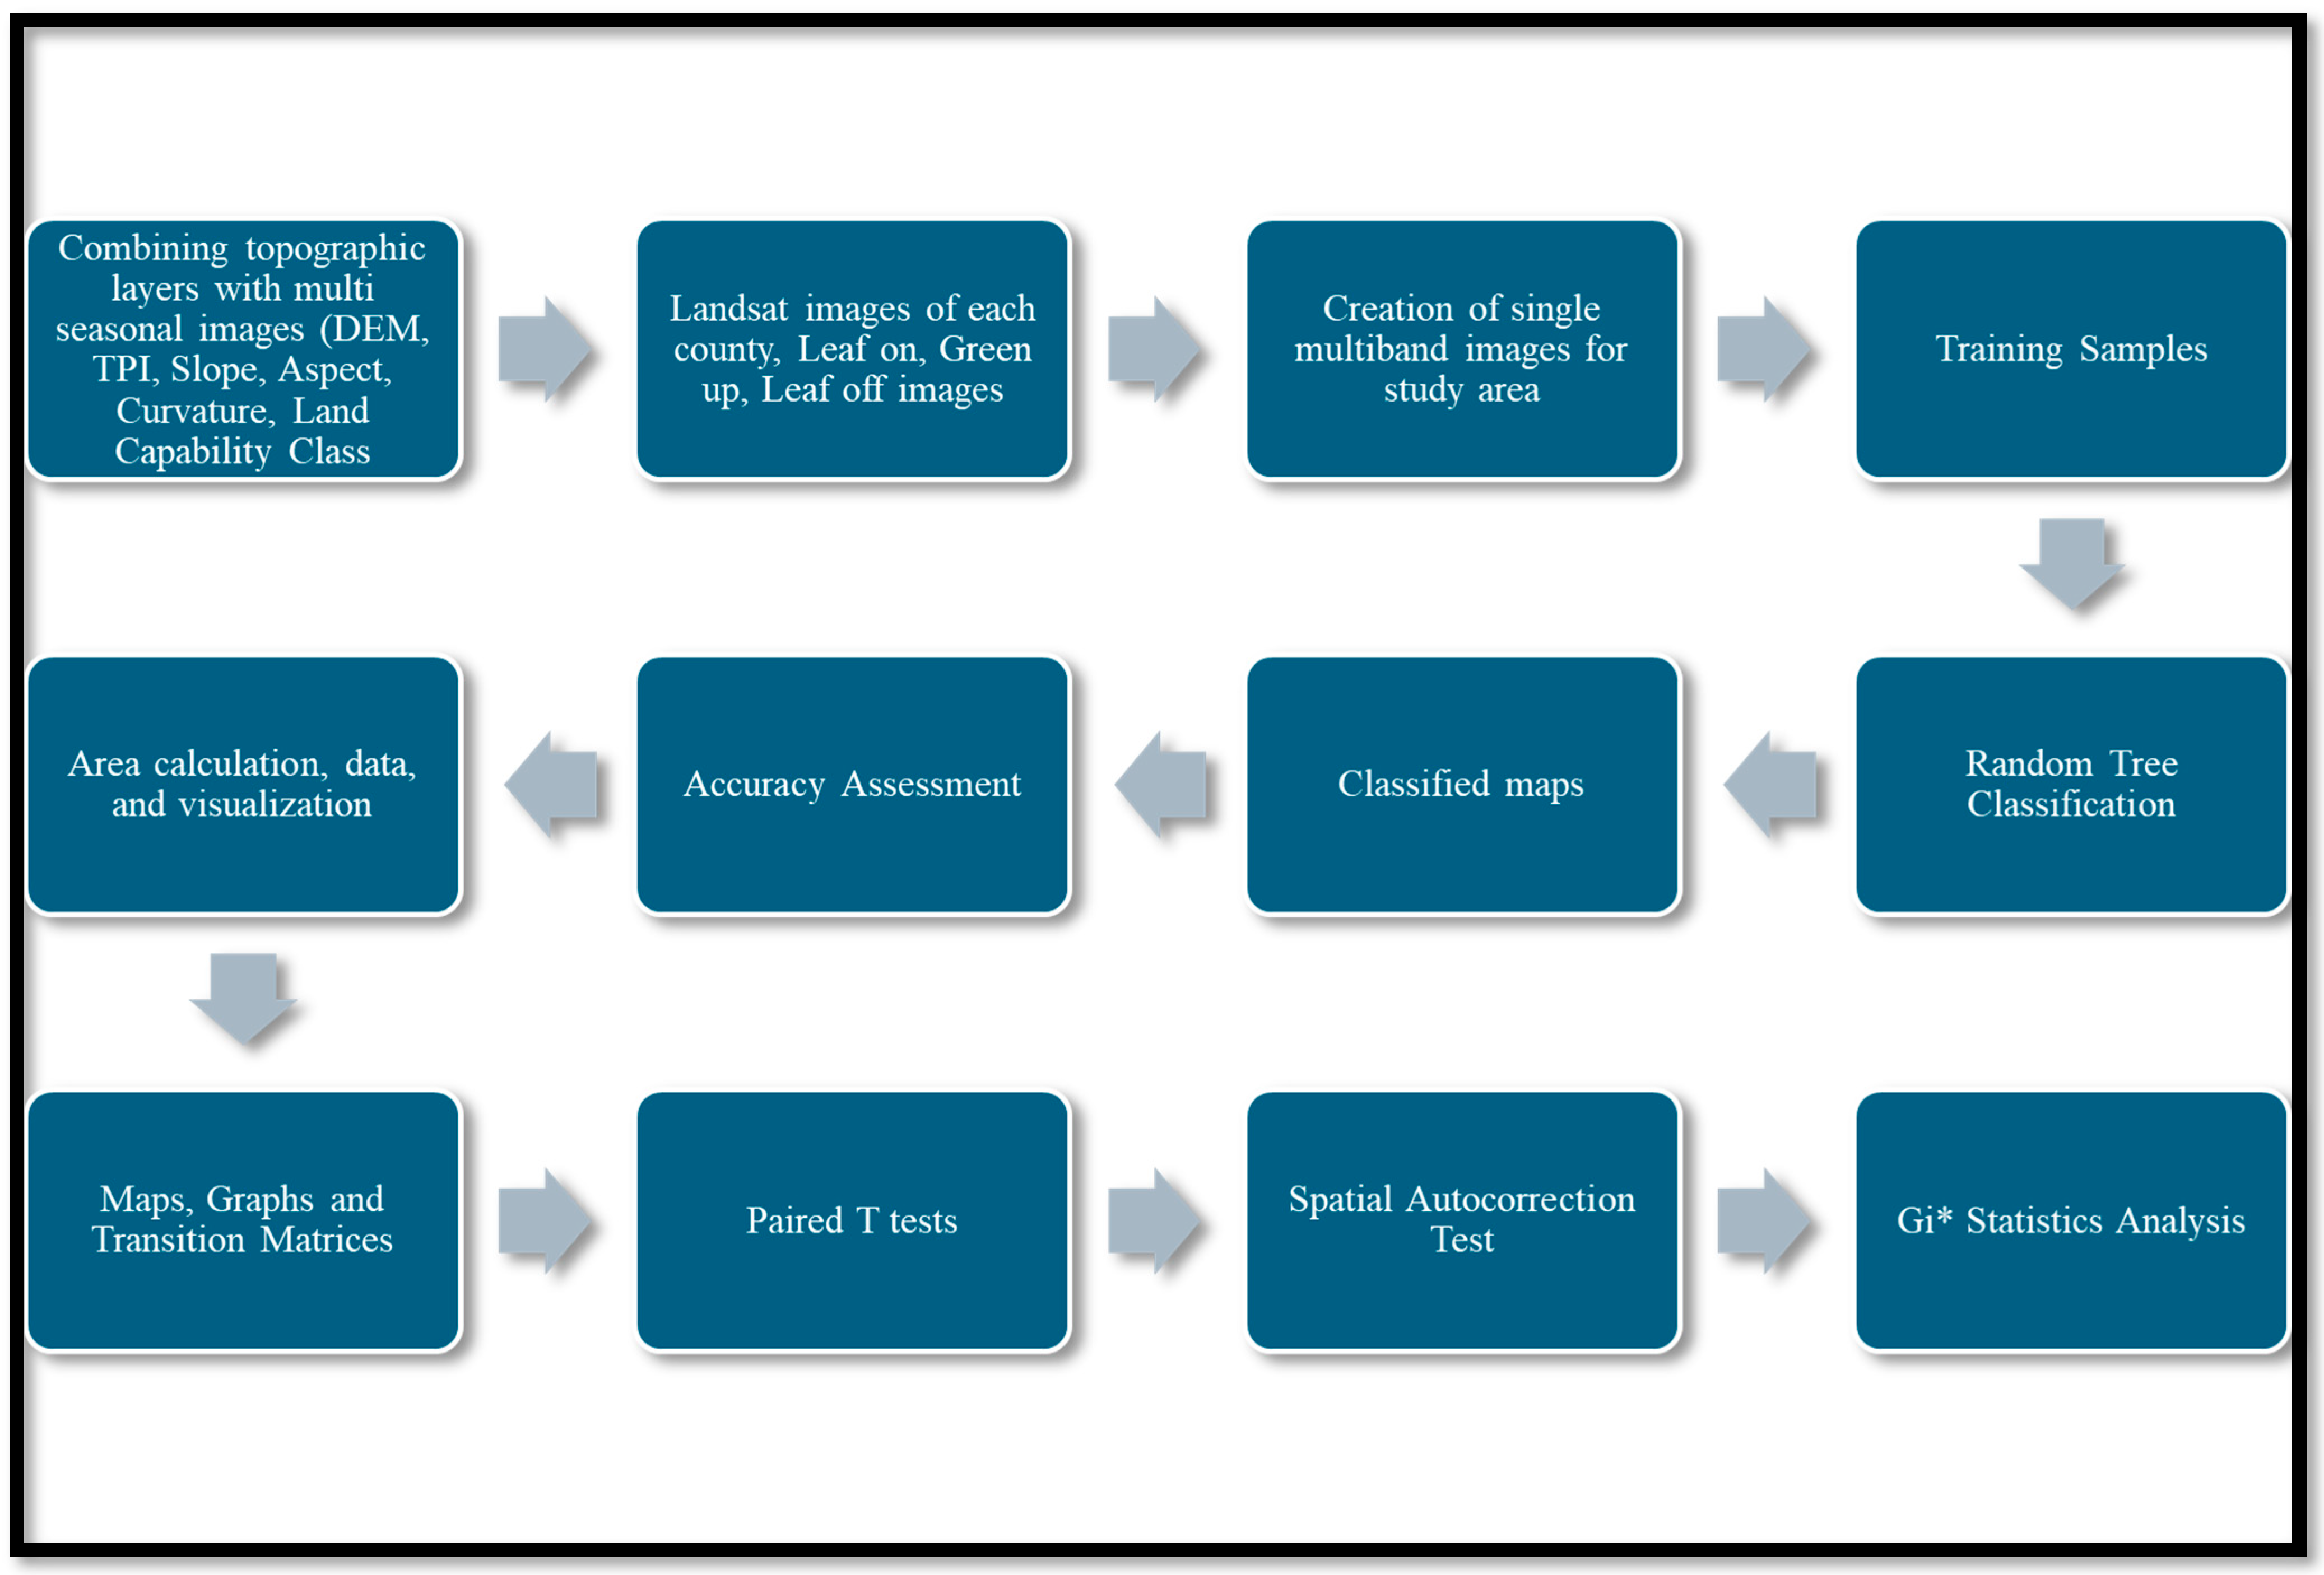
The paired t-tests facilitate the identification of significant land-cover changes overtime, shedding light on the magnitude and direction of these changes [64]. Through comparisons between different time periods, these tests help identify periods characterized by notable transformations, such as substantial increases or decreases in specific land-cover classes. A paired t-test was used to test the variability between land-cover percentage of land-cover classes areas between 2019 and 2004. This test evaluates the statistical significance of the observed changes in land-cover areas, distinguishing whether these changes are statistically significant or merely the result of random chance. By calculating the t-value and examining the corresponding p-value at a 10%, 5% and 1% significance level, the significance of the differences between land-cover areas was quantified. Figure 2 shows the workflow used in the land-cover change analysis.

3. Results

3.1. Topographic Attributes

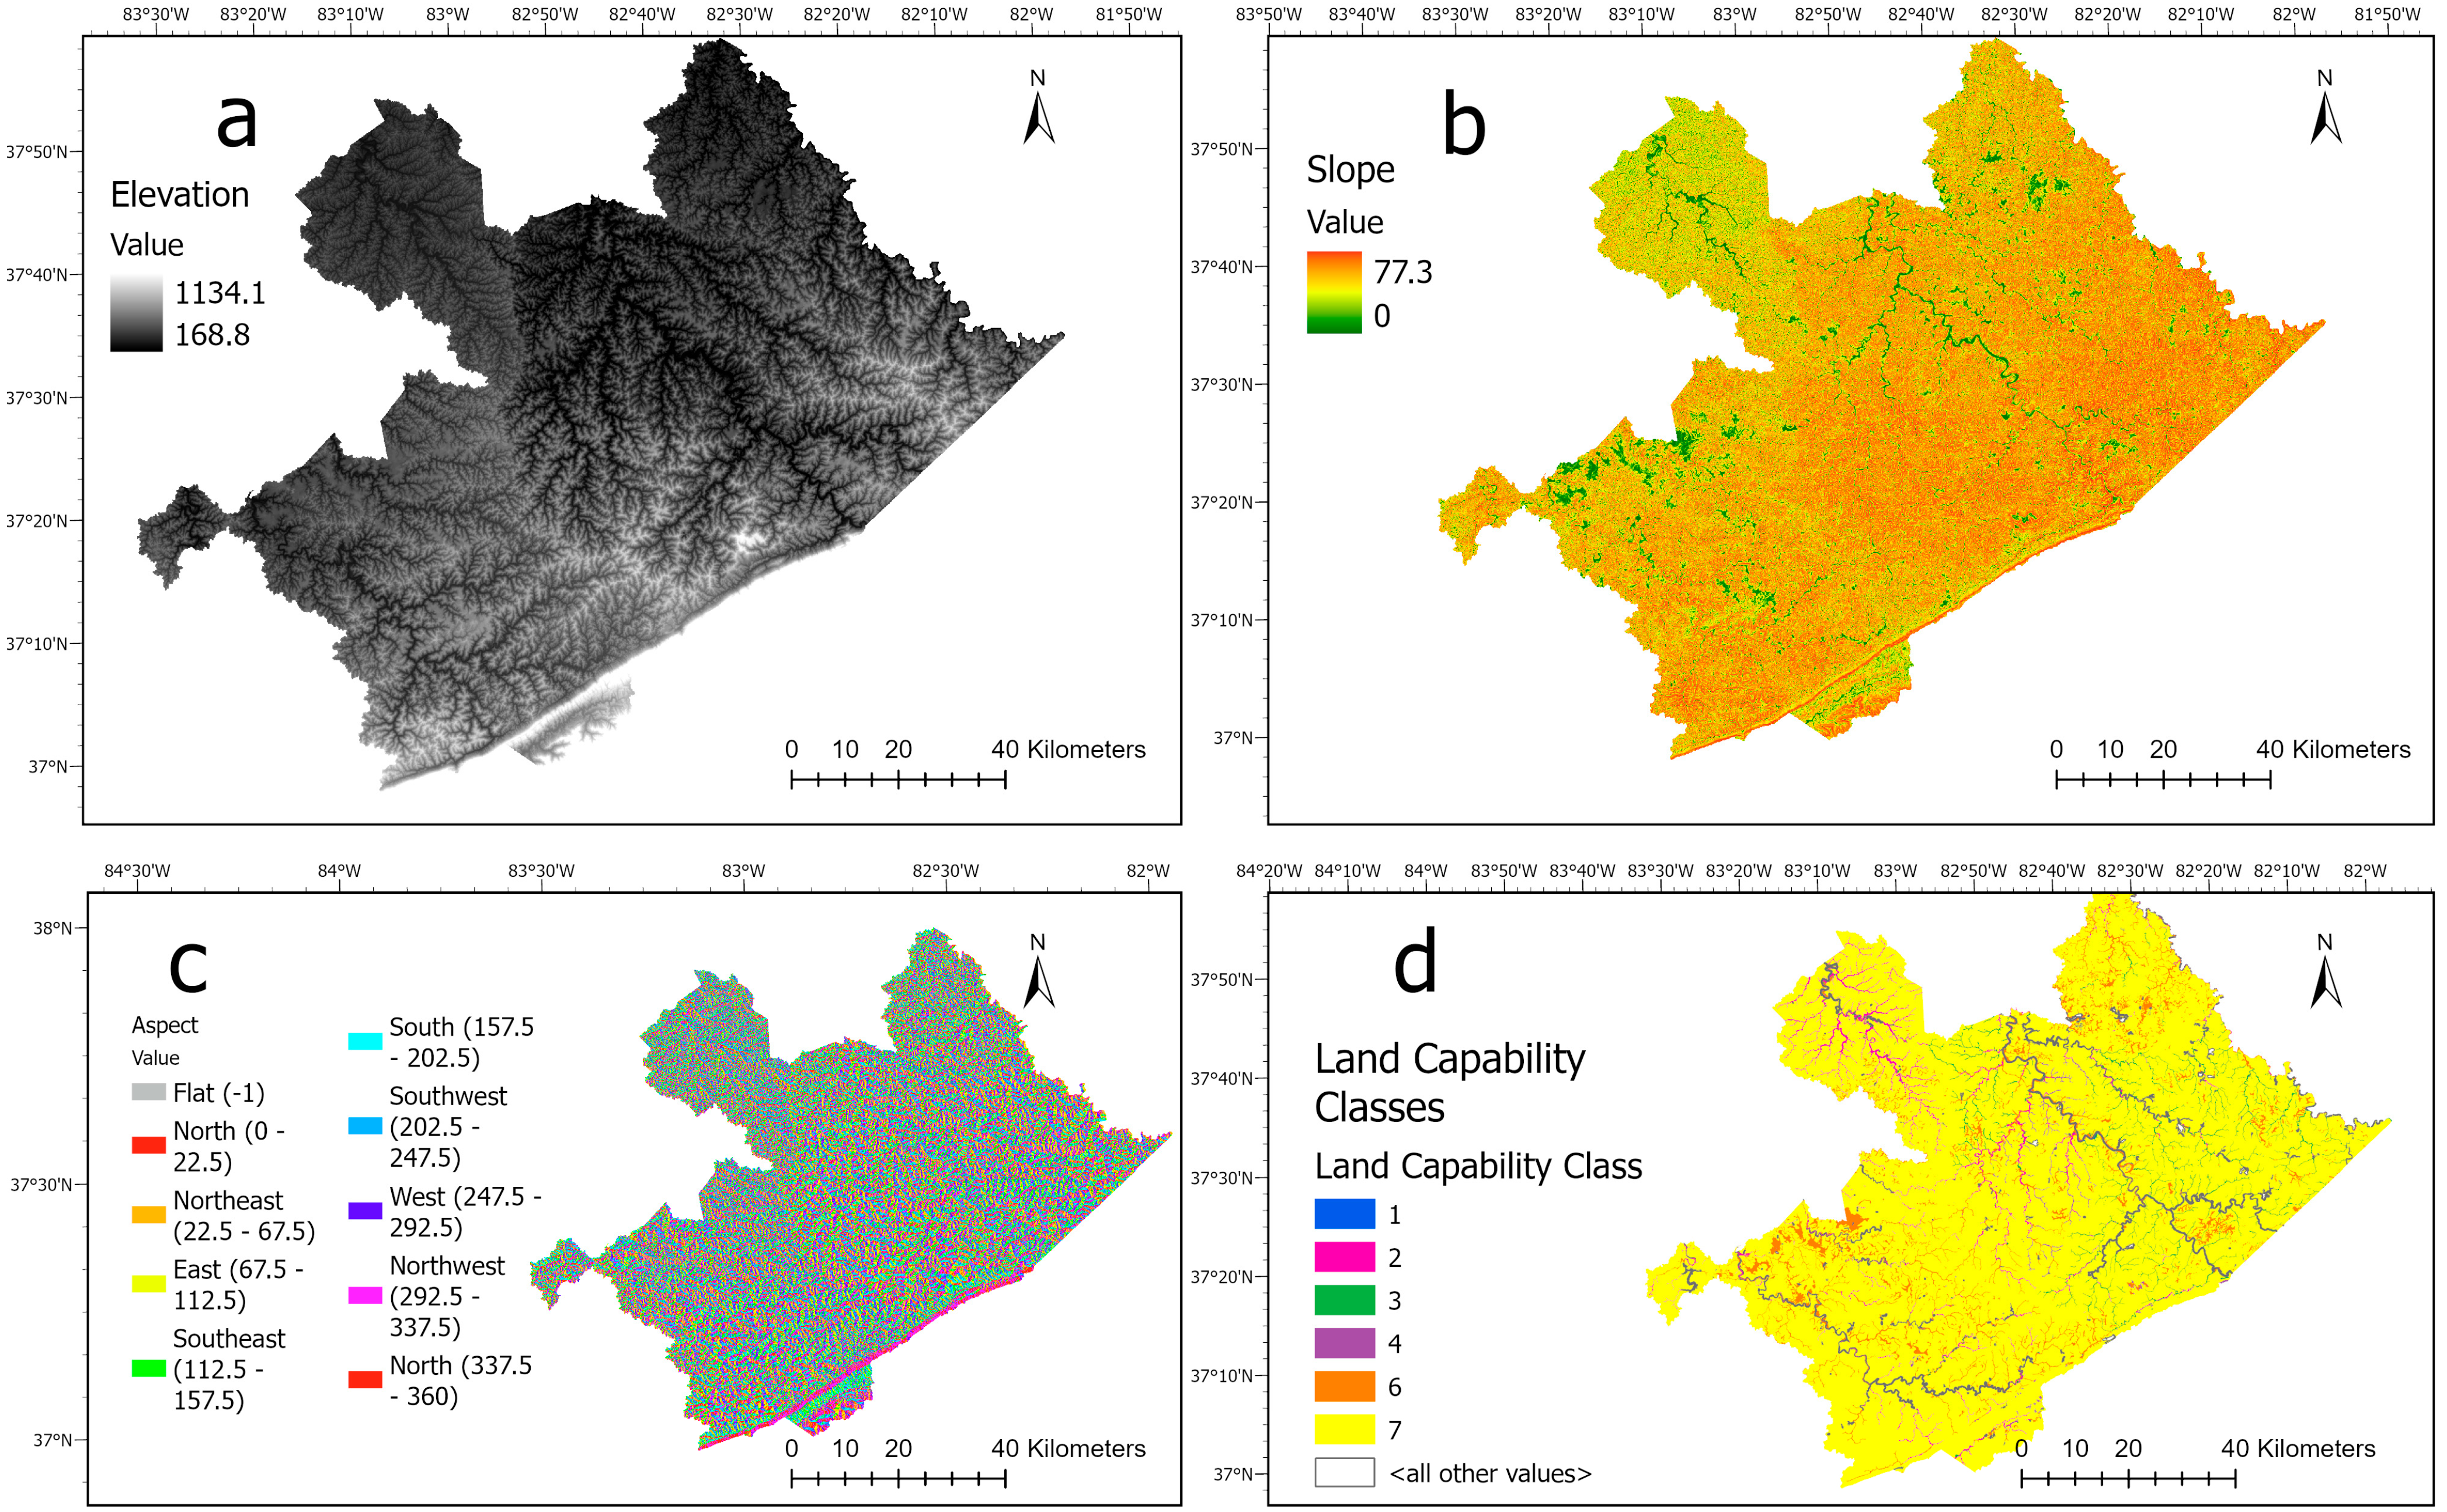
Figure 3 presents various attributes of our study area, including slope, aspect, digital elevation model (DEM), and land capability classes of the study area. The slope aspect maps exhibit a noticeable presence of southeastern slopes across all regions. The DEM reveals variations in altitude within the study area, ranging from the higher peaks of the Black Mountain and Pine Mountains in eastern Kentucky to the lower valleys and ridges (165–1135 m). The land capability classes indicate a distribution of classes suitable for agriculture (1 and 2). Most of the land suitable for agriculture can be found in the northern direction of the study area.

3.2. Land-Cover Change

There is an evident increment in developed land-cover, while barren land cover has been gradually decreasing from 2004 to 2019. The growth of housing stock, commercialization, and infrastructure associated with coal mining operations are the main causes of this trend. New residential constructions and coal mining infrastructure projects are responsible for the notable increase in developed areas between 2010 and 2016 [11,65]. By 2019, the marked increase in developed land reflects a notable transformation of the landscape, potentially encroaching upon natural habitats and agricultural lands [65]. With these developments and related land reclamation efforts, there is a corresponding decrease in undeveloped territory [11,65].
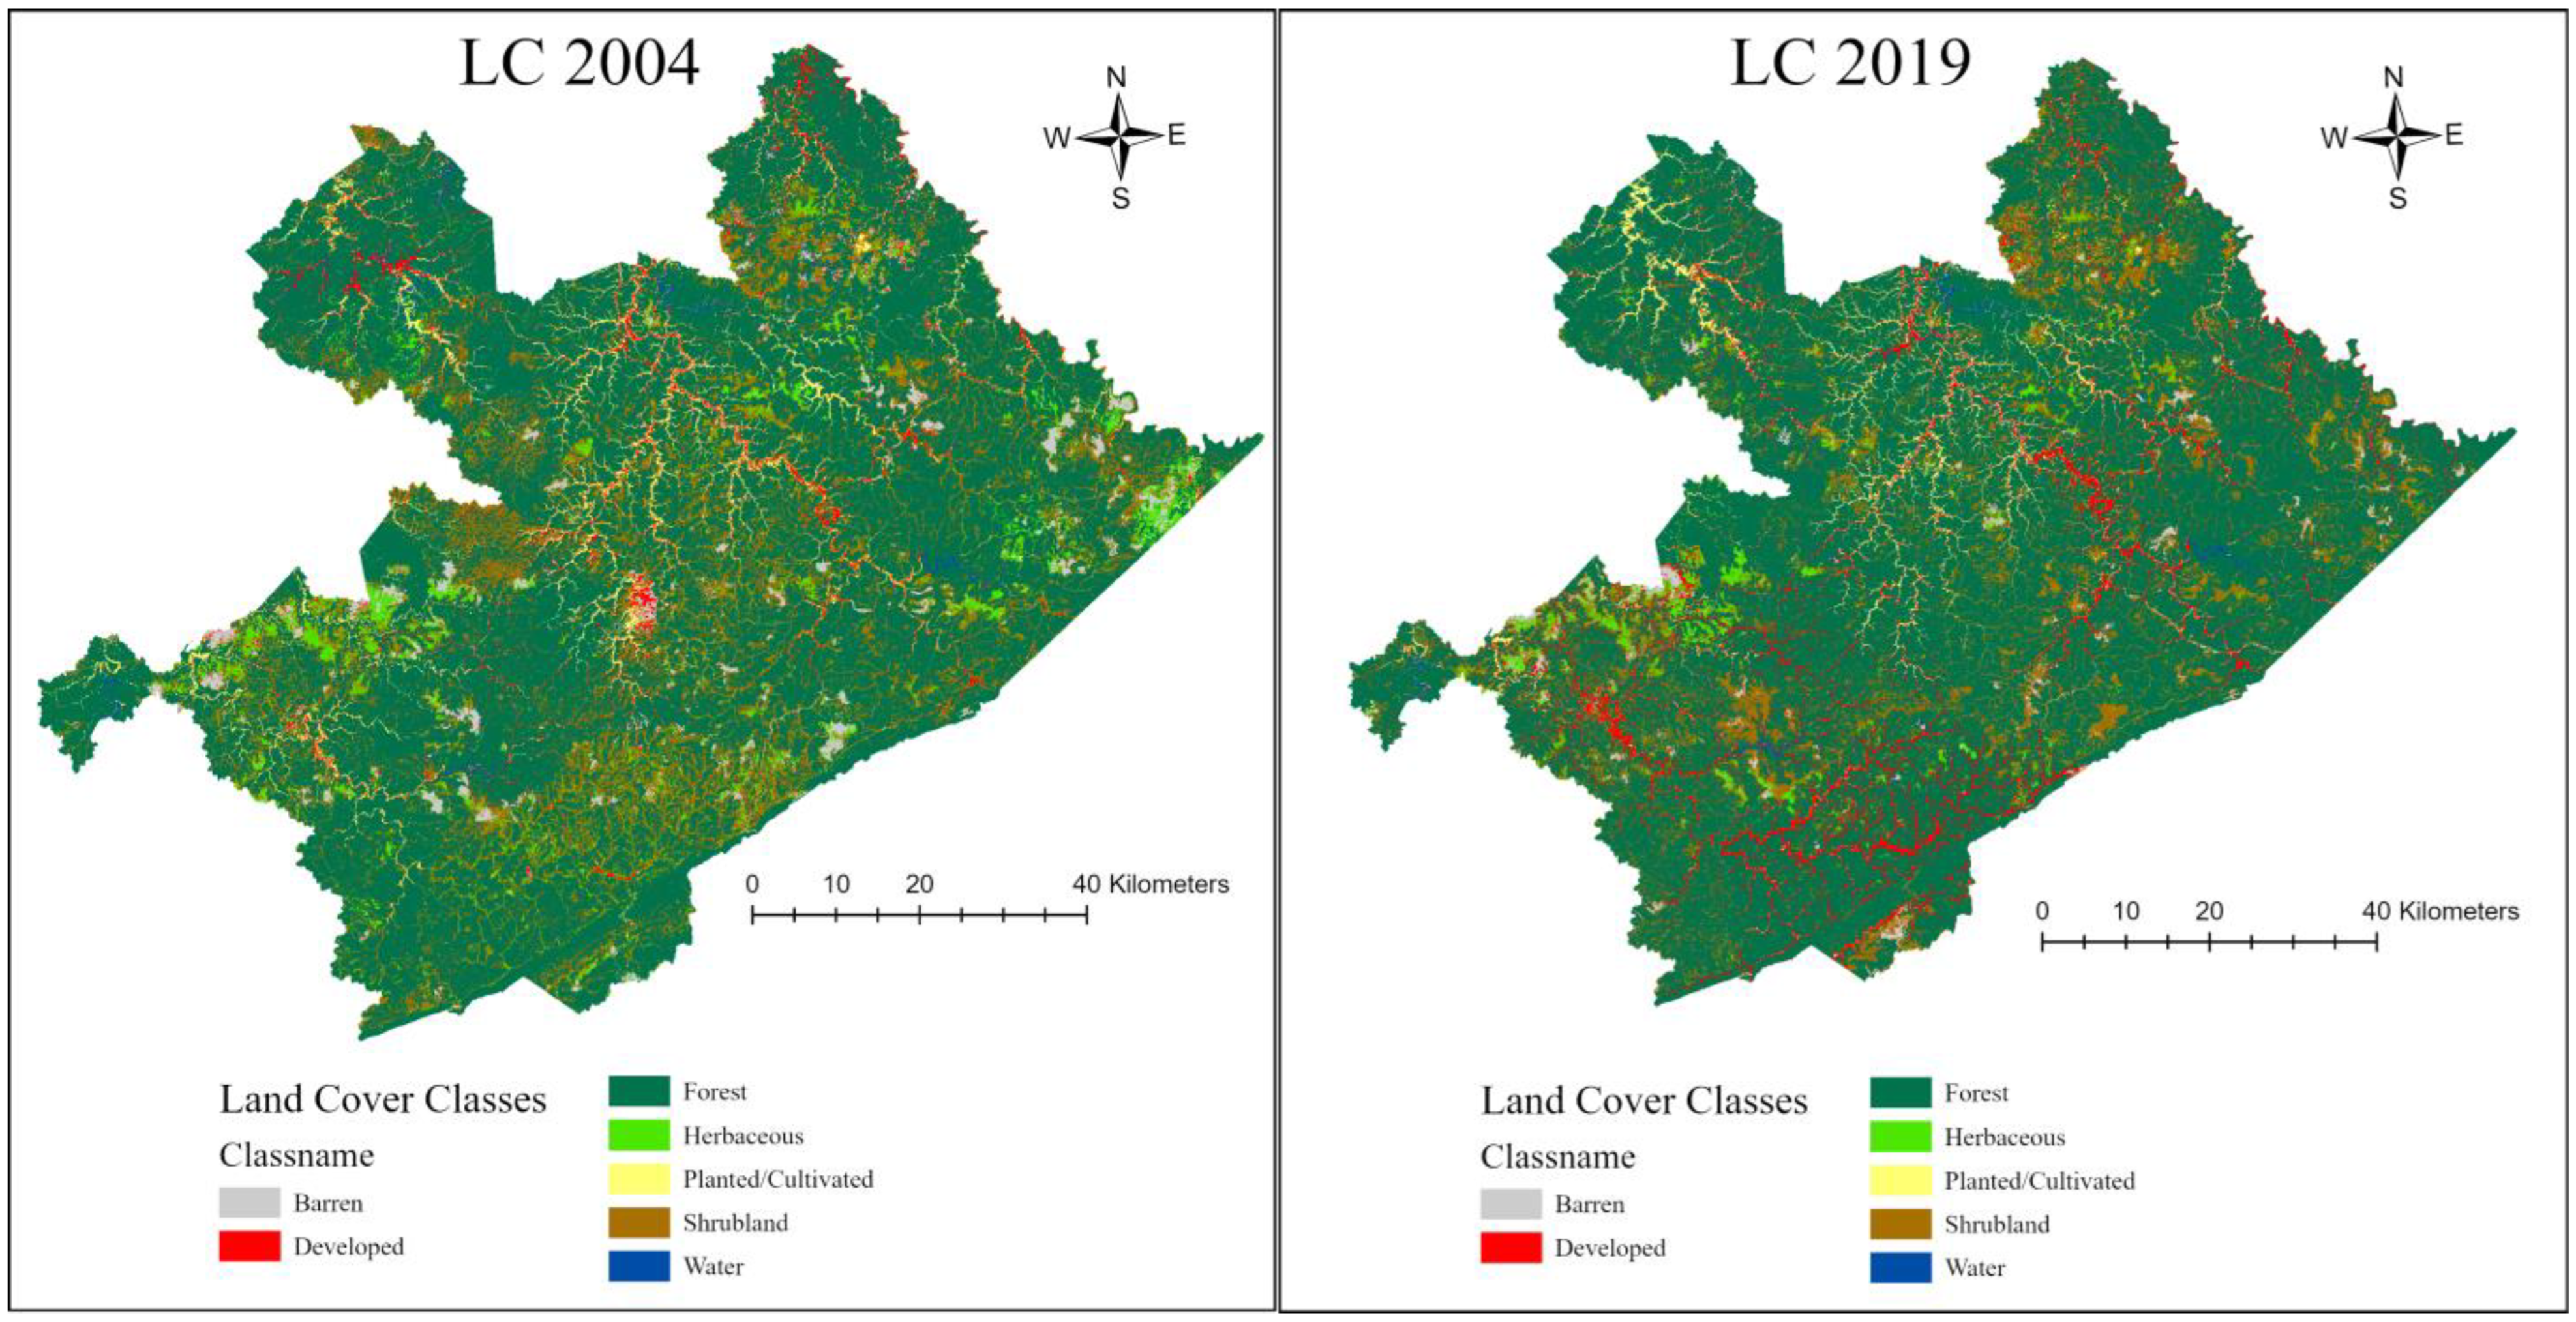
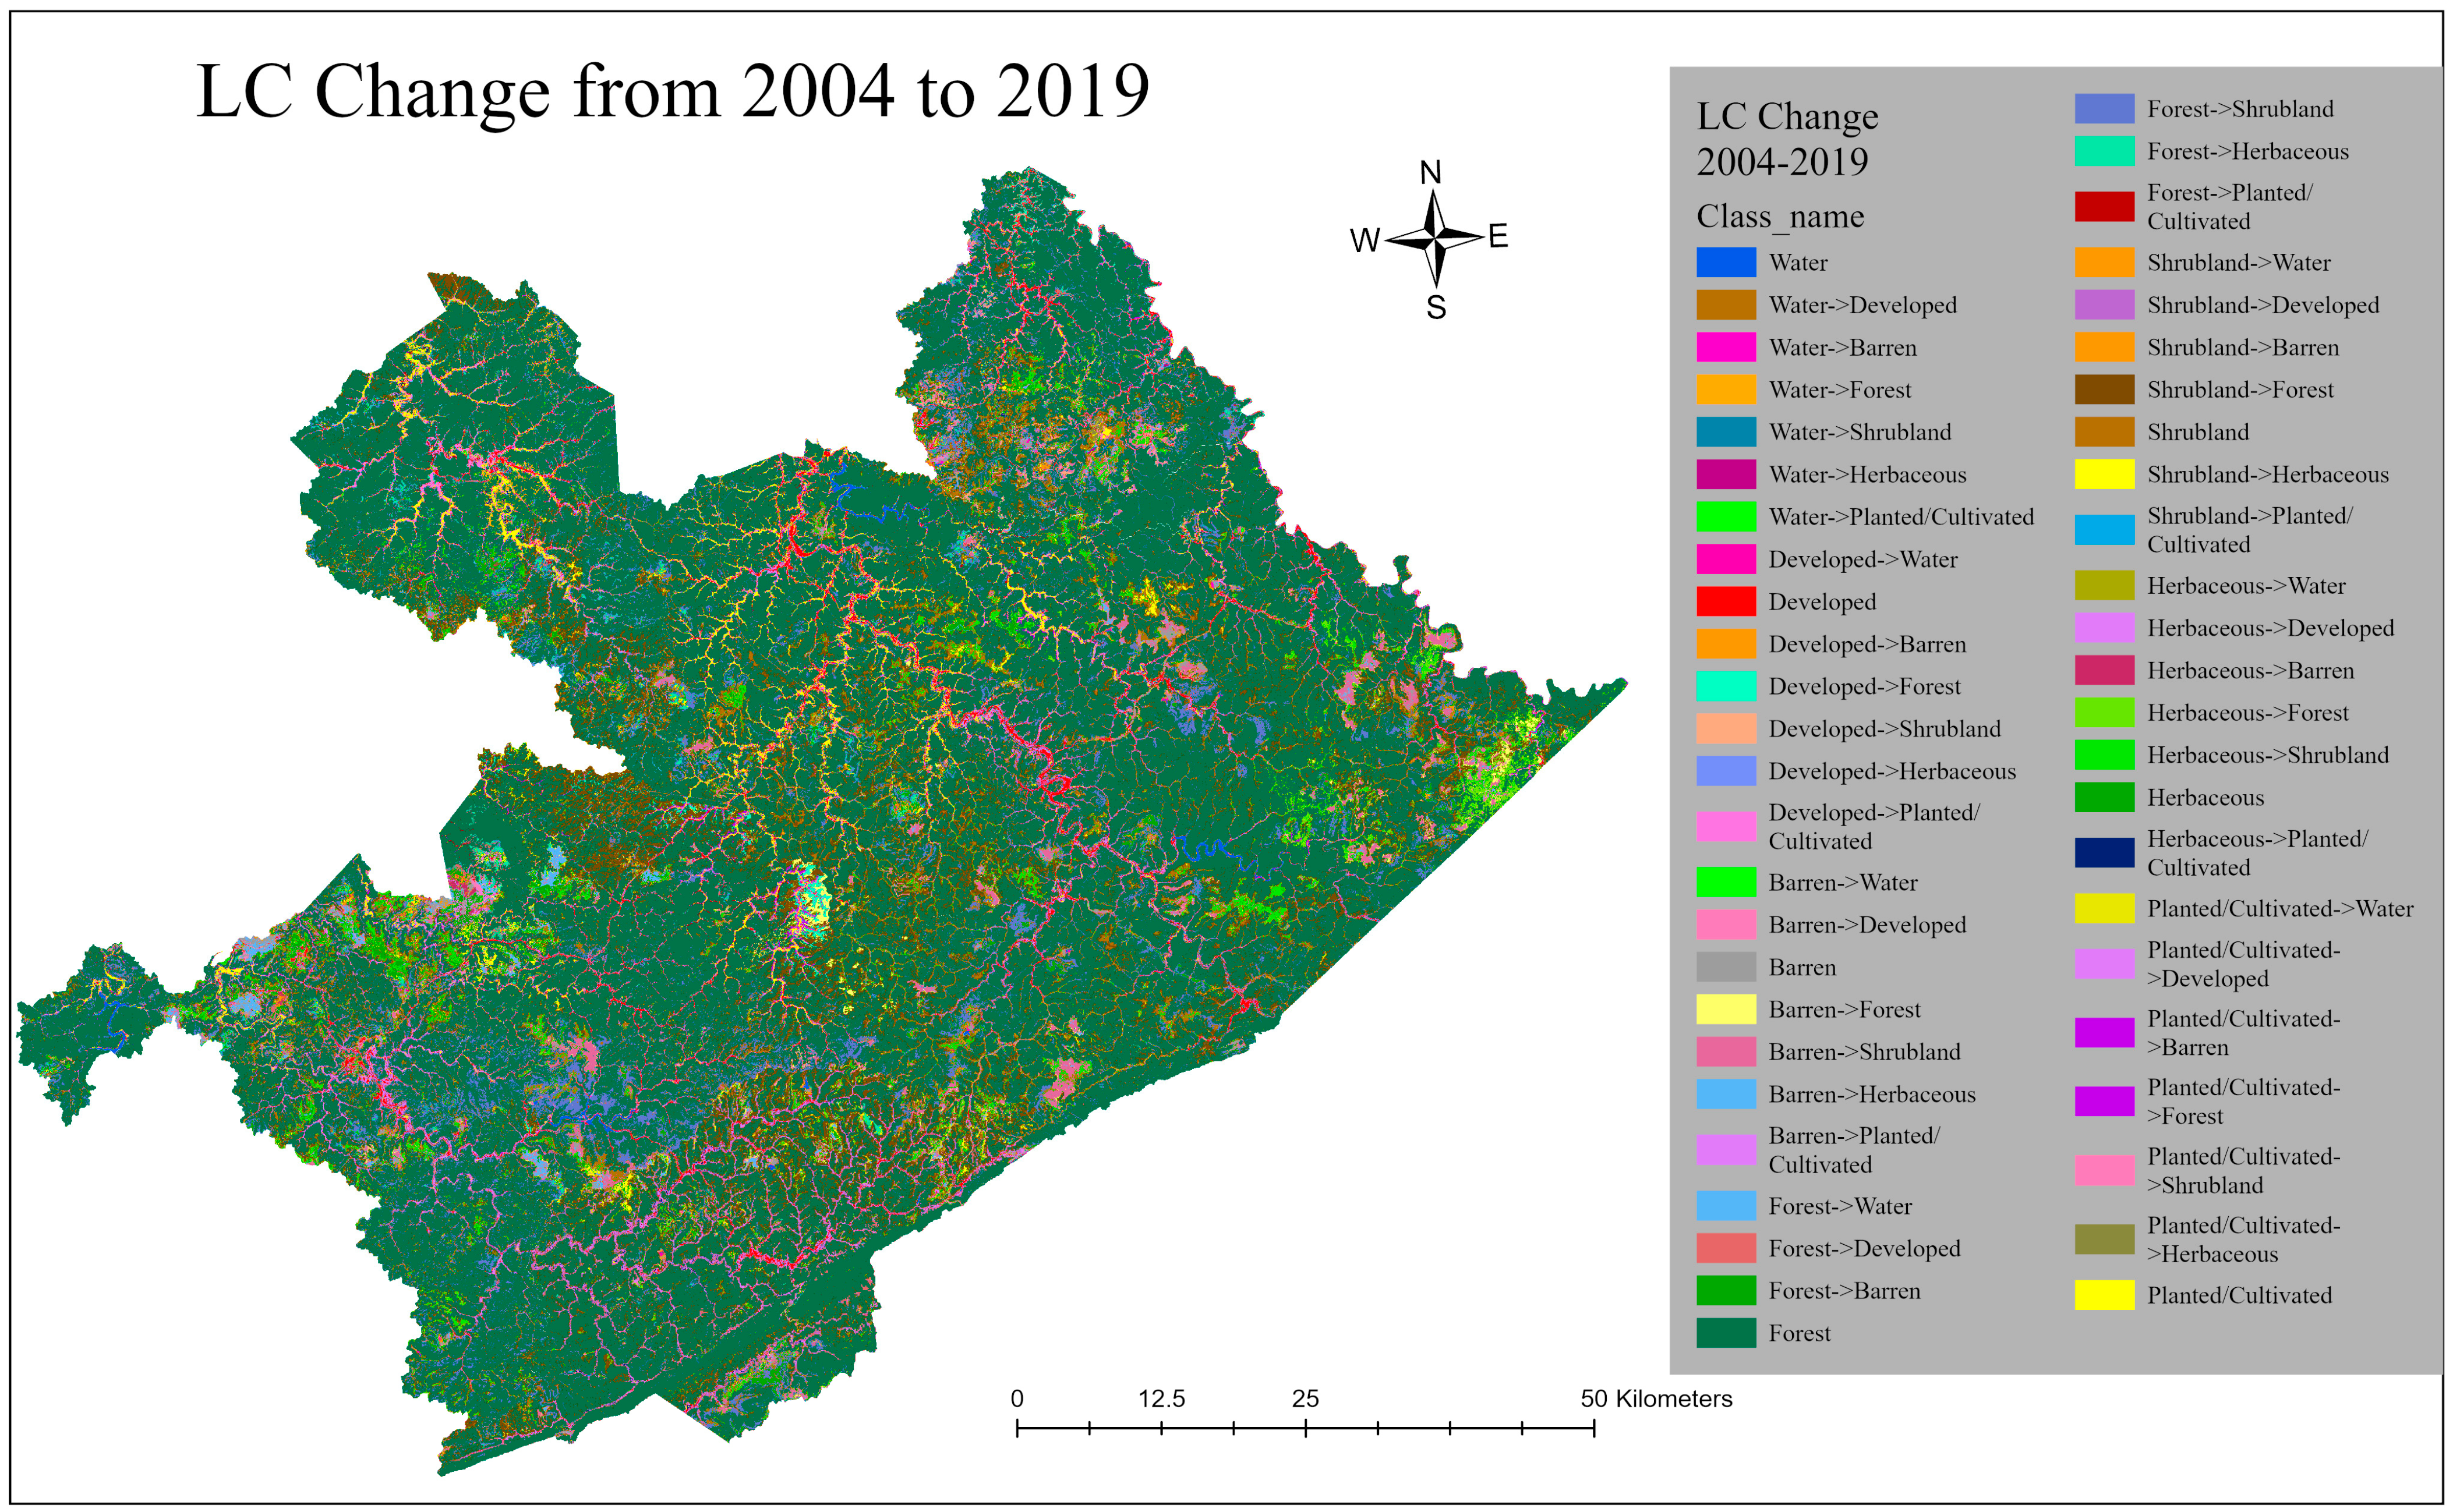
The vivid increase in developed areas and forests and the decrease in the barren land area can be seen in Figure 4. Figure 5 shows the land-cover change between 2004 and 2019 and between the classes (from–to) in the study area.
Figure 6a provides a visual representation of the changing trends in the water area in the study area over the study period. The analysis of water area changes reveals varying extents of water bodies within the study area. Between 2004 and 2006, there was a notable increase in the water area, expanding from 44.5 to 77.5 sq km. From 2006 to 2010, there was a significant expansion in the water area, reaching 112.1 sq km. This indicates further growth in water bodies within the coal field area, potentially driven by increased rainfall, changes in land use practices, and the establishment of new water bodies due to mining activities [66]. However, the trend reversed between 2010 and 2016, with a decrease in the water area from 112.1 to 55.0 sq km. This decline could be attributed to reduced rainfall, increased evaporation, alterations in hydrological properties, and human interventions resulting in the loss or shrinkage of water bodies [67,68]. In the final year of the study, 2019, the water area slightly decreased compared to 2016, measuring 50.0 sq km. From 2004 to 2019, we see a decrease in planted/cultivated land area indicating decrease in arable land and agriculture activities in study area.
From Figure 6a, we can visualize the trend in developed area changes that demonstrates a consistent and progressive increase in developed or built-up areas within the study area. From 2004 to 2006, the developed area expanded notably from 174.3 to 240.3 sq km, indicating rapid urbanization or land conversion for infrastructure and human settlements. This growth can be attributed to factors such as population growth, economic development, and industrial activities in the seven counties. Between 2006 and 2010, the developed area further increased from 240.3 to 267.4 sq km, indicating continuous urbanization and land conversion for built-up purposes.
The trend continued between 2010 and 2016, with a significant growth in the developed area from 267.4 to 335.7 sq km. This suggests continued urban expansion and the conversion of land for residential, commercial, and industrial development. In 2019, the final year of the analysis, the developed area expanded even further to 392.8 sq km compared to 2016. This indicates a continued incremental trend in urban areas and the conversion of land for human settlements and infrastructure.
Figure 6a also demonstrates the land-cover change analysis in the study area over five years (2004, 2006, 2010, 2016, and 2019) for barren land, which reveals fluctuations, indicating a decrease from 179.3 sq km in 2004 to 90.8 sq km in 2019 in barren land, with some variations in between. From 2004 to 2006, there was a slight decrease in barren land, indicating initial reclamation efforts or land conversion. However, from 2010 to 2016, there was an increase in barren land, potentially due to ongoing mining activities or slower reclamation progress.
In 2019, there was a substantial decrease in barren land, indicating renewed reclamation efforts and successful conversion into vegetation cover. These observations highlight the dynamic nature of land reclamation and mining activities in the coal field area. The analysis of land-cover change in the research area from Figure 6a, reveals noteworthy patterns concerning the area of planted/cultivated land over a span of five years (2004, 2006, 2010, 2016, and 2019). Reclamation efforts in the study area focused on restoring forest land, shrubland, and herbaceous areas, with minimal attention given to planted/cultivated land. The findings indicate a consistent decline in the planted/cultivated land area throughout the study period, decreasing from 211.2 sq km in 2004 to 190.6 sq km in 2019. The limited extent of planted/cultivated land suggests potential challenges or factors hindering agricultural activities in the study area. The growth in reclaiming and developing planted/cultivated land indicates a need for support or interest in expanding farmlands in coalfield counties [69].
The continuous expansion of forest land area in Figure 6b signifies the positive impact of reclamation efforts [70]. Shrubland, herbaceous, planted/cultivated, and water areas have declined over the years between 2004 and 2019, as shown in Figure 6b. Along with the gradual growth of developed and forest areas, a decrease in the barren and planted/cultivated land cover was expected.
Figure 6b presents the change in forest cover during the 2004–2019 period in the study region. The measured forest land area for each year is as follows: 5051.8 sq km in 2004, 5084.5 sq km in 2006, 5083.94 sq km in 2010, 5158.6 sq km in 2016, and 5305.3 sq km in 2019. From 2004 to 2006, there was a modest increase in the forest land area, indicating the positive impacts of reclamation activities and natural forest regeneration. Between 2006 and 2010, the forest land area remained relatively stable, indicating the maintenance of existing forest cover. Between 2010 and 2016, there was a slight expansion in the forest land area, suggesting ongoing reclamation efforts and the growth of forest cover. This demonstrates the likelihood of the success of land reclamation and the establishment of forested ecosystems in the study area [71]. In 2019, the final year of analysis, there was a further increase in the forest land area compared to 2016, indicating continuous reclamation activities and sustained expansion of forested areas in the study area. Despite mining activities, the study area has maintained a relatively stable or slightly increasing trend in forest land cover over the study period. This highlights the success of reclamation efforts and the restoration of forested ecosystems. Throughout the study period, the analysis shows a stable or relatively increased forest area and shrubland. This might be because of the growth of shrubland, plant species and forest vegetation in the previously mined barren land areas.
The analysis of land-cover changes in the coalfield area over five years (2004, 2006, 2010, 2016, and 2019) from Figure 6b reveals the presence of herbaceous land characterized by grasses and non-woody plants. The measurements for the herbaceous land area were as follows: 343.5 sq km in 2004, 358.9 sq km in 2006, 377.2 sq km in 2010, 229.5 sq km in 2016, and 155.8 sq km in 2019. The trend in an herbaceous land area shows varying levels of vegetation cover within the coalfield area throughout the study period. Between 2004 and 2006, there was a slight increase in herbaceous land area, indicating successful reclamation efforts and the establishment of vegetation on previously disturbed or mined land. Reclamation activities aimed at restoring the land to a natural state contributed to this growth. In 2019, the herbaceous land area experienced a drastic decrease compared to 2016, indicating a continuation of the declining trend observed in the previous period. Further analysis is necessary to understand the factors influencing this decrease and to determine appropriate conservation measures.
Figure 6b also shows the analysis of shrubland land-cover changes in the study area over five years (2004, 2006, 2010, 2016, and 2019). It reveals the presence and transformation of shrubland within the study area. The data for the shrubland area during this period shows variations: 1137.15 sq km in 2004, 908.5 sq km in 2006, 858.3 sq km in 2010, 930.8 sq km in 2016, and 957.6 sq km in 2019. The trend in shrubland area indicates fluctuations in the extent of vegetation cover, primarily consisting of shrubs and low-lying plants within the study area over the study period. Between 2004 and 2006, there was a noticeable decrease in shrubland area, suggesting potential changes in land use or shifts in vegetation types. Continuing from 2006 to 2010, the shrinkage of shrubland area persisted, indicating ongoing land-cover transformations or reclamation activities. This suggests the success of reclamation efforts in converting shrubland into desired land-cover types within the coalfield area. However, between 2010 and 2016, there was a slight increase in the shrubland area, possibly indicating changes in land use practices or natural regeneration processes. Further investigation is necessary to determine the underlying factors driving the expansion of shrubland during this period. In the final year of the analysis, 2019, there was a marginal increase in the shrubland area compared to 2016, indicating a continuation of the observed trend. Further analysis and examination are needed to identify the specific factors influencing this increase.
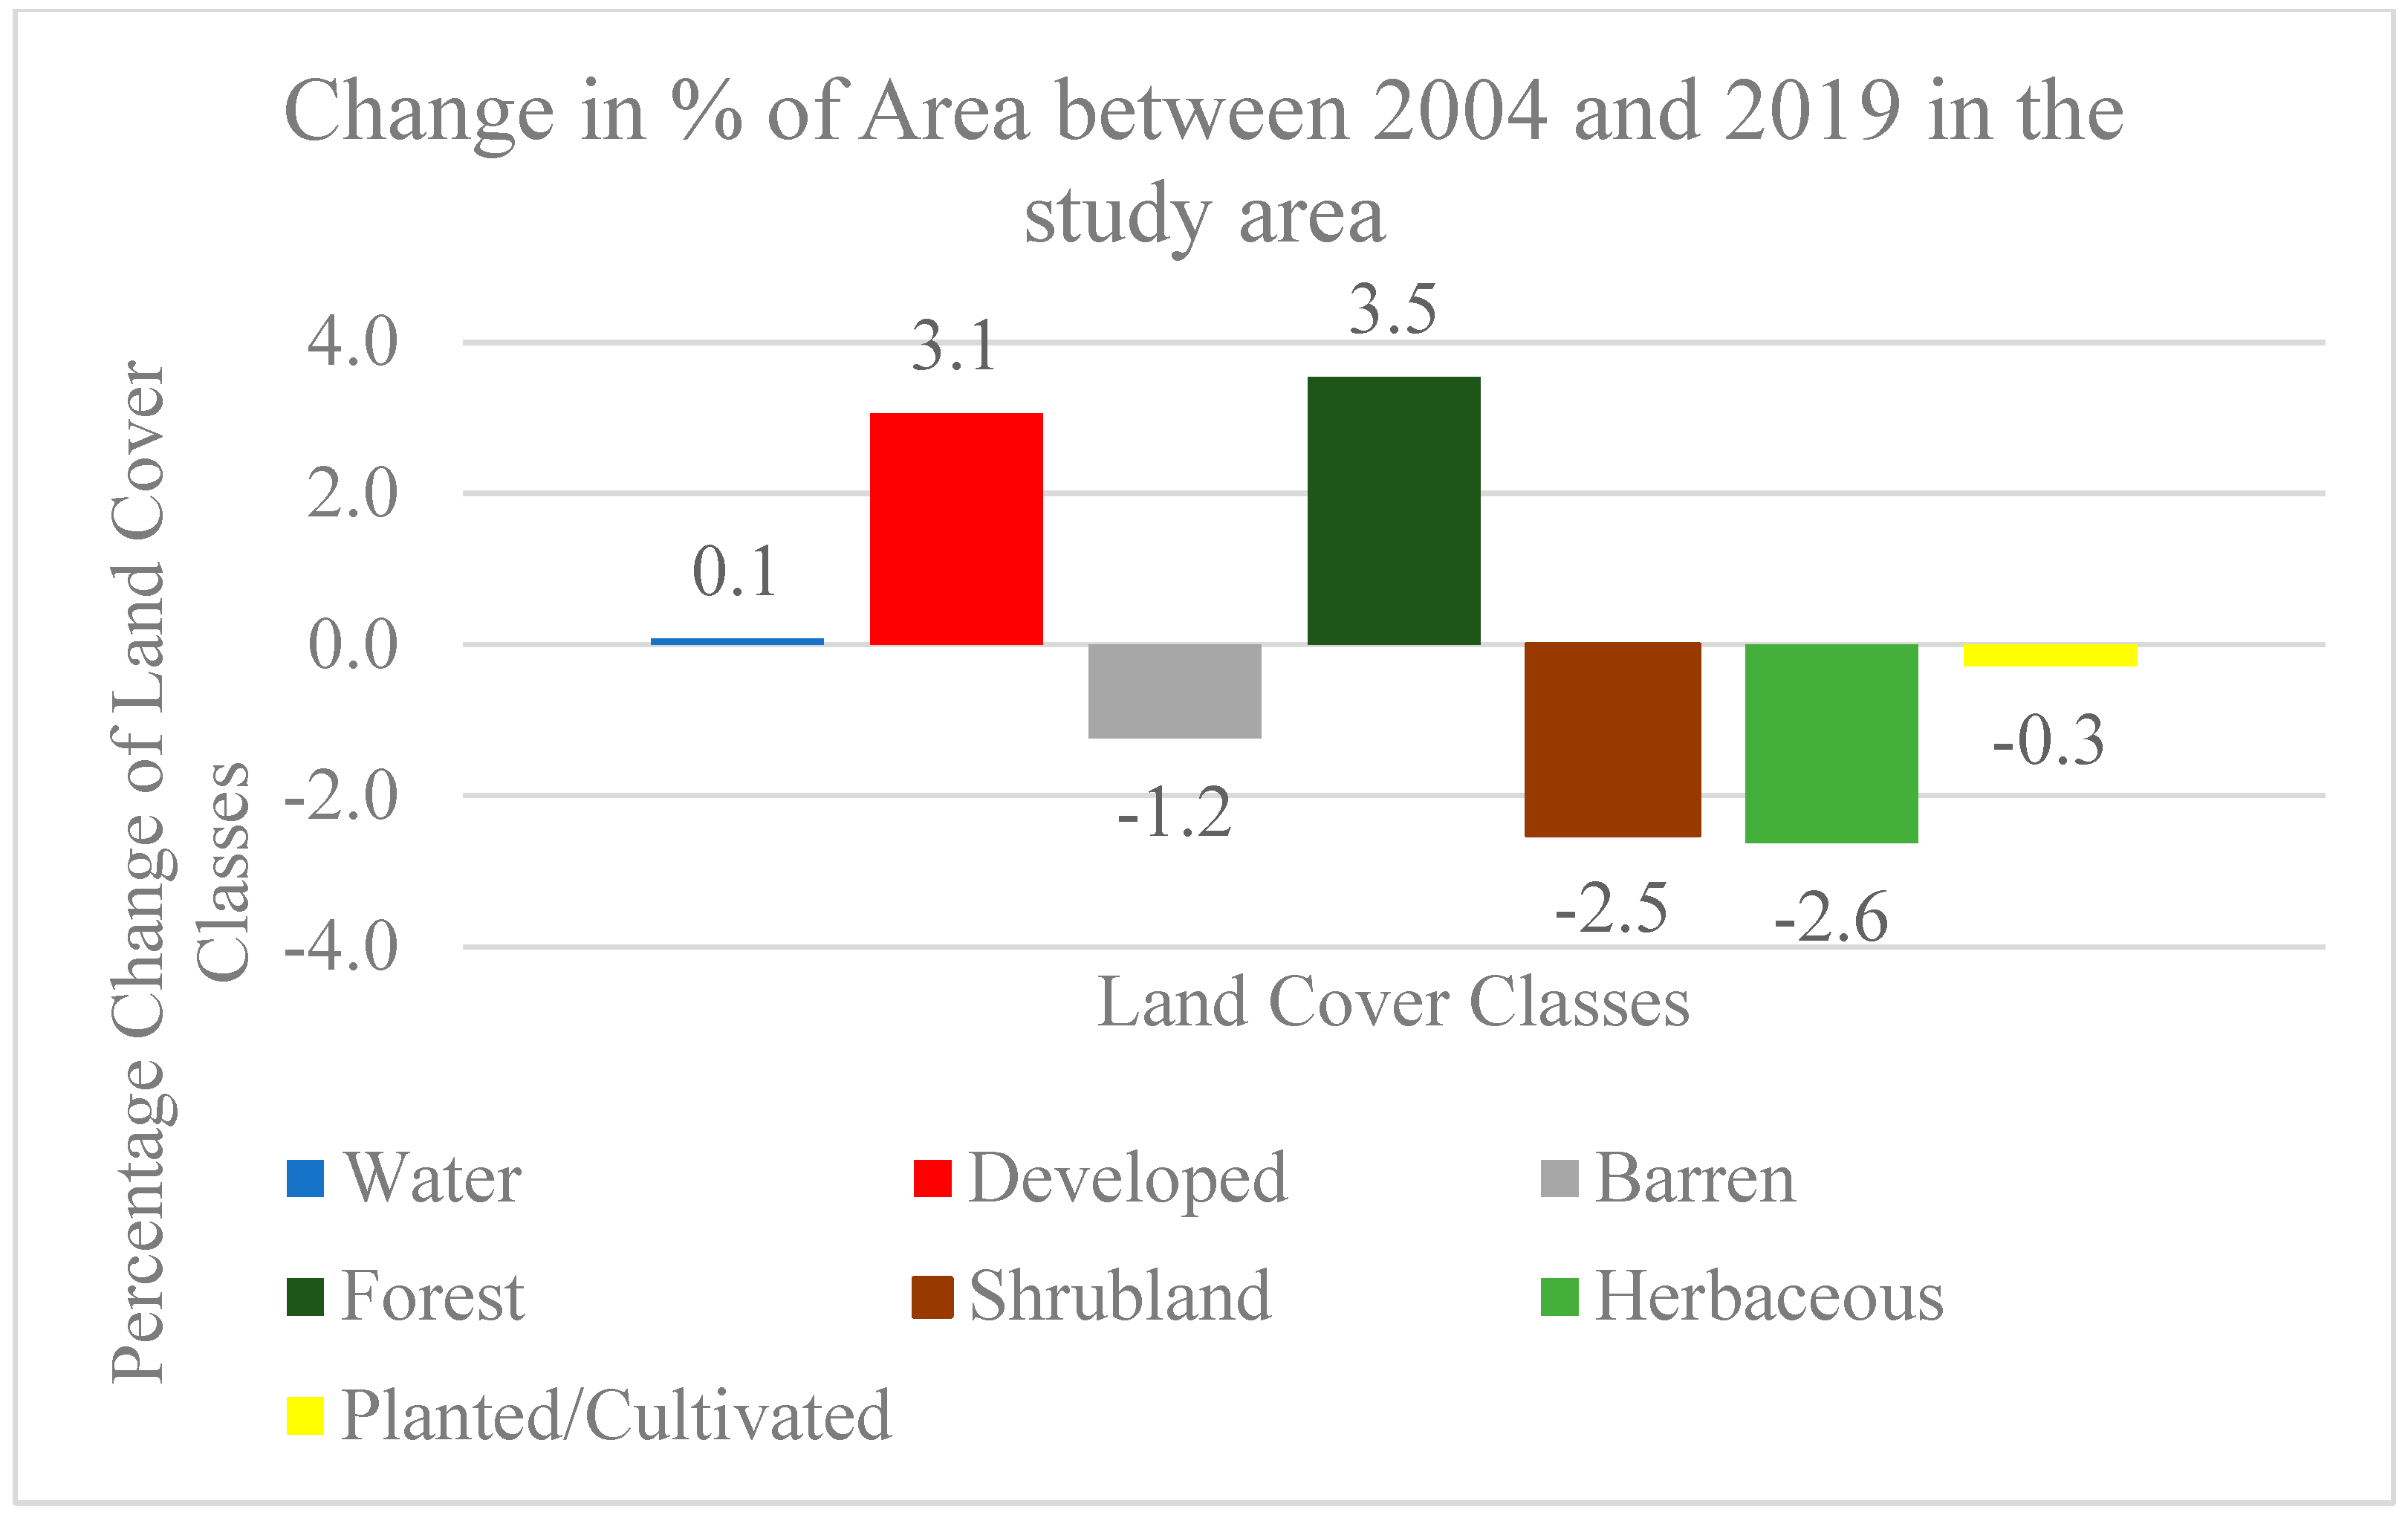
Figure 7 summarizes changes in land-cover classes in percentages from 2004 to 2019. The decline in shrubland, herbaceous areas, and planted/cultivated land may be linked to shifting land-use practices and ecological dynamics. The conversion of shrubland and herbaceous areas to forest or developed land could be driven by natural succession processes, land management decisions, or changes in agricultural practices. Additionally, the slight decrease in planted/cultivated land could be influenced by factors such as changes in agricultural practices, crop rotation, or land-use diversification. Forest restoration programs and afforestation projects may have been implemented to enhance ecosystem services, restore biodiversity, and mitigate the impacts of previous land-use practices like mining or deforestation [72]. Barren land often refers to areas that have been stripped of vegetation or degraded due to mining, erosion, or other factors. Reclamation efforts aim to restore these areas by applying techniques such as reseeding, soil stabilization, and vegetation establishment, leading to a decrease in barren land cover [67]. The land-cover changes between 2004 and 2019 were validated using paired t-tests in the study area’s 191 Census Block Groups. The t-test showed statistically significant changes in developed, barren, forest, shrubland and herbaceous land-cover between 2004 and 2019 as shown in Table 3.
The paired t-test results from Table 3 illustrate whether the land-cover changes in study area between 2004 and 2019 are statistically significant or not. Although there was a non-significant increase in water cover, indicating minimal changes in hydrological dynamics, developed land cover exhibited a significant increase, suggesting considerable urban expansion related to surface coal mining and reclamation activities. This expansion is likely attributed to the development of infrastructure necessary for mining operations. Reclamation efforts have been successful in transforming previously barren areas into productive ecosystems, as indicated by the significant decrease in barren land cover and significant increase in forest cover, reflecting reforestation practices. The shrubland cover showed a significant decrease, possibly due to changes in vegetation types or land use modifications. Herbaceous cover also significantly decreased, indicating potential shifts in the composition and abundance of non-woody plants. The non-significant decrease in planted/cultivated land cover implies potential impacts on agricultural areas resulting from mining activities. Overall, these t-test results suggest substantial land-cover changes in the study area due to ongoing surface coal mining and reclamation. Successful reclamation efforts have led to the conversion of barren areas into productive ecosystems, including the establishment of forests. However, these changes have also led to urban expansion and potential effects on herbaceous and cultivated land covers.

3.3. Land-Cover Transition

The dominant transitions among land-cover classes reveal interesting patterns, as shown in Table 4. A transition of 15.3 sq km from water to forest suggests the expansion of forested areas into water bodies, potentially driven by conservation projects or afforestation initiatives. These types of transitions are found to be driven by anthropogenic causes [73]. The transition of 27.9 sq km from developed to planted/cultivated indicates the conversion of urban areas into agricultural land, potentially driven by the need for food production or agricultural expansion. The transition of 90.1 sq km from barren to shrublands indicates natural succession or favorable conditions for shrub growth in previously barren areas, which could be a result of reclamation efforts. The transition of 135.5 sq km from herbaceous to shrublands implies changes in vegetation composition, influenced by natural succession, land management practices, or shifts in agricultural practices [68,69]. Lastly, the transition of 60.5 sq km from planted/cultivated to developed indicates the conversion of agricultural land into urban or built-up areas, potentially driven by urbanization or infrastructure development projects [74].

3.4. Spatial Autocorrelation Results

Moran’s, I index was calculated using the inverse distance and the Euclidean distance method. Spatial autocorrelation (Global Moran’s I) indices were computed for the land-cover classes of study area for 2004, 2006, 2010, 2016, and 2019 as shown in Table 5. The spatial autocorrelation reports were computed for the 191 Census Block Groups (CBGs) of the study area. Moran’s I value ranges from 0 to 1, where 0 represents no clustering and 1 represents a high amount of clustering.
This clustering pattern may be influenced by various factors related to the study area’s history of surface coal mining and reclamation. A possible explanation for this spatial autocorrelation is the natural regeneration and regrowth of forests in areas previously affected by mining activities [75]. The presence of positive (moderate-high) spatial autocorrelation in developed land cover implies that developed areas tend to cluster together in eastern Kentucky. This clustering pattern may be influenced by factors related to the region’s history of surface coal mining and reclamation.
The barren land cover also showed moderate to high spatial autocorrelation with a positive Moran’s I index. This clustering pattern may be attributed to the spatial arrangement of coal mining activities and subsequent reclamation efforts as explained by [76], Bernhardt et al., 2012. Surface coal mining and reclamation can lead to the creation of barren areas because of land disturbance [76]. Furthermore, factors such as topography, geology, and soil conditions may also contribute to the clustering of barren areas [77]. The extraction of coal from specific geological formations or the presence of certain soil types can result in a contiguous spatial pattern of barren land cover [77]. Following surface coal mining, shrubland vegetation is known to colonize the reclaimed areas, resulting in a contiguous pattern of shrubland land cover [78]. Factors such as soil conditions, the availability of seeds or propagules, and the natural growth, adaptation, and interaction of shrub vegetation with the environment may influence the formation of these shrubland clusters [9,74]. Furthermore, the positive spatial autocorrelation of shrubland land cover underscores the importance of considering the impacts of mining and reclamation activities on ecosystem composition and structure [79]. Depending on various ecological factors, including soil conditions, seed dispersal, and successional dynamics, the land may transition between herbaceous and shrubland states [80]. Moreover, the positive spatial autocorrelation of herbaceous land cover highlights the need to consider the impacts of mining and reclamation activities on the region’s ecological dynamics [80]. The clustering of herbaceous areas signifies the potential for altered habitat patterns and the fragmentation of natural landscapes [81]. The Moran’s I results indicate a clustering pattern of agricultural activities, suggesting that farming practices are concentrated in certain areas. This concentration may be influenced by factors such as proximity to mining sites and successful reclamation efforts, as well as favorable soil conditions and access to water resources. The presence of clustered water bodies in the study region, particularly in the context of ongoing surface coal mining and reclamation activities, holds significant implications for the region. These clusters suggest the creation of artificial water bodies, such as ponds, lakes, or reservoirs, because of mining and reclamation practices.

3.5. Hot Spot and Cold Spot Analysis

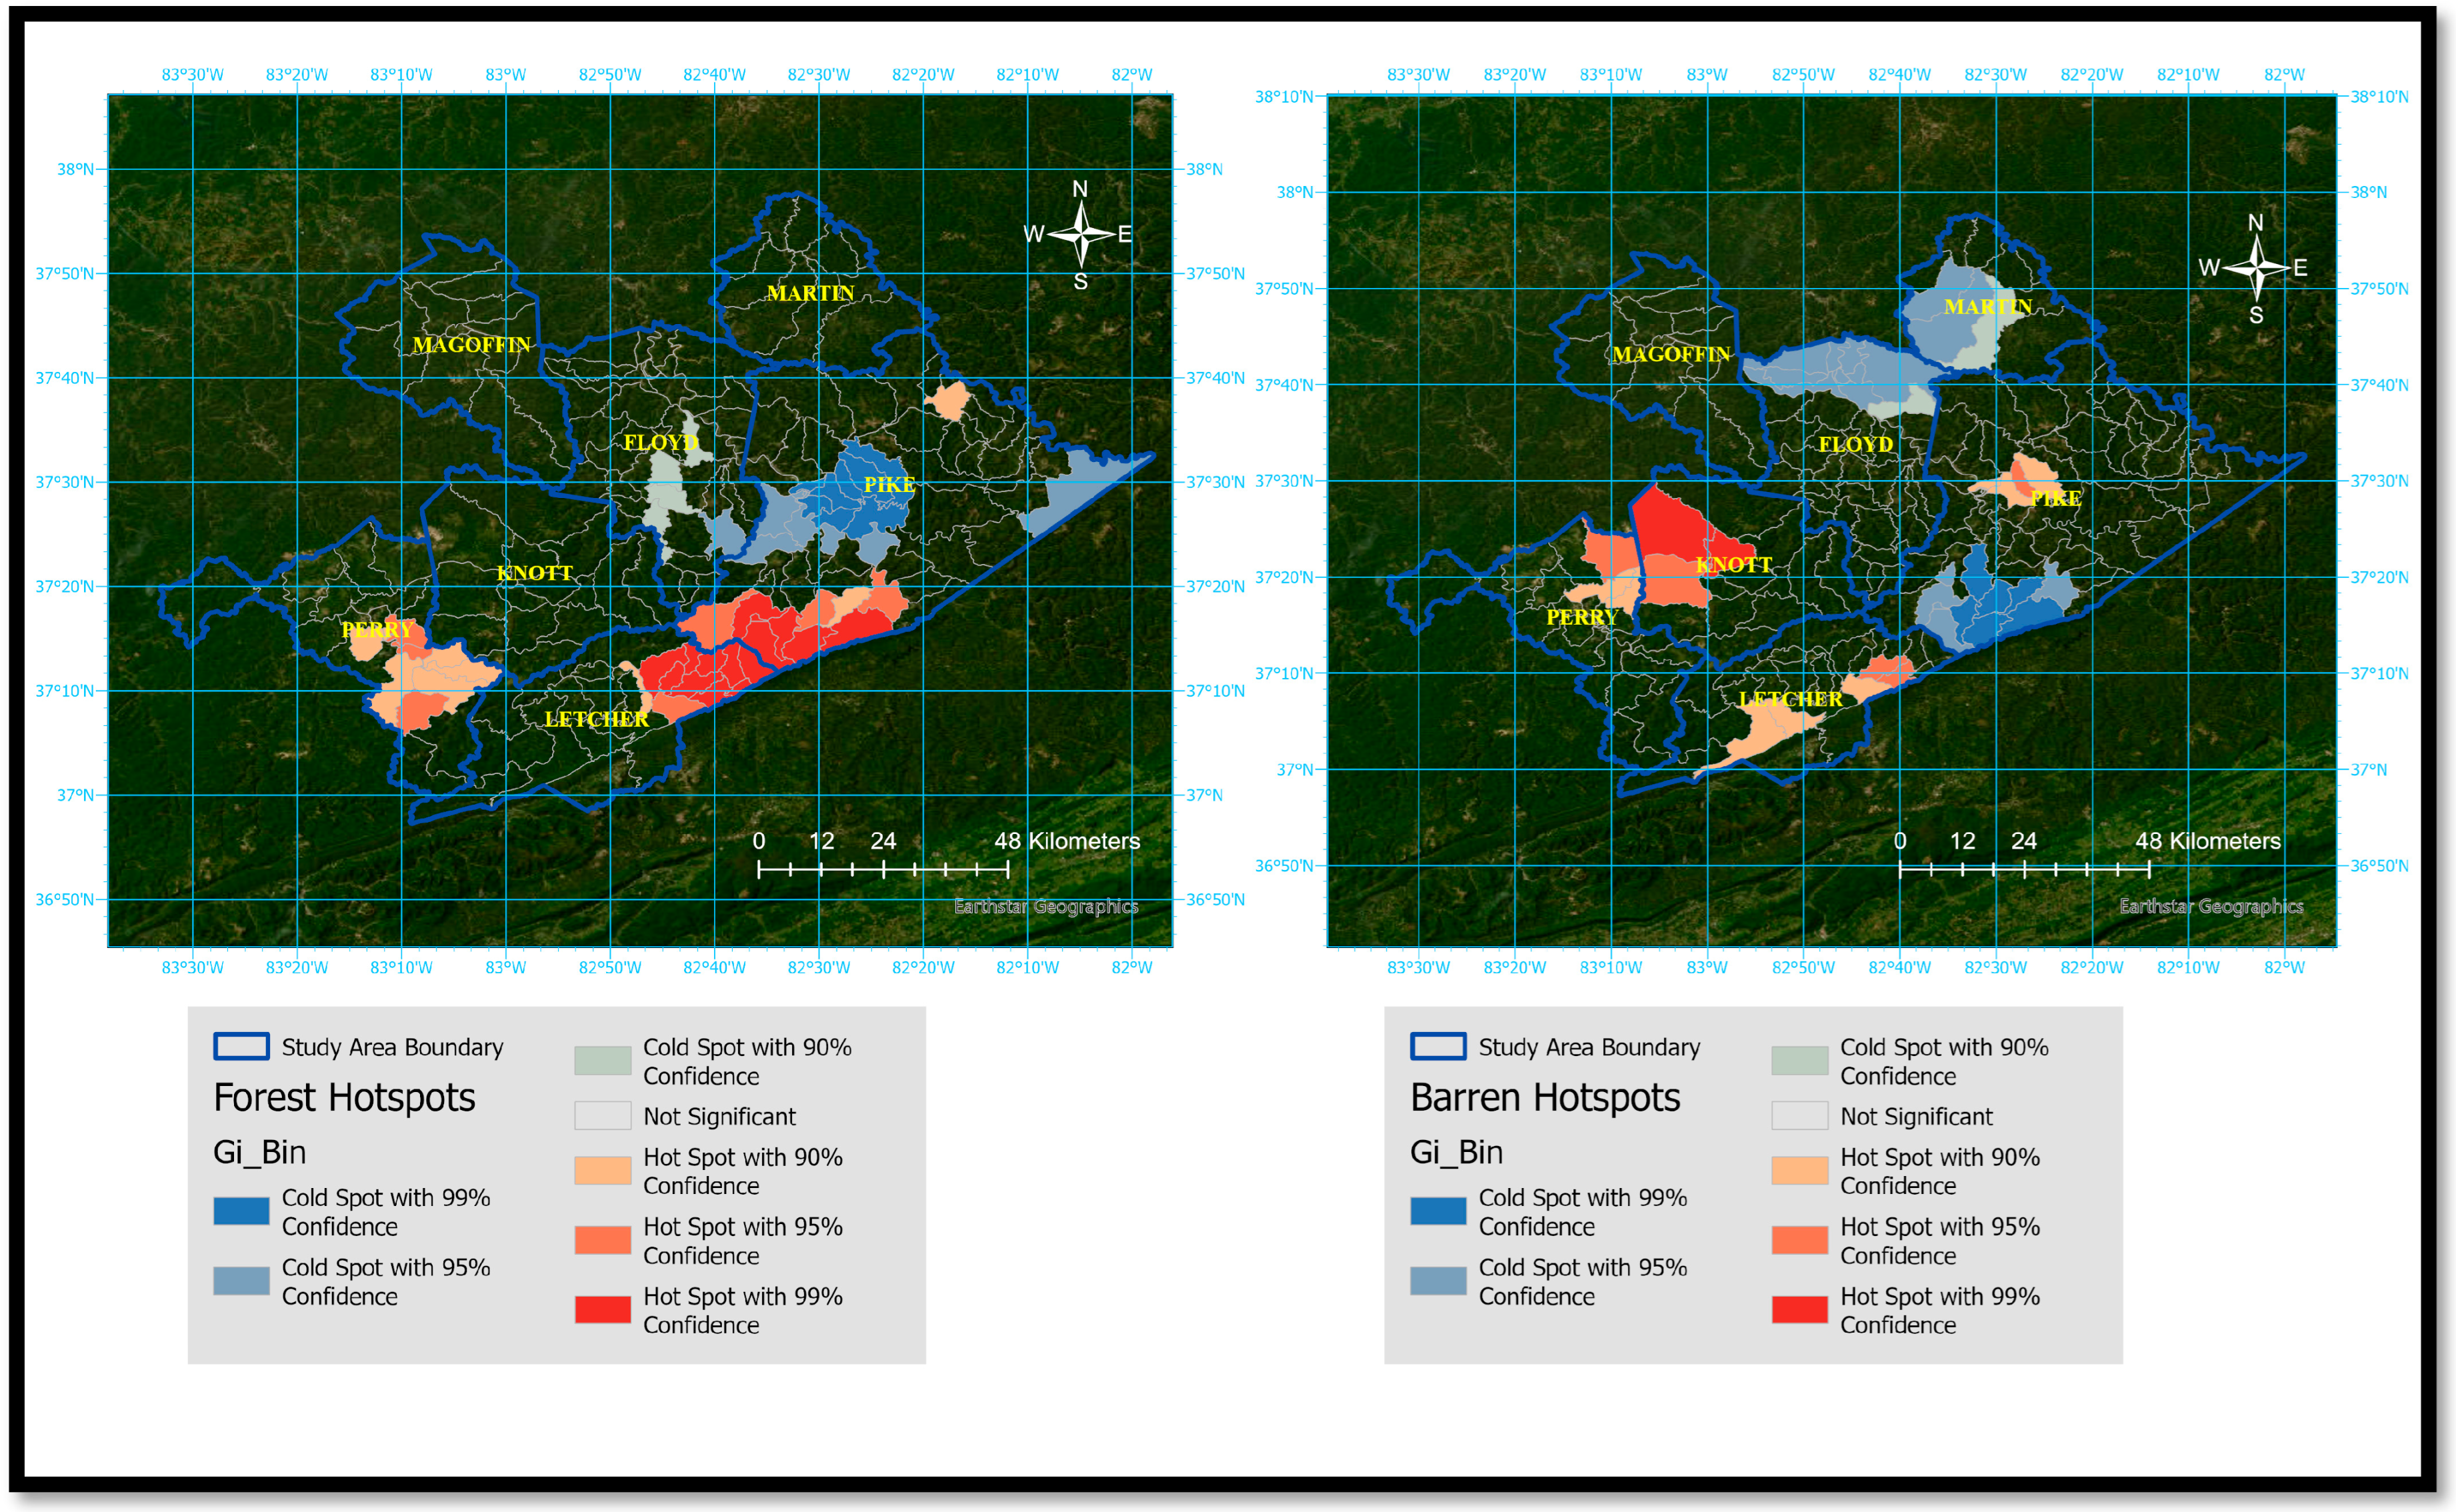
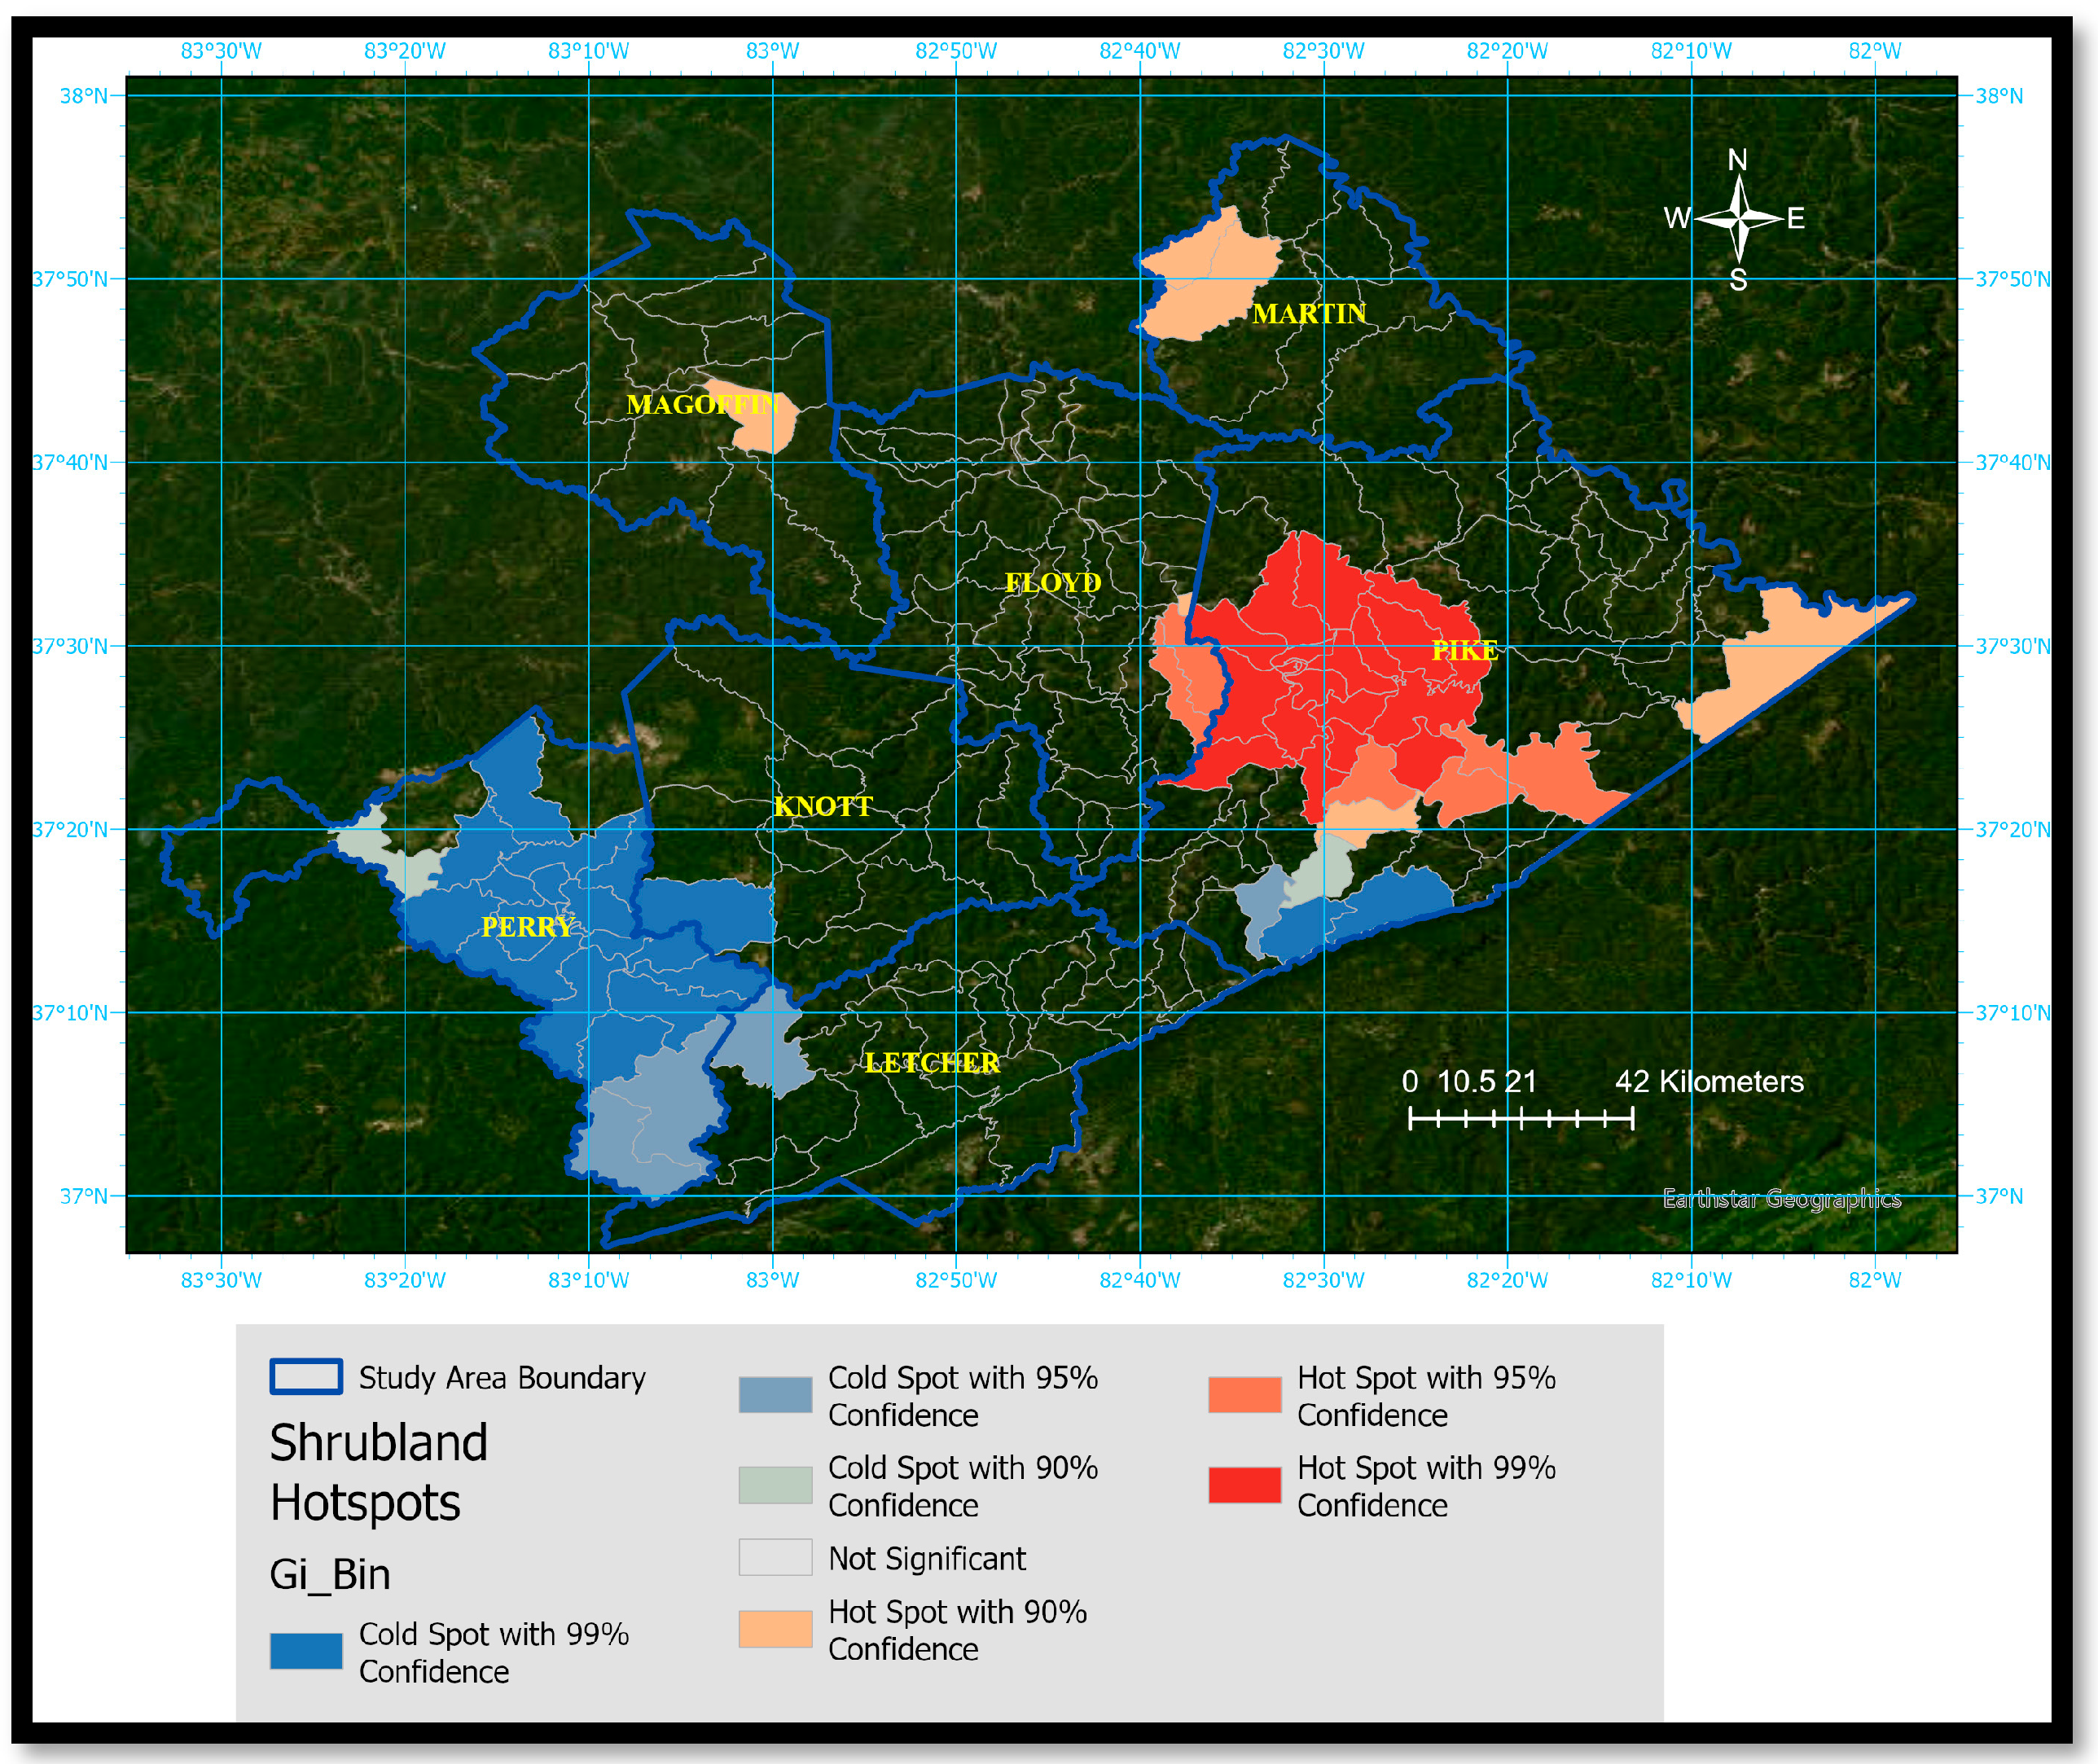
Getis statistical maps aid in determining “where” changes in land cover have taken place during the study. Figure 8, Figure 9 and Figure 10 present comprehensive maps reports showcasing hot spot mapping using the Gi* statistic for different land-cover change categories in the study region. Each figure corresponds to a specific land-cover change between 2004 and 2019. Figure 8 illustrates the hot spots and cold spots of herbaceous land-cover change between 2004 and 2019, with high confidence levels. Hot spots are identified in Pike, parts of Floyd, and Perry counties, indicating a natural succession of vegetation growth, revegetation, and the probable growth of herbaceous species [11]. Cold spots are visible in Letcher, Knott, and parts of Pike counties, signifying a likely transition of herbaceous land to other land-cover types.
Figure 8 displays the hot spots and cold spots for developed land-cover change in the study area. Hot spots are visible in Floyd, Perry, and parts of Knott counties, indicating growth in infrastructure, roads, and built-up areas [77]. Cold spots with high confidence levels are observed in northern Magoffin and Martin counties, suggesting outward migration, potential reclamation activities, transitions from developed to other land covers, and the growth of green covers [14].
The hot spot analysis for forest land-cover change is shown in Figure 9. Hot spots can be seen in the southwestern Pike, Letcher, and Perry regions with high confidence levels, indicating forest growth and effective reclamation results [82]. Cold spots are observed in the Pike and Floyd counties, representing a decline in forest growth potentially due to mining activities, transitions to other land covers, and development. Figure 9 also illustrates the hot spots and cold spots for barren land-cover change in the study area during the specified period. Hot spots in barren change are observed in parts of Perry, Knott, southern Letcher, and in central Pike regions with high confidence levels. These hot spots indicate significant growth in barren land resulting from surface mining activities. For the surface coal mining operations, vegetation is cleared out and mining operations are initiated. These coal mining operations are prevalent in the parts of Perry, Knott, southern Pike and Letcher regions, which might be the reasons for the increased hot spots in those areas [4,5,9]. Cold spots in barren change can be seen in southwestern Pike, Martin, and eastern Floyd counties, suggesting forest growth and impactful reclamation efforts between 2004 and 2019 [17].
Figure 10 represents the hot spots and cold spots of shrubland covering changes between 2004 and 2019. Hot spots can be observed in the Pike, Martin, Floyd, and Magoffin counties, indicating increased shrubland covers and positive impacts of reclamation activities. Cold spots are identified in the Perry and Pike counties, which could be attributed to transitions to planted/cultivated land, developed areas, or forest lands [11].

3.6. Accuracy Assessment

Kappa statistics, Producer’s and User’s accuracy were computed to validate the accuracy of the land-cover maps for all seven counties between 2004 and 2019, as shown in Table 6 (Producer’s and User’s accuracy values are reported in the Supplementary Material). Higher Producer’s, User’s and Kappa accuracy values show better agreement between predicted and observed land-cover classes. Kappa accuracy levels in this study varied from 0.75 for Knott County in 2004 to 0.89 for Floyd County in 2016. Because of this level of precision, land-cover maps generated in this study are considered an accurate depiction of land-cover classes on the ground in the respective years. Such validated maps allow for informed land use and cover change decision making for land management, environmental monitoring, and planning. The high accuracy of the land-cover maps can be attributed to the use of multi-seasonal Landsat imageries, the use of several ancillary and reference source maps, such as the National Agriculture Imagery Program, the National Land Cover Dataset, Google maps, and high-resolution aerial photos and base maps [83].
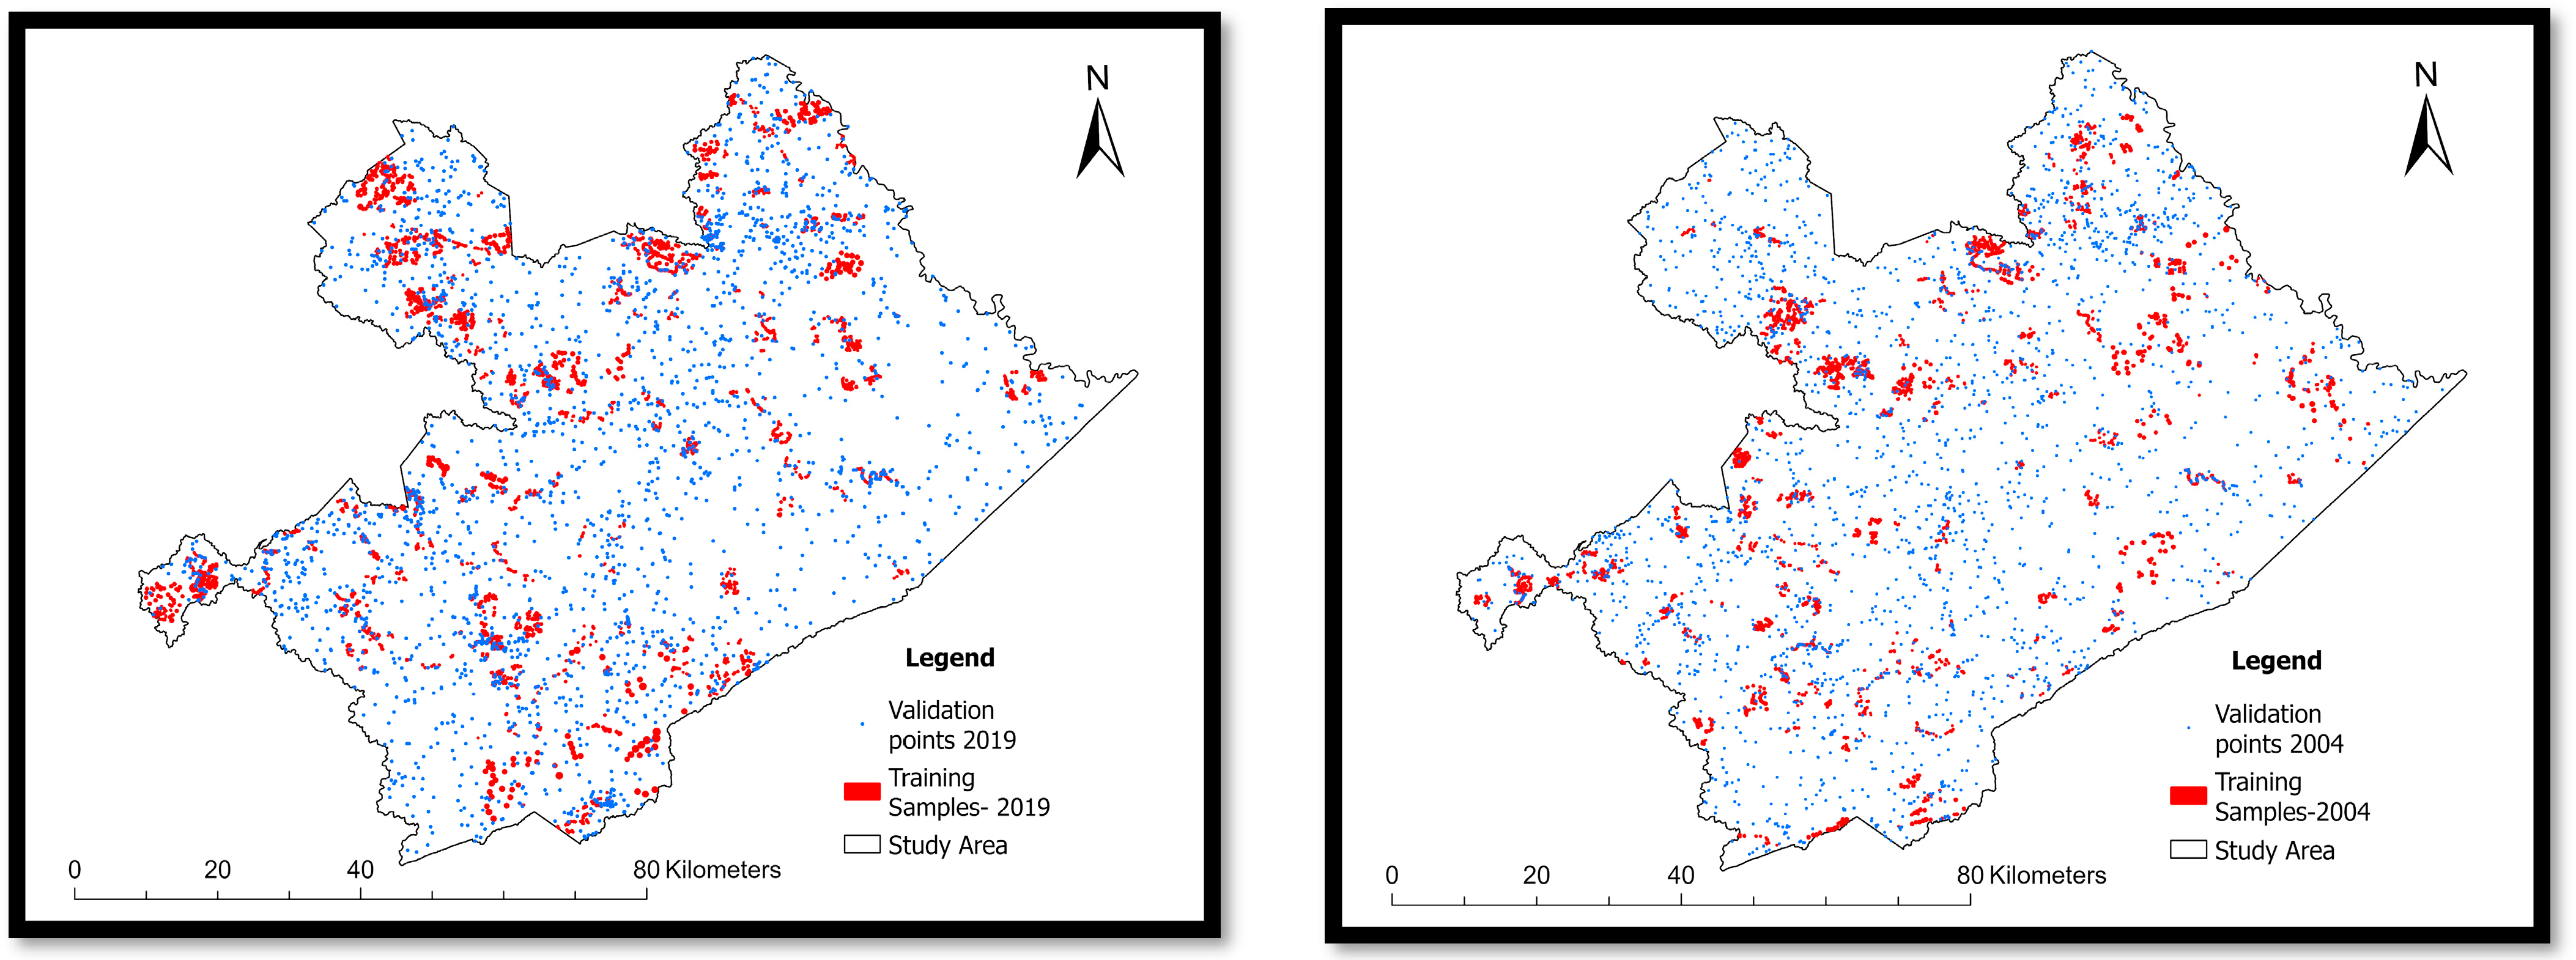
Figure 11 illustrates the distribution of validation points and training samples depicted on maps for 2004 and 2019. In 2004, Landsat 5 images with six bands were utilized, whereas in 2019, Landsat 8 images with seven bands were employed. As per [47], the training samples were determined by multiplying the number of bands by 10. Hence, for each land-cover class across seven counties in 2004, there were 60 training samples, whereas in 2019, there were 70 training samples per land-cover class. The validation points for each land-cover class in both 2004 and 2019 were 50. The validation points were randomly generated using a stratified random sampling method. Then, utilizing visual inspection for basemaps, Landsat, NAIP, NLCD data accuracy assessment was carried out.

4. Discussion

The results of this study have revealed numerous intriguing insights into the spatial and temporal trends and patterns of landscape changes. Some of the evident landscape changes include the growth of vegetation in previous barren land, incremental changes in developed areas, interchange in shrubland, herbaceous and forest, and a decrease in planted/cultivated land and slight increase in water areas from 2004 to 2019. In between 2004 and 2019, our study has quantified and explored the trends and patterns of landscape changes in the study area. Notably, most lands suitable for agriculture were found on the northern side of the study area, as we could see the increased presence of land capability classes 1 and 2 in the northern part of the study area, as shown in Figure 3d. This provides valuable insights into the diverse vegetation, flora, and fauna found across the region [79,81]. Slope maps highlight the distribution of steep slopes and flat land, identifying areas at risk of soil erosion and those unsuitable for construction and agriculture throughout the study area [65].
This research also noted the variations in the research area’s water area. The notable increase in water bodies from 2004 to 2006 may suggest a rise, potentially influenced by altered rainfall patterns, hydrological processes, or the creation of artificial water bodies for mining activities [84]. The decrease in the water body between 2010 and 2016 suggests a change in hydrological cycles and increased evaporation. Nonetheless, between 2016 and 2019, we observed stable water bodies, suggesting that the water bodies’ prior shrinking had hit a plateau. This represents a relatively stable situation regarding water bodies, indicating that the previous decrease might have reached a plateau or that the water bodies have reached a stabilized size [85]. Although the water area in the study region remained relatively stable from 2004 to 2019, there were fluctuations during that period. These variations could be attributed to the effects of mining operations and the impacts of reclamation processes on water bodies, which eventually stabilized [85].
The study region has seen an increase in developed land area, which is explained by the construction of infrastructure related to coal mining operations, increasing housing, and commercialization, similar to the study carried out in [86] by Guan and Yu. The increase in developed areas from 2010 to 2016 reflects the development of new residential areas and the influence of coal mining-related infrastructure projects in the study area [87]. The considerable increase in developed areas during 2019 signifies an evident transformation of the coalfield area’s landscape, potentially encroaching upon natural habitats and agricultural lands [11]. Between 2006 and 2010, the barren land remained relatively stable, suggesting successful reclamation and vegetation establishment [88] and the suspension of coalmine projects due to tight federal regulation after 2008. The decline in barren land in 2019 indicates successful reclamation that might have led to the restoration of the landscape with forest, shrubland, and other vegetation cover types [89].
We could see that the research area’s forest land area has been gradually expanding, highlighting the effectiveness of the reclamation efforts [89]. Despite the ongoing mining activities, the forest land area remained relatively stable or slightly increased from the period of 2004 to 2019. This indicates successful reclamation efforts and the establishment of vegetation, leading to the restoration of the forested regions in the research area [90]. Most surface coal mines are in barren ground, which has consistently decreased because of successful reclamation efforts. This shows how the forest, shrubland, and overall green areas have been restored in the previously barren areas [65,85,86]. Over the course of the study, we see fluctuations in the shrubland area, which provides evidence for the reclamation efforts that have resulted in success or failure in areas that might differ in slope, aspects, and soil properties [91]. The decline in shrubland may also relate to conversion to other land-cover types, such as forests or herbaceous vegetation [88,89].
The transition matrix from 2004 to 2019 shows a clear pattern of dominant land-cover transitions, such as from agriculture to developed, from shrubland and herbaceous to forest, and from barren to shrubland and forest. These transitions suggest increased infrastructure, vegetation growth in the previously barren land, and natural land-cover transitions [80]. The shift of 383.44 sq km from forest to shrublands may imply that land management practices favor shrub growth or disturbances impacting forest ecosystems [9]. Conversely, the conversion of 650.14 sq km from shrublands to forest suggests the re-establishment or regeneration of forests in areas once dominated by shrublands, potentially aided by conservation efforts or natural processes. The positive spatial autocorrelation in forest areas suggests that areas with forest land cover tend to be spatially adjacent to other forested areas [92]. The reclamation process, which involves restoring mined lands to their original or alternative uses, may have facilitated the establishment of new forested areas [93]. The observed spatial clustering of developed areas can be attributed to growth in infrastructure, favorable land-use policies and ordinances for residential land development, and the availability of jobs and growth of suburb or micropolitan areas, which need to be further studied [91,94].
Hot spot analysis showed variations in changes in land-cover classes in different counties. Reclamation and forest growth were seen in Pike, Martin, and eastern Floyd [17]. Between 2004 and 2019, Floyd, Perry, and portions of Knott counties showed an increase in developed land [77]. The amount of developed land dropped in the northern Magoffin and Martin counties, indicating movement westward and a change from developed to undeveloped areas [14].
Despite the extensive history of active coal mining in our study area, there is a notable scarcity of similar research that corresponds to our research [95,96]. This study fills this gap by quantifying the land-cover changes influenced by coal mining and reclamation. This research serves as a foundational record, offering essential baseline information for future studies. While we endeavored to meticulously utilize available data and fulfill our research objectives within the time constraints, we acknowledge certain limitations. These include the scarcity of optimized satellite data, discrepancies in data acquisition and limited access for the field work for ground truthing. Nonetheless, we recognize the potential for future research to employ advanced technologies such as high-resolution UAV/drone, lidar, or hyperspectral imagery. As discussed by Sun et al. (2024), in future studies we can also adopt similarity- and dissimilarity-induced image regression (SDIR)-like advanced regression models for improving the final change detection accuracy [97]. These tools could facilitate a deeper understanding of landscape changes and their relationship with biomass change, hydrology, soil dynamics, environmental health, and the management of reclaimed mine lands. Despite its limitations, our research was able to comprehensively examine land-cover changes from 2004 to 2019 in the study area. We believe it provides valuable insights for researchers and readers alike, offering a broader understanding of the evolving landscape dynamics shaped by coal mining and reclamation activities.

5. Conclusions

This study explored spatial trends, patterns, and transitions in the change in land cover in eastern Kentucky between 2004 and 2019 using machine-learning random forest algorithm and spatial analysis techniques. Random Tree Classifier, paired t-test, spatial autocorrelation using Moran’s I, and hot spot analysis examined how land cover varied spatially between 2004 and 2019. Among the seven land-cover types, forests/herbaceous and developed lands were increased. This indicates successful reclamation efforts, leading to the restoration of the forested areas lost during mining activities before 2004 and the conversion of reclaimed lands into development, infrastructure, industries, and recreational places in recent years.
Despite being a dominant region of surface coal mining in the Appalachian region, only a few studies reported a land-cover classification of the study area in the past, which was based on traditional classification methods and were observational studies. Our study’s use of a Random Tree Classifier from ArcGIS pro, a random forest classification method spatial clustering, hot spot analysis, and the inclusion of topographic layers and multi-season Landsat imagery in the analysis made this research crucial to understanding the land-cover dynamics of study area. The findings offer crucial insights into land-cover changes, vegetation reclamation success, and transitions between land-cover types. This research not only fills a significant gap but also aids local land managers and mine workers in pinpointing areas of change, effectively managing land, and forecasting future scenarios.

Supplementary Materials

The following supporting information can be downloaded at: https://www.mdpi.com/article/10.3390/land13091541/s1, Percent user’s and producer’s accuracy of mapped cover classes for all counties of study area, all dates; evaluation based on best available data.

Author Contributions

Conceptualization, S.K.C., B.R.G., S.L. and D.Z.; Methodology, S.K.C., S.L. and D.Z.; Formal analysis, S.K.C. and D.Z.; Investigation, B.R.G. and D.Z.; Resources, B.R.G.; Writing—original draft, S.K.C., B.R.G. and D.Z.; Writing—review & editing, S.K.C., G.F.A., A.C. and D.Z.; Visualization, S.L., G.F.A., A.C.; Supervision, B.R.G., S.L., G.F.A., A.C. and D.Z.; Funding acquisition, B.R.G. All authors have read and agreed to the published version of the manuscript.

Funding

This research is funded by USDA/NIFA-CBG. Award # 2020-38821-31102: “Strengthening research and teaching capacity of KSU by studying interrelationships and disruptions in landscape change and ecosystem functions in Kentucky’s Appalachia”. Buddhi Gyawali’s time and contribution relates to the USDA/AFRI Grant “Enhancing Productivity, Diversification, and Sustainability By Infusing Geospatial Technology In Small And Medium-Sized Farms” USDA/AFRI (Award # 2019-68006-29330) and Preparing the Pipeline of Next Generation STEM Professionals (Award Number (FAIN): HRD 2011917).

Data Availability Statement

Data is contained within the article/Supplementary Material.

Acknowledgments

The authors are grateful to Kabita Paudel, Jeremy Sandifer, and anonymous reviewers for their support during the research and revision of the manuscript.

Conflicts of Interest

The authors declare no conflict of interest.

References

  1. Banks, A. Coal Miners and Firebrick Workers: The Structure of Work Relations in Two Eastern Kentucky Communities. Appalach. J. 1983, 11, 85–102. [Google Scholar]
  2. Clark, E.V.; Zipper, C.E.; Soucek, D.J.; Daniels, W.L. Contaminants in Appalachian Water Resources Generated by Non-acid-forming Coal-Mining Materials. In Appalachia’s Coal-Mined Landscapes: Resources and Communities in a New Energy Era; Zipper, C.E., Skousen, J., Eds.; Springer International Publishing: Cham, Switzerland, 2021; pp. 217–243. ISBN 978-3-030-57780-3. [Google Scholar]
  3. Pond, G.J. Effects of Surface Mining and Residential Land Use on Headwater Stream Biotic Integrity in the Eastern Kentucky Coalfield Region; Kentucky Department for Environmental Protection, Division of Water: Frankfort, KY, USA, 2004.
  4. Davidson, W.H.; Hutnik, R.J.; Parr, D.E. Reforestation of Mined Land in the Northeastern and North-Central U.S. North. J. Appl. For. 1984, 1, 7–12. [Google Scholar] [CrossRef]
  5. Senanayake, I.P.; Welivitiya, W.D.D.P.; Nadeeka, P.M. Remote sensing based analysis of urban heat islands with vegetation cover in Colombo city, Sri Lanka using Landsat-7 ETM+ data. Urban Clim. 2013, 5, 19–35. [Google Scholar] [CrossRef]
  6. Yeiser, J.M.; Baxley, D.L.; Robinson, B.A.; Morgan, J.J.; Stewart, J.N.; Barnard, J.O. A comparison of coal mine reclamation seed mixes in Kentucky: Implications for grassland establishment in Appalachia. Int. J. Min. Reclam. Environ. 2016, 30, 257–267. [Google Scholar] [CrossRef]
  7. Feng, Y.; Wang, J.; Bai, Z.; Reading, L. Effects of surface coal mining and land reclamation on soil properties: A review. Earth-Sci. Rev. 2019, 191, 12–25. [Google Scholar] [CrossRef]
  8. Swab, R.M.; Lorenz, N.; Byrd, S.; Dick, R. Native vegetation in reclamation: Improving habitat and ecosystem function through using prairie species in mine land reclamation. Ecol. Eng. 2017, 108, 525–536. [Google Scholar] [CrossRef]
  9. Townsend, P.A.; Helmers, D.P.; Kingdon, C.C.; McNeil, B.E.; de Beurs, K.M.; Eshleman, K.N. Changes in the extent of surface mining and reclamation in the Central Appalachians detected using a 1976–2006 Landsat time series. Remote Sens. Environ. 2009, 113, 62–72. [Google Scholar] [CrossRef]
  10. Cianciolo, T.R.; McLaughlin, D.L.; Zipper, C.E.; Timpano, A.J.; Soucek, D.J.; Schoenholtz, S.H. Impacts to water quality and biota persist in mining-influenced Appalachian streams. Sci. Total Environ. 2020, 717, 137216. [Google Scholar] [CrossRef]
  11. Zipper, C.E.; Burger, J.A.; Skousen, J.G.; Angel, P.N.; Barton, C.D.; Davis, V.; Franklin, J.A. Restoring Forests and Associated Ecosystem Services on Appalachian Coal Surface Mines. Environ. Manag. 2011, 47, 751–765. [Google Scholar] [CrossRef]
  12. Evans, D.M.; Zipper, C.E.; Hester, E.T.; Schoenholtz, S.H. Hydrologic Effects of Surface Coal Mining in Appalachia (U.S.). J. Am. Water Resour. Assoc. 2015, 51, 1436–1452. [Google Scholar] [CrossRef]
  13. Gurung, K.; Yang, J.; Fang, L. Assessing Ecosystem Services from the Forestry-Based Reclamation of Surface Mined Areas in the North Fork of the Kentucky River Watershed. Forests 2018, 9, 652. [Google Scholar] [CrossRef]
  14. Simmons, J.A.; Currie, W.S.; Eshleman, K.N.; Kuers, K.; Monteleone, S.; Negley, T.L.; Pohlad, B.R.; Thomas, C.L. Forest to Reclaimed Mine Land Use Change Leads to Altered Ecosystem Structure and Function. Ecol. Appl. 2008, 18, 104–118. [Google Scholar] [CrossRef] [PubMed]
  15. Zipper, C.; Angel, P.; Adams, M.B.; Sanderson, T.; Sena, K.; Barton, C.; Agouridis, C. The Forestry Reclamation Approach: An Essential Tool for Controlling Invasive Exotic Plants on Active Mine Sites. The Appalachian Regional Reforestation Initiative (ARRI). 2019. Available online: https://www.fs.usda.gov/treesearch/pubs/60463 (accessed on 14 September 2022).
  16. Gyawali, B.; Shrestha, S.; Bhatta, A.; Pokhrel, B.; Cristan, R.; Antonious, G.; Banerjee, S.; Paudel, K.P. Assessing the Effect of Land-Use and Land-Cover Changes on Discharge and Sediment Yield in a Rural Coal-Mine Dominated Watershed in Kentucky, USA. Water 2022, 14, 516. [Google Scholar] [CrossRef]
  17. Strager, M.P.; Strager, J.M.; Evans, J.S.; Dunscomb, J.K.; Kreps, B.J.; Maxwell, A.E. Combining a spatial model and demand forecasts to map future surface coal mining in Appalachia. PLoS ONE 2015, 10, e0128813. [Google Scholar] [CrossRef] [PubMed]
  18. Alexander, S.; Aronson, J.; Whaley, O.; Lamb, D. The relationship between ecological restoration and the ecosystem services concept. Ecol. Soc. 2016, 21, 34. [Google Scholar] [CrossRef]
  19. Quintas-Soriano, C.; Castro, A.J.; Castro, H.; García-Llorente, M. Impacts of land use change on ecosystem services and implications for human well-being in Spanish drylands. Land Use Policy 2016, 54, 534–548. [Google Scholar] [CrossRef]
  20. Zhao, Q.; Wen, Z.; Chen, S.; Ding, S.; Zhang, M. Quantifying land use/land cover and landscape pattern changes and impacts on ecosystem services. Int. J. Environ. Res. Public Health 2020, 17, 126. [Google Scholar] [CrossRef]
  21. Yohannes, A.W.; Cotter, M.; Kelboro, G.; Dessalegn, W. Land use and land cover changes and their effects on the landscape of Abaya-Chamo basin, Southern Ethiopia. Land 2018, 7, 2. [Google Scholar] [CrossRef]
  22. Jensen, J.R. Remote Sensing of the Environment: An Earth Resource Perspective; Prentice Hall: Upper Saddle River, NJ, USA, 2000; 544p, ISBN 0134897331/9780134897332. [Google Scholar]
  23. Bielecka, E. GIS spatial analysis modeling for land use change. A bibliometric analysis of the intellectual base and trends. Geosciences 2020, 10, 421. [Google Scholar] [CrossRef]
  24. Li, Y.; Liu, G. Characterizing Spatiotemporal Pattern of Land Use Change and Its Driving Force Based on GIS and Landscape Analysis Techniques in Tianjin during 2000–2015. Sustainability 2017, 9, 894. [Google Scholar] [CrossRef]
  25. Khan, S.H.; He, X.; Porikli, F.; Bennamoun, M. Forest change detection in incomplete satellite images with deep neural networks. IEEE Trans. Geosci. Remote Sens. 2017, 55, 5407–5423. [Google Scholar] [CrossRef]
  26. Khelifi, L.; Mignotte, M. Deep learning for change detection in remote sensing images: Comprehensive review and meta-analysis. Ieee Access 2020, 8, 126385–126400. [Google Scholar] [CrossRef]
  27. Gnadinger, Z. The Ecological Regions of Kentucky. Available online: https://www.kynativeplants.com/post/ecological-regions-of-kentucky (accessed on 1 November 2023).
  28. Woods, A.J.; Omernik, J.M.; Martin, W.H.; Pond, G.J.; Andrews, W.M.; Call, S.M.; Comstock, J.A.; Taylor, D.D. Ecoregions of Kentucky (color poster with map, descriptive text, summary tables, and photographs): Reston, VA., U.S. Geological Survey (map scale 1:1,000,000). 2002. Available online: https://gaftp.epa.gov/EPADataCommons/ORD/Ecoregions/ky/ky_front.pdf (accessed on 23 December 2022).
  29. Butler, P.R.; Iverson, L.R.; III, F.R.T.; Brandt, L.A.; Handler, S.D.; Janowiak, M.K.; Shannon, P.D.; Swanston, C.; Karriker, K.; Bartig, J.; et al. Central Appalachians Forest Ecosystem Vulnerability Assessment and Synthesis: A Report from the Central Appalachians Climate Change Response Framework Project; U.S. Department of Agriculture, Forest Service, Northern Research Station: Newtown Square, PA, USA, 2015; p. 322.
  30. Duraisamy, V.; Bendapudi, R.; Jadhav, A. Identifying hotspots in land use land cover change and the drivers in a semi-arid region of India. Environ. Monit. Assess. 2018, 190, 535. [Google Scholar] [CrossRef] [PubMed]
  31. University of Kentucky, Martin-Gatton College of Agriculture, Food and Environment. Kentucky: By The Numbers Data Series. Available online: https://kybtn.ca.uky.edu/kentucky-numbers-data-series (accessed on 15 March 2023).
  32. Roy, A.; Inamdar, A.B. Multi-temporal Land Use Land Cover (LULC) change analysis of a dry semi-arid river basin in western India following a robust multi-sensor satellite image calibration strategy. Heliyon 2019, 5, e01478. [Google Scholar] [CrossRef] [PubMed]
  33. Hendryx, M.; Zullig, K.J.; Luo, J. Impacts of coal use on health. Annu. Rev. Public Health 2020, 41, 397–415. [Google Scholar] [CrossRef]
  34. Shriver, T.E.; Bodenhamer, A. The enduring legacy of black lung: Environmental health and contested illness in Appalachia. Sociol. Health Illn. 2018, 40, 1361–1375. [Google Scholar] [CrossRef]
  35. Xu, S.; Yu, T.; Xu, J.; Pan, X.; Shao, W.; Zuo, J.; Yu, Y. Monitoring and Forecasting Green Tide in the Yellow Sea Using Satellite Imagery. Remote Sens. 2023, 15, 2196. [Google Scholar] [CrossRef]
  36. Liang, S.; Wang, J. Geometric Processing and Positioning Techniques. In Advanced Remote Sensing, 2nd ed.; Academic Press: Cambridge, MA, USA, 2020; pp. 59–105. ISBN 9780128158265. [Google Scholar] [CrossRef]
  37. Commonwealth of Kentucky, Kentucky’s Elevation Data & Aerial Photography Program. Available online: https://kyfromabove.ky.gov/ (accessed on 7 April 2022).
  38. United States Department of Agriculture, Natural Resources Conservation Service (USDA-NRCS). Soil Survey Geographic (SSURGO) Database for Kentucky. Available online: https://kygeoportal.ky.gov (accessed on 18 April 2022).
  39. Panuju, D.R.; Paull, D.J.; Griffin, A.L. Change Detection Techniques Based on Multispectral Images for Investigating Land Cover Dynamics. Remote Sens. 2020, 12, 1781. [Google Scholar] [CrossRef]
  40. Wondrade, N.; Dick, Ø.B.; Tveite, H. GIS based mapping of land cover changes utilizing multi-temporal remotely sensed image data in Lake Hawassa Watershed, Ethiopia. Environ. Monit. Assess. 2014, 186, 1765–1780. [Google Scholar] [CrossRef]
  41. Basten, K. Classifying Landsat Terrain Images via Random Forests. Bachelor Thesis, Radboud University, Nijmegen, The Netherlands, 2016. [Google Scholar]
  42. Amini, S.; Saber, M.; Rabiei-Dastjerdi, H.; Homayouni, S. Urban Land Use and Land Cover Change Analysis Using Random Forest Classification of Landsat Time Series. Remote Sens. 2022, 14, 2654. [Google Scholar] [CrossRef]
  43. Rodriguez-Galiano, V.F.; Ghimire, B.; Rogan, J.; Chica-Olmo, M.; Rigol-Sanchez, J.P. An assessment of the effectiveness of a random forest classifier for land-cover classification. ISPRS J. Photogramm. Remote Sens. 2012, 67, 93–104. [Google Scholar] [CrossRef]
  44. Htitiou, A.; Boudhar, A.; Lebrini, Y.; Hadria, R.; Lionboui, H.; Elmansouri, L.; Tychon, B.; Benabdelouahab, T. The Performance of Random Forest Classification Based on Phenological Metrics Derived from Sentinel-2 and Landsat 8 to Map Crop Cover in an Irrigated Semi-arid Region. Remote Sens. Earth Syst. Sci. 2019, 2, 208–224. [Google Scholar] [CrossRef]
  45. Esri. ArcGIS Pro; Version 3.0; Environmental Systems Research Institute: Redlands, CA, USA, 2022. [Google Scholar]
  46. Martínez Prentice, R.; Villoslada Peciña, M.; Ward, R.D.; Bergamo, T.F.; Joyce, C.B.; Sepp, K. Machine learning classification and accuracy assessment from high-resolution images of coastal wetlands. Remote Sens. 2021, 13, 3669. [Google Scholar] [CrossRef]
  47. Ballanti, L.; Blesius, L.; Hines, E.; Kruse, B. Tree species classification using hyperspectral imagery: A comparison of two classifiers. Remote Sens. 2016, 8, 445. [Google Scholar] [CrossRef]
  48. McCoy, R.M. Field Methods in Remote Sensing; Guilford Press: New York, NY, USA, 2005; ISBN 1593850794. [Google Scholar]
  49. Bilucan, F.; Kavzoglu, T. The effect of auxiliary data (slope, aspect and elevation) on classification accuracy of Sentinel–2A image using random forest classifier. Intercont. Geoinf. Days 2021, 2, 143–146. [Google Scholar]
  50. Kindu, M.; Schneider, T.; Teketay, D.; Knoke, T. Land use/land cover change analysis using object-based classification approach in Munessa-Shashemene landscape of the Ethiopian highlands. Remote Sens. 2013, 5, 2411–2435. [Google Scholar] [CrossRef]
  51. Tatsumi, K.; Yamashiki, Y.; Canales Torres, M.A.; Taipe, C.L.R. Crop classification of upland fields using Random forest of time-series Landsat 7 ETM+ data. Comput. Electron. Agric. 2015, 115, 171–179. [Google Scholar] [CrossRef]
  52. Corcoran, J.M.; Knight, J.F.; Gallant, A.L. Influence of multi-source and multi-temporal remotely sensed and ancillary data on the accuracy of random forest classification of wetlands in northern Minnesota. Remote Sens. 2013, 5, 3212–3238. [Google Scholar] [CrossRef]
  53. Munthali, M.; Botai, O.J.; Munthali, M.G.; Botai, J.O.; Davis, N.; Adeola, A.M. Multi-temporal Analysis of Land Use and Land Cover Change Detection for Dedza District of Malawi using Geospatial Techniques Remotely Sensing Invasive Alien Plants View project Crop yields estimations: Applications of satellite indices View project Multi-. Artic. Int. J. Appl. Eng. Res. 2019, 14, 1151–1162. [Google Scholar]
  54. Anderson, J.R.; Hardy, E.E.; Roach, J.; Witmer, R.E. A Land Use and Land Cover Classification System for Use with Remote Sensor Data; United States Government Printing Office: Washington, DC, USA, 1976.
  55. Dewitz, J. National Land Cover Database (NLCD) 2016 Products (ver. 3.0, November 2023); U.S. Geological Survey Data Release: Reston, VA, USA, 2019.
  56. Sokal, R.R.; Thomson, J.D. Applications of spatial autocorrelation in ecology. Dev. Numer. Ecol. 1987, 14, 431–466. [Google Scholar] [CrossRef]
  57. Eastman, J.R.; He, J. A Regression-Based Procedure for Markov Transition Probability Estimation in Land Change Modeling. Land 2020, 9, 407. [Google Scholar] [CrossRef]
  58. Zhang, B.; Zhang, Q.; Feng, C.; Feng, Q.; Zhang, S. Understanding land use and land cover dynamics from 1976 to 2014 in Yellow River Delta. Land 2017, 6, 20. [Google Scholar] [CrossRef]
  59. Lee, S.-I. Correlation and Spatial Autocorrelation. In Encyclopedia of GIS; Shekhar, S., Xiong, H., Zhou, X., Eds.; Springer International Publishing: Cham, Switzerland, 2017; pp. 360–368. ISBN 978-3-319-17885-1. [Google Scholar]
  60. Posa, D.; De Iaco, S. Spatial Autocorrelation. In Encyclopedia of Mathematical Geosciences; Daya Sagar, B.S., Cheng, Q., McKinley, J., Agterberg, F., Eds.; Springer International Publishing: Cham, Switzerland, 2020; pp. 1–9. ISBN 978-3-030-26050-7. [Google Scholar]
  61. Sánchez-Martín, J.M.; Rengifo-Gallego, J.I.; Blas-Morato, R. Hot Spot Analysis versus Cluster and Outlier Analysis: An enquiry into the grouping of rural accommodation in Extremadura (Spain). ISPRS Int. J. Geo-Inf. 2019, 8, 176. [Google Scholar] [CrossRef]
  62. Liping, C.; Yujun, S.; Saeed, S. Monitoring and predicting land use and land cover changes using remote sensing and GIS techniques—A case study of a hilly area, Jiangle, China. PLoS ONE 2018, 13, e0200493. [Google Scholar] [CrossRef] [PubMed]
  63. Sim, J.; Wright, C.C. The Kappa Statistic in Reliability Studies: Use, Interpretation, and. Phys. Ther. 2005, 85, 257–268. [Google Scholar] [CrossRef]
  64. Kumar, S.; Arya, S. Change Detection Techniques for Land Cover Change Analysis Using Spatial Datasets: A Review. Remote Sens. Earth Syst. Sci. 2021, 4, 172–185. [Google Scholar] [CrossRef]
  65. Bakker, M.M.; Govers, G.; Kosmas, C.; Vanacker, V.; van Oost, K.; Rounsevell, M. Soil erosion as a driver of land-use change. Agric. Ecosyst. Environ. 2005, 105, 467–481. [Google Scholar] [CrossRef]
  66. Fabio, E.S.; Arthur, M.A.; Rhoades, C.C. Influence of moisture regime and tree species composition on nitrogen cycling dynamics in hardwood forests of Mammoth Cave National Park, Kentucky, USA. Can. J. For. Res. 2009, 39, 330–341. [Google Scholar] [CrossRef]
  67. Chattopadhyay, S.; Edwards, D.R. Long-term trend analysis of precipitation and air temperature for Kentucky, United States. Climate 2016, 4, 10. [Google Scholar] [CrossRef]
  68. Crawford, M.M.; Dortch, J.M.; Koch, H.J.; Zhu, Y.; Haneberg, W.C.; Wang, Z.; Bryson, L.S. Landslide Risk Assessment in Eastern Kentucky, USA: Developing a Regional Scale, Limited Resource Approach. Remote Sens. 2022, 14, 6246. [Google Scholar] [CrossRef]
  69. Chen, Y.; Hu, Z.; Li, P.; Li, G.; Yuan, D.; Guo, J. Assessment and Effect of Mining Subsidence on Farmland in Coal–Crop Overlapped Areas: A Case of Shandong Province, China. Agriculture 2022, 12, 1235. [Google Scholar] [CrossRef]
  70. Hackworth, Z.J.; Lhotka, J.M.; Cox, J.J.; Barton, C.D.; Springer, M.T. First-year vitality of reforestation plantings in response to herbivore exclusion on reclaimed appalachian surface-mined land. Forests 2018, 9, 222. [Google Scholar] [CrossRef]
  71. Burger, J.; Zipper, C. Restoring the Value of Forests on Reclaimed Mined Land. Virginia Cooperative Extension Publication Number 460-138. 2009. Available online: http://hdl.handle.net/10919/54950 (accessed on 19 January 2023).
  72. Mcgowan, E. Reclaiming Appalachia: A Push to Bring Back Native Forests to Coal Country, Yale School of the Environment. Available online: https://e360.yale.edu/features/reclaiming-appalachia-a-push-to-bring-back-native-forests-to-coal-country (accessed on 23 January 2023).
  73. Rodgers, W.N. Land Cover Change and Its Impacts on a Flash Flood-Producing Rain Event in Eastern Kentucky. Masters Theses & Specialist Projects. 2014, p. 90. Available online: http://digitalcommons.wku.edu/theses/1363 (accessed on 5 February 2023).
  74. Commission for Environmental Cooperation. North American Land Change Monitoring System. 2020. Available online: https://storymaps.arcgis.com/stories/cb62207a38e1437f89165f5eac019f13 (accessed on 18 February 2023).
  75. Woodall, C.W.; Walters, B.F.; Russell, M.B.; Coulston, J.W.; Domke, G.M.; D’Amato, A.W.; Sowers, P.A. A Tale of Two Forest Carbon Assessments in the Eastern United States: Forest Use Versus Cover as a Metric of Change. Ecosystems 2016, 19, 1401–1417. [Google Scholar] [CrossRef]
  76. Bernhardt, E.S.; Lutz, B.D.; King, R.S.; Fay, J.P.; Carter, C.E.; Helton, A.M.; Campagna, D.; Amos, J. How Many Mountains Can We Mine? Assessing the Regional Degradation of Central Appalachian Rivers by Surface Coal Mining. Environ. Sci. Technol. 2012, 46, 8115–8122. [Google Scholar] [CrossRef]
  77. Pericak, A.A.; Thomas, C.J.; Kroodsma, D.A.; Wasson, M.F.; Ross, M.R.V.; Clinton, N.E.; Campagna, D.J.; Franklin, Y.; Bernhardt, E.S.; Amos, J.F. Mapping the yearly extent of surface coal mining in central appalachia using landsat and google earth engine. PLoS ONE 2018, 13, e0197758. [Google Scholar] [CrossRef]
  78. Blackford, C.; Heung, B.; Baldwin, K.; Fleming, R.L.; Hazlett, P.W.; Morris, D.M.; Uhlig, P.W.C.; Webster, K.L. Digital soil mapping workflow for forest resource applications: A case study in the Hearst Forest, Ontario. Can. J. For. Res. 2021, 51, 59–77. [Google Scholar] [CrossRef]
  79. Kentucky Energy and Environment Cabinet. Mine Reclamation and Enforcement Natural Resource Mining. Available online: https://eec.ky.gov/Natural-Resources/Conservation/Pages/default.aspx (accessed on 10 September 2022).
  80. Franklin, J.A.; Zipper, C.E.; Burger, J.A.; Skousen, J.G.; Jacobs, D.F. Influence of herbaceous ground cover on forest restoration of eastern US coal surface mines. New For. 2012, 43, 905–924. [Google Scholar] [CrossRef]
  81. Ashby, W.C.; Hannigan, K.P.; Kost, D.A. Coal mine reclamation with grasses and legumes in southern Illinois. J. Soil Water Conserv. 1989, 44, 79–83. [Google Scholar]
  82. Ferrari, J.R.; Lookingbill, T.R.; McCormick, B.; Townsend, P.A.; Eshleman, K.N. Surface mining and reclamation effects on flood response of watersheds in the central Appalachian Plateau region. Water Resour. Res. 2009, 45. [Google Scholar] [CrossRef]
  83. Tilahun, A. Accuracy Assessment of Land Use Land Cover Classification using Google Earth. Am. J. Environ. Prot. 2015, 4, 193. [Google Scholar] [CrossRef]
  84. Choi, Y.; Park, H.-D.; Sunwoo, C. Flood and gully erosion problems at the Pasir open pit coal mine, Indonesia: A case study of the hydrology using GIS. Bull. Eng. Geol. Environ. 2008, 67, 251–258. [Google Scholar] [CrossRef]
  85. Wunsch, D.R. Ground-Water Geochemistry and Its Relationship to the Flow System at an Unmined Site in the Eastern Kentucky Coal Field. Ph.D. Dissertation, University of Kentucky, Lexington, KY, USA, 1992. [Google Scholar]
  86. Guan, J.; Yu, P. Does coal mining have effects on land use changes in a coal resource-based city? Evidence from huaibei city on the North China plain. Int. J. Environ. Res. Public Health 2021, 18, 11616. [Google Scholar] [CrossRef] [PubMed]
  87. Matheis, M. Local economic impacts of coal mining in the United States 1870 to 1970. J. Econ. Hist. 2016, 76, 1152–1181. [Google Scholar] [CrossRef]
  88. Roberts, M.; Richter, J.; Martin, B.; Peterson, C.; Le, T.-T.; Wiener, M.; Dockery, S. Evaluating Tree Growth and Soil Development on Restored Coal Mine Sites in Eastern Kentucky; UNC: Chapel Hill, NC, USA, 2015. [Google Scholar]
  89. Pardieu, S. Biodiversity in Eastern Kentucky: Effects of Habitat Change, Surface Top Mining, and Current Reclamation Practices, Undergraduate Theses. 2023. Available online: https://scholarworks.bellarmine.edu/ugrad_theses/112/ (accessed on 24 January 2023).
  90. Macdonald, S.E.; Landhäusser, S.M.; Skousen, J.; Franklin, J.; Frouz, J.; Hall, S.; Jacobs, D.F.; Quideau, S. Forest restoration following surface mining disturbance: Challenges and solutions. New For. 2015, 46, 703–732. [Google Scholar] [CrossRef]
  91. Skousen, J.; Monteleone, A.; Tyree, M.; Swab, R.; Groninger, J.; Adams, M.; Buckley, D.; Wood, P.; Williams, R.; Eggerud, S.; et al. Establishing Small Tree and Shrub Species on Mined Lands Using the Forestry Reclamation Approach; Forest Reclamation Advisory No. 18; Appalachian Regional Reforestation Initiative: Pittsburgh, PA, USA, 2019; 9p.
  92. Li, M.; Yan, Q.; Li, G.; Yi, M.; Li, J. Spatio-Temporal Changes of Vegetation Cover and Its Influencing Factors in Northeast China from 2000 to 2021. Remote Sens. 2022, 14, 5720. [Google Scholar] [CrossRef]
  93. The Forestry Reclamation Approach: Guide to Successful Reforestation of Mined Lands; U.S. Department of Agriculture, Forest Service, Northern Research Station: Newtown Square, PA, USA, 2017. [CrossRef]
  94. Huang, L.; Zhang, P.; Hu, Y.; Zhao, Y. Vegetation succession and soil infiltration characteristics under different aged refuse dumps at the Heidaigou opencast coal mine. Glob. Ecol. Conserv. 2015, 4, 255–263. [Google Scholar] [CrossRef]
  95. Sun, M.; Meng, Q. Using spatial syntax and GIS to identify spatial heterogeneity in the main urban area of Harbin, China. Front. Earth Sci. 2022, 10, 893414. [Google Scholar] [CrossRef]
  96. Dong, Y.-H.; Peng, F.-L.; Li, H.; Men, Y.-Q. Spatial autocorrelation and spatial heterogeneity of underground parking space development in Chinese megacities based on multisource open data. Appl. Geogr. 2023, 153, 102897. [Google Scholar] [CrossRef]
  97. Sun, Y.; Lei, L.; Li, Z.; Kuang, G. Similarity and dissimilarity relationships based graphs for multimodal change detection. ISPRS J. Photogramm. Remote Sens. 2024, 208, 70–88. [Google Scholar] [CrossRef]
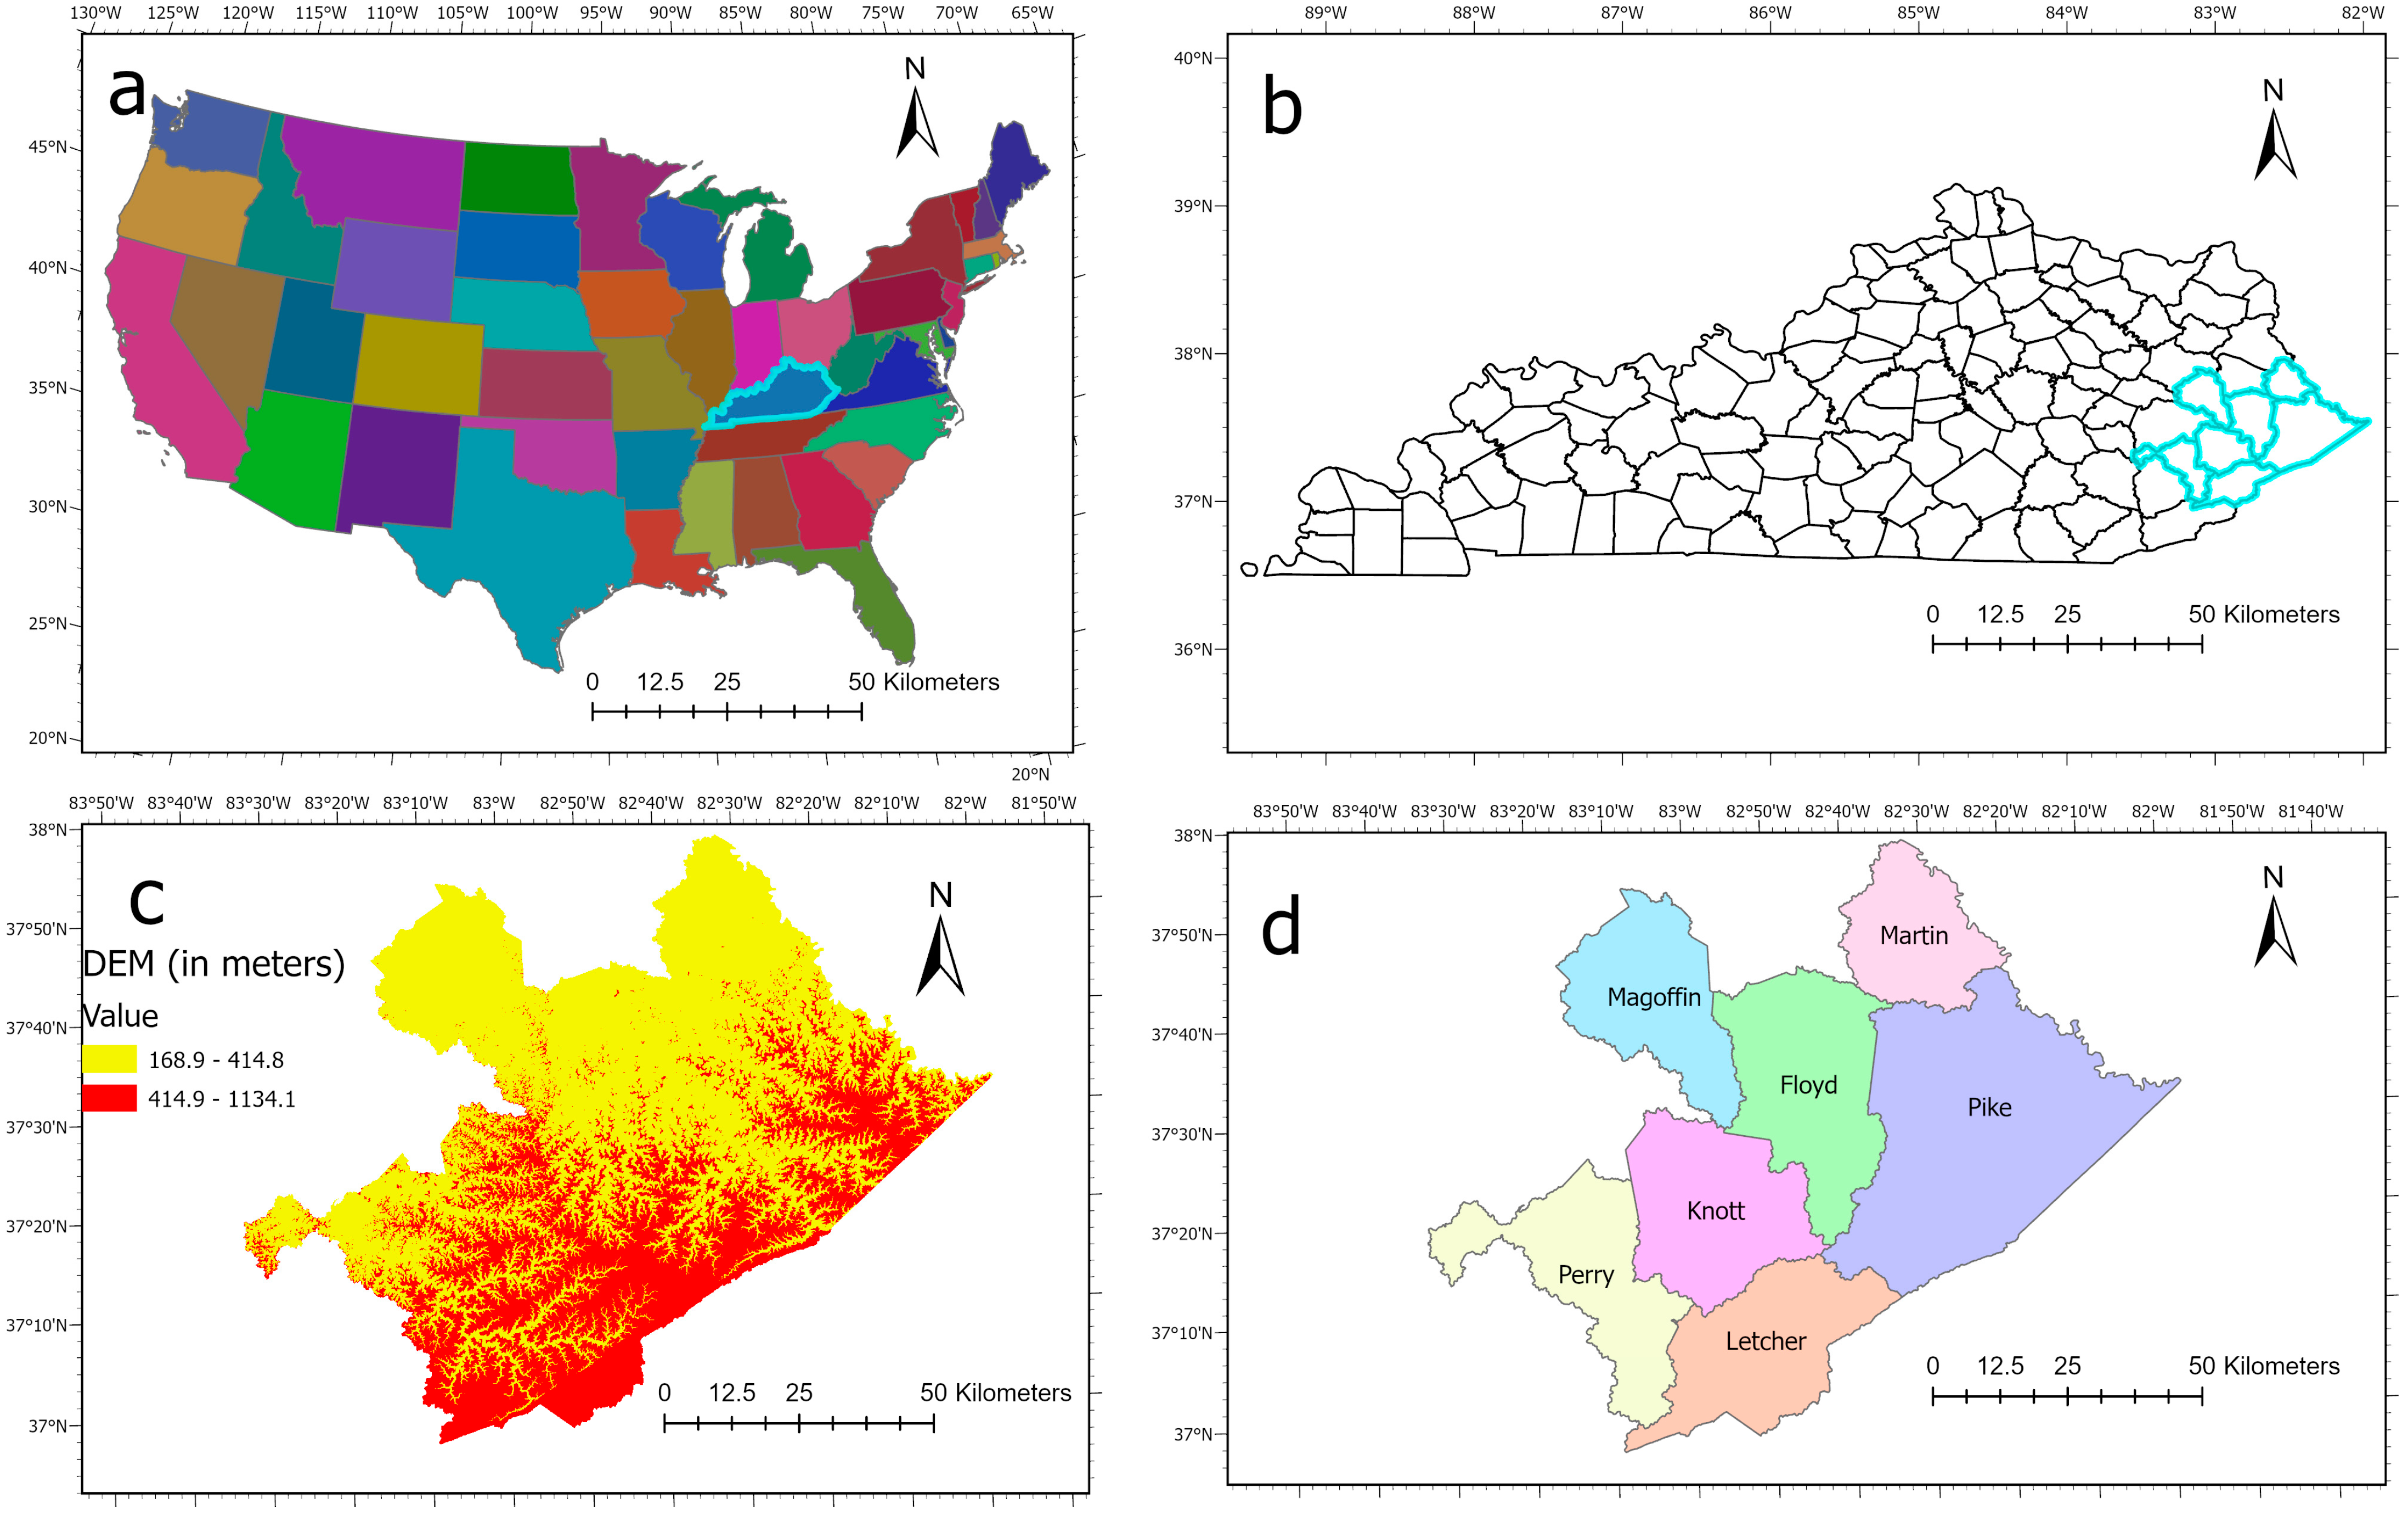
Figure 1. Map of study area: (a) contiguous USA showing KY, (b) Map of KY showing study area counties within blue border, (c) DEM of study area, (d) coalfield counties of study area.
Land 13 01541 g001
Figure 2. Study workflow.
Land 13 01541 g002
Figure 3. Topographic layers: (a) elevation, (b) slope, (c) aspect, (d) land capability classes of the study area.
Land 13 01541 g003
Figure 4. Land-cover maps of the study area for 2004 and 2019.
Land 13 01541 g004
Figure 5. Map showing land-cover change in the study area from 2004 to 2019.
Land 13 01541 g005
Figure 6. (a) Land-cover change trends in the study area from 2004 to 2019. (b) Land-cover change trends in the study area from 2004 to 2019.
Land 13 01541 g006
Figure 7. Graphical representation of percentage change in land-cover classes between the years 2004 and 2019 in the study area.
Land 13 01541 g007
Figure 8. Hot spot and cold spot mapping of herbaceous and developed land-cover change using Gi* Statistic between 2004 and 2019 in eastern Kentucky.
Land 13 01541 g008
Figure 9. Hot spot and cold spot mapping of forest and barren land-cover change using Gi* Statistic between 2004 and 2019 in eastern Kentucky.
Land 13 01541 g009
Figure 10. Hot spot and cold spot mapping of shrubland land-cover change using Gi* Statistic between 2004 and 2019 in eastern Kentucky.
Land 13 01541 g010
Figure 11. Validation points and training samples shown in a map of the study area for 2004 and 2019.
Land 13 01541 g011
Table 1. Datasets used in the study.
Data Type GroupSpatial ResolutionSource of DataTypes of Data
Landsat data (2004, 2006, 2010, 2016, 2019)30 mUSGS/EROSRaster
NAIP data (2004, 2006, 2010, 2016, 2020)1 mKY Geoportal Image ServiceRaster
NLCD data (2006, 2011, 2016, 2019)30 mKY Geoportal Image Service Raster
Surface-mined areas KY Division of Mine PermitsPoint and Polygons
DEM data layer (2011)1.524 m (5 feet)KY Geoportal Image ServiceRaster
Land capability class (2012) USDA NRCS Soil Survey Geographic Data base (SSURGO)Vector data
Kentucky roads (2015)(30 m converted)KY Geoportal Vector data
National Hydrology Dataset (2023)USGSVector data
Table 3. Results of the paired t-test for the change in land-cover classes between 2004 and 2019 in Census Block Groups (CBGs) of the study area.
Land-Cover ClassT-Valuep-Value
Water1.470.14
Developed9.051.72 × 10−16 ***
Barren−5.021.18 × 10−6 ***
Forest3.270.01 ***
Shrubland−2.430.01 ***
Herbaceous−6.526.02 × 10−10 ***
Planted/
Cultivated
−1.820.07 **
Test results are based on the paired t-test. *** represents p-values at 1%, ** at 5% and * at 10% of significance level. The number of CBGs for the t test was 191.
Table 4. Land-cover transition matrix between 2004 and 2019 in the study area (results in sq km).
2019
2004Land-Cover TypeWaterDevelopedBarrenForestShrublandsHerbaceousPlanted/CultivatedTotal 2004
Water18.563.791.1215.272.790.582.2544.36
Developed2.9690.443.5822.1923.363.6327.85174.01
Barren0.9310.3421.5824.5490.1230.161.51179.18
Forest19.2582.2237.534471.14383.4429.427.155050.13
Shrublands4.7995.9515.58650.14305.9839.7124.461136.61
Herbaceous0.6848.8211.0385.33135.3350.6311.45343.27
Planted/Cultivated2.4360.510.3234.4215.931.5195.77210.89
Total 201949.6392.0790.745303.03956.95155.62190.447138.45
Table 5. Spatial autocorrelation report for land-cover classes in the study area displaying Moran’s I index for each year (2004–2019).
YearLand-Cover Classes
WaterDevelopedBarrenForestHerbaceousShrublandPlanted/
Cultivated
20040.4680.2670.1530.3380.3580.5420.499
20060.360.3360.2310.3070.3410.4280.552
20100.5420.3450.260.3960.2360.6710.638
20160.4290.3880.2540.3660.3190.4810.461
20190.3670.4320.1940.410.2710.4080.613
Table 6. Table showing the Kappa’s accuracy for all seven counties from 2004 to 2019.
YearsCountiesKappa’s AccuracyYearsCountiesKappa’s Accuracy
2004Floyd0.842006Floyd0.84
Knott0.75Knott0.79
Letcher0.77Letcher0.83
Martin0.86Martin0.85
Magoffin0.77Magoffin0.78
Perry0.84Perry0.81
Pike0.77Pike0.8
2010Floyd0.852016Floyd0.89
Knott0.85Knott0.81
Letcher0.79Letcher0.89
Martin0.83Martin0.85
Magoffin0.8Magoffin0.79
Perry0.83Perry0.82
Pike0.84Pike0.79
2019Floyd0.85
Knott0.84
Letcher0.78
Martin0.85
Magoffin0.8
Perry0.83
Pike0.84
Disclaimer/Publisher’s Note: The statements, opinions and data contained in all publications are solely those of the individual author(s) and contributor(s) and not of MDPI and/or the editor(s). MDPI and/or the editor(s) disclaim responsibility for any injury to people or property resulting from any ideas, methods, instructions or products referred to in the content.