Article

Spatiotemporal Variation and Prediction of Carbon Storage in Terrestrial Ecosystems at Multiple Development Stages in Beijing City Based on the Plus and Integrated Valuation of Ecosystem Services and Tradeoffs Models

1
College of Urban and Environmental Sciences, Peking University, Beijing 100871, China
2
School of Architecture, Tsinghua University, Beijing 100083, China
*
Author to whom correspondence should be addressed.
These authors contirbuted as co-first authors.
Land 2024, 13(9), 1544; https://doi.org/10.3390/land13091544
Submission received: 15 July 2024 / Revised: 12 September 2024 / Accepted: 19 September 2024 / Published: 23 September 2024

Abstract

:
Terrestrial ecosystems play a critical role in the global carbon cycle, and their carbon sequestration capacity is vital for mitigating the impacts of climate change. Changes in land use and land cover (LULC) dynamics significantly alter this capacity. This study scrutinizes the LULC evolution within the Beijing metropolitan region from 1992 to 2022, evaluating its implications for ecosystem carbon storage. It also employs the Patch-Generating Land Use Simulation (PLUS) model to simulate LULC patterns under four scenarios for 2035: an Uncontrolled Scenario (UCS), a Natural Evolution Scenario (NES), a Strict Control Scenario (SCS), and a Reforestation and Wetland Expansion Scenario (RWES). The InVEST model is concurrently used to assess and forecast ecosystem carbon storage under each scenario. Key insights from the study are as follows: (1) from 1992 to 2022, Beijing’s LULC exhibited a phased developmental trajectory, marked by an expansion of urban and forested areas at the expense of agricultural land; (2) concurrently, the region’s ecosystem carbon storage displayed a fluctuating trend, peaking initially before declining, with higher storage in the northwest and lower in the central urban zones; (3) by 2035, ecosystem carbon storage is projected to decrease by 1.41 Megatons under the UCS, decrease by 0.097 Megatons under the NES, increase by 1.70 Megatons under the SCS, and increase by 11.97 Megatons under the RWES; and (4) the study underscores the efficacy of policies curtailing construction land expansion in Beijing, advocating for sustained urban growth constraints and intensified afforestation initiatives. This research reveals significant changes in urban land use types and the mechanisms propelling these shifts, offering a scientific basis for comprehending LULC transformations in Beijing and their ramifications for ecosystem carbon storage. It further provides policymakers with substantial insights for the development of strategic environmental and urban planning initiatives.

1. Introduction

The 2023 United Nations Intergovernmental Panel on Climate Change (IPCC) report indicates that the global average surface temperature rose by 1.1 °C between 2011 and 2020 in comparison to the period between 1850 and 1900 [1]. Terrestrial ecosystems have a significant impact on the global carbon cycle [2], and enhancing the carbon storage capacity of terrestrial ecosystems is currently widely acknowledged by the international community as one of the most economically feasible and environmentally sustainable ways to mitigate the rise in atmospheric carbon dioxide concentrations [3]. At the 75th session of the United Nations General Assembly, China announced its aim to peak carbon emissions by 2030 and become carbon neutral by 2060.
Land use and land cover (LULC) are significant factors affecting the carbon storage of terrestrial ecosystems. They contribute to either carbon emissions or sequestration, ultimately impacting regional carbon balance [4,5]. Therefore, quantitatively analyzing LULC’s impact on the carbon storage of terrestrial ecosystems is vital.
Predicting future carbon storage quantities and spatial distribution patterns requires spatial simulation analysis based on LULC types. Therefore, using coupled models of carbon storage calculation and LULC prediction is a classic approach in this field, with common models such as FLUS-InVEST, PLUS-InVEST, and so on. In existing carbon storage calculation models, the InVEST (Integrated Valuation of Ecosystem Services and Tradeoffs) model can estimate regional carbon storage based on four fundamental carbon pools: aboveground biomass carbon, belowground biomass carbon, soil carbon, and dead organic matter carbon, and has the advantages of requiring less data and providing clear spatial representation [6,7], and it is widely used to study the impact of land use changes on terrestrial ecosystem carbon storage at different spatial scales [8,9].
Currently, academia primarily uses models based on cellular automata for LULC prediction, such as the CA-Markov [10], CLUE-S [11], FLUS [12], and PLUS models [13]. However, the CA-Markov model cannot capture the complex spatial dynamics and nonlinear characteristics of LULC changes [14]; the CLUE-S model neglects the possibility of non-dominant land cover conversion [15,16]; the FLUS model fails to reveal how driving factors lead to land use changes, and its accuracy in simulating changes across multiple land use types is not high [17,18]. The PLUS model, with its unique advantages, effectively circumvents the pitfall of exponential growth in the number of transformation types as categories increase through the integration of transformation analysis strategies and pattern analysis strategies [16], and it can reveal the mechanisms of land use changes within specific time periods. Therefore, it offers higher predictive accuracy and broader applicability and supports more analyses of urban development patterns [13]. Some scholars have used the coupled PLUS-InVEST model to predict future carbon storage in different cities [16,19,20,21]. Therefore, this study selects the PLUS-InVEST model to predict future carbon storage. It uses the Kappa coefficient to test the predictive accuracy of the PLUS model, with test results exceeding 0.90, demonstrating that the PLUS model is suitable for this study (as detailed in Section 2.4.1).
In the early 20th century, Patrick Geddes introduced the concept of urban development cycles [22]. Later in the century, Peter Hall proposed a theory of urban development stages, elucidating the processes of urban emergence, growth, prosperity, decline, and regeneration [23]. Recent studies have indicated that the development of Land Use and Land Cover (LULC) and ecosystem carbon storage in cities at different developmental stages of growth exhibits distinct characteristics [24,25,26]. Many ongoing studies utilize the PLUS model to simulate and comparatively analyze changes in regional LULC and carbon storage distribution under various scenarios, such as ecological conservation, low-carbon development, cropland protection, and economic prioritization [27,28,29,30]. However, existing studies lack the perspective of integrating urban development stages with planning policies to examine the changes in LULC and terrestrial ecosystem carbon storage across different stages of urban development. This will lead to inaccuracies in the prediction results.
In 2015, China’s capital—Beijing—joined the “Pioneering Carbon Peaking Cities Alliance”, being the first mega-city in China to propose and implement a “reduction of construction land” plan. Around 2017, Beijing introduced a series of policies to control the expansion of construction land. It marks the transition of Beijing’s land use pattern development from the rapid expansion phase of construction land to the control phase of construction land. Currently, some scholars are using the PLUS model to predict Beijing’s future spatial patterns of LULC, but there is a lack of further research on carbon storage, and their approach still relies on the natural growth and livable city scenarios commonly used in previous studies without considering the multi-stage development scenarios relevant to Beijing [31,32,33].
In this study, we developed a multi-scenario LULC and terrestrial ecosystem carbon storage prediction model. Compared to previous studies, this model thoroughly considers the impact of urban development stages and planning policies, allowing for more accurate predictions of future regional carbon storage trends. The objectives of study are as follows: (1) to elaborate the developmental stages and change patterns of Beijing’s LULC and ecosystem carbon storage over the past 30 years, (2) to forecast spatial patterns of LULC and ecosystem carbon storage for multiple scenarios in Beijing by the year 2035, (3) to investigate the intrinsic mechanisms driving the changes in LULC and ecosystem carbon storage, and (4) to provide recommendations for the formulation of planning strategies based on the aforementioned analysis.

2. Materials and Methodology

2.1. Study Area

Beijing, located in the northern part of the North China Plain, spans approximately 16,410 square kilometers. Its geographical coordinates range from 115°25′ E to 117°30′ E and 39°28′ N to 41°05′ N. The city is in close proximity to Tianjin and Hebei Province, forming the Beijing–Tianjin–Hebei metropolitan region. Topographically, Beijing is characterized by higher elevations in the northwest and lower in the southeast. The western and northern parts are mountainous, with peaks reaching 1000 to 1500 m above sea level, typically covered by forests and grasslands. The southeastern plain, which is about 6338 square kilometers in area, is the main area for urban development (Figure 1).

2.2. Data

Table 1 demonstrates the research data used in this paper and its sources. The land use and land cover (LULC) dataset used in this paper is extracted from the China Land Cover Dataset (CLCD), compiled by Professor Xin Huang’s team at Wuhan University, based on Landsat data through the Google Earth engine. The dataset has a spatial resolution of 30 × 30 m and covers 23 time points from 1992 to 2022, including parameters for LULC types and area. It categorizes Beijing’s LULC types into seven distinct classes: cropland, forest, shrubland, grassland, water bodies, unused land, and construction land. This study incorporates the characteristics of LULC change in Beijing, leveraging the spatiotemporal accessibility and quantifiability of various datasets. Referring to established research conventions, 17 driving factors for LULC forecasting have been identified and classified into natural and socioeconomic factors [2,13,18,20,34,35,36,37,38]. Data on population density, GDP, NLD (Night Light Data), AMT (Annual Mean Temperature), MAP (Mean Annual Precipitation), NDVI (Normalize Difference Vegetation Index), and soil types are sourced from the Resource and Environment Science and Data Center of the Chinese Academy of Sciences (https://www.resdc.cn/, assessed on 22 April 2024). Data on urban road networks, railways, transportation stations, and water bodies are sourced from OpenStreetMap (http://www.openstreetmap.org/, assessed on 22 April 2024). Euclidean distance analysis in Arcmap 10.7 was used to generate raster data for distances to road networks, railways, transportation stations, and water bodies, all with a spatial resolution of 30 m by 30 m. DEM (Digital Elevation Model) data were extracted from the Shuttle Radar Topography Mission (SRTM) dataset (https://www.earthdata.nasa.gov/sensors/srtm, assessed on 22 April 2024), and slope and Slope Orientation were generated using Arcmap 10.7. Referring to previous studies [20,37], all spatial data were standardized to a uniform projection coordinate system using ArcGIS 10.7. The “Resample” tool was used to resample the resolution of all spatial data to 30 m, employing different resampling techniques according to the characteristics of the data. The Nearest technique was used for soil type data, which is suitable for categorical data; the Bilinear technique was used for GDP, population, NLD, DEM, slope, Slope Orientation, and NDVI data, as it interpolates values using the four nearest cells around the target location and is suitable for continuously varying data; the Cubic Convolution technique was used for AMT and MAP, utilizing 16 surrounding cells and cubic convolution functions, an approach suitable for continuous and smoothly varying data.

2.3. Research Framework

Figure 2 illustrates the four components included in this study:
(1)
Using 30 phases of LULC data from 1992 to 2022 and ArcGIS software (https://www.arcgis.com/index.html accessed on 17 September 2024), we analyzed LULC change trends in Beijing from 1992 to 2022. Then, using InVEST software (https://naturalcapitalproject.stanford.edu/software/invest accessed on 17 September 2024), we calculated and analyzed the trends in ecosystem carbon storage in Beijing from 1992 to 2022.
(2)
Based on the LULC and ecosystem carbon storage change trends in Beijing over the past 30 years, as well as relevant policies and plans issued by the government, we identified the development stages of LULC and ecosystem carbon storage in Beijing.
(3)
Using the development stage assessment described above, we predicted the LULC and ecosystem carbon storage in Beijing for 2035 under multiple scenarios. The scenarios were as follows: (i) an Uncontrolled Scenario (UCS), which simulates the LULC development trend in Beijing from 2011 to 2017 (i.e., the first time phase identified in the second part of this study) and serves as a baseline; (ii) a Natural Evolution Scenario (NES), which simulates the LULC development trend in Beijing from 2017 to 2020 (i.e., the second time phase identified in the second part); (iii) a Strict Control Scenario (SCS), which simulates the LULC development trend in Beijing from 2017 to 2020 (i.e., the second time phase identified in the second part), with strict control over the expansion of construction land according to the planning requirements; and (iv) a Reforestation and Wetland Expansion Scenario (RWES), which simulates the LULC development trend in Beijing from 2017 to 2020 (i.e., the second time phase identified in the second part); it involves strict control over the construction land area according to planning requirements while intensifying efforts in reforestation and wetland restoration, expanding various ecological spaces.
(4)
Based on the above analyses and simulation predictions, we propose corresponding policy and planning recommendations, including discussions on the mechanisms of land use pattern changes.

2.4. Methodology

2.4.1. Simulation of Future LULC Patterns under Multiple Scenarios

The PLUS model was applied to simulate Beijing’s future LULC patterns through the following steps:
(1) LULC Expansion Analysis
The LEAS module of the PLUS model processes land use and land cover data from two periods, along with driving factor data, which are input. It extracts the expansion areas from the initial to the final land use and land cover and utilizes a random forest algorithm to calculate the expansion probability of each LULC type and the contribution of driving factors to the expansion of each LULC type [31,34,39]. The growth probability P i , k d of land use type k at cell i [13].
P i , k d = n = 1 M I ( h n x = d ) M
The value of d is either 0 or 1; a value of 1 indicates that there were other land use types that changed to land use type k, while 0 represents other transitions; x is a vector that consists of multiple driving factors; I(∙) is the indicative function of the decision tree set; ℎn(x) is the prediction type of the n−th decision tree for vector x; and M is the total count of decision trees [13].
(2) Multi-scenario Setting
Chinese cities may implement different land policies and exhibit varying LULC development trends at different stages of their development [40,41,42,43,44]. In Beijing, where strict land expansion control policies were implemented after 2017, the rate of land expansion slowed down. If using very early data before 2017 for prediction, the Markov chain-based forecast of future construction land demand may be overestimated. Previous studies on Beijing have not addressed this issue [2,18,31,32,33,45].
At the beginning of a new development phase in Beijing, adding a control group that uses LULC data from the previous phase for predicting future land use changes, as compared to using only the LULC data from the new phase, allows for a more refined evaluation of the effectiveness of land expansion control policies through comparison, identifies where the policies have produced specific effects, and provides a basis for further controlling land expansion to mitigate carbon storage loss.
Therefore, this study utilizes multi-period land use data from Beijing’s two development stages, in line with the “Beijing Urban Master Plan (2016–2035)” and the “Beijing Comprehensive Reform and Expansion Plan.” Four development scenarios—UCS, NES, SCS, and RWES—were established.
(i)
Uncontrolled Scenario (UCS)
Beijing’s LULC will continue its development trend from 2011 to 2017, before the formal implementation of policies. This scenario will serve as a baseline control for evaluating the effectiveness of policies aimed at reducing land use.
(ii)
Natural Evolution Scenario (NES)
After the formal implementation of policies, the LULC in Beijing will continue the actual development trend observed between 2017 and 2020.
(iii)
Strict Control Scenario (SCS)
Strictly complying with planning requirements, the entire construction land area will be controlled. The “Beijing General Plan (2016–2035)” proposes that the overall construction land area in the city should be 3670 square kilometers by 2035, with a minimum forest coverage rate of 45%. By adjusting the transfer probabilities of LULC, by 2035, the total area of Beijing’s construction land and forest area will meet the planning requirements.
(iv)
Reforestation and Wetland Expansion Scenario (RWES)
On the premise of strictly controlling the total area of construction land in 2035 to not exceed the planning requirements, Beijing will increase the intensity of converting farmland back to forests and wetlands, thereby expanding ecological space. Some of the ambitious targets set by the “Beijing General Plan (2016–2035)” include achieving a forest coverage rate in the plain areas of 33% by 2035 (Article 49), significantly expanding the scale of green space, and promoting the return of inefficient land use to green land (Article 104). Beijing’s plain area is 6338 square kilometers, and the LULC data for 2020 show that the forest area in the plain area is 138.77 square kilometers, and the forest area in the mountainous area is 7843.75 square kilometers. By adjusting the transfer probabilities of LULC, Beijing’s forest area will expand to approximately 9934 square kilometers by 2035, simulating Beijing’s policy of actively promoting the conversion of farmland back to forests.
(3) Forecasting LULC Demand
Utilizing the Markov chain method for forecasting future LULC demands, the calculation formula is given by the following:
S t + 1 = P i j × S t
In the formula, i and j denote land use types; t represents time; St and St+1 represent the land use states at time t and t+1, respectively; and Pij represents the transition probability matrix from the i-th land use type to the j-th land use type.
Using LULC data from 2011 and 2017, the demand for various LULC types in Beijing for 2035 under the Uncontrolled Scenario (UCS) is forecasted. Similarly, using LULC data from 2017 and 2020, the demand for various LULC types in Beijing for 2035 is predicted under three scenarios. These scenarios are the Natural Evolution Scenario (NES), the Strict Control Scenario (SCS), and the Reforestation and Wetland Expansion Scenario (RWES). In the UCS and NES, the LULC transition probabilities directly derived from the LULC data are utilized.
Under the SCS, in accordance with policy requirements, the LULC transition probabilities calculated from the data of 2017 and 2020 are adjusted. The probabilities of forest land, shrubland, and water bodies transitioning to construction land are set to zero while increasing the probabilities of construction land transitioning to cropland, forest land, and water bodies. This adjustment aims to approximate the total construction land area of 3670 square kilometers in Beijing by 2035.
In the RWES, based on the SCS, the probabilities of cropland transitioning to forest land and water bodies are increased to simulate a scenario where the forest coverage rate in the plain areas reaches approximately 33%. This results in a forecasted area of cropland for 2035 of 2297.44 square kilometers, which still meets the requirement of the “Beijing General Plan (2016–2035)”, outlining that the protected area of basic farmland should be at less than 1.5 million mu (approximately 100,000 hectares).
Table 2 demonstrates the Probability adjustment of LULC conversion based on RCL policies obtained after the above analysis.
(4) Simulation of Future LULC Patterns and Accuracy Assessment
Initial LULC data and the expansion probabilities of each LULC type, calculated using the LEAS module, are input into the CARS module of the PLUS model. By setting the parameters Conversion Constraint, Transition Matrix, and Neighborhood Weights, the model simulates future LULC patterns under four scenarios. The CARS module will simulate future LULC patterns based on “Feedbacks between Macro Demands and Local Competition” and “Multi-type Random Patch Seeds based on a Descending Threshold” for the four scenarios. The Uncontrolled Scenario (UCS) utilizes the 2017 LULC data as initial LULC data, while the Natural Evolution Scenario (NES), Strict Control Scenario (SCS), and Reforestation and Wetland Expansion Scenario (RWES) utilize the 2020 LULC data as initial LULC data.
(i) Conversion Constraint
The Conversion Constraint is used to designate areas in which LULC transitions are restricted. A raster layer containing only the values 0 and 1 is input, where areas with a value of 0 represent restricted transition zones, within which LULC types are prohibited from changing. Under the UCS, the restricted transition zones are the nature reserves in Beijing. Under the SCS, NES, and RWES, the restricted transition zones include the nature reserves in Beijing and the open water bodies from the 2020 LULC data.
(ii) Transition Matrix
The Transition Matrix determines transition possibilities between different LULC types, with 1 representing permissible transitions and 0 representing impermissible transitions. The Transition Matrix is configured according to the connotations of the four scenarios.
(iii) Neighborhood Weights
Neighborhood Weights are used to set the expansion capabilities of each LULC type, with values ranging from 0 to 1, where higher values indicate stronger expansion capabilities. In this study, the Neighborhood Weights for the UCS and NES are calculated based on the actual expansion areas of each LULC type. The calculation formula is as follows:
W i = T A i T A m i n T A m a x T A m i n
In the formula, Wi is the neighborhood weight for the i-th land type, TAi is the expansion area of the i-th land use type, TAmin is the minimum expansion area across all land use types, and TAmax is the maximum expansion area across all land use types.
Table 3 demonstrates the Neighborhood factor parameters used in this study.
The expansion areas of each LULC type under the SCS and RWES for the period 2017–2020 are simulated using the revised LULC transition probabilities; the neighborhood factor is calculated similarly using Formula (2).
(iv) Accuracy Assessment
Before simulating future LULC patterns, it is necessary to verify the accuracy of the model’s simulation. The Kappa coefficient is used to evaluate the simulation accuracy of the model, where a Kappa coefficient greater than 0.8 indicates a high level of simulation accuracy. The calculation formula is given by:
K a p p a = P o P c P p P c
In the formula, Kappa represents the simulation coefficient value, which ranges from 0 to 1; Po represents the proportion of correct simulations; Pc represents the proportion of correct predictions under random model conditions; Pp represents the proportion of correct predictions under ideal conditions. The closer the Kappa value is to 1, the more consistent the model’s predictions are with the actual situation, indicating a higher accuracy of the model. Generally, a Kappa coefficient greater than 0.8 is considered to indicate that the model is reliable.
Using the LULC data from 2011 and 2017, the UCS model is constructed, and the LULC pattern for 2017 is simulated using the 2011 LULC data as the initial LULC data. The simulation results are compared with the actual LULC data from 2017, and the Kappa coefficient is 0.964029. Similarly, using the LULC data from 2017 and 2020, the NES and SCS models are constructed, with Kappa coefficients of 0.905812. All three model coefficients exceed 0.8, indicating that they are suitable for simulation purposes.

2.4.2. Estimation of Future Carbon Storage

This study uses the carbon storage and sequestration modules of the InVEST model to estimate Beijing’s future carbon storage. This module categorizes ecosystem carbon storage into four fundamental carbon pools: aboveground biomass carbon, belowground biomass carbon, soil carbon, and dead organic matter carbon. The formula is expressed as:
C i = C i a b o v e + C i b e l o w + C i s o i l + C i d e a d
In the formula, Ci represents the carbon density value for LULC type i; and Ci-above, Ci-below, Ci-soil, and Ci-dead represent the carbon densities for aboveground biomass, belowground biomass, soil, and dead organic matter, respectively.
The total carbon storage in the study area is calculated as the sum of the average carbon density of the four carbon pools, each multiplied by the area of the corresponding LULC types. The formula is given by
C t o t a l = i = 1 n C i × S i
In the formula, Ctotal denotes the total carbon storage of the study area; n is the number of LULC types, which is set to 7 for the purpose of this study; Ci is the carbon density value for LULC type i; and Si is the area of LULC type i.
As shown in Table 4, the carbon density data (carbon stock per unit area) used in this study are based on the latest research findings by some scholars [2]. They combined field measurements from 327 sample plots set up in the Beijing–Tianjin–Hebei region in 2022, forest resource planning and design survey data from Hebei Province (2005 and 2018), 499 carbon density data points from the 21st-century terrestrial ecosystem aboveground carbon density dataset for the Beijing–Tianjin–Hebei region (2004–2014), and previous studies by Shao Zhuang et al. [18]. The result is a calculation of carbon density applicable to the land use types in the Beijing–Tianjin–Hebei region, covering eight LULC types: cropland, forest, shrubland, grassland, water bodies, unused land, construction land, and coastal mudflats, consistent with the land use classification used in this study. These data are based on actual measurements, have a high level of feasibility, and are suitable for the LULC data used in this study.

2.4.3. Land Use Change Analysis

According to the research objectives, three indicators are selected to analyze land use changes in Beijing from 1990 to 2022 and for the year 2035 relative to 2017 and 2020: the area of change for single land use types, the dynamic degree of single land use types, and the land use transition matrix. The growth probability of construction land is used to analyze the trends and patterns of construction land change in Beijing.
The dynamic degree of a single land use type visually reflects the magnitude and speed of changes in that land use type. The calculation formula is
k = U U a × 1 T × 100 %
U = U b U a
In the formulas, k represents the change rate of a specific land use type within the study period; U a and U b denote the quantity of the specific land use type at the beginning and end of the study period, respectively; T is the length of the study period. △U represents the area of change for the specific land use type within the study period.
The land use transition matrix describes the conversion between different land use types. The mathematical form of the transition matrix is
S i j = S 11 S 12 S 1 n S 21 S 22 S 2 n S n 1 S n 2 S n n
In the formula, n represents the land use types, S i j indicates the area of land use type i that is transferred to land use type j. The sum of each row in the transition matrix represents the total area of the land use type at the beginning of the study period. Each element in a row provides information on the direction of flow from land use type i to various land use types after the transfer. The sum of each column represents the total area of the land use type at the end of the study period, and each element in a column provides information on the area of land use type j after the transfer, indicating its source from different land use types before the transfer.
The formula for calculating the growth probability was provided in Section 2.4.1.

3. Results

3.1. Evolution of LULC and Ecosystem Carbon Storage in Beijing from 1992 to 2022

3.1.1. Evolution of LULC

Table 5 delineates the spatiotemporal alterations in the area and the dynamic intensity of each LULC category within the study area, spanning between 1992 and 2022. Figure 3 shows the distribution pattern of LULC types for each representative year. The empirical data reveal that between 1992 and 2022, the expanse of cropland decreased, with the most pronounced phase of transformation occurring between 2002 and 2007. The grassland area experienced a consistent decline across most surveyed periods, except a notable increase between 2002 and 2007, and demonstrated a comparatively elevated dynamic index. Conversely, the area of forest land exhibited a consistent upward trend from 1992 to 2022, exhibiting the lowest mean dynamic index among all LULC categories. The area of water bodies decreased from 1997 to 2007, with a high dynamic index, followed by an expansion post-2007, with another period of heightened dynamics after 2012. Though minimal, the aggregate area of shrublands and unused land underwent significant changes. The footprint of construction land saw a continuous expansion from 1992 to 2022, with the apex of its dynamic index occurring between 2002 and 2007. The annual growth rate of construction land from 1992 to 2004 was relatively strong, showing an overall upward trend with periodic fluctuations. Between 2005 and 2015, despite the high growth rate, the overall trend was downward, interspersed with cyclical fluctuations. Between 2016 and 2022, the growth rate of construction land was subdued, manifesting a persistently declining trend, with the exception of 2022, which displayed a notable uptick. This resurgence may be attributed to the temporary halt in the expansion of construction land in 2021, a consequence of the economic slowdown induced by the COVID-19 pandemic in 2020, followed by a resurgence in the subsequent year. The evolution of construction land is congruent with the developmental trajectory of China’s real estate industry and aligns with the chronological implementation of Beijing’s RCL policies [46].
Table 6 presents the land use transition matrix for the study area between 1992 to 2022. The data indicate that from 1992 to 2022, 1810.2 square kilometers of cropland were converted to construction land, accounting for 79.3% of the reduction in cropland and 96.9% of the increase in construction land. Additionally, 20.54 square kilometers of construction land was reduced; 78.3% of construction land was converted to water and 20.3% to cropland. Furthermore, 365.03 square kilometers of cultivated land and 381.54 square kilometers of grassland were converted to forest land, accounting for 46.1% and 48.2% of the increase in forest land, respectively. It is noteworthy that 108.92 square kilometers of forest land was converted to cultivated land, accounting for 57.4% of the reduction in forest land.

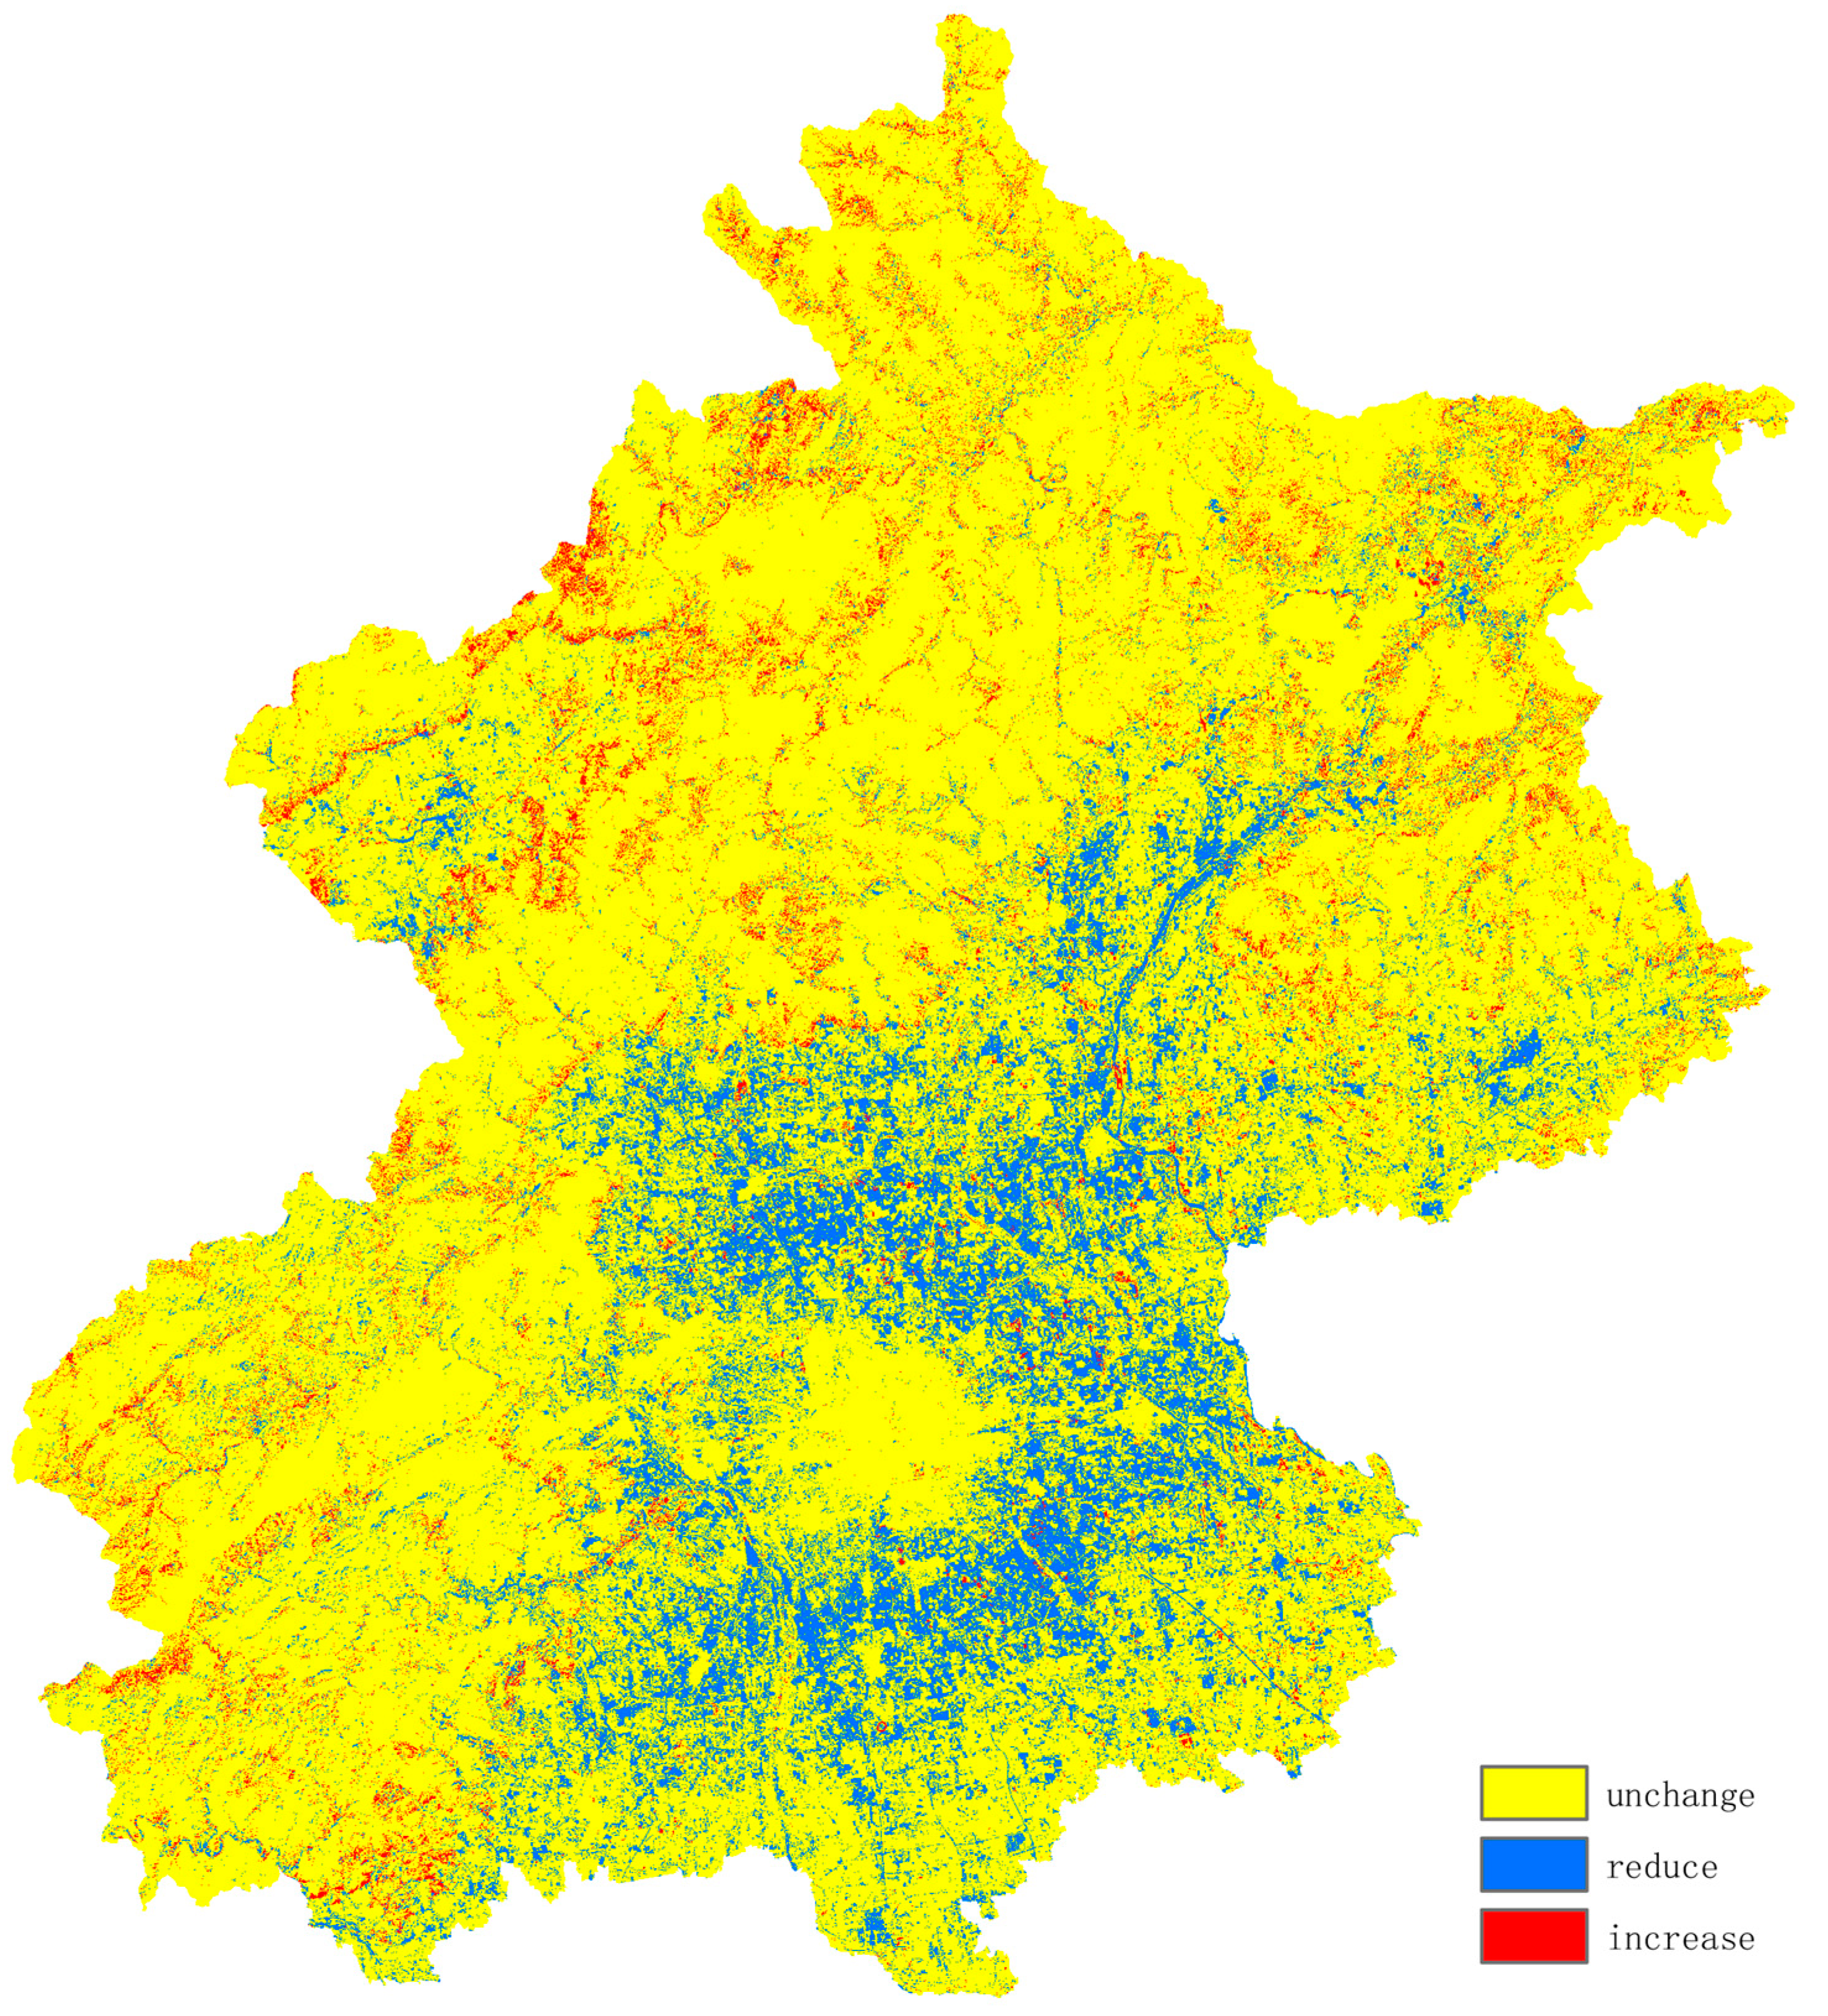
3.1.2. Evolution of Ecosystem Carbon Storage

The analysis revealed an increase in carbon storage until 1994, which was followed by a decline until 1997. A subsequent rise occurred after 1998, culminating in a peak carbon storage of 209.82 Megatons. This was succeeded by a precipitous decline, which reached a nadir in 2011. The interval between 1998 and 2011 is characterized by a significant loss of 3.48 Megatons in carbon storage, representing the peak of carbon depletion. This period coincided with a phase of robust economic growth and urban expansion in Beijing, intensifying the demand for land conversion. The period between 2011 and 2013 marked a brief recovery in carbon storage, after which a decline ensued until 2017, albeit at a slower rate. Since 2017, carbon storage has exhibited a pattern of stable oscillation, concurrent with a marked deceleration in urban construction land expansion. By 2022, Beijing’s carbon storage was recorded at 206.01 Megatons. The regions in Beijing with higher carbon storage are predominantly situated in the forest-rich northwest of the study area. In contrast, lower carbon storage zones are predominantly located within the central urban districts. Figure 4 delineates the spatial redistribution of carbon storage in Beijing from 1992 to 2018. The study area reveals that carbon storage has been relatively stable and represents 81.4% of the total area. A decreasing trend in carbon storage is observed in 13.1% of the area, primarily peripheral to urban centers and in the vicinities of rivers, wetlands, and reservoirs, where land use has shifted from other types to aquatic bodies. In contrast, an increasing trend is detected in 5.5% of the area, predominantly in mountainous areas and environs of the South-to-North Water Diversion Project, where land has been reforested from other utilization types.

3.2. Anticipated Transformations in LULC and Carbon Sequestration Potential within Beijing’s Ecosystem by 2035: A Multi-Scenario Approach

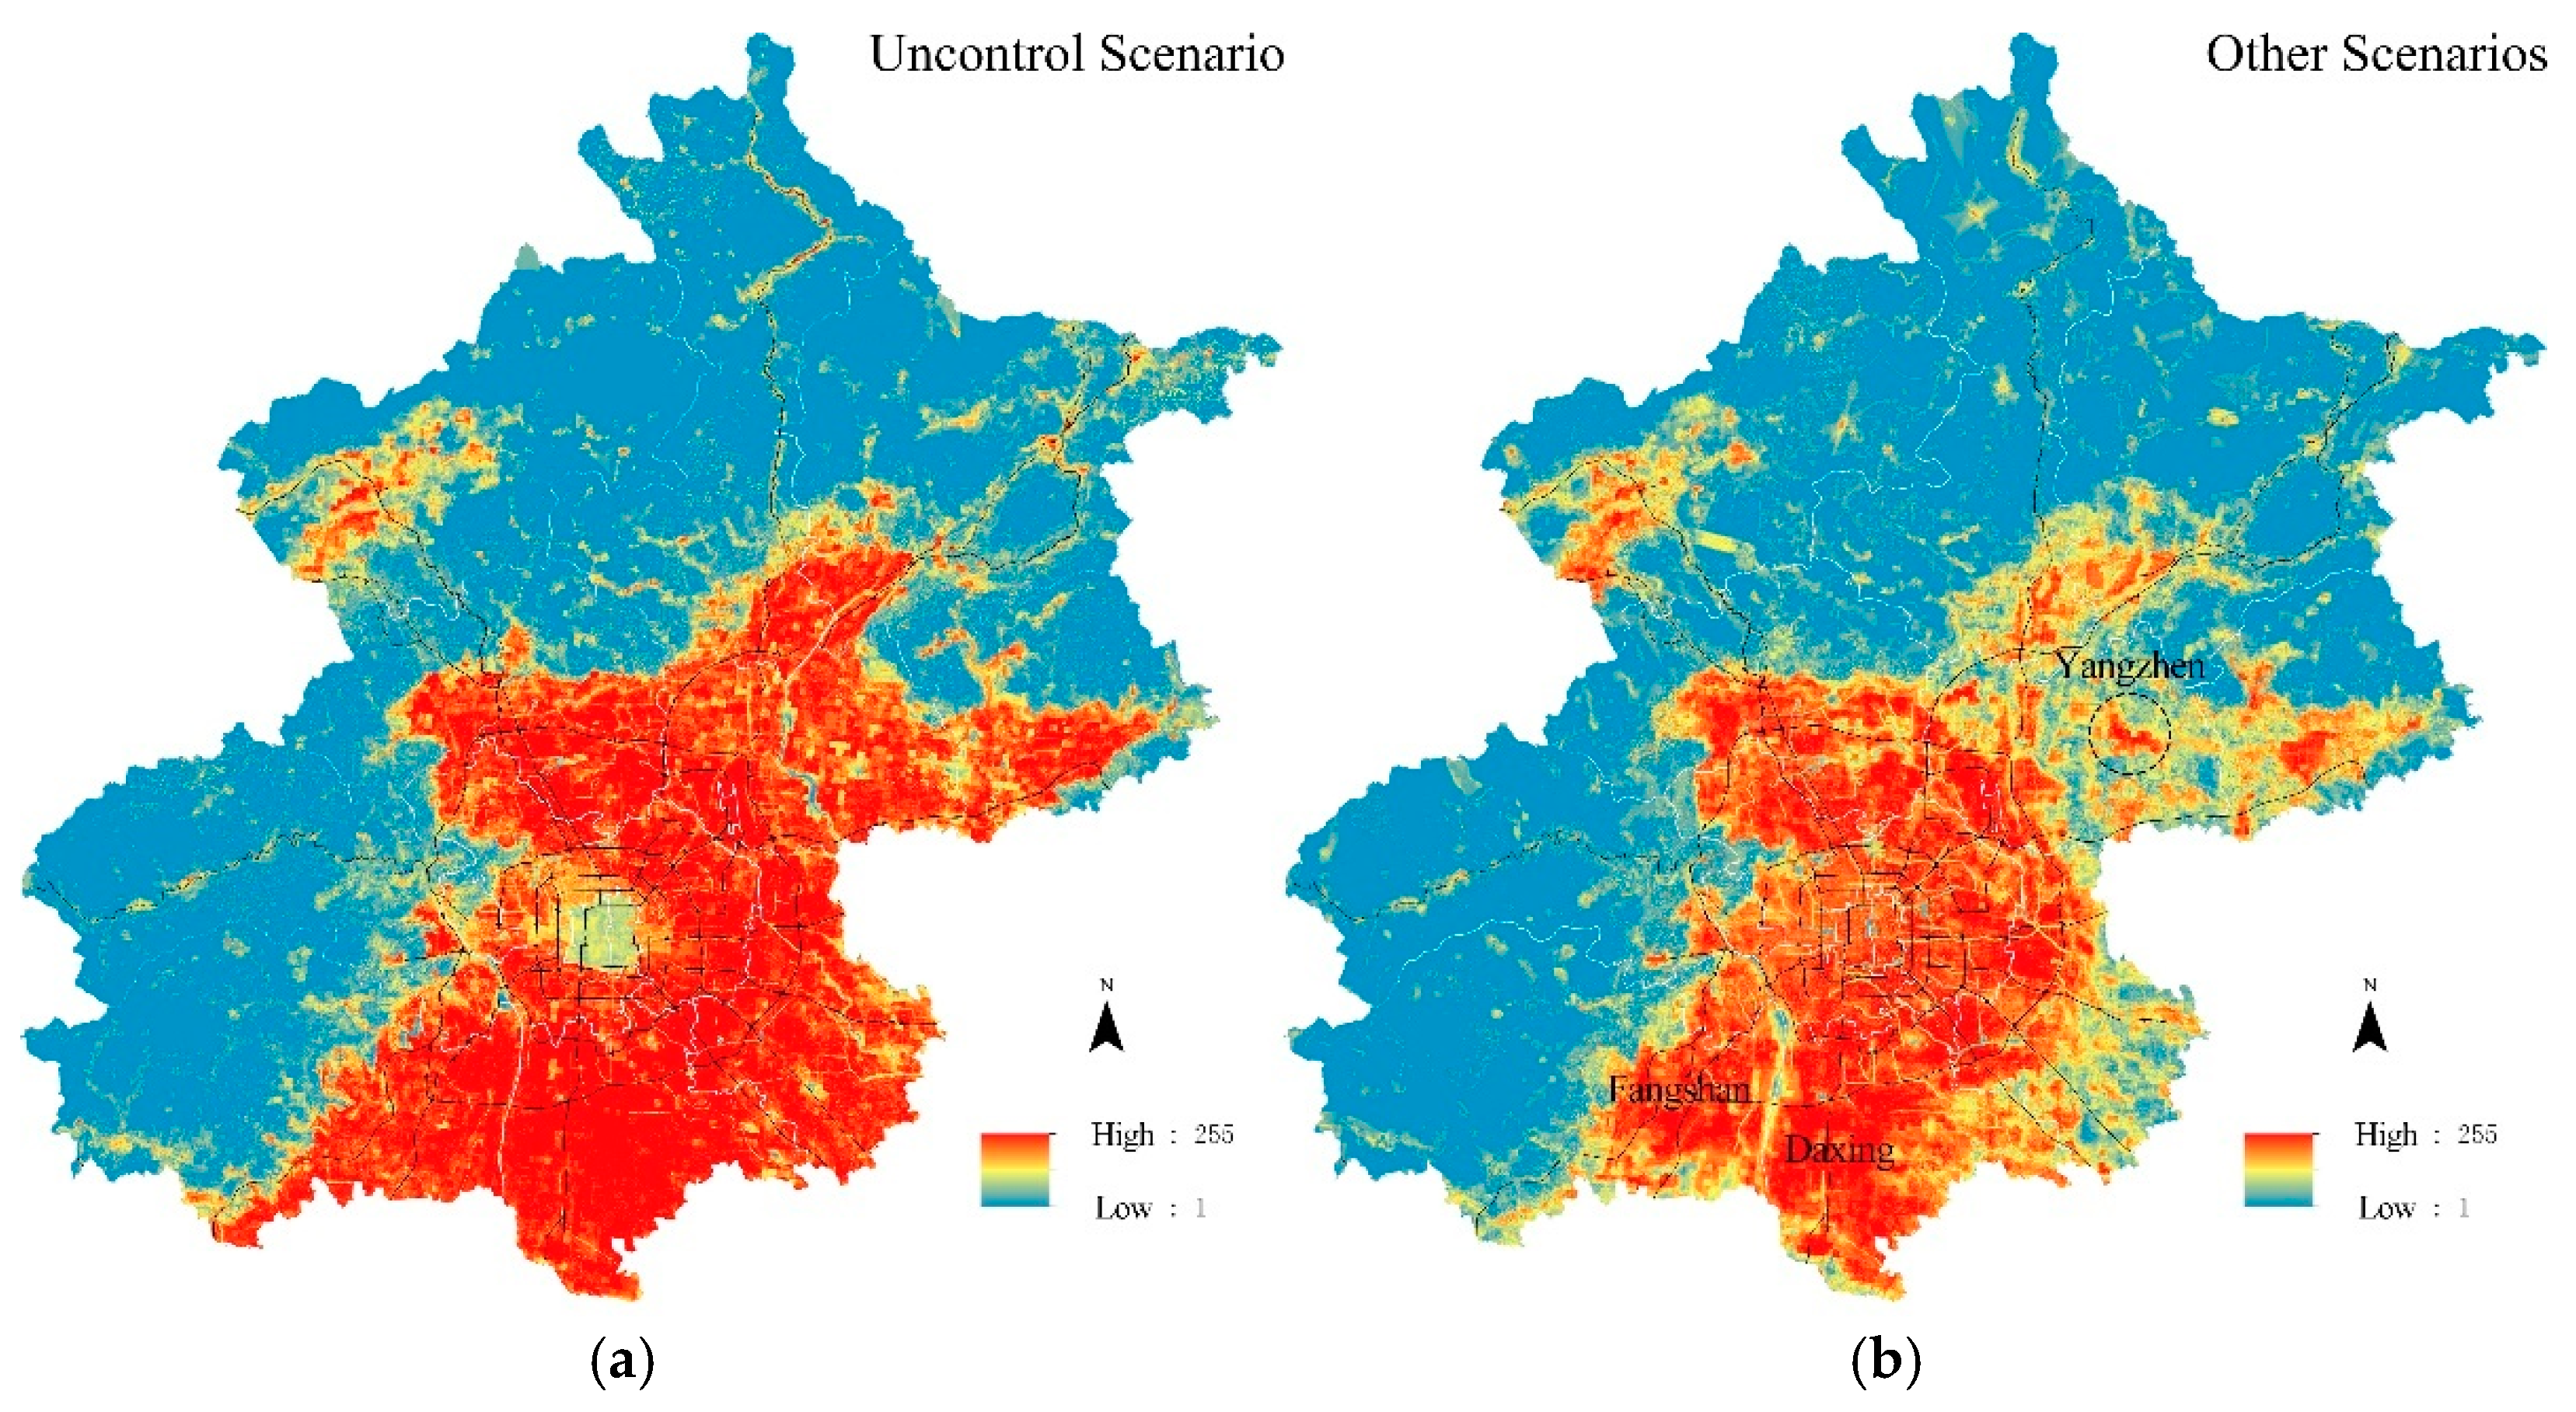
3.2.1. Prediction of LULC

Employing a temporal dataset spanning 2011, 2017, and 2020, we utilized the PLUS model to simulate the potential LULC configurations for the year 2035 under four different urbanization paradigms: the Uncontrolled Scenario (UCS), the Natural Evolution (NES), the Strict Control Scenario (SCS), and the Reforestation and Wetland Expansion Scenario (RWES) (refer to Table 7 and Table 8 for detailed outcomes).
A consistent decline is observed in cropland across all scenarios, with the most significant reduction occurring under the UCS and RWES. However, the encroachment on agricultural expanses in the NES and SCS is observed to be somewhat mitigated. Forested areas exhibit an increment in all scenarios, with the RWES demonstrating a more significant enhancement, which is beneficial for forest-based carbon sequestration. Forested regions are predominantly converted from a decrease in grasslands. The water bodies exhibit an increasing trend in all scenarios, contradicting the patterns identified in extant literature [2,18,31,33,34].
Spatial analysis shows that the construction land across all scenarios exhibits an expansionary trend along pre-existing urban footprints. The UCS shows the most pronounced effect, particularly in the southeastern districts of Daxing and Tongzhou, where construction land has rapidly encroached upon cropland. Conversely, the NES, SCS, and RWES exhibit a more moderate pace in construction land expansion, primarily building upon the existing urban cores and new cities. Crucially, without strict land expansion control measures, by 2035, the NES may lead to a construction land total that surpasses the policy-led threshold of 3670 square kilometers.

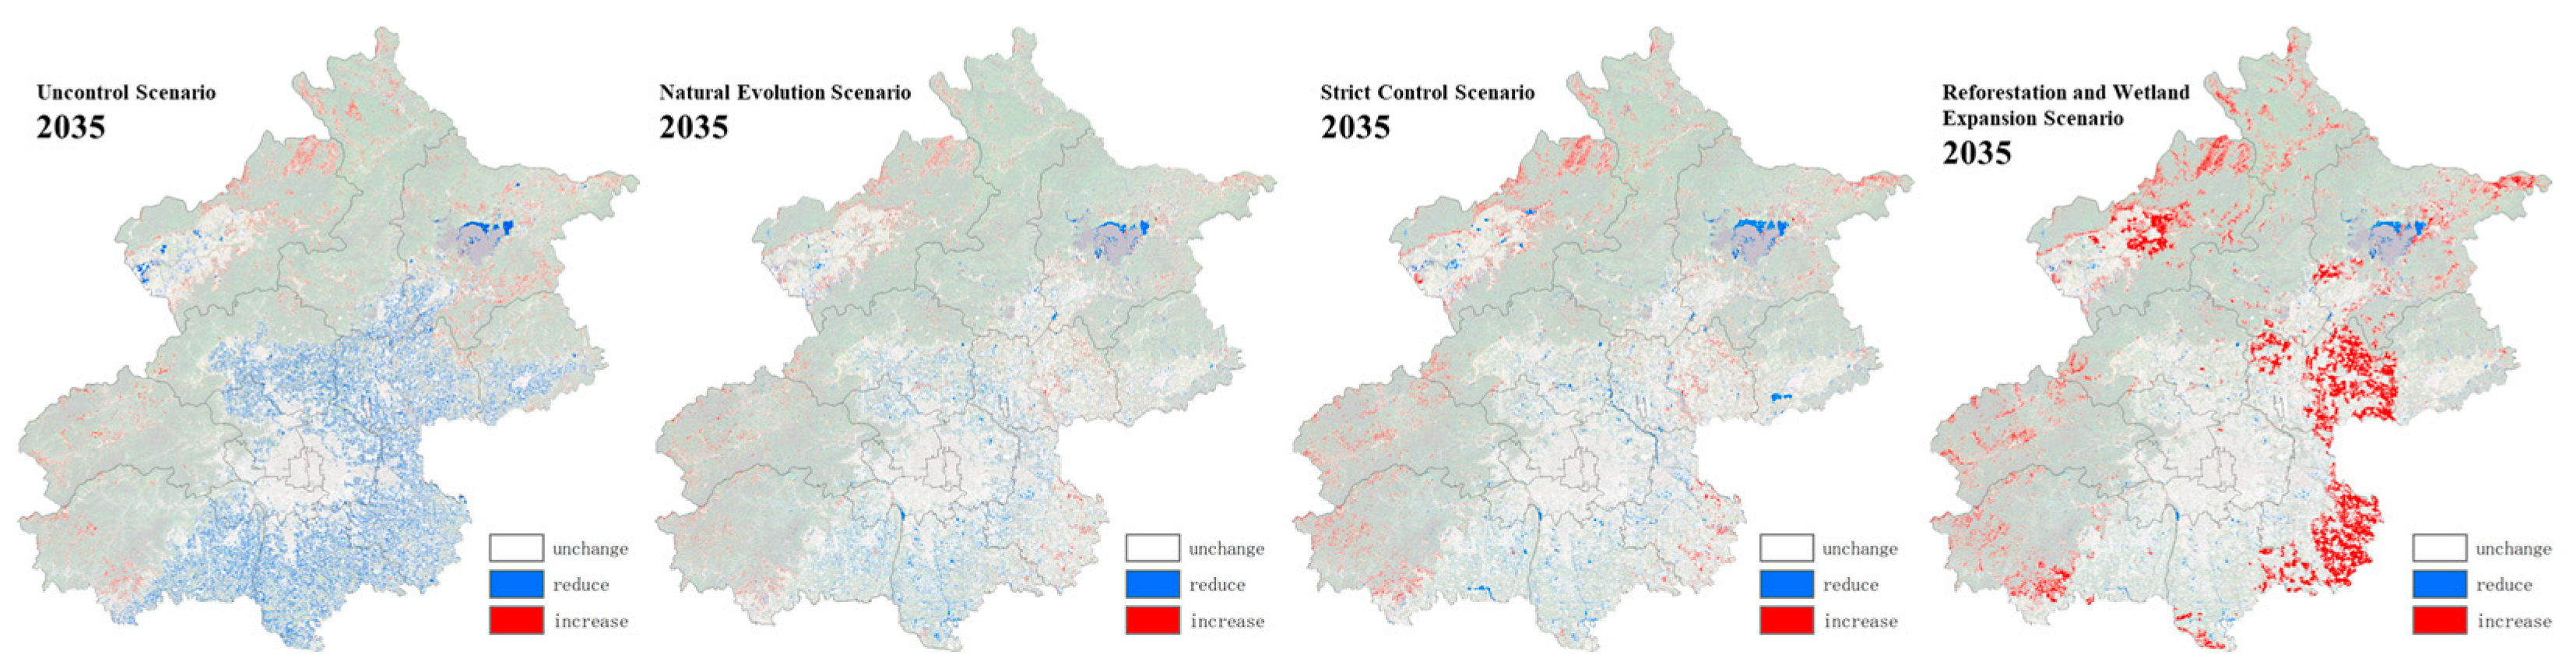
3.2.2. Prediction of Carbon Storage

Figure 5 illustrates the carbon storage of various LULC types under four scenarios. The carbon storage in the UCS is 204.62 Megatons, a decrease of 1.41 Megatons compared with 2017, and the decrease is mainly due to the significant reduction of cropland. In contrast, the carbon storage in the NES is 205.93 Megatons, a decrease of 0.097 Megatons; this decrease is significantly smaller compared to the UCS. On the other hand, carbon storage in the SCS is 207.72 Megatons, an increase of 1.70 Megatons compared to 2017, while carbon storage in the RWES is 218.00 Megatons, an increase of 11.97 Megatons compared to 2017, and this increase in carbon storage is mainly attributed to the increase in forest area.
Figure 6 graphically represents the delineation of ecosystem carbon storage across the four urban development scenarios. The spatial heterogeneity features elevated carbon sequestration in the mountainous regions and lower storage in the urban zones. Notably, the high-intensity carbon storage zones in the northwest are concentrated within the Taihang and Yanshan mountain ranges, while in comparison, the expansive urban conglomerations in the southeast exhibit lower carbon storage capacities due to the extensive built-up areas.
Figure 7 juxtaposes the carbon storage estimates for 2035 and 2017 under the four scenarios. Within the UCS framework, it is observed that a majority of the region’s carbon storage, 93.4%, maintains a relatively stable condition. However, a reduction in carbon storage, 5.3%, is primarily observed in the southeastern plains and select valley regions within the northwestern mountainous areas, notably in the Yanqing and Miyun Districts. Conversely, it is sporadically noted in the mountainous parts with negligible enhancement in the plains, a minor increment of 1.3% in carbon storage.
Under the NES, a significant majority of 96.6% of the area’s carbon storage remains stable. A marginal 2.2% decrease in carbon storage is observed, predominantly in the peripheries of existing urban settlements and regions where other land types adjacent to water bodies have been converted into aquatic expanses. This scenario demonstrates a significant reduction in carbon loss compared to the UCS. Additionally, a slight increase of 1.2% in carbon storage is identified mainly in the mountainous areas and the plains east of the Sixth Ring Road.
In the context of the SCS, 96.13% of the area’s carbon storage is stable. An increase of 2.03% and a slight decrease of 1.84% in carbon storage are noted. The distribution pattern of carbon storage mirrors that of the NES, with reduced carbon loss attributable to urban sprawl and increased carbon storage in the mountainous regions and the plains east of the Sixth Ring Road.
Finally, the RWES discloses that 92.09% of the region’s carbon storage is preserved in a stable state. A minor reduction of 1.15% and a substantial increase of 6.76% in the region’s carbon storage are observed. This scenario is distinguished by a significant conversion of cropland into forested areas, leading to a substantial increase in carbon storage in Beijing‘s northeastern and southwestern sectors.

4. Discussion

4.1. Discussion on Carbon Storage in Beijing by 2035 and the Reasons for Its Changes

This study posits that given policies controlling construction land growth, the total construction land area in Beijing will slightly exceed policy limits by 2035 if development trends from 2017 to 2020 continue. Without the emergence of large new cities, new construction land will appear around existing areas. This aligns with most studies predicting Beijing’s LULC pattern by 2035 [47,48] but differs from studies based on land use data from 2015 and 2020 [31]. In Tongzhou District, the RWES scenario described here and the Sustainable Urban Development Scenario from previous studies predict similar outcomes [49]. The forest land area in Tongzhou will significantly increase, achieving Beijing’s goal to create a forest and wetland park ring around the capital.
LULC data are crucial for predicting future carbon storage. Existing studies on Beijing’s carbon storage often use data from the Resource and Environment Science and Data Center of the Chinese Academy of Sciences [18,50,51] and GlobeLand30 [14,52]. The former provides detailed classifications for forests, grasslands, and other land types, making it suitable for larger regions like Beijing–Tianjin–Hebei, but it has significant errors in measuring Beijing’s LULC area. For instance, it shows a decrease of 616.87 square kilometers in construction land from 2015 to 2018, with an increase of 150.17 square kilometers by 2020. This significantly deviates from actual changes reported by the Beijing municipal government and contradicts Chinese urban development patterns. GlobeLand30 only has LULC data for the three periods of 2000, 2010, and 2020, which cannot accurately reflect the characteristics of LULC changes in Beijing in the new stage. The CLCD data used in this study better reflect Beijing’s LULC situation. Some studies predict Beijing’s carbon storage to be around 16 million tons by 2035 [18]. This study questions this estimate, suggesting Beijing’s carbon storage should exceed 200 million tons, aligning more closely with other predictions [34].
Existing research generally analyzes the distribution of changes in Beijing’s future carbon storage but overlooks the detailed analysis of LULC changes driving these variations [14,18,50,51,52]. This study addresses that gap. As shown in Figure 8, Under the SCS scenario, most regions with increased carbon storage result from land use/land cover transitions to forests, such as northwest Yanqing District (Region ⑥), southwest Fangshan District (Region ⑦), and east Changping District (Region ④). Additionally, in western Yanqing District (Region ⑤), decreased grassland and increased arable land have led to higher carbon storage. Regions with reduced carbon storage are mainly due to construction land expansion, such as southern Changping District (Region ①), southern Daxing District (Region ③), and northeastern Miyun District (Region ⑧). Expansion of water bodies further exacerbates carbon storage reduction. These results align with previous studies [2]. In the eastern part of Yanqing District, the opposite trend is observed compared to the western part (Region ⑤), where reduced cultivated land and increased grassland have led to decreased carbon storage.

4.2. LULC Forecasting Methodology Based on Multi-Stage Development Control

In academic discourses on predicting LULC, traditional approaches involve manipulating Markov chain models and recalibrating driving factors, as explained in existing literature [2,12].
This study employs two distinct phases of LULC data as the foundational dataset for prediction: the control group (UCS) used data from 2011 and 2017, while the experimental group (NES, SCS, and RWES) used data from 2017 and 2020. This will not only improve the accuracy of future land use predictions but will also enable the evaluation of the implementation of policy effectiveness when constraining the expansion of construction land through comparative analysis. The method is to select LULC data from the current stage of urban development to set up an experimental group and select LULC data from the stage where Beijing has not yet implemented construction land control policies as the control group. Three parameters will be used for comparative analysis: Parameter one is the contribution of socio-economic driving factors to the expansion of construction land under different scenarios; Parameter two is the land use transfer matrix from 2017 to 2035 under different scenarios; and Parameter three is the growth probability of construction land under different scenarios.

4.2.1. Analysis of the Mechanism of Multi-Stage Changes in Construction Land in Beijing

The study of future urban LULC and carbon storage should analyze the driving factors of LULC changes and provide further support for the government in formulating more refined urban development strategies. The LEAS module of the PLUS model has the ability to use Random Forest Classification to analyze the contribution of each driving factor to the growth of different types of LULC, measured by Variable Importance. The larger the Variable Importance, the greater the contribution. Scholars have used this method to analyze the mechanism of changes in LULC, such as deciduous forests in Wuhan are most affected by the distance of main roads [13], slope is the most significant factor contributing to the expansion of Chengdu Chongqing Urban Agglomeration’s forests [19], and GDP has a limiting impact on urban forests in Chengdu [28]. However, there is currently no scholar analyzing the driving factors of LULC changes in Beijing [31,51,53]. A comparative analysis of the contributions of driving factors to the expansion of construction land between two epochs, 2011–2017 and 2017–2020 (Figure 9), reveals a significant decrease in the contributions of the Digital Elevation Model (DEM), Gross Domestic Product (GDP), and population (POP) metric in 2011–2017. This reduction can be attributed to Beijing’s policy of de-emphasizing non-capital core functions, resulting in the containment of the expansion of construction land within the main urban area. This is achieved while dispersing these functions to the surrounding suburban counties and other provincial and municipal jurisdictions. The construction land expansion in the northwestern mountainous district urban areas, such as Yanqing and Miyun, is less constrained in comparison to the main urban area. The influence of proximity to highways and principal roads on construction land expansion has waned between 2017 and 2020. Adversely, the contributions of nighttime illumination (a proxy for the concentration of urban activities) and the distances to secondary roads, minor roads, and transportation hubs have escalated. This transformation may indicate Beijing’s adoption of a more intensive and public transport-oriented development strategy for construction land post-2017. This discovery is consistent with the conclusions of previous research [54,55]. The transformation of urban development mode will fundamentally slow down the loss of carbon storage in Beijing.

4.2.2. Policy Recommendations for Mitigating Carbon Stock Loss by Controlling the Expansion of Construction Land

Comparing the Uncontrolled Scenario as a baseline with the expansion of construction land in other scenarios can more accurately identify the effectiveness of Beijing’s construction land control policies and where control should be strengthened in the future to mitigate the loss of carbon storage.
Comparing the land use transfer matrix from 2017 to 2035 between other scenarios and the Uncontrolled Scenario, it can be found that after Beijing implemented construction land control, the carbon storage loss caused by construction land expansion in 2035 significantly decreased, indicating that the policy can achieve results.
The predictions of future LULC by the PLUS model depend on the future demand and expansion potential of LULC types. If the demand is artificially controlled, even if a certain LULC type has shown strong growth probability in the past, it may not show significant expansion in the predictions. However, this does not mean that the difficulty and significance of controlling construction land expansion are the same across different regions, which is a precise concern for urban managers when formulating policies. Therefore, this article compares the growth probability of construction land under UCS and other scenarios. The calculation formula has been provided in Section 2.4.1, and the PLUS model will output a grid file with values ranging from 1 to 255. The higher the value of a grid, the more likely it is to be converted into construction land in the future.
As shown in Figure 10, Under the developmental trajectory observed from 2011 to 2017, the expansion potential for Beijing’s construction land is exceedingly high, featuring near-unregulated proliferation in the southeastern plains and the valleys within the mountainous regions. This expansion tends to propagate along transportation arteries, penetrating into the mountainous areas. This finding is consistent with previous studies [2,18]. In contrast, under the developmental trend from 2017 to 2020, there is a marked containment of construction land expansion in these regions, with a sharp decline in the expansion potential east of the Sixth Ring Road. This trend is consistent with Beijing’s “Greenbelt Plan” [56], underscoring the efficacy of the city’s strategic planning and policies in curbing urban sprawl, particularly in the eastern sectors of the primary urban expanse. The expansion potential of construction land near major water bodies, green corridors, and their vicinities has declined significantly relative to the period between 2011–2017, signifying a strengthened commitment to the preservation of Beijing’s ecological framework. However, Daxing District and Fangshan District in the south, as well as Yanqing District in the northwest, still have high potential for expansion of construction land.
Further comparison of the growth probability of construction land between 2017 and 2020 with the urban planning structure reveals that the growth probability of construction land in Beijing during this period is largely consistent with the urban development structure proposed in the ‘Beijing Master Plan 2017–2035’. However, attention should be given to monitoring the unregulated expansion of construction land in rural areas of Fangshan District, Daxing District, Yanqing District, and Yangzhen in Shunyi District.
Based on the projected 2035 spatial alterations in carbon storage and the attendant influence mechanisms anticipated, the following strategic planning interventions are recommended for implementation to augment Beijing’s carbon sequestration and sink capacity:
(1)
Strictly limit urban construction land expansion: Promote the intensive use of land and enforce a stringent urban development boundary system to prevent a decline in land carbon sequestration capacity.
(2)
Strengthen afforestation initiatives: Encourage the conversion of various LULC types into forests to enhance carbon sequestration.
(3)
Utilize technological measures to limit the expansion of water bodies: Prevent water bodies from encroaching on other LULC categories, especially forest land, to avoid a corresponding decline in Beijing’s carbon storage. For example, promote inter-basin water transfers instead of building new reservoirs and deepen existing reservoirs vertically rather than expanding them horizontally.

4.3. Limitations and Future Prospects

It is important to acknowledge that this study has certain limitations. First, due to constraints in data availability, the land use data are not highly precise, and the resolution of the driving factors is not sufficiently high, leading to some degree of error in the prediction results. These LULC data also lack sufficient distinction between forest, cropland, unused land, and construction land in the urban fringe areas of Beijing. For example, it does not accurately identify patches of forest within areas of cropland, or it continues to classify land that will be reclaimed as cropland or restored to forest as construction or unused land. This leads to the data not clearly presenting the true pattern of forest in Beijing’s urban fringe areas, resulting in errors when the cellular automata model predicts the future pattern of LULC. To address this, we have referred to other studies and conducted a Kappa analysis to keep the error within an acceptable range. Future research could explore more methods of data acquisition to improve the accuracy and resolution of the data.
Moreover, while the coupled PLUS and InVEST method used in this study is currently the preferred approach in most research, there is still room for improvement. In terms of future land use predictions, some recent studies have begun to explore the use of system dynamics methods for LULC prediction [37,57].
In terms of carbon storage calculations, due to the InVEST model’s neglect of the fact that carbon storage changes resulting from LULC changes occur gradually, there is some error in the future carbon storage predictions. Take forest land as an example: the carbon storage of forest land is closely related to the age structure of the forest. According to the study by Fan Dengxing et al. on the carbon storage of forests of different ages in Beijing, the carbon storage of mature forests in Beijing is approximately 1.06 times and 1.60 times that of middle-aged and young forests, respectively. After other LULC types transition to forest land [58], it takes 20 years or even longer for the ecosystem’s carbon storage to reach the level of mature forests. In the four scenarios of this study, forest land expansion is the main reason for carbon storage growth (Figure 5). The forest land carbon storage data used in this study for InVEST calculations was revised by Wu Aibin et al. based on multi-source measured data, with the latest forest land sampling data mainly collected from mature forests in the Yanshan-Taihang Mountains region [2]. Therefore, the carbon storage of newly added forest land after 2017 is unlikely to reach the values used in InVEST calculations by 2035, leading to potentially overestimated predictions for 2035 carbon storage. At present, research on the ecosystem carbon storage changes following various LULC changes in Beijing is relatively scarce. Filling this research gap in the future could enable more accurate predictions. In summary, future research could innovate in modeling and prediction techniques to further enhance accuracy.
Finally, this study’s main contribution is the introduction of a control group method for more precise prediction of LULC patterns across different urban development stages. However, the selected sample is limited to Beijing, and it is unclear whether this method is applicable to other cities in China or worldwide. Future research could build on this by selecting different urban samples and further subdividing urban development stages for more in-depth analysis.

5. Conclusions

This study delivers a comprehensive examination of the shifts in LULC in Beijing between 1992 and 2022, along with their implications for ecosystem carbon storage. Employing the PLUS-InVEST model, it forecasts the LULC and ecosystem carbon storage in Beijing for 2035 under four scenarios. The key findings are as follows:
LULC in Beijing has experienced a phased developmental trajectory from 1992 to 2022, with a pronounced expansion in construction land, particularly until 2017. The construction land saw an average annual increase of 68.01 square kilometers until 2017, which then decelerated to 14.47 square kilometers per year. Over the 30-year period, the forest area expanded by 601.62 square kilometers, while the cropland area contracted by 2099.14 square kilometers.
Ecosystem carbon storage in Beijing displayed a fluctuating trend, reaching its zenith in 1998 at 209.82 Megatons. A subsequent decline was observed, primarily due to the expansion of construction land, culminating in the lowest recorded storage in 2011, with a reduction of 3.48 Megatons from the 1998 peak. By 2022, carbon storage rebounded to 206.01 Megatons, with spatial variations indicating higher storage in the northwest and lower in central urban regions.
Projections for 2035 under the UCS, NES, SCS, and RWES scenarios indicate varying impacts on carbon storage. The UCS scenario predicts the largest decrease of 1.41 Megatons, while the RWES scenario forecasts the most significant increase of 11.97 Megatons. The decrease in carbon storage is primarily attributed to the expansion of construction land around the urban center, whereas the increase is due to the growth of forest land in suburban areas.
The study underscores the effectiveness of Beijing’s policies in controlling the expansion of construction land. It is crucial to maintain strict regulations on construction land expansion and to optimize land use to protect ecological spaces, particularly in the rural areas of Daxing and Fangshan Districts. Enhancing ecological restoration projects, such as afforestation, is vital to improving the carbon sequestration capacity of ecosystems. Additionally, efforts must be made to prevent the conversion of various land types into water bodies to preserve the terrestrial ecosystem’s carbon sequestration ability.

Author Contributions

C.L.: Data curation, Methodology, Software, Formal analysis, Visualization. P.W.: Formal analysis, Investigation, Supervision, Writing—original draft, review and editing. L.D.: Resources, Project administration, Funding acquisition, Writing—review and editing. All authors have read and agreed to the published version of the manuscript.

Funding

This research was funded by the National Natural Science Foundation of China (No. 52078003).

Data Availability Statement

No new data were created or analyzed in this study. Data sharing is not applicable to this article.

Conflicts of Interest

The authors declare no conflicts of interest.

References

  1. Lee, H.; Calvin, K.; Dasgupta, D.; Krinmer, G.; Mukherji, A.; Thorne, P.; Trisos, C.; Romero, J.; Aldunce, P.; Barret, K.; et al. Synthesis Report of the IPCC Sixth Assessment Report (AR6), Longer Report. IPCC; Intergovernmental Panel on Climate Change (IPCC): Geneva, Switzerland, 2023. [Google Scholar]
  2. Wu, A.B.; Chen, F.G.; Zhao, Y.X.; Qin, Y.J.; Liu, X.; Guo, X.P. Multi-scenario Simulation of Construction Land Expansion and Its Impact on Ecosystem Carbon Storage in Beijing-Tianjin-Hebei Urban Agglomeration. Huan Jing Ke Xue Huanjing Kexue 2024, 45, 2828–2839. [Google Scholar] [PubMed]
  3. Dybala, K.E.; Steger, K.; Walsh, R.G.; Smart, D.R.; Gardali, T.; Seavy, N.E. Optimizing carbon storage and biodiversity co-benefits in reforested riparian zones. J. Appl. Ecol. 2019, 56, 343–353. [Google Scholar] [CrossRef]
  4. Ge, Q.; Dai, J.; He, F.; Pan, Y.; Wang, M. Land Use, Land Cover Change, and Carbon Cycle Research in China over the Last 300 Years. Sci. China Ser. D Earth Sci. 2008, 51, 197–210. [Google Scholar] [CrossRef]
  5. Ma, X.Z.; Wang, Z. Progress in the study on the impact of land-use change on regional carbon sources and sinks. Acta Ecol. Sin. 2015, 35, 5898–5907. [Google Scholar]
  6. Bagstad, K.J.; Semmens, D.J.; Waage, S.; Winthrop, R. A comparative assessment of decision-support tools for ecosystem services quantification and valuation. Ecosyst. Serv. 2013, 5, 27–39. [Google Scholar] [CrossRef]
  7. Posner, S.; Verutes, G.; Koh, I.; Denu, D.; Ricketts, T. Global use of ecosystem service models. Ecosyst. Serv. 2016, 17, 131–141. [Google Scholar] [CrossRef]
  8. Lin, T.; Yang, M.-Z.; Wu, D.-F.; Liu, F.; Yang, J.-H.; Wang, Y.-J. Spatial correlation and prediction of land use carbon storage based on the InVEST-PLUS model-A case study in Guangdong Province. China Environ. Sci. 2022, 42, 4827–4839. [Google Scholar]
  9. Shi, J.; Shi, P.J.; Wang, Z.Y.; Cheng, F.Y. Spatial-Temporal Evolution and Prediction of Carbon Storage in Jiuquan City Ecosystem Based on PLUS-InVEST Model. Huan Jing Ke Xue Huanjing Kexue 2024, 45, 300–313. [Google Scholar]
  10. Zhu, L.; Song, R.; Sun, S.; Li, Y.; Hu, K. Land use/land cover change and its impact on ecosystem carbon storage in coastal areas of China from 1980 to 2050. Ecol. Indic. 2022, 142, 109178. [Google Scholar] [CrossRef]
  11. Huang, D.; Huang, J.; Liu, T. Delimiting Urban Growth Boundaries Using the CLUE-S Model with Village Administrative Boundaries. Land Use Policy 2019, 82, 422–435. [Google Scholar] [CrossRef]
  12. Hou, J.K.; Chen, J.J.; Zhang, K.Q.; Zhou, G.Q.; You, H.T.; Han, X.W. Temporal and spatial variation characteristics of carbon storage in the source region of the Yellow River based on InVEST and GeoSoS-FLUS models and its response to different future scenarios. Huan Jing Ke Xue Huanjing Kexue 2022, 43, 5253–5262. [Google Scholar] [PubMed]
  13. Liang, X.; Guan, Q.; Clarke, K.C.; Liu, S.; Wang, B.; Yao, Y. Understanding the drivers of sustainable land expansion using a patch-generating land use simulation (PLUS) model: A case study in Wuhan, China. Comput. Environ. Urban Syst. 2021, 85, 101569. [Google Scholar] [CrossRef]
  14. Zhou, T.J.; Ni, C.; Zheng, X. Study on the Impact of Landuse Pattern Changes on Habitat Based on Ca-Markov and InVEST Models—A Case Study of Shallow Mountainous Areas in Beijing. J. Chin. Landsc. Archit. 2020, 36, 139–144. [Google Scholar]
  15. Fu, C.; Liu, Y.; Chen, Y.; Li, F.; Huang, J.; Huang, H. Simulation of Land Use Change and Habitat Quality in the Yellow River Basin under Multiple Scenarios. Water 2022, 14, 3767. [Google Scholar] [CrossRef]
  16. Verburg, P.H.; Soepboer, W.; Veldkamp, A.; Limpiada, R.; Espaldon, V.; Mastura, S.S. Modeling the spatial dynamics of regional land use: The CLUE-S model. Environ. Manag. 2002, 30, 391–405. [Google Scholar] [CrossRef]
  17. Ren, Y.; Liu, X.; Xu, X.; Sun, S.; Zhao, L.; Liang, X.; Zeng, L. Multi-scenario simulation of land use change and its impact on ecosystem services in Beijing-Tianjin-Hebei region based on the FLUS-InVEST Model. Acta Ecol. Sin. 2023, 43, 1–15. [Google Scholar]
  18. Shao, Z.; Chen, Y.; Zhao, J.; Xia, C.; He, Y.; Tang, F. Spatio-temporal evolution and prediction of carbon storage in Beijing’s ecosystem based on FLUS and InVEST models. Acta Ecol. Sin. 2022, 42, 9456–9469. [Google Scholar]
  19. Wang, C.; Li, T.; Guo, X.; Xia, L.; Lu, C.; Wang, C. Plus-InVEST Study of the Chengdu-Chongqing urban agglomeration’s land-use change and carbon storage. Land 2022, 11, 1617. [Google Scholar] [CrossRef]
  20. Li, Y.; Yao, S.; Jiang, H.; Wang, H.; Ran, Q.; Gao, X.; Ding, X.; Ge, D. Spatial-temporal evolution and prediction of carbon storage: An integrated framework based on the MOP–PLUS–InVEST model and an applied case study in Hangzhou, East China. Land 2022, 11, 2213. [Google Scholar] [CrossRef]
  21. Zhang, Z.; Liu, J.; Zhang, Q.; Chen, C.; Yang, Z. Analysis of Spatial-Temporal Variation and Driving Forces of Carbon Storage in Suzhou City Based on the PLUS-InVEST-Geodector Model. Environ. Sci. Technol. 2024, 47, 1–17. [Google Scholar]
  22. Geddes, P. Cities in Evolution; Routledge/Thoemmes Press: London, UK, 1998. [Google Scholar]
  23. Hall, P.; Hay, D. Growth centres in the European urban system. Geogr. Rev. 1982, 72, 360. [Google Scholar]
  24. Li, H.; Hu, Y.; Li, H.; Ren, J.; Shao, R.; Liu, Z. Assessing the Impact of Spatiotemporal Evolution of Urbanization on Carbon Storage in the Mega-Urban Agglomeration Area: Case Study of Yangtze River Delta Urban Agglomeration, China. Sustainability 2023, 15, 14548. [Google Scholar] [CrossRef]
  25. Lu, Q.; Lv, T.; Wang, S.; Wei, L. Spatiotemporal Variation and Development Stage of CO2 Emissions of Urban Agglomerations in the Yangtze River Economic Belt, China. Land 2023, 12, 1678. [Google Scholar] [CrossRef]
  26. Wu, R.; Zhang, Y.; Dai, M.; Li, Q.; Sun, C. The Heterogeneity of the Drivers of Urban Form in China: Perspectives from Regional Disparities and Development Stage Variations. Land 2023, 12, 1436. [Google Scholar] [CrossRef]
  27. Zhang, Y.; Liu, Y.; Wang, Y.; Liu, D.; Xia, C.; Wang, Z.; Wang, H.; Liu, Y. Urban expansion simulation towards low-carbon development: A case study of Wuhan, China. Sustain. Cities Soc. 2020, 63, 102455. [Google Scholar] [CrossRef]
  28. Zhang, Y.; Liao, X.; Sun, D. A Coupled InVEST-PLUS Model for the Spatiotemporal Evolution of Ecosystem Carbon Storage and Multi-Scenario Prediction Analysis. Land 2024, 13, 509. [Google Scholar] [CrossRef]
  29. Du, S.; Zhou, Z.; Huang, D.; Zhang, F.; Deng, F.; Yang, Y. The Response of Carbon storages to Land Use/Cover Change and a Vulnerability Multi-Scenario Analysis of the Karst Region in Southern China Based on PLUS-InVEST. Forests 2023, 14, 2307. [Google Scholar] [CrossRef]
  30. Liu, X.J.; Li, X.; Liang, X.; Shi, H.; Ou, J. Simulating the change of terrestrial carbon storage in China based on the FLUS-InVEST model. Trop. Geogr 2019, 39, 397–409. [Google Scholar]
  31. Du, M.; Liu, C.; Wang, W.; Yang, H. Simulation of Ecological Risk in Beijing Using Mop-Plus Model. Int. Arch. Photogramm. Remote Sens. Spat. Inf. Sci. 2022, 48, 15–22. [Google Scholar] [CrossRef]
  32. Wu, W.; Xu, L.; Zheng, H.; Zhang, X. How much carbon storage will the ecological space leave in a rapid urbanization area? Scenario analysis from Beijing-Tianjin-Hebei Urban Agglomeration. Resour. Conserv. Recycl. 2023, 189, 106774. [Google Scholar] [CrossRef]
  33. Yu, Y.; Guo, B.; Wang, C.; Zang, W.; Huang, X.; Wu, Z.; Xu, M.; Zhou, K.; Li, J.; Yang, Y. Carbon storage simulation and analysis in Beijing-Tianjin-Hebei region based on CA-plus model under dual-carbon background. Geomat. Nat. Hazards Risk 2023, 14, 2173661. [Google Scholar] [CrossRef]
  34. Wang, X.; Wang, C.; Lyu, F.; Chen, S.; Yu, Z. Temporal and spatial variations of carbon storage and carbon sink improvement strategy atthe district and county level based on PLUS-InVEST model: Taking Yanqing District as an example. Acta Ecol. Sin. 2023, 34, 3373–3384. [Google Scholar]
  35. He, Y.; Xia, C.; Shao, Z.; Zhao, J. The spatiotemporal evolution and prediction of carbon storage: A case study of urban agglomeration in China’s Beijing-Tianjin-Hebei region. Land 2022, 11, 858. [Google Scholar] [CrossRef]
  36. Zhang, X.; Han, Y.; Han, Y. Land Use Change and Carbon storage Assessment in Southern Shaanxi based on the PLUS-InVEST Model under Multiple Scenarios. Reg. Res. Dev. 2024, 43, 145–152+160. [Google Scholar]
  37. Lai, Z.; Chen, C.; Chen, J.; Wu, Z.; Wang, F.; Li, S. Multi-scenario simulation of land-use change and delineation of urban growth boundaries in county area: A case study of Xinxing County, Guangdong Province. Land 2022, 11, 1598. [Google Scholar] [CrossRef]
  38. Li, X.; Liu, Z.; Li, S.; Li, Y.; Wang, W. Urban Land Carbon Emission and Carbon Emission Intensity Prediction Based on Patch-Generating Land Use Simulation Model and Grid with Multiple Scenarios in Tianjin. Land 2023, 12, 2160. [Google Scholar] [CrossRef]
  39. Li, L.; Song, Y.; Wei, X.; Dong, J. Exploring the impacts of urban growth on carbon storage under integrated spatial regulation: A case study of Wuhan, China. Ecol. Indic. 2020, 111, 106064. [Google Scholar] [CrossRef]
  40. Wang, H.; Fan, J. Influence of Urban Development Stage of Beijing on the Development of New cities. City Plan. Rev. 2007, 3, 20–24. [Google Scholar]
  41. Zheng, D.; Ma, X.; Zhang, K. Planning Needs and Practice Innovations at the Present Stage. City Plan. Rev. 2023, 47, 10–19. [Google Scholar]
  42. Li, L. Perplexity of Inflection Point at 50%Urbanization Level A Comparative Study on Rapid Urbanization of Typical Countries. Urban Plan. Forum 2013, 3, 43–49. [Google Scholar]
  43. Zhang, J.; Deng, N.; Wei, S.; Chen, J. Comparative Study of Urban Spatial Expansion between Regions with Different EconomicDevelopment Phases: A Case Study of Fuzhou and Taipei. J. Nat. Resour. 2012, 27, 177–186. [Google Scholar]
  44. Tang, L.; Liu, J.; Ma, X. Research on Coordination between Urban Construction Land Consumption Intensity andSocio-Economic Development Level: From the Perspective of Urban Development Stages. Chin. Land Sci. 2017, 31, 73–82. [Google Scholar]
  45. Chen, X.; He, X.; Wang, S. Simulated validation and prediction of land use under multiple scenarios in Daxing District, Beijing, China, Based on GeoSOS-FLUS Model. Sustainability 2022, 14, 11428. [Google Scholar] [CrossRef]
  46. Piao, S.; Fang, J.; Ciais, P.; Peylin, P.; Huang, Y.; Sitch, S.; Wang, T. The carbon balance of terrestrial ecosystems in China. Nature 2009, 458, 1009–1013. [Google Scholar] [CrossRef]
  47. Huang, Y.; Yang, B.; Wang, M.; Liu, B.; Yang, X. Analysis of the future land cover change in Beijing using CA–Markov chain model. Environ. Earth Sci. 2020, 79, 60. [Google Scholar] [CrossRef]
  48. Li, L.; Hu, R.; Li, S. Simulation of Low-Carbon Land Use Scenarios in Beijing Based on the Improved FLUS Model. Remote Sens. Nat. Resour. 2023, 35, 81–89. [Google Scholar]
  49. Liu, Y.; Shi, J.; Zheng, Y.; Hu, X. The Evolution Pattern and Simulation of Land Use in the Beijing Municipal Administrative Center (Tongzhou District). J. Resour. Ecol. 2022, 13, 270–284. [Google Scholar]
  50. Li, Z.; Cheng, X.; Han, H. Future impacts of land use change on ecosystem services under different scenarios in the ecological conservation area, Beijing, China. Forests 2020, 11, 584. [Google Scholar] [CrossRef]
  51. Zhao, L.; Wang, Y.; Dong, F. Optimization of land use structure in Beijing based on MOP model and FLUS model. Int. Conf. Comput. Model. Simul. Data Anal. 2022, 12160, 87–92. [Google Scholar]
  52. Ning, X.; Zhang, X.; Zhang, X.; Wang, H.; Zhang, W. A Method for Assessing Urban Ecological Resilience and Identifying Its Critical Distance Belt Based on the Source-Sink Theory: A Case Study of Beijing. Remote Sens. 2023, 15, 2502. [Google Scholar] [CrossRef]
  53. Meng, F.; Zhou, Z.; Zhang, P. Multi-objective optimization of land use in the Beijing–Tianjin–Hebei region of China based on the GMOP-PLUS coupling model. Sustainability 2023, 15, 3977. [Google Scholar] [CrossRef]
  54. Yang, M.; Zhou, L.; Zhang, C.; Liao, Z. Strategic Thoughts on the Spatial Layout of Beijing in the New Stage. City Plan. Rev. 2017, 41, 23–32. [Google Scholar]
  55. Xu, S.; Yuan, X.; Deng, Y. Structural Patterns and Aggregation Rules of the Spatial Evolution of Urban Functions in Beijing. Acta Geogr. Sin. 2023, 78, 2092–2104. [Google Scholar]
  56. Li, Q. The Housing Price Issue: A Historical Review, Analysis of Causes, and Long-Term Strategies. Shanghai Real Estate 2019, 9, 10–15. [Google Scholar]
  57. Li, W.; Li, H.; Hao, F.; Feng, Z.; Wang, S. A Simulation of the Spatial Expansion Process of Shrinking Cities Based on the Concept of Smart Shrinkage: A Case Study of the City of Baishan. Land 2024, 13, 239. [Google Scholar] [CrossRef]
  58. Dengxing, F.; Xinxiao, Y.; Yongjie, Y.; Lili, N.; Zhiliang, G.; Liya, M. Carbon storage in Beijing’s forests and its dynamics. J. Beijing For. Univ. 2008, 30 (Suppl. 2), 117–120. [Google Scholar]
Figure 1. Location of Beijing.
Land 13 01544 g001
Figure 2. The technology roadmap of this study.
Land 13 01544 g002
Figure 3. The spatial distribution of Beijing’s LULC types in representative years.
Land 13 01544 g003
Figure 4. Spatial changes in carbon storage in Beijing from 1992 to 2022.
Land 13 01544 g004
Figure 5. Prediction of carbon storage in Beijing by 2035 under 4 scenarios (MT).
Land 13 01544 g005
Figure 6. Prediction of the spatial distribution of carbon storage under 4 scenarios.
Land 13 01544 g006
Figure 7. Comparison of carbon storage in 2035 and 2017 under 4 scenarios.
Land 13 01544 g007
Figure 8. Spatial change of carbon storage in Beijing in 2035 under Strict Control Scenario.
Land 13 01544 g008
Figure 9. The contribution of driving factors to the expansion of construction land.
Land 13 01544 g009
Figure 10. (a) Expansion potential of construction land (calculated based on development trends from 2011 to 2017, Uncontrolled Scenario); (b) Expansion potential of construction land (calculated based on development trends from 2017 to 2020, other scenarios).
Land 13 01544 g010
Table 1. Data and data sources.
Data TypeData NameResolution (m)Data Source
Land use dataLULC30China Land Cover Dataset, Wuhan University
Socioeconomic factorsGDP1000Resource and Environment Science and Data Center of Chinese Academy of Sciences
(https://www.resdc.cn/, assessed on 22 April 2024)
Population Density1000
Night Light Data1000
Distance to Railway30OpenStreetMap
(http://www.openstreetmap.org/, assessed on 22 April 2024)
Distance to Highways30
Distance to Primary Way30
Distance to Secondary Way30
Distance to Tertiary Way30
Distance to Transportation Stations30
Natural FactorsDistance to Water30OpenStreetMap
(http://www.openstreetmap.org/, assessed on 22 April 2024)
Soil type1000Resource and Environment Science and Data Center of Chinese Academy of Sciences
(https://www.resdc.cn/, assessed on 22 April 2024)
Digital Elevation Model90Shuttle Radar Topography Mission, SRTM
(https://www.earthdata.nasa.gov/sensors/srtm, assessed on 22 April 2024)
Slope90Generate from DEM data by Arcgis
Slope Orientation90
Mean Annual Precipitation1000Resource and Environment Science and Data Center of Chinese Academy of Sciences
(https://www.resdc.cn/, assessed on 22 April 2024)
Annual Mean Temperature1000
Normalize Difference Vegetation Index1000
Table 2. Probability adjustment of LULC conversion based on RCL policies.
LULC TypesCroplandForestShrubGrassland
NESSCSRWESNESSCSRWESNESSCSRWESNESSCSRWES
Cropland0.9680.9680.9680.0120.0120.1240000.0010.0010.001
Forest0.0080.0080.0080.9900.9910.9910.0010.0010.001000
Shrub0000.2090.2090.2090.7520.7520.7520.0380.0380.038
Grassland0.0640.0640.0640.0970.0970.0970.0090.0090.0090.8260.8260.826
Water0.0340.0340.0360.0010.0010.001000000
Unused Land0.1150.1150.1150000000.0610.0610.061
Construction Land00000.0070.007000000
LULC TypesWaterUnused LandConstruction Land
NESSCSRWESNESSCSRWESNESSCSRWES
Cropland0.0050.0050.0070000.0130.0130.013
Forest000000000
Shrub000000000
Grassland0.0010.0010.0010000.0020.0020.002
Water0.9640.9660.9660000.00200
Unused Land0.0040.0040.0040.7860.7860.7860.0330.0330.033
Construction Land0.0020.0040.0040000.9890.9890.989
Table 3. Neighborhood factor parameters.
CroplandForestShrubGrasslandWaterUnused
Land
Construction
Land
UCS0.3260.6100.1160.0800.1750.0011
NES0.94110.1130.0600.2690.0010.563
SCS0.76510.0920.0490.2850.0010.443
RWES0.16510.0200.0110.0730.0010.096
Table 4. Carbon density of different LULC types in Beijing (g·m−2).
CroplandForestShrubGrasslandWaterUnused LandConstruction Land
Aboveground Biomass Carbon4533580290110611050
Belowground Biomass Carbon91907199261020
Soil Carbon700015,14094006290171622633217
Dead Organic Matter Carbon45300247124015
C: cropland; F: forest; S: shrub; G: grassland; W: water; U: unused land; CL: construction land.
Table 5. Temporal evolution of different LU types in Beijing from 1992 to 2022 (km2).
1992199720022007201220172022
Cropland6095.995699.275452.834964.314554.064241.974164.67
Forest7586.297739.157744.597793.447880.447952.407989.78
Shrub42.0227.9261.4934.5046.4371.2055.97
Grassland621.84558.81521.54546.28503.58407.88353.39
Water231.05247.92179.54149.93160.63204.46241.02
Unused Land1.561.120.870.700.940.621.36
Construction Land1831.782136.342449.672921.373264.463532.003604.34
(a) Changes in the Area of Different Land Use Types from 1992 to 2022
1992–19971997–20022002–20072007–20122012–20172017–20221992–2022
AC
(km2)
DD
(%)
AC
(km2)
DD
(%)
AC
(km2)
DD
(%)
AC
(km2)
DD
(%)
AC
(km2)
DD
(%)
AC
(km2)
DD
(%)
AC
(km2)
DD
(%)
Cropland−396.72−1.39−246.44−0.90−488.52−1.97−410.25−1.80−312.08−1.47−77.31−0.37−2099.14−1.58
Forest152.860.405.440.0148.850.1387.000.2271.960.1837.380.09601.620.24
Shrub−14.10−10.1033.5810.92−26.99−15.6411.925.1424.776.96−15.23−5.44−12.75−0.71
Grassland−63.03−2.26−37.27−1.4324.740.91−42.70−1.70−95.70−4.69−54.49−3.08−368.10−3.26
Water16.861.36−68.38−7.62−29.61−3.9510.711.3343.834.2936.563.0331.470.41
Unused Land−0.44−7.83−0.25−5.74−0.17−4.780.245.02−0.32−10.170.7310.81−0.51−1.18
Construction Land304.572.85313.332.56471.703.23343.092.10267.541.5172.340.401847.421.60
AC: Area Change; DD: Dynamic Degree.
(b) Changes and Dynamics of Different Land Use Types during Different Periods, from 1992 to 2022
Table 6. LULC transition matrix in Beijing from 1992 to 2022 (km2).
CroplandForestShrubGrasslandWaterUnused LandConstruction LandTotal 1992
Cropland3964.97310.190.1347.6538.610.131734.316095.99
Forest127.167367.7038.8825.313.250.0023.997586.29
Shrub0.0420.476.8414.660.000.000.0142.02
Grassland43.69287.3410.12265.420.450.1414.69621.84
Water24.493.860.000.31182.360.9019.13231.05
Unused Land0.160.000.000.030.010.171.181.56
Contruction Land4.150.220.000.0116.330.021811.041831.78
Total 20224164.677989.7855.97353.39241.021.363604.3516,410.54
Table 7. The changes in LULC in Beijing in 2035 compared to 2017 under four scenarios.
UCSNESSCSRWES
AC
(km2)
DD
(%)
AC
(km2)
DD
(%)
AC
(km2)
DD
(%)
AC
(km2)
DD
(%)
Cropland−942.8−1.48%−229.8−0.36%−218.37−0.34%−831.25−1.31%
Forest180.650.15%80.130.07%211.430.18%999.730.84%
Shrub16.271.52%−8.56−0.80%−23.21−2.17%−20.01−1.87%
Grassland−112.18−1.84%−99.12−1.62%−175.52−2.87%−259.18−4.24%
Water45.231.48%22.740.74%71.752.35%30.731.00%
Unused Land−0.37−3.98%−0.35−3.76%−0.25−2.69%−0.17−1.83%
Construction Land813.191.53%234.930.44%134.110.25%80.140.15%
Table 8. Beijing LULC Transfer Matrix 2035 under four scenarios.
CroplandForestShrubGrassland
UCSNESSCSRWESUCSNESSCSRWESUCSNESSCSRWESUCSNESSCSRWES
Cropland3290.293913.503911.893312.2982.9365.85105.90810.280.890.010.000.009.893.3413.391.97
Forest0.0065.3461.8854.397950.177875.777880.237887.600.007.626.576.830.000.010.060.00
Shrub0.000.000.000.000.0020.3931.1728.8771.1848.0438.2741.100.052.791.781.25
Grassland6.6625.7541.9835.3797.7368.14144.16222.3613.437.003.183.28287.27300.30216.61145.01
Water0.816.496.747.570.000.160.170.750.000.000.000.000.020.000.000.00
Unused Land0.010.070.090.090.000.000.010.040.000.000.000.000.020.020.100.04
Construction Land0.390.000.000.000.000.000.000.000.000.000.000.000.011.870.000.00
Total 20353298.164011.164022.593409.718130.828030.308161.658949.9087.5062.6748.0251.22295.27308.33231.93148.27
WaterUnused LandConstruction LandTotal 2017
UCSNESSCSRWESUCSNESSCSRWESUCSNESSCSRWESUCSNESSCSRWES
Cropland45.6723.4373.3533.750.000.000.000.00811.29234.83136.4282.664240.964240.964240.964240.96
Forest0.000.000.070.010.000.000.000.000.001.431.351.337950.177950.177950.177950.17
Shrub0.000.000.000.000.000.000.000.000.000.000.000.0071.2371.2371.2371.23
Grassland1.420.420.490.430.000.030.030.050.935.811.000.95407.45407.45407.45407.45
Water201.89194.86196.45195.140.000.000.000.001.212.420.580.49203.95203.95203.95203.95
Unused Land0.000.000.000.000.250.240.340.410.340.000.090.040.620.620.620.62
Construction Land0.197.975.345.340.000.000.000.003535.583526.333530.833530.833536.173536.173536.173536.17
Total 2035249.18226.69275.70234.680.250.270.370.454349.363771.103670.283616.3116,410.5416,410.5416,410.5416,410.54
Disclaimer/Publisher’s Note: The statements, opinions and data contained in all publications are solely those of the individual author(s) and contributor(s) and not of MDPI and/or the editor(s). MDPI and/or the editor(s) disclaim responsibility for any injury to people or property resulting from any ideas, methods, instructions or products referred to in the content.

