Abstract
The contradiction between economic development and ecological protection has become a common challenge for territorial governance in developing countries around the world. However, extant studies have neglected the coupling and symbiotic relationship between humans and nature, resulting in significant functional conflicts, insufficient stability, and imbalances in ecological and economic benefits in the reconstruction of territorial spatial functional pattern (TSFP), making it difficult to achieve synergies between development and protection. The question that arises is how the TSFP can be reconstructed in order to achieve harmonious coexistence between humans and nature. This remains a challenging problem in the context of the synergizing development and protection of the TSFP. This study innovatively integrates set-theoretic principles and functional mappings with game-theoretic analysis to develop Territorial Spatial Functional Pattern Reconstruction (TSFPR) model designed to foster harmonious human–nature coexistence, and validates the model using geospatial data from Qionglai City, China. Empirical evidence demonstrates that, in comparison with conventional methods, TSFPR model significantly mitigates the territorial spatial functional conflicts (TSFCs), enhances stability and ecological and economic benefits, and achieves the expected harmonious coexistence between humans and nature. The analysis confirms that the territorial spatial functional conflict (TSFC) coordination index established in this study provides a reliable criterion for identifying superior territorial spatial functions (TSFs). The proposed TSFPR model is an expansion of the theory of spatial optimization modelling, and it provides a tool for reconstructing the TSFP for the harmonious coexistence between humans and nature. In summary, the utilization of the TSFPR model to reconstruct the TSFP for harmonious coexistence between humans and nature provides a novel solution for coordinating the development and protection of territorial space governance.
1. Introduction
The territorial space is the spatial carrier of the modernization goal of harmonious coexistence between humans and nature, and its functional pattern is the spatial expression of the territorial development and protection strategy [1]. The formation of the territorial spatial functional pattern (TSFP) is driven by the supply and demand relationship between the supply of territorial spatial function (TSF) and human functional needs, and is also constrained by objective conditions such as economic level and resource and environmental carrying capacity [2]. In particular, it is constrained by regional natural resource endowments, and areas suitable for industrialization and urbanization often overlap with areas suitable for agricultural production and areas requiring ecological protection (e.g., the southeast side of China’s “Hu Huanyong Line” [3]). If the development and protection patterns of such spaces are not properly constructed, it is easy to trigger the territorial spatial functional conflict (TSFC), exacerbate human–land conflicts, and hinder the realization of the goal of coordinated development and protection of TSFP [4]. However, in the past, the construction of TSFP has focused excessively on industrial and agricultural production, urban construction, and the allocation of living space, resulting in the large-scale encroachment of ecological spaces such as forests and wetlands, leading to a sharp decline in biodiversity [5,6] and the degradation of ecosystem services [7,8], and even triggering environmental crises such as global climate change [9]. These realities warn us that the use of TSF must maintain a harmonious coexistence between humans and nature, otherwise we will face negative feedback from ecosystems [10,11]. In particularly, global climate change has attracted high attention from the international community [12,13,14], and the United Nations Paris Agreement clearly states that anthropogenic greenhouse gas emissions and removals must be balanced in the second half of this century to address climate impacts [15]. Therefore, coordinating territorial spatial functional conflicts (TSFCs) and reconstructing a TSFP that enables harmonious coexistence between humans and nature is of considerable practical significance for developing governance pathways that mitigate tensions between ecological protection and economic development.
TSFP reconstruction is a central approach to reconciling ecological protection with economic development [16,17]. Scholars have conducted extensive research on TSFP reconstruction and the optimisation of land-use functions, producing significant advances [17,18,19]. First, methods for coordinating functional conflicts and restructuring spatial patterns have become increasingly sophisticated. Early work focused on identifying territorial spatial functions (TFSs) using “dual evaluation” approaches (for example, comparative advantage indices and ecological vulnerability indices) [20,21,22,23]. The field has since progressed towards quantifying multifunctional trade-offs and conflict intensity by integrating mechanical equilibrium models and coupling–coordination models [24,25,26,27]. Pattern resilience has been enhanced by applying spatially explicit conflict diagnostics and by introducing ecological security baseline constraints. Second, research that addresses economic growth together with carbon reduction has moved beyond single-objective analyses. Studies increasingly incorporate carbon emission constraints and the coupling of energy, industrial and land systems into spatial optimisation goals. Multi-objective planning and scenario simulation methods are used to explore the linkage mechanisms between emission reductions and stable growth. Researchers also increasingly introduce indicators such as ecosystem service values and carbon sequestration potential to optimise functional layouts [16,28,29,30]. Third, understanding of the human–land relationship has shifted towards the objective of harmonious coexistence between humans and nature, emphasising TSFP reconstruction that couples socio-economic systems with ecosystems [31,32]. Nevertheless, existing studies still have notable shortcomings. First, many neglect the spatiotemporal heterogeneity of TSFC, which complicates efforts to ensure the stability of restructured patterns [33]. Second, studies that explicitly integrate ecological and economic benefit indicators into reconstruction methods or models to build territorial spatial functional patterns (TSFPs) coordinating ecological protection and economic development remain relatively scarce [34]. Third, the research perspective is often dominated by human needs and does not truly place nature and humans on an equal footing in decision-making. This oversight neglects the coupled, symbiotic relationship between humans and the TSF system [35]. Given that humanity has not discovered an alternative habitable planet, the TSF system and humans constitute a community of life that together form the human–land system [36,37]. Yet TSFP reconstruction studies grounded in the cognition of human–land system coupling remain rare. Therefore, from the perspective of human–land system coupling, constructing models that account for functional conflict coordination, ecological and economic benefits, and functional pattern stability—and thereby reconstructing a TSFP that supports harmonious coexistence between humans and nature—has become a key challenge for achieving coordinated development and protection through TSFP reconstruction.
To address the above issues, this study first constructs a TSFC coordination Game model, combines the Nash equilibrium strategy of the game model with the suitability of TSFs, and establishes a TSFC coordination index. Then, it constructs a function for identifying advantageous TSFs, defines the set of elements with advantageous TSFs as the reconstructed TSFP, and establishes a model for the reconstruction of the TSFP. Finally, using Qionglai City in China as an empirical area, we constructed the TSFP of the empirical area using the TFSPR model informed by geospatial data and compared and verified it with the TSFP constructed based on functional suitability from three aspects: TSFC control, TSFP stability maintenance, and functional utilization ecological and economic efficiency improvement, in order to evaluate the effectiveness of the model in realizing the path of territorial governance that coordinates development and protection.
After the introduction, the remainder of the manuscript is organised as follows. Section 2 provides a systematic review of research progress on the reconstruction of TSFPs and analyses the principal unresolved issues. Section 3 describes the development of the reconstruction model, and the system for evaluating model performance. Section 4 describes the specific implementation process of the model in the empirical region. Section 5 presents the model’s reconstruction results for the empirical area and compares these results with those obtained using common practical methods. Section 6 discusses the study’s contributions, and policy implications. Finally, Section 7 summarises the main findings and discusses their theoretical and practical significance.
2. Literature Review
2.1. TSFC Coordination: Methodological Evolution from Static Identification to Dynamic Response
The coordination methods for TSFC have continuously evolved from static identification to dynamic modeling. In the early stage, static function identification methods (e.g., comparative advantage index, ecological vulnerability index) based on “dual evaluation” (evaluation of resource and environmental carrying capacity and development suitability) were mainly used to define the dominant TSFs of spatial units [20,21,22,23]. As research deepened, conflict intensity quantification tools such as mechanical balance models and coupling coordination degree models were gradually applied to complex spatial function coordination [24,25,26,27]. These methods have been applied in the reconstruction of TSFPs in Chinese regions, such as ecological restoration in the southwest karst area [38], spatial pattern optimization in Jilin Province [32], and functional zoning in the Yangtze River Economic Belt [25]. However, since the above methods mostly rely on static suitability or subjective experience, they generally ignore the spatiotemporal heterogeneity of TSFCs, fail to fully consider the dynamic changes in conflict characteristics caused by the evolution of different functions over time, and are difficult to address the dynamic evolution of the dominant TFSs of spatial units over time. This leads to insufficient long-term stability of the optimization results of TSFPs on the time scale [28,39]. Meanwhile, it is also difficult to capture the subtle differences within the region, affecting the local stability of the functional pattern [40,41]. In recent years, game theory, with its theoretical superiority in coordinating multi-agent interest conflicts and dynamic strategy selection ability, has been widely applied in land use and spatial optimization research [42,43]. Its characteristic of considering both the goal conflicts and cooperation opportunities of users may make up for the spatiotemporal limitations of commonly used practical methods [44]. If the functional suitability and dynamic evolution characteristics can be integrated to construct a “conflict coordination index” incorporating game theory, it is expected to break through the spatio-temporal limitations of commonly used practical methods and provide new theoretical and methodological support for constructing a robust TSFP.
2.2. Coordinated Achievement of Economic Development and Ecological Protection: From Conceptual Advocacy to Indicator Integration in Practice
The objectives of TSFP reconstruction have shifted in phases from a single economic orientation to multi-objective coordination. In the early stages, priorities were dominated by economic demands such as industrial and agricultural production [45,46]. As ecological and environmental problems became more prominent, objectives shifted towards the preservation of ecological spaces such as forests and wetlands [47,48]. More recently, with the deepening of the concept of harmony between humans and nature, reconstruction objectives have increasingly emphasised the coordination of economic development and ecological protection. Researchers have sought to alleviate conflicts between development and conservation by applying multi-objective planning, scenario simulation and related methods [24,25]. Although some studies have incorporated ecological benefits (for example, carbon reduction and biodiversity) and economic benefits (for example, GDP and land output) into reconstruction models [49,50], systematic methods for organically integrating these two types of indicators into the reconstruction process remain relatively scarce. Some research uses quantitative optimisation models (such as fuzzy linear programming) to allocate areas for TSFs [16]. These models are frequently combined with function-use suitability derived from the traditional “dual evaluation” and with spatial simulation tools such as PLUS to implement TSFP reconstruction [51]. While such frameworks have in some cases improved both economic and ecological outcomes, the spatial-allocation step often continues to rely on static suitability criteria derived from the traditional dual evaluation [52]. This reliance ignores the spatiotemporal heterogeneity of functional conflicts and thus produces shortcomings in the stability and effectiveness of optimised functional patterns. Consequently, such patterns may be ill equipped to cope with the complex, coupled dynamics of human–land systems [33,53]. With the expanding application of game theory in land-use optimization [54,55], embedding ecological and economic benefit indicators within game-model utility functions and balancing the interest demands of different actors offers a promising approach. This approach may help to reconcile ecological and economic objectives and to enhance the stability of reconstructed functional patterns.
2.3. Understanding Human–Land Relationships in TSF Utilisation: From Human Dominance to Harmonious Coexistence
For a long time, TSFP construction has been centred on human demands, often treating natural systems as passive objects to be protected or managed [56]. This reflects a logic of avoiding direct harm to humans by controlling ecosystems [24,45]. Such an approach, which focuses solely on ecosystem service capacity and does not treat nature as an equal decision-making subject, overlooks the fundamental character of the human–land system as a life community and generates adverse consequences [4,57]. For example, in pursuit of short-term economic gains, some regions have developed ecologically sensitive areas into tourist zones while prioritising ecological protection in less sensitive areas. This paradox has often resulted in environmental governance costs that substantially exceed short-term economic benefits, and this outcome has been documented in multiple studies and planning practices [58,59,60]. Game theory, which assumes that decision-makers are fully rational and pursue goal maximization [61], provides a theoretical basis for modelling humans and nature as equal participants in spatial decision-making. In territorial spatial development and utilisation, nature can be represented as “participating” in decisions through ecological feedback mechanisms, such as changes in carbon sinks and biodiversity responses, thereby forming a dynamic, interactive system with human actors [62,63]. This two-way decision-making model can abstract nature’s feedback as game strategies and thus offers a logical framework for balancing human development demands and the constraints imposed by natural systems [64]. Adopting such a framework removes the single-actor presumption that typically underpins mathematical programming models (which generally model humans alone). If nature and human decision-making agents are equally included in game models and reconstruction proceeds from a human-dominated perspective to one of harmonious coexistence grounded in human–land coupling, this would overcome a key limitation of traditional models, which can only handle a single decision-making agent (e.g., humans) [36,65]. It could also provide new theoretical and methodological support for reconciling development and conservation and for improving the stability of functional patterns.
2.4. Explicit Expression of TSFP Reconstruction Models: From Conceptual Frameworks to Deeper Mathematical Abstraction
Currently, methods for reconstructing TSFP that aim to coordinate economic development with ecological protection are mostly presented as conceptual frameworks [22,66], and rigorous, highly abstract mathematical models remain relatively scarce. For example, Zou et al. [67] proposed a TSF trade-off framework based on carbon emissions. By compiling an inventory of land use and human activity carbon emissions, they analysed the relationship between the evolution of TSFs and carbon emissions, thereby providing theoretical and technical support for achieving dual carbon goals. From the perspective of spatial composition, the distribution of TSFs can be treated as a non-overlapping set of spatial units with clearly defined TSF in a given region [68,69]. For instance, Qu et al. [70] used a multi-functional suitability assessment to partition the Yellow River Delta into dominant functional units (ecological protection, agricultural production and urban construction), thereby demonstrating the clarity of dominant functions and spatial heterogeneity. This whole–part spatial relationship lends itself to abstraction by set theory [71]: the TSFP of a region may be regarded as a universal set, the identified spatial units of TSF as elements of that set, and TSF categories as subsets corresponding to different functions. Determining the TSF of a spatial unit is fundamentally a mapping from spatial attributes to functional types [69]. Existing studies commonly map spatial unit attributes (for example, suitability, dynamics, ecological benefits or economic benefits) to dominant function types using rule-based criteria such as suitability thresholds or conflict coordination levels [32,38]. This approach corresponds to an independent to dependent variable mapping in function theory: spatial attributes (for example, a conflict coordination index) serve as independent variables and TSF types as dependent variables. Once a mapping relationship is established, TSF identification can be expressed quantitatively. Nevertheless, most current research continues to present TSFP reconstruction as conceptual framework models [72,73]. Such presentations tend to be verbose, to lack theoretical rigour and to have limited generalisability. If set theory (to describe whole–part relationships) and function theory (to formalise attribute to function mapping rules) are integrated, these conceptual frameworks could be abstracted into concise mathematical expressions. This formalisation would improve model portability and provide deeper theoretical tools to support TSFP reconstruction.
In summary, existing research has provided an important theoretical foundation and methodological support for this study, but three principal shortcomings remain. (1) Although some scholars have examined the impact of functional conflicts on the optimisation of development and protection patterns and have attempted to reconstruct functional patterns by coordinating those conflicts [71,74], the spatiotemporal heterogeneity of TSFCs has been largely overlooked. This omission has led to insufficient stability in reconstructed patterns. (2) Research on the synergy between ecological protection and economic development often remains at the conceptual level [24]. Systematic exploration of how to incorporate ecological and economic benefit indicators into reconstruction methods or models is still limited. (3) TSFP reconstruction continues to focus primarily on human needs and does not treat nature and humans as equal decision-making entities [56]. This anthropocentric orientation neglects the coupling and symbiotic relationship between the territorial spatial functional system and human society. Therefore, to develop a model that accounts for functional conflict coordination, ecological and economic benefits, and functional pattern stability—and to reconstruct a TSFP that promotes harmonious coexistence between humans and nature—two key technical problems must be addressed: (a) How can the coupling cognition of the human–land system and game theory be used to integrate territorial spatial functional suitability, functional dynamics, and the ecological and economic benefits of functional utilisation to construct a TSFC coordination index? (b) How can function theory be used to construct the spatial-unit TSF identification mapping and its corresponding rules, taking the TSFC coordination index as the independent variable and the TSF type as the dependent variable?
3. Methods
3.1. Research Methodology Framework
Currently, territorial spatial planning generally constructs TSFPs based on the suitability of TSFs (referred to as the commonly used practical method in this study). However, when there are two or more highly suitable TSFs in the same spatial unit, decision-makers often determine the dominant TSF from the perspective of meeting human needs. This easily leads to problems such as prominent spatial conflicts, weak pattern stability, and imbalanced ecological and economic benefits in the reconstructed TSFPs, making it difficult to support the reconstruction of TSFPs that integrate economic growth and ecological protection. The root cause is that the commonly used practical method does not place the natural system and humans as equal decision-making subjects, violating the core concept of “harmonious coexistence between humans and nature” in the theory of human–land system coupling. This makes it difficult for the TSFP to balance ecological protection and economic development, with prominent spatial conflicts and unsustainability. In essence, the conflict of TSFs is an external manifestation of the interaction between humans and nature. To achieve balanced development between the two, a scientific balance of their relationship is required. Game theory can effectively depict the interaction of decision-making subjects and solve for the optimal equilibrium by quantifying the benefits and costs of strategy selection, providing a tool for dealing with such human–land relationship issues.
Based on the above theoretical understanding, this study integrates game theory, set theory, and function theory to propose a research framework for constructing TSFPs that balance functional conflict coordination, ecological and economic benefits, and pattern stability (Figure 1). The framework consists of three core modules:
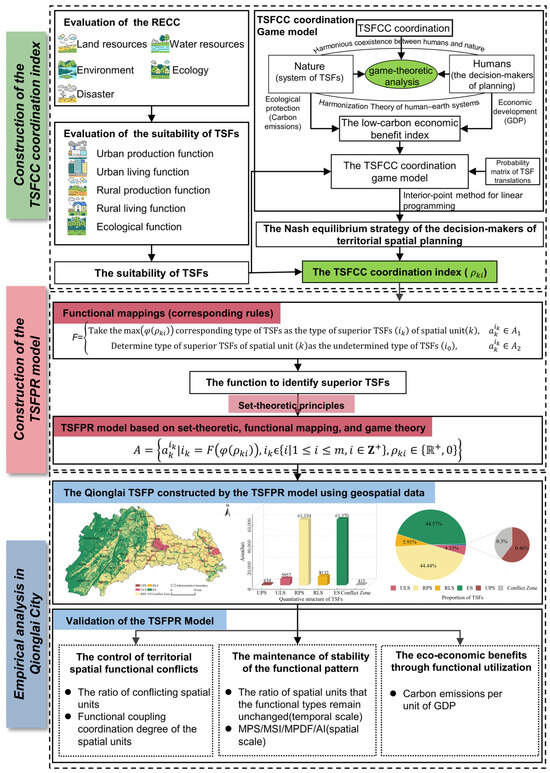
Figure 1.
The research framework of TSFPR employs a model that integrates set-theoretic principles and functional mappings with game-theoretic analysis.
(1) Module for constructing the coordination index of TSFC. Based on the theory of human–land system coupling, the coordination of TSFC is interpreted as a zero-sum game process between humans and nature. A two-player zero-sum game model is constructed by integrating the suitability, dynamics, and ecological and economic benefits of TSFs. The Nash equilibrium strategy of territorial spatial planning decision-makers obtained from this model is used as a correction parameter for the suitability of TSFs, and a new coordination index of TSFC is established.
(2) Module for constructing the reconstruction model of TSFPs. Relying on function theory, the identification of dominant TSFs is transformed into a functional relationship between the coordination index of TSFC and the types of TSF. A functional correspondence rule is established, and a function for identifying the dominant TSF of spatial units is constructed. On this basis, based on set theory, spatial units are abstracted as elements of a set. Using the function for identifying the dominant TSF as the element characteristic description function, the set of elements with the characteristics of dominant TSF is defined as the reconstructed TSFP, and a new TSFPR model is established.
(3) Module for verifying the reconstruction effect of TSFPs. An evaluation system is designed from three dimensions: spatial function conflict control, pattern stability, and overall improvement of ecological and economic benefits. Taking Qionglai City as an empirical area, the TSFP constructed by the commonly used practical method and the TSFPR model are evaluated and compared to verify the effectiveness and advantages of the TSFPR model in constructing TSFP that coordinates economic development and ecological protection.
3.2. TSFPR Model Based on Set-Theoretic, Functional Mapping, and Game Theory
The main steps for constructing a model of TSFPs that considers the coordination of functional conflicts, ecological and economic benefits, and the stability of functional patterns by integrating applied game theory, set theory, and function theory are: First, based on game theory, the coordination of TSFCs is abstracted into a zero-sum game process between territorial spatial planning decision-makers (humans) and TSF system (nature). The utility function of game participants is established by comprehensively considering the suitability of TSFs, functional dynamics (represented by a transition probability matrix predicted using differential formulas), and the ecological and economic benefits of functional utilization (quantified by low-carbon economic benefit indicators). a two-player zero-sum game model is constructed, and the Nash equilibrium strategy of the territorial spatial planning decision-makers obtained from this model is used as the correction parameter for the suitability of TSFs to establish a new TSFC coordination index. Then, based on functional mapping theory, the identification of superior TSFs is abstracted as a functional relationship between the TSFC coordination index (independent variable) and the types of superior TSFs (dependent variable). establish a correspondence rule between the independent variable and the dependent variable, construct a function for identifying superior TSFs in spatial units; finally, treat spatial units as set elements, use the function for identifying superior TSFs as the element feature description function, define the set of elements with superior TSF features as the reconstructed TSFP, and establish a new TSFPR model, whose mathematical expression is:
where is a set of spatial units that have certain features, representing the TSFP. is an element of set , and denotes the th spatial unit of the superior TSF , which is the function dependent variable. is the function independent variable denoting the th-type TSFC coordination index of the th spatial unit, and represent the corresponding rule of the inner and outer functions of the composite function, respectively, and and denote the serial number and the number of spatial units, respectively, . and denote the serial number and the number of types of TSFs, respectively.
3.2.1. Construction of the TSFC Coordination Index Based on Game Theory
This study assumes the following: (1) The TSFs are regarded as natural, and their functions are valuable to both humans and nature. (2) Humans and the TSFs constitute an interdependent human–land coupling system, that is, if humans configure the functional system (such as planning a certain spatial unit as an urban production functional area), the functional system will lose its right to natural evolution in that space due to human interference, or a new functional order may need to be formed to maintain balance. Otherwise, it may lead to spatial structural imbalances. (3) TSFCs are the external manifestation of the interactive relationship between humans and nature. (4) If no intervention is made in TSFCs, the functional system may achieve coordination through long-term self-repair, but this is time-consuming and risky. Therefore, humans need to coordinate conflicts and reconstruct the functional pattern through short-term intervention to resolve the contradiction between economic development and ecological protection and achieve harmonious coexistence between humans and nature. To this end, coordinating TSFCs should be regarded as spatial intervention by humans (territorial spatial planning decision-makers) in nature (TSF system) to achieve balanced development between humans and nature.
Based on the above assumptions, this study abstracts the interactive relationship between humans and nature as a zero-sum game between national land use planners and the TSF system. The Nash equilibrium of the game is manifested as the probability that both sides will treat each TSF as the superior function of that spatial unit (i.e., the probability that each TSF will become a superior TSF under the expected benefit conditions), which is the optimal decision state that neither side is willing to break. According to game theory, this Nash equilibrium includes the Nash equilibrium strategy () of territorial spatial planning decision-makers and the Nash equilibrium strategy () of the TSF system. Among them, represents the optimal strategy adopted by humans to resolve functional conflicts and reconstruct the TSFP in which humans and nature coexist in harmony, that is, the set of optimal choice probabilities for each TSF; reflects the optimal strategy for the TSF system to achieve conflict coordination through natural restoration under the optimal strategy of planning decision makers, embodying the feedback mechanism of the natural system. Considering the complexity of the TSF system, reconstructing the functional pattern based solely on the Nash equilibrium strategy may be unrealistic. Therefore, this study integrates the Nash equilibrium strategy with the suitability of the current TSFs to construct a TSFC coordination index as a criterion for identifying superior TSFs. Since the goal of reconstructing the TSFP is consistent with the strategic intentions of planning decision-makers, it is appropriate to participate in the construction of the TSFC coordination index, which is calculated as follows:
where and denote the TSFC coordination index and the suitability of the th type of TSF of the th spatial unit, respectively. denotes the optimal selection probability of the th type of TSF of the th spatial unit by the decision-makers of territorial spatial planning, and . Among them, the suitability of TSFs () is evaluated based on spatial units and resource and environmental carrying capacity, using a comprehensive evaluation method (the steps are as follows: first, establish an evaluation index system; second, determine the weight of the evaluation indicators; third, calculate the comprehensive index of the evaluation object (such as the suitability of TSFs and resource and environmental carrying capacity); finally, classify the evaluation grades according to the comprehensive index). The probability of the optimal choice of TSFs () is the Nash equilibrium strategy of territorial spatial planning decision-makers, which is determined by constructing a zero-sum game model between planning decision-makers and the TSF system and applying linear programming to solve it.
- (1)
- TSFC coordination Game model
The TSFC coordination game model is a zero-sum model between the decision-makers of territorial spatial planning and the system of TSFs, and the strategic formulation of TSFC coordination game model can be represented as:
where denotes the zero-sum game model between the decision-makers of territorial spatial planning and the system of TSFs. denotes a game player. We define the game player as , where denotes the decision-makers of territorial spatial planning and denotes the system of TSFs. The decision-making agents are players in the game, and they all aim to maximize their utility levels by choosing the strategies. The coordination of TSFCs is a zero-sum game between and , with only two decision-makers, each of which has a limited number of strategies to choose from. The interests of both players are in opposition, i.e., one player gains what the other player loses. denotes the set of player strategies. Because is a static game of complete information, strategy in it is equivalent to action. The available strategy for both the decision-makers of territorial spatial planning and the systems of TSFs is a specific type of TSF. Therefore, we define the strategic set of game players as , where denotes the th strategy of the th player and denotes the set of strategies of the th player. If each player chooses a strategy, the vector represents a combination of strategies. denotes the player’s utility function, which is the determined utility level of the player received under a particular combination of strategies. Where denotes the specific strategy available to the player. The utility level of decision-makers of territorial spatial planning not only depends on their own selection strategies for various types of TSFs, but also on the response of the system of TSFs to strategic choices of the decision-makers of territorial spatial planning. Therefore, we define the utility function of the game player as .
- (2)
- A solution method for coordinating functional conflicts in TSFs
The zero-sum game model is defined as a static game with complete information, and its solution is the Nash equilibrium of the optimal strategy combination of the participants. In this study, the coordination of TSFs is shown to be a zero-sum game between planning decision-makers and functional systems. That is to say, the benefits accrued by the former in terms of the allocation of functional types are equal to the payments made by the latter in adjustments. We assume that and denote the payoff matrices of the decision-maker for territorial spatial planning and the system of TSFs, respectively. From game theory, . We set and . If , the strategic combination () is the pure strategy Nash equilibrium of model , where is the optimal pure strategy of the decision-maker for territorial spatial planning and is that of the system of TSFs. However, due to the complexity of the system of TSFs, its pure strategy Nash equilibrium rarely occurs in practice, and the mixed strategy Nash equilibrium is commonly encountered. Linear programming is an effective method to solve mixed strategy Nash equilibrium of a zero-sum game [75]. To describe the process of applying it to solve the mixed-strategy Nash equilibrium, we assume that and denote the probabilities of players and choosing and , respectively, i.e., a mixed strategy. and denote the expected payoff and payment of the game players and , respectively. When the decision-makers of territorial spatial planning try to choose a certain mixed strategy in a zero-sum game, the system of TSFs will correspondingly choose a mixed strategy that minimizes its payoff. The goal of the decision-makers of territorial spatial planning is thus to seek a mixed strategy so that they can ensure their maximum payoff, regardless of the strategy chosen by the system of TSFs, under the condition of minimum payment strategy of the system of TSFs, i.e., . Similarly, when the system of TSFs tries to choose a certain mixed strategy, the decision-maker for territorial spatial planning will correspondingly choose a mixed strategy that maximizes its payoff. The goal of the system of TSFs is thus to seek a mixed strategy so that they can ensure their minimize payment, regardless of the strategy adopted by the decision-maker for territorial spatial planning, under the condition of maximum payoff strategy of the decision-maker for territorial spatial planning, i.e., . It is then clear that the sufficient and necessary condition for achieving equilibrium is that the intentions of both players are realized, i.e., and are established simultaneously. This strategy, which simultaneously realizes the intentions of both players in the game, is a mixed-strategy Nash equilibrium. It is not difficult to prove that there must exist a saddle point in the mixed strategy of any zero-sum game that renders [76].
We set as a unit row vector with only its th component being 1, and the remaining components being 0. Let ; then, . ; since , reaches its minimum value at , and then . Therefore, should be the solution to the linear programming (4):
Since , the linear programming (4) can be represented as:
Similarly, we set as a unit column vector with only its th component being 1, and the remaining components being 0. Let ; then, . . Since , reaches its maximum value at . Then, . Therefore, should be the solution to the linear programming (6):
Since , the above linear programming (6) can be represented as:
By solving the linear programming (5) and (7), we can obtain the mixed-strategy Nash equilibrium solution to model G as well as the payoff (payment) . Assuming that denotes the vector of probability of the best choice of each TSF for the th spatial unit by the decision-maker for territorial spatial planning, the Nash equilibrium strategy of the decision-maker for territorial spatial planning can be expressed as: .
3.2.2. Construction of Corresponding Rules of Identification Function of Superior TSFs of Spatial Units
The function used to identify the superior TSFs of spatial units, which was established by using the TSFC coordination index as the independent variable and the type of superior TSFs as the dependent variable, is a composite function, where the inner function corresponding rule () can be combined with the research in practice to select an appropriate method to hierarchically classify random variables (e.g., the natural breakpoint method of classification (Jenks), standard deviation, and quantile method). The outer function corresponding rule () is defined as:
where , , and have the same meanings as in Formula (1). means that the type of superior TSFs of spatial units () is undetermined, and denote the non-conflicts zone and the conflicts zone of TSFs, respectively, and their set constitutes the TSFP (). We take the TSFC coordination index as the independent variable, and determine the functional expressions of and according to a certain rule :
where denotes the corresponding rule that distinguishes the conflicts and non-conflicts zones of the TSFs through the independent variable . We define it as:
3.3. Evaluation of the Reconstruction Effect of TSFPs
To evaluate the effect of the reconstructed TSFP in coordinating functional conflicts, maintaining pattern stability, and enhancing the ecological and economic benefits of functional utilization, this study selected eight specific evaluation indicators from three dimensions: the coordination degree of TSFCs, the stability of functional patterns, and the ecological and economic benefits of functional utilization, and constructed an evaluation index system.
3.3.1. Comparison and Validation of Coordination Degree of TSFCs
In this study, if the spatial unit with the highest suitability rating corresponds to two or more types of TSFs, it is determined that there is a functional conflict between the spatial units. Therefore, two indicators, the proportion of conflicting spatial units and the degree of functional coupling and coordination of spatial units, are selected to evaluate the coordination of TSFCs. The formula for calculating the proportion of conflicting spatial units is as follows:
where is the ratio of conflicting spatial units, indicating the ratio of the number of spatial units with functional conflicts in the constructed TSFP (%), denotes the number of spatial units with functional conflicts in the constructed TSFP, and denotes the total number of spatial units in the constructed TSFP.
The functional coupling coordination degree of the spatial units was obtained by synthesizing the suitability of each TSF or the TSFC coordination index of the spatial unit. A small value indicated that the comparative advantage of the superior TSFs of spatial unit was more prominent, and the effect of coordination of conflicts was better. The functional coupling coordination degree of an arbitrary spatial unit is calculated by the formula:
where denotes the coupling degree, with a range of values of [0, 1], denotes the suitability or the TSFC coordination index of the th type of TSF, is the comprehensive evaluation score of the TSFs, is an undetermined coefficient, , and . is the coupling coordination degree, which indicates the coupling coordination degree of each system of the TSF in spatial unit.
3.3.2. Comparison and Validation of Stability of TSFP
Based on the concepts of landscape stability and ecosystem stability [77], we assess the stability of the TSFPs from temporal and spatial dimensions. On the temporal scale, the greater the adjustment of the reconstructed TSFP to the current pattern, the higher the risk of being broken and the lower the stability, due to factors such as the spatio-temporal heterogeneity of TSFs and the dynamics of functional conflict characteristics. Therefore, the proportion of spatial units with unchanged functional types is selected to represent the stability on the temporal scale, and the calculation formula is:
where denotes the stability of the TSFP on the temporal scale (%), denotes the number of spatial units that the superior TSFs of the TSFP remain unchanged, and denotes the total number of spatial units in the constructed TSFP.
On the other hand, in terms of spatial scale, studies have shown that there is a close relationship between landscape pattern and TSFPs, and the former largely influences or even determines the formation of the latter [78]. Information such as the structural composition and spatial configuration of landscape patterns can be effectively characterized by landscape pattern indices [79]. This study selects indices representing landscape pattern stability to evaluate the stability of the reconstructed TSFP from the dimension of spatial form. Generally, the stability of landscape patterns can be analyzed at three levels: patch, patch type, and landscape. The patch level reflects the structural characteristics of patches from a micro-perspective, while the patch-type and landscape levels reflect the landscape structural characteristics from meso- and macro-perspectives, respectively [80]. Considering that TSFP is characterized by large scale and few levels, and the TSF system has strong integrity [81], this study focuses on the patch-type and landscape levels for comparative analysis of landscape patterns (Table 1).
At the patch-type level, to enhance the anti-interference ability and maintain the stability of the functional pattern, the reconstructed TSFP is expected to have a lower degree of fragmentation. The Mean Patch Size (MPS) is a key indicator for measuring the degree of fragmentation. Larger patch sizes are more conducive to the realization of ecosystem functions and processes and the improvement of system connectivity, thus strengthening the stability of TSFP [78]. The Mean Shape Index (MSI) reflects the complexity of patch shapes. Patches with more complex shapes have stronger interactions with the surrounding matrix, are at a higher risk of interference, and are less conducive to the stability of the functional pattern [82]. Therefore, this study selects MPS and MSI to evaluate the stability at the patch-type level.
At the landscape level, the constructed TSFP is expected to have both rich landscape diversity and high landscape concentration to form a stable landscape pattern. The Mean Patch Fractal Dimension (MPDF) describes the complexity of patch geometric shapes. A smaller MPDF value indicates a simpler shape and richer landscape diversity, which is more beneficial for improving the anti-interference ability of the TSF system [83]. The Aggregation Index (AI) represents the connectivity of patches of the same landscape type. A smaller AI value means more discrete landscapes, which is less conducive to the stability of the functional pattern [84]. Therefore, this study selects MPDF and AI to evaluate the stability at the landscape level.

Table 1.
Index to assess the stability of the TSFP at the spatial scales.
Table 1.
Index to assess the stability of the TSFP at the spatial scales.
| Indicators | Formula | Explanation of Parameters | |
|---|---|---|---|
| Patch type level | Mean patch size index | is mean patch size index; is the total area of all patches in the landscape; is the total number of patches. | |
| Mean shape index | is mean shape index; , are the perimeter and area of the -th patch in the -th landscape class, respectively; is the number of all patches in the -th TSF types [85]. | ||
| Landscape level | Mean patch fractal dimension Index | is the mean patch fractal dimension index, is the perimeter of patch , is the area of patch , is the number of all patches in the landscape [85]. | |
| Aggregation Index | is aggregation index; is the number of similar adjacent patches of the corresponding landscape type [86]. | ||
3.3.3. Comparison and Validation of Eco-Economic Benefits of Functional Utilization
We used the intensity of carbon emissions (i.e., carbon emissions per unit of GDP) to evaluate the eco-economic benefits of the functional utilization in the constructed TSFP. The intensities of carbon emissions in the reconstructed TSFP and in each TSF are calculated as follows:
where and denote the intensity of carbon emissions in the reconstructed TSFP and in th type of TSF, respectively. The smaller their values are, the higher are the eco-economic benefits of the utilization of TSFs. denotes carbon emissions of th type of TSF, which are obtained through the coefficient of net carbon emission and the scale of the TSF in the target year. denotes the GDP of th type of TSF, which is obtained through the coefficient of economic efficiency and scale of the TSF in the target year.
4. Application in the Study Area
To verify the application effect of the TSFPR model in the reconstruction of TSFPs for coordinated economic growth and carbon emission reduction, an empirical analysis was conducted in Qionglai City, China. Based on the previous results of linking the territorial spatial classification system with land-use classification [87], taking 2020 as the base year, the TSFPR model was applied to construct the TSFP of Qionglai City in 2025. The main solution steps of the model are detailed in Supplementary Materials S1. The implementation processes of key model contents, such as the coordination index of TSFC and the corresponding rules of the identification function for dominant TSF, are detailed in Section 4.2 and Section 4.3.
4.1. Study Area and Data
4.1.1. Case Study Area
Qionglai City is located in the transition zone between the Chengdu Plain and the Longmen Mountains in western China (30°12′ N to 30°33′ N, 103°04′ E to 103°45′ E), with a total land area of 1377 km2. The district is further subdivided into one subdistrict, 19 towns, and four townships (see Figure 2). The topography of the region is characterized by a pronounced variation in altitude, with the highest elevations occurring in the northwest and the lowest in the southeast. The total range of elevations is from 451 to 1991 m above sea level. The topography of the region is characterized by the presence of plains, mountains, and hills. The total area of the plain is 311.36 km2, distributed across the eastern and northeastern parts of the county. The mountainous regions extend to 817.79 km2, encompassing the Wumian Mountains and the Changqiu Mountain Range in the south and the southern extension of the Longmen Mountains in the west. The hilly terrain, covering an area of 245.98 km2, is dispersed along the northwestern periphery of the county. The region is characterized by a substantial abundance of water resources, with a total of 271.25 km of river length. Qionglai City is located within the subtropical humid monsoon climate zone, characterized by an annual average temperature of 16.3 °C, an annual precipitation of 1117.3 mm, an annual sunshine duration of 1107.9 h, and an annual evaporation of 1024.92 mm. The predominant soil types in this region are alluvial soil and purple soil. The forest vegetation is categorized as subtropical evergreen broad-leaved forest, and is distributed primarily in the northwestern low-to-mid mountains and central hilly areas.
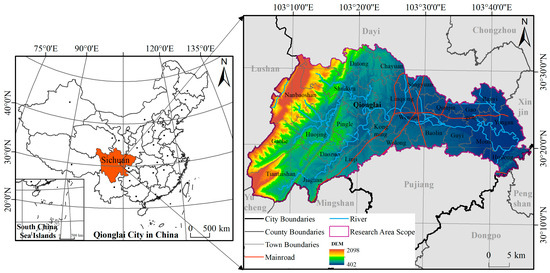
Figure 2.
Geographical location of the study area [88].
The total land area of the world is 1.49 billion km2, of which less than 5% is deemed to be suitable for human survival and development [17,19]. Furthermore, within the confines of this limited space, there is a considerable overlap between areas conducive to industrialization and urbanization, and those that are conducive to agricultural production and ecological protection. This overlap is susceptible to generating conflicts between the various TSFs. Since the beginning of the 21st century, the acceleration of global industrialization and urbanization, coupled with increased environmental awareness in the context of climate change, has exacerbated conflicts between TSFs in such overlapping areas. This has led to an intensification of the conflict between humans and nature, as well as hindering the implementation of a path of territorial space governance that synergizes economic development and ecological protection. This issue has become a common problem in the economic and social transformation of developing countries.
Qionglai City is an important grain production functional area and a key protected area for agricultural product production in western China (permanent basic farmland accounts for 81.33% of the cultivated land area). It is also an important ecological protection and restoration area for the ecological security barrier in the upper reaches of the Yangtze River (covering national scenic spots like Tiantai Mountain and the core area of the biodiversity conservation red-line in Qionglai Mountains), with the core functions of both agricultural production and ecological protection. The functional types of territorial space in this region are relatively comprehensive, including urban production and living, rural production and living, and ecological space [87]. From 2010 to 2020, its rapid economic development with an average annual GDP growth of 12.85%, combined with the promotion of the ecological civilization strategy and the increasing public ecological demand, led to significant functional conflicts in some territorial spaces due to insufficient optimization of the development—protection pattern, which highly coincides with the problems faced by developing countries during economic and social transformation. In particular, the trends of Qionglai City in urbanization, economic development, population change, and carbon emissions are similar to those of developing countries such as China, India, Brazil, and South Africa [16]. These countries and regions also share common goals in ecological and environmental protection policies (e.g., all have proposed carbon-neutral timetables and made commitments to address global climate change) [16], making it highly representative. Therefore, choosing Qionglai City as an empirical area to explore new methods for coordinating TSFC and reconstructing TSFPs can lay a theoretical foundation and provide methodological support for developing countries worldwide to find territorial space governance paths to resolve the contradiction between economic development and ecological protection.
4.1.2. Data Sources and Processing
The data employed in this study primarily include three categories: geospatial data, monitoring data, and panel data (see Table 2 for details). Geospatial data constitute the primary data source and include satellite remote-sensing imagery, land-use data, the normalized difference vegetation index (NDVI), digital elevation models (DEM), and electronic map layers. Remote sensing data were primarily obtained from the Google Earth historical imagery archive, which aggregates Landsat observations released by authoritative agencies such as NASA and USGS. Land-use data were compiled from the Chengdu Land Survey Achievements Database. The Second National Land Survey employed orthophoto maps (DOM) generated from French SPOT HVR satellite imagery and 30 m–resolution DEMs as base maps. These products were created through a standardized workflow comprising preliminary indoor interpretation, field verification, and subsequent indoor scanning and vectorization processing. The Third National Land Survey utilized high-resolution satellite remote-sensing imagery (spatial resolution < 1 m) to produce survey base maps. Data acquisition leveraged advanced technologies—including mobile internet, cloud computing, and UAV-based remote sensing—and was complemented by on-site supplementary investigations to ensure comprehensive coverage and accuracy. The sources of NDVI, DEM, and other geospatial datasets, as well as meteorological monitoring data, soil attribute data, and socio-economic statistics, are detailed in Table 2.
Table 2.
Data types and sources.
To meet the technical requirements of model construction and analysis, all spatial datasets were standardized. Geographic coordinates were unified to the WGS-84 datum, projection coordinates to the UTM system, and raster spatial resolution to 50 m. Targeted spatial pre-processing was then applied to different types of data, specifically as follows: (1) Spatial interpolation on the ESRI ArcGIS platform: A Kriging interpolation approach was employed to transform point-based observations of soil nutrients and meteorological factors into raster datasets, thereby producing continuous surface layers. The interpolated indicators included soil organic matter, organic phosphorus, available potassium, and alkaline-hydrolyzable nitrogen, as well as meteorological variables such as annual accumulated temperature ≥ 10 °C and annual precipitation. (2) Spatialization and quantification of panel data: The panel dataset comprises two primary categories: national economic and social development statistics, and energy statistics. City and town level indicators of national economic and social development were spatially discretized using 50 m × 50 m vector grids, following established methods [88]. Energy-related variables, such as energy consumption for urban (rural) production and household activities, and chemical oxygen demand (COD) in industrial wastewater, were quantified in accordance with the IPCC accounting frameworks [89,90] and baseline parameters from the China Energy Statistical Yearbook, using the calculation procedures described by Qin et al. [16] and Wang et al. [91].
4.2. Realization of Calculation Method of the TSFC Coordination Index
The TSFC coordination index calculation is concerned with the evaluation of TSFs and the probability of optimal selection. Among them, the calculation of suitability is relatively straightforward (see the Supplementary Materials S2 and S3 (Refs. [17,92,93,94] have been cited in the Supplementary Materials S2; Refs. [17,92,93,94,95,96] have been cited in the Supplementary Materials S3) for details of resource and environmental carrying capacity and suitability evaluation methods and results). By contrast, the calculation of the probability of optimal selection is more complex, mainly involving the implementation of a TSFC coordination game model and its solution method.
4.2.1. Realization of the TSFC Coordination Game Model
Because the Nash equilibrium strategy of the zero-sum game model is determined based on the payoff matrix, the establishment of the utility function of the game players and the construction of the payoff matrix are key to formulating the model. We established the utility function of the game players based on the results of evaluation of the suitability of the current TSFs, which was based on the dynamics of the function (expressed by applying the transfer probability matrix predicted by differential equations) and eco-economic benefits of functional utilization (expressed by applying the low-carbon economic benefit index):
where denotes the payoff matrix of the game players and indicates the eco-economic benefits of utilization of TSFs. The higher the value is, the greater are the benefits of utilization of TSFs. denotes the first correction coefficient of the eco-economic benefits of utilization of TSFs. represents the suitability of the current TSFs. A larger value means a higher suitability. ; denotes the second correction coefficient of the eco-economic benefits of utilization of TSFs. is the probability of the transformation of TSF to TSF .
- (1)
- Calculation of eco-economic benefits of utilization of TSFs
The eco-economic benefits of utilization of TSFs are measured based on the low-carbon economic benefit index:
where represents the index of low-carbon economic efficiency of the th type of TSF. The larger its value is, the higher is the level of eco-economic benefits of utilization of TSFs. denotes the normalized coefficient of economic benefits of the th type of TSF. denotes the GDP of this TSF, which was obtained from the GDP spatial distribution simulated by nighttime lighting and statistics data and vector data of the distribution of TSF types in the corresponding year with the help of ESRI ArcGIS partition statistics tool (the methodology and results of the simulation of the GDP spatial distribution are detailed in the Supplementary Materials S4 (Ref. [97] have been cited in the Supplementary Materials S4)). is the area of the th type of TSF, which is obtained from vector data on the distribution of the type of TSF (see the Supplementary Materials S5 for details). denotes the method of data normalization. We used the maximum–minimum normalization method [98]. denotes the normalized coefficient of net carbon emissions of the th type of TSF, where denotes the total net carbon emissions of the th type of TSF. which was obtained from the carbon emissions spatial distribution data (the methodology and results of the simulation of the carbon emissions spatial distribution are detailed in the Supplementary Materials S6 (Refs. [89,90,99,100,101,102,103,104,105,106,107,108,109,110,111] have been cited in the Supplementary Materials S6)), and vector data of the distribution of TSFs in the corresponding year with the help of ESRI ArcGIS partition statistics tool. We then used time series, exponential smoothing, and linear regression to predict the coefficients of economic benefits and net carbon emissions of each TSF in the target year.
- (2)
- The implementation process and results of the evaluation method for the suitability of TSFs are shown in Supplementary Materials S2 and S3 (Refs. [17,92,93,94] have been cited in the Supplementary Materials S2; Refs. [17,92,93,94,95,96] have been cited in the Supplementary Materials S3).
- (3)
- Prediction of the transfer probability matrix of TSFs
Differential equations contain continuously varying independent variables, unknown functions, and their derivatives that can be used to characterize the dynamics of the system over time and easily predict its future state [112]. We used the Markov model to calculate the period-by-period transition probability square matrix of the TSFs. Assuming that the transition probability is a function that varies continuously with time , and that the rate of change in unit time is also a function that varies with time, we can obtain the differential equation describing the pattern of change in the transition probability and the definite conditions for its solution:
Solving Formula (19) yields:
where is an undetermined constant with an initial value of .
We used Formula (20) to calculate the period-by-period transition probability of the TSFs from the base year (the th year) to the target year on an interval. We then used this basis to calculate the period-by-period transition probability matrix from the base year to the target year according to Formula (21):
where denotes the sum of transition probabilities of types of TSFs in period and denotes the transition probability matrix of the TSFs in period .
Finally, we calculated the transition probability matrix of the TSFs from the base year to the target year according to Formula (22):
We applied the Markov model to obtain the transition probability of the TSFs in the past periods 0 (2010–2011), 1 (2011–2012), 2 (2012–2013), 3 (2013–2014), 4 (2014–2015), 5 (2015–2016), 6 (2016–2017), 7 (2017–2018), 8 (2018–2019), and 9 (2019–2020) by using MATLAB (r2023b) to obtain the function (see the Supplementary Materials S7 for details). We then calculate to obtain the transition probabilities of the TSFs in the periods 10 (2020–2021), 11 (2021–2022), 12 (2022–2023), 13 (2023–2024), and 14 (2024–2025). Finally, we used Formulas (19) to (22) to calculate the transition probability matrix of the TSFs in the range 2020–2025.
4.2.2. Realization of the Solution Method of TSFC Coordination Game Model
From Section 3.2.1, we know that the construction of the TSFC coordination index requires only determining the Nash equilibrium strategy of the decision-makers of territorial spatial planning. As their Nash equilibrium strategy involves only the linear programming (5), and linear programming (5) and linear programming (7) are dyadic to each other and have a similar solution process, so we will only give the implementation of the solution method for the linear programming (5).
By assuming and setting the temporary variable , we obtain . Because , the linear programming (5) can be transformed into:
According to the calculated payoff matrix in the target year , the optimal solution ( to the linear programming model can be obtained by using the design program on the MATLAB platform. We use this to obtain the Nash equilibrium strategy of game player (the decision-makers of territorial spatial planning) in the given target year by Formula (24):
where denotes the Nash equilibrium strategy of game player , i.e., the optimal selection probability of th type of TSF by the decision-makers of territorial spatial planning. denotes the optimal solution of the linear programming model in formula (23), and denotes the optimal objective function of the linear programming model in formula (5) that was calculated as follows: .
4.3. Realization of the Construction Method of the Corresponding Rules of Identification Function of Superior TSFs of Spatial Units
The key elements for obtaining the corresponding rules between the TSFC coordination index (independent variable) and the type of superior TSFs of spatial units (dependent variable) include the inner functional corresponding rule (i.e., the method for grading the TSFC coordination index, ), the corresponding rule for classifying conflicts and non-conflicts zones of TSFs, , and the outer functional corresponding rule (i.e., the method for identifying the superior TSFs of spatial units, ). There is uncertainty in the numerical characteristics of the TSFC coordination index. Moreover, the quantile method has no hypothetical prerequisites for the pattern of distribution of the data, such that it can be applied to grade various types of data with normal, skewed, and discrete distributions. We thus used as the quantile method. The basic mathematical principle is as: Let the distribution function of the continuous random variable be and the density function be . For any , we postulate that the that satisfies the condition is the p-quantile of the distribution. We used the Esri ArcGIS quantile tool to divide the TSFC coordination index into three levels: high, medium, and low. was defined as the conflicting spatial unit if the highest suitability level corresponded to two or more types of TSFs in the same spatial unit; otherwise, it was considered to be a non-conflicting spatial unit. was defined such that in non-conflicts zones, the TSFs with the highest index level were superior TSFs of spatial units, and in the conflicts zone, the types of superior TSFs of spatial units were undetermined. Qionglai City’s TSFs were of five types: urban production, urban living, rural production, rural living, and ecology. The process of obtaining the corresponding rules between the TSFC coordination index of its spatial units and the types of superior TSFs in it is shown in Supplementary Materials S1.
4.4. Validation of the TSFPR Model
To test the application effect of the TSFPR model in the reconstruction of TSFPs for coordinated economic growth and carbon emission reduction, this study applied the TSFPR model in Qionglai City and conducted a rationality analysis. Then, using a commonly used practical method (mathematically expressed as replacing the variable in Formula (1) with ), we simultaneously constructed the TSFP of Qionglai City. Combining the comprehensive evaluation index system constructed in Section 3.3, we systematically evaluated and comparatively analyzed the results obtained by the two methods to verify the advantages and effectiveness of the TSFPR model.
To ensure the comparability of the TSFP constructed by the two methods, we kept the basic data and parameter settings of the practical method consistent with those of the TSFPR model. The specific settings were as follows: (1) The types of TSFCs were uniformly divided into five categories (see Supplementary Materials S5 for details), and the base year and the target year of the plan were unified as 2020 and 2025, respectively. (2) The evaluation method and results of the suitability of TSFs were the same as those of the TSFPR model (see Supplementary Materials S2 and S3 for details (Refs. [17,92,93,94] have been cited in the Supplementary Materials S2; Refs. [17,92,93,94,95,96] have been cited in the Supplementary Materials S3)). (3) In the process of reconstructing the TSFP, both methods used the same method for classifying independent variable levels and the corresponding rules with the dependent variable (see Section 4.3 for details).
5. Results and Analysis
5.1. Model Empirical Results and Analysis
5.1.1. Results and Analysis of the Quantitative Structure of TSFs
The scale of urban, rural, and ecological space of Qionglai City’s TSFP constructed by the TSFPR model is 6591 hm2, 69,326 hm2, and 61,370 hm2, respectively, accounting for 4.79%, 50.34%, and 44.57%, in that order (Figure 3). Among them, the production and living space of the town will increase by 12 hm2 and 730 hm2 respectively compared to 2020. Although China’s national urbanization strategy has been transformed to an emphasis on internal development, 60.03% of the study area had been urbanize (still room for improvement compared with over 80% in developed countries). In the short term, the population will continue to be concentrated in cities and towns. Therefore, the urban space grows slightly, which is consistent with the characteristics of the urbanization stage under the constraints of ecological protection (e.g., control over carbon emissions). Rural production space and rural living space decreased by 1290 and 1910 hm2, respectively. The main reason is that the dependence on the development path of urban and rural areas, and the rigid constraints of ecological policies, have led to the continuous migration of rural populations, resulting in the conversion of some rural areas into urban or ecological spaces, which is in line with the regional development pattern. Ecological space increased by 2043 hm2, because Qionglai as China’s upper reaches of the Yangtze River ecological security barrier key area, with high carbon sink capacity of ecological space growth not only meets the demand for carbon emission reduction—economic growth harmonization, in line with the expected goal of harmonious coexistence between humans and nature, but also to match the regional economic and social transformation and development of the actual. In summary, the quantitative structure of the TSFP constructed by the TSFPR model is in line with the expected goal and the actual regional development.
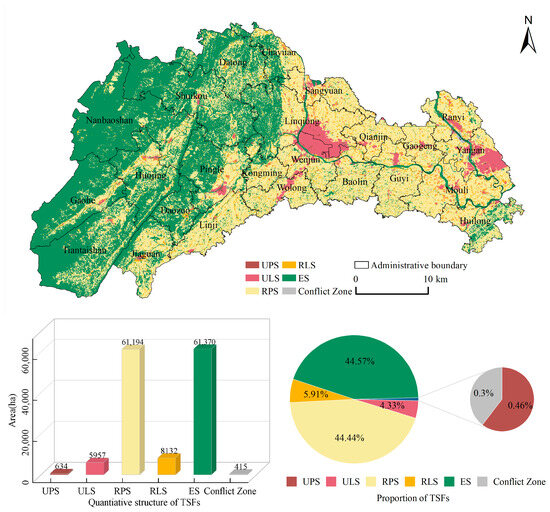
Figure 3.
Reconstruction results of TSFP of Qionglai City in 2025. UPS is urban production space; ULS is urban living space; RPS is rural production space; RLS is rural living space; ES is ecological space; CZ is conflict zone.
5.1.2. Results and Analysis of the Spatial Distribution of TSFs
The distribution characteristics of the TSFP of Qionglai City constructed by the TSFPR model (Figure 3) are: urban production space is concentrated in cities, towns and surrounding areas with convenient transportation and abundant labor force, and the external conditions are suitable to meet the needs of the production function; urban living space is distributed in the form of a cluster in the central and eastern regions such as Linqiong, Yang’an, Wolong, etc., relying on the radiation effect of the existing cities and towns and the perfect transportation and public service facilities, and suitable to meet the needs of the life of the population agglomeration. The rural production space covers non-central urban townships in a concentrated and continuous form, with a belt-shaped distribution in the western mountainous areas, relying on gentle slopes, fertile soil and sufficient water sources, combined with a long-term cultivation base to safeguard the production function. Rural living space is based on the current situation of concentrated rural settlements, scattered in the western river valley terraces and the eastern dam area, using the existing transportation and public service facilities to support the living function. The ecological space is dominated by the western part and supplemented by the southeastern part, relying on high vegetation cover, rich biological resources and high-quality habitats to effectively support ecological functions. In conclusion, the TSFP of Qionglai City obtained by the TSFPR model was highly compatible with the regional natural and humanistic conditions, and the reconstruction results are reasonable.
5.2. Model Validation and Analysis
5.2.1. Comparative Analysis of Coordination Degree of TSFC in Reconstruction Results
The TSFP constructed by the conventional method has significant functional conflicts, with the conflict area amounting to 64,494.5 hm2, accounting for 46.84% of the total territorial area of Qionglai City (Figure 4a); only 53.83% of the spatial unit functions are in a coupled and coordinated state (Figure 4c), which indicates that there is a strong interdependence of functions, but the dominant functions are not prominent, and the effect of conflict coordination is not good.
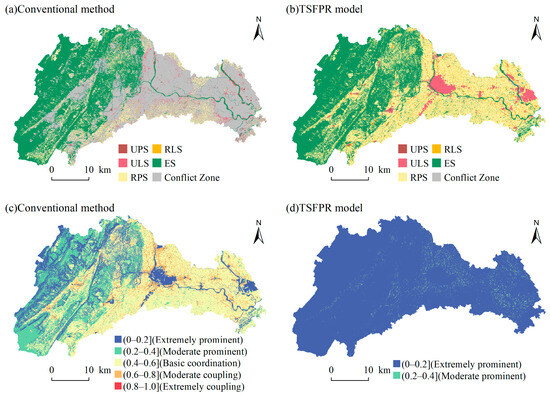
Figure 4.
Comparison of coordination degree of functional conflict between conventional method and TSFPR model. UPS is urban production space; ULS is urban living space; RPS is rural production space; RLS is rural living space; ES is ecological space; CZ is conflict zone.
In contrast, the conflict control effect of the TSFP constructed by the TSFPR model is obvious, with the total area of the conflict zone being only 415 hm2 (0.30% of the total area, Figure 4b), and it is mainly distributed in the riparian zones adjacent to rivers and cultivated land, which may be related to the bias of the functional values due to the limitation of the accuracy of the data. The effect of conflict coordination of TSFs is also significantly improved: 98.19% of spatial units have very low coupling coordination (highly prominent dominant functions), and the remaining 1.81% of units have low coupling coordination (more prominent dominant functions, Figure 4d), which indicates that the model significantly improves the effect of conflict coordination between urban production and life, rural production and life, and ecological functions.
5.2.2. Comparative Analysis of Stability of TSFP of Reconstruction Results
In terms of temporal scale stability, the ratio of functional types unchanged of the TSFP obtained by the conventional method and the TSFPR model were 0.49 and 0.95, respectively, indicating that the unadjusted functional types of the TSFP constructed by the TSFPR model occupied a larger area, while the disturbed area in implementation process was smaller. This outcome was thus highly stable over time. The stability of the spaces for urban living, rural production, and rural living improved most significantly, by 100%, 78%, and 95%, respectively.
In terms of spatial scale stability, the index of the landscape pattern calculated based on Fragstat (4.2) software for patch type and landscape level shows that: at the level of patch type, the average patch area of urban and rural space constructed by TSFPR model is significantly larger than that of conventional method (e.g., the average patch area of the space for rural production that is susceptible to disturbance reaches 13.93 hm2), and the average patch area of ecological space is close to that of conventional method, except for the slightly lower average shape index of ecological space, the average shape indices of production and living space were higher than that of the conventional method, indicating that its patch shape was more regular and simple, and more resistant to fragmentation. At the landscape level, the average number of patch dimensions of the TSFPR model was slightly lower than that of the conventional method, reflecting its moderate shape complexity and richer landscape diversity; the index of the degree of aggregation was significantly higher than that of the conventional method (especially in the central, southeastern, and northwestern parts of the study area), which indicated that the degree of aggregation of the functional pattern was higher. On the whole, the functional pattern constructed by the TSFPR model is better in terms of patch fragmentation, shape regularity and landscape aggregation, and the spatial stability of the functional pattern is significantly improved (Figure 5).
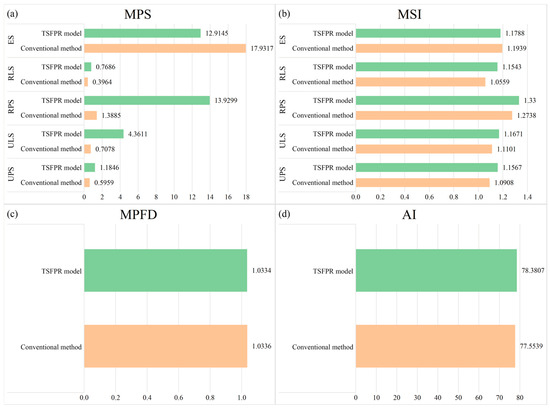
Figure 5.
Comparison of landscape pattern indexes between conventional method and TSFPR model. (a) Comparison of MPS between the TSFPR model and the conventional method; (b) Comparison of MSI between the TSFPR model and the conventional method; (c) Comparison of MPFD between the TSFPR model and the conventional method; (d) Comparison of AI between the TSFPR model and the conventional method.
5.2.3. Comparative Analysis of the Eco-Economic Benefits of Functional Utilization from Reconstruction Results
In terms of single-dimensional benefits, the TSFP constructed by the TSFPR model has a lower economic benefit of 38.875 billion yuan than that of the conventional method, but the net carbon emission is reduced by 170,600 tonnes. Because the conventional method is not based on the concept of harmonious coexistence between humans and nature, and lacks economic-ecological coordination strategy, and is driven by the historical development path dependence, the production space of cities and towns is over-expanded, and a large amount of ecological space is encroached upon, which enhances the economic benefits but pays the environmental price (the shrinkage of the ecological space with a strong carbon sequestration capacity leads to the ineffective dissipation of carbon emissions, and the net carbon emissions are significantly higher than that of the TSFPR model). In terms of comprehensive benefits, the carbon emission intensity of the functional pattern constructed by the TSFPR model is reduced by 0.05 compared with that of 2020, which is much lower than the average level of the same period in China [113], indicating that its ecological and economic benefits have been effectively improved (Table 3). This verifies the feasibility of the reconstruction strategy of the TSFPR model that incorporates the ecological and economic benefits into the utility function and identifies the advantageous functions mainly on the basis of the Nash equilibrium of the zero-sum game between humans and nature, and also confirms the scientificity of interpreting the functional conflict as a zero-sum game between humans and nature based on the concept of harmonious coexistence between humans and nature.
Table 3.
Comparison of eco-economic benefits of functional utilization from reconstruction results.
6. Discussion
This study proposes a TSFPR model that breaks through regional limitations and has theoretical universality. It effectively addresses the drawbacks of significant spatial conflicts and insufficient pattern stability in reconstructing TSFPs using commonly used methods, and simultaneously achieves the coordinated optimization of economic and ecological benefits. The study provides a new theoretical framework and methodological tools for constructing TSFPs that integrate ecological protection and economic development, and contributes an innovative solution to exploring high-quality territorial space governance paths.
6.1. Enhancing the Theoretical Universality and Cross-Regional Applicability of Methods for Reconstructing TSFP
Currently, most methods for reconstructing the TSFPs that coordinate economic growth and carbon emission reduction are presented in the form of conceptual frameworks [72,73]. Although they can provide initial ideas, since these frameworks are usually proposed based on specific regions, they are easily restricted by differences in regional natural conditions, evaluation indicator systems, and decision-making rules [16,114], resulting in insufficient theoretical universality and difficulty in cross-regional promotion and practical application. To address these deficiencies, this study innovatively integrates set theory and function theory, abstracting the complex process of reconstructing TSFPs into a mathematical model with universal significance. This effectively overcomes the limitations of commonly used practical methods in regional applicability and provides theoretical support for the reconstruction of TSFPs.
On the one hand, there is a lack of theoretical methods for determining the dominant TSF of spatial units using the TSFC coordination index [22,24,115]. In this study, function theory was used to abstract the identification of the dominant TSF as a composite function of the TSFC coordination index: taking the index as the independent variable and the type of dominant TSF as the dependent variable, a composite function relationship was established by constructing the correspondence rule of the inner function (i.e., the grading method of the TSFC coordination index) and the correspondence rule of the outer function (the identification method of the dominant TSF in conflict and non-conflict areas) (see Section 4.3 for specific function rules). The empirical results of Qionglai City show that, this composite function rule can effectively achieve a one-to-one correspondence between the TSFC coordination index and the type of dominant TSF, solving the theoretical and methodological problems of using this index to determine the dominant TSF of spatial units.
On the other hand, regarding the complex resource optimization problem of constructing TSFPs (which requires considering conflict coordination, pattern stability, and ecological and economic benefits) [17,22,38], this study proposes a universal reconstruction model for TSFPs based on set theory: abstracting spatial units as set elements, using the dominant TSF identification function as the element feature description function, and defining the reconstructed TSFPs as a set of elements with specific functional characteristics (see Formula (1) for the mathematical expression). Through high abstraction, this model eliminates the constraints of regional conditions on model migration. Theoretically, by combining regional realities and policy requirements and simply adjusting the TSFC coordination index and function rules accordingly, this model can be applied to the reconstruction of TSFPs in different regions, with both theoretical universality and good applicability for cross-regional applications. This innovation not only enriches the theory of spatial optimization modeling but also provides methodological support for the reconstruction of TSFPs under multi-objective collaboration.
6.2. Resolved the Spatial Conflict in Establishing a TSFP Based on Functional Suitability
6.2.1. Solved the Spatial Conflict Problem in Establishing TSFPs Based on Functional Suitability
The objective existence of territorial space function conflicts has been widely recognized [24,115,116]. Typically, there are two or more function types with the highest suitability in the same spatial unit [115,117]. Theoretically, such conflicts can be self-regulated through the natural recovery process of the function system. However, this process is often extremely time-consuming and involves high uncertainty and risks (e.g., it took 28 years to complete the natural ecological restoration of a mining area in California Canyon, USA [118]). During this period, function conflicts may cause serious or even catastrophic impacts on human society and the ecosystem (e.g., large-scale deforestation in the Amazon rainforest has led to the loss of biodiversity and the degradation of ecological functions [119]). Therefore, it is practically necessary to take active intervention to reconstruct TSFPs, mitigate conflict damages, and promote the harmonious coexistence of humans and nature. In practice, traditional planning often relies on the suitability of TSFs to reconstruct functional patterns [22,38], but it often faces the problem of multiple highly suitable functions coexisting in a single spatial unit. For such units, decision-makers often rely on empirical judgment or simple qualitative analysis to determine the dominant TSF [120,121]. However, this method ignores the dynamic nature of conflicts caused by the spatio-temporal heterogeneity of TSFs and the complex coupling relationship of the human–land system, resulting in problems such as ineffective resolution of conflicts, insufficient stability, and imbalance of ecological and economic benefits in the reconstructed TSFPs. It is difficult to support the reconstruction of TSFPs that coordinate economic development and ecological protection.
This study innovatively abstracts the coordination of TSFCs into a zero-sum game process between humans and nature. By integrating the suitability, dynamics, and ecological and economic benefits of TSFs, a two-player zero-sum game model of decision-makers and the TSF system is constructed. The Nash equilibrium strategy is used to represent the optimal choice probability of decision-makers in conflict coordination (i.e., the comparative advantages of various TSFs within spatial units). Further, based on this probability, the suitability of TSFs is revised, and a new index for coordinating TSFCs is proposed as the core criterion for identifying the dominant TSF. This criterion is based on the Nash equilibrium of optimal decision-making in the TSF system, comprehensively considering ecological and economic goals, and fully reflecting the concept of harmonious coexistence between humans and nature. It creates conditions for solving problems such as insufficient scientificity of criteria, weak pattern stability, and benefit imbalance in traditional research on identifying the dominant TSF.
The empirical results of Qionglai City show that compared with the commonly used methods in practice, the functional pattern constructed based on the coordination index of TSFC not only completely eliminates the spatial units with unclear dominant TSFs, but also effectively controls the scope of conflict areas. This verifies the effectiveness of this criterion in identifying the dominant TSFs of spatial units, and provides new ideas and solutions for breaking through the dilemma of identifying dominant TSFs caused by TSFCs.
6.2.2. Resolved the Weakness in Stability When Establishing TSFP Based on Functional Suitability
The spatio-temporal heterogeneity of TSFs leads to the dynamic evolution of functional conflicts [24,33,122]. The functional patterns traditionally constructed only based on the current suitability of TSFs often become ineffective due to the changing conflict characteristics and are difficult to guarantee the spatio-temporal stability of the reconstructed patterns [24,33,123]. This study effectively improves the stability of the reconstructed TSFPs through the game model and Nash equilibrium strategy design.
Specifically, when constructing the game model for coordinating TSFCs, first, fit the change rules of transfer probabilities of different TSF types in the historical period, establish differential equations to predict the TSF transfer probability matrix from the base period to the planning period, and use it as the basis for constructing the pay-off matrix of the game model, thus reducing the impact of the dynamic changes of TSFs on the stability of the reconstructed functional pattern from the source. Meanwhile, use game theory to abstract the coordination of TSFCs into a zero-sum game between humans (planning decision-makers) and nature (functional systems). Amend the functional suitability through the decision-maker’s Nash equilibrium strategy (i.e., the Nash equilibrium based on the optimal strategy of the TSF system, which is a stable solution that neither rational party has a reason to break), and propose a new index for coordinating TSFCs as the basis for reconstructing the TSFPs. Since the Nash equilibrium is a stable state where neither party has the motivation to deviate, the corresponding probability of TSF selection has theoretical reliability, ensuring the stability of the reconstructed TSFPs.
On the other hand, as the core variable of the coordination index for TSFCs, the stability of the Nash equilibrium strategy depends on the solution accuracy of the game model. Although the two-player zero-sum game model constructed in this study can be transformed into a system of linear equations for solution (with mature theory and strong solution stability) [124,125], there is a risk of solutions exceeding the value range (e.g., negative solutions) or having no solution (see the Supplementary Material S9). Therefore, it is transformed into a complex linear programming model with equality and inequality constraints (detailed in Section 3.2.1) [126], and the interior-point method is used for iterative solution [127,128]. This algorithm is an iterative method widely used to meet the KKT conditions, with advantages in both convergence speed and stability, and can effectively obtain feasible solutions within the value range [127,128]. The solution obtained by the interior-point method is an approximate solution with uncertainty [129,130]. However, by controlling the error at the order of 1.0 × 10⁻⁸, the impact of uncertainty on the stability of the reconstruction results of TSFPs is minimized. Empirical results in Qionglai City show that compared with commonly used practical methods, the pattern constructed by the TSFPR model has a smaller patch change coefficient, fewer disturbed areas, lower patch fragmentation, higher shape regularity, stronger landscape aggregation, and significantly improved anti-interference ability and spatial stability, verifying the effectiveness of this model in solving the problem of weak stability in reconstructing TSFPs with commonly used practical methods.
6.2.3. Solved the Problem of Neglecting Both Ecological and Economic Benefits in TSFP Established Solely on the Basis of Functional Suitability
Coordinating the contradiction between socio-economic development and ecological environment protection is a core practical challenge faced globally, especially by developing countries [131,132]. The commonly used practical methods of constructing TSFPs based on the suitability of TSF does not balance the synergy of economic and ecological benefits. It often leads to an imbalanced TSFP with stronger economic benefits and weaker ecological benefits, making it difficult to support the construction of a territorial spatial functional pattern for harmonious coexistence between humans and nature [133,134,135]. To address this issue, from the perspective of coordinating ecological protection and economic development, this study integrates GDP (representing economic benefits) and net carbon emissions (representing ecological benefits) indicators to construct a low-carbon economic benefit coefficient for TSFs. This coefficient serves as the basis for constructing the pay-off matrix of the game model for coordinating TSFC, providing a basis for constructing a TSFP that balances ecological and economic benefits. Empirical results from Qionglai City show that the carbon emission intensity of the TSFP constructed by the TFSPR model is significantly lower than the national average level in China in 2020 [16,136], confirming the effectiveness of using the Nash equilibrium strategy determined by the pay-off matrix of the game model based on the low-carbon economic benefit coefficient as the core parameter of the coordination index forTSFCs. This solves the imbalance problem of ecological and economic benefits in the TSFP established based on the suitability of TSFs.
6.3. Policy Implications
Reconstructing the TSFPs that coordinate economic development and ecological protection can provide at least three policy implications for territorial space governance in global developing countries.
(1) Balancing economic and ecological benefits is an important goal of collaborative governance. In the early stage of social development, excessive pursuit of material interests often leads to ecological damage (e.g., global climate change [137,138,139]). How to coordinate development and protection has become a key challenge. In this study, when constructing TSFPs, by integrating GDP and net carbon emission indicators (see Section 4.2.1 for specific methods), the ecological and economic benefits of TSF utilization were both considered, and the feasibility of the territorial space governance path for balancing ecological and economic benefits was verified. Countries with prominent human—land contradictions need to coordinate the demands for ecological and development space, supplemented by policies such as green industrial transformation and rigid constraints on ecological protection (e.g., China’s ecological protection red line [140,141]) to achieve mutual benefit and win-win results between development and protection.
(2) The harmonious coexistence of humanity and nature is the fundamental principle of collaborative governance. The traditional development model centered on human needs (e.g., over-development in the Yellow River Basin of China [142,143]) ignored the human–land coupling relationship and was punished by nature (e.g., air pollution caused by the disorderly development of urbanization and industrialization in India led to 1.7 million deaths in 2019 [144]). This study breaks through the limitation of maximizing unilateral human interests. It takes the Nash equilibrium strategy of the zero-sum game between humanity and nature as the core parameter for constructing the identification criteria of dominant TSF, and proves that the TSFPs featuring the harmonious coexistence of humanity and nature can resolve TSFC and improve ecological and economic benefits. It should serve as the basic principle for constructing the territorial space governance path in global developing countries.
(3) Reconstructing the TSFPs that coordinate ecological protection and economic development is an innovative measure for collaborative governance. The essence of TSFC is the existence of multiple suitable functions in the same spatial unit. Commonly used practical methods are likely to lead to chaos in TSFPs and imbalance in benefits (e.g., the conflict between agriculture and urban development results in a sharp reduction of arable land [38,51]; the conflict between agriculture and ecological protection causes ecological encroachment [143,145]). The model proposed in this study eliminates the conflict areas in reconstructing TSFPs, enhances stability, ecological and economic benefits, and realizes the reconstruction of TSFPs that coordinate economic development and ecological protection. It provides a new solution for the territorial space governance path towards harmonious coexistence between humans and nature.
7. Conclusions
The contradiction between economic development and ecological protection is a common challenge during the transition of developing countries, and irrational territorial functional patterns exacerbate this tension. Existing reconstruction methods do not adequately balance human and natural needs. As a result, they generate poorly coordinated spatial conflicts, weak temporal and spatial stability, and imbalanced ecological and economic outcomes in reconstructed TSFPs, thereby hindering collaborative governance. This study integrates set theory, function theory and game theory to develop a theoretically general TSFPR model. The model is empirically tested in Qionglai City. The main findings of the study are as follows:
(1) In the TSFP for Qionglai City reconstructed by the TSFPR model, urban space totals 6591 ha (it accounts for 4.79% of the total. Its production space is concentrated in urban areas and surrounding regions with convenient transportation and abundant labour, while its living space is clustered in central–eastern areas such as Linqiong and Yang’an). Rural space totals 69,326 ha (it accounts for 50.34% of the total, with its production space concentrated in contiguous areas across non-central urban townships, while its living space is distributed across existing residential settlements in the western river valleys and terraces as well as the eastern flatlands). Ecological space totals 61,370 ha (it accounts for 44.57% of the total and is mainly concentrated in the west). These allocations align with regional natural conditions, and the functional scales have been adjusted reasonably relative to 2020 to meet development expectations.
(2) Compared with TSFPs reconstructed by commonly used practical methods, the reconstructing TSFP model significantly coordinates and controls functional conflicts in the constructed TSFP (98.19% of spatial units have highly prominent superior TSFs, and the proportion of conflict zones has decreased by 46.54%), achieving a significant enhancement of the stability of the reconstructed TSFP (the patch change coefficient has increased by 0.46, and the degree of patch fragmentation is low, simpler and more regular shapes, higher landscape aggregation, and stronger interference resistance) and overall improvement in ecological and economic benefits (carbon emission intensity in the territorial space decreased by 0.05 t/10,000 yuan compared to 2020), solving the problems of conventional methods in reconstructing the TSFP.
(3) The study verifies that the TSFC coordination index derived from the game-theoretic framework remedies the unscientific coordination criteria used in common practical methods. TSFPs established using this index not only reconcile conflicts among functions within spatial units (eliminating fuzzy units with no dominant function) but also dramatically limit the spatial extent of conflict areas in the reconstructed TSFP (conflict areas account for only 0.30% of the empirical study area).
In conclusion, the TSFPR model proposed in this study addresses the shortcomings of commonly used practical methods for reconstructing TSFPs. It promotes a harmonious coexistence between humans and nature through the reorganisation of the TSFP. The model therefore offers a novel implementation pathway for territorial spatial governance in developing countries, helping to mitigate the conflict between ecological conservation and economic development. However, limitations remain in the spatial extent of model validation and in the comprehensiveness of parameters. For example, the optimisation of human demand for TSFs and the influence of macro-policy factors were not considered. Future research could integrate spatiotemporal equilibrium analysis of functional supply and human demand, incorporate policy factors to improve the model, and thereby provide stronger support for constructing TSFPs that reconcile economic growth with carbon-emission reduction.
Supplementary Materials
The following supporting information can be downloaded at: https://www.mdpi.com/article/10.3390/land14102060/s1, S1: Solution of the TSFPR model; S2: Evaluation indexes, weights and evaluation results of resources and environmental carrying capacity; S3: Evaluation indexes, weights and evaluation results of the suitability of TSFs; S4: Simulation method and results of spatial distribution of GDP in Qionglai City; S5: Territorial spatial functional patterns in Qionglai city; S6: Simulation method and results of spatial distribution of net carbon emission in Qionglai City; S7: Prediction and results of the transfer probability matrix of TSFs in Qionglai City; S8: Spatial distribution of the TSFC coordination index in Qionglai City; S9: Solution results of the game model of TSFC coordination based on different solving methods.
Author Contributions
Conceptualization, D.O., Z.Z. and J.X.; methodology, D.O. and X.C.; software, D.O., Z.Y. (Zijia Yan) and J.Q.; validation, X.C., Z.Y. (Zijia Yan) and Z.Y. (Ziheng Yang); formal analysis, D.O., K.R. and Q.H.; investigation, X.C., Z.Y. (Ziheng Yang) and J.Q.; resources, D.O., Z.Z. and J.X.; data curation, K.R. and X.C.; writing—original draft preparation, D.O., X.C. and K.R.; writing—review and editing, D.O., X.C., Z.Y. (Zijia Yan) and Q.H.; visualization, Z.Y. (Ziheng Yang) and Q.H.; supervision, J.X.; project administration, Z.Z.; funding acquisition, D.O. and J.X. All authors have read and agreed to the published version of the manuscript.
Funding
This research was supported by the Philosophy and Social Science Fund of Sichuan, China (grant numbers SCJJ23ND161), the Open Fund Project of the Observation and Research Station of Land Ecology and Land Use in Chengdu Plain, Ministry of Natural Resources (grant numbers CDORS-2024-06, CDORS-2024-08), the Natural Science Foundation of Sichuan, China (grant numbers 2024NSFSC0075), Open Fund of Investigation, Monitoring, Protection and Utilization for Cultivated Land Resources, Ministry of Natural Resources, China (grant number CLRKL2024KP02), Sichuan Science and Technology Program (grant numbers 2020YFS0335), the National College Students’ Innovative Entrepreneurial Training Plan Program (grant numbers 202510626047), the Provincial College Students’ innovation training program (grant numbers S202510626016), Scientific Research Projects of the Sichuan Geological Survey Institute (No. SCIGS-CZDXM-2025011) and Science and Technology Projects of the Department of Natural Resources of Sichuan Province (No. ZDKJ-2025-004). All funding details have been carefully checked for accuracy. APC was funded by the Philosophy and Social Science Fund of Sichuan, China (grant numbers SCJJ23ND161); the Open Fund Project of the Observation and Research Station of Land Ecology and Land Use in Chengdu Plain, Ministry of Natural Resources (grant numbers CDORS-2024-06).
Data Availability Statement
The data used in this study include Administrative boundary, Land use status data, Soil organic matter, Organic phosphorus, quick-acting potassium, Alkali-hydrolyzable nitrogen, National economic and social development statistics, and Energy statistics. Availability of the data is limited; they are used under license for the current study and therefore cannot be made public. However, data are available upon reasonable request and under license from the relevant functional departments of local governments in China (see Table 2 of the manuscript for details). Other data cited in the current study can be searched according to the statements in Table 2. Datasets generated and/or analyzed during the current study are not publicly available due to the continuity of the study and critical importance for future progress, but can be obtained from the corresponding author upon reasonable request.
Conflicts of Interest
The authors declare that they have no known competing financial interests or personal relationships that could have appeared to influence the work reported in this paper.
References
- Liu, Y.; Zhou, Y. Territory spatial planning and national governance system in China. Land Use Policy 2021, 102, 105288. [Google Scholar] [CrossRef]
- Wang, Z.; Deng, W.; Zhang, S.; Zhang, H. Improved trade-off model of land use functions: Differentiated objective setting by territory spatial planning. Ecol. Indic. 2024, 160, 111881. [Google Scholar] [CrossRef]
- Jiang, S.; Meng, J.; Zhu, L.; Cheng, H. Spatial-temporal pattern of land use conflict in China and its multilevel driving mechanisms. Sci. Total Environ. 2021, 801, 149697. [Google Scholar] [CrossRef] [PubMed]
- Yang, W.; Li, W.; Wang, L. How should rural development be chosen? The mechanism narration of rural regional function: A case study of Gansu Province, China. Heliyon 2023, 9, e20485. [Google Scholar] [CrossRef]
- Hong, C.; Burney, J.A.; Pongratz, J.; Nabel, J.E.M.S.; Mueller, N.D.; Jackson, R.B.; Davis, S.J. Global and regional drivers of land-use emissions in 1961–2017. Nature 2021, 589, 554–561. [Google Scholar] [CrossRef]
- Baude, M.; Meyer, B.C.; Schindewolf, M. Land use change in an agricultural landscape causing degradation of soil based ecosystem services. Sci. Total Environ. 2019, 659, 1526–1536. [Google Scholar] [CrossRef]
- Peng, J.; Yang, Y.; Liu, Y.; Hu, Y.; Du, Y.; Meersmans, J.; Qiu, S. Linking ecosystem services and circuit theory to identify ecological security patterns. Sci. Total Environ. 2018, 644, 781–790. [Google Scholar] [CrossRef]
- Hui, E.C.M.; Bao, H. The logic behind conflicts in land acquisitions in contemporary China: A framework based upon game theory. Land Use Policy 2013, 30, 373–380. [Google Scholar] [CrossRef]
- Hoegh-Guldberg, O.; Jacob, D.; Taylor, M.; Guillén Bolaños, T.; Bindi, M.; Brown, S.; Camilloni, I.A.; Diedhiou, A.; Djalante, R.; Ebi, K.; et al. The human imperative of stabilizing global climate change at 1.5 °C. Science 2019, 365, eaaw6974. [Google Scholar] [CrossRef]
- Li, X.; Du, J.; Long, H. Theoretical framework and formation mechanism of the green development system model in China. Environ. Dev. 2019, 32, 100465. [Google Scholar] [CrossRef]
- Fang, C.; Wang, Z.; Liu, H. Beautiful China initiative: Human-nature harmony theory, evaluation index system and application. J. Geogr. Sci. 2020, 30, 691–704. [Google Scholar] [CrossRef]
- Abbass, K.; Qasim, M.Z.; Song, H.; Murshed, M.; Mahmood, H.; Younis, I. A review of the global climate change impacts, adaptation, and sustainable mitigation measures. Environ. Sci. Pollut. Res. 2022, 29, 42539–42559. [Google Scholar] [CrossRef]
- Anderson, R.; Bayer, P.E.; Edwards, D. Climate change and the need for agricultural adaptation. Curr. Opin. Plant Biol. 2020, 56, 197–202. [Google Scholar] [CrossRef]
- Gomez-Zavaglia, A.; Mejuto, J.C.; Simal-Gandara, J. Mitigation of emerging implications of climate change on food production systems. Food Res. Int. 2020, 134, 109256. [Google Scholar] [CrossRef]
- Seneviratne, S.I.; Rogelj, J.; Séférian, R.; Wartenburger, R.; Allen, M.R.; Cain, M.; Millar, R.J.; Ebi, K.L.; Ellis, N.; Hoegh-Guldberg, O.; et al. The many possible climates from the Paris Agreement’s aim of 1.5 °C warming. Nature 2018, 558, 41–49. [Google Scholar] [CrossRef] [PubMed]
- Qin, J.; Ou, D.; Gao, X.; Yang, Z.; Zhong, Y.; Yang, W.; Wu, J.; Yang, Y.; Liu, Y.; Sun, J.; et al. Synergizing economic growth and carbon emission reduction in China: A path to coupling the MFLP and PLUS models for optimizing the territorial spatial functional pattern. Sci. Total Environ. 2024, 929, 171926. [Google Scholar] [CrossRef] [PubMed]
- Qu, Y.; Dong, X.; Su, D.; Jiang, G.; Ma, W. How to balance protection and development? A comprehensive analysis framework for territorial space utilization scale, function and pattern. J. Environ. Manag. 2023, 336, 117670. [Google Scholar] [CrossRef] [PubMed]
- Zhang, Z.; Li, J. Spatial suitability and multi-scenarios for land use: Simulation and policy insights from the production-living-ecological perspective. Land Use Policy 2022, 119, 106219. [Google Scholar] [CrossRef]
- Jiang, Z.; Wu, H.; Lin, A.; Shariff, A.R.M.; Hu, Q.; Song, D.; Zhu, W. Optimizing the spatial pattern of land use in a prominent grain-producing area: A sustainable development perspective. Sci. Total Environ. 2022, 843, 156971. [Google Scholar] [CrossRef]
- Zhang, F.; Wang, Y.; Ma, X.; Wang, Y.; Yang, G.; Zhu, L. Evaluation of resources and environmental carrying capacity of 36 large cities in China based on a support-pressure coupling mechanism. Sci. Total Environ. 2019, 688, 838–854. [Google Scholar] [CrossRef]
- Zhang, H.; Wang, Z.; Liu, J.; Chai, J.; Wei, C. Selection of targeted poverty alleviation policies from the perspective of land resources-environmental carrying capacity. J. Rural Stud. 2022, 93, 318–325. [Google Scholar] [CrossRef]
- Zhang, J.; Li, S.; Lin, N.; Lin, Y.; Yuan, S.; Zhang, L.; Zhu, J.; Wang, K.; Gan, M.; Zhu, C. Spatial identification and trade-off analysis of land use functions improve spatial zoning management in rapid urbanized areas, China. Land Use Policy 2022, 116, 106058. [Google Scholar] [CrossRef]
- Yang, H.; Zhai, G.; Zhang, Y. Ecological vulnerability assessment and spatial pattern optimization of resource-based cities: A case study of Huaibei City, China. Hum. Ecol. Risk Assess. Int. J. 2020, 27, 606–625. [Google Scholar] [CrossRef]
- Zhang, Y.; Long, H.; Tu, S.; Ge, D.; Ma, L.; Wang, L. Spatial identification of land use functions and their tradeoffs/synergies in China: Implications for sustainable land management. Ecol. Indic. 2019, 107, 105550. [Google Scholar] [CrossRef]
- Zhao, J.; Zhao, Y. Synergy/trade-offs and differential optimization of production, living, and ecological functions in the Yangtze River Economic Belt, China. Ecol. Indic. 2023, 147, 109925. [Google Scholar] [CrossRef]
- Yang, Y.; Bao, W.; Liu, Y. Coupling coordination analysis of rural production-living-ecological space in the Beijing-Tianjin-Hebei region. Ecol. Indic. 2020, 117, 106512. [Google Scholar] [CrossRef]
- Li, J.; Zhang, Q.; Chen, X.; Wang, L.; Zhao, M. Coupling coordination degree of production, living and ecological spaces and its influencing factors in the Yellow River Basin. J. Clean. Prod. 2021, 298, 126803. [Google Scholar] [CrossRef]
- Zhang, H.; Xu, L.; Zhou, P.; Zhu, X.; Cudjoe, D. Coordination between Economic Growth and Carbon Emissions: Evidence from 178 Cities in China. Econ. Anal. Policy 2023, 81, 164–180. [Google Scholar] [CrossRef]
- Liu, C.; Sun, W.; Li, P.; Zhang, L.; Li, M. Differential characteristics of carbon emission efficiency and coordinated emission reduction pathways under different stages of economic development: Evidence from the Yangtze River Delta, China. J. Environ. Manag. 2022, 327, 116819. [Google Scholar] [CrossRef]
- Sheng, P.; Li, J.; Zhai, M.; Huang, S. Coupling of economic growth and reduction in carbon emissions at the efficiency level: Evidence from China. Energy 2020, 213, 118747. [Google Scholar] [CrossRef]
- Cao, X.; Wang, H.; Song, Y.; Zeng, H.; Zhang, B. An optimization-simulation modeling framework for exploring the dynamic correlation between the coordinated development of the human-nature nexus and land use under uncertainty. Sustain. Cities Soc. 2024, 110, 105995. [Google Scholar] [CrossRef]
- Wei, L.; Zhang, Y.; Wang, L.; Cheng, Z.; Wu, X. Obstacle indicators diagnosis and advantage functions zoning optimization based on “Production-Living-Ecological” functions of national territory space in Jilin Province. Sustainability 2022, 14, 4215. [Google Scholar] [CrossRef]
- Han, B.; Jin, X.; Zhao, Q.; Chen, H. Spatiotemporal patterns and mechanisms of land-use conflicts affecting high-quality development in China. Appl. Geogr. 2023, 155, 103093. [Google Scholar] [CrossRef]
- Huang, C.; Zhao, D.; Liu, C.; Liao, Q. Integrating territorial pattern and socioeconomic development into ecosystem service value assessment. Environ. Impact Assess. Rev. 2023, 101, 107236. [Google Scholar] [CrossRef]
- Liao, G.; He, P.; Gao, X.; Lin, Z.; Huang, C.; Zhou, W.; Deng, O.; Xu, C.; Deng, L. Land use optimization of rural production–living–ecological space at different scales based on the BP–ANN and CLUE–S models. Ecol. Indic. 2022, 139, 108911. [Google Scholar] [CrossRef]
- Fu, B.; Wu, X.; Wang, Z.; Wu, X.; Wang, S. Coupling human and natural systems for sustainability: Experiences from China’s Loess Plateau. Earth Syst. Dyn. Discuss. 2022, 13, 795–808. [Google Scholar] [CrossRef]
- Tan, J.; Duan, Q.; Xiao, C.; He, C.; Yan, X. A brief review of the coupled human-Earth system modeling: Current state and challenges. Anthr. Rev. 2023, 10, 664–684. [Google Scholar] [CrossRef]
- Li, S.; Zhao, X.; Pu, J.; Miao, P.; Wang, Q.; Tan, K. Optimize and control territorial spatial functional areas to improve the ecological stability and total environment in karst areas of Southwest China. Land Use Policy 2021, 100, 104940. [Google Scholar] [CrossRef]
- Li, Y.; Ma, X.; Zhao, J.; Zhang, S.; Liu, C. Spatio-Temporal Evolution and Conflict Diagnosis of Territorial Space in Mountainous–Flatland Areas from a Multi-Scale Perspective: A Case Study of the Central Yunnan Urban Agglomeration. Land 2025, 14, 703. [Google Scholar] [CrossRef]
- Rossi, C.; Kneubühler, M.; Schütz, M.; Schaepman, M.; Haller, R.; Risch, A. From local to regional: Functional diversity in differently managed alpine grasslands. Remote Sens. Environ. 2020, 237, 111522. [Google Scholar] [CrossRef]
- Schneider, F.D.; Morsdorf, F.; Schmid, B.; Petchey, O.L.; Hueni, A.; Schimel, D.S.; Schaepman, M.E. Mapping functional diversity from remotely sensed morphological and physiological forest traits. Nat. Commun. 2017, 8, 1441. [Google Scholar] [CrossRef]
- Liu, Y.; Tang, W.; He, J.; Liu, Y.; Ai, T.; Liu, D. A land-use spatial optimization model based on genetic optimization and game theory. Comput. Environ. Urban Syst. 2015, 49, 1–14. [Google Scholar] [CrossRef]
- Maleki, J.; Masoumi, Z.; Hakimpour, F.; Coello, C.A.C. A spatial land-use planning support system based on game theory. Land Use Policy 2020, 99, 105013. [Google Scholar] [CrossRef]
- Hilbe, C.; Simsa, S.; Chatterjee, K.; Nowak, M. Evolution of cooperation in stochastic games. Nature 2018, 559, 246–249. [Google Scholar] [CrossRef]
- Fan, J.; Wang, Y.; Wang, C.; Chen, T.; Jin, F.; Zhang, W.; Li, L.; Xu, Y.; Dai, E.; Tao, A.; et al. Reshaping the sustainable geographical pattern: A major function zoning model and its applications in China. Earth’s Future 2018, 7, 25–42. [Google Scholar] [CrossRef]
- Wang, J.; Hu, Y.; Song, R.; Wang, W. Research on the optimal allocation of ecological land from the perspective of human needs—Taking Hechi City, Guangxi as an example. Int. J. Environ. Res. Public Health 2022, 19, 12418. [Google Scholar] [CrossRef]
- Gao, M.; Hu, Y.; Bai, Y. Construction of ecological security pattern in national land space from the perspective of the community of life in mountain, water, forest, field, lake and grass: A case study in Guangxi Hechi, China. Ecol. Indic. 2022, 139, 108867. [Google Scholar] [CrossRef]
- Liu, S.; Zhao, L. Development and synergetic evolution of the water–energy–food nexus system in the Yellow River Basin. Environ. Sci. Pollut. Res. 2022, 29, 65549–65564. [Google Scholar] [CrossRef]
- Sun, Q.; Wang, J.; Zhang, J.; Xing, Z. Selecting reservoir reconstruction schemes from an ecological-economic trade-off perspective: Model building and case study. J. Clean. Prod. 2022, 370, 133468. [Google Scholar] [CrossRef]
- Zhu, Y.; Zhou, M. Optimization of land use structure integrating ecosystem service function and economic development—A case study in Dongting Lake Ecological and Economic Zone, China. Environ. Sustain. Indic. 2025, 19, 100387. [Google Scholar] [CrossRef]
- Niu, M.; Wang, Y. Greening the economy: How territorial spatial planning policy promotes ecological and economic integration. Environ. Impact Assess. Rev. 2025, 105, 107338. [Google Scholar] [CrossRef]
- Chen, G.; Wang, S. Evaluation of Urban Resource Environmental Carrying Capacity and Land Spatial Development Suitability in a Semiarid Area of the Yellow River Basin. Sustainability 2023, 15, 12411. [Google Scholar] [CrossRef]
- Deco, G.; Kringelbach, M.; Arnatkevičiūtė, A.; Oldham, S.; Sabaroedin, K.; Rogasch, N.; Aquino, K.; Fornito, A. Dynamical consequences of regional heterogeneity in the brain’s transcriptional landscape. Sci. Adv. 2020, 6, eabc5539. [Google Scholar] [CrossRef] [PubMed]
- Ghodsvali, M.; Dane, G.; de Vries, B. An integrated decision support system for the urban food-water-energy nexus: Methodology, modification, and model formulation. Comput. Environ. Urban Syst. 2023, 100, 101940. [Google Scholar] [CrossRef]
- Sadooghi, S.E.; Taleai, M.; Abolhasani, S. Simulation of urban growth scenarios using integration of multi-criteria analysis and game theory. Land Use Policy 2022, 120, 106267. [Google Scholar] [CrossRef]
- Liang, T.; Yang, F.; Luo, Y.; Fang, M.; Huang, X.; Zhang, Z.; Wen, C.; Ren, X. The Synchronous Development Pattern and Type Division of Functional Coupling Coordination and Human Activity Intensity Based on the “Production–Living–Ecological” Space Perspective: A Case Study of Wanzhou District. Land 2022, 11, 1897. [Google Scholar] [CrossRef]
- Ellis, E.C.; Pascual, U.; Mertz, O. Ecosystem services and nature’s contribution to people: Negotiating diverse values and trade-offs in land systems. Curr. Opin. Environ. Sustain. 2019, 38, 86–94. [Google Scholar] [CrossRef]
- Brander, L.; Beukering, P.V.; Nijsten, L.; McVittie, A.; Baulcomb, C.; Eppink, F.; Cado van der Lelij, J.A. The global costs and benefits of expanding Marine Protected Areas. Mar. Policy 2020, 116, 103953. [Google Scholar] [CrossRef]
- Drechsler, M. Flexibility trade-offs in conservation offsets. Conserv. Biol. 2023, 38, e14144. [Google Scholar] [CrossRef]
- Alger, J. The Political Economy of Protected Area Designations: Commercial Interests in Conservation Policy. Glob. Environ. Politics 2023, 23, 54–73. [Google Scholar] [CrossRef]
- Krueger, J.I.; Heck, P.R.; Evans, A.M.; DiDonato, T.E. Social game theory: Preferences, perceptions, and choices. Eur. Rev. Soc. Psychol. 2020, 31, 222–253. [Google Scholar] [CrossRef]
- Prodanović, V.; Bach, P.M.; Stojković, M. Urban nature-based solutions planning for biodiversity outcomes: Human, ecological, and artificial intelligence perspectives. Urban Ecosyst. 2024, 27, 1795–1806. [Google Scholar] [CrossRef]
- Huber, J.; Newig, J.; Loos, J. Participation in protected area governance: A systematic case survey of the evidence on ecological and social outcomes. J. Environ. Manag. 2023, 336, 117593. [Google Scholar] [CrossRef]
- Tilman, A.R.; Plotkin, J.B.; Akçay, E. Evolutionary games with environmental feedbacks. Nat. Commun. 2020, 11, 915. [Google Scholar] [CrossRef] [PubMed]
- Ye, Y.; Qin, Y.; Yu, R.; Wu, Q. Optimization of Chinese land spatial pattern in the transformation process of resource-based cities: A case study in Tongling City, China. Sci. Rep. 2024, 14, 6092. [Google Scholar] [CrossRef] [PubMed]
- Zamberletti, P.; Papaïx, J.; Gabriel, E.; Opitz, T. Markov random field models for vector-based representations of landscapes. Ann. Appl. Stat. 2021, 15, 1801–1822. [Google Scholar] [CrossRef]
- Zou, L.; Zhang, L.; Liang, Y.; Wen, Q. Scientific cognition and research framework of territorial space function in the New Era. J. Nat. Resour. 2022, 37, 3060–3072. [Google Scholar] [CrossRef]
- Ou, D.; Wu, N.; Li, Y.; Ma, Q.; Zheng, S.; Li, Q.; Yu, D.; Tang, H.; Gao, X. Delimiting Ecological Space and Simulating Spatial-temporal Changes in Its Ecosystem Service Functions based on a Dynamic Perspective: A Case Study on Qionglai City of Sichuan Province, China. J. Resour. Ecol. 2022, 13, 1128–1142. [Google Scholar] [CrossRef]
- Zhang, R.; Tian, G.; Borowiak, K.; Lisiak-Zielińska, M.; Lei, Y.; Yang, M.; Tian, Y.; Zhao, R.; Yan, J.; Mu, B. Measuring the evolutionary game process among three functional space types at the county scale in Henan Province, China. Cities 2023, 142, 104654. [Google Scholar] [CrossRef]
- Qu, Y.; Wang, S.; Tian, Y.; Jiang, G.; Zhou, T.; Meng, L. Territorial spatial planning for regional high-quality development—An analytical framework for the identification, mediation and transmission of potential land utilization conflicts in the Yellow River Delta. Land Use Policy 2023, 125, 106462. [Google Scholar] [CrossRef]
- Zadeh, L.A. Fuzzy sets. Inf. Control. 1965, 8, 338–353. [Google Scholar] [CrossRef]
- Burbano-Moreno, A.A.; Mayrink, V.D. Spatial functional data analysis: Irregular spacing and bernstein polynomials. Spat. Stat. 2024, 60, 100832. [Google Scholar] [CrossRef]
- Su, C.; Hu, X.; Meng, Q.; Zhang, L.; Shi, W.; Zhao, M. A multimodal fusion framework for urban scene understanding and functional identification using geospatial data. Int. J. Appl. Earth Obs. Geoinf. 2024, 127, 103563. [Google Scholar] [CrossRef]
- Wang, X.; Wang, D.; Wu, S.; Yan, Z.; Han, J. Cultivated land multifunctionality in undeveloped peri-urban agriculture areas in China: Implications for sustainable land management. J. Environ. Manag. 2023, 325, 116500. [Google Scholar] [CrossRef] [PubMed]
- Cococcioni, M.; Fiaschi, L.; Lambertini, L. Non-Archimedean zero-sum games. J. Comput. Appl. Math. 2021, 393, 113483. [Google Scholar] [CrossRef]
- Wu, D.; Lisser, A. Using CNN for solving two-player zero-sum games. Expert Syst. Appl. 2022, 204, 117545. [Google Scholar] [CrossRef]
- Holling, C.S. Resilience and stability of ecological systems. Annu. Rev. Ecol. Syst. 1973, 4, 1–23. [Google Scholar] [CrossRef]
- Turner, M.G. Landscape ecology: The effect of pattern on process. Annu. Rev. Ecol. Syst. 1989, 20, 171–197. [Google Scholar] [CrossRef]
- Luck, M.; Wu, J. A Gradient Analysis of Urban Landscape Pattern: A Case Study from the Phoenix Metropolitan Region, Arizona, USA. Landsc. Ecol. 2002, 17, 327–339. [Google Scholar] [CrossRef]
- Cabral, A.I.; Costa, F.L. Land Cover Changes and Landscape Pattern Dynamics in Senegal and Guinea Bissau Borderland. Appl. Geogr. 2017, 82, 115–128. [Google Scholar] [CrossRef]
- Wu, J. Landscape sustainability science: Ecosystem services and human well-being in changing landscapes. Landsc. Ecol. 2021, 36, 639–664. [Google Scholar] [CrossRef]
- McGarigal, K.; Marks, B.J. FRAGSTATS: Spatial Pattern Analysis Program for Quantifying Landscape Structure; General Technical Report PNW-GTR-351; U.S. Department of Agriculture, Forest Service, Pacific Northwest Research Station: Portland, OR, USA, 1995. [CrossRef]
- Gustafson, E.J. Quantifying Landscape Spatial Pattern: What Is the State of the Art? Ecosystems 1998, 1, 143–156. [Google Scholar] [CrossRef]
- Li, H.; Reynolds, J.F. On definition and quantification of heterogeneity. Oikos 1995, 73, 280–284. [Google Scholar] [CrossRef]
- Zhang, D.; Wang, W.; Zheng, H.; Ren, Z.; Zhai, C.; Tang, Z.; Shen, G.; He, X. Effects of urbanization intensity on forest structural-taxonomic attributes, landscape patterns and their associations in Changchun, Northeast China: Implications for urban green infrastructure planning. Ecol. Indic. 2017, 80, 286–296. [Google Scholar] [CrossRef]
- Xie, Z.; Han, Y.; Sun, L.; Ping, J. Analysis of land cover evolution within the built-up areas of provincial capital cities in northeastern China based on nighttime light data and Landsat data. PLoS ONE 2020, 15, e0239371. [Google Scholar] [CrossRef] [PubMed]
- Ou, D.; Zhang, Q.; Wu, Y.; Qin, J.; Xia, J.; Deng, O.; Gao, X.; Bian, J.; Gong, S. Construction of a territorial space classification system based on spatiotemporal heterogeneity of land use and its superior territorial space functions and their dynamic coupling: Case study on Qionglai City of Sichuan Province, China. Int. J. Environ. Res. Public Health 2021, 18, 9052. [Google Scholar] [CrossRef]
- Ou, D.; Zhang, Q.; Qin, J.; Gong, S.; Wu, Y.; Zheng, Z.; Xia, J.; Bian, J.; Gao, X. Classification system for county-level territorial space using spatiotemporal heterogeneity and dynamic coupling of land use and functionality. Trans. Chin. Soc. Agric. Eng. (Trans. CSAE) 2021, 37, 284–296. [Google Scholar] [CrossRef]
- IPCC (Intergovernmental Panel on Climate Change). 2006 IPCC Guidelines for National Greenhouse Gas Inventories, Prepared by the National Greenhouse Gas Inventories Programme; Eggleston, H.S., Buendia, L., Miwa, K., Ngara, T., Tanabe, K., Eds.; IPCC: Hayama, Japan, 2006. Available online: https://www.osti.gov/etdeweb/biblio/20880391 (accessed on 1 October 2025).
- IPCC (Intergovernmental Panel on Climate Change). 2019 Refinement to the 2006 IPCC Guidelines for National Greenhouse Gas Inventories; Calvo Buendia, E., Tanabe, K., Kranjc, A., Baasansuren, J., Fukuda, M., Ngarize, S., Osako, A., Pyrozhenko, Y., Shermanau, P., Federici, S., Eds.; IPCC: Geneva, Switzerland, 2019; Available online: https://www.ipcc-nggip.iges.or.jp/public/2019rf/index.html (accessed on 1 October 2025).
- Wang, X.; Ou, D.; Shu, C.; Liu, Y.; Yan, Z.; La, M.; Xia, J. How Can We Achieve Carbon Neutrality During Urban Expansion? An Empirical Study from Qionglai City, China. Land 2025, 14, 1689. [Google Scholar] [CrossRef]
- Liu, H.C.; You, J.X.; You, X.Y.; Shan, M.M. A novel approach for failure mode and effects analysis using combination weighting and fuzzy VIKOR method. Appl. Soft Comput. 2015, 28, 579–588. [Google Scholar] [CrossRef]
- Zhang, Y.J.; Li, A.J.; Fung, T. Using GIS and multi-criteria decision analysis for conflict resolution in land use planning. Procedia Environ. Sci. 2012, 13, 2264–2273. [Google Scholar] [CrossRef]
- Xu, H.; Ma, C.; Lian, J.; Xu, K.; Chaima, E. Urban flooding risk assessment based on an integrated k-means cluster algorithm and improved entropy weight method in the region of Haikou, China. J. Hydrol. 2018, 563, 975–986. [Google Scholar] [CrossRef]
- Luo, W.; Ren, Y.; Shen, L.; Zhu, M.; Jiang, Y.; Meng, C.; Zhang, P. An evolution perspective on the urban land carrying capacity in the urbanization era of China. Sci. Total Environ. 2020, 744, 140827. [Google Scholar] [CrossRef]
- Zhu, W.; Pan, Y.; Zhang, J. Estimation of net primary productivity of Chinese terrestrial vegetation based on remote sensing. J. Plant Ecol. 2007, 31, 413–424. [Google Scholar] [CrossRef]
- Ma, S.; Wen, Z. Optimization of land use structure to balance economic benefits and ecosystem services under uncertainties: A case study in Wuhan, China. J. Clean. Prod. 2021, 311, 127537. [Google Scholar] [CrossRef]
- Chen, X.; Wang, D.; Chen, J.; Wang, C.; Shen, M. The mixed pixel effect in land surface phenology: A simulation study. Remote Sens. Environ. 2018, 211, 338–344. [Google Scholar] [CrossRef]
- Wang, Q.; Wang, S. Is energy transition promoting the decoupling economic growth from emission growth? Evidence from the 186 countries. J. Clean. Prod. 2020, 260, 120768. [Google Scholar] [CrossRef]
- Wang, Q.; Su, M. The effects of urbanization and industrialization on decoupling economic growth from carbon emission—A case study of China. Sustain. Cities Soc. 2019, 51, 101758. [Google Scholar] [CrossRef]
- Wu, Y.; Tam, V.W.Y.; Shuai, C.; Shen, L.; Zhang, Y.; Liao, S. Decoupling China’s economic growth from carbon emissions: Empirical studies from 30 Chinese provinces (2001–2015). Sci. Total Environ. 2019, 656, 576–588. [Google Scholar] [CrossRef] [PubMed]
- Zhao, R.Q.; Huang, X.J.; Zhong, T.Y.; Cui, X.W. Carbon effect evaluation and low-carbon optimization of regional land use structure. J. Agric. Eng. 2013, 29, 220–229. [Google Scholar] [CrossRef]
- Zhu, E.; Deng, J.; Zhou, M.; Gan, M.; Jiang, R.; Wang, K.; Shahtahmassebi, A. Carbon emissions induced by land-use and land-cover change from 1970 to 2010 in Zhejiang, China. Sci. Total Environ. 2019, 646, 930–939. [Google Scholar] [CrossRef]
- Zhao, R.; Huang, X.; Liu, Y.; Zhong, T.; Ding, M.; Chuai, X. Carbon emission of regional land use and its decomposition analysis: Case study of Nanjing City, China. Chin. Geogr. Sci. 2015, 25, 198–212. [Google Scholar] [CrossRef]
- Zhao, R.; Huang, X.; Peng, B. Research on carbon cycle and carbon balance of Nanjing urban system. Acta Geogr. Sin. 2012, 67, 758–770. [Google Scholar] [CrossRef]
- Piao, S.L.; Fang, J.Y.; Philippe, C.; Philippe, P.; Huang, Y.; Stephen, S.; Wang, T. The carbon balance of terrestrial ecosystems in China. Nature 2009, 458, 1009–1013. [Google Scholar] [CrossRef] [PubMed]
- Cai, Z.; Kang, G.; Tsuruta, H.; Mosier, A. Estimate of CH4 emissions from year-round flooded rice fields during rice growing season in China. Pedosphere 2005, 15, 66–71. [Google Scholar]
- He, Y.; Dan, L.; Dong, W.; Ji, J.; Qin, D. The terrestrial NPP simulations in China since Last Glacial Maximum. Chin. Sci. Bull. 2005, 50, 2074–2079. [Google Scholar] [CrossRef]
- Fang, J.; Guo, Z.; Pu, S.; Chen, A. Terrestrial vegetation carbon sinks in China, 1981–2000. Sci. China Ser. D 2007, 50, 1341–1350. [Google Scholar] [CrossRef]
- Duan, X.N.; Wang, X.K.; Lu, F.; Ouyang, Z.Y. Carbon sequestration and its potential by wetland ecosystems in China. Acta Ecol. Sin. 2008, 28, 463–469. [Google Scholar] [CrossRef]
- Lai, L.; Huang, X.J.; Wang, H.; Dong, Y.H.; Xiao, S.S. Estimation of environmental costs of chemical fertilizer application in China. Acta Pedol. Sin. 2009, 46, 63–69. [Google Scholar] [CrossRef]
- Baggio, R.; Sainaghi, R. Complex and chaotic tourism systems: Towards a quantitative approach. Int. J. Contemp. Hosp. Manag. 2011, 23, 840–861. [Google Scholar] [CrossRef]
- Guan, Y.; Shan, Y.; Huang, Q.; Chen, H.; Wang, D.; Hubacek, K. Assessment to China’s recent emission pattern shifts. Earth’s Future 2021, 9, e2021EF002241. [Google Scholar] [CrossRef]
- Zhai, Y.; Zhai, G.; Chen, Y.; Liu, J. Research on regional terrestrial carbon storage based on the pattern-process-function. Ecol. Inform. 2024, 78, 102497. [Google Scholar] [CrossRef]
- Zou, L.; Liu, Y.; Wang, J.; Yang, Y. An analysis of land use conflict potentials based on ecological-production-living function in the southeast coastal area of China. Ecol. Indic. 2021, 122, 107229. [Google Scholar] [CrossRef]
- Bao, W.; Yang, Y.; Zou, L. How to reconcile land use conflicts in mega urban agglomeration? A scenario-based study in the Beijing-Tianjin-Hebei region, China. J. Environ. Manag. 2021, 294, 112995. [Google Scholar] [CrossRef]
- Fang, Y.-T.; Ai, D.-Y.; Yang, Y.; Sun, W.; Zu, J. Multi-Objective Spatial Suitability Evaluation and Conflict Optimization Considering Productivity, Sustainability, and Livability in Southwestern Mountainous Areas of China. Sustainability 2021, 14, 371. [Google Scholar] [CrossRef]
- Palmer, M.A.; Bernhardt, E.S.; Allan, J.D.; Lake, P.S.; Alexander, G.; Brooks, S.; Carr, J.; Clayton, S.; Dahm, C.N.; Follstad Shah, J.; et al. Standards for ecologically successful river restoration. J. Appl. Ecol. 2005, 42, 208–217. [Google Scholar] [CrossRef]
- Franco, M.A.; Rizzo, L.V.; Teixeira, M.J.; Artaxo, P.; Azevedo, T.; Lelieveld, J.; Nobre, C.A.; Pöhlker, C.; Pöschl, U.; Shimbo, J.; et al. How climate change and deforestation interact in the transformation of the Amazon rainforest. Nat. Commun. 2025, 16, 7944. [Google Scholar] [CrossRef] [PubMed]
- Zhukov, Y.M.; Byers, J.S.; Davidson, M.; Kollman, K. Integrating data across misaligned spatial units. Political Anal. 2023, 31, 267–285. [Google Scholar] [CrossRef]
- Jahan, F.; Kennedy, D.W.; Duncan, E.W.; Mengersen, K. Evaluation of spatial Bayesian Empirical Likelihood models in analysis of small area data. PLoS ONE 2022, 17, e0268130. [Google Scholar] [CrossRef]
- Ding, S.; Liu, S.; Chang, M.; Lin, H.; Lv, T.; Zhang, Y.; Zeng, C. Spatial Optimization of Land Use Pattern toward Carbon Mitigation Targets—A Study in Guangzhou. Land 2023, 12, 1903. [Google Scholar] [CrossRef]
- Shah, P.; Peterson, R.; Jones, S.L.; Ferguson, A.J. Things are not always what they seem: The origins and evolution of intragroup conflict. Adm. Sci. Q. 2020, 65, 1112–1152. [Google Scholar] [CrossRef]
- Luo, B.; Yang, Y.; Liu, D. Policy Iteration Q-Learning for Data-Based Two-Player Zero-Sum Game of Linear Discrete-Time Systems. IEEE Trans. Cybern. 2020, 50, 728–739. [Google Scholar] [CrossRef] [PubMed]
- Sun, J. Two-Person Zero-Sum Stochastic Linear-Quadratic Differential Games. SIAM J. Control Optim. 2020, 58, 1710–1735. [Google Scholar] [CrossRef]
- Govindan, S.; Wilson, R. A global Newton method for computing Nash equilibria. J. Econ. Theory 2003, 110, 65–86. [Google Scholar] [CrossRef]
- Wright, S.J. Primal-Dual Interior-Point Methods; Society for Industrial and Applied Mathematics: Philadelphia, PA, USA, 1997. [Google Scholar] [CrossRef]
- Nesterov, Y.; Nemirovskii, A. Interior-Point Polynomial Algorithms in Convex Programming; Society for Industrial and Applied Mathematics: Philadelphia, PA, USA, 1994. [Google Scholar] [CrossRef]
- Forsgren, A.; Gill, P.E.; Wright, M.H. Interior methods for nonlinear optimization. SIAM Rev. 2002, 44, 525–597. [Google Scholar] [CrossRef]
- Roos, C.; Terlaky, T.; Vial, J.-P. Interior Point Methods for Linear Optimization, 2nd ed.; Springer: Berlin/Heidelberg, Germany, 2006. [Google Scholar] [CrossRef]
- Peng, B.; Sheng, X.; Wei, G. Does environmental protection promote economic development? From the perspective of coupling coordination between environmental protection and economic development. Environ. Sci. Pollut. Res. 2020, 27, 27980–27993. [Google Scholar] [CrossRef]
- Hossin, M.A.; Abudu, H.; Sai, R.; Agyeman, S.; Wesseh, P.K. Examining sustainable development goals: Are developing countries advancing in sustainable energy and environmental sustainability? Environ. Sci. Pollut. Res. 2023, 31, 1–19. [Google Scholar] [CrossRef]
- Liang, C.; Zhang, R.-C.; Zeng, J. Optimizing ecological and economic benefits in areas with complex land-use evolution based on spatial subdivisions. Landsc. Urban Plan. 2023, 233, 104701. [Google Scholar] [CrossRef]
- Zhang, L.; Hu, B.; Hu, W. Study on Territorial Spatial Equilibrium Based on Ecosystem Service Value: A Case Study of the Southwest Guangxi Karst–Beibu Gulf, China. Land Degrad. Dev. 2024, 36, 900–918. [Google Scholar] [CrossRef]
- Song, W.; Cao, S.; Du, M.; He, Z. Aligning territorial spatial planning with sustainable development goals: A comprehensive analysis of production, living, and ecological spaces in China. Ecol. Indic. 2024, 158, 113393. [Google Scholar] [CrossRef]
- Yang, Y.; Yang, M.; Zhao, B.; Lu, Z.; Sun, X.; Zhang, Z. Spatially explicit carbon emissions from land use change: Dynamics and scenario simulation in the Beijing-Tianjin-Hebei urban agglomeration. Land Use Policy 2025, 137, 107001. [Google Scholar] [CrossRef]
- Wang, S.; Liu, C.; Zhou, Z. Government-enterprise green collaborative governance and urban carbon emission reduction: Empirical evidence from green PPP programs. Environ. Res. 2024, 246, 119484. [Google Scholar] [CrossRef] [PubMed]
- Bodin, Ö. Collaborative environmental governance: Achieving collective action in social-ecological systems. Science 2017, 357, eaan1114. [Google Scholar] [CrossRef] [PubMed]
- Mi, Z.; Coffman, D. The sharing economy promotes sustainable societies. Nat. Commun. 2019, 10, 1214. [Google Scholar] [CrossRef] [PubMed]
- Li, X.; Lu, Z. Exploring the balance between ecosystem services and economic benefits via multi-objective land use optimization. Land 2025, 14, 920. [Google Scholar] [CrossRef]
- Zheng, W.; Ke, X.; Xiao, B.; Zhou, T. Optimising land use allocation to balance ecosystem services and economic benefits: A case study in Wuhan, China. J. Environ. Manag. 2019, 251, 109613. [Google Scholar] [CrossRef]
- Wang, H.; Yang, Z.; Saito, Y.; Liu, J.P.; Sun, X.; Wang, Y. Stepwise decreases of the Huanghe (Yellow River) sediment load (1950–2005): Impacts of climate change and human activities. Glob. Planet. Change 2007, 57, 331–354. [Google Scholar] [CrossRef]
- Miao, C.; Ni, J.; Borthwick, A.G.L.; Yang, L. A preliminary estimate of human and natural contributions to the changes in water discharge and sediment load in the Yellow River. Glob. Planet. Change 2011, 76, 196–205. [Google Scholar] [CrossRef]
- Balakrishnan, K.; Dey, S.; Gupta, T.; Dhaliwal, R.S.; Brauer, M.; Cohen, A.J.; Stanaway, J.D.; Beig, G.; Joshi, T.K.; Aggarwal, A.N.; et al. The impact of air pollution on deaths, disease burden, and life expectancy across the states of India: The Global Burden of Disease Study 2017. Lancet Planet. Health 2019, 3, e26–e39. [Google Scholar] [CrossRef]
- Kehoe, L.; Romero-Muñoz, A.; Polaina, E.; Estes, L.; Kreft, H.; Kuemmerle, T. Biodiversity at risk under future cropland expansion and intensification. Nat. Ecol. Evol. 2017, 1, 1129–1135. [Google Scholar] [CrossRef]


Disclaimer/Publisher’s Note: The statements, opinions and data contained in all publications are solely those of the individual author(s) and contributor(s) and not of MDPI and/or the editor(s). MDPI and/or the editor(s) disclaim responsibility for any injury to people or property resulting from any ideas, methods, instructions or products referred to in the content. |
© 2025 by the authors. Licensee MDPI, Basel, Switzerland. This article is an open access article distributed under the terms and conditions of the Creative Commons Attribution (CC BY) license (https://creativecommons.org/licenses/by/4.0/).