Abstract
Over the past three decades, the Yangtze River Delta has undergone a rapid urbanization phenomenon, resulting in pronounced urban sprawl that has significantly impacted regional sustainable development and air quality. This study constructs an urban sprawl index based on nighttime light data spanning 2000–2020 and employs exploratory spatio-temporal analysis, panel data models, and spatial econometric models to examine the evolution of urban sprawl and its effects on PM2.5 concentrations. The results reveal four key findings: (1) Urban sprawl is spatially heterogeneous, exhibiting a ‘high in the centre-east, low in the north-west’ pattern, with high-intensity sprawl expanding from the central region towards the north-west and south-west; (2) The dominant growth pattern is characterized by relatively rapid expansion. The global Moran’s I index fluctuates between 0.428 and 0.214, indicating a gradual decline in the global clustering effect of urban sprawl. Meanwhile, the share of local high–high agglomeration zones decreases to 21.9%, whereas low–low zones increase to 24.3%; (3) Spatio-temporal transitions of urban sprawl show strong spatial dependence while overall relocation exhibits inertia; (4) Before the implementation of the Ten Key Measures for Air Pollution Prevention and Control in 2013, urban sprawl significantly intensified PM2.5 pollution. Following the policy, this relationship notably reversed, with sprawl exhibiting pollution-mitigating effects in certain regions. The spatial diffusion of pollution is evident, as urban sprawl influences air quality through both local development and inter-regional interactions. This study provides an in-depth analysis of the spatio-temporal evolution of urban sprawl and establishes a framework to examine the interactive mechanisms between urban expansion and air pollution, thereby broadening perspectives on atmospheric pollution research and offering scientific and policy guidance for sustainable land use and air quality management in the Yangtze River Delta.
1. Introduction
Since the initiation of China’s reform and opening-up, the Yangtze River Delta region has undergone rapid urbanization [1], characterized by continuous spatial expansion and sustained population growth. However, the rate of land urbanization has significantly outpaced that of population urbanization [2], resulting in extensive, low-density outward expansion of urban areas into peripheral regions [3]. Urban sprawl, characterized by the expansion of urban land use and intensified human activities, has increasingly exerted significant pressure on the regional atmospheric environment, with PM2.5 pollution emerging as the most prominent manifestation [4].
Urban sprawl has long been a focus of academic inquiry, with scholars both in China and abroad conducting extensive research on its measurement methods, spatio-temporal dynamics, and influencing factors. In terms of measurement, both single-dimensional and multi-dimensional indicators have been employed. While single indicators are straightforward to implement, they often fall short in capturing the complex spatial patterns of urban expansion. Consequently, the multi-dimensional framework proposed by Fallah [5] has become the prevailing approach in current studies, as it more comprehensively reflects urban spatial characteristics. In exploring the spatio-temporal evolution of urban sprawl, a range of analytical methods has been widely adopted, including remote sensing tracking [6], time-series analysis [7], and spatial autocorrelation models [8]. For example, Seto et al. [9] applied remote sensing and GIS tools to analyse the spatial and temporal distribution of urban sprawl; HAO L. et al. [10] used multi-period remote sensing data to investigate the historical sprawl patterns in Shanghai; and Li Q. et al. [11] integrated socio-economic and urban development data to examine the sequence of spatiotemporal changes. Over time, the spatial scale of such research has shifted from broader national or provincial levels [12] to more localized analyses at the city level [13], with growing emphasis on key regions such as the Yangtze River Basin [14] and the Yellow River Basin [15], where urban expansion is particularly pronounced. In parallel, studies on the driving forces of urban sprawl have focused on a range of socio-economic variables—such as economic development, industrial structure, population density, and transportation infrastructure [16,17]—as well as environmental factors including PM2.5 concentrations and carbon emissions. Although numerous studies have examined the effects of urban sprawl on PM2.5, several consistent findings have emerged. For instance, Sarigiannis et al. [18] reported that urban sprawl can exacerbate traffic-related pollution, increasing residents’ exposure risk. Tao et al. [19], using gridded PM2.5 concentration data, identified an inverted “U-shaped” relationship between urban sprawl and haze pollution, while Wu et al. [20] demonstrated that compact urban forms can effectively mitigate pollution levels. Beyond these environmental factors, government policies play a critical role in shaping urban sprawl patterns. Morán Uriel et al. [21], for example, examined how state policies in China influence the real estate market, urban expansion, and population distribution, as well as the interplay with community development. Similarly, Wang et al. [22,23] showed that China’s Zero-Waste City policy not only directly reduces PM2.5 emissions but also indirectly mitigates air pollution by promoting green innovation. Meanwhile, the New-Type Urbanization Policy has improved land use efficiency and innovation capacity, thereby affecting urban population distribution and community development, and contributing to further reductions in PM2.5 concentrations. Despite these advances, most existing studies focus primarily on major cities and rarely account for policy phase effects or spatial spillovers, highlighting the need for more comprehensive regional analyses.
As one of China’s most economically developed regions, the Yangtze River Delta is an important area for studying urban sprawl and its environmental impacts. Considering the region’s distinctive urbanization patterns and spatial structures, and drawing on both domestic and international research, this study investigates the spatiotemporal dynamics of urban expansion and its relationship with PM2.5. The results are intended to inform strategies for optimizing urban spatial layouts, promoting efficient land use, and enhancing air quality management, while also providing a scientific basis for advancing new urbanization initiatives and supporting ecological civilization development.
2. Research Data and Methods
2.1. Study Area
The Yangtze River Delta region (Figure 1) comprises 40 prefecture-level cities from three provinces—Anhui, Jiangsu, and Zhejiang—in addition to the centrally administered municipality of Shanghai, totaling 41 cities. As one of China’s three major urban agglomerations, it lies in the lower reaches of the Yangtze River basin, bordering the East China Sea and the Yellow Sea. With a permanent population of approximately 238 million, the region spans 358,000 square kilometers. As one of China’s most economically developed and highly urbanized regions, its urban spatial expansion continues at a rapid pace, resulting in extensive encroachment upon ecological land. The ecological carrying capacity of certain areas is approaching its limits, while the adverse factors accumulated through rapid urban development have constrained the region’s sustainable development [24].
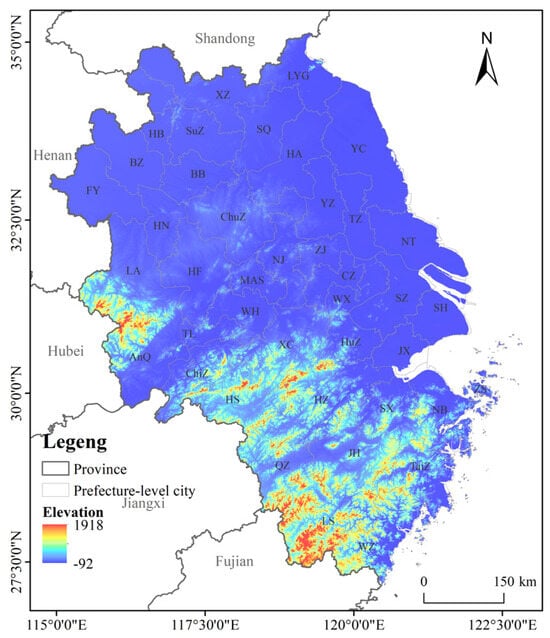
Figure 1.
Administrative Boundaries and Geographical Location of the Study Area. Note: The map is produced based on the standard map (review number GS(2019)1822) from the Ministry of Natural Resources’ Standard Map Service website. The base map boundaries remain unmodified. Figures 2–6 are generated based on the same study area and share a consistent mapping framework; City abbreviations are listed in Appendix A.
2.2. Data Sources
Data sources for this study include:
- (1)
- Night-time light data. This data is sourced from the annual DMSP/OLS stable nighttime light data obtained from the study Annual-scale DMSP/OLS stable night-time light data (Defense Meteorological Satellite Program’s Operational Linescan System, DMSP/OLS) acquired for the period 2000–2013, featuring pixel grey values of 0–63, annual temporal resolution, and 1 km × 1 km spatial resolution. Annual-scale NPP/VIIRS night-time light data (Suomi National Polar-Orbiting Partnership satellite with the Visible Infrared Imaging Radiometer Suite, NPP/VIIRS) acquired for the period 2012–2020, featuring a spatial resolution of 0.5 km × 0.5 km. Using NPP/VIIRS night-time light data as the benchmark, the two night-time light imagery sets underwent mutual calibration, continuity correction, saturation correction, projection transformation, and resampling. This process established a spatio-temporal raster dataset of night-time lights for 2000–2020 [25,26].
- (2)
- PM2.5 concentration data: The 2000–2020 PM2.5-1 km high-resolution monthly average mass concentration spatiotemporal distribution raster data used herein originate from the China Atmospheric Composition Near-Real-Time Tracking (TAP) Data Resource Network (http://tapdata.org.cn/, accessed on 16 July 2025). This dataset is jointly created and maintained by Tsinghua University in collaboration with Nanjing University, Peking University, Fudan University, the Chinese Academy of Meteorological Sciences, and numerous other academic institutions. Its purpose is to integrate diverse data sources—including satellite remote sensing information, ground-based observational data, model simulation results, and emission inventories—to construct a multidimensional, near-real-time dataset covering atmospheric pollutant concentrations and atmospheric aerosol concentration information across China. By providing foundational data, TAP supports scientific research into the health impacts of air pollution, environmental management, and the evaluation of policies aimed at reducing atmospheric pollution [27,28].
- (3)
- Other Variable Data: Variables such as GDP, population, built-up area, and green coverage rate were sourced from China’s national and provincial statistical yearbooks. Vector data delineating provincial and municipal boundaries were obtained from the National Geographic (https://www.webmap.cn, accessed on 20 July 2025).
2.3. Research Methodology
2.3.1. Urban Sprawl Index Measurement Coefficients
To determine the threshold for urban area extraction, we selected the base year of 2003 and used the corresponding nighttime light (NTL) data. First, raster cells with the same digital number (DN)—representing the pixel-level light intensity—were grouped and sorted in descending order. The cumulative area corresponding to these DN values was then compared with the built-up area reported in the 2003 Statistical Yearbook. The DN value that minimized the difference between the NTL-derived and statistical urban area was selected as the extraction threshold. As a result, a DN value of 5 was chosen to delineate the urban extent.
Subsequently, we further divided the extracted urban areas based on the average DN value in 2003. We calculated the total digital number (TDN), defined as the sum of DN values within the urban extent, and classified regions into high-intensity (DN > average) and low-intensity (DN < average) areas accordingly.
(1) Vertical Sprawl Index. Drawing on existing approaches for measuring urban sprawl [29], this study defines areas with DN exceeding 30 as highly urbanized zones, which serve as the focus for vertical sprawl analysis. The vertical sprawl index is calculated as follows:
where LPi denotes the proportion of total light intensity in city i that falls below the national average DN value, and HPi denotes the proportion of light intensity exceeding the national average within the urbanized area. A weight of 0.5 is applied, as recommended by Chen and Wu et al. [30,31].
(2) Horizontal Sprawl Index. While Equation (2) captures the internal light intensity distribution within urban areas, this study further introduces a horizontal sprawl index based on the spatial extent of nighttime lights:
where LAi represents the share of urban land area in city i with DN values below the national average, and HAi represents the share with DN values above the national average, both relative to the total urbanized area.
(3) Comprehensive Urban Sprawl Index (USI). Finally, by integrating vertical and horizontal dimensions of urban sprawl, the overall sprawl index spi is constructed as follows:
where spi ranges from 0 to 1, with values closer to 1 indicating a higher degree of urban sprawl.
2.3.2. Urban Sprawl Accuracy Verification Model
The expansion of urban built-up areas is accompanied by growth in the urban population. Therefore, when measuring urban sprawl, both the expansion of built-up areas and the growth of the urban population should be considered. Urban sprawl is defined as the phenomenon that occurs when the rate of urban spatial growth exceeds the rate of population growth. Consequently, this study employs a single-indicator method to calculate the urban sprawl index. To assess the accuracy of the urban sprawl index constructed using nighttime light data, we follow the approach of [32] by constructing a single-indicator urban sprawl index based on population and built-up area data for each city and comparing it with the nighttime light-derived urban sprawl index. Using 2003 as the base year, the formula for calculating the urban sprawl index is as follows:
In the formula: ssp denotes the urban sprawl index (USI) calculated using statistical data; Ait and Ai1 represent the built-up area of city i in year t and the baseline built-up area of city i, respectively; Pit and Pi1 denote the population of city i in year t and the baseline population of city i, respectively. When the urban population growth rate falls below the growth rate of the built-up area, the value of ssp exceeds 1, indicating urban sprawl. When the urban population growth rate exceeds the built-up area growth rate, ssp is less than 1, indicating the city follows a compact development pattern. When the urban population growth rate equals the built-up area growth rate, ssp equals 1, signifying no urban sprawl.
Based on the urban sprawl index calculated from the aforementioned statistical data, analyze its correlation with the urban sprawl index derived from night-time light data [33]. This will validate the applicability of the urban sprawl index calculated from night-time light data. The specific formula is as follows:
In the equation, sspit denotes the urban sprawl index (USI) for city i in year t calculated from statistical data; spit denotes the urban sprawl index for city i in year t calculated from night-time light data; Controljit represents the set of control variables; μi, φt, and εit, respectively, denote the city fixed effect, time fixed effect, and random fixed term.
2.3.3. Slope Method
This study employs the Slope method to analyse urban sprawl evolution trends [34]. First, linear regression calculations are performed using the ArcGIS 10.8 software’s Raster Calculator tool to determine the increase or decrease in urban sprawl. Subsequently, the Reclassify tool is used to classify urban sprawl levels. The Slope method calculation formula is shown in Equation (6):
where Slope denotes the slope of the urban sprawl index regression equation for each study unit, SI represents the urban sprawl index, SIi denotes the average SI value for year I, n denotes the duration of the study period.
2.3.4. Spatial Autocorrelation Analysis
This study employs Moran’s I index and hotspot analysis to examine the spatial correlation characteristics of urban sprawl in the Yangtze River Delta, systematically investigating spatial autocorrelation.
The global Moran’s I index serves as a statistical measure of spatial autocorrelation, quantifying the degree of spatial clustering or dispersion of variables within a study area [35]. Its calculation Formula (7) is as follows:
where n denotes the number of regions, xi and xj represent the carbon emissions of regions i and j, respectively, is the average urban sprawl value across all regions, and Wij is the spatial weighting matrix for neighbouring regions i and j. A positive index value indicates spatial clustering effects in urban sprawl; a value close to zero suggests no significant spatial correlation in urban sprawl; a negative value indicates spatial dispersion effects in carbon emissions.
The Local Moran’s I index is a statistical measure for assessing local spatial autocorrelation, quantifying the similarity or dissimilarity between a specific spatial unit and its neighboring units within a study area [36]. This study employs the Local Moran’s I index to analyse the local spatial dependence and clustering patterns of urban sprawl in the Yangtze River Delta region. The calculation Formula (8) is as follows:
where Ii denotes the local Moran’s I value for region i, n represents the number of regions, xi and xj denote carbon emissions for regions i and j, respectively, is the average carbon emissions across all regions, and Wij is the spatial weight matrix for neighboring regions i and j.
2.3.5. Local Indicators of Spatial Association (LISA) Time Path
In spatial analysis, the LISA time path integrates the temporal dimension to characterise the dynamic migration trajectory of LISA coordinates within Moran’s scatter plots. By examining variations in urban sprawl index values and spatial lag values across prefecture-level cities in the Yangtze River Delta region, this approach measures the stability of LISA coordinates for each prefecture-level city. This serves to elucidate the spatiotemporal co-variation in urban sprawl indices within local spatial units, alongside local spatial heterogeneity and spatiotemporal dynamics. Its geometric characteristics encompass path length, curvature, and transition direction [37].
The LISA temporal path length reveals dynamic features of the local spatial structure in the Yangtze River Delta. Its calculation formula is given by Equation (9):
where Γ denotes the temporal path length; Li,t represents the coordinates of city i in the Moran scatter plot at year t; d(Li,t, Li,t+1) indicates the displacement distance of city i between years t and t + 1; T signifies the annual time interval; and n denotes the number of cities.
LISA temporal path curvature is employed to investigate the fluctuating characteristics of the local spatial structure within the Yangtze River Delta. Its calculation formula is given in Equation (10):
where ƒ denotes the temporal path curvature; d(Li,Li,T) represents the cumulative distance travelled by prefecture-level city unit i from the initial to the final year.
2.3.6. Local Indicators of Spatial Association (LISA) Spatiotemporal Transitions
LISA spatiotemporal transitions describe the changes in spatial association types among urban units [38]. These transitions are categorized into four types: I (Stable), II (Transition-Stable), III (Stable-Transition), and IV (Transition). Type I denotes no spatial association transformation in either the unit itself or its neighbors; Type II indicates a transition occurring within the unit while its neighbors remain stable; and Type III signifies a transition occurring in the unit while its neighbors become stable. Type I indicates neither the unit itself nor its neighboring units undergo spatial association type transformation; Type II signifies the unit itself transitions while its neighbors remain stable; Type III denotes the unit itself remains stable while its neighbors’ transition; and Type IV indicates that both the unit itself and its neighbors undergo transition.
2.3.7. Multiple Regression Model
To investigate the impact of urban sprawl and other economic variables on PM2.5 concentrations, it is necessary to consider the linear relationship between a dependent variable and multiple independent variables, i.e., establishing a multiple linear regression model [39]. The model panel is shown in Equation (11):
where i denotes a specific city; t denotes a particular year; Pit represents the average PM2.5 concentration in city i during year t, signifying PM2.5 pollution, measured in μg/m3; Sit denotes the Urban Sprawl Index (USI) of city i in year t, a dimensionless index ranging from 0 to 1; PSGDPit denotes the GDP per square kilometer in city i in year t, measured in million CNY/km2; INDUSit denotes the proportion of the industrial structure (five-dimensional spatial relationships encompassing production factors within industries, inter-industry dynamics, and spatial, temporal, and hierarchical dimensions) for city i in year t, expressed as a percentage (%); SFDIit indicates the amount of spatially distributed foreign direct investment in city i during year t, measured in 100 million CNY; POPit represents the urban scale of city i in year t, measured in 10,000 persons; β0 denotes the constant term, while β1, β2, β3, β4, and β5 are elasticity coefficients to be estimated; constitutes the random error term. Given that the 2013 Action Plan for Air Pollution Prevention and Control served as a watershed for national air quality governance, the study period is divided into two phases: pre-policy implementation (2000–2012) and post-policy implementation (2013–2020). A phased regression model is constructed to identify temporal heterogeneity in the relationship between urban sprawl and PM2.5, highlighting the differential impact of policy interventions on pollution mechanisms. To reduce potential distortions and improve comparability, all variables were transformed using natural logarithms. The key descriptive statistics for the transformed data are summarized in Table 1.

Table 1.
Descriptive Statistics.
2.3.8. Spatial Econometric Model
Both urban sprawl and PM2.5 are influenced by spatial factors. Given the spatial heterogeneity of PM2.5, a basic econometric model alone is inadequate to fully capture the effects of urban sprawl on PM2.5 concentrations. Therefore, this study incorporates spatial factors into the model by constructing a Durbin spatial regression model [40], with the calculation formula as follows (12):
where Y denotes the dependent variable in the model; X represents the explanatory variables; W signifies the spatial weighting matrix for each variable in the spatial Durbin model; β indicates the coefficients of the explanatory variables in the model; ρ denotes the spatial effect coefficient of the dependent variable in the model; θ represents the spatial lag coefficient in the model; and ε signifies the random error term.
2.3.9. Methodological Reflections and Limitation
Despite the analytical robustness of the methods applied in this study, several limitations should be noted. First, the urban sprawl index constructed from nighttime light data, while suitable for long-term and large-scale spatial analysis, may not adequately reflect fine-grained variations in land use intensity or intra-urban functional differentiation. Future work could improve spatial resolution by integrating multisource remote sensing data or cadastral information. Second, although the LISA-based spatiotemporal trajectory analysis effectively captures changes in spatial clustering patterns, it offers limited capacity for identifying causal pathways or accounting for the temporal dynamics of interaction between urban sprawl and air pollution. Third, the spatial Durbin model, though well-suited to capturing spatial spillovers and indirect effects, relies on linear assumptions and may not fully represent the complex, potentially nonlinear relationships between urban expansion, socioeconomic factors, and environmental outcomes. In addition, fixed-effects estimators used in the panel regression framework help control for unobserved heterogeneity across cities and over time, but they do not fully address possible endogeneity or measurement errors in key explanatory variables. These limitations highlight the need for future research to adopt more flexible modeling strategies—such as nonlinear or hierarchical frameworks—and to validate findings through alternative sprawl indicators and data-driven approaches.
3. Results and Discussion
3.1. Accuracy Assessment of Urban Sprawl Index Based on Nighttime Light Measurements
To assess the accuracy of the urban sprawl index constructed using night-time light data, this paper employed the aforementioned single-indicator urban sprawl index for verification [33]. The validation results are presented in Table 2.
Table 2.
Accuracy validation results for the urban sprawl index based on night-time light data.
Column (2) in the table shows that the Hausman test strongly rejects the null hypothesis of no difference between the fixed-effects model and random-effects model, indicating superiority of the fixed-effects model. Within this model, the regression coefficient for the urban sprawl index derived from night-time light data is positive and passes the significance test at the 1% level. This indicates that the statistical urban sprawl index can be replaced by the night-time light data urban sprawl index, demonstrating high measurement precision.
This paper further employs a dynamic SYS-GMM model to validate the robustness of the aforementioned results. Columns (3) and (4) of Table 2 reveal that AR (1) values are all below 0.01, while AR (2) values exceed 0.1, indicating the absence of second-order serial correlation in the residual sequence of the difference equation. Subsequently, the Hausman test strongly rejects the null hypothesis that the fixed-effects model is indistinguishable from the random-effects model, confirming the superiority of the former. Under both scenarios with and without control variables, the regression coefficients for the urban sprawl index derived from night-time light data were found to be significantly positive. This further demonstrates the robust applicability and validity of this metric within the present study.
Despite the positive validation results, some uncertainty remains in the nightlight-derived USI due to factors such as regional variations in brightness, differences between DMSP and VIIRS sensors, pixel saturation in urban cores, and background noise in rural areas [41,42,43]. The threshold for distinguishing high- and low-density areas has been determined based on the 2003 urban built-up area, reducing subjectivity and ensuring robust measurement. Future improvements could involve higher-resolution land use data or adaptive, locally tailored thresholding.
In summary, the statistical validation and robustness tests confirm the reliability and applicability of the nightlight-derived USI. The discussion of residual uncertainties provides transparency without undermining the credibility of the urban sprawl assessment framework.
3.2. Spatial Patterns and Evolutionary Trends of Urban Sprawl in the Yangtze River Delta
3.2.1. Spatial Distribution Characteristics of Urban Sprawl in the Yangtze River Delta
Drawing upon the methodology of Bai Y et al. [44], this study utilised ArcGIS software to map the spatial distribution patterns of urban sprawl in the Yangtze River Delta region from 2000 to 2020 (Figure 2). Lower urban sprawl indices in the figure indicate milder sprawl phenomena in the area, while higher indices signify more pronounced sprawl.
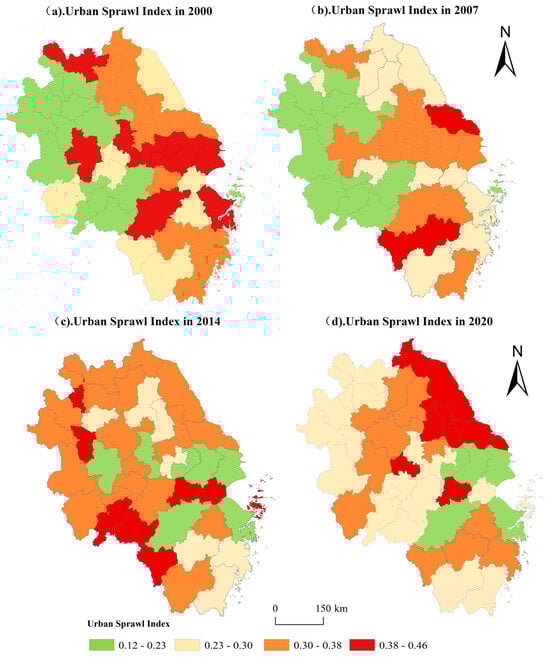
Figure 2.
Spatial Distribution of Urban Sprawl Index.
From a regional perspective, the data reveal pronounced spatio-temporal variations in urban sprawl evolution, reflecting the complex interplay between industrial restructuring and adjustments in urban planning policies. Overall trends show that between 2000 and 2020, the number of low-sprawl cities increased by 23.3%, while medium-to-high sprawl cities decreased by 6.7%. Specifically: ① The highest number of low-sprawl cities (13) was recorded in 2007, primarily concentrated in cities such as Huainan and Lu’an within Anhui Province. This indicates that in earlier phases, cities with relatively lower economic development levels were more likely to maintain lower urban sprawl. Conversely, economically more developed cities like Shanghai and Suzhou have long exhibited higher sprawl levels; ② By 2014, the number of low-sprawl cities had decreased to seven, representing a decline of approximately 42% compared to 2000. The rising proportion of medium-to-high sprawl cities may be influenced by rapid economic development and expansion strategies; ③ In 2020, the number of high-sprawl cities saw a slight decrease compared to 2014. This shift reflects that some cities have achieved effective control over urban sprawl following optimised urban management and planning policies.
Spatially, a distinct ‘core-periphery’ structure emerged, with pronounced differentiation between core cities and their surrounding areas. Specifically: ① Between 2000 and 2007, urban sprawl in the Yangtze River Delta exhibited a gradient pattern of low levels in the northwest and high levels in the southeast. This distribution trend indicates that economically more developed cities with greater urban cohesion (such as provincial capitals and central cities like Nanjing and Hangzhou) tended to have higher sprawl indices, while relatively less developed regions demonstrated lower sprawl levels. ② Between 2000 and 2020, adjustments in urban development strategies and policy orientations [45] prompted some previously high-sprawl cities (e.g., Shanghai, Wuxi) to gradually transition towards lower levels of sprawl, whereas certain low-sprawl cities (e.g., Huangshan, Lishui, Ma’anshan) exhibited a trend toward medium-to-high sprawl.
This shift in sprawl patterns from core to peripheral areas vividly illustrates the complex interplay between industrial restructuring and optimised urban planning policies in regional development. It also offers practical insights for achieving sustainable, low-carbon transformation and coordinated development within the Yangtze River Delta region.
To further elucidate the dynamic evolution of urban sprawl, this study employs the SLOPE method to classify the sprawl indices of 41 cities between 2000 and 2020 into distinct growth patterns [46] (Figure 3). From a county-level perspective, the classification reveals that cities with higher economic levels predominantly fall into the ‘relatively rapid growth’ and ‘rapid growth’ categories, such as Shanghai and Suzhou. This suggests that economically advanced cities tend to allocate greater resources to urban development and construction, resulting in higher urban sprawl indices during periods of expansion. Conversely, cities with relatively lagging economic development predominantly exhibit ‘slow growth’ and ‘moderate growth’ patterns, including most cities within Anhui Province and cities such as Lishui and Quzhou in Zhejiang Province. This disparity reflects a positive correlation between economic strength and the pace and manner of urban sprawl.
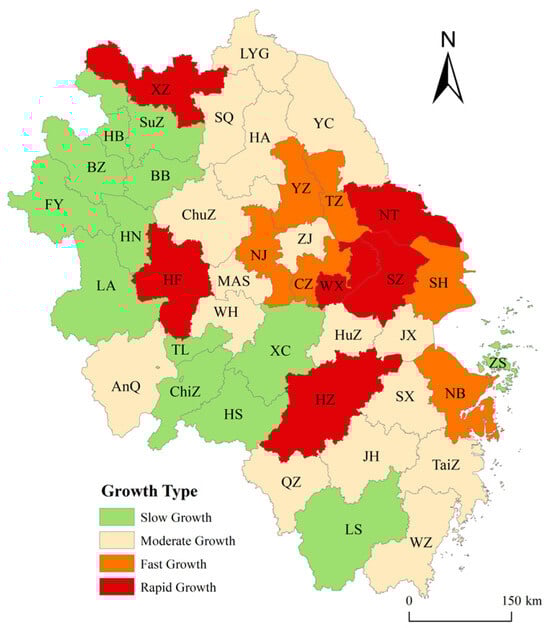
Figure 3.
Spatio-temporal Evolution Trends of Urban Sprawl in the Yangtze River Delta.
Overall, due to its flat terrain and strong economic foundations, the majority of cities in the Yangtze River Delta have experienced rapid growth in urban sprawl. However, accelerated urban expansion exerts a strong agglomeration effect on regional resources. Particularly when urban development outpaces population density, this can foster urban ills such as ‘crowding effects’ and shortages in public services. Presently, rapid economic development imposes heightened demands on urban spatial planning. Against a backdrop where construction pace often outstrips spatial planning, the issue of fragmented spatial structures has become increasingly evident, undermining sustainable urban development. Consequently, cities within the Yangtze River Delta should prioritise optimising urban spatial structures while advancing urbanisation, promoting compact and intensive development pathways to achieve coordinated and sustainable urban growth.
3.2.2. Spatial Correlation Characteristics of Urban Sprawl
This study employed Geoda 1.18 software to conduct spatial autocorrelation analysis on urban sprawl in the Yangtze River Delta region from 2000 to 2020. Results indicate that urban sprawl exhibits significant positive spatial correlation, demonstrating a pattern of agglomeration. The global Moran’s I indices were all positive and passed the 1% significance level test (Table 3), exhibiting a fluctuating upward trend characterised by an initial rise followed by a decline. The spatial clustering effect of urban sprawl progressively strengthened during the early period but weakened in the later phase.
Table 3.
Global Moran’s I for Urban Sprawl in the Yangtze River Delta from 2000 to 2020.
This study further calculated the localised Moran’s I indices for urban sprawl in the Yangtze River Delta region from 2000 to 2020 using ArcGIS and GeoDa software (Figure 4). The spatial patterns of urban sprawl within the study area were categorised into five types: high–high clustering, high–low clustering, low–high clustering, low–low clustering, and no significant clustering. This approach enables an intuitive analysis of the spatial associations and local spatial correlations of urban sprawl among cities within the Yangtze River Delta region.
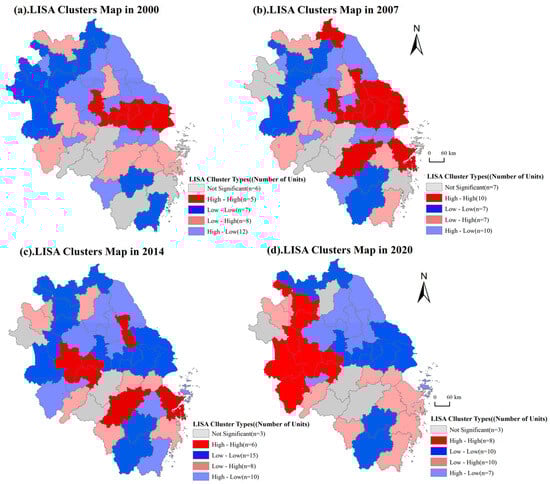
Figure 4.
LISA Cluster Analysis of Urban Sprawl Indices in the Yangtze River Delta.
During the study period, the urban sprawl pattern in the Yangtze River Delta underwent significant evolution, exhibiting a shift from a ‘centre-periphery’ to a ‘multipolar diffusion’ trend. Prior to 2007, the proportion of high–high clustering areas was relatively high, primarily concentrated in core cities such as Shanghai and Hangzhou, as well as their surrounding regions. These cities demonstrated high levels of both urban sprawl and economic development, underpinned by strong resource agglomeration capacity. Simultaneously, they drove synchronous development in neighboring cities through industrial spillover and transport connectivity, forming pronounced spatial agglomeration effects. In contrast, low–low agglomeration areas were primarily concentrated in the northwestern part of the region, particularly in cities such as Suqian and Huaibei. Constrained by geographical location and economic foundations, these cities demonstrated weaker urban sprawl and limited capacity for coordinated development with their surroundings.
Furthermore, low-low agglomeration regions accounted for a significant proportion during this phase, primarily situated in the central and western parts of the Yangtze River Delta, such as Ma’anshan and Chuzhou. These cities exhibit low levels of urban sprawl themselves, yet due to the rapid expansion of neighbouring cities like Nanjing and Hefei, they are significantly influenced by surrounding radiation, displaying pronounced characteristics of spatial ‘passive expansion’.
Following 2014, the urban sprawl pattern gradually reshaped, with high-value zones shifting from traditional core cities to emerging regions. The region centred on Hefei witnessed markedly intensified urban sprawl, reflecting the combined effects of accelerated economic growth and population aggregation. Conversely, previously high-value areas such as Wuxi and Suzhou experienced a deceleration in urban sprawl as their urban spaces approached saturation. Their development models shifted from extensive outward expansion to intensive internal optimisation, forming new low-low concentration zones.
The evolution of this pattern stemmed primarily from three factors: ① Prior to 2007, core cities like Shanghai leveraged locational advantages and policy support to achieve rapid urban land expansion. However, some regions lacked scientific planning, resulting in inefficient land use and disorderly sprawl. ② After 2014, as urbanisation levels rose, governments progressively strengthened and refined management of urban land use. Particularly in cities like Shanghai and Suzhou, optimising land use structures and promoting coordinated development within metropolitan areas enhanced spatial efficiency while curbing disorderly expansion. ③ Regions previously constrained by topography and hindered in expansion, such as Suzhou and Huaibei, overcame developmental bottlenecks through new technological advances and infrastructure development. This enabled rapid urban spatial expansion, propelling them into an ascending phase of urban sprawl.
Overall, urban sprawl within the Yangtze River Delta exhibited marked spatial unevenness during the study period, with pronounced developmental disparities between cities. The dynamic evolution of urban sprawl reflects not only the constraints imposed by economic development levels and geographical conditions but also highlights the pivotal role of policy regulation and regional coordination in shaping urban spatial structures. Moving forward, efforts to promote sustainable urban development should focus on strengthening integrated land use management, optimising urban spatial layouts, and enhancing inter-regional collaborative development capabilities to achieve orderly and efficient urban growth.
3.2.3. Spatio-Temporal Interaction Characteristics of Urban Sprawl in the Yangtze River Delta
- (1)
- Geometric Analysis of LISA Spatio-Temporal Pathways
Visualization of the relative length and curvature of LISA temporal pathways for urban sprawl in the Yangtze River Delta (Figure 5) reveals significant variations among cities in terms of local spatial dependencies and dynamic spatial structural characteristics. Specifically, cities such as Fuyang (1.238), Lianyungang (0.786), Chizhou (1.654), and Huangshan (2.498) exhibit markedly longer relative LISA temporal path lengths than other cities within the study area. This indicates these cities possess highly pronounced local spatial dependencies and dynamic spatial structural characteristics, characterised by substantial variation and volatility, alongside unstable relationships with surrounding regions. This stems from the absence of systematic planning and rational layout in land expansion within these cities, resulting in substantial spatial structural fluctuations and poor stability of local spatial patterns. Conversely, cities with shorter LISA time path lengths, such as Suzhou, Shanghai, and Wuxi, exhibit relatively stable local spatial patterns where spatial dependencies are less susceptible to external interference. This is closely associated with their advanced economies, higher levels of urbanization, and more rational and scientifically grounded approaches to land use planning.
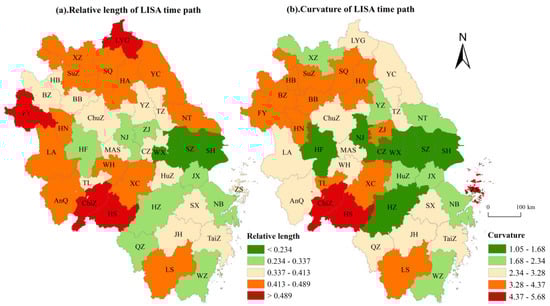
Figure 5.
Relative length and curvature of LISA time paths for urban sprawl in the Yangtze River Delta, 2000–2020.
With respect to LISA temporal path curvature, the Yangtze River Delta region displays an overall strip-like distribution, indicating fluctuating spatial dependencies in urban sprawl. Chizhou (4.68), Huangshan (5.68), and Zhoushan (5.24) recorded the highest LISA temporal path curvatures, significantly exceeding other cities. This indicates that spatial dependencies in these cities exhibit considerable fluctuation, with their evolutionary trajectories displaying marked instability and susceptibility to neighbouring urban developments, characterised by frequent shifts in directional trends. This instability arises from these cities’ substantial economic dependence on tourism, the revenues of which are strongly affected by seasonal variations, policy interventions, and market demand, thereby introducing considerable uncertainty into the spatial structure of urban sprawl.
Overall, the average time path curvature for the 41 prefecture-level cities in the Yangtze River Delta region was 2.87, with 24 cities exhibiting curvature below this average. This indicates that most cities in the study area exhibit relatively minor fluctuations in local spatial dependence during urban sprawl, thereby maintaining a generally stable spatial structure. Nevertheless, certain cities remain significantly influenced by external environments, with their spatial dependencies still exhibiting considerable uncertainty.
- (2)
- Analysis of LISA spatio-temporal path movement directions
The direction of LISA temporal path movement can be categorised into four migration types: HH (win-win), indicating synergistic high growth between a city and its neighbouring cities; HL (win-lose), signifying high growth in the city itself but low growth in neighbouring cities; LH (lose-win), representing low growth in the city itself but high growth in neighbouring cities; LL (lose-lose), indicating low growth in both the city itself and its neighbouring cities. As shown in the visualisation of Figure 6, the number of cities exhibiting collaborative growth (21) exceeds those with opposing growth patterns (20) within the study area. This indicates that urban sprawl in the Yangtze River Delta region generally exhibits a spatial cooperative trend, with cooperative patterns slightly outperforming spatial competition. This facilitates resource sharing and coordinated development, demonstrating strong spatial integration.
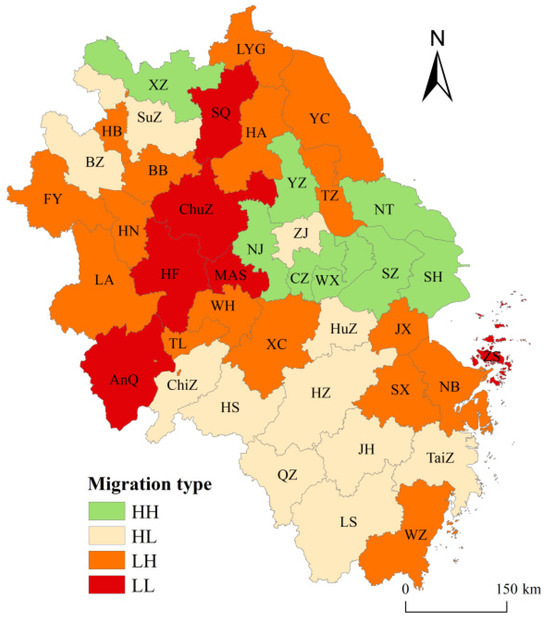
Figure 6.
LISA Time-Path Movement Direction.
However, it is noteworthy that most cities in Anhui Province and some in Zhejiang Province (such as Quzhou and Lishui) exhibit low growth trends, with the number of low-growth cities exceeding those in synergistic high-growth patterns. This suggests that while urban expansion in these areas has not led to significant disorderly sprawl, their growth momentum remains relatively insufficient, keeping them at a lower developmental level. Nevertheless, their urban sprawl has not spiraled out of control, and future policy adjustments and planning optimization could enable them to catch up or undergo transformation and upgrading. Conversely, the LISA time paths of cities like Suqian and Ma’anshan indicate that they operate within a collaborative, low-growth pattern, suggesting weaker joint growth performance with neighboring cities. While this situation may not precipitate acute resource shortages or urban ills in the short term, neglecting effective planning measures in the long term risks stagnating urban development and potentially triggering negative cycles. Consequently, cities operating within this low-synergy growth paradigm warrant particular attention. Effective measures must be implemented to address spatial disorder, avert vicious cycles, and foster orderly urban development.
- (3)
- LISA Spatio-Temporal Transition Analysis
Spatio-temporal transitions precisely capture the dynamic spatial-temporal evolution of urban sprawl in the Yangtze River Delta region, revealing distinct transition pathways. Analysis of the specific spatio-temporal transition types in urban sprawl within the Yangtze River Delta (Table 4) reveals that Type I, the stable type, predominantly occurs in economically developed cities with high urbanisation levels, such as Shanghai and Suzhou. These cities exhibit minimal changes in the spatial correlation of urban sprawl during the study period, reflecting relatively mature land use and development planning, overall stable growth, and strong spatial resilience. Type II, the transition-stable pattern, predominantly occurs in most cities within Anhui Province. Despite undergoing internal structural adjustments, the stable domain characteristics of these cities provide a degree of buffer space for subsequent development. Type III, the stable-transition type, comprises the largest number of cities, primarily distributed in southern Zhejiang Province and northeastern Jiangsu Province. This indicates that while some cities maintain relatively robust development, their spatial relationships undergo significant changes due to the rapid development pace of neighbouring regions, reflecting to some extent the inter-city linkage mechanisms and spillover effects. Type IV, the transition type, encompasses cities that experienced rapid development during the study period, alongside accelerated growth in their surrounding areas. These are primarily located in central Anhui Province, with representative cities including Anqing and Hefei.
Table 4.
Classification of Specific Spatiotemporal Transition Types of Urban Sprawl in the Yangtze River Delta.
To further analyse the characteristics of transition processes in local spatial association types among prefecture-level cities within the study area, calculations yielded the results presented in Table 5. The results indicate transition probabilities of 12.8%, 11.2%, 70.06%, and 7.11% for stable, transition-to-stable, stable-to-transition, and transition types, respectively. This suggests insufficient spatial stability in urban sprawl within the Yangtze River Delta, characterised by significant transitions between different urban types and relatively high transition probabilities. The spatial association transition probability HH→HH (2.87%) was highest among stable types, followed by LL→LL (4.23%), indicating that overall, fluctuations in high and low-value agglomerations of urban sprawl were relatively minor during the study period. The spatial association transition probability HL→LL (3.24%) was highest among transition-stable types. The spatial transition probability HL→HH (33.28%) was highest among stable-transition types, indicating a degree of diffusion in urban sprawl within the study area over a specific timeframe. The spatial transition probability LL→HH (2.37%) was highest among transition types, suggesting increased urban sprawl in some cities within the study area; the spatial transition probability HL→LH (0.23%) was the lowest.
Table 5.
Transition Matrix of Urban Sprawl in the Yangtze River Delta.
Overall, although the number of cities exhibiting synergistic growth within the region holds a certain advantage, the differences in transition probabilities among various city types indicate that the spatial integration of urban sprawl is not absolutely stable. Relatively stable high-growth agglomeration areas, alongside more volatile low-growth regions, collectively form the complex spatiotemporal evolution pattern of the Yangtze River Delta. From a policy perspective, for cities exhibiting transition-type behaviour (such as certain cities in Anhui and Jiangsu provinces), attention should focus on strengthening planning coordination and internal resource integration amid rapid expansion. For stable-to-transition and transition-to-stable cities, the priority should be implementing regional linkage mechanisms to narrow development disparities between neighbouring cities and foster coordinated development.
3.3. Empirical Analysis of the Impact of Urban Sprawl in the Yangtze River Delta on PM2.5 Pollution
3.3.1. Multiple Linear Regression Results
Based on the characteristics of urban sprawl and the spatiotemporal evolution of PM2.5, this study divided the period 2000–2020 into two phases: pre-policy implementation (2000–2012) and post-policy implementation (2013–2020). Coefficients for urban sprawl and multiple economic variables were selected to construct a multiple linear regression model, exploring the specific impacts of urban sprawl and related economic variables on PM2.5 levels and their underlying mechanisms. Results indicate that urban sprawl, economic development level, industrial structure, foreign direct investment, and city size all exert significant effects on PM2.5 concentrations (see Table 6).
Table 6.
Results of the Multiple Linear Regression (MLR) Model.
Between 2000 and 2012, the regression model results identified a significantly positive coefficient for the impact of urban sprawl on PM2.5 concentrations, indicating that disorderly expansion, intensive land development, increased energy consumption, and motor vehicle emissions collectively exacerbated PM2.5 pollution. After 2013, regression results revealed a significantly negative impact of urban sprawl on PM2.5, with the absolute value of this coefficient gradually decreasing as control variables were incorporated. This shift indicates that, driven by governmental pollution control policies, rational urban sprawl exhibits a certain inhibitory effect on PM2.5 emissions, while spatial layout optimisation plays a positive role in improving air quality. This finding supports existing research on the nonlinear relationship between urban sprawl and PM2.5.
Furthermore, industrial structure exhibits a significant negative correlation with PM2.5, indicating that optimising industrial composition—reducing the proportion of high-pollution industries while promoting service and high-tech sectors—effectively reduces pollutant emissions. GDP and FDI demonstrate a significant positive correlation with PM2.5, suggesting that traditional industrialisation and foreign investment-driven development models, while boosting economic growth, also impose environmental pressures. Urban scale exhibits a negative correlation with PM2.5. While urban expansion reflects agglomeration effects to some extent, it may simultaneously generate issues such as traffic congestion and energy consumption, exerting negative impacts on PM2.5 pollution.
Overall, the impact of urban sprawl and other economic variables on PM2.5 pollution exhibits phased variations. Under policy intervention, rationally guiding urban expansion, optimising industrial structures, and balancing economic development with environmental protection constitute key pathways to sustainable urban development.
3.3.2. Robustness Testing
To ensure the stability of the multivariate linear regression model results, this study employs multicollinearity tests to evaluate regression variables. When tolerance ≤ 0.1 or the variance inflation factor (VIF) falls between 3 and 9, it indicates a relatively pronounced collinear relationship between urban sprawl and these economic variables.
As shown in Table 7, the VIF values for all economic variables fall within the reasonable range of 3–9. This suggests a certain degree of correlation among these variables, though the collinearity has not yet reached a level that compromises the explanatory power of the regression results. Consequently, the constructed multiple linear regression model exhibits high statistical robustness, accurately reflecting the intrinsic relationship between urban sprawl and economic variables, as well as their impact on PM2.5 pollution.
Table 7.
Results of Multicollinearity Test.
In summary, with VIF values within the acceptable range, the multiple linear regression model established in this study is robust. It effectively captures the relationship between urban sprawl and economic variables, thereby providing reliable empirical support for subsequent findings.
3.3.3. Spatial Durbin Model Results
Given PM2.5’s pronounced spatial transfer characteristics, the aforementioned multiple linear regression model may not comprehensively capture the impact of urban sprawl on PM2.5 within the Yangtze River Delta region. To enhance the reliability of regression outcomes, this study integrates spatial factors with selected economic variables to construct a Spatial Durbin Model (SDM), thereby further exploring the comprehensive impact mechanism of urban sprawl on PM2.5.
Following the testing pathway outlined by Xu X. et al. [47], this study first conducts LR and Wald tests on the Spatial Durbin Model. Empirical results (Table 8) indicate that the p-values for both tests are zero at the 1% significance level. Combined with the model’s overall fit and the results of the Hosmer test, this study therefore adopts a spatial Durbin model (SDM) with individual and time fixed effects. This choice ensures the model controls for spatial autocorrelation and temporal heterogeneity while more accurately reflecting the dynamic relationships between variables.
Empirical findings reveal a significant negative spatial correlation for PM2.5, underscoring the necessity to transcend the single-city perspective in pollution control and advance regional joint prevention and control. Under period segmentation, both urban sprawl prior to 2012 and its spatial lagged effects exerted significant positive spillover effects on PM2.5, which reversed to negative after 2013, confirming the buffering role of optimized urban spatial layout in pollution management. Concurrently, the spatial lag terms for GDP, industrial structure, and city size were significantly positive, indicating that economic expansion and industrial activities amplify pollution levels in neighboring cities through spatial pathways. In contrast, the impact of FDI on PM2.5 was insignificant, suggesting its effect is unstable, potentially influenced by policy and regional variations.
In summary, urban sprawl exhibits pronounced spatio-temporal heterogeneity in its impact on PM2.5 pollution, manifesting both direct effects and significant spatial spillover effects mediated through economic variables. Future pollution control policies should priorities the coordinated management of urban expansion and industrial restructuring, incorporating spatial interactions across regions to simultaneously achieve two objectives: improving environmental quality and promoting high-quality urban development in the Yangtze River Delta.
Between 2000 and 2012, urban sprawl exhibited significantly positive direct, indirect, and total effects, with spatial spillovers playing a particularly prominent role. This indicates that disorderly expansion patterns during this period exacerbated pollution levels in the region and surrounding cities, constituting a classic ‘negative sprawl effect’. Conversely, from 2013 to 2020, following the implementation of the Air Pollution Prevention and Control Action Plan, the overall urban sprawl effect shifted in a significantly negative direction, with indirect effects remaining dominant, exhibiting a ‘positive improvement effect’. This transformation indicates that, under policy guidance and well-planned development, orderly urban spatial expansion contributes to alleviating pollution pressure, reducing central urban density, and enhancing functional layout, thereby driving improvements in overall regional air quality.
Notably, the introduction of control variables did not alter the direction or significance of the effects, further validating the robustness of the model results. Overall, the impact of urban sprawl on PM2.5 is not a simple linear process but rather a dynamic evolution mechanism influenced by factors such as development stage, policy interventions, and spatial interactions. This finding indicates that regional air governance should transcend local perspectives, prioritizing the spatial characteristics and spillover effects of urban sprawl to promote cross-regional collaborative governance and scientific planning. This approach aims to achieve the coordinated integration of pollution prevention and control with high-quality urban development in the Yangtze River Delta region.
Table 8.
Results of the Spatial Durbin Model (SDM) Regression.
Table 8.
Results of the Spatial Durbin Model (SDM) Regression.
| 2000–2012 (N = 12) | 2013–2020 (N = 7) | |||||||||||
|---|---|---|---|---|---|---|---|---|---|---|---|---|
| Variable | Individual Fixed SDM | Fixed Time SDM | Double Fixed SDM | Individual Fixed SDM | Fixed Time SDM | Double Fixed SDM | ||||||
| Coef. | Std. Err. | Coef. | Std. Err. | Coef. | Std. Err. | Coef. | Std. Err. | Coef. | Std. Err. | Coef. | Std. Err. | |
| SI | 2.428 * | 1.968 | 5.337 *** | 1.954 | 3.237 | 1.952 | −3.428 * | 1.948 | −5.217 *** | 1.924 | −4.517 | 1.923 |
| PSGDP | 24.467 ** | 9.754 | 11.323 | 11.228 | 20.963 * | 11.054 | 25.487 ** | 10.784 | 11.257 | 11.204 | 21.323 * | 10.747 |
| INDUS | 0.427 *** | 0.078 | 0.498 *** | 0.088 | 0.518 *** | 0.091 | 0.487 *** | 0.083 | 0.498 *** | 0.087 | 0.523 *** | 0.087 |
| SFDI | 0.077 | 0.061 | 0.0514 | 0.009 | 0.081 | 0.059 | 0.087 | 0.054 | 0.0514 | 0.014 | 0.074 | 0.055 |
| POP | 0.021 *** | 0.005 | 0.024 *** | 0.006 | 0.023 *** | 0.006 | 0.018 *** | 0.006 | 0.024 *** | 0.007 | 0.023 *** | 0.006 |
| W*SI | 0.663 | 2.436 | 2.147 | 2.658 | 6.989 *** | 2.498 | −0.654 | 2.436 | −2.147 | 2.874 | −7.484 *** | 2.547 |
| W *PSGDP | 40.216 | 16.475 | 12.547 | 17.668 | 33.634 * | 15.887 | 38.406 | 16.475 | 12.547 | 17.408 | 32.547 * | 16.243 |
| W*INDUS | −0.106 | 0.114 | 0.041 | 0.187 | 0.02 | 0.126 | −0.134 | 0.114 | 0.041 | 0.128 | 0.02 | 0.147 |
| W*SFDI | 0.059 | 0.095 | −0.154 * | 0.087 | −0.039 | 0.098 | 0.059 | 0.089 | −0.147 * | 0.087 | −0.039 | 0.089 |
| W*POP | −0.002 | 0.012 | −0.008 | 0.006 | 0.002 | 0.007 | −0.001 | 0.008 | −0.008 | 0.008 | 0.002 | 0.008 |
| pro | 0.424 *** | 0.028 | 0.324 *** | 0.0298 | 0.264 *** | 0.029 | 0.415 *** | 0.031 | 0.324 *** | 0.0341 | 0.274 *** | 0.031 |
| logliksfe | −4128.387 | −4257.696 | −4156.854 | −4226.457 | −4357.846 | −4183.764 | ||||||
| R-squared | 0.546 | 0.368 | 0.447 | 0.547 | 0.367 | 0.437 | ||||||
| Nobs | 492 | 492 | 492 | 328 | 328 | 328 | ||||||
| LR(lag) | 14.683 ** | 16.794 ** | 19.881 ** | 16.047 ** | 17.308 ** | 19.623 ** | ||||||
| LR(error) | 24.784 *** | 26.567 *** | 33.787 *** | 24.639 *** | 26.321 *** | 32.847 *** | ||||||
| Hausman | 942.127 *** | 942.127 *** | 942.127 *** | 928.567 *** | 928.567 *** | 928.567 *** | ||||||
Note: *, **, *** indicate significance at 10%, 5%, and 1% levels, respectively. To further elucidate the mechanism underpinning urban sprawl’s influence on PM2.5 pollution, this study decomposed the spatial effects of urban sprawl based on regression results from a spatial Durbin model, quantifying its direct effect (local effect), indirect effect (spatial spillover effect), and total effect (see Table 9). Findings reveal that the impact of urban sprawl on PM2.5 exhibits significant variations across different phases, highlighting the nonlinear nature of their relationship.
Table 9.
Decomposition of Direct, Indirect, and Total Spatial Effects.
Table 9.
Decomposition of Direct, Indirect, and Total Spatial Effects.
| 2000–2012 (N = 12) | 2013–2020 (N = 7) | |||||||||||
|---|---|---|---|---|---|---|---|---|---|---|---|---|
| Variable | Direct Effect | Indirect Effect | Total Effect | Direct Effect | Indirect Effect | Total Effect | ||||||
| Coef. | Std. Err. | Coef. | Std. Err. | Coef. | Std. Err. | Coef. | Std. Err. | Coef. | Std. Err. | Coef. | Std. Err. | |
| SI | 5.486 *** | 2.314 | 11.965 *** | 4.362 | 17.451 *** | 3.587 | −5.576 *** | 2.031 | −12.074 *** | 3.564 | −17.650 *** | 4.321 |
| PSGDP | 25.886 ** | 10.287 | 48.747 ** | 25.867 | 74.633 *** | 29.186 | 26.879 ** | 10.364 | 48.660 ** | 26.354 | 75.539 *** | 27.036 |
| INDUS | 0.559 *** | 0.078 | 0.375 | 0.141 | 0.934 *** | 0.187 | 0.560 *** | 0.074 | 0.237 | 0.132 | 0.797 *** | 0.197 |
| SFDI | 0.075 | 0.038 | 0.027 | 0.11 | 0.102 | 0.134 | 0.085 | 0.036 | 0.025 | 0.11 | 0.11 | 0.123 |
| POP | 0.021 *** | 0.006 | 0.005 | 0.009 | 0.026 ** | 0.014 | 0.021 *** | 0.005 | 0.005 | 0.01 | 0.026 ** | 0.013 |
Note: **, *** indicate significance at 5%, and 1% levels, respectively.
3.3.4. Identification of Heterogeneous Mechanisms in Policy Interventions
Comparing regression results across policy implementation phases reveals a significant shift in the mechanism through which urban sprawl influences PM2.5 pollution before and after policy interventions. Between 2000 and 2012, urban sprawl markedly exacerbated pollution, functioning as a classic ‘pollution driver.’ After 2013, under the influence of policies such as the Air Pollution Prevention and Control Action Plan, this relationship shifted to a significantly negative correlation. This indicates urban sprawl gradually evolved into an environmentally friendly expansion model, reflecting the corrective effect of policy within urban development trajectories.
The effect decomposition based on the Spatial Durbin Model further confirmed the shift in underlying mechanisms. Prior to policy implementation, the direct, indirect, and total effects of urban sprawl were all significantly positive, with spatial spillover effects being particularly pronounced, indicating a trend of reinforced pollution accumulation across regions. Post-policy implementation, however, all three effects turned significantly negative. Urban sprawl, instead, mitigated pollution levels at broader spatial scales through multiple pathways, including land use optimization, industrial relocation, and transportation improvements, gradually evolving into a ‘pollution mitigate.
This reversal not only demonstrates how policy regulation significantly enhances the environmental resilience of urban sprawl but also reveals the spatial moderating role of scientific planning and functional zone management in pollution control. Overall, the relationship between urban sprawl and PM2.5 pollution exhibits pronounced policy heterogeneity and dynamic adjustment characteristics. Under institutional guidance, urban expansion trajectories shift from disorderly to intensive patterns, providing practical grounds for advancing regional collaborative governance and differentiated environmental policies.
4. Discussion
4.1. Spatial Insights and Model-Based Findings
This study advances the understanding of how urban sprawl influences PM2.5 pollution by incorporating spatial dependence through the Spatial Durbin Model (SDM). Unlike conventional regression models that treat cities as independent units, the SDM framework captures both local effects within cities and spillover effects across neighboring areas. This is particularly meaningful in the Yangtze River Delta, where cities are highly interconnected and air pollutants disperse across administrative boundaries, making spatial interaction a critical determinant of environmental outcomes.
Compared with existing studies that mainly employed non-spatial or single-period analyses [19,48,49], our study offers several new insights.
First, the SDM results demonstrate that the relationship between urban sprawl and PM2.5 is spatio-temporally heterogeneous rather than constant. From 2000 through 2012, urban sprawl exerted significantly positive direct and spillover effects, highlighting that disorderly expansion intensified pollution within cities and across neighboring regions—an aspect frequently neglected in conventional non-spatial frameworks. After 2013, however, the relationship turned significantly negative, reflecting that policy-guided and spatially optimized expansion can mitigate pollution by reducing urban density and improving functional layout.
Second, the SDM reveals significant spatial spillovers of economic variables, including GDP and industrial structure, which were not fully captured in traditional models. The positive spatial lag coefficients for these factors indicate that economic expansion and industrial activity in one city can elevate pollution in neighboring regions, highlighting the need for cross-jurisdictional environmental governance. This finding provides new empirical evidence of inter-city environmental interdependence, expanding beyond the local perspective emphasized in previous works [50,51].
Third, by controlling for spatial autocorrelation and temporal heterogeneity, the SDM improves model robustness and explanatory power. It better reflects how regional policy interventions—such as the Air Pollution Prevention and Control Action Plan—alter the direction and intensity of the urbanization–pollution linkage. These findings supplement and refine earlier research by offering methodological and empirical advancements in understanding how spatial development patterns influence environmental outcomes.
In summary, this study moves beyond verifying established conclusions to uncovering new spatial mechanisms underlying the relationship between urban sprawl and air pollution. The results confirm that urbanization’s environmental effects are dynamic, multi-directional, and shaped by both policy and spatial linkages. Recognizing these dependencies provides a stronger foundation for coordinated urban planning and integrated air quality management across the Yangtze River Delta.
4.2. Policy Recommendations
The Yangtze River Delta exhibits predominantly growth-oriented urban sprawl, concentrated in regional hubs such as Shanghai, Nanjing, and Hangzhou, with spatially interconnected sprawl patterns across cities. Amidst rapid urban development, population growth has driven a surge in land demand. However, the lack of systematic and scientific approaches in urban spatial planning has led to increasingly disorderly expansion. To mitigate the negative impacts of excessive urban sprawl, efforts should focus on three key areas: ① Strictly implement land use management systems, scientifically regulate the scale of urban construction land, coordinate the overall development of the Yangtze River Delta urban cluster, prevent disorderly and fragmented land expansion, and effectively protect ecological spaces; ② Priorities meeting public welfare land requirements within ecological carrying capacity limits, while formulating restrictive development measures based on functional zone characteristics to enhance land use intensity; ③ Addressing the spatial correlation of urban sprawl, strengthen regional integrated planning by implementing differentiated development strategies under the principle of ‘total control—intensity guidance—quality enhancement’ to optimize layout pathways.
This study indicates that disorderly sprawl exacerbates PM2.5 pollution. Therefore, integrating new urbanization with green development principles is essential to scientifically advance urban construction and alleviate PM2.5 pollution pressures. Specific measures include: ① Formulating differentiated policies for cities across varying regions and development levels. Given the ecological impacts of urban sprawl, developed cities may employ polycentric structures to redirect populations towards satellite centers, thereby relieving pressure on core urban areas. For slower-developing cities like Huangshan and Huainan, compact, single-centre urban structures should be adopted to increase population density and curb extensive land expansion. ② Given that the spatial dispersion of atmospheric pollutants constitutes a significant source of PM2.5 in the Yangtze River Delta region, joint prevention and control efforts among heavily polluted cities should be strengthened. The optimization of coordination mechanisms plays a critical role in improving the overall effectiveness of regional atmospheric governance.
4.3. Limitations and Future Prospects
While this study provides empirical insights into the relationship between urban sprawl and PM2.5 pollution in the Yangtze River Delta, several limitations should be acknowledged. First, although nighttime light data offer a consistent and widely adopted proxy for measuring urban expansion, they do not fully reflect intra-urban variations in land use intensity or functional zoning. Future efforts to quantify urban sprawl could benefit from incorporating high-resolution land use data and multisource remote sensing imagery. Second, the PM2.5 data employed are based on gridded estimates that lack sufficient validation from ground-based monitoring stations, which may limit their ability to capture localized pollution dynamics, particularly in complex urban environments. Third, although spatial econometric models help account for spatial dependencies and policy stage effects, they fall short in disentangling specific pathways—such as the roles of urban form, industrial layout, and transportation infrastructure—through which sprawl influences air quality. More advanced modeling approaches—such as nonlinear regression and machine learning—may offer improved capacity to identify and explain the underlying mechanisms.
Looking ahead, several avenues for future research emerge. First, comparative studies across different megaregions could assess whether the observed patterns hold in areas with distinct spatial development trajectories. Second, more granular environmental and urban datasets—such as mobile sensor measurements or satellite-based aerosol retrievals—could enhance the spatial and temporal precision of pollution estimates. Third, integrating causal inference frameworks, such as difference-in-differences or synthetic control methods, may enable more rigorous evaluations of specific policy interventions. These improvements could deepen our understanding of the interplay between urban spatial restructuring and environmental change under ongoing urbanization and governance reforms.
5. Conclusions
Against the backdrop of new urban development, the accelerated urbanization of the Yangtze River Delta has profoundly impacted the atmospheric environment through expanding urban spaces and shifting land use patterns. Urban sprawl is not only an inevitable outcome of land development but also a fundamental driver of air pollution and excessive resource consumption. Therefore, exploring synergistic optimization pathways between urban land development and atmospheric environmental governance holds significant theoretical and practical importance for achieving rational land resource utilization and promoting low-carbon, green urban economic development. Through spatial analysis of urban sprawl indices alongside multiple regression and spatial econometric models, this study systematically examines the spatiotemporal characteristics of urban sprawl in the Yangtze River Delta and its impact on PM2.5 levels, yielding the following three principal conclusions:
- (1)
- From a regional perspective, urban sprawl in the Yangtze River Delta exhibited a sustained growth trend between 2000 and 2020. The number of cities with low-level sprawl gradually increased, while the centre of sprawl shifted slightly northwestward. The predominant growth pattern was characterised by relatively rapid expansion, exhibiting significant spatial correlation. Adjacent cities influenced each other’s sprawl trajectories, demonstrating pronounced regional diffusion effects.
- (2)
- Most cities within the study area exhibited relatively short LISA time-path lengths, indicating overall spatial stability, particularly in developed cities such as Shanghai and Suzhou and their surrounding regions. In contrast, cities like Fuyang and Lianyungang demonstrated relatively dynamic local spatial structures. Additionally, Chizhou, Huangshan, and Zhoushan—cities influenced by tourism—exhibited stronger local spatial dependencies. Between 2000 and 2020, the curvature of LISA time paths for most cities in the study area was below average, indicating that the overall influence of local spatial patterns on urban sprawl was relatively weak. Most cities did not experience significant spatio-temporal jumps, demonstrating strong inertia in the transition of urban units and a high degree of stability in the associative patterns of urban sprawl.
- (3)
- Analyses using multiple linear and spatial regression models reveal a nonlinear relationship between urban sprawl and PM2.5 levels. Between 2000 and 2012, the disorderly expansion of urban sprawl in the Yangtze River Delta exacerbated PM2.5 pollution. This was primarily due to the lack of systematic planning in urban land development, which resulted in increased population density, traffic congestion, and industrial emissions. Conversely, from 2013 to 2020, the implementation of air pollution control policies significantly reduced PM2.5 pollution. Concurrently, a compact and orderly urban spatial structure, along with its spatial spillover effects, further contributed to the improvement in PM2.5 pollution levels. In addition, existing research suggests that foreign direct investment, industrial restructuring, urban scale, and economic development all contribute to the exacerbation of PM2.5 pollution.
Author Contributions
Conceptualization, N.R. and J.X.; Methodology, N.R. and J.X.; Software, N.R.; Validation, N.R.; Formal analysis, N.R.; Investigation, N.R. and J.X.; Resources, N.R. and H.H.; Data curation, N.R.; Writing—original draft, N.R.; Writing—review & editing, N.R.; Visualization, N.R. and J.X.; Supervision, N.R. and J.X.; Funding acquisition, H.H. All authors have read and agreed to the published version of the manuscript.
Funding
This research was supported by the Anhui Provincial Key Natural Science Projects for Higher Education Institutions (KJ2021A1078, KJ2021A1079, KJ2020A0724, ZRJZ2021021), the Anhui Provincial Key Humanities and Social Sciences Research Projects for Higher Education Institutions (SK2021A0687, 2022AH051063), the Chuzhou Science and Technology Bureau Science and Technology Plan Project (2021ZD007), and the Chuzhou Science and Technology Bureau Key Research and Development Project (No. 2022ZN019). The APC was paid by the first author, Ning Ruan.
Data Availability Statement
The original contributions presented in the study are included in the article material, further inquiries can be directed to the corresponding author.
Conflicts of Interest
The authors declare no conflict of interest.
Appendix A
City Abbreviations in the Yangtze River Delta.
Table A1.
Abbreviations for major cities in the Yangtze River Delta.
Table A1.
Abbreviations for major cities in the Yangtze River Delta.
| Abbreviation | City | Abbreviation | City |
|---|---|---|---|
| SH | Shanghai | QZ | Quzhou |
| NJ | Nanjing | ZS | Zhoushan |
| WX | Wuxi | TaiZ | Taizhou (Zhejiang Province) |
| XZ | Xuzhou | LS | Lishui |
| CZ | Changzhou | HF | Hefei |
| SZ | Suzhou (Jiangsu Province) | WH | Wuhu |
| NT | Nantong | BB | Bangbu |
| LYG | Lianyugang | HN | Huainan |
| HA | Huaian | MAS | Ma’anshan |
| YC | Yancheng | HB | Huaibei |
| YZ | Yangzhou | TL | Tongling |
| ZJ | Zhenjiang | AnQ | Anqing |
| TZ | Taizhou (Jiangsu Province) | HS | Huangshan |
| SQ | Suqian | ChuZ | Chuzhou |
| HZ | Hangzhou | FY | Fuyang |
| NB | Ningbo | SuZ | Suzhou (Anhui Province) |
| WZ | Wenzhou | LA | Lu’an |
| JX | Jiaxing | BZ | Bozhou |
| HuZ | Huzhou | ChiZ | Chizhou |
| SX | Shaoxing | XC | Xuancheng |
| JH | Jinhua |
Note: City abbreviations are unique; in cases of similar pinyin, letters or province codes are added to avoid ambiguity.
References
- Hou, Y.; Huang, Q.; Ren, Q.; Gu, T.; Zhou, Y.; Wu, P.; Fan, Y.; Zhu, G. Spatiotemporal dynamics of urban sprawl in China from 2000 to 2020. GISci. Remote Sens. 2024, 61, 2351262. [Google Scholar] [CrossRef]
- Jiang, G.; Zhang, R.; Ma, W.; Zhou, D.; Wang, X.; He, X. Cultivated land productivity potential improvement in land consolidation schemes in Shenyang, China: Assessment and policy implications. Land Use Policy 2017, 68, 80–88. [Google Scholar] [CrossRef]
- Yang, Y.; Liu, Y.; Yue, H.; Dong, Z. Spatiotemporal pattern of urban sprawl based on the weighted urban proliferation model: A case study of the Bohai Rim region in China. Land 2024, 13, 55. [Google Scholar] [CrossRef]
- Kang, T.; Zhao, J.; Zeng, L.; Han, Q.; Ding, F. Unraveling PM2.5 Pollution Drivers through Digitalization-Climate-Urban Form Interactions in Chinese Cities. Environ. Technol. Innov. 2025, 40, 104515. [Google Scholar] [CrossRef]
- Fallah, B.N.; Partridge, M.D.; Olfert, M.R. Urban Sprawl and Productivity: Evidence from US Metropolitan Areas. Pap. Reg. Sci. 2011, 90, 451–472. [Google Scholar] [CrossRef]
- Krofcheck, D.J.; Litvak, M.E.; Lippitt, C.D.; Neuenschwander, A.; Ouyang, Z. Woody Biomass Estimation in a Southwestern U.S. Juniper Savanna Using LiDAR-Derived Clumped Tree Segmentation and Existing Allometries. Remote Sens. 2016, 8, 453. [Google Scholar] [CrossRef]
- Travisi, C.M.; Camagni, R.; Nijkamp, P. Impacts of Urban Sprawl and Commuting: A Modelling Study for Italy. J. Transp. Geogr. 2010, 18, 382–392. [Google Scholar] [CrossRef]
- Li, D.; Tang, J.; Hu, Q.; Dong, M.; Chithpanya, S. Spatiotemporal Urban Evolution Along the China–Laos Railway in Laos Determined Using Multiple Sources of Remote-Sensed Landscape Indicators and Interpretable Machine Learning. Land 2024, 13, 2094. [Google Scholar] [CrossRef]
- Seto, K.C.; Shepherd, J.M. Global urban land-use trends and climate change. J. Curr. Opin. Environ. Sustain. 2009, 1, 89–95. [Google Scholar] [CrossRef]
- Hao, L.; Li, X. Impact of urban sprawl on regional productivity improvement: Based on the perspective of dynamic industrial agglomeration. J. Cent. South Univ. Soc. Sci. Ed. 2020, 26, 21–23. [Google Scholar] [CrossRef]
- Li, Q.; Wang, Y. The spread of cities and the upgrading of the Yangtze Economic Belt Industry. J. Chongqing Univ. Soc. Sci. Ed. 2021, 27, 39–49. [Google Scholar] [CrossRef]
- Arsanjani, J.J.; Helbich, M.; Vaz, E.D.N. Spatiotemporal Simulation of Urban Growth Patterns Using Agent-Based Modeling: The Case of Tehran. Cities 2013, 35, 27–37. [Google Scholar] [CrossRef]
- Plantinga, A.J.; Bernell, S. The Association Between Urban Sprawl and Obesity: Is It a Two-Way Street? J. Reg. Sci. 2010, 50, 651–671. [Google Scholar] [CrossRef]
- Zhang, Y.; Zhang, L.; Cao, S.; Liu, X.; Jin, J.; Zhao, Y. Improved Anthropogenic Mercury Emission Inventories for China from 1980 to 2020: Toward More Accurate Effectiveness Evaluation for the Minamata Convention. Environ. Sci. Technol. 2023, 57, 8660–8670. [Google Scholar] [CrossRef]
- Irwin, E.G.; Bockstael, N.E. The Evolution of Urban Sprawl: Evidence of Spatial Heterogeneity and Increasing Land Fragmentation. Proc. Natl. Acad. Sci. USA 2007, 104, 20672–20677. [Google Scholar] [CrossRef]
- Yu, B.B.; Zhou, X.R. Land Finance and Urban Sprawl: Evidence from Prefecture-Level Cities in China. Habitat Int. 2024, 130, 103074. [Google Scholar] [CrossRef]
- Wen, H.; Yu, H.; Nghiem, X.H. Impact of Urban Sprawl on Carbon Emission Efficiency: Evidence from China. Urban Clim. 2024, 55, 101986. [Google Scholar] [CrossRef]
- Sarigiannis, D.A.; Karakitsios, S.P.; Gotti, A.; Papagiannakis, A. Benefits on public health from transport-related greenhouse gas mitigation policies in Southeastern European cities. Sci. Total Environ. 2017, 579, 1427–1438. [Google Scholar] [CrossRef]
- Tao, L.; Jian, G.; Zheng, W. Research on emergency reserves and layout of refined oil in the Yangtze River Delta. Resour. Sci. 2018, 40, 1450–1458. [Google Scholar] [CrossRef][Green Version]
- Wu, J.; Weng, W.; Shen, L.; Fu, M. Transient and continuous effects of indoor human movement on nanoparticle concentrations in a sitting person’s breathing zone. Sci. Total Environ. 2022, 805, 149970. [Google Scholar] [CrossRef] [PubMed]
- Morán Uriel, J.; Camerin, F.; Córdoba Hernández, R. Urban Horizons in China: Challenges and Opportunities for Community Intervention in a Country Marked by the Heihe-Tengchong Line; Springer Nature: Singapore, 2024; pp. 105–125. [Google Scholar] [CrossRef]
- Wang, W. Breaking down the barriers to clean air: The Effects of China’s Zero-Waste City Policy on PM2.5 Concentration and Urban Sprawl. Chin. J. Popul. Resour. Environ. 2025, 23, 75–84. [Google Scholar] [CrossRef]
- Wang, Y.; Chen, S.; Zhou, Z.; Zhong, S. Does the New-Type Urbanization Policy Help Reduce PM2.5 Pollution? Evidence from Chinese Counties. Sustainability 2025, 17, 7585. [Google Scholar] [CrossRef]
- Chang, Q.; Sha, Y.; Chen, Y. The Coupling Coordination and Influencing Factors of Urbanization and Ecological Resilience in the Yangtze River Delta Urban Agglomeration, China. Land 2024, 13, 111. [Google Scholar] [CrossRef]
- Zheng, Y.; Fan, M.; Cai, Y.; Fu, M.; Yang, K.; Wei, C. Spatio-Temporal Pattern Evolution of Carbon Emissions at the City-County-Town Scale in Fujian Province Based on DMSP/OLS and NPP/VIIRS Nighttime Light Data. J. Clean. Prod. 2024, 442, 140958. [Google Scholar] [CrossRef]
- Sarif, N.; Roy, A.K. Measuring Urban Shrinkage in India Using Night-Light Data from DMSP-OLS and VIIRS-NPP Satellite Sensors. Cities 2024, 152, 105176. [Google Scholar] [CrossRef]
- Zou, J.; Chen, Y.; Ding, G.; Xuan, W. A Clustered Threshold Method for Extracting Urban Built-up Area Using the DMSP/OLS Nighttime Light Images. Geomat. Inf. Sci. Wuhan Univ. 2016, 41, 196–201. [Google Scholar] [CrossRef]
- Chen, Z.; Yu, B.; Yang, C.; Zhou, Y.; Qian, X.; Wang, C.; Wu, B.; Wu, J. An Extended Time Series (2000–2018) of Global NPP-VIIRS-like Nighttime Light Data from a Cross-Sensor Calibration. Earth Syst. Sci. 2021, 13, 889–906. [Google Scholar] [CrossRef]
- Qin, M.; Liu, X.; Tong, Y. Does Urban Sprawl Exacerbate Haze Pollution? Empirical Evidence from PM2.5 Data in China. Econ. Manag. Sci. 2016, 11, 146–160. [Google Scholar] [CrossRef]
- Chen, X.; Qin, M. Urban Sprawl, Population and Production Efficiency: Evidence from Chinese Enterprises Data. J. Chongqing Univ. Soc. Sci. Ed. 2019, 4, 38–52. [Google Scholar] [CrossRef]
- Wu, Y.; Shi, K.; Yu, B.; Li, C. Analysis of the Impact of Urban Sprawl on Haze Pollution Based on the NPP-VIIRS Nighttime Light Remote Sensing Data. J. Wuhan Univ. Geosci. 2021, 46, 777–789. [Google Scholar] [CrossRef]
- Cheng, K.; Xu, Y. The Impact of Urban Sprawl on Electricity Intensity: An Analysis Based on Panel Data of Prefecture-level and Above Cities in China. Urban Issues 2019, 7, 37–42+49. (In Chinese) [Google Scholar]
- Liao, B.; Luo, X.; Tian, C. Spatial threshold characteristics and radiation range of regional synergy development impact on urban sprawl. Syst. Eng. Theory Pract. 2025, 45, 371–390. (In Chinese) [Google Scholar] [CrossRef]
- Siddique, T.; Pradhan, S.P.; Vishal, V.; Singh, T.N. Applicability of Q-slope Method in the Himalayan Road Cut Rock Slopes and Its Comparison with CSMR. Rock Mech. Rock Eng. 2020, 53, 4509–4522. [Google Scholar] [CrossRef]
- Anselin, L. Local Indicators of Spatial Association—LISA. Geogr. Anal. 1995, 27, 93–115. [Google Scholar] [CrossRef]
- Gedamu, W.T.; Plank-Wiedenbeck, U.; Wodajo, B.T. A Spatial Autocorrelation Analysis of Road Traffic Crash by Severity Using Moran’s I Spatial Statistics: A Comparative Study of Addis Ababa and Berlin Cities. Accid. Anal. Prev. 2024, 200, 107535. [Google Scholar] [CrossRef] [PubMed]
- Tao, R.; Chen, Y.; Thill, J.-C. A Space-Time Flow LISA Approach for Panel Flow Data. Soc. Sci. Comput. Rev. 2023, 106, 102042. [Google Scholar] [CrossRef]
- Chen, Y. Reconstruction and Normalization of LISA for Spatial Analysis. PLoS ONE 2023, 18, e0303456. [Google Scholar] [CrossRef] [PubMed]
- Hesamian, G.; Akbari, M.G. A Robust Varying Coefficient Approach to Fuzzy Multiple Regression Model. J. Comput. Appl. Math. 2020, 371, 112704. [Google Scholar] [CrossRef]
- Bhatti, U.A.; Marjan, S.; Wahid, A.; Syam, M.S.; Huang, M.; Tang, H.; Hasnain, A. The Effects of Socioeconomic Factors on Particulate Matter Concentration in China: New Evidence from Spatial Econometric Model. J. Clean. Prod. 2023, 393, 137969. [Google Scholar] [CrossRef]
- Zhang, Q.; Schaaf, C.; Seto, K.C. The vegetation adjusted nighttime light urban index: A new approach to reduce saturation and increase variation in nighttime luminosity. Remote Sens. Environ. 2016, 129, 232–245. [Google Scholar] [CrossRef]
- Ma, T.; Zhou, Y.; Zhou, C.; Haynie, S.; Pei, T.; Xu, T. Night-time light derived estimation of spatio-temporal characteristics of urbanization dynamics using DMSP/OLS satellite data. Remote Sens. Environ. 2015, 158, 453–464. [Google Scholar] [CrossRef]
- Liao, Z.; Wang, L. Urban Sprawl and Regional Economic High-Quality Development: A Study Based on DMSP/OLS Nighttime Light Data. Finance Econ. Sci. 2019, 6, 106–114. (In Chinese) [Google Scholar]
- Bai, Y.; Fan, J.; Lai, Y. Whole-Domain Spatial Dynamic Transition and Local Spatial Driving Differences of Ozone Pollution in the Yangtze River Economic Zone. J. China Univ. Geosci. Econ. Manag. 2024, 2, 100–113. (In Chinese) [Google Scholar] [CrossRef]
- Ali, M.A.; Huang, Z.W.; Bilal, M.; Assiri, M.E.; Mhawish, A.; Nichol, J.E.; de Leeuw, G.; Almazroui, M.; Wang, Y.; Alsubhi, Y. Long-term PM2.5 pollution over China: Identification of PM2.5 pollution hotspots and source contributions. Sci. Total Environ. 2023, 893, 164871. [Google Scholar] [CrossRef]
- Wen, X.; Lu, R.; Song, T.; Wang, Y.; Wu, J.; Gong, L. The Causal Effect of Land-Use Transformation on Urban Vitality in the Context of Urban Regeneration: A Case Study of Chengdu. Land 2025, 14, 2020. [Google Scholar] [CrossRef]
- Xu, X.; Chen, Z.; Ding, X. Measurements of Urban Sprawl of Regional Central Cities and Control Strategies: A Case Study in Linyi City of Shandong Province, China. China Land Sci. 2019, 33, 85–92. (In Chinese) [Google Scholar] [CrossRef]
- Hernández-Lamas, P.; Cabau-Anchuelo, B.; de Castro-Cuartero, Ó.; Bernabéu-Larena, J. Mobile Applications, Geolocation and Information Technologies for the Study and Communication of the Heritage Value of Public Works. Sustainability 2021, 13, 2083. [Google Scholar] [CrossRef]
- Banerjee, A.K.; Liang, X.; Harms, N.E.; Tan, F.; Lin, Y.; Feng, H.; Wang, J.; Li, Q.; Jia, Y.; Lu, X.; et al. Spatio-temporal pattern of cross-continental invasion: Evidence of climatic niche shift and predicted range expansion provide management insights for smooth cordgrass. Ecol. Indic. 2022, 140, 109052. [Google Scholar] [CrossRef]
- Zheng, S.; Wang, J.; Sun, C.; Zhang, X.; Kahn, M.E. Air pollution lowers Chinese urbanites’ expressed happiness on social media. Nat. Human Behav. 2019, 3, 237–243. [Google Scholar] [CrossRef]
- Seikkula-Leino, J.; Salomaa, M. Entrepreneurial Competencies and Organisational Change—Assessing Entrepreneurial Staff Competencies within Higher Education Institutions. Sustainability 2020, 12, 7323. [Google Scholar] [CrossRef]


Disclaimer/Publisher’s Note: The statements, opinions and data contained in all publications are solely those of the individual author(s) and contributor(s) and not of MDPI and/or the editor(s). MDPI and/or the editor(s) disclaim responsibility for any injury to people or property resulting from any ideas, methods, instructions or products referred to in the content. |
© 2025 by the authors. Licensee MDPI, Basel, Switzerland. This article is an open access article distributed under the terms and conditions of the Creative Commons Attribution (CC BY) license (https://creativecommons.org/licenses/by/4.0/).