Article

Spatio-Temporal Coupling Coordination and Driving Mechanism of Urban Pseudo and Reality Human Settlements in the Coastal Cities of China

1
School of Geography, Liaoning Normal University, Dalian 116029, China
2
University Collaborative Innovation Center of Marine Economy High-Quality Development of Liaoning Province, Dalian 116029, China
3
Research Base of Urban Agglomeration in Central-South Liaoning of China Urban Agglomeration Research Base Alliance, Liaoning Normal University, Dalian 116029, China
4
Human Settlements Research Center, Liaoning Normal University, Dalian 116029, China
*
Author to whom correspondence should be addressed.
Land 2025, 14(10), 2081; https://doi.org/10.3390/land14102081
Submission received: 24 August 2025 / Revised: 14 October 2025 / Accepted: 15 October 2025 / Published: 17 October 2025

Abstract

The accelerated development of digital technologies during the 21st century has intensified requirements for Human Settlements (HS) infrastructure advancement in China’s maritime urban centers, driven by national objectives to forge a cohesive, technologically integrated state framework. This transformation has changed people’s work, learning, and entertainment patterns, leading to the rise in complex networks of pseudo human settlements (PHS). Traditional approaches to environmental research are insufficient for understanding the interactions between PHS and reality human settlements (RHS), which are interdependent and shape urban development. This study utilizes advanced methods such as the entropy weight method to determine indicator weights, the coupling coordination degree model to quantify the interaction intensity, the geo-detector to identify driving factors, and ArcGIS for spatial analysis to assess the interaction between PHS and RHS in 53 coastal cities from 2011 to 2022. The results show: (1) The coupling coordination degree rose initially but later declined, reflecting temporal differentiation; (2) The coordination of settlements varies across regions; (3) A migration trend from the northeast to southwest, with faster coordination improvement in the southwest; (4) Socio-economic development drives the coupling coordination, with big data technology enhancing the relationship. The findings guide sustainable urban development in coastal cities.

1. Introduction

Since the beginning of the twenty-first century, the information technology revolution is transforming the way society develops, changing people’s way of life and facilitating globalization in an unprecedented way [1]. Big data [2], a significant product of the information technology revolution, has fostered greater connectivity among individuals and streamlined various aspects of life. It has transformed everyday activities and led to the creation of pseudo-human settlements (PHS), which are built from data, information, and other digital components. Therefore, research on urban human settlements must evolve in tandem with these developments [3]. The report from the 20th Communist Party of China highlights several key priorities, such as creating a modernized industrial system, emphasizing economic development within the solid economy, and accelerating the progress of the digital economics. A major focus is on deeply integrating the with the aim of cultivate digital industry clusters that are competitive on the global stage [4]. As a result, traditional research on human settlements has struggled to fully interpret emerging phenomena in this context, highlighting the urgent need for research on PHS [5].
Reality human settlements (RHS) encompasses the combination of physical, social, cultural, psychological environments where individuals engage in daily activities such as living, working, and leisure [6,7]. The creation of this product is the result of the development of human society and its relationship with the natural environment [8]. RHS is a complex and multidisciplinary concept that encompasses fields such as urban planning science [9], geography [10,11] and settlement science [12,13] RHS are shaped by the interaction of various factors. Typically, the study of RHS requires consideration of elements like the economic development, social culture, natural environment, and more. This includes the physical environment crucial for human survival and daily life, such as living spaces, recreational areas, and natural ecological surroundings [14,15]. The study of RHS aims to improve people’s quality of life and life satisfaction through the creation of comfortable and beautiful, beneficial and safe environments. RHS significantly influence the development and health of individuals and society [16], making the study of RHS a long-standing focus of attention and a subject of research for numerous institutions in China. RHS have a direct influence on both the physical and mental health of individuals, as well as their overall sense of well-being. Therefore, enhancing RHS is essential for improving overall human well-being [17].
Pseudo human settlements (PHS) is based on RHS and is an information environment constructed through the selection, processing, and reporting of communication media, that is, a virtual living environment constructed by people within a network framework [18]. It should be emphasized that the term “Pseudo” is employed in this study in a value-neutral manner to describe a digital realm that closely mirrors and runs parallel to the RHS, highlighting their mirroring and complementary relationship in functional structure rather than implying a lack of authenticity [5]. Unlike RHS, it reflects the thoughts and behavioral awareness of residents. With the advent of the information age, the lifestyles and social habits of urban residents have undergone significant changes [19]. People now access information through various digital media and applications, such as social media, online shopping platforms, and mobile maps [20,21]. Urban residents use social communication software like WeChat and QQ, online shopping platforms like Taobao and JD.com, news reading websites like Sina News and Sohu News, iQiyi Video, KuGou Music, and other audio-visual entertainment platforms, as well as Dianping, 58 Tongcheng, Baidu Maps, and other lifestyle service apps. These platforms integrate text, images, and video into a structured framework, collectively creating an information-driven environment that encompasses diverse functions and services, thereby editing and mapping out an information foundation rooted in their subconscious. The research on PHS aligns with China’s policy direction of promoting digital transformation and building a Digital China [1], and is of great significance for understanding urban development patterns in the digital era [2]. The use of these digital media and applications has become an integral part of urban residents’ lives, influencing various aspects of urban life while also being influenced by digital media and applications [22].
“Coupling coordination” refers to the dynamic process of coordination and interaction among multi-system entities or their subsystems [23]. The term “coupling” originally originated from the field of physics [24], but its application has since expanded to encompass various disciplines such as economics [25,26,27], ecology [28,29], tourism studies [30,31,32], and geography. In HS research, the application of the coupling coordination model mainly focuses on the following core aspects: (1) In-depth exploration of the coupling coordination relationship between various systems within the HS [33,34]; (2) Analysis of the coupling coordination mechanism between different forms of the HS [35]; (3) studying the interaction and coupling coordination status between the HS and external systems. The introduction and application of the coupling coordination model in the field of human geography has not only greatly enriched the research methods and methodology of this discipline, but also made an important contribution to promoting the continuous progress and development of human geography [36].
The economic development of coastal cities in China has emerged as a central focus of global economic growth, with China’s industrial economy increasingly aligning with the trend of coastalization, which has become a new axis of development, thereby driving the entire urban landscape of China toward more ambitious objectives [37]. The strategy of “Maritime Power” was first introduced at the 18th National Congress of the CPC. Building on this foundation, the 20th National Congress further defined the objectives of “developing the marine economy, safeguarding the marine ecosystem, and accelerating the construction of a strong maritime nation”. These clearly emphasize the importance of the coastal zone. Since the implementation of the marine power strategy, coastal provinces and cities have achieved remarkable results in coordinated development, with continuous improvement in the ecological environment, enhanced innovation momentum, and a comprehensive upgrade in openness to the outside world. These developments have played a significant leading role in promoting high-quality economic development in China. However, rapid development has also brought challenges. Resource and environmental pressures have increased, and issues such as environmental pollution and ecological destruction have become increasingly prominent. At the same time, regional development imbalances, urban-rural gaps, and coastal-inland gaps still require attention. In addition, although the industrial structure has been continuously optimized, it still needs further transformation and upgrading to cope with competitive pressures from domestic and foreign markets. To this end, research on the PHS of coastal cities is not only necessary for theoretical discourse but also crucial for guiding practical applications. It is necessary to explore the spatio-temporal distribution patterns of the human settlement environment in coastal cities and the coupling and coordination mechanisms between them and the RHS, with a view to promoting the integration of digital and physical environments [38]. This will help accelerate the construction of a HS that meets the higher-level needs of the people, enhance their sense of happiness and fulfillment, conform to new urban construction goals, build livable, green, and smart cities, and promote the coordinated development of coastal areas [39]. At the same time, it has important practical significance for enhancing China’s comprehensive competitiveness and realizing its goal of becoming a maritime power [40].
In summary, although research on HS has achieved significant results, the following limitations remain: the research in this field started relatively late, and its content needs further expansion and refinement; internal influencing factors and their driving mechanisms require more in-depth investigation; existing studies have predominantly focused on inland cities, resulting in insufficient attention to coastal urban systems—yet, given the distinctive and representative characteristics of coastal cities in China, research on their human settlement environment remains essential. To address these issues, this study constructs evaluation systems for both Real Human Settlements (RHS) and Pseudo Human Settlements (PHS) targeting 53 coastal cities in China. Data were processed using the entropy weight method, and a coupling coordination model was applied to explore the synergistic relationships within each evaluation system. The spatial distribution characteristics of sample data across regions were visualized using standard deviation ellipse analysis, while a geographic detector was used to examine the correlations among systems, indicators, and coupling coordination. The study ultimately evaluates the suitability of human settlements in coastal cities of China and identifies the overall impact mechanisms of each evaluation system and indicator. This research aims to enrich the spatial scale of HS studies, provide new insights for interdisciplinary scientific breakthroughs in related fields, and offer novel perspectives for promoting coordinated development and optimization of human settlements in these 53 coastal cities. As an applied practice in human geography at the coastal city scale, this study provides scientific support for diversifying HS development pathways, advancing sustainable urban development, and facilitating high-quality development in coastal regions.

2. Theoretical Framework

2.1. Constituent Elements

The RHS is composed of five systems: residential, human, support, environmental, social systems [41,42]. The human systems emphasize the satisfaction of basic human needs. The residential system fundamentally addresses human habitation environments and their associated conditions. The support system encompasses fundamental facilities critical for human survival and biological continuity, while environmental system addresses the impact of natural environmental factors on the RHS. The social system includes various aspects of human interaction, such as social relations, economic development, law, welfare, and more. Each of the five systems contains multielement, which interact with each other to form a complex, multi-functional RHS [20].
The PHS consists of five systems: the social, information, entertainment, living, and tool systems [43]. Social systems emphasize the interaction and connection between people through virtual spaces or digital platforms. Information systems are primarily responsible for the collection, processing, storage and dissemination of information. Entertainment systems provide a variety of entertainment options within the virtual space, including virtual games, interactive movies, concerts, and immersive experiences. Living systems are concerned with how individuals conduct their daily activities and organize their lives in a virtual space. Tool systems involve the use of virtual tools and devices that help users better live, work, socialize, etc., virtual environments [44].
Both the RHS and PHS are based on human beings, and they influence [45,46], constrain, and interfere with each other, jointly affecting the quality of urban habitat development, so the research on the urban habitat should also keep abreast of the times (Figure 1).
This study presents a conceptual framework in Figure 1 that outlines a progressive structure from foundational concepts to theoretical synthesis. The initial phase involves the deconstruction and definition of the urban human settlement into two core dimensions: the Reality Human Settlement, or RHS, and the Pseudo Human Settlement, or PHS. The RHS comprises five foundational systems operating in physical space: Residential, Support, Environmental, Human, and Social [47]. The PHS is constituted by five parallel systems existing in digital space: Social, Information, Entertainment, Living, and Tool. The framework culminates in its core proposition, which posits a dynamic and interactive coupling between these two human-centric dimensions. It establishes that the RHS and PHS do not operate in isolation but are engaged in a continuous process of mutual influence, constraint, and transformation [48]. Together, they form an integrated analytical system that constitutes the theoretical foundation of this research.

2.2. Technology Roadmap

This study integrates methodological frameworks from human settlement sciences and urban geography to examine the spatiotemporal evolution of HS. This research accomplishes its objectives through analyzing critical socio-structural phenomena and emerging challenges, including digital-physical convergence, socio-technological transformations in the information era, HS optimization under quality-oriented paradigms, and metropolitan governance dilemmas in China.
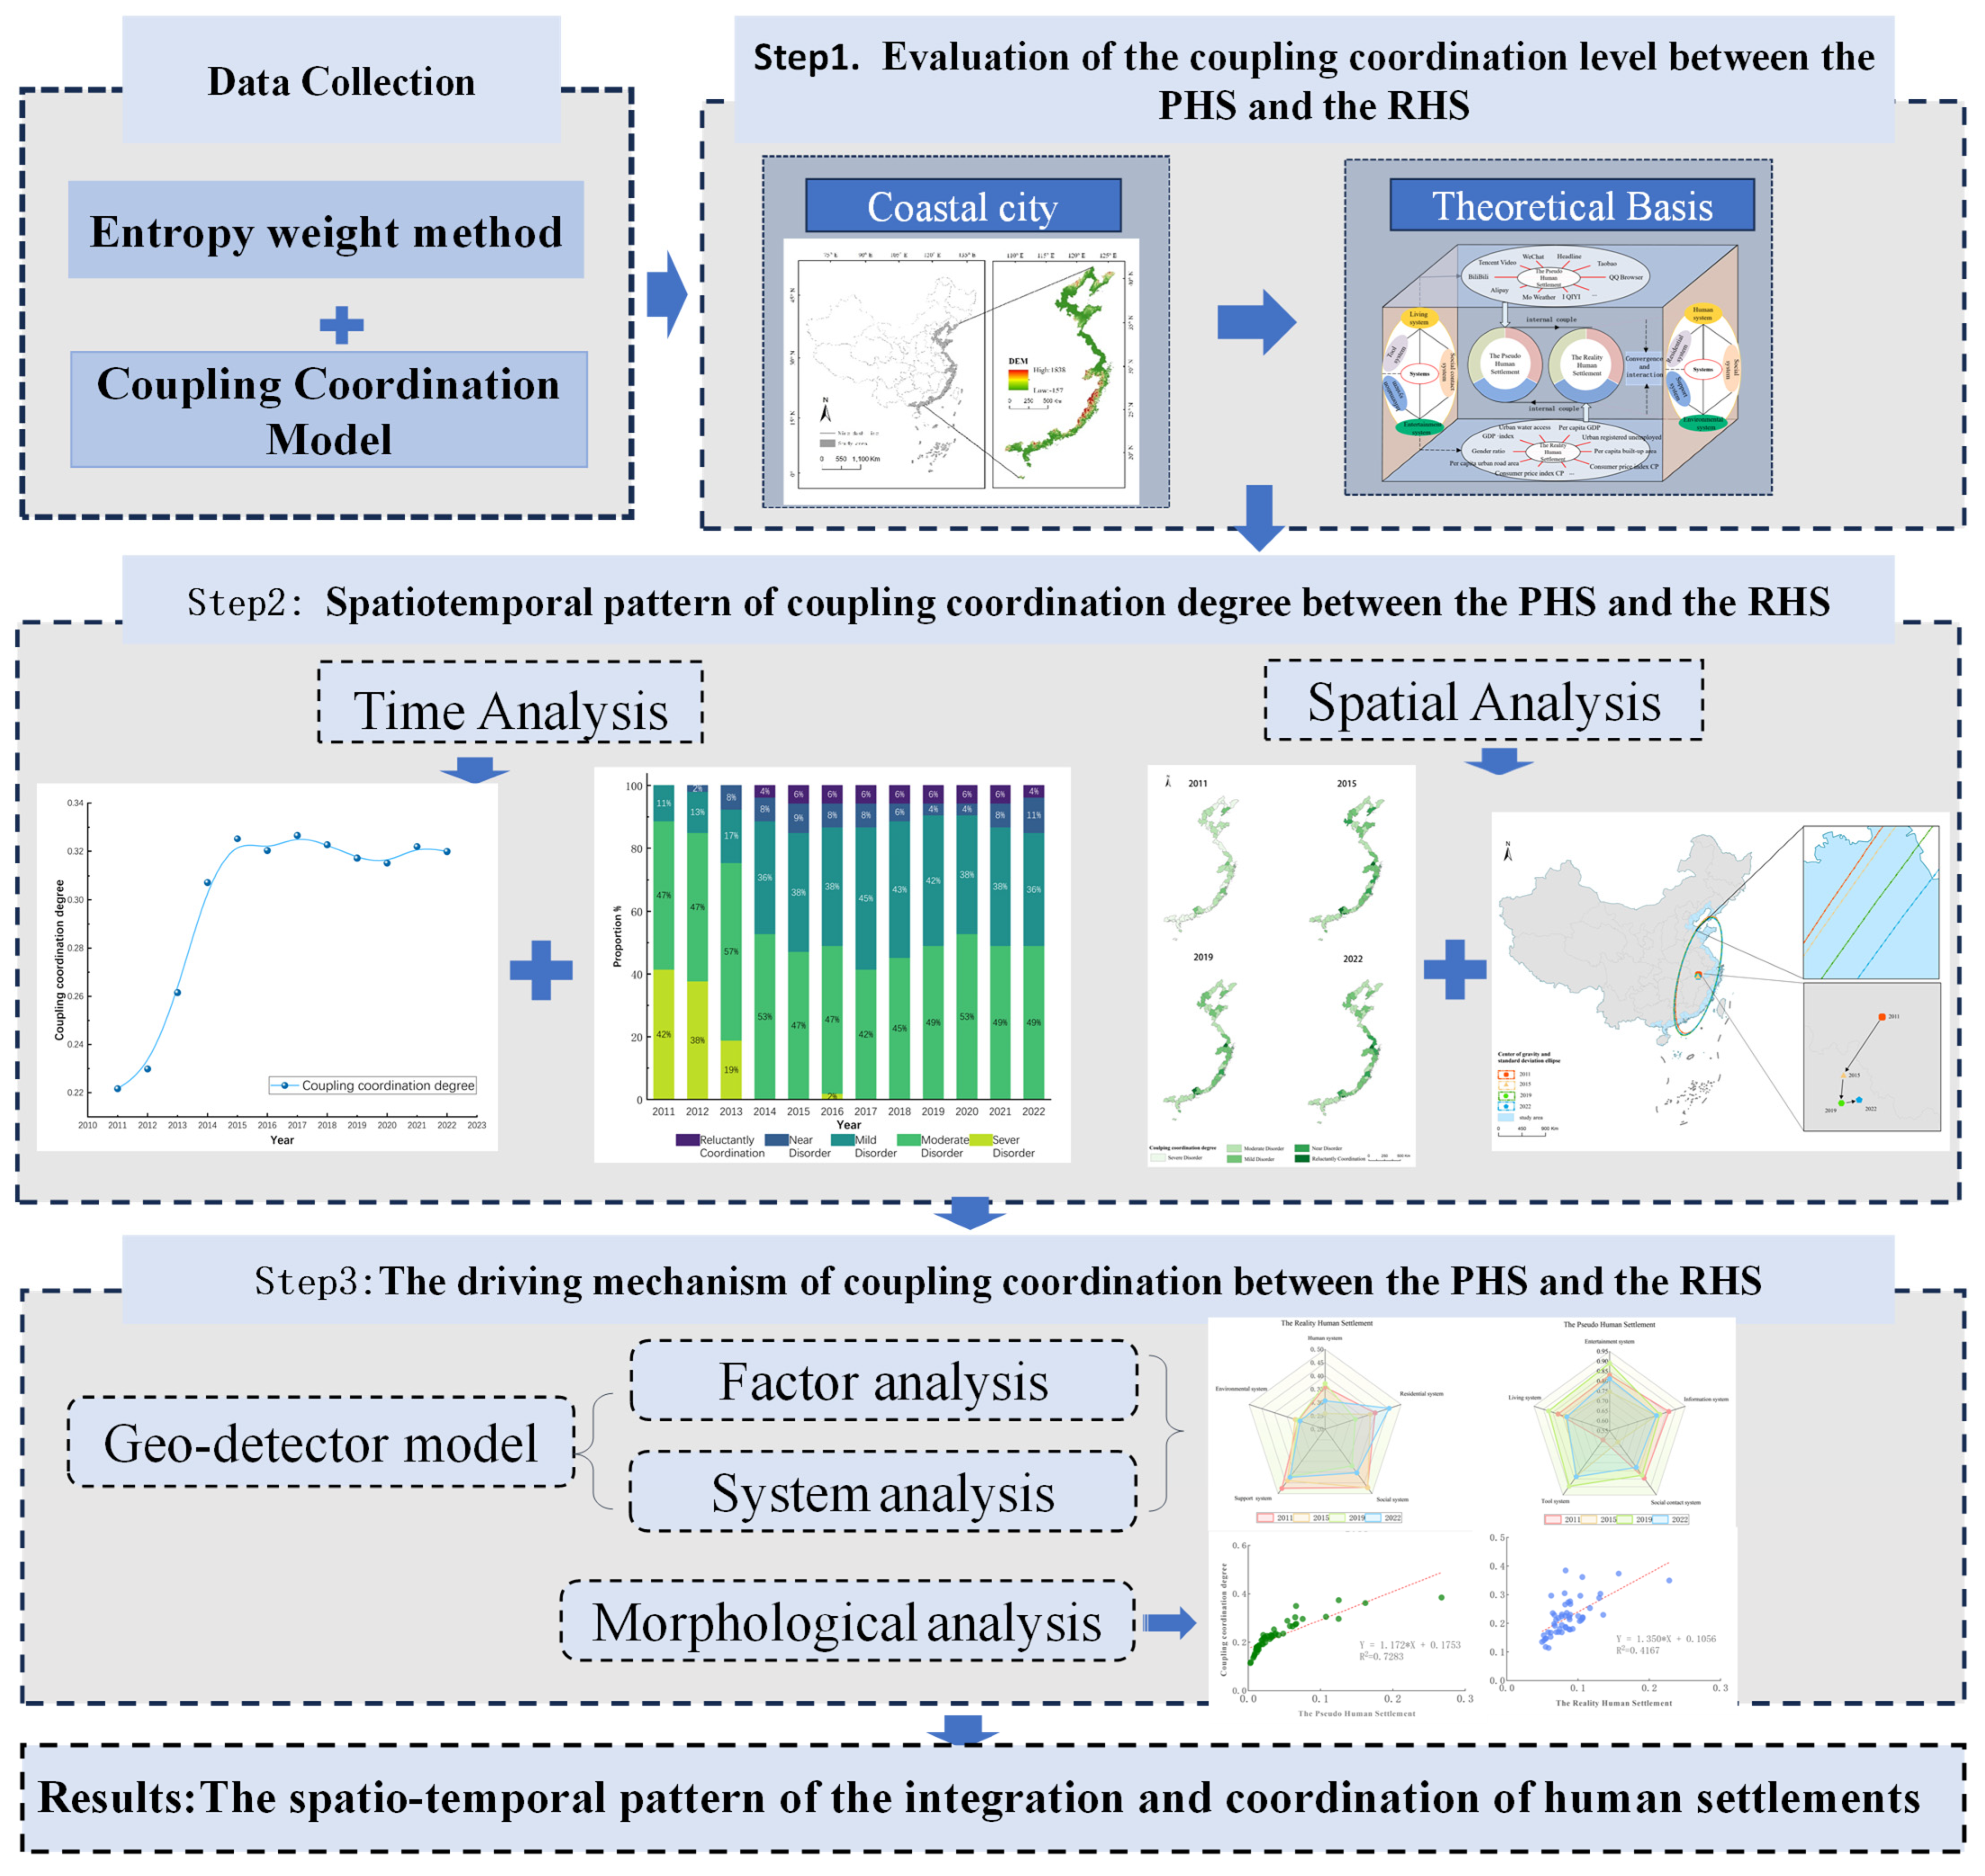
The temporal trends and spatial patterns of PHS and RHS across 53 coastal cities in China from 2011 to 2022 were examined through the crawling and mining of the Baidu Index. This study examines temporal-spatial dynamics, structural imbalances, and causal mechanisms of CCD evolution within China’s 53 prefectural-level municipalities over a twelve-year period (2011–2022). It achieves this by integrating socio-economic data, population census information, and relevant graphical representations. A corresponding technology roadmap was developed with the aid of geographic information technology, in combination with spatial geography (Figure 2).
This figure illustrates the analytical workflow of this research. It begins with the construction of the PHS and RHS evaluation systems. The core analysis involves calculating the comprehensive development levels of both systems, leading to the measurement of their CCD. The spatio-temporal analysis of CCD is then conducted, followed by the exploration of driving mechanisms using the Geo-detector model. Finally, the conclusions and policy implications are derived, forming a closed-loop research process. The arrows indicate the sequential and logical flow from data collection to final outcomes.

3. Overview of the Study Area and Data Sources

3.1. Study Area

China’s coastal regions serve as the core drivers of the nation’s marine economic development, encompassing 53 coastal cities across 11 provinces (regions and municipalities). These regions represent one of the most dynamic, open, and innovative areas in China’s economic landscape [49].
As a pivotal economic engine of China, the 53 coastal cities, despite constituting a modest portion of the national land area, contribute disproportionately to the nation’s economy. This region generates nearly half of the national GDP, accounts for over three-fifths of the total foreign trade, and serves as the dominant hub for the digital economy. As the maritime gateway for the Belt and Road Initiative, the region has formed a collaborative development pattern among the Yangtze River Delta, Pearl River Delta, and Beijing-Tianjin-Hebei metropolitan areas, while also cultivating regional growth poles such as the Shandong Peninsula, West Coast of the Taiwan Strait, and Beibu Gulf. In terms of ecological civilization construction, 53 cities have established 80% of the national marine ecological protection areas. Over the past five years, China’s nearshore waters have witnessed remarkable improvements in water quality, accompanied by a continuous enhancement of marine ecosystem carbon sink capacity. Notably, the Yangtze River Delta urban agglomeration is actively developing the Digital Yangtze River Delta, with its artificial intelligence industry accounting for one-third of the national total, serving as a benchmark for regional digital transformation [50].
This study takes these 53 coastal cities (including four municipalities and cities with independent planning status, such as Shanghai, Tianjin, Shenzhen, and Qingdao, as well as 49 prefecture-level cities) as empirical objects to systematically explore the coupling and coordination mechanism between the RHS and PHS of coastal cities. The selected cities are all located at key nodes along China’s 18,000 km mainland coastline, encompassing national central cities, important port cities, and distinctive coastal tourist cities. They exhibit a spatial distribution characterized by “three major clusters and multi-center linkage”, demonstrating significant regional representativeness and typological diversity. These cities exhibit gradient differences in terms of digital transformation levels, the proportion of marine economy, and population density, providing an ideal sample for studying the integration of digital-physical spaces (Figure 3).

3.2. Model Construction and Data Sources

This paper empirically studies the CCD of RHS and PHS, analyzes their spatial and temporal evolution, quantitatively explores their influencing factors, and elucidates the logic behind their driving mechanisms. The study area consists of 53 prefecture-level cities along the coast of China. Considering the comparability of PHS and RHS, as well as the temporal continuity of big data, the study period covers 2011 to 2022.
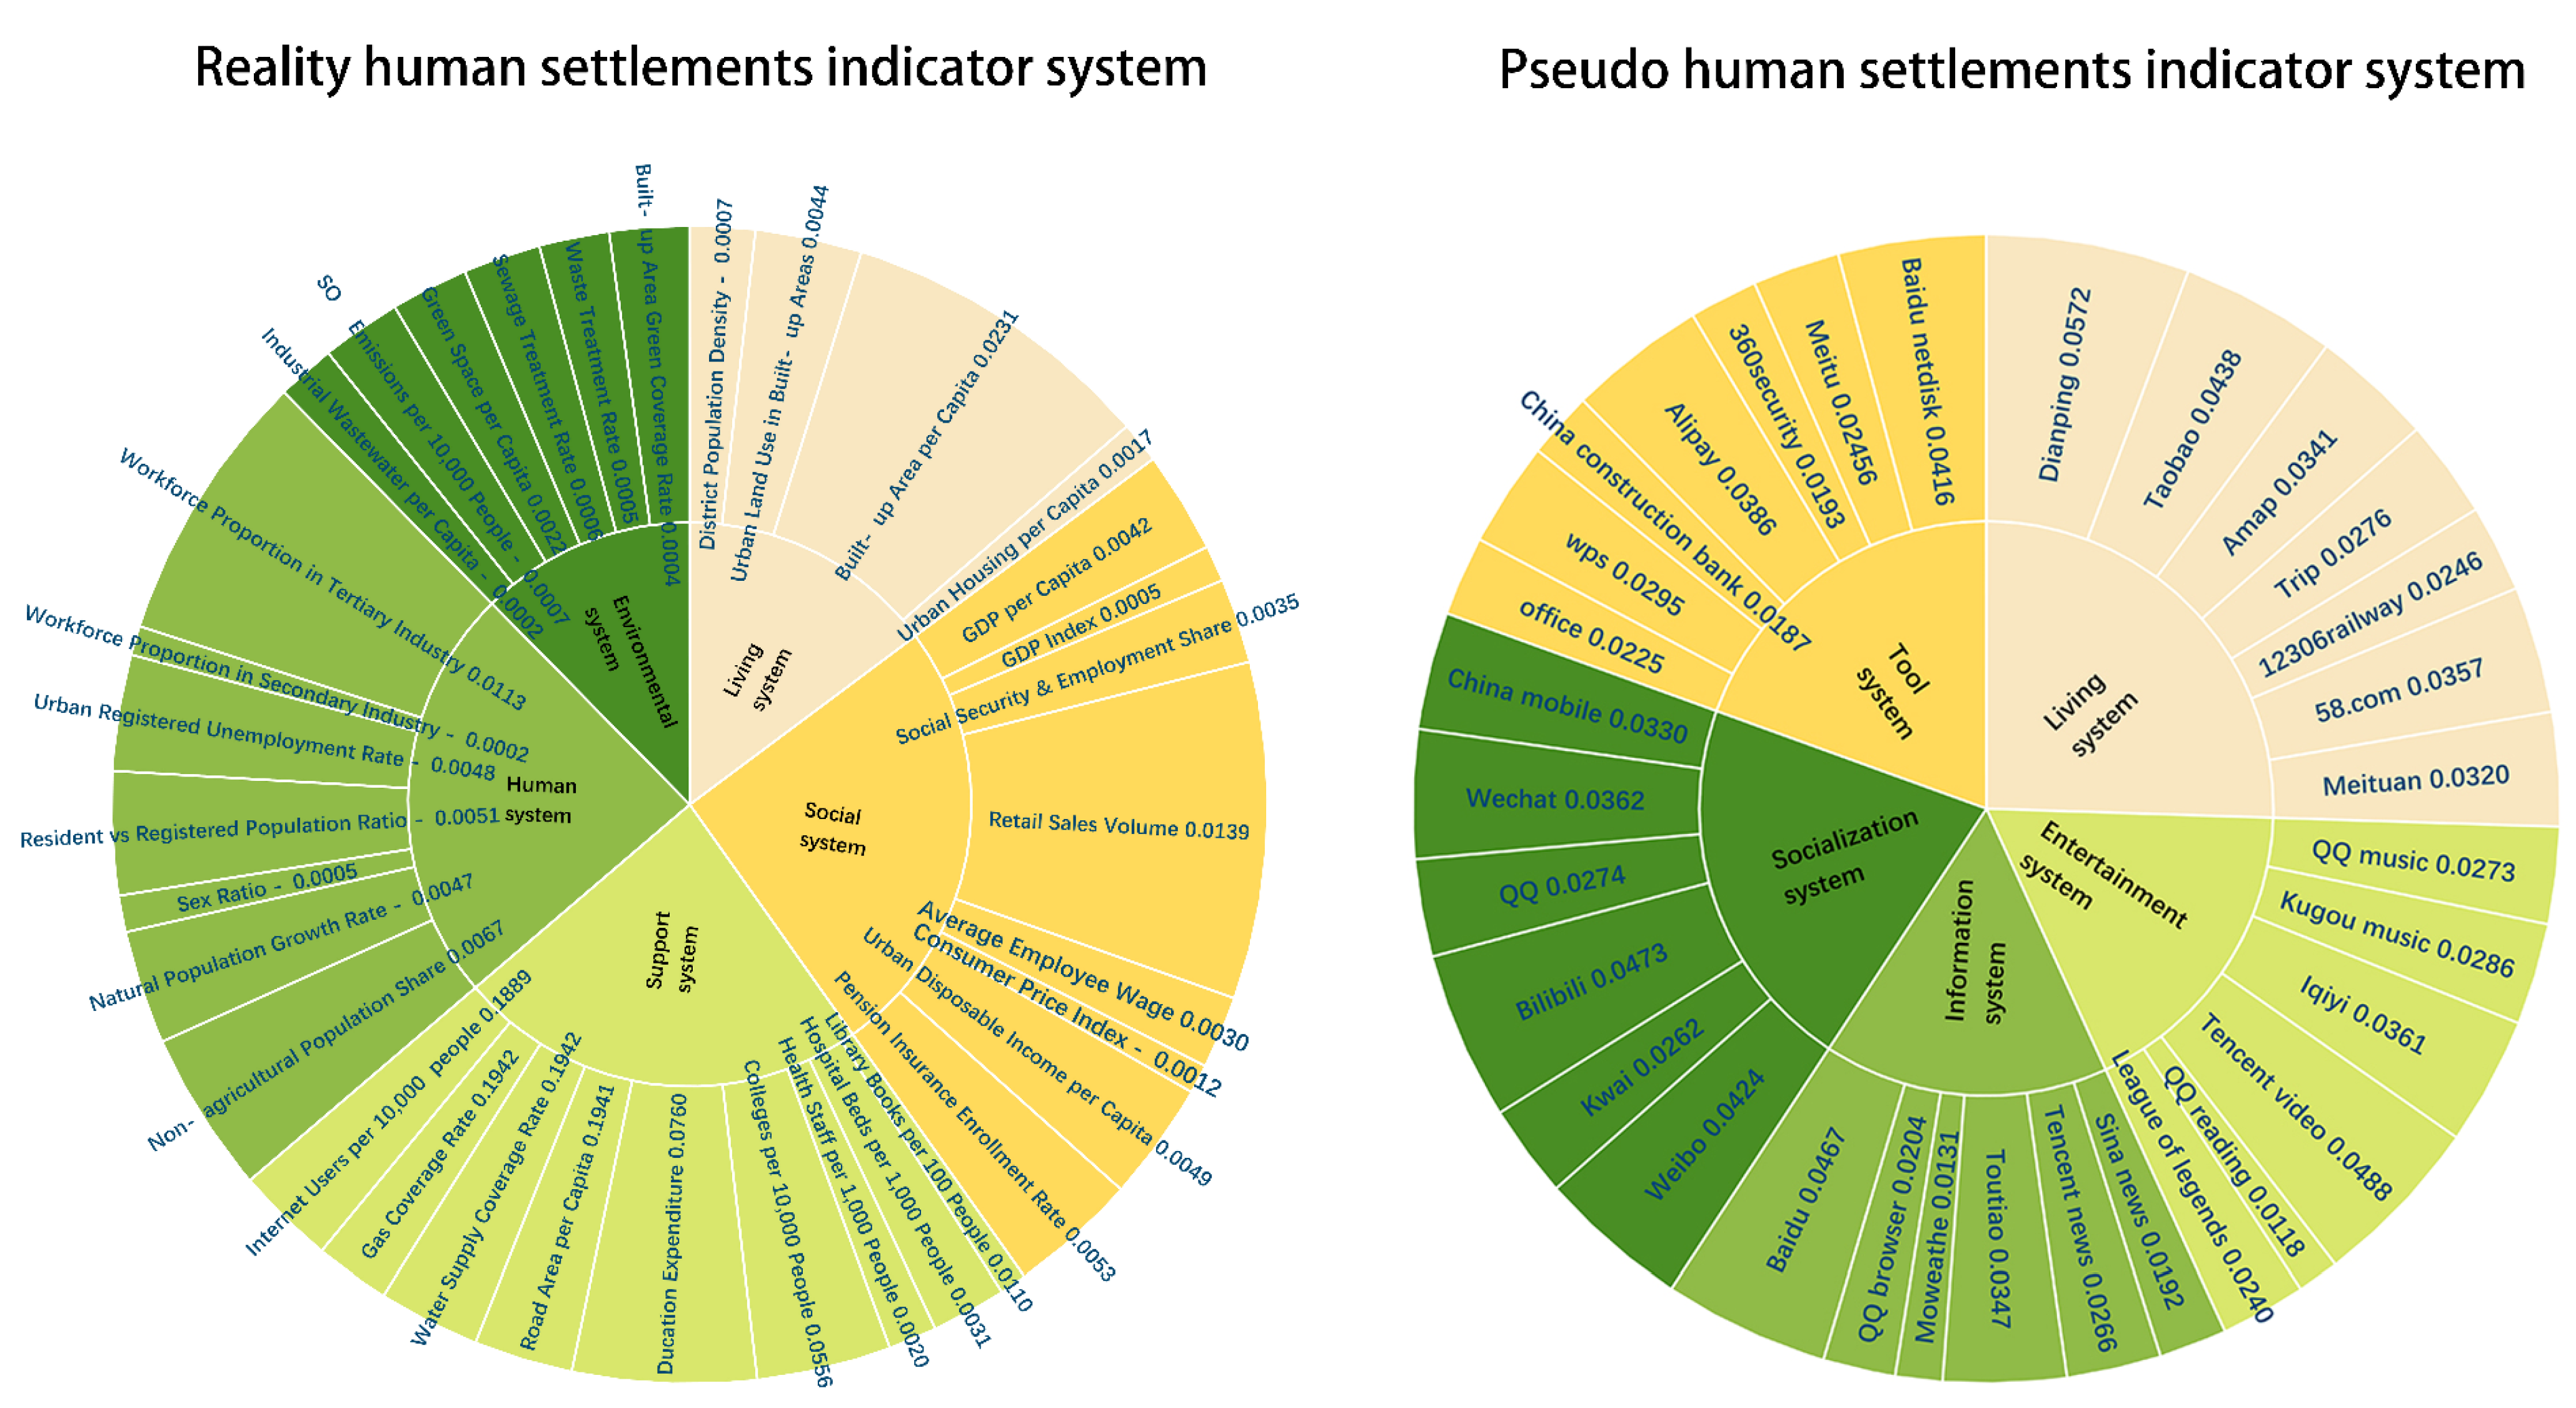
The urban PHS-RHS coupling coordination evaluation system constructed in this study consists of two core modules. In terms of PHS evaluation, based on the principles of geographical time-space attributes, system representativeness, and data availability, a multi-level evaluation framework was established that includes five subsystems (social, information, entertainment, lifestyle, etc.), 14 intermediate layers (news reading, travel, work, study, etc.), and 32 specific indicators. The selection of indicators fully considers the behavioral characteristics of urban residents, covering representative digital platforms such as WeChat, Tencent News, JD.com, and Baidu Maps. The research data is sourced from the Baidu Index Open Platform, spanning the period from 1 January 2011, to 31 December 2022 (a total of 4383 days). A data collection framework was established using Microsoft Excel. Daily data for 32 indicators across 53 cities were manually collated and organized, resulting in a complete dataset totaling 7,433,568 observations. The annual average method was used to integrate the time series data to accurately characterize the annual trends in the development of PHS in each city. All indicator data underwent standardization and outlier testing to ensure the scientific and reliable nature of the evaluation results (Figure 4).
In terms of RHS, based on the principles of comprehensiveness and systematicity of HS science, and building on the work of Dos Santos, Wu Liangyong, and others, we constructed a multi-level evaluation framework consisting of five subsystems (living, entertainment, information, social interaction, and tools), 12 intermediate layers (population status, employment status, land resources, etc.), and 34 specific indicators. Data sources include provincial and municipal statistics bureaus, statistical information networks, and geographic information databases from the same period. Data sources include provincial and municipal statistics bureaus, statistical information networks, and geographic information databases from the same period. The mimetic and real indicator systems are detailed in Figure 4, where “-” denotes negative attributes and numbers denote weights.

4. Research Methods

4.1. Coupling Coordination Degree Model

The Coupling Coordination Degree (CCD) model quantifies the synergistic coordination between subsystems, reflecting both the coupling strength and the overall coordination level [51,52]. Geographers commonly use it to expound the patterns as well as mechanisms of interaction and impact within sophisticated human-environment relationship. Thus, this study uses this model to assess the CCD. The current commonly used CCD specification formula is [53,54]:
C n H S 1 , H S 2 , , H S n = n · i = 1 n H S i i = 1 n H S i n 1 / n
where HSi (i = 1, 2, …, n) denotes the standardized evaluation score of the *i*-th subsystem (normalized to [0, 1] via entropy weighting or other methods). n is the number of subsystems (here, n = 2n = 2 for PHS and RHS). Cn represents the coupling degree (C), bounded by [0, 1]. A value of 0 indicates no coupling, while 1 signifies full coupling. Considering the objective facts of the PHS and RHS study area in this study, the construction of the two coupled and coordinated operation models is as follows [53]:
C 2 P H S , R H S = 2 · P H S R H S P H S + R H S 2
Components HS1 to HSn represent distinct habitat subsystems, while RHS and PHS correspond to authentic versus artificial habitat constructs. C is the coupling degree, with values in the interval [0, 1] [55].
For deeper exploration of the CCD, the synchronization level (D) for these settlements was computed through systematic analysis of their interactive relationships, utilizing the coupling degree (C) as the foundational metric. The computational framework is expressed as follows:
T = α · PHS + β · RHS , D = C × T
where D is the CCD, T serves as the overall measurement index for both, the coefficients α / β require calibrated determination based on the geographical particularities of the study region and uniform distribution principles. Typically, the CCD can be divided into ten categories using the median segmentation method [56] (Table 1).

4.2. Geo-Detector Model

Geographical detectors have been widely applied in environment, society, and geography [54]. This module employs mathematical modeling to systematically analyze driving forces affecting CCD, utilizing the operational expression:
q = 1 h = 1 L N h δ h 2 N δ 2 = 1 S S W S S T
Within this analytical framework, the q-value ranges between 0 and 1, providing a precise measure of how strongly variable X influences the spatial distribution of CCD (Y). A q-value approaching 1 indicates that factor X completely explains the spatial pattern of Y, while q = 0 suggests no statistical relationship exists. Intermediate values offer gradations of explanatory power: values above 0.5 typically denote strong influences, while those below 0.2 indicate relatively weak effects. The model decomposes total variance (SST) into within-stratum variance (SSW) and between-stratum variance (SSB), where Nh represents the sample size in stratum h, δ2h denotes the variance within each stratum, and L is the total number of strata. This approach has proven particularly valuable for identifying key drivers in complex human-environment systems and can effectively handle both quantitative and categorical variables in spatial analysis.

4.3. Center of Gravity and Standard Deviation Ellipse Models

The center of gravity (CoG) and the standard deviation ellipse (SDE) are effective spatial analysis tools when studying the spatial evolution characteristics of the CCD in coastal cities in eastern China [57]. By analyzing the GoG and SDE, the evolutionary characteristics of CCD can be understood in depth, providing data support for regional development planning [58].
  • The CoG: The CoG indicates the position of the spatial center of the CCD and its variations, providing insights into whether the CCD is experiencing a trend of centralization or spatial migration. The corresponding calculation formula is presented below:
    X = i = 1 n P i X i ¯ / i = 1 n P i    Y = i = 1 n P i Y i ¯ / i = 1 n P i
    θ i j = n π / 2   +   a r c t a n y i y j / x i x j
    D i j = C · y i y j 2 + x i x j 2  
In this model, X / Y d correspond to the CCD gravity centers for Chinese coastal municipalities. The geospatial coordinates of the i-th municipal unit are expressed as X ¯ i / Y ¯ i , where P i represents the CCD magnitude of individual municipalities, and θ characterizes the directional angle of gravity center migration. x i , y i , x j , y j respectively document CCD gravity positions for Chinese coastal cities in years i and j. Eastward displacement occurs when θ = 0 . D i j quantifies the gravity center’s migration distance, functioning as the geodetic conversion parameter between coordinate systems. This standardized conversion factor, typically derived from projected coordinates, maintains a constant value of 111.111 km.
2.
The SDE: The SDE reveals the spatial expansion and main direction of CCD by depicting the distribution range and directionality of CCD.

5. Results

5.1. Time Course of CCD

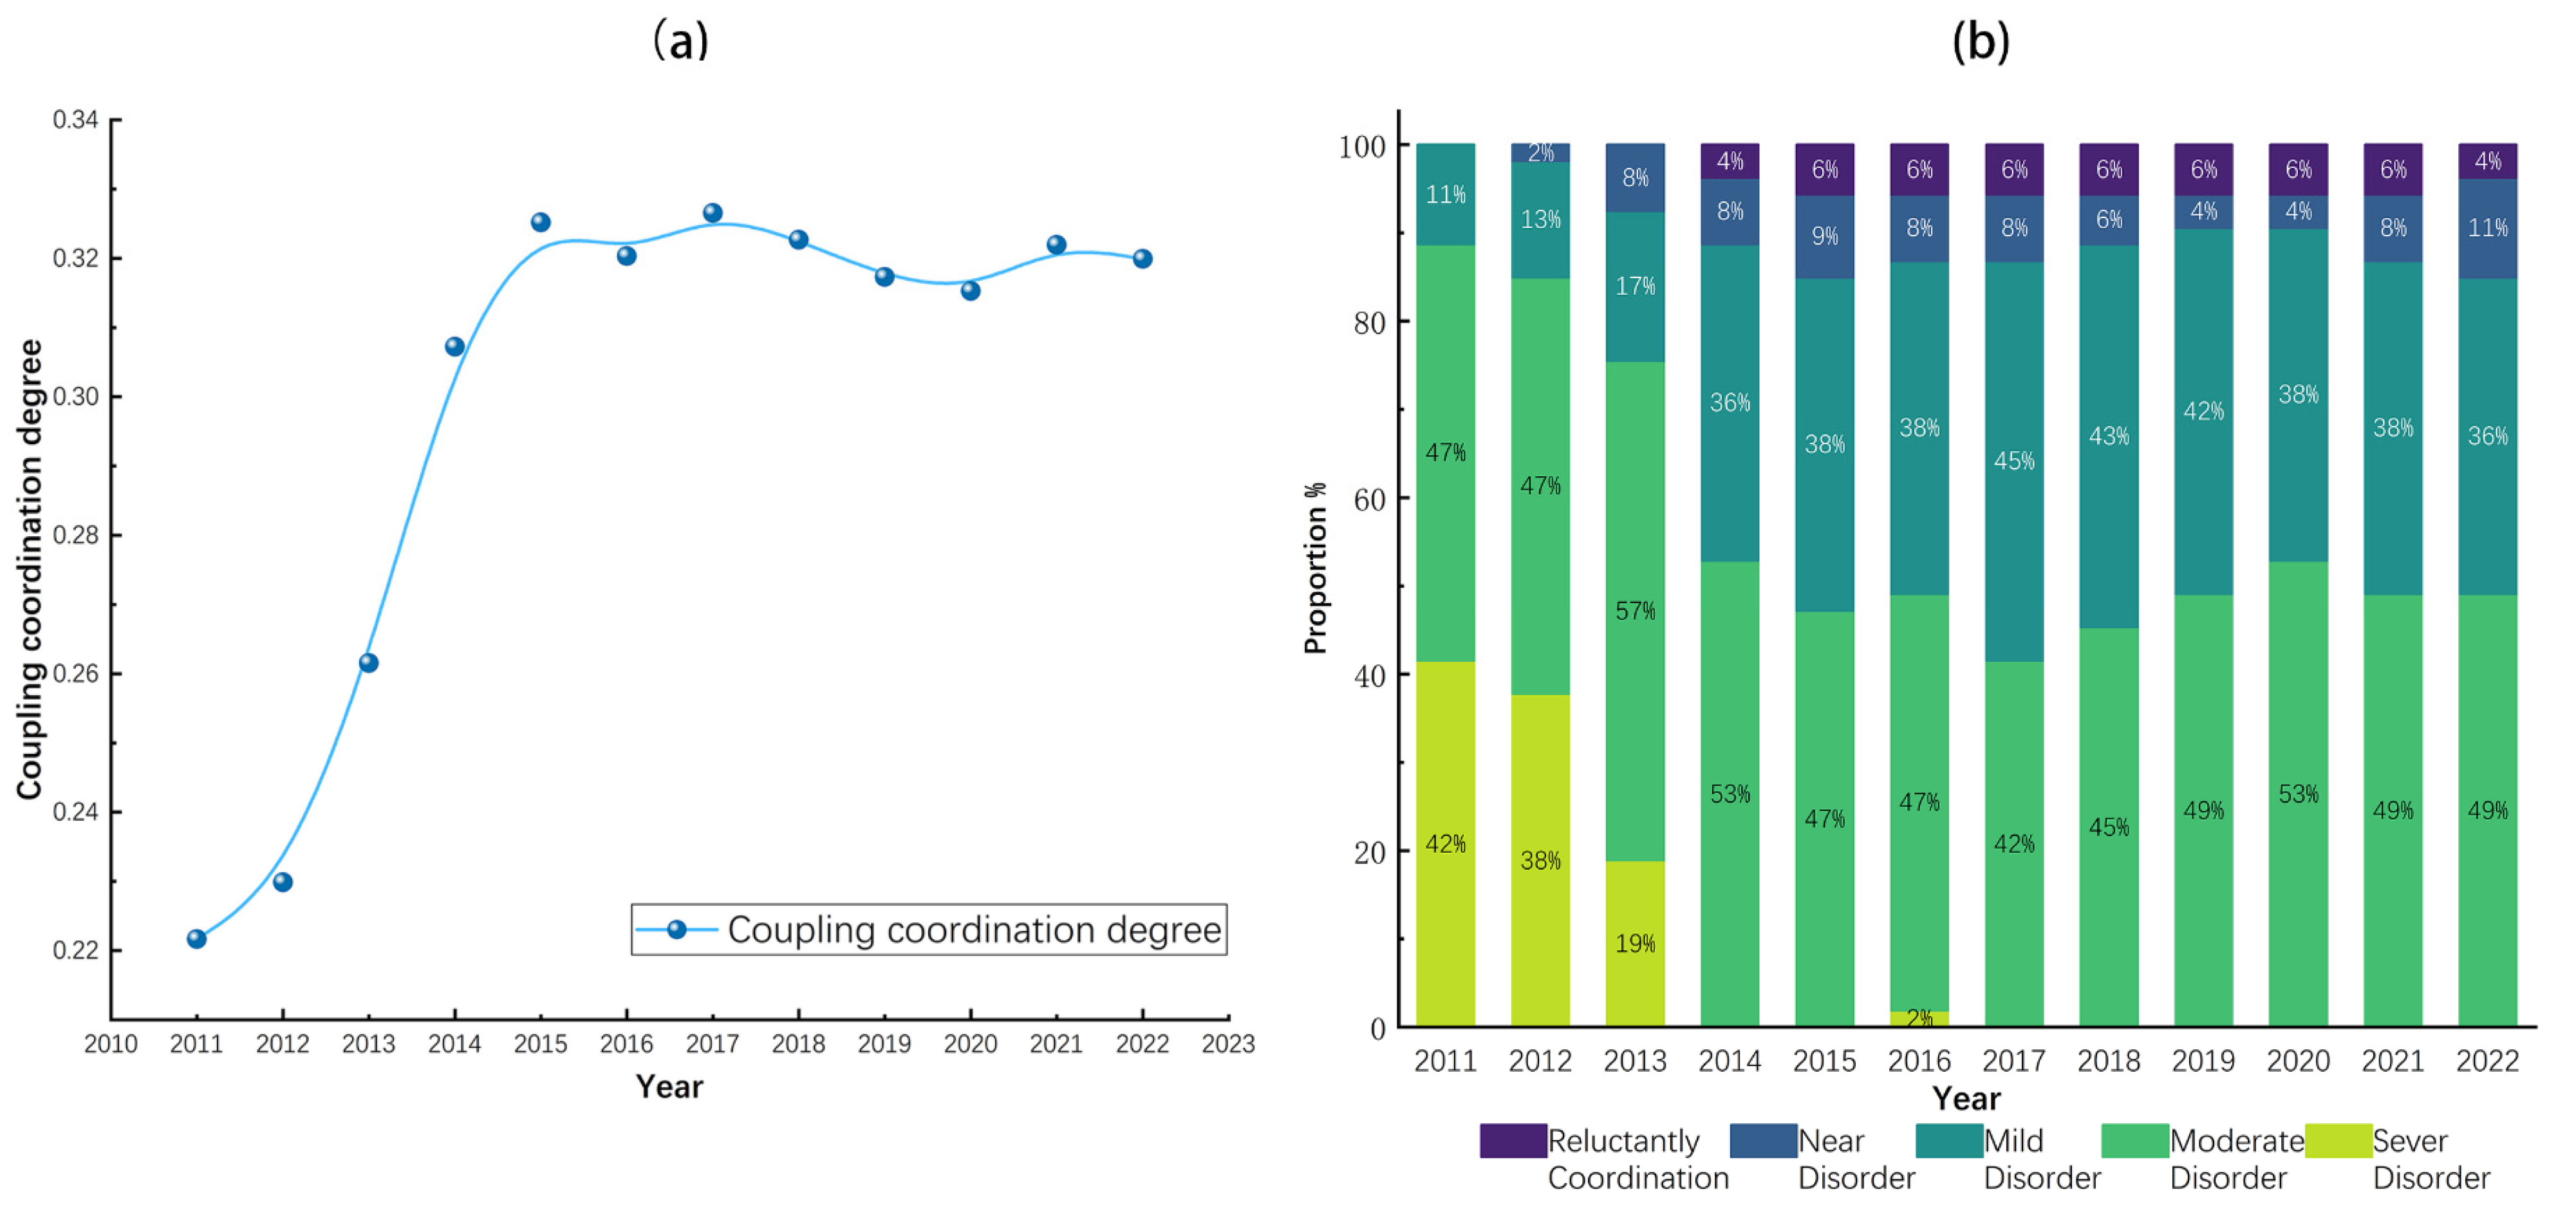
General characterization of the CCD. The CCD generally exhibits mild disorder, with this condition showing a fluctuating growth trend over time. Specifically, during the observation period from 2011 to 2022, the CCD for 53 coastal cities in China was calculated and averaged at 0.2991, a value that distinctly reflects the mild disorder prevalent in these regions during this time. From 2011 to 2017, the trajectory of the CCD exhibits a significant fluctuating upward trend. Specifically, in 2011, the CCD was 0.2216, falling within the moderate disorder range; after several years of fluctuating growth, by 2014, the CCD had risen to 0.3072, transitioning into the mild disorder range. Between 2016 and 2022, the CCD, while maintaining mild disorder, demonstrated a fluctuating upward trend, with coordination levels evolving to higher stages during this period. This discovery offers an important reference for improving our understanding and optimization of the CCD.
Stage characterization of CCD. The degree of CCD settlements between PHS and RHS shows a gradual increase and presents a phase crossing. Over the observation period from 2011 to 2022, for 53 cities in coastal China, moderate dislocations consistently dominated their PHS and RHS typology. Additionally, from the viewpoint of temporal progression, 2015 can be regarded as a pivotal year, signifying the separation of this period into two distinct phases. In the low-level development phase from 2011 to 2015, moderate disorders, while still constituting a significant portion, gradually decreased in their relative share. Simultaneously, the percentage of mild disorders gradually increased and began to dominate. Additionally, this phase was marked by a year-on-year decrease in severe disorders; specifically, the percentage of severe disorders was 42% in 2011, decreased to 38% in 2012, and further declined to 19% in 2013, after which severe disorders disappeared entirely (Figure 5).
Mild disorder persists as the predominant developmental state as we transition into the medium-level evolutionary phase between 2016 and 2022. It is crucial to emphasize, however, that higher levels of coordination—specifically, near disorder and reluctant disorder—began to emerge during this phase, and the proportion of these two coordination levels gradually increased. Additionally, intermediate levels of mild disorder, near disorder, and reluctant disorder consistently persist during this stage, exhibiting a tendency to fluctuate and increase annually, which is characteristic of stage transitions. Specifically, the proportion of mild disorder was 38% in 2016, while the proportions of near disorder and reluctant disorder fluctuated and increased from 8% and 6% in 2016 to 11% and 4% in 2022, respectively. This discovery offers a significant academic reference that enhances the understanding of the dynamic evolution of CCD.

5.2. Spatial Pattern of CCD

The overall spatial pattern of the “three centers of gravity” reveals that the CCD in coastal cities exhibits non-equilibrium and notable regional differences (Figure 6).
In 2011, the 53 coastal cities in China spanned three coupling stages, situated between the severe disorder stage and the mild disorder stage, with Shanghai having the largest CCD at 0.38 and Fangchenggang having the smallest at 0.11. None of these cities were found to be in the reluctantly disordered stage or higher. The moderate disorder period accounts for 47.16% of the total number of cities, with the aggregation effect primarily concentrated in the Bohai Rim and the Yangtze River Delta regions. Key cities include Tangshan, Tianjin, Wenzhou, Ningbo, and others.
In 2015, China’s coastal cities exhibited an overall improvement in CCD levels. Municipalities classified under moderate disorder maintained stable quantities, while those previously in severe disorder phases were entirely eliminated. Concurrently, urban units in transitional disorder phases demonstrated sixfold expansion (6 → 20), with spatial clustering predominantly observed among settlements approaching disorder thresholds and those exhibiting incipient coordination deficits. For instance, Cangzhou and Tangshan near Tianjin, and Nantong, Jiaxing, and Hangzhou near Shanghai.
In 2019, the overall CCD of coastal cities showed a mild decline, mainly driven by a decrease in the number of cities in the near-disorder stage, which dropped from five to two. Tianjin, Wenzhou, and Dalian exited the near disorder stage.
In 2022, the CCD of coastal cities rebounded compared to 2019. This was primarily reflected in the decline in the proportion of cities in the mild disorder stage and the increase in the proportion of cities in the near-disorder stage. Yantai, Nantong, Qingdao, and Guangzhou entered the near disorder stage. The city with the highest CCD shifted from Shanghai Municipality to Shenzhou City, at 0.56, while the city with the lowest CCD remained Fangchenggang City, at 0.21.

5.3. Analysis of the Evolution of Spatial Patterns of CCD

5.3.1. Center of Gravity Migration Analysis

Through the application of ArcGIS’s Central Feature analysis tool in the Spatial Statistics module 24, multi-temporal assessments of CCD spatiotemporal centroids were conducted for coastal urban clusters in China. This included quantitative characterization of displacement metrics (distance, orientation) and generation of spatiotemporal trajectory mappingto graphically represent centroid dynamics (Figure 7).
Between 2011 and 2019, the center of gravity of the CCD in coastal cities of China shifted from Huangshan City to Jingdezhen City, reflecting a migration trend from northeast to southwest, with the southwest experiencing faster growth than the northeast.
During the 2019–2022 observation window, the CCD spatiotemporal centroid of China’s coastal urban agglomerations remained anchored within Jingdezhen in Jiangxi Province, demonstrating a directional migration vector from southwestern to northeastern sectors while maintaining predominant spatial persistence in the southwestern geographical domain. This is primarily due to the higher CCD and larger base in the coastal areas of northeastern China, which makes upgrading more challenging than in the southwestern region; moreover, the national policy of “prioritizing the development of the eastern part of the country” also creates favorable conditions for improving HS in the southwestern coastal region of China.

5.3.2. Standard Deviation Elliptic Analysis

Employing the Spatial Statistics toolbox within ArcGIS23, the SDE methodology was applied to conduct quantitative assessments of CCD spatial distribution parameters in China’s coastal urban agglomerations across all study periods. This included generating spatiotemporal visualization of SDE temporal variations through elliptical trajectory mapping (Figure 7).
Between 2011 and 2022, the CCD in China’s coastal cities demonstrates a shift toward the southwest, indicating that the southwest region’s coastal cities experience faster growth compared to other areas. From 2011 to 2021, the angle θ of the SDE shows a steady upward trend, with its orientation aligning in a northeast-southwest direction. This spatial disparity reveals that urban CCD development dynamics within the northeastern sector of the SDE axis demonstrate diminished growth momentum relative to their southwestern counterparts, aligning with core-periphery theory in regional economics. During the 2011–2022 period, the SDE expanded by 11,838.06 km2, revealing a southwestward-oriented decentralization trend in the CCD patterns of China’s littoral urban centers. This implies that the spatial agglomeration of the CCD in this region is decreasing, suggesting that the developmental disparities among China’s coastal cities are narrowing. Under the sustained advancement of China’s “Reform and Opening-up” policy and “Coastal Development Priority Strategy”, the western and southern coastal regions have experienced marked economic advancement, with their CCD progressively moving beyond its historically subdued baseline. The development of essential infrastructure, including network systems and communication technologies, has progressively improved, effectively bridging the disparity with the northern coastal regions.

5.4. Driving Mechanisms of CCD

CCD is undeniably influenced by a range of complex factors and driven by various elements throughout its spatial and temporal evolution. It may also exhibit significant variation across different spatial and temporal scales, forms of HS, and subsystems. Building on this, the paper quantitatively identifies the driving factors behind the CCD through the use of geo-detectors and examines their underlying mechanisms.

5.4.1. Factor Analysis

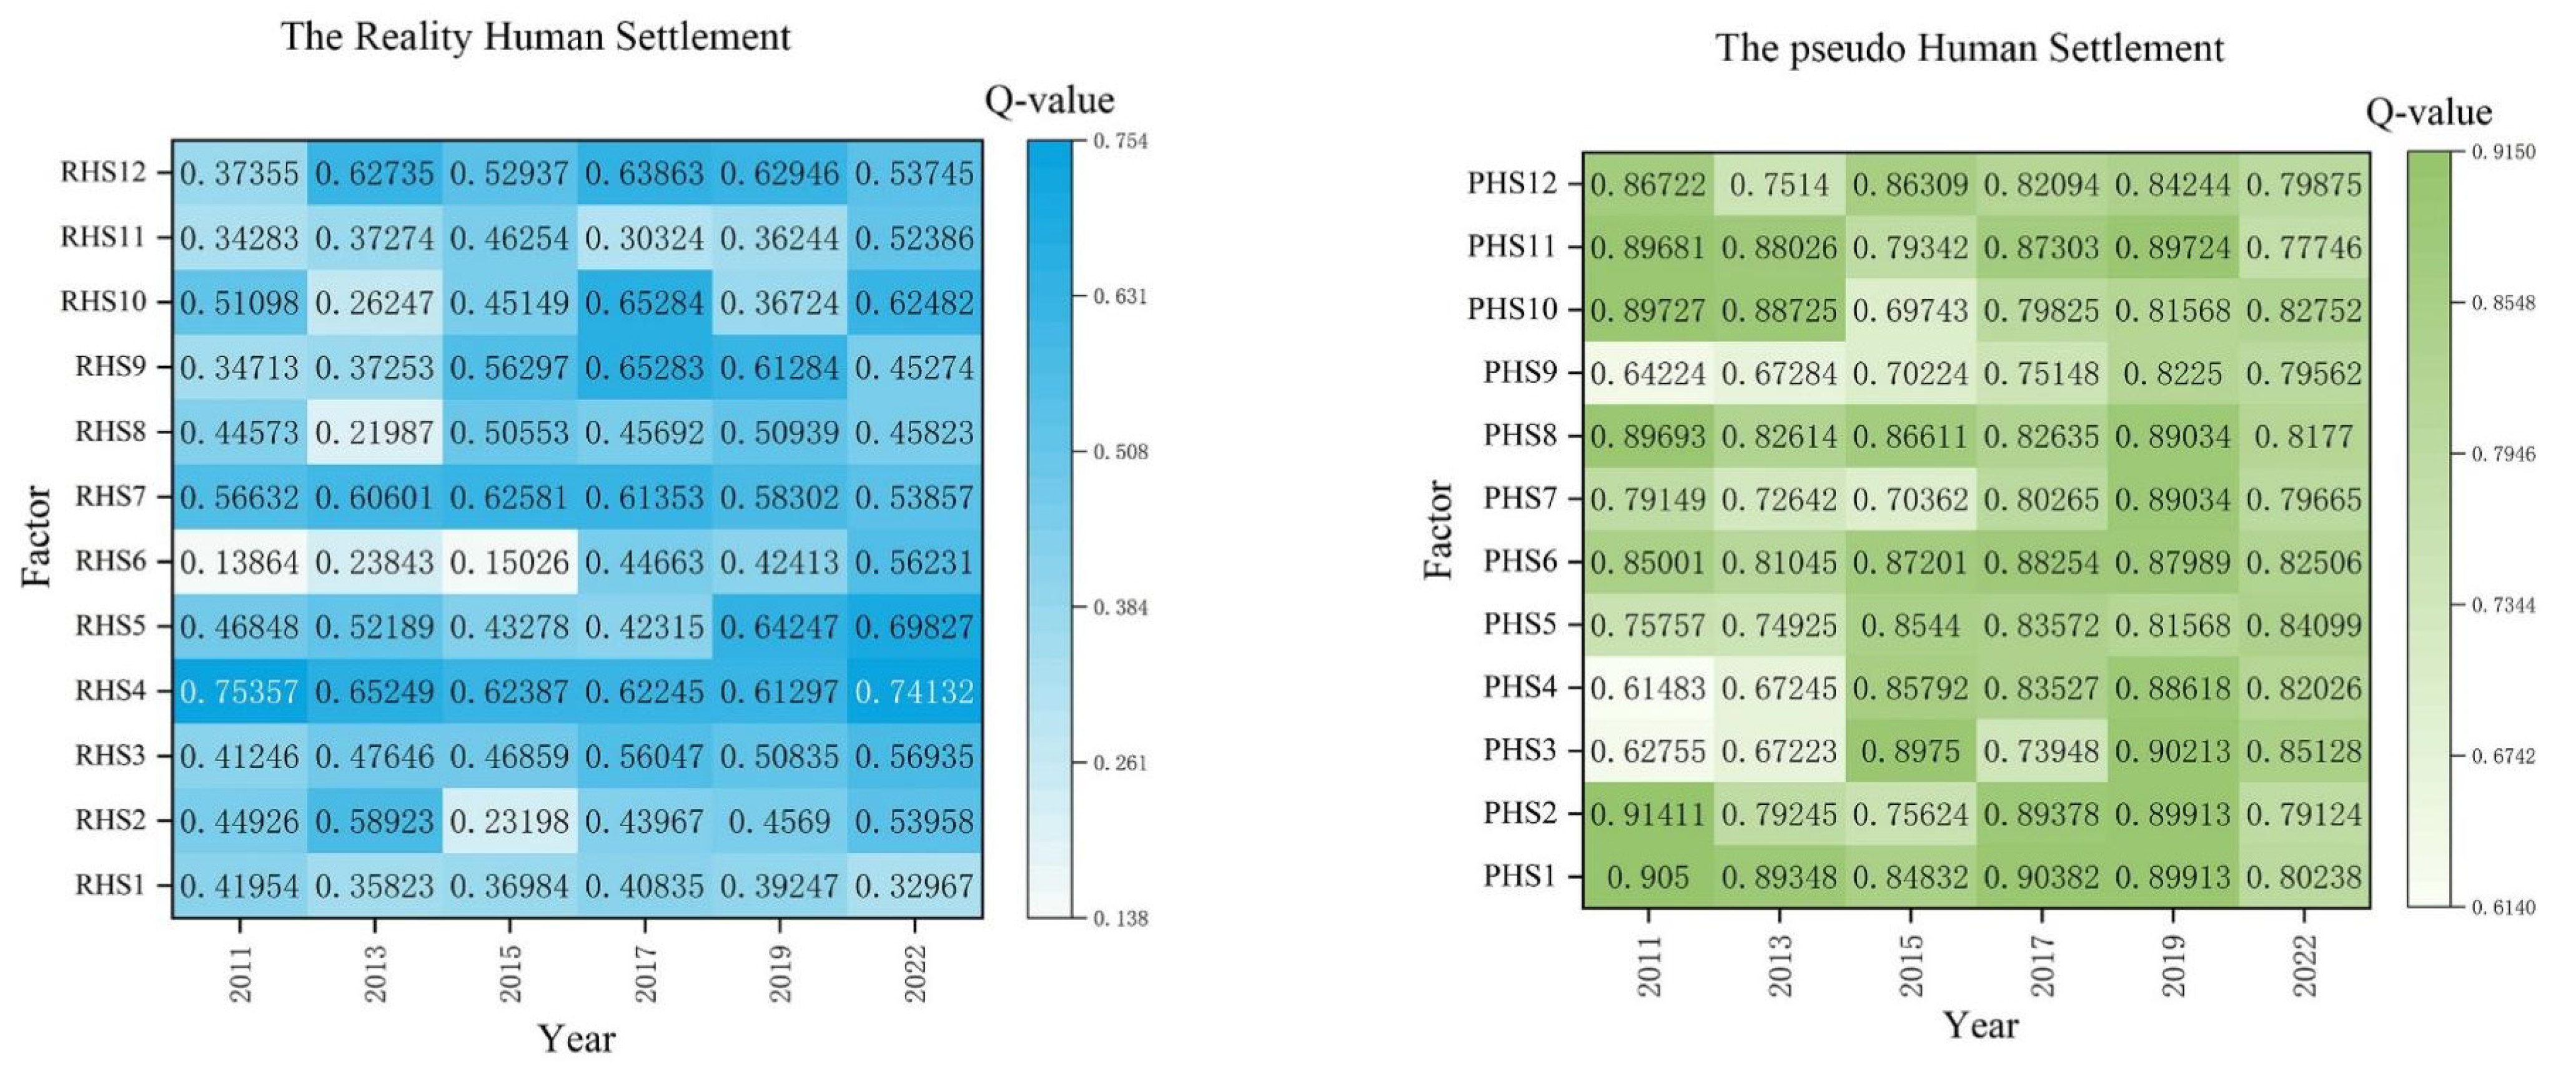
The dominant factors affecting the CCD of coastal cities vary significantly across time. Based on factor analysis (Figure 8):
Dimensions of PHS, the core drivers that dominated CCD in 2011 were communication, music, video and online shopping; In 2013, communications, online shopping, and news consumption were the primary drivers; the key driving factors in 2015 were communication and social networking, financial investment, music, and travel and tourism; the key driving factors in 2017, in order, were communication and social networking, news consumption, online shopping, and music; the key drivers in 2022, in order, are financial investment, travel and tourism, communication and social networking, and music. A comprehensive analysis of the core drivers and detection q-values for 2011–2022 indicates that online shopping, communication and socializing are core drivers.
Dimensions of RHS, the core drivers that dominated CCD in 2011 were social assets, science, education, culture and health, environmental pollution, employment status, and housing status; in 2013, the general economy, public utilities, living conditions, demographic conditions, and environmental pollution were the dominant driving factors; the core factors in 2015 are people’s life, science, education, culture and health, employment status and environmental pollution; the core driving factors in 2017 were, in order, people’s life, science, education, culture and health, living status, employment status, etc. In addition, a comprehensive analysis of the core drivers and detection q-values for the 12 years from 2011 to 2022 shows that comprehensive economy, science, education, culture and health are core positive drivers, and employment status and environmental pollution are core negative drivers. The PHS1-PHS12 indices denote PHS determinants, exemplified by digital platforms (e.g., QQ, WeChat) and financial infrastructures (e.g., China Construction Bank). Conversely, RHS1-RHS12 correspond to RHS metrics, encompassing annual urban unemployment registration ratios relative to total population and industrial wastewater emissions per capita.

5.4.2. System Analysis

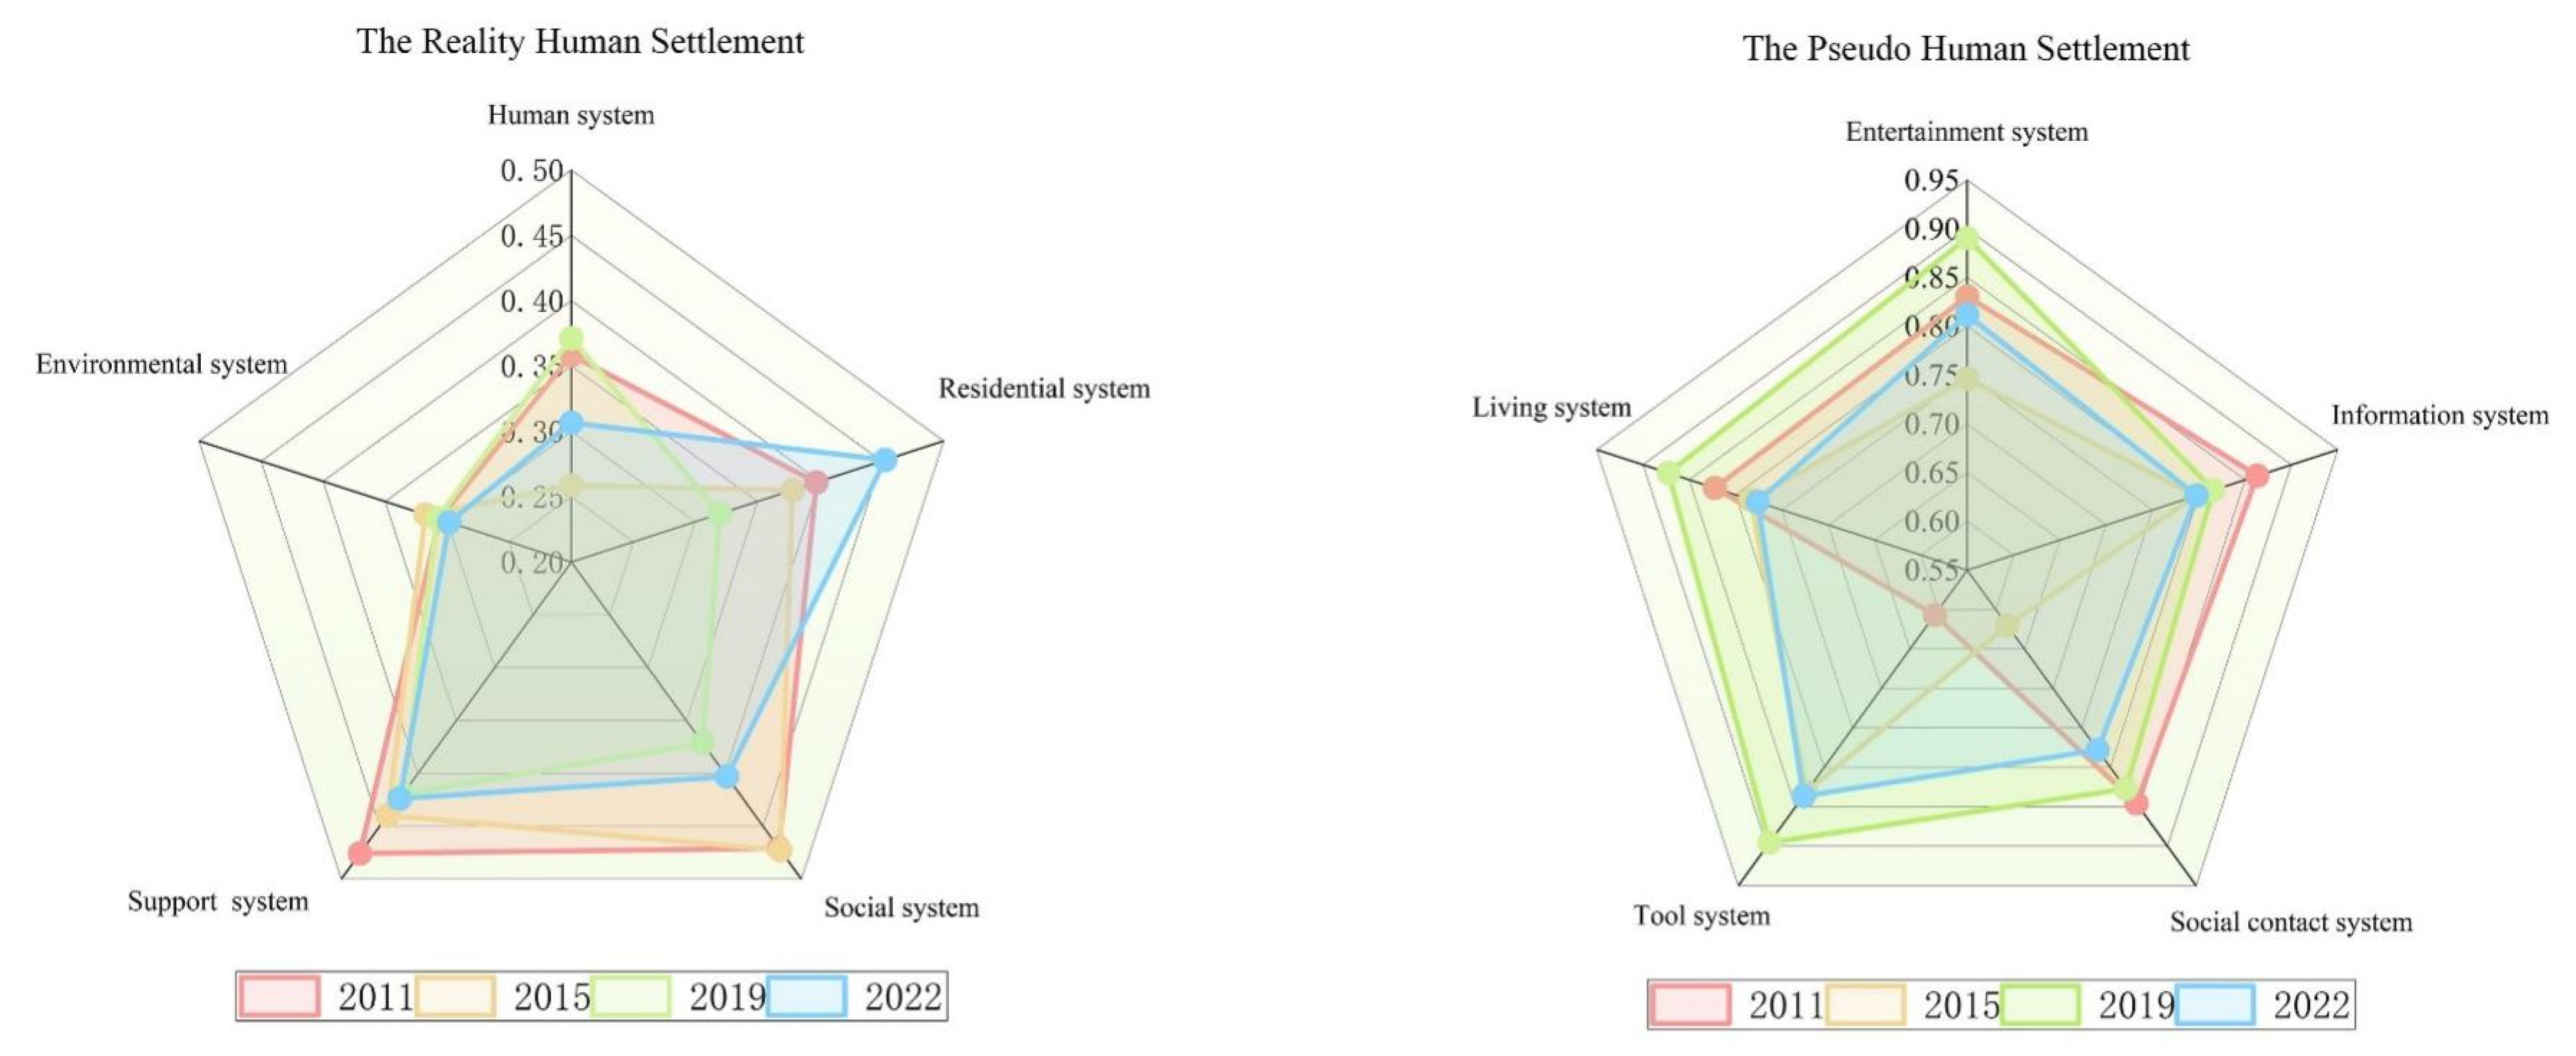
The impact of each system on CCD changes considerably over time (Figure 9).
The 2011 CCD impact hierarchy prioritized PHS systems as: Information > Social contact > Entertainment > Living > Tool. In 2015: Tool > Information > Living > Entertainment > Social contact. By 2019, dominance transitioned to: Tool > Entertainment > Living > Social contact > Information. Subsequent 2022 dynamics reordered these as: Tool > Entertainment > Information > Social contact > Living. The dominance of information systems in 2011 reflects the early stage of digital technology development, which focused on information acquisition. Starting in 2015, tool systems jumped to the top, marking the popularization of practical digital tools such as mobile payments and the sharing economy. By 2022, the continued dominance of tools and entertainment systems will highlight the profound transformation of digital lifestyles.
The 2011 CCD impact hierarchy for RHS systems prioritized: Support > Social > Residential > Human > Environmental. By 2015, dominance shifted to Social > Support > Residential > Environmental > Human. Subsequent evaluations in 2019 reordered these as Support > Social > Human > Habitat > Environmental, while 2022 data revealed Residential > Support > Social > Human > Environmental as the emergent configuration. In terms of RHS, support systems and social systems alternated in the lead between 2011 and 2019, reflecting the key role of infrastructure and public services; while the rise in residential systems in 2022 reflects the effectiveness of housing security policies and the implementation of the “no speculation on housing” policy.
The evolutionary pathways of these two systems jointly illustrate a developmental shift from a “basic service-driven” model toward one that is “quality of life-oriented”. Throughout this process, environmental systems have consistently developed at a slower pace, highlighting the inadequate incorporation of ecological considerations into the coordinated advancement of urban and rural regions. This temporal trajectory corresponds with the implementation rhythm of China’s new urbanization policy, while also mirroring the phased integration of digital technologies with the real economy.

5.4.3. Morphological Analysis

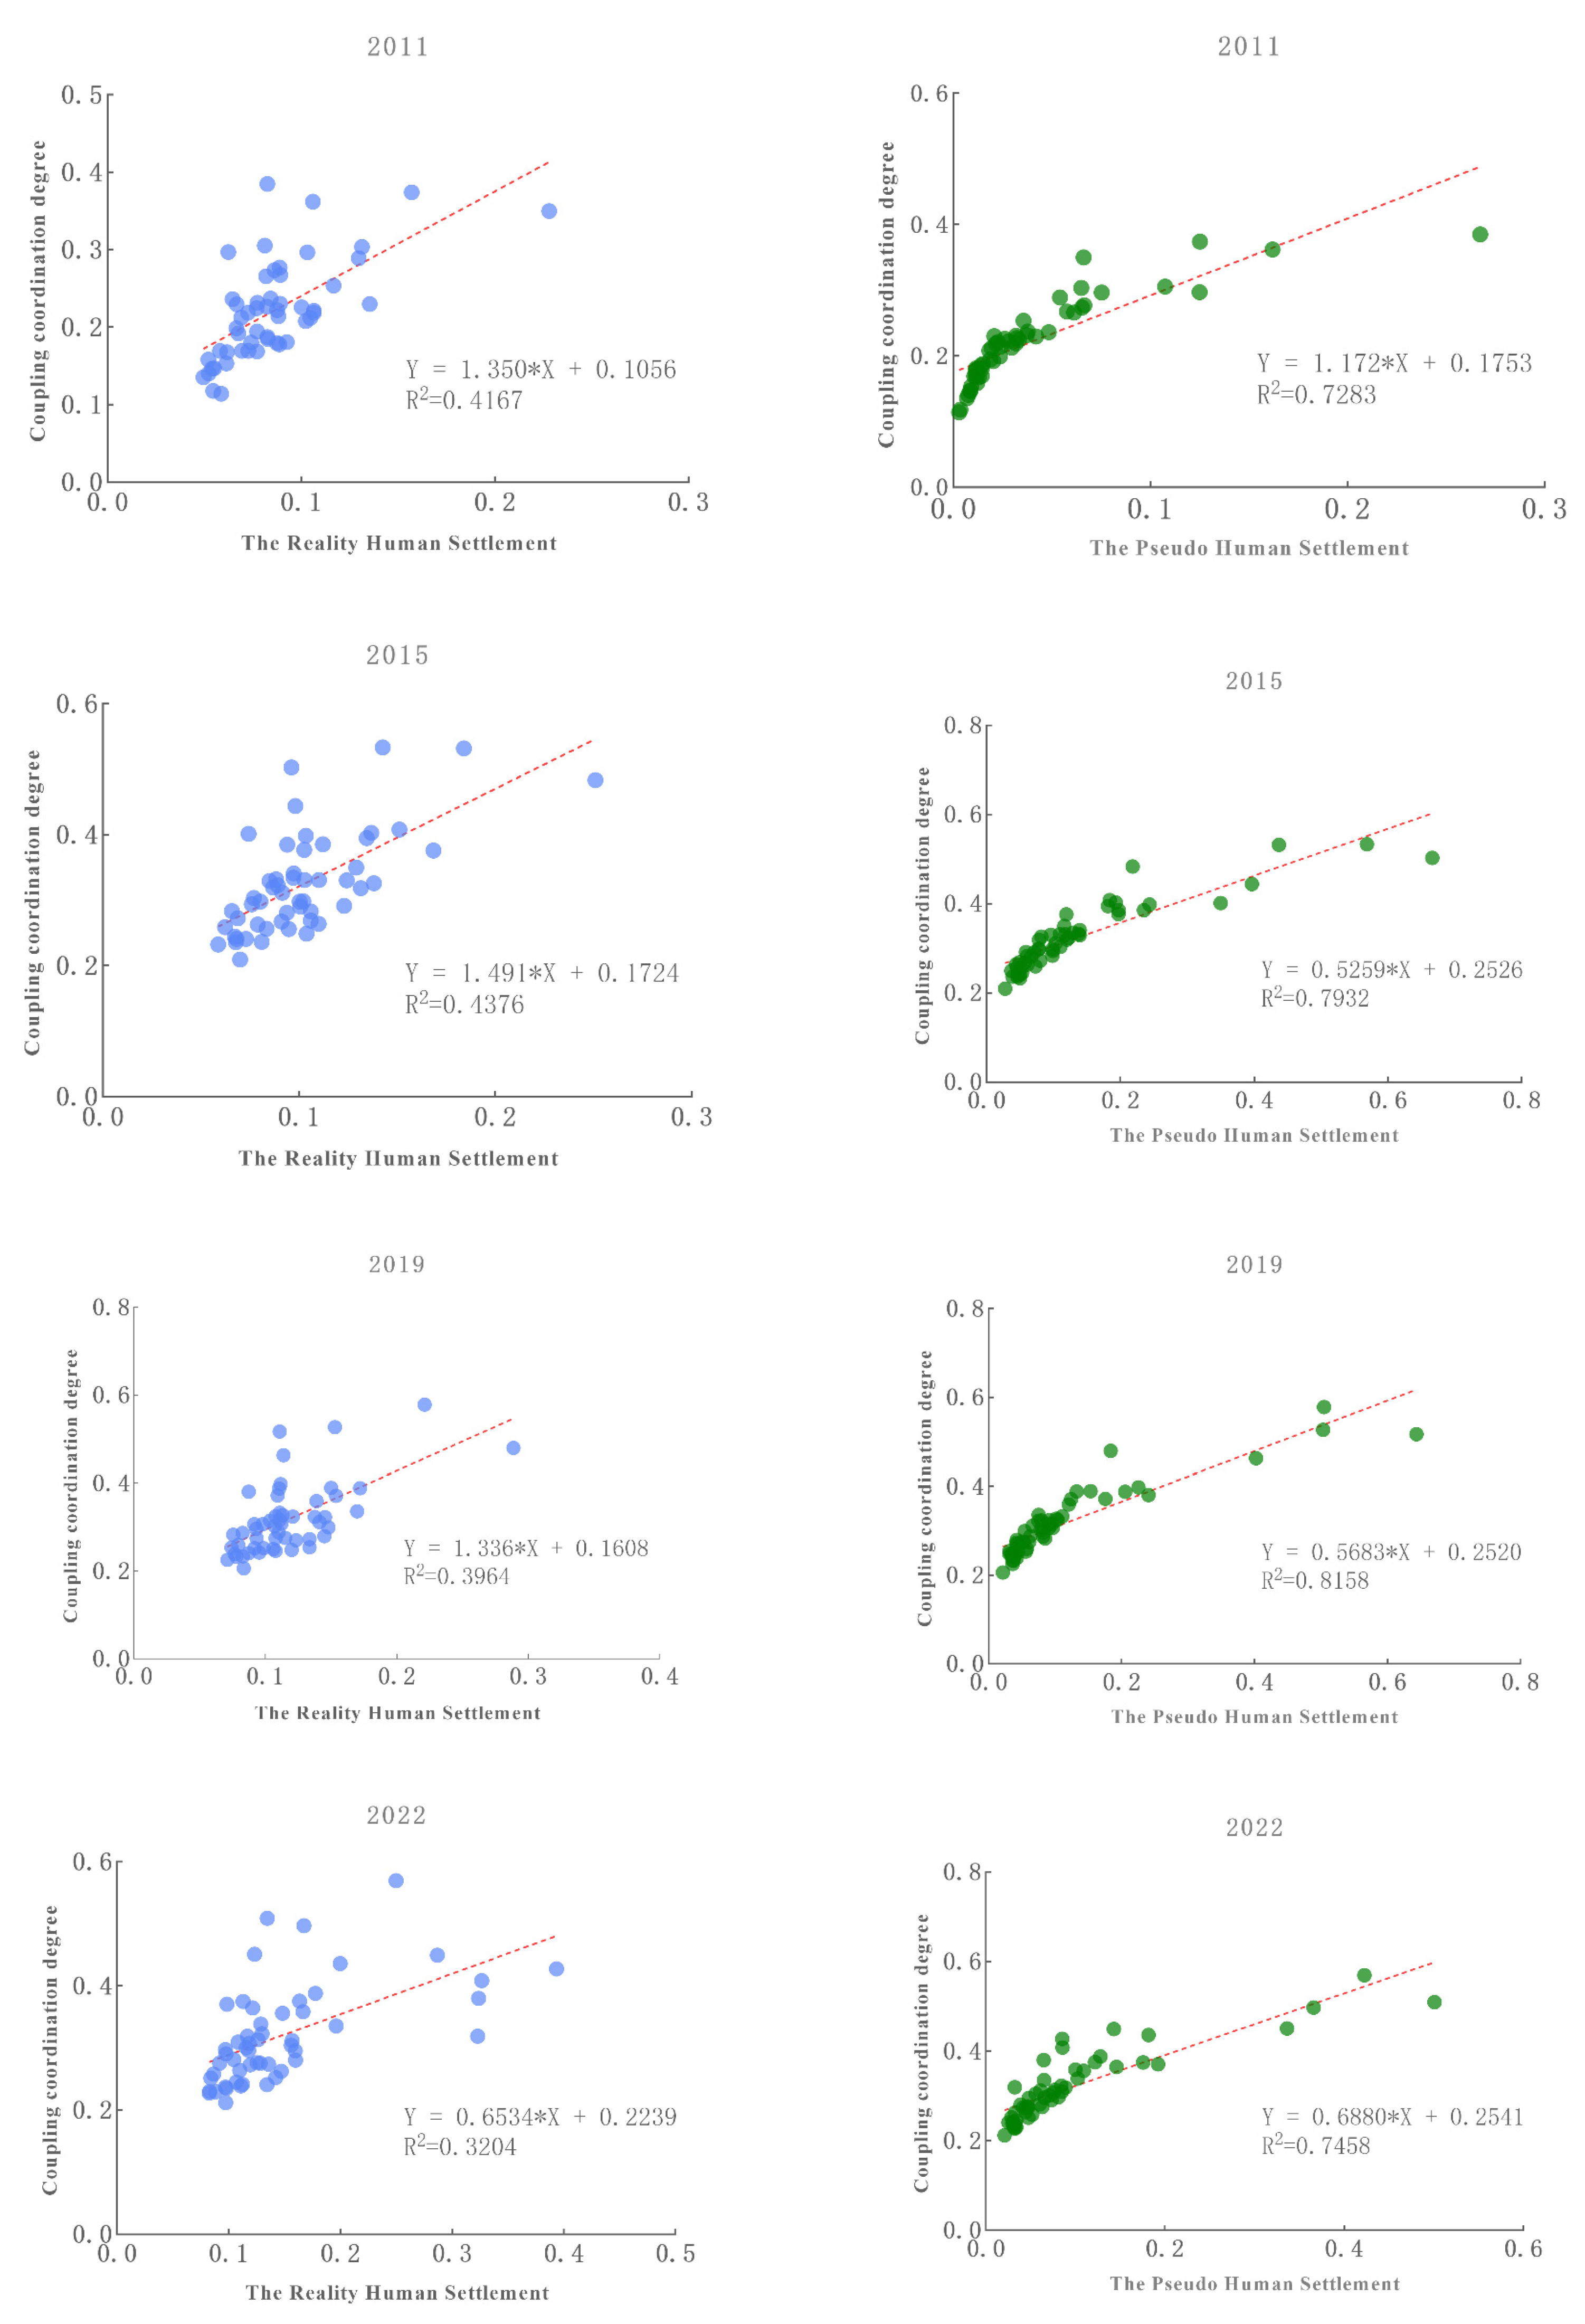
The CCD-related parameters of PHS and RHS systems were quantified using morphological characterization methods. A high positive correlation exists between RHS, PHS, and CCD in 53 cities along China’s coastal areas from 2011 to 2022, with PHS and CCD demonstrating a stronger consistency (Figure 10).
An analysis of the RHS pattern reveals that its coefficient of determination generally exhibits a decreasing trend, with a slight increase observed in 2015. The average correlation coefficient is 0.3923, which passes the 0.01 significance test, indicating a moderate positive correlation between RHS and CCD.
The analysis of the PHS morphology reveals that the coefficient of determination across the four periods exhibits a significant growth trend, with a slight decline in 2022. The average correlation coefficient, 0.7708, exceeds the 0.01 significance threshold, demonstrating a strong positive relationship between PHS and CCD.

5.4.4. Exploration of Mechanisms

In order to accurately understand the CCD and to improve the quality of human settlement construction in China, we aim to further investigate and analyze the underlying driving mechanisms.
  • Socio-economic development drives the CCD. China’s economic growth fosters investments in urban infrastructure, education, healthcare, culture, social security, and environmental improvement. Economic factors are vital in the spatial and temporal development of CCD, as evidenced in cities such as Guangzhou and Shanghai, where increased economic growth improves CCD.
  • Human beings are the primary driver of CCD between the PHS and RHS, with all systems ultimately aimed at fulfilling their developmental and value needs. Urban planners must prioritize human-centered city development, focusing on key aspects such as living, working, transportation, education, and healthcare. Population growth and quality improvements drive human system advancements, positively impacting CCD. To enhance residents’ quality of life, planners should optimize urban settlements by addressing their transportation, education, and healthcare needs.
  • The growing importance of network big data in the CCD is evident, with its influence continuing to expand as information technology becomes more widely integrated into public life. PHS are rooted in the development of big data on the web, which has led to the transformation and expansion of PHS and RHS, and nowadays, the web has become an important platform for people to get information, communicate, shop, and entertain themselves. The onset of the information age has broadened the behavioral dynamics within cities, increased the flow of elements across different urban systems, and promoted the advancement of PHS. This has resulted in a rise in activities like online shopping, social interactions, and recreation, which are becoming more common.

6. Discussion

6.1. Research on the Sustainable Development of RHS and PHS

The coordinated relationship between the PHS and the RHS in China’s coastal cities exhibited distinct dynamic evolutionary characteristics between 2011 and 2022. Research indicates that the overall coordination level remained in a state of mild imbalance but showed a fluctuating upward trend, with the average value increasing from 0.2216 in 2011 to 0.2991 in 2022, marking a phased transition from moderate imbalance to mild imbalance. Consistent with the findings of Li Xueming et al. [19,20] on the relationship between smart cities and HS, this study found that during the digital transformation process in coastal regions, the relationship between the PHS and RHS is gradually transitioning from an antagonistic phase to a phase of adaptation, with a positive interactive mechanism between the two beginning to form.
In terms of spatial patterns, coordination exhibits significant non-equilibrium distribution characteristics. In 2011, coordination showed a pronounced spatial polarization effect, with high-value areas highly concentrated in the Bohai Rim and Yangtze River Delta regions. Over time, the spatial pattern underwent significant changes: the center of gravity model analysis showed that the center of gravity of coordination shifted from the northeast to the southwest and then back to the northeast, while the standard deviation ellipse analysis indicated a significant expansion in ellipse area. These findings engage in an interesting dialog with Sun Jiwen et al.’s [59] research on regional disparities in high-quality development in coastal areas—though the research subjects differ, both studies observed similar spatial convergence trends. This study further found that the coordination index in the southern Pearl River Delta is increasing at an accelerated pace, while traditional core regions represented by Shanghai and Tianjin, though still leading in absolute values, are experiencing a relative slowdown in growth, exhibiting certain upgrading bottleneck effects.
The underlying mechanisms of this spatiotemporal evolution pattern stem from the interaction between policy-driven factors and regional development stages. The implementation effects of national regional strategies such as the “Eastern Region Leading Development” initiative are validated in this study, as pointed out by Zhen Feng et al. [60,61], who noted that smart city development promotes regional coordination through technological diffusion effects. The rapid popularization of new infrastructure has effectively overcome geographical location disadvantages, promoting leapfrog development of PHS in lagging regions. Meanwhile, traditional core regions, due to their relatively mature RHS, face higher marginal costs for renovation and upgrading. This finding complements Sun Jiwen et al.’s [59] research on the convergence of coastal region development, providing new evidence for understanding the upgrading bottlenecks in leading regions.
The narrowing of spatial disparities and the diffusion of spatial patterns indicate that coastal regions are undergoing a transition from unipolar aggregation to multipolar networked development. This study’s revelation of the spatiotemporal evolution patterns of CCD not only validates existing research conclusions on the trend toward balanced regional development [62,63] but also further provides new research dimensions and empirical evidence for China’s regional coordinated development theory from the perspective of the coordination between PHS and RHS. In the future, differentiated strategies should be adopted to continuously enhance the development of lagging regions while focusing on helping leading regions break through upgrading bottlenecks, ultimately achieving high-quality coordinated development across the entire coastal region.

6.2. Limitations and Future Directions

  • Diversification of data sources. The data in this paper mainly consists of mimetic data such as information searches and online social interactions, as well as real data such as social and economic data. It does not take into account urban residents’ acceptance of PHS and their level of awareness of its ecological benefits, and fails to comprehensively consider the needs and wishes of urban residents. In the future, we will introduce image data to analyze the real factors that affect the temporal and spatial evolution of PHS.
  • Comprehensive research content. This paper mainly focuses on PHS and RHS as research objects, but the human settlement environment is a complex giant system, and PHS and RHS are only part of the human settlement environment system. Studying only PHS and RHS cannot reasonably explain the complex relationship between humans and the environment. In future research, we will conduct more comprehensive research on the coupling and coordination of the human settlement environment, such as the imaginary human settlement environment, to promote the comprehensive development of human settlement geography.
  • Deepening the content of the research. This paper mainly conducts preliminary research on the spatiotemporal characteristics and driving factors of the coupling and coordination of PHS, but does not yet analyze the driving mechanisms of the research results in depth. In future research, we will explore in depth the complex interactive relationships between different elements and systems, as well as how these interactions drive the results.

6.3. Policy Recommendations

  • Insist on giving equal weight to both PHS and RHS. There are differences between the current state of PHS and RHS development in 53 coastal cities in China. In the early stages of urbanization, the northeast region focused more on realistic factors such as economic development, population, science, education, culture, and health. With the advent of the information age, big data has gradually entered into urban production, life, and management, and the long-term neglect of PHS has hindered the coordinated development of urban systems. In the future, more attention should be paid to the construction of PHS systems to improve PHS.
  • Adhere to local conditions and coordinated development, and follow the differences in the quality of the human habitat in various places. There is a lack of unified planning in the construction of the urban human habitat, and there are differences and inconsistencies between regions. In areas with low levels of coordinated development, such as Fangchenggang and Beihai, policy support should be increased to improve the livability and business friendliness of the region. In cities with high levels of coordination, such as Shanghai and Guangzhou, their radiating and driving role should continue to be played, realizing the leading role of the core and the coordinated development of the core and peripheral areas. The construction of urban PHS needs to take into account the needs and characteristics of the RHS, effectively solve practical problems, and gradually promote the construction of urban PHS.
  • Adhere to refined management. Adhere to refined management and continuously build and improve public infrastructure, such as barrier-free access, blind paths, and mother and baby rooms, to meet the livability needs of special groups and improve people’s livelihood security and happiness. The construction of PHS needs to be based on RHS and achieve coordinated development through the establishment of connections.

7. Conclusions

This study employs mathematical statistics, the coupling coordination degree (CCD) model, geographic detectors, and ArcGIS spatial analysis to conduct an empirical assessment of the coupling coordination between PHS and RHS across 53 coastal cities in China from 2011 to 2022. The main findings are as follows:
(1)
Temporal process: During the study period, the overall CCD of the human settlement (HS) system in coastal cities exhibited a pattern of initial increase followed by a decline, indicating notable temporal variability. The upward trend in the earlier phase can be attributed to rapid economic growth and accelerated urbanization, which contributed to comprehensive improvements in various aspects of HS. However, the subsequent decline may reflect growing constraints such as resource and environmental pressures, imbalanced regional development, and adjustments in national policy.
(2)
Spatial pattern: The coordination status of human settlements in China’s coastal zone demonstrates a relatively dispersed spatial distribution, with no consolidated high-coordination region emerging. Southern coastal cities generally outperform their northern counterparts in terms of CCD, which may be associated with more advanced economic development, ecological conservation efforts, and governance capacity in the south. These findings suggest a need for targeted policy interventions to enhance coordination levels in northern regions.
(3)
Spatial evolution: The coordination between RHS and PHS subsystems shows a discernible southwestward shift, with cities in the southwestern region experiencing more rapid growth in CCD. This trend reflects a reduction in the spatial concentration of coupling coordination and a narrowing of developmental disparities among coastal cities. Supportive national policies, particularly those emphasized in the 19th and 20th National Congresses of the Communist Party of China advocating regional coordinated development, have facilitated improvement in western and southern coastal areas, contributing to greater regional equilibrium.
(4)
Driving factors: Socioeconomic development level constitutes the most critical factor influencing the coordination between PHS and RHS. Regions with higher economic development tend to exhibit superior performance in infrastructure, public services, and ecological protection, which in turn facilitates positive interaction and synergistic development between the two systems. Moreover, the role of residents—the core agents of urban development—cannot be overlooked. All institutional arrangements ultimately aim to serve human needs and enhance quality of life, underscoring the importance of human-centered approaches in promoting HS coordination.
The findings of this study offer valuable insights for multiple stakeholders. Urban planners and policymakers in coastal cities can utilize the CCD assessment to identify deficiencies in either digital or physical infrastructure, informing targeted investments and balanced development strategies. Real estate developers and technology firms may leverage the spatial trends identified in this study to guide market entry and investment decisions. Ultimately, residents are the primary beneficiaries, as enhanced PHS-RHS coordination directly improves their quality of life and social well-being, which aligns with the human-centric principle advocated by Wu (2001) in his human settlement theory [47].
This study still has several limitations, which point to directions for future research. First, the data sources primarily rely on online behavior and statistical data, failing to encompass subjective factors such as residents’ perceptions and intentions. Future research will incorporate diverse information, including image data and survey data, to achieve a more holistic understanding. Second, while this study focuses on the coupling of RHS and PHS, the human settlement environment is a more complex mega-system. Subsequent research will incorporate concepts like the imagined human settlement [64] to construct a more comprehensive analytical framework. Finally, the exploration of driving mechanisms for coupled coordination relationships remains preliminary. Future work should delve into the complex interactions and underlying dynamics among various system elements, potentially drawing on methodological insights from studies like those by Long (2019) on new urban science [65] which emphasize the power of new data and technologies for understanding urban complexity.

Author Contributions

Conceptualization, S.T. and L.F.; data and conducted analyses, L.F., M.D. and S.T.; formal analysis, L.F. and M.D.; investigation, L.F.; drafted the paper and proofread, S.T., X.L., L.F. and M.D. All authors have read and agreed to the published version of the manuscript.

Funding

This research was funded by the National Natural Science Foundation of China, No. 42201221/42471246; Liaoning Province Natural Science Foundation Project, No. 2023-MS-254; Liaoning Province General Research Project on the Economic and Social Development, No. 2025lslybwzzkt-167; Liaoning Province Social Science Planning Fund Project, No. L22CJY016; Liaoning Normal University’s High-End Cultivation Project, No. 25GDW001].

Data Availability Statement

The datasets analyzed during the current study are available from the corresponding author upon reasonable request.

Conflicts of Interest

The authors declare no conflicts of interest.

References

  1. Hong, S.; Hyoung Kim, S.; Kim, Y.; Park, J. Big Data and government: Evidence of the role of Big Data for smart cities. Big Data Soc. 2019, 6, 2053951719842543. [Google Scholar] [CrossRef]
  2. Cheng, C.; Shi, P.; Song, C.; Gao, J. Geographical Big Data: A New Opportunity for Geography Complexity Study. Acta Geogr. Sin. 2018, 73, 1397–1406. [Google Scholar] [CrossRef]
  3. Gu, C. A Masterpiece on the Study of Human Settlements’ Mimetic Environment: A Review of Geographical Research on Human Settlements: From Positivism to Humanism. Geogr. Res. 2015, 34, 1604. [Google Scholar]
  4. Pinto, M.R.; Salume, P.K.; Barbosa, M.W.; de Sousa, P.R. The path to digital maturity: A cluster analysis of the retail industry in an emerging economy. Technol. Soc. 2022, 72, 102191. [Google Scholar] [CrossRef]
  5. Tian, S.; Li, X.; Yang, J.; Wang, H.; Guo, J. Spatiotemporal evolution of pseudo human settlements: Case study of 36 cities in the three provinces of Northeast China from 2011 to 2018. Environ. Dev. Sustain. 2022, 25, 1742–1772. [Google Scholar] [CrossRef]
  6. Xue, Q.; Yang, X.; Wu, F. A two-stage system analysis of real and pseudo urban human settlements in China. J. Clean. Prod. 2021, 293, 126272. [Google Scholar] [CrossRef]
  7. LazauskaitĖ, D.; BurinskienĖ, M.; Podvezko, V. Subjectively and objectively integrated assessment of the quality indices of the suburban residential environment. Int. J. Strateg. Prop. Manag. 2015, 19, 297–308. [Google Scholar] [CrossRef]
  8. Ni, F.; Wang, Q.; Shao, W.; Zhang, J.; Shan, Y.; Sun, X.; Guan, Q. Spatiotemporal characteristics and driving mechanisms of PM10 in arid and semi-arid cities of northwest China. J. Clean. Prod. 2023, 419, 138273. [Google Scholar] [CrossRef]
  9. Zhao, H.; Gu, T.; Sun, D.; Miao, C. Dynamic evolution and mechanism of urban human settlements in the Yellow River Basin from the perspective of production-living-ecological space. Acta Geogr. Sin. 2023, 78, 2973–2999. [Google Scholar] [CrossRef]
  10. Fan, J.; Zhao, P.; Zhou, S.; Deng, X.; Wang, C. Discipline system and development strategy of human geography in China. Acta Geogr. Sin. 2021, 76, 2083–2093. [Google Scholar] [CrossRef]
  11. Chen, F.; Wu, S.; Liu, H.; Yang, X.; Liu, J. Discipline system and development strategy of physical geography in China. Acta Geogr. Sin. 2021, 76, 2074–2082. [Google Scholar] [CrossRef]
  12. Li, J.; Li, G.; Liang, Y.; Yuan, J.; Xu, G.; Yang, C. Spatiotemporal differentiation of the ecosystem service value and its coupling relationship with urbanization: A case study of the Lanzhou-Xining urban agglomeration. Ecol. Indic. 2024, 160, 111932. [Google Scholar] [CrossRef]
  13. Huang, Z.; Chen, Y.; Zheng, Z.; Wu, Z. Spatiotemporal coupling analysis between human footprint and ecosystem service value in the highly urbanized Pearl River Delta urban Agglomeration, China. Ecol. Indic. 2023, 148, 110033. [Google Scholar] [CrossRef]
  14. Song, F.; Yang, X.; Wu, F. Suitable Pattern of the Natural Environment of Human Settlements in the Lower Reaches of the Yangtze River. Atmosphere 2019, 10, 200. [Google Scholar] [CrossRef]
  15. Dou, H.; Ma, L.; Li, H.; Bo, J.; Fang, F. Impact evaluation and driving type identification of human factors on rural human settlement environment: Taking Gansu Province, China as an example. Open Geosci. 2020, 12, 1324–1337. [Google Scholar] [CrossRef]
  16. Xiong, J.; Wang, X.; Zhao, D.; Zhao, Y. Spatiotemporal pattern and driving forces of ecological carrying capacity during urbanization process in the Dongting Lake area, China. Ecol. Indic. 2022, 144, 109486. [Google Scholar] [CrossRef]
  17. Wang, X.; Wang, J.; Wang, B.; Burkhard, B.; Che, L.; Dai, C.; Zheng, L. The Nature-Based Ecological Engineering Paradigm: Symbiosis, Coupling, and Coordination. Engineering 2022, 19, 14–21. [Google Scholar] [CrossRef]
  18. Doxiadis, C.A. Ekistics, the Science of Human Settlements: Ekistics starts with the premise that human settlements are susceptible of systematic investigation. Science 1970, 170, 393–404. [Google Scholar] [CrossRef] [PubMed]
  19. Li, H.; Lou, L.; Wang, Y.; Tian, S.; Yang, J.; Cong, X. Spatio-temporal dynamic evolution characteristics and driving mechanism analysis of urban pseudo human settlements. Front. Earth Sci. 2024, 12, 1454572. [Google Scholar] [CrossRef]
  20. Tian, S.; Yang, B.; Liu, Z.; Li, X.; Zhang, W. Coupling Coordination of Urban Pseudo and Reality Human Settlements. Land 2022, 11, 414. [Google Scholar] [CrossRef]
  21. Ye, C.; Pi, J.; Chen, H. Coupling Coordination Development of the Logistics Industry, New Urbanization and the Ecological Environment in the Yangtze River Economic Belt. Sustainability 2022, 14, 5298. [Google Scholar] [CrossRef]
  22. Lin, T.; Zhang, L.; Li, J. Coupling and coordinated development of green finance and renewable energy industry in China: Spatiotemporal differentiation and driving factors. Renew. Energy 2024, 235, 121255. [Google Scholar] [CrossRef]
  23. Liu, J.; Tian, Y.; Huang, K.; Yi, T. Spatial-temporal differentiation of the coupling coordinated development of regional energy-economy-ecology system: A case study of the Yangtze River Economic Belt. Ecol. Indic. 2021, 124, 107394. [Google Scholar] [CrossRef]
  24. Yang, S.; Yan, H.; Gong, Y.; Zeng, S. Coupling coordination of the provision of medical services and high-quality economic development in the Yangtze River Economic Belt. Front. Public Health 2024, 11, 1298875. [Google Scholar] [CrossRef] [PubMed]
  25. Yu, T.; Zhang, Y.; Jia, S.; Cui, X. Spatio-temporal evolution and drivers of coupling coordination between digital infrastructure and inclusive green growth: Evidence from the Yangtze River economic belt. J. Environ. Manag. 2025, 376, 124416. [Google Scholar] [CrossRef]
  26. Zhang, Y.; Khan, S.U.; Swallow, B.; Liu, W.; Zhao, M. Coupling coordination analysis of China’s water resources utilization efficiency and economic development level. J. Clean. Prod. 2022, 373, 133874. [Google Scholar] [CrossRef]
  27. Han, X.; Fu, L.; Lv, C.; Peng, J. Measurement and spatio-temporal heterogeneity analysis of the coupling coordinated development among the digital economy, technological innovation and ecological environment. Ecol. Indic. 2023, 151, 110325. [Google Scholar] [CrossRef]
  28. Chen, D.; Zhong, L.; Fan, J.; Yu, H.; Yang, D.; Zeng, Y. Evaluation and structural analysis of the functions of the Tibetan Plateau National Park Cluster. J. Geogr. Sci. 2022, 32, 957–980. [Google Scholar] [CrossRef]
  29. Shi, Y.; Feng, C.-C.; Yu, Q.; Han, R.; Guo, L. Contradiction or coordination? The spatiotemporal relationship between landscape ecological risks and urbanization from coupling perspectives in China. J. Clean. Prod. 2022, 363, 132557. [Google Scholar] [CrossRef]
  30. Li, S.; Du, S. An Empirical Study on the Coupling Coordination Relationship between Cultural Tourism Industry Competitiveness and Tourism Flow. Sustainability 2021, 13, 5525. [Google Scholar] [CrossRef]
  31. Yu, Z.; Liu, W.; Ren, Q.; Zhong, J. Analysis of the coordinated evolution and driving mechanism of the coupling of tourism economy and urbanization in Southwest China. Curr. Issues Tour. 2024, 28, 891–909. [Google Scholar] [CrossRef]
  32. Wang, M.; Wang, X. A study of eco-culture-tourism coupling and coordinated development and influencing mechanism in the Yellow River Basin based on spatial production theory. Ecol. Indic. 2025, 176, 113689. [Google Scholar] [CrossRef]
  33. Tian, S.; Wang, Y.; Li, X.; Wu, W.; Yang, J.; Cong, X.; Wang, H. Spatio-Temporal Evolution and Driving Mechanism of Coupling Coordination of Pseudo Human Settlements in Central China’s Urban Agglomerations. Land 2024, 13, 858. [Google Scholar] [CrossRef]
  34. Chu, N.; Zhang, P.; Wu, X. Spatiotemporal evolution characteristics of urbanization and its coupling coordination degree in Russia—Perspectives from the population, economy, society, and eco-environment. Environ. Sci. Pollut. Res. 2022, 29, 61334–61351. [Google Scholar] [CrossRef] [PubMed]
  35. Zhang, D.; Chen, Y. Evaluation on urban environmental sustainability and coupling coordination among its dimensions: A case study of Shandong Province, China. Sustain. Cities Soc. 2021, 75, 103351. [Google Scholar] [CrossRef]
  36. Zhang, J.; Yuan, J.; Wang, Y. Spatio-temporal evolution and influencing factors of coupling coordination between urban resilience and high-quality development in Yangtze River Delta Area, China. Front. Environ. Sci. 2023, 11, 1174875. [Google Scholar] [CrossRef]
  37. Eggert, A.L.; Löwe, R.; Arnbjerg-Nielsen, K. Feedbacks between city development and coastal adaptation: A systems thinking approach. Ocean Coast. Manag. 2024, 249, 107026. [Google Scholar] [CrossRef]
  38. Zeng, S.; Zhou, G.; Xiao, G.; Peng, J. Review on Domestic Rural Settlements Research from Geography Perspective. Hum. Geogr. 2011, 26, 68–73. [Google Scholar] [CrossRef]
  39. Bolton, R.N.; McColl-Kennedy, J.R.; Cheung, L.; Gallan, A.; Orsingher, C.; Witell, L.; Zaki, M. Customer experience challenges: Bringing together digital, physical and social realms. J. Serv. Manag. 2018, 29, 776–808. [Google Scholar] [CrossRef]
  40. Matt, G. Climatic change and climatic variability: An objective decomposition. Quat. Sci. Rev. 2021, 271, 107196. [Google Scholar] [CrossRef]
  41. Tian, S.; Li, X.; Yang, J.; Zhang, W.; Guo, J. Spatio-temporal coupling characteristics and mechanism of urban mimetic and real human settlements in Northeast China. Acta Geogr. Sin. 2021, 76, 781–798. [Google Scholar] [CrossRef]
  42. Sun, Y.; Hou, G.; Huang, Z.; Zhong, Y. Spatial-Temporal Differences and Influencing Factors of Tourism Eco-Efficiency in China’s Three Major Urban Agglomerations Based on the Super-EBM Model. Sustainability 2020, 12, 4156. [Google Scholar] [CrossRef]
  43. Yang, C.; Zeng, W.; Yang, X. Coupling coordination evaluation and sustainable development pattern of geo-ecological environment and urbanization in Chongqing municipality, China. Sustain. Cities Soc. 2020, 61, 102271. [Google Scholar] [CrossRef]
  44. Liu, H.; Li, X.; Tian, S.; Guan, Y. Research on the Evaluation of Resilience and Influencing Factors of the Urban Network Structure in the Three Provinces of Northeast China Based on Multiple Flows. Buildings 2022, 12, 945. [Google Scholar] [CrossRef]
  45. Cheng, Z.; Zhang, Y.; Wang, L.; Wei, L.; Wu, X. An Analysis of Land-Use Conflict Potential Based on the Perspective of Production–Living–Ecological Function. Sustainability 2022, 14, 5936. [Google Scholar] [CrossRef]
  46. Chen, C.; Zhang, W.; Zhan, D.; Li, X. Assessment of urban human settlement quality and its influencing factors in the Bohai Rim area. Prog. Geogr. 2017, 36, 1562–1570. [Google Scholar] [CrossRef]
  47. Wu, L. Introduction to Sciences of Human Settlements; China Architecture & Building Press: Beijing, China, 2001; pp. 40–48, 222–228. [Google Scholar]
  48. Szczepańska, A.; Kaźmierczak, R.; Myszkowska, M. Virtual Reality as a Tool for Public Consultations in Spatial Planning and Management. Energies 2021, 14, 6046. [Google Scholar] [CrossRef]
  49. Li, B.; Qu, Y. The influence of industrial path dependence and breakthrough on regional economic resilience in China’s coastal areas. Acta Geogr. Sin. 2023, 78, 824–839. [Google Scholar] [CrossRef]
  50. Central Committee of the Communist Party of China, State Council. Outline of the Yangtze River Delta Regional Integrated Development Plan; Central Committee of the Communist Party of China, State Council: Beijing, China, 2019. [Google Scholar]
  51. Dong, F.; Li, W. Research on the coupling coordination degree of “upstream-midstream-downstream” of China’s wind power industry chain. J. Clean. Prod. 2020, 283, 124633. [Google Scholar] [CrossRef]
  52. Cong, X. The Form, Nature and Several Misuses of Coupling Degree Model in Geography. Econ. Geogr. 2019, 39, 18–25. [Google Scholar] [CrossRef]
  53. Zou, C.; Zhu, J.; Lou, K.; Yang, L. Coupling coordination and spatiotemporal heterogeneity between urbanization and ecological environment in Shaanxi Province, China. Ecol. Indic. 2022, 141, 109152. [Google Scholar] [CrossRef]
  54. Wang, J.F.; Li, X.H.; Christakos, G.; Liao, Y.L.; Zhang, T.; Gu, X.; Zheng, X.Y. Geographical Detectors--Based Health Risk Assessment and its Application in the Neural Tube Defects Study of the Heshun Region, China. Int. J. Geogr. Inf. Sci. 2010, 24, 107–127. [Google Scholar] [CrossRef]
  55. Azuz-Adeath, I.; Yañez-Arancibia, A. Climate Change: Ecological and socio economic dimensions in the coastal zone. Ecol. Eng. 2019, 130, 228–232. [Google Scholar] [CrossRef]
  56. Wang, Y.; Geng, Q.; Si, X.; Kan, L. Coupling and coordination analysis of urbanization, economy and environment of Shandong Province, China. Environ. Dev. Sustain. 2020, 23, 10397–10415. [Google Scholar] [CrossRef]
  57. Zhao, Y.; Wu, Q.; Wei, P.; Zhao, H.; Zhang, X.; Pang, C. Explore the Mitigation Mechanism of Urban Thermal Environment by Integrating Geographic Detector and Standard Deviation Ellipse (SDE). Remote Sens. 2022, 14, 3411. [Google Scholar] [CrossRef]
  58. Wang, Z.; Wang, Y.; Zhao, L.; Zhao, L. Spatio-temporal evolution and influencing factors of total factor productivity in China’s manufacturing industry. Acta Geogr. Sin. 2021, 76, 3061–3075. [Google Scholar] [CrossRef]
  59. Sun, J.; Jiang, Z. The path of high-quality development of China’s coastal areas. Acta Geogr. Sin. 2021, 76, 277–294. [Google Scholar] [CrossRef]
  60. Kong, Y.; Zhen, F.; Zhang, S. Research progress and thinking on urban space under the influence of intelligent technology. Prog. Geogr. 2022, 41, 1068–1081. [Google Scholar] [CrossRef]
  61. Kong, Y.; Zhen, F.; Zhang, S. Research Progress and Prospect of the Impact of Intelligent Technology on Urban Residents’ Activities. Sci. Geogr. Sin. 2022, 42, 413–425. [Google Scholar]
  62. Fang, K.; He, J.; Zhang, J. Substantiating the Botai Line as China’s Regional Development Equilibrium Boundary: A Case Study of Urban Greenhouse Gas Emissions. Acta Geogr. Sin. 2021, 76, 3090–3102. [Google Scholar] [CrossRef]
  63. Deng, X.; Liang, L.; Wu, F.; Wang, Z.; He, S. Regional Balanced Development in China from the Perspective of Development Geography. Acta Geogr. Sin. 2021, 76, 261–276. [Google Scholar] [CrossRef]
  64. Dayaratne, R. Creating places through participatory design: Psychological techniques to understand people’s conceptions. J. Hous. Built Environ. 2016, 31, 719–741. [Google Scholar] [CrossRef]
  65. Long, Y. (New) Urban science: Studying “new” cities with new data, methods, and technologies. Landsc. Archit. Front. 2019, 7, 8–21. [Google Scholar] [CrossRef]
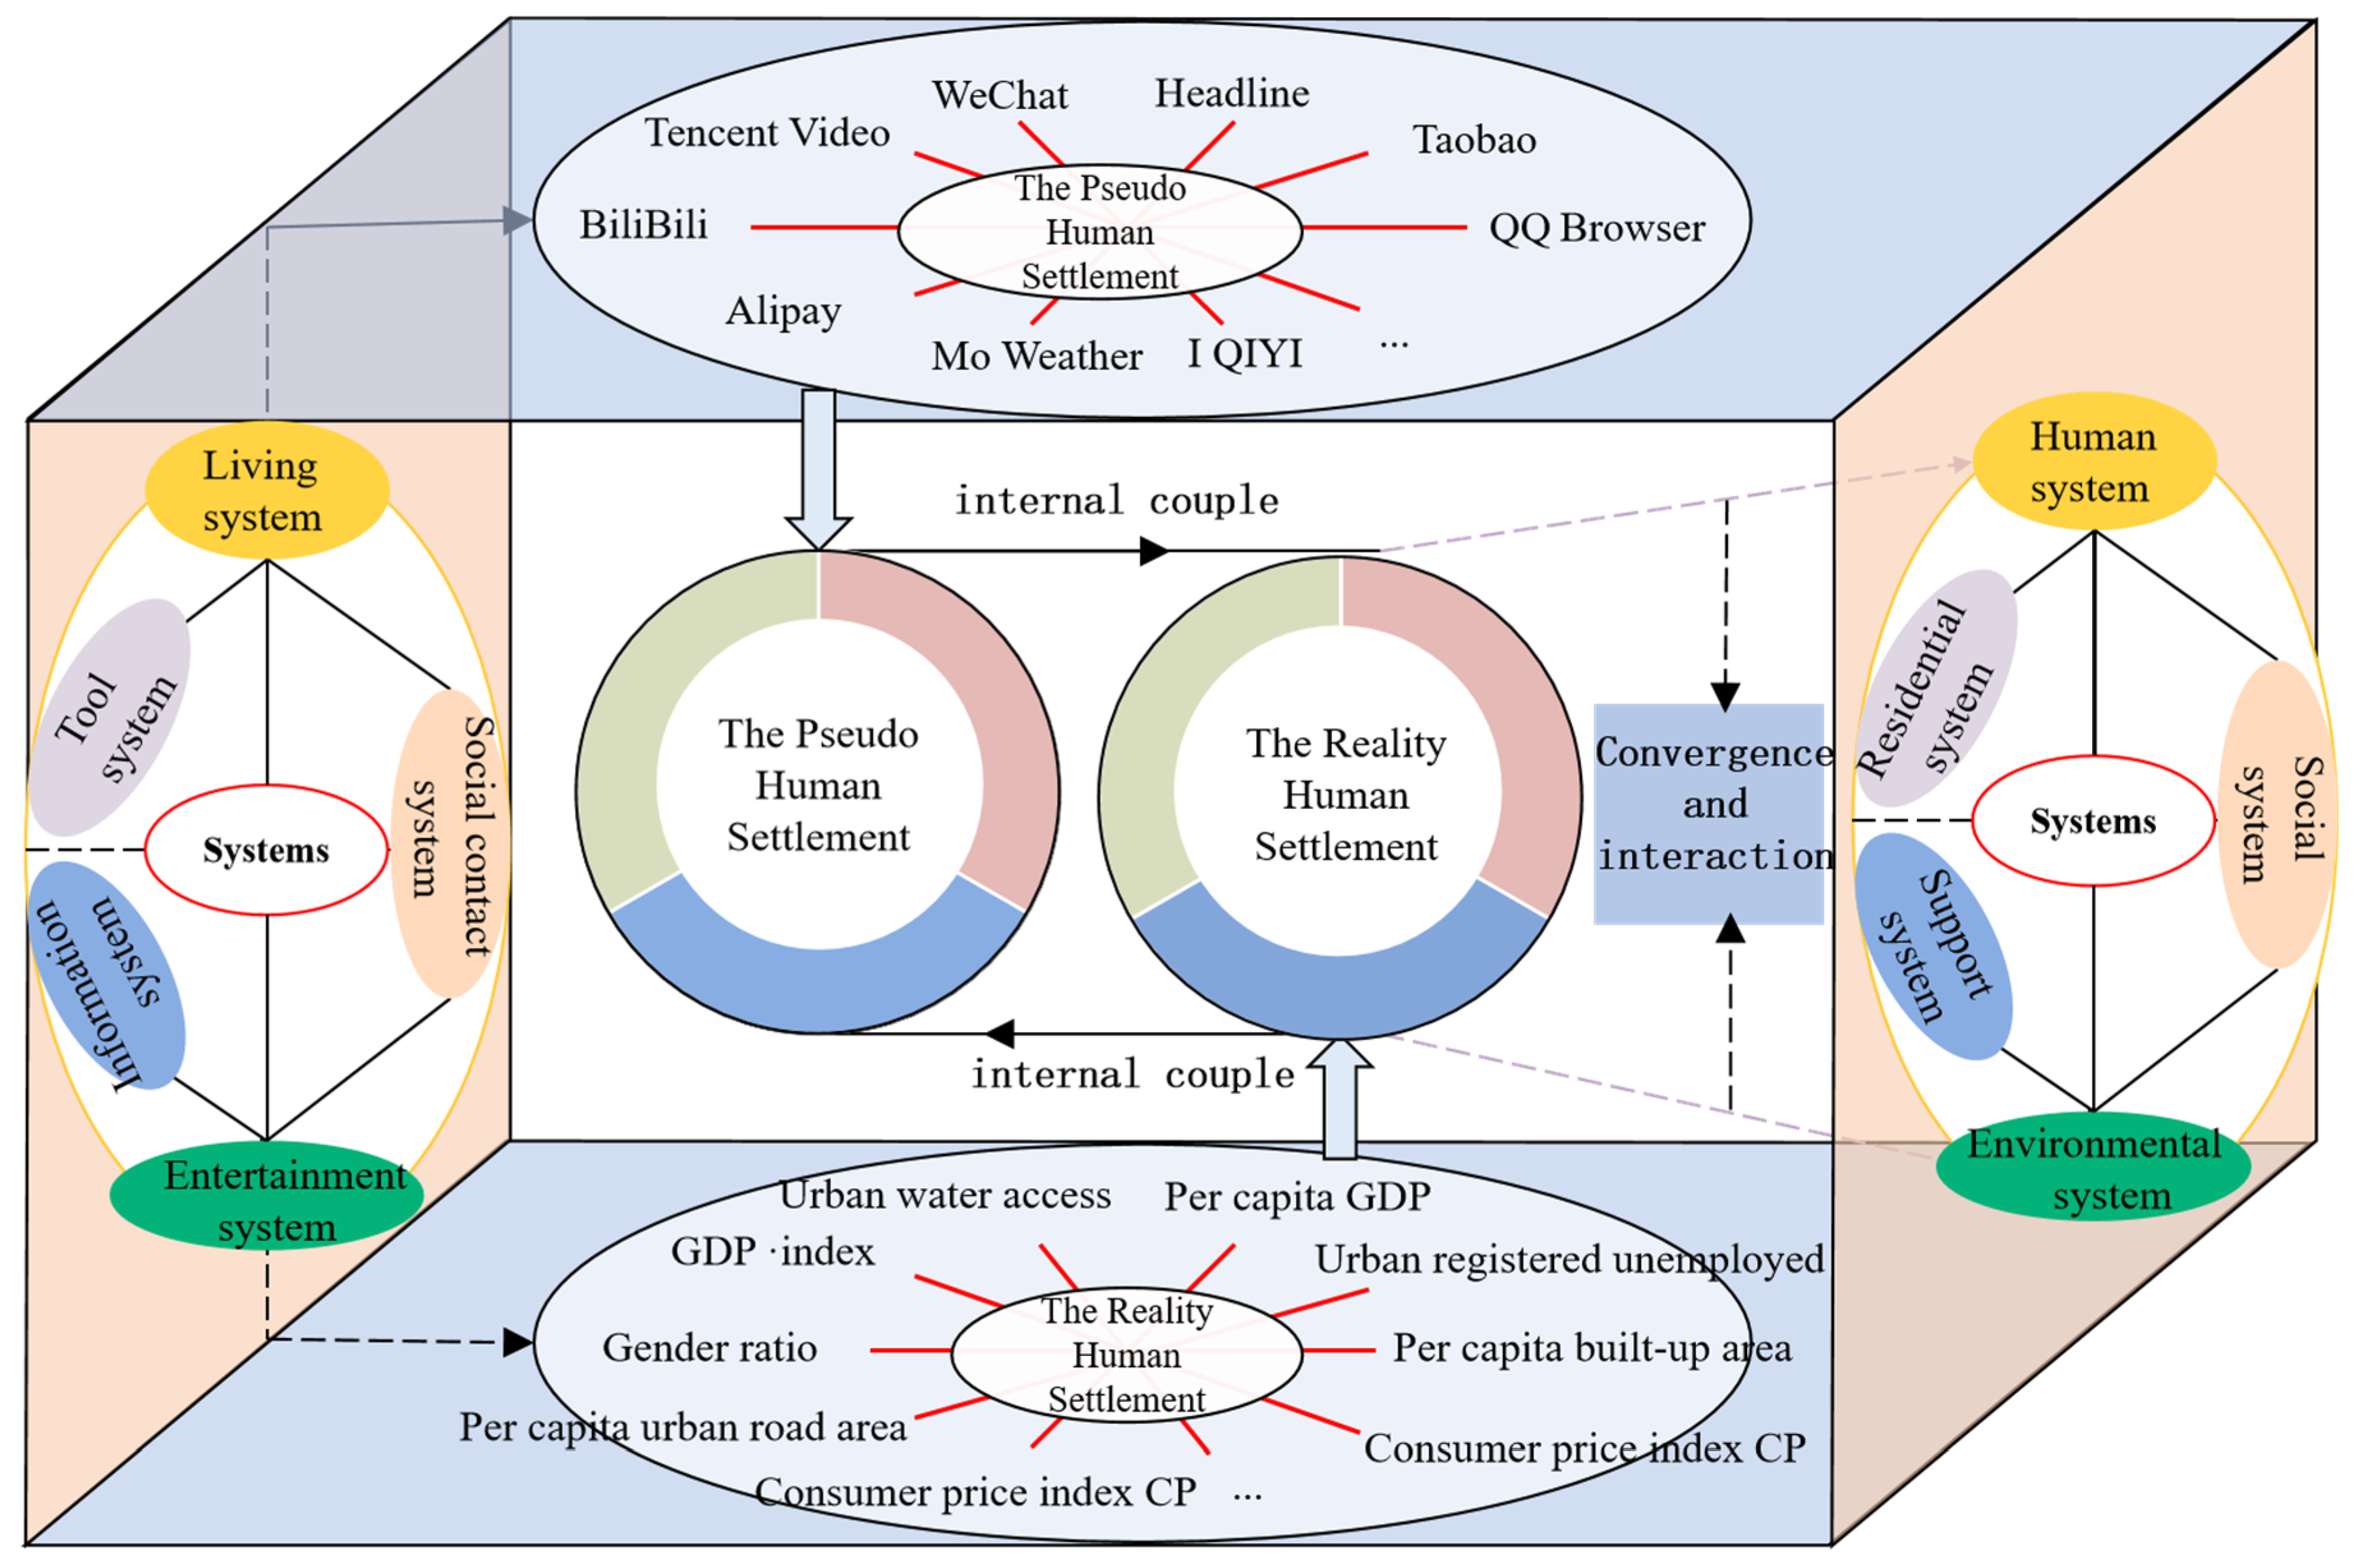
Figure 1. The coupling coordination theory framework of human settlements.
Land 14 02081 g001
Figure 2. Research flow chart of coastal city pseudo and reality human settlements.
Land 14 02081 g002
Figure 3. Location of the study area in the China.
Land 14 02081 g003
Figure 4. Evaluation index system for pseudo and reality human settlement environment.
Land 14 02081 g004
Figure 5. The CCD in coastal cities in China from 2011 to 2022. (a) Temporal evolution trend of the average CCD value; (b) Temporal variation in the proportional distribution of different CCD types.
Land 14 02081 g005
Figure 6. Spatial pattern of CCD in coastal cities in China from 2011 to 2022.
Land 14 02081 g006
Figure 7. The trend surface analysis of the CCD in coastal cities of China.
Land 14 02081 g007
Figure 8. Q value of the driving factors of CCD between PHS and RHS in coastal cities in China from 2011 to 2022.
Land 14 02081 g008
Figure 9. The driving system of PHS and RHS in 2011—2022.
Land 14 02081 g009
Figure 10. The variations in correlation coefficients between coupling coordination with PHS and RHS.
Land 14 02081 g010
Table 1. Criteria for coupling and coordination levels.
Coupling DegreeCCoordination DegreeDCoupling DegreeCCoordination DegreeD
High-level coupling stage0.8 < C ≤ 1Excellent Coordination0.9 < D ≤ 1.0Antagonistic stage0.3 < C ≤ 0.5Near Disorder0.4 < D ≤ 0.5
Good Coordination0.8 < D ≤ 0.9Mild Disorder0.3 < D ≤ 0.4
Break-in stage0.5 < C ≤ 0.8Intermediate Coordination0.7 < D ≤ 0.8Low-level coupling stage0 < C ≤ 0.3Moderate Disorder0.2 < D ≤ 0.3
Primary Coordination0.6 < D ≤ 0.7Severe Disorder0.1 < D ≤ 0.2
Reluctantly
Coordination
0.5 < D ≤ 0.6Extreme Disorder0.0 < D ≤ 0.1
Disclaimer/Publisher’s Note: The statements, opinions and data contained in all publications are solely those of the individual author(s) and contributor(s) and not of MDPI and/or the editor(s). MDPI and/or the editor(s) disclaim responsibility for any injury to people or property resulting from any ideas, methods, instructions or products referred to in the content.