Article

Exploring the Spatial Coupling Between Visual and Ecological Sensitivity: A Cross-Modal Approach Using Deep Learning in Tianjin’s Central Urban Area

1
The School of Architecture, Tianjin University, Tianjin 300072, China
2
Tianjin Xinjian Construction Co., Ltd., Tianjin 300220, China
3
Tianjin Port Bonded Zone Urban Renewal Investment and Construction Group, Tianjin 300450, China
4
College of Architecture and Urban Planning, Tongji University, Shanghai 200092, China
5
College of Design and Environment, National University of Singapore, Singapore 117575, Singapore
*
Author to whom correspondence should be addressed.
Current address: Yinzhidu Design Studio, Hexi District, Tianjin 300220, China.
Current address: Human Settlements Professional Committee, Chinese Society for Urban Studies, Beijing 100835, China.
Land 2025, 14(11), 2104; https://doi.org/10.3390/land14112104
Submission received: 30 August 2025 / Revised: 12 October 2025 / Accepted: 16 October 2025 / Published: 23 October 2025

Abstract

Amid rapid urbanization, Chinese cities face mounting ecological pressure, making it critical to balance environmental protection with public well-being. As visual perception accounts for over 80% of environmental information acquisition, it plays a key role in shaping experiences and evaluations of ecological space. However, current ecological planning often overlooks public perception, leading to increasing mismatches between ecological conditions and spatial experiences. While previous studies have attempted to introduce public perspectives, a systematic framework for analyzing the spatial relationship between ecological and visual sensitivity remains lacking. This study takes 56,210 street-level points in Tianjin’s central urban area to construct a coordinated analysis framework of ecological and perceptual sensitivity. Visual sensitivity is derived from social media sentiment analysis (via GPT-4o) and street-view image semantic features extracted using the ADE20K semantic segmentation model, and subsequently processed through a Multilayer Perceptron (MLP) model. Ecological sensitivity is calculated using the Analytic Hierarchy Process (AHP)—based model integrating elevation, slope, normalized difference vegetation index (NDVI), land use, and nighttime light data. A coupling coordination model and bivariate Moran’s I are employed to examine spatial synergy and mismatches between the two dimensions. Results indicate that while 72.82% of points show good coupling, spatial mismatches are widespread. The dominant types include “HL” (high visual–low ecological) areas (e.g., Wudadao) with high visual attention but low ecological resilience, and “LH” (low visual–high ecological) areas (e.g., Huaiyuanli) with strong ecological value but low public perception. This study provides a systematic path for analyzing the spatial divergence between ecological and perceptual sensitivity, offering insights into ecological landscape optimization and perception-driven street design.

1. Introduction

Over the past three decades, China’s rapid urbanization has increasingly intensified environmental pressures on urban ecosystems, leading to a series of ecological degradation issues such as habitat fragmentation and loss of biodiversity. These challenges have significantly weakened the stability and resilience of ecosystems, posing potential threats to sustainable urban development [1,2]. In this context, it is essential to conduct ecological sensitivity (ES) assessments to identify vulnerable areas and formulate effective protection and intervention strategies. Achieving a balance between ecological preservation and public well-being amidst rapid urban growth has become a critical issue in contemporary urban governance [3,4,5].
Ecological sensitivity refers to the adaptive capacity of ecosystems to cope with natural environmental changes and human disturbances without compromising ecological quality [6]. It is a critical component of ecological planning and environmental protection [7]. For instance, Xu et al. (2023) employed the CRITIC method to develop an ecological sensitivity evaluation model based on indicators such as topography, climate, and vegetation, enabling the identification of ecologically fragile areas and the proposal of targeted protection strategies [8]. Bai and Guo (2021) constructed an indicator system comprising five categories—including land use change, normalized difference vegetation index (NDVI) variation, distance to water bodies, slope, and fragmentation of ecological land—to support urban ecological spatial regulation and the enhancement of ecological connectivity [9]. Although current research has made progress in systematically integrating multi-source environmental data to improve the accuracy and spatial resolution of ecological sensitivity assessments, it often overlooks public perceptions and emotional responses to spatial environments. Traditional expert-driven evaluation methods, such as the Analytic Hierarchy Process (AHP), focus primarily on objective ecological indicators and struggle to capture the dynamic visual perception of urban spaces. Moreover, they seldom account for human subjective experience and cultural values, which limits the accuracy and broad applicability of these assessments. In particular, under the context of rapid urbanization, public spatial perception plays a crucial role in the effectiveness of urban ecological governance; however, this dimension has yet to be incorporated into existing ecological sensitivity assessment frameworks.
Visual sensitivity refers to the degree of visual attention and emotional response that the public exhibits toward specific spatial landscape elements, reflecting the visual appeal of a landscape to observers. It is typically influenced by factors such as spatial morphology, greening level, building façades, and spatial openness [10]. Traditional methods for measuring visual sensitivity—such as expert scoring, questionnaires, or on-site interviews [11,12,13]—often suffer from limitations including small sample sizes, culturally homogeneous perspectives, and high costs, making them insufficient for large-scale spatial evaluations. In recent years, the rapid development of social media and mobile internet has provided new opportunities to incorporate public perception into ecological assessments [14,15,16]. Dunkel (2015) proposed a visual perception analysis method based on social media images, using crowdsourced geographic data to reflect public perceptions of urban landscapes and constructing visual perception maps to support urban planning decisions [17]. Zhang and Zhou (2018) utilized geo-tagged check-in data from the Sina Weibo platform to develop a public perception-driven model of park visitation, providing empirical evidence for optimizing urban green space allocation and accessibility [18]. With the advancement of social media and spatial image data, public visual experiences and emotional feedback within urban spaces can now be captured in the form of big data, offering broader, more timely, and culturally representative approaches to measuring visual sensitivity [19,20,21]. In particular, the integration of street view image semantic segmentation with textual sentiment analysis has enabled automated, multi-dimensional modeling of visual sensitivity, significantly enhancing its applicability and scalability in urban planning and ecological perception research.
In urban environments, humans acquire environmental information through multiple senses, with vision playing a dominant role that far outweighs olfaction, hearing, and other sensory modalities in shaping spatial perception [22,23]. Visual elements such as urban greenery, landscape form, and building façades profoundly influence the public’s understanding and experience of ecological spaces [24]. Visual perception has thus become a key dimension in evaluating urban ecological quality. Although existing studies suggest a potential close relationship between visual elements and ecological sensitivity, systematic investigations into the spatial coupling between the two remain limited [25,26]. Particularly within complex urban settings, there is a lack of comprehensive methodological frameworks capable of revealing the coordination level and spatial mismatch patterns between visual and ecological sensitivity [27]. To address this gap, this study introduces a coupling coordination degree model and bivariate spatial autocorrelation analysis to systematically evaluate the spatial synergy and divergence of these two dimensions at the street level.
Against this background, this study aims to fill the methodological gap in understanding the spatial coupling and coordination between ecological sensitivity and visual sensitivity. Rather than proposing a completely new framework, it builds upon existing approaches by integrating traditional expert-driven ecological assessments with public perception data derived from social media and street-view imagery. Specifically, the study utilizes visual perception data sourced from social media—including 920 street-view images and their corresponding comment texts—and applies deep learning techniques such as the ADE20K model for image processing and the GPT-4o large language model for textual analysis to construct a street-level visual sensitivity perception model. This model is then used to evaluate the integrated visual ecological sensitivity of 56,210 street-view points within the central urban area of Tianjin. The main objectives of this study are as follows: (1) to analyze the spatial coupling relationship between visual sensitivity and ecological sensitivity in Tianjin’s central urban area, identifying their correlations and complementary characteristics; (2) to develop a public perception-integrated urban visual sensitivity evaluation framework based on social media-derived data and street-view imagery; and (3) to identify typical areas of “ecological blind spots” and “perceptual hotspots” within the urban landscape, and propose human-centered strategies for optimizing ecological space. This study not only provides a perception-driven approach for urban ecological management in Tianjin, but also offers theoretical and practical insights for advancing ecological sensitivity assessment methodologies in other high-density urban contexts.

2. Materials and Methods

2.1. Study Area

Tianjin is located in northern China (38°34′–40°15′ N, 116°43′–118°4′ E) and serves as a core city within the Beijing-Tianjin-Hebei urban agglomeration, covering a total area of approximately 216,000 km2 (Official website of the State Council of the People’s Republic of China, https://www.gov.cn/xinwen/2023-02/26/content_5743341.htm (accessed on 4 January 2025)). The central urban area of Tianjin comprises six administrative districts, namely Heping, Hedong, Hexi, Nankai, Hebei, and Hongqiao, covering an area of about 195 km2 (Ministry of Civil Affairs of the People’s Republic of China, http://xzqh.mca.gov.cn/ (accessed on 4 January 2025)). Characterized by a temperate monsoon climate, this area has an annual average temperature ranging between 11 °C and 14 °C and an annual precipitation of approximately 500–700 mm. The region is predominantly flat, characterized by plains, situated eastward along the Bohai Sea and westward adjacent to the North China Plain. It serves as an important economic and industrial hub in northern China and forms an integral part of the Beijing-Tianjin-Hebei ecological framework.
With rapid economic development and accelerated urbanization, the central urban area of Tianjin faces increasingly severe ecological challenges [28]. Issues such as air pollution, water scarcity, and reduced green spaces are particularly prominent. The rapid expansion of urban construction land has significantly impacted ecological land and public green spaces, posing a critical challenge to the carrying capacity of the urban ecological environment. To achieve sustainable development, the ecological vulnerability of this region highlights the urgent need for comprehensive ecological assessments to effectively guide ecological management and urban planning (Figure 1).
Importantly, Tianjin’s central districts were selected not merely for their local ecological conditions, but as a representative case of a post-rapid-urbanization city that has already experienced many challenges associated with fast-paced growth. In addition, the study area provides access to abundant social media data and extensive Baidu street-view imagery, which offer valuable resources for integrating public perception with spatial ecological evaluation. These advantages make Tianjin an appropriate setting to test the applicability of the proposed analytical approach in a real-world context and to derive insights that can be extended to other high-density urban environments facing similar ecological and perceptual issues.

2.2. Data Sources

2.2.1. Traditional Ecological Sensitivity Data

The data used are presented in Table 1. Land use data were sourced from “The 30 m annual land cover dataset and its dynamics in China from 1990 to 2023”, hosted on Zenodo (https://zenodo.org/records/12779975 (accessed on 4 January 2025)). This dataset classifies land into cropland, forest land, grassland, water bodies, built-up land, and unused land, with a spatial resolution of 30 m × 30 m. NDVI data, were obtained from the National Ecological Data Science Center, covering the period from 2000 to 2022 at a resolution of 30 m × 30 m. Nighttime light data, serving as a proxy for human activity and urbanization, were obtained from Wu et al. (2021) in their study “An improved time-series DMSP-OLS-like data (1992–2022) in China by integrating DMSP-OLS and SNPP-VIIRS”, available on Harvard Dataverse with a resolution of 500 m × 500 m [29]. Digital Elevation Model (DEM) data, describing terrain conditions, were sourced from NASA’s Shuttle Radar Topography Mission (SRTM), with a spatial resolution of 30 m × 30 m, and were processed to generate slope and elevation layers. To ensure comparability among datasets with differing spatial resolutions, all raster layers were resampled, reprojected, and clipped within ArcGIS Pro 3.0.2 to maintain a consistent spatial resolution of 30 m × 30 m under the same coordinate system. Selected datasets with high spatial resolution, broad temporal coverage, and strong relevance ensured a robust and comprehensive analysis of ecological sensitivity across the study area [30].

2.2.2. Social Media Data Collection

Considering the necessity for street-view imagery from social media platforms to possess global cultural diversity, high-quality visual data, rich user-generated textual reviews, high user engagement, and an open data ecosystem [31], this study selected Instagram (INS) as the source of social media data. First, as an image-oriented platform, INS provides high-definition street-view images, which are advantageous for extracting environmental elements such as buildings, greenery, and roads, making them highly suitable for ADE20K semantic segmentation [32]. Additionally, INS posts usually contain user-generated textual reviews, facilitating text sentiment analysis via GPT-4o to quantify visual sensitivity [33]. Second, INS’s global user base covers diverse regions and, compared to platforms such as Weibo, Xiaohongshu, and Twitter, provides superior image quality and location accuracy, making it particularly suitable for multi-modal ecological sensitivity studies [34]. Furthermore, INS’s relatively open API facilitates data collection and deep learning modeling [35].
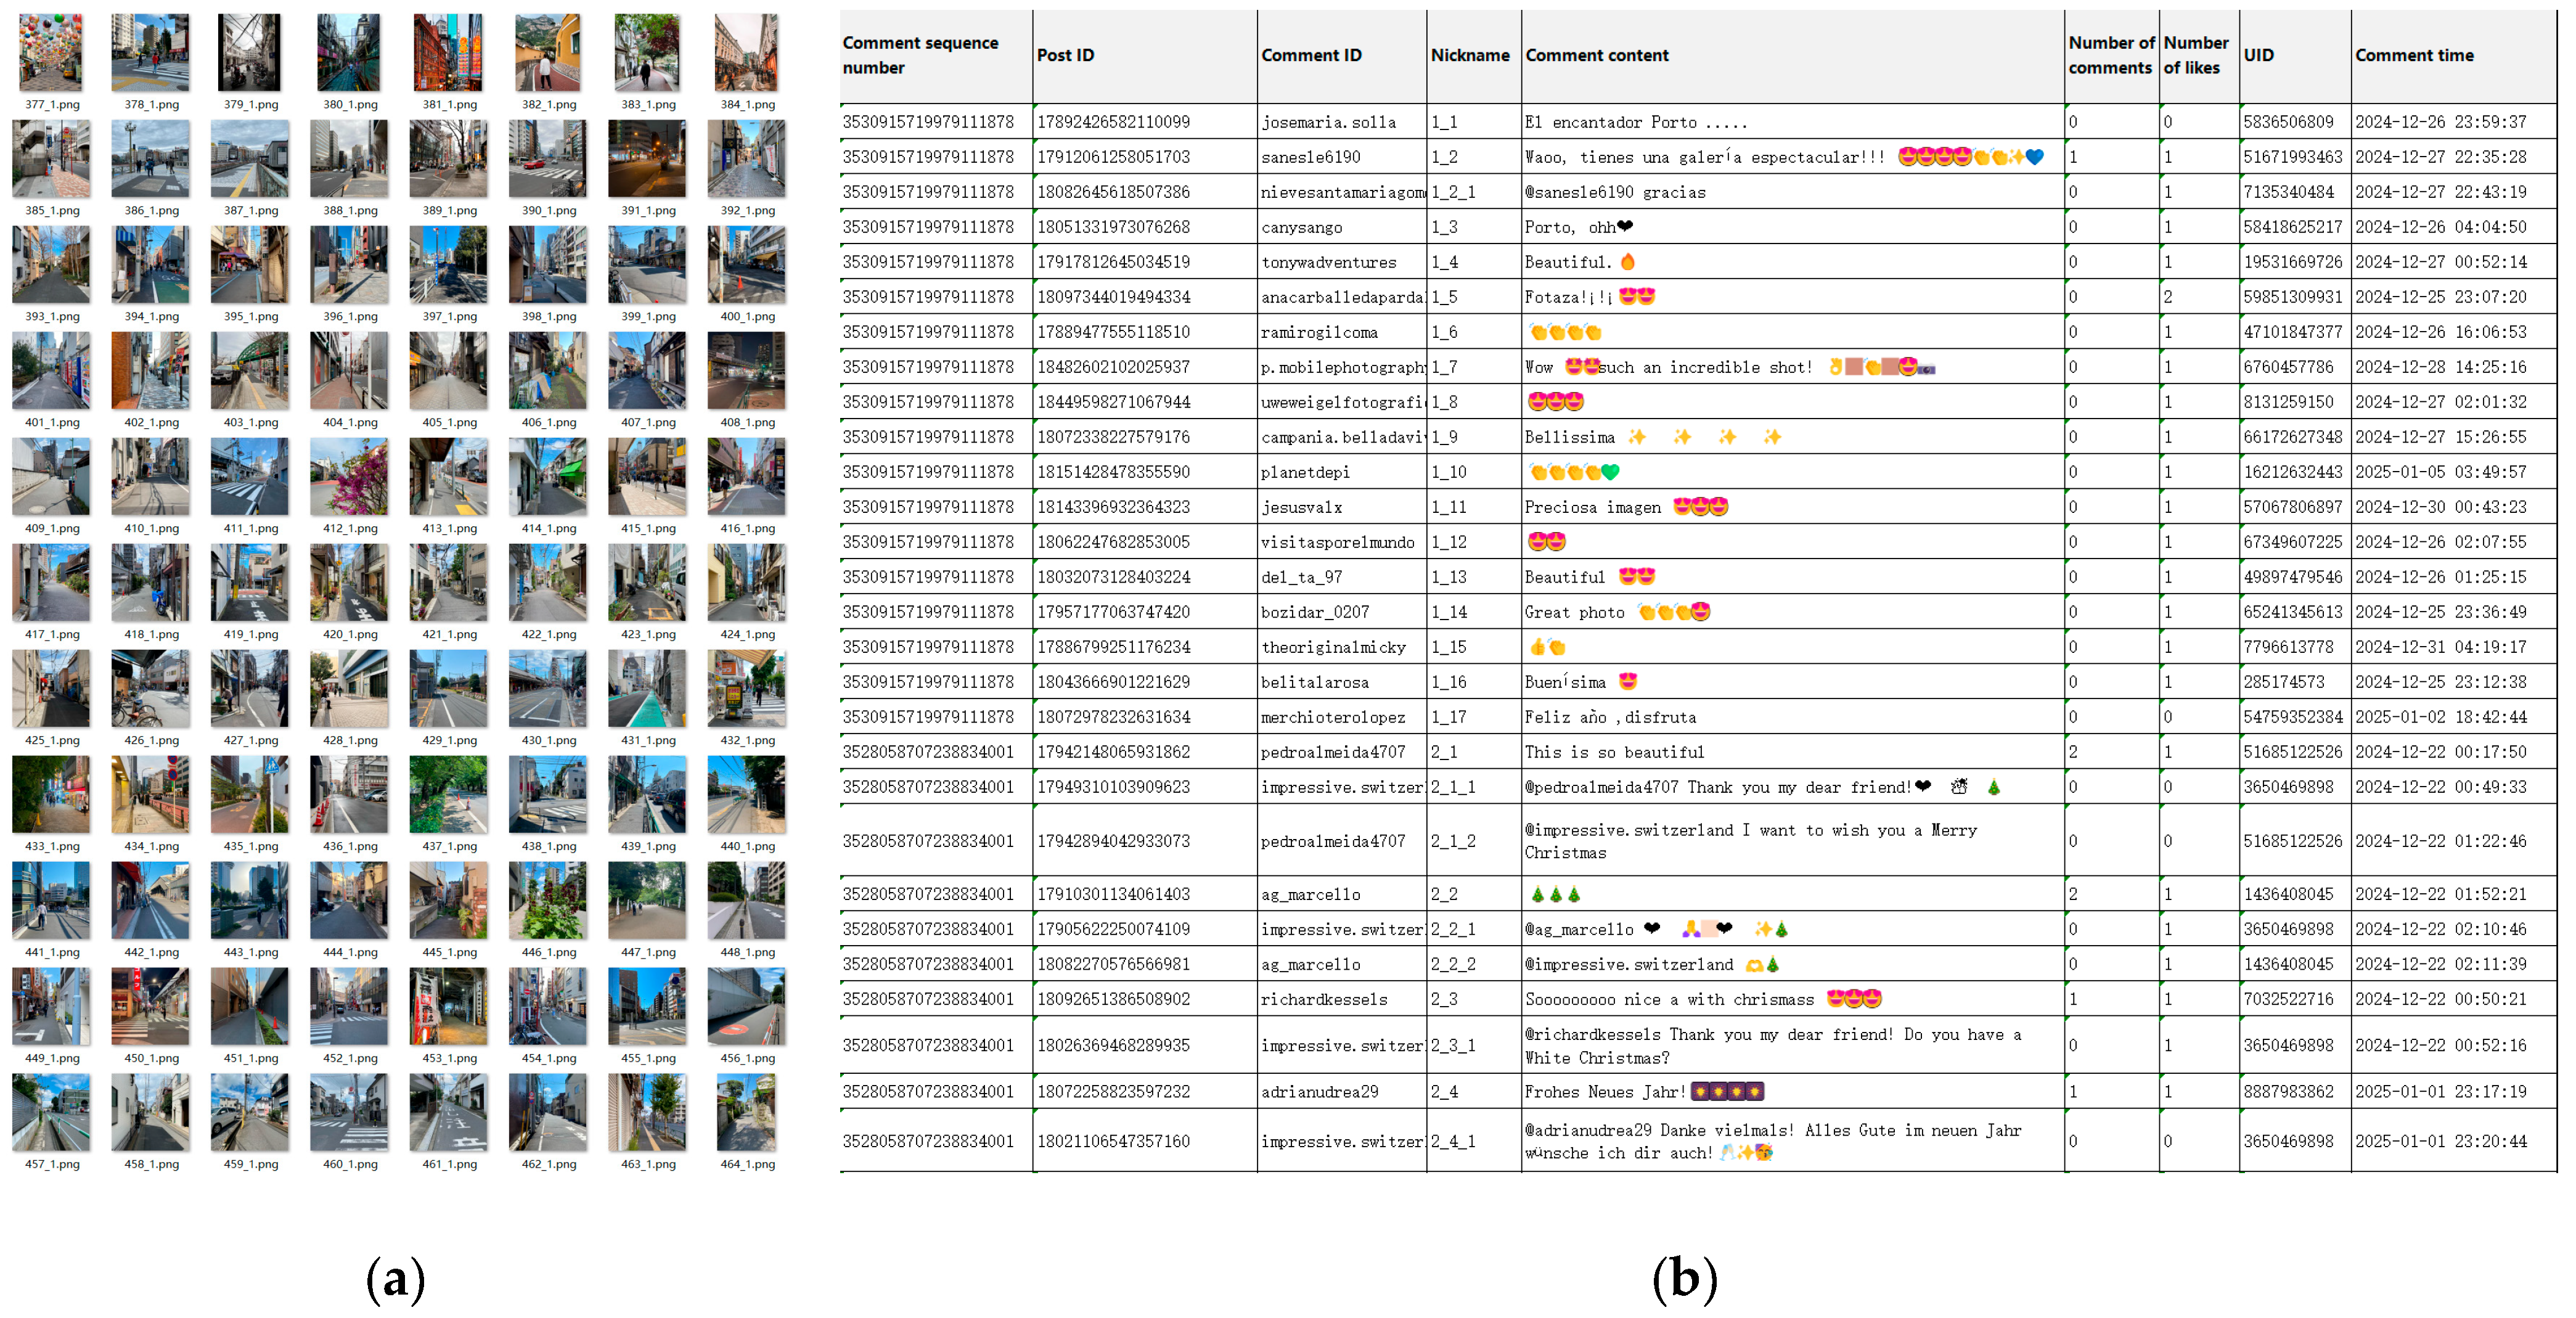
Visual perception data from INS were collected in batches using Python 3.12 scripts. Keywords such as “streetscape, urban form, avenue, alley, arterial, back alley, pedestrian zone, amenity zone, bike facilities, access road” were used to gather single images with similar sky proportions to Baidu Street View imagery. A total of 2817 urban streetscape-related posts were collected, yielding 2817 single-view images and 21,213 corresponding textual reviews (Figure 2). After preliminary text sentiment analysis using GPT-4o to eliminate posts with zero relevance to the urban environment and visual sensitivity, 920 street-view images and their corresponding textual reviews remained.

2.2.3. Baidu Street View Data Collection

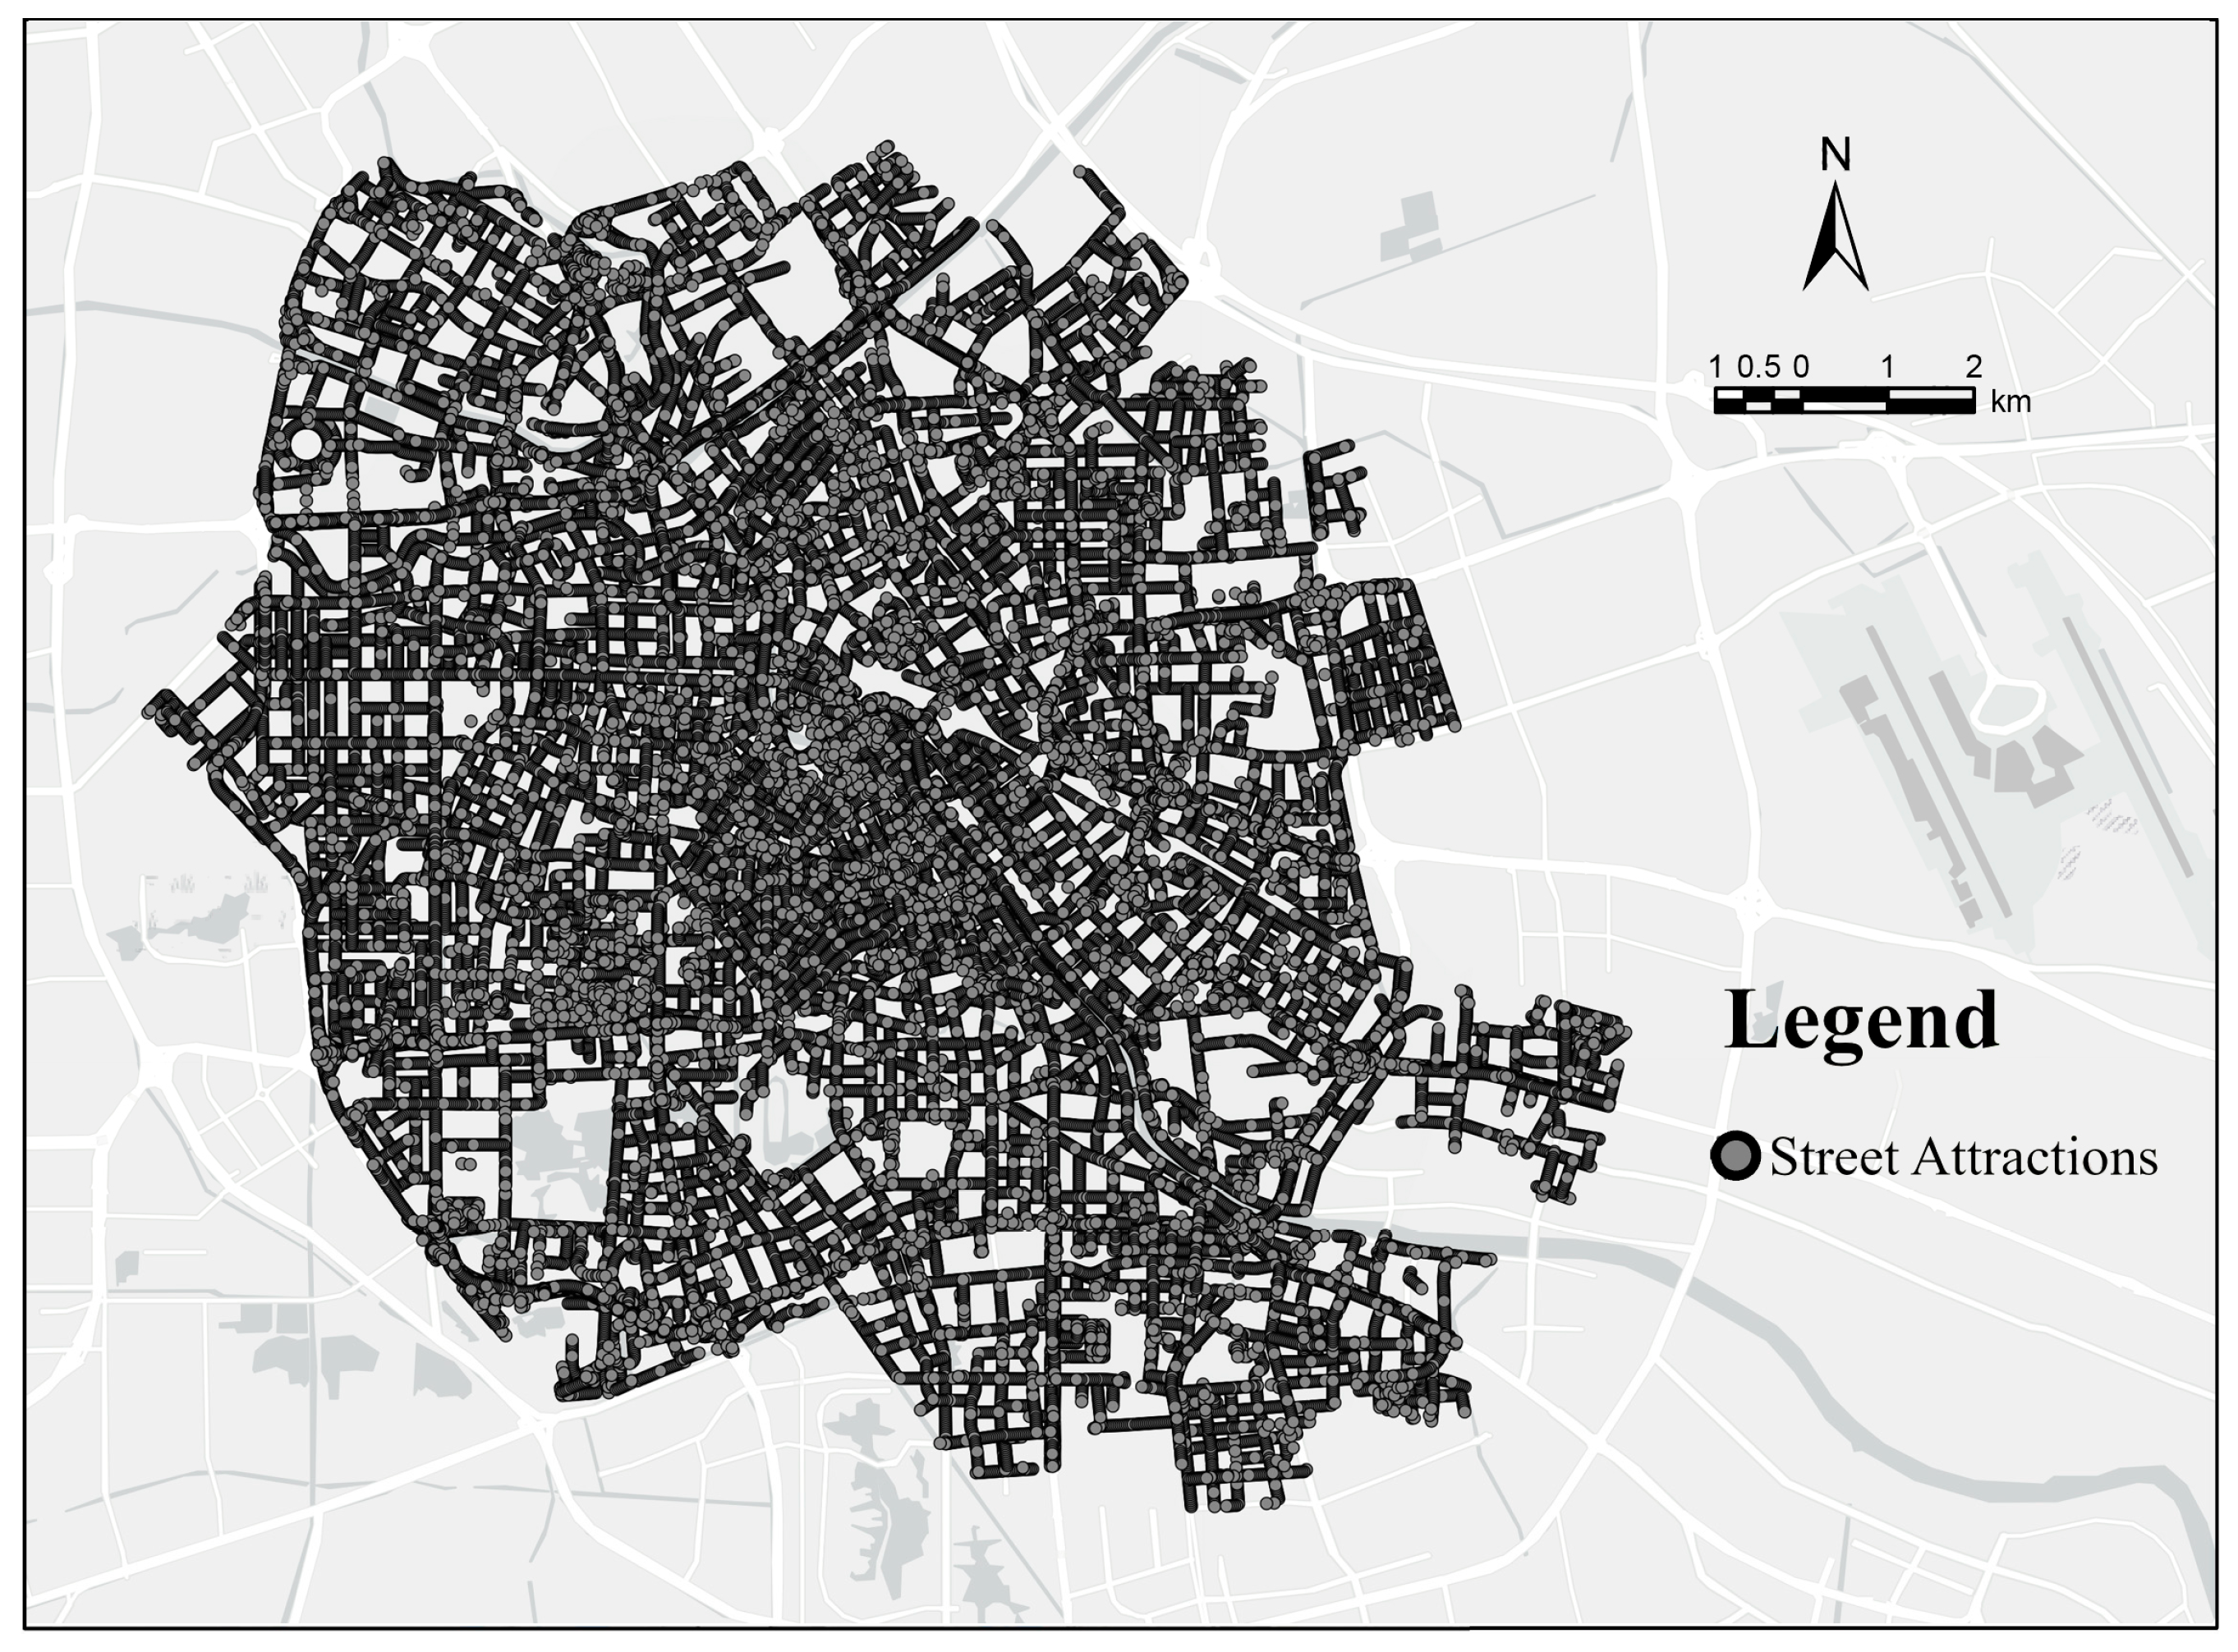
The boundary shapefile of the six central urban districts of Tianjin was acquired, along with road network data from OpenStreetMap (OSM). Using ArcGIS Pro’s clipping tool, road data for these six central districts were extracted. Subsequently, ArcGIS Pro was employed to generate sampling points at 30 m intervals along these roads, resulting in a total of 56,210 street-view sampling points within the six central districts of Tianjin for the year 2020 [36] (Figure 3). Each sampling point contains four street-view images captured in the forward, backward, left, and right directions, together with the corresponding geographic coordinates (latitude and longitude). The four directional images collectively represent the panoramic visual field of each location, allowing the integration of visual content and spatial position. These attributes enable each sampling point to serve as a spatial reference unit for calculating both visual and ecological sensitivity values.

2.3. Methods

2.3.1. Research Framework

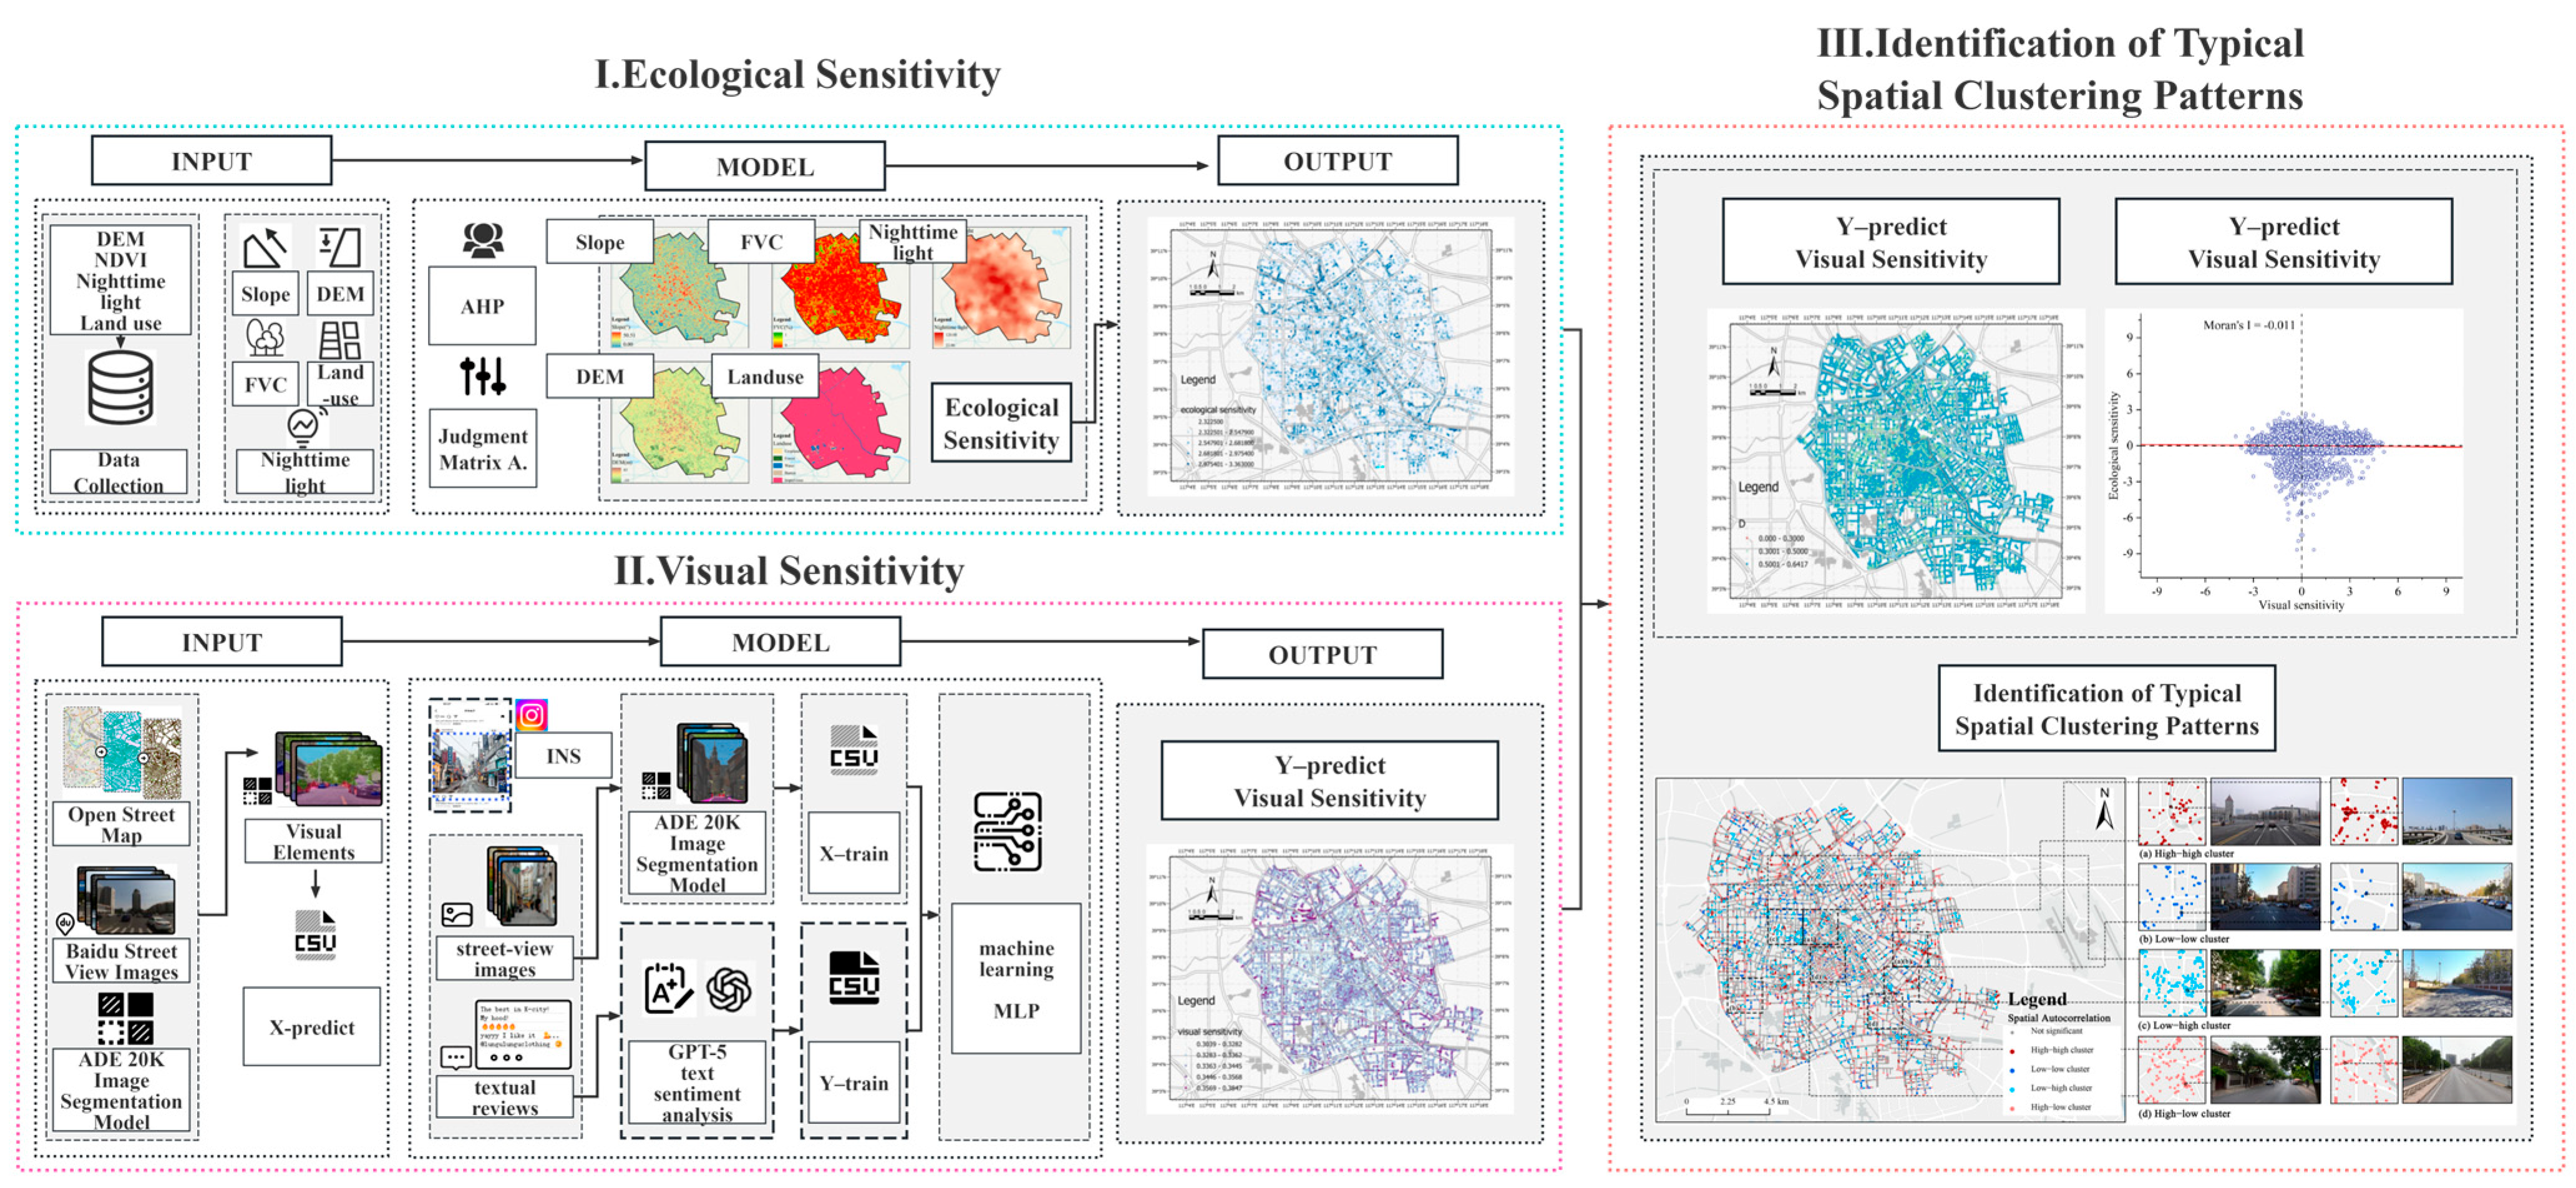
This study focuses on analyzing the spatial relationship between ecological sensitivity and visual sensitivity. The methodological framework is divided into two components: ecological sensitivity and visual sensitivity, as illustrated in Figure 4. Research Framework.
(1) Ecological sensitivity (Input–Output):
Natural and environmental data including DEM, NDVI, nighttime light, and land use were collected and processed in ArcGIS Pro. Based on these inputs, five major indicators—elevation, slope, vegetation coverage (FVC), land use type, and nighttime light index—were weighted using the AHP [37]. The outputs generated an ecological sensitivity map for the six central districts of Tianjin.
(2) Visual sensitivity (Input–Output):
For the perception dimension, visual sensitivity was derived from social media data. After screening, 920 street-view images and their corresponding textual evaluations were collected. Visual features were extracted from the images using the ADE20K segmentation model, while textual comments were analyzed with the GPT-4o large language model to capture public sentiment. These multimodal features served as the input for a Multilayer Perceptron (MLP), which generated outputs of predicted visual sensitivity values for 56,210 street-view points across Tianjin’s central urban area.
Finally, the spatial relationship between ecological and visual sensitivity was systematically examined using a coupling coordination degree model and bivariate Moran’s I analysis, enabling the identification of coordination levels, spatial mismatches, and clustering patterns between the two dimensions.

2.3.2. Ecological Sensitivity Model Construction

Ecological sensitivity refers to the responsiveness of an ecosystem when facing external disturbances or changes, measuring the system’s sensitivity and adaptability to environmental pressures [38,39]. In urban environments, ecological sensitivity is particularly crucial due to increasing urbanization, placing dual pressures from natural and anthropogenic factors on ecological systems [40]. High ecological sensitivity indicates weak adaptability of ecosystems to external disturbances, thus making them more vulnerable [41]. Conversely, low ecological sensitivity indicates greater adaptability and resilience to external changes, demonstrating stronger self-recovery capacities [42].
The ecological sensitivity assessment employed multiple environmental data sources, including slope, fractional vegetation cover (FVC), nighttime light, digital elevation model (DEM), and land use type. These factors serve as critical indicators within urban ecological environments, reflecting variations in ecological carrying capacity and ecological health across different areas [43]. The AHP was utilized to weight these factors scientifically, determining their relative importance to ecological sensitivity. The Digital Elevation Model (DEM) is a fundamental dataset that reflects terrain undulation. In urban ecosystems, elevation can reveal water flow paths and accumulation zones, thereby influencing the formation and dynamics of ecological environments. Low-lying areas tend to accumulate surface runoff, which may facilitate the development of wetland ecosystems, whereas higher elevation zones are often associated with nature reserves or mountainous landscape areas. Therefore, analyzing elevation data enables the identification of regions with higher ecological sensitivity, as well as areas that may exhibit greater ecological stability due to topographical advantages.
Slope is one of the critical factors influencing ecological sensitivity, as it is directly associated with ecological risks such as soil erosion and water loss. Slope was calculated using the slope analysis tool in ArcGIS Pro and classified into four levels (0–2°, 2–4°, 4–8°, and >8°), with weights assigned based on ecological risk levels, thereby highlighting its role in the overall ecological sensitivity assessment [44].
Fractional Vegetation Cover (FVC) is another critical factor in ecological sensitivity assessment. FVC was calculated using the gdal and numpy libraries in Python based on the following formula:
F V C = N D V I N D V I s o i l N D V I v e g N D V I s o i l
where F V C denotes the FVC, N D V I s o i l represents the NDVI value of bare soil (taken as the 5th percentile of the cumulative frequency), and N D V I v e g corresponds to the NDVI value of full vegetation cover (taken as the 95th percentile of the cumulative frequency). Areas with high FVC typically have abundant greenery, effectively absorbing carbon dioxide, mitigating urban heat islands, and providing habitats for wildlife. The FVC value ranges from 0% to 100%, corresponding to varying ecological sensitivity levels [45].
Nighttime light acts as an indirect indicator of urban development, typically correlating with urbanization level, commercial activity, and traffic density. Excessive night lighting can negatively impact ecosystems, particularly disturbing nocturnal species’ behavior; thus, nighttime lighting is a significant factor in assessing ecological sensitivity. This research divided nighttime lighting into four categories (>45, 20–45, 5–20, and 0–5), assigning weights according to potential ecological threats [46].
The Digital Elevation Model (DEM) provides foundational data reflecting topographical variations. Within urban ecosystems, DEM data reveal water flow paths and accumulation areas, influencing ecological environments’ formation and changes. Lower elevation areas generally accumulate water, fostering wetland ecosystems, while higher elevations may include natural reserves or mountainous landscapes. Therefore, DEM analysis further identifies areas of high ecological sensitivity and those potentially more stable due to their topography [47,48].
Land use type is an essential component of urban ecosystems, offering detailed insights into urban space usage and ecological resource allocation. Different land use types—such as unused land, construction land, farmland, grassland, water bodies, or forests—affect ecological stability and resilience differently [49]. For instance, forests and water bodies generally have stronger ecological carrying capacity, while built-up areas may lead to ecological disruption and species loss [50]. For the ecological sensitivity assessment, the 500 m resolution NPP-VIIRS nighttime light data were processed using the Natural Breaks (Jenks) classification method in ArcGIS Pro to categorize them into four sensitivity levels. The Natural Breaks method classifies data based on their inherent characteristics, by maximizing inter-class variance while minimizing intra-class variance, thus revealing natural groupings within the dataset. Land use data derived from the CLCD (China Land Cover Dataset) were reclassified based on their sensitivity to ecological impacts: unused and built-up land were classified as low sensitivity areas, cropland as moderate sensitivity, grassland as high sensitivity, and water bodies and forest land as extremely high sensitivity. Through this grading and reclassification process, both datasets were integrated within a unified ecological sensitivity evaluation framework.
The relative importance of the five indicators was determined using the Analytic Hierarchy Process (AHP). Expert judgment and pairwise comparisons were employed to construct the judgment matrix, from which the eigenvector and consistency ratio (CR) were calculated. The final normalized weights are presented in Table 2, showing that elevation (0.4408) and fractional vegetation cover (0.2936) exert the greatest influence on ecological sensitivity, followed by slope (0.1597), land use type (0.0657), and nighttime light (0.0403). This distribution indicates that natural topographic and vegetation-related factors play a more dominant role in shaping ecological sensitivity than anthropogenic indicators, aligning with findings from previous urban ecological studies.
Ultimately, the ecological sensitivity assessment incorporated slope, FVC, nighttime light, DEM, and land use data to establish a comprehensive evaluation framework (Table 2, Figure 5). The AHP, as a multi-objective decision-making approach, integrated expert opinions, constructed judgment matrices and weight vectors to rank ecological security factors such as elevation, slope, vegetation cover, land use type, and nighttime lighting indices. Initially, factor maps were generated as shown in (Figure 5a–e). Subsequently, a judgment matrix A for the AHP was constructed (Table 2). Based on the AHP, the judgment matrix A was processed using the eigenvalue method. The maximum eigenvalue of the matrix was calculated as λmax. The corresponding eigenvector W was normalized to obtain the final weight vector Wi, representing the relative importance of each factor in the ecological sensitivity evaluation. To verify the consistency of the judgment matrix, the consistency ratio (CR) was computed and yielded a value of 0.0634, which is less than the threshold of 0.1, indicating acceptable consistency in expert judgments. Lastly, the yaahp 10.1 software was employed for AHP calculations, constructing a hierarchical ecological sensitivity evaluation framework to comprehensively reveal the region’s ecological status and development trends (Figure 5f).

2.3.3. Construction of the Visual Sensitivity MLP Model

The construction of the visual sensitivity model for streets was based on social media-derived data, specifically integrating images and corresponding textual evaluations from the INS platform for street-level visual sensitivity analysis. Individual street-view images with a certain proportion of sky comparable to Baidu Street View imagery were selected. Posts identified as having “zero relevance to the urban environment” or “zero visual sensitivity” were removed using the GPT-4o image recognition model. Ultimately, 920 street-view images and their corresponding textual evaluations were retained as core materials for the research. These images and comments were used to comprehensively understand public visual perceptions and ecological sensitivity evaluations of specific street environments, thereby revealing the ecological characteristics of streets and their association with public perceptions.
Image data processing began with segmentation of street-view images using the ADE20K model [51]. ADE20K is an advanced semantic segmentation model capable of accurately classifying different objects and scenes within images, thus extracting critical elements from street-view imagery [52,53]. These elements include buildings, greenery, roads, and street furniture, resulting in 10 key categories: Road, Building, People, Mountain, Sky, Plant, Traffic Sign (TS), Water, Advertising Board (AB), and Vehicle. The visual characteristics of each category significantly influence the evaluation of street-level visual sensitivity. This method allowed the extraction of detailed information from street-view images, providing a robust data foundation for subsequent analyses.
For processing textual evaluations, the GPT-4o model, an advanced generative language model, was employed to extract visual sensitivity scores from social media comments [54,55]. These comments contained users’ subjective perceptions and evaluations of street scenes, including descriptions of environmental aesthetics, greenery conditions, and spatial comfort. Using GPT-4o’s semantic analysis and sentiment extraction capabilities, the textual data were converted into quantifiable visual sensitivity metrics. The API interface was prompted with the description: “Urban relevance refers to whether comments mention a specific place name and whether the semantics describe that location. Visual sensitivity measures the degree of attention observers pay to landscapes within their field of view, closely related to geographic location, landscape attributes, and other factors [56,57,58]. It evaluates the visual attractiveness and landscape value perceived by observers within visible areas, aiming to identify highly sensitive areas to prevent visual disturbances and resource wastage caused by development [59,60]. Scores range from 0 to 1, with higher scores indicating stronger sentiments”. Through this approach, unstructured textual data were effectively transformed into structured numerical data, providing a scientific basis for subsequent modeling and analysis.
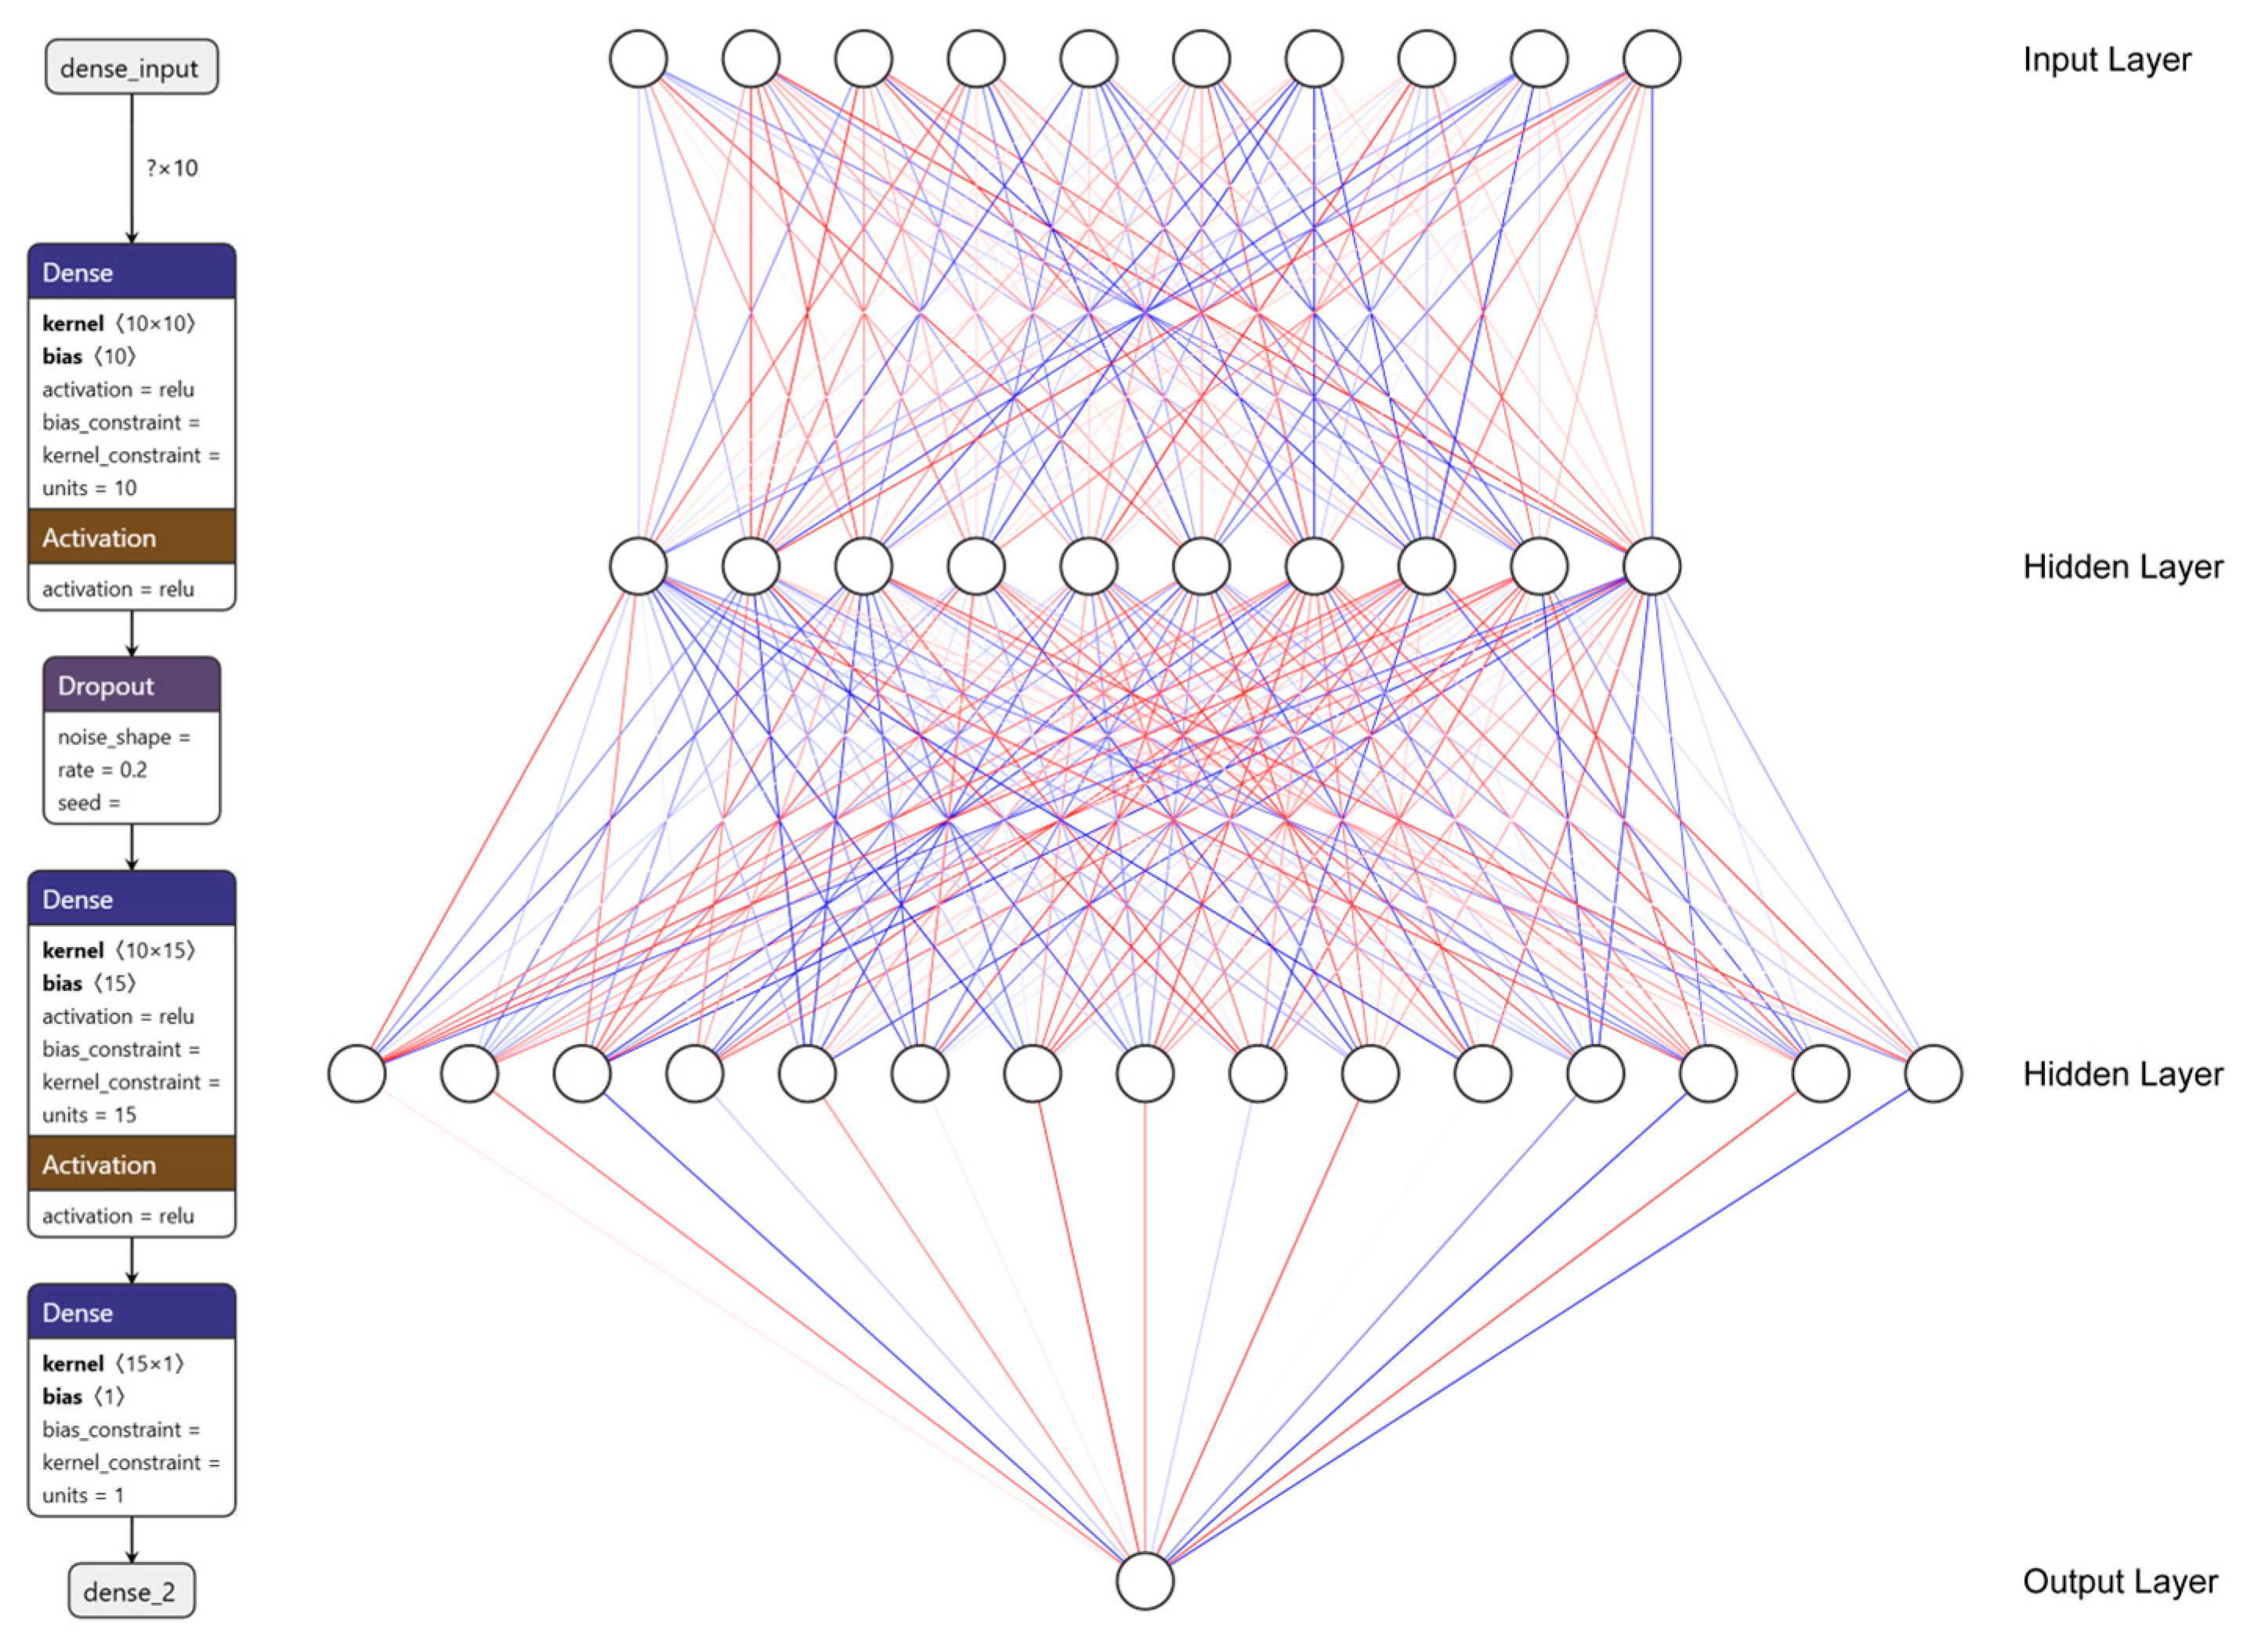
Integrating results from image segmentation and sentiment analysis of textual evaluations, this study employed the MLP algorithm to establish a social media-driven street-level visual ecological sensitivity perception model. The MLP algorithm, as a classical neural network model, can identify complex non-linear relationships among large sets of input features and achieve accurate predictive modeling through training [61,62]. The neural network was constructed using the TensorFlow framework based on Python and libraries such as Keras [63,64]. Input features for the MLP algorithm included street-view elements extracted from image segmentation. As illustrated, the model-building process consisted of an InputLayer, two hidden Dense layers containing 10 and 15 neurons, respectively, and a Dropout layer to prevent overfitting. Finally, a single-neuron Dense layer was used to predict visual sensitivity values (Figure 6).

2.3.4. Correlation and Coupling Coordination Degree Analysis

To enhance the interpretability of the visual sensitivity model and examine the relationship between ecological and perceptual systems, this study employs two complementary analytical methods: Pearson correlation analysis and the Coupling Coordination Degree (CCD) model.
(1) Pearson Correlation Analysis
The Pearson correlation coefficient was used to measure the linear relationship between visual sensitivity and a series of environmental features extracted from street-view images, such as Road, Building, People, Mountain, Sky, Plant, TS, Water, AB, and Vehicle. This method quantifies the degree to which two continuous variables vary together, providing an objective measure of their correlation strength. The Pearson coefficient r ranges from −1 to +1, where the absolute value reflects the correlation magnitude [65]. This statistical approach enables the identification of associations between model input variables and visual sensitivity, supporting the subsequent interpretation of spatial patterns in Section 3.1.
(2) CCD Model
To further investigate the coupling relationship between ecological environmental factors and public visual perception in urban spaces, this study employs the CCD. As shown in Equations (2)–(4), two dimensions—Visual Sensitivity and Ecological Sensitivity —are introduced to construct a visual–ecological coupling coordination analysis framework, aiming to reveal the interaction mechanisms between perceptual cognition and ecological conditions in urban environments. The coupling degree C represents the strength of interaction between the two systems, while the coordination degree T reflects the level of coordinated development. Combined, they yield the coupling coordination degree D, which indicates both the closeness of interaction and the state of coordinated development between visual and ecological systems. A larger D value corresponds to a higher level of coordination, whereas a smaller value indicates weaker coordination [66].
Coupling   Degree   ( C ) :   C = 2 × V S × E S V S + E S
Coordination   Index   ( T ) :   T = α V S + β E S α = β = 0.5
Coupling   Coordination   Degree   ( D ) :   D = C T

3. Results

3.1. Results Correlation Between Landscape Features and Visual Sensitivity

The Pearson correlation analysis revealed distinct relationships between visual sensitivity and various environmental features extracted from street-view images (Table 3).
The correlation coefficient between visual sensitivity and Road is 0.288, which is close to zero, with a p-value of 0.390 (>0.05). This indicates that there is no significant relationship between visual sensitivity and Road. The correlation coefficient between visual sensitivity and Building is −0.806, significant at the 0.01 level, indicating a significant negative correlation between the two. The correlation coefficient between visual sensitivity and People is 0.949, also significant at the 0.01 level, indicating a significant positive correlation. The correlation coefficient between visual sensitivity and Mountain is −0.793, significant at the 0.01 level, indicating a significant negative correlation. The correlation coefficient between visual sensitivity and Sky is 0.718, significant at the 0.05 level, indicating a significant positive correlation. The correlation coefficient between visual sensitivity and Plant is −0.828, significant at the 0.01 level, indicating a significant negative correlation. The correlation coefficient between visual sensitivity and TS is −0.860, significant at the 0.01 level, indicating a significant negative correlation. The correlation coefficient between visual sensitivity and Water is −0.875, significant at the 0.01 level, indicating a significant negative correlation. The correlation coefficient between visual sensitivity and AB is 0.730, significant at the 0.05 level, indicating a significant positive correlation. Finally, the correlation coefficient between visual sensitivity and Vehicle is −0.962, significant at the 0.01 level, indicating a significant negative correlation.
Overall, Buildings, Vehicles, Plants, and Traffic Signs (TSs) exhibit strong negative correlations with visual sensitivity, whereas People, Sky, and Advertising Boards (ABs) show strong positive associations. Water and Mountain also display notable negative relationships, reflecting the complex interplay between spatial composition and visual perception.

3.2. Comparative Results of Ecological and Visual Sensitivity

This study selected slope, FVC, nighttime light, DEM, and land use data as key indicators. The AHP was applied to determine the weight of each factor, and the ecological sensitivity of Tianjin’s central urban area was classified into five levels. The ecological sensitivity raster, with a spatial resolution of 30 m × 30 m, was processed in ArcGIS Pro using the “Extract Multi Values to Points” tool (Spatial Analyst extension) to assign raster values to 56,210 street-view sampling points. This operation extracted the ecological sensitivity values corresponding to each point location from the raster layer, thereby generating street-level ecological sensitivity data (Figure 7).
The results reveal significant spatial disparities in ecological sensitivity across the study area. Overall, higher ecological sensitivity is observed in the urban core, particularly concentrated in commercial hubs, intersections of major arterial roads, and areas characterized by high-density development. In contrast, the ecological sensitivity in peripheral zones is relatively low. The ecological sensitivity index ranges from 2.3225 to 3.3630 and tends to increase with intensifying urban land use.
The spatial pattern of ecological sensitivity exhibits a distinct configuration, with clustered point-like distributions in the central diastricts and scattered point- or line-like formations in the peripheral areas. A clear spatial gradient is evident, characterized by a “high-in-center, low-in-periphery” structure.
Highly sensitive zones are predominantly located at key transportation nodes, high-density urban blocks, and functionally complex areas in the city center—particularly along the junction of Heping, Hexi, and Nankai districts. Examples include the Binjiangdao commercial area, surroundings of Tianjin Railway Station, and the vicinity of the Gulou historical district. Moderately sensitive areas are distributed in a belt-like manner, aligning with primary and secondary road networks and forming a radial pattern. In contrast, low-sensitivity regions are concentrated in the outskirts, such as around Tianjin South Railway Station and the borders of Xiqing and Jinnan districts, where the distribution is more dispersed or patchy.
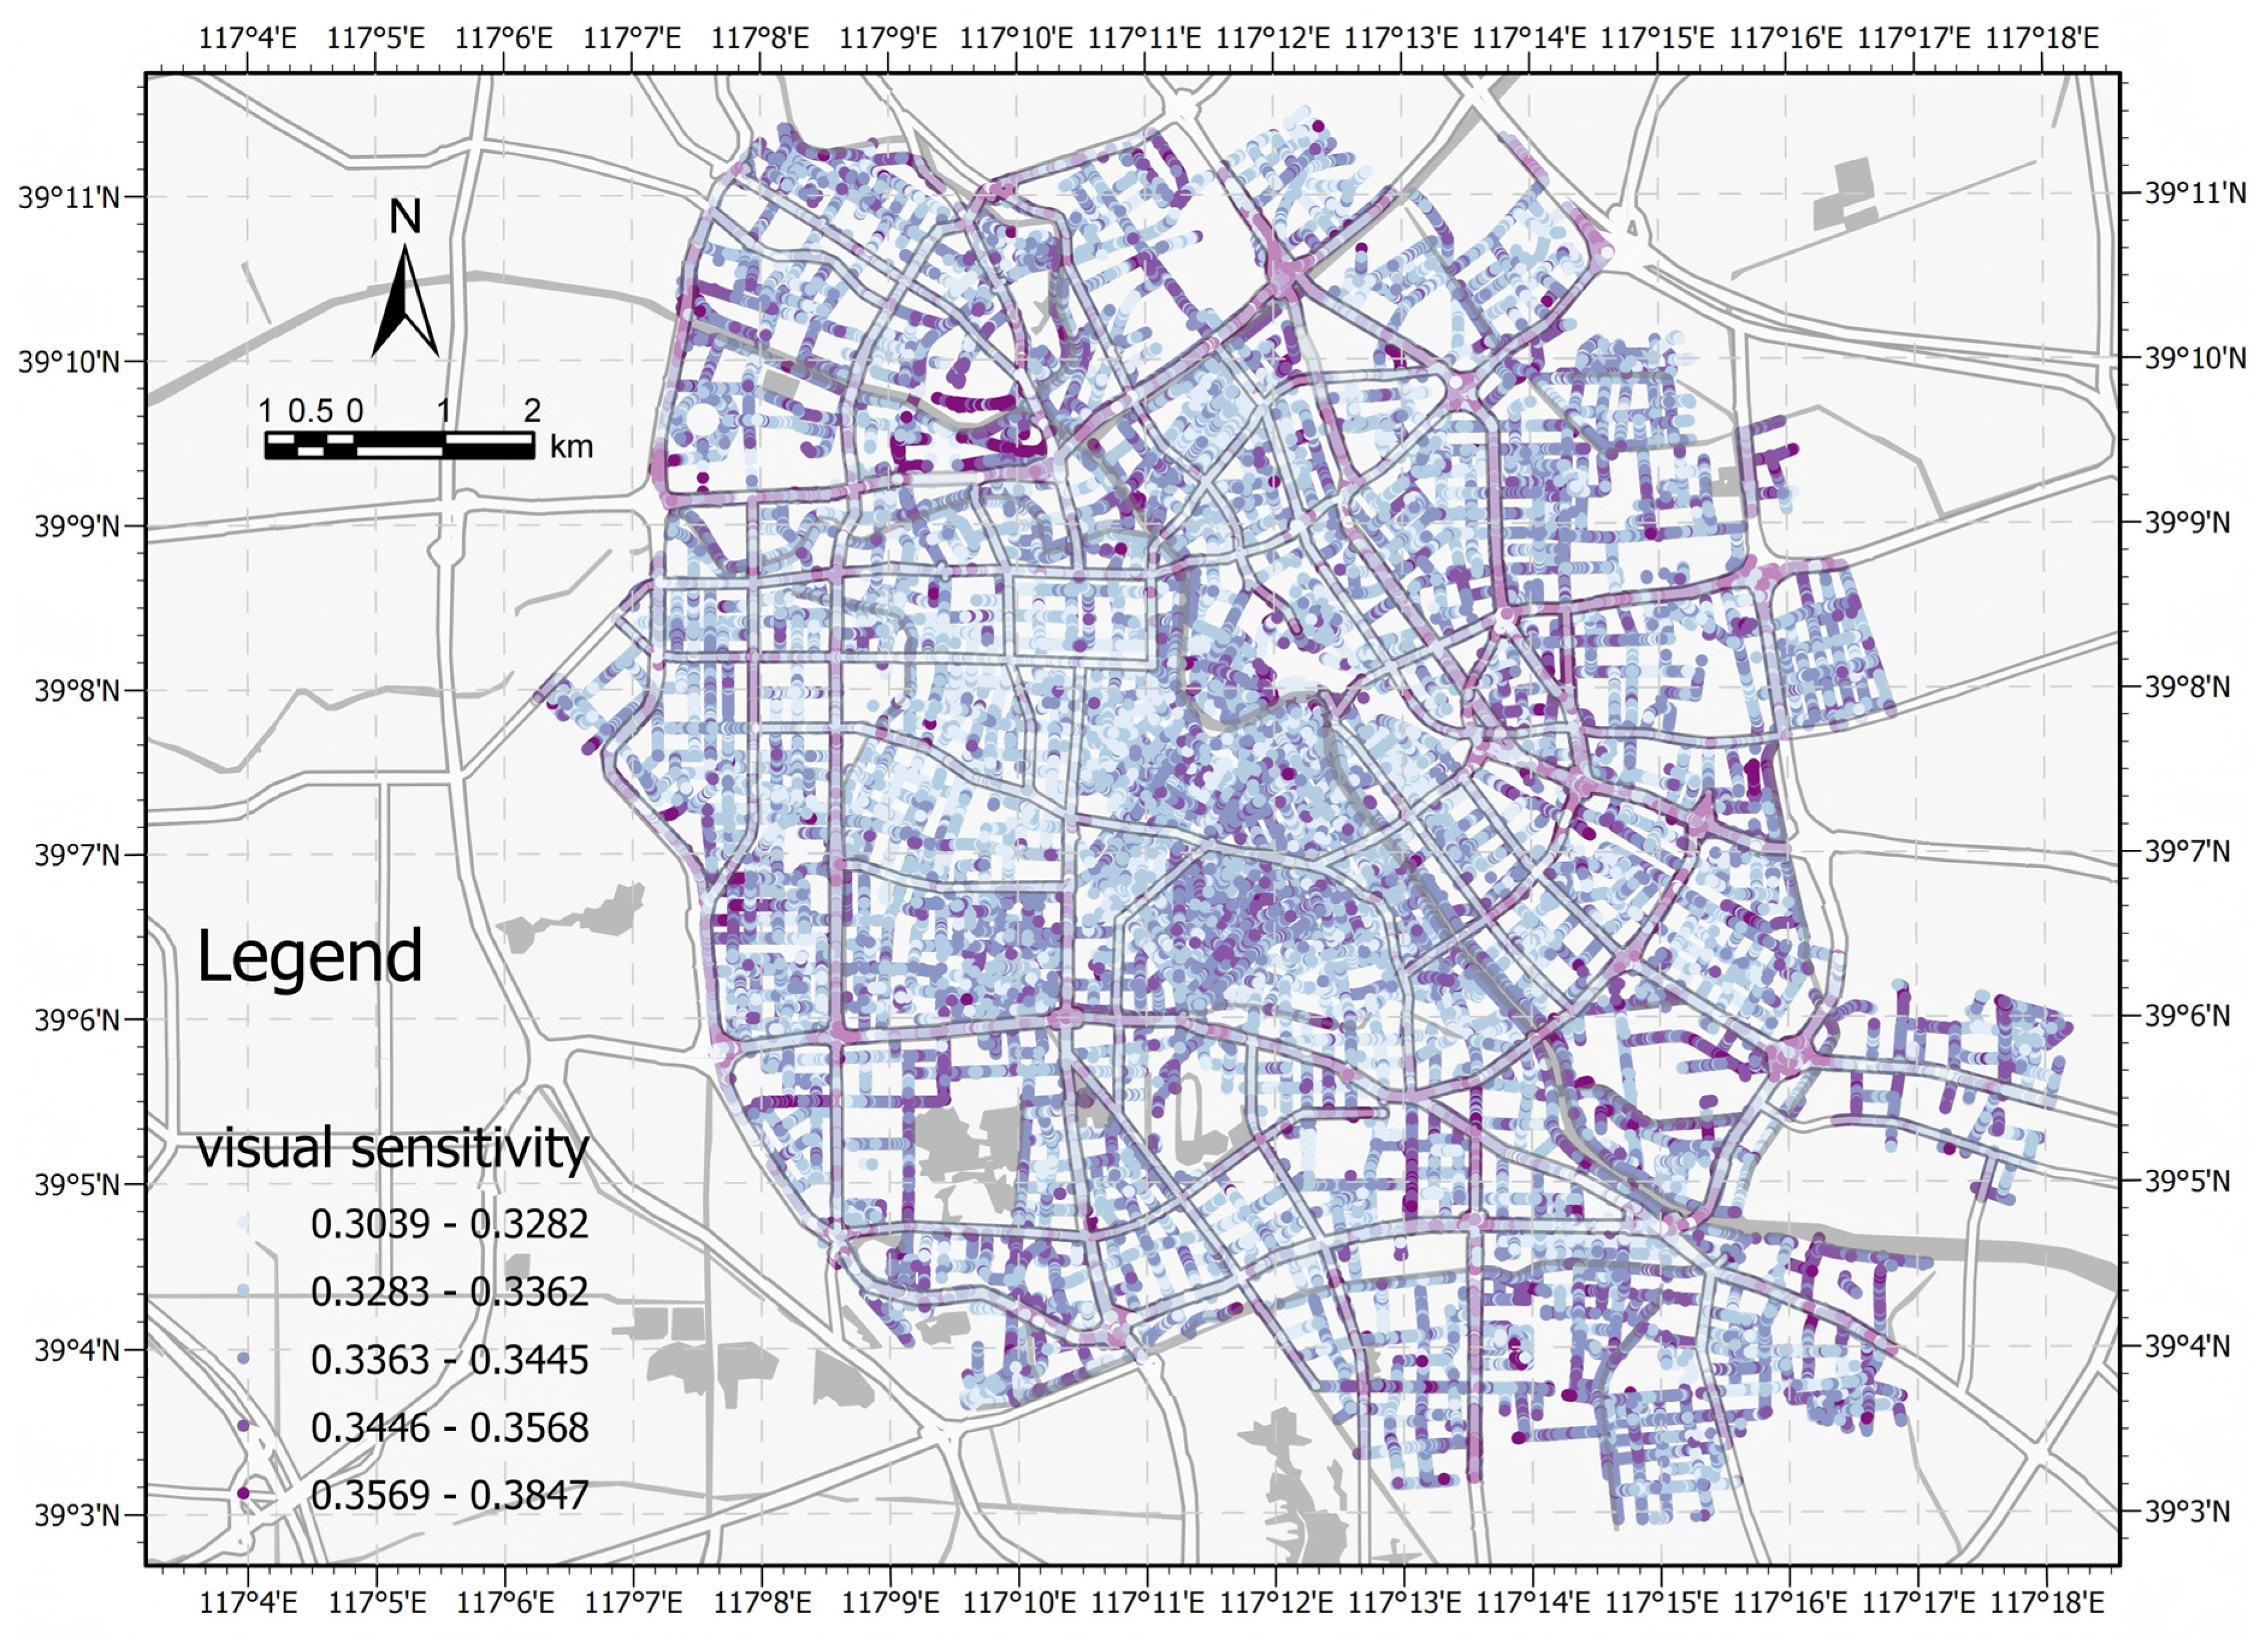
By constructing the Visual Sensitivity MLP Model, the independent variables extracted from Baidu street-view images of Tianjin’s central urban area—including Road, Building, People, Mountain, Sky, Plant, TS, Water, AB, and Vehicle—were set as predictor variables. These variables were input into the model, generating visual sensitivity values based on social media data (Figure 8).
The results indicate that visual sensitivity is higher in the central urban area, particularly around commercial hubs, major transportation nodes, and cultural landmarks such as Binjiang Road, Wudadao (Five Great Avenues), and the Italian Style Street in Tianjin. Additionally, there is no significant difference in visual sensitivity between primary and secondary roads, with a clustered distribution pattern. This may be due to similar characteristics in building density and traffic flow, leading to a comparable perception of visual sensitivity across these road types.
Visual sensitivity exhibits significant spatial clustering, characterized by a pattern of “point-like dispersion, linear aggregation, and planar dispersion”, with varying levels of intensity along the linear clusters. It also demonstrates a clear spatial gradient structure of “high in the center and low at the periphery”, while displaying localized linear aggregation in peripheral areas.
High visual sensitivity exhibits significant spatial clustering, characterized by a pattern of “scattered points, linear aggregation, and dispersed surfaces,” with varying intensities along the linear clusters. It also presents a distinct spatial gradient of “higher in the center, lower on the periphery”, though local linear clustering is observed in some peripheral areas. Areas with high visual sensitivity are highly concentrated in the urban core, particularly in the high-density functional zones at the intersection of Heping, Hexi, and Nankai districts. These include the Binjiangdao commercial area, the hub around Tianjin Railway Station, and the Wudadao cultural tourism zone. In addition, high visual sensitivity is observed at major arterial intersections, crossroads, and elevated road turnarounds, such as the junctions of Nanjing Road, Anshan Road, and Youyi Road, which serve as important transportation nodes. Moderate visual sensitivity areas are mainly located between the urban inner and outer rings, within mixed-use zones and secondary road areas. These regions exhibit a “striped + patchy” clustering pattern, with some forming a “chain-like” extension structure. Examples include secondary roads and residential neighborhoods in Nankai and Hongqiao districts, which display moderate sensitivity. Low visual sensitivity areas are primarily found on the urban periphery, especially in newly developed districts in the south and southeast, as well as along expressway corridors. These include sections near the Jinnan District border, the outer ring road, and areas surrounding the airport.

3.3. Coupling Coordination and Spatial Autocorrelation

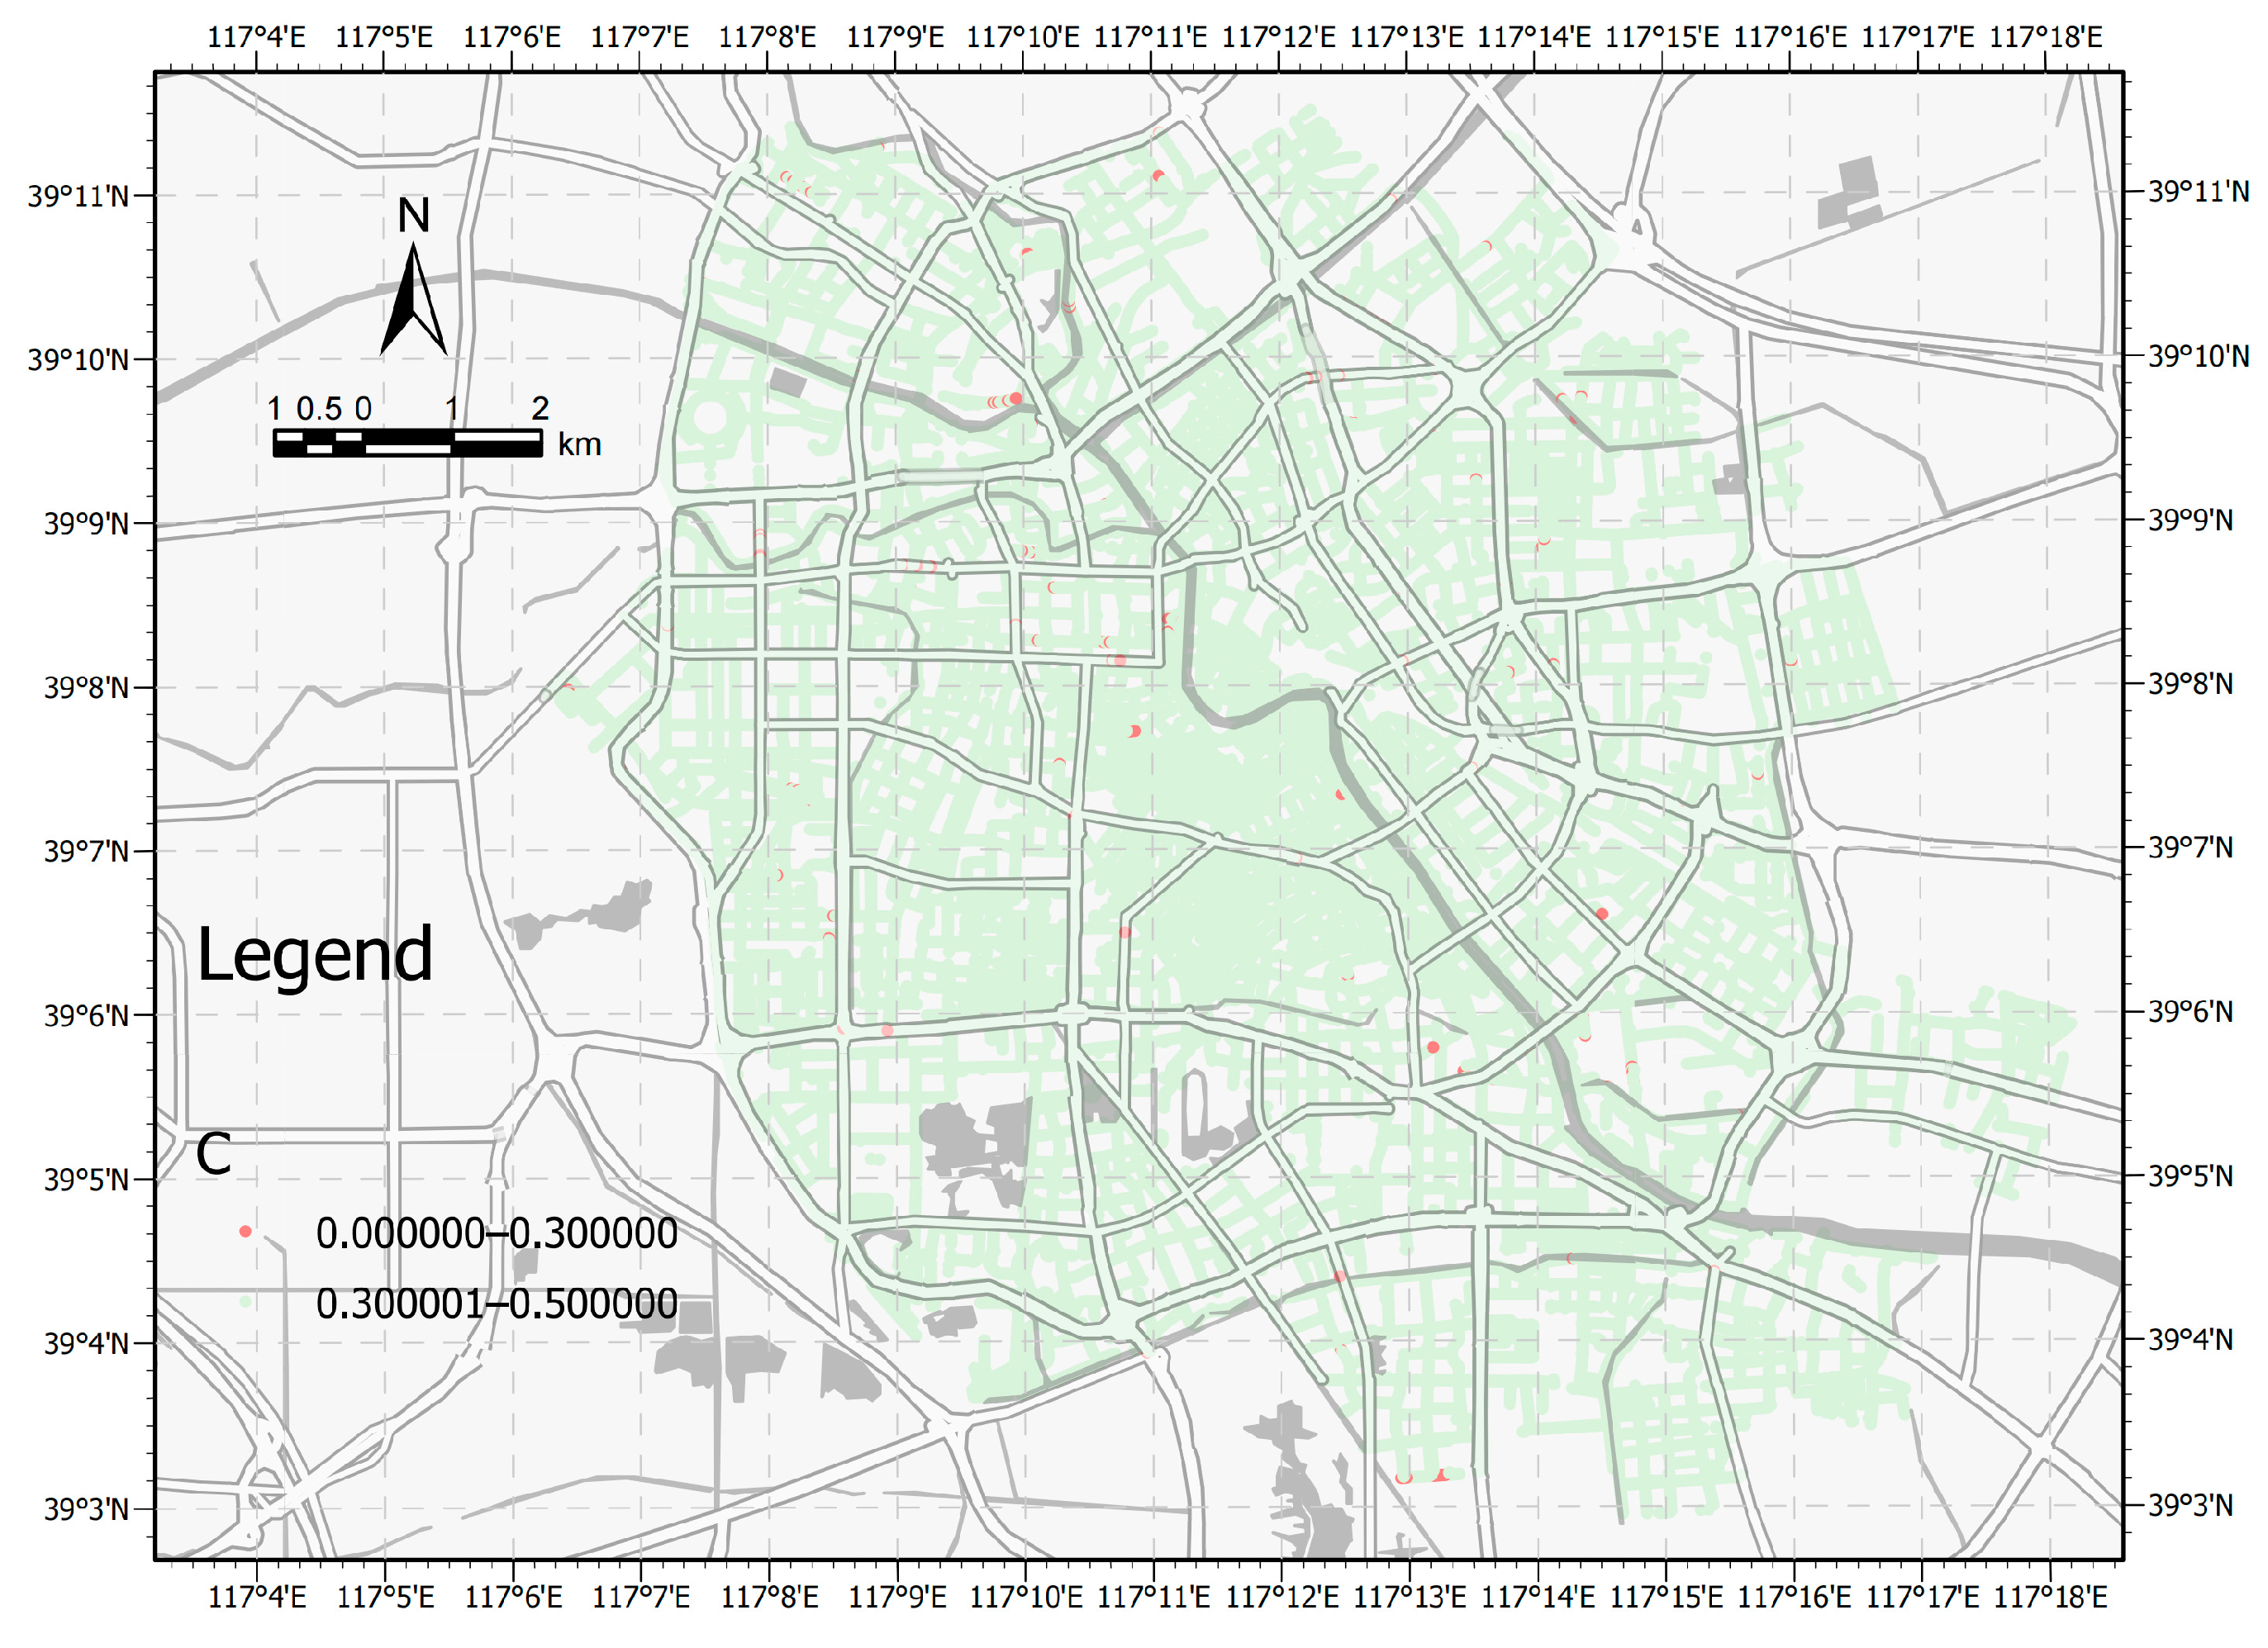
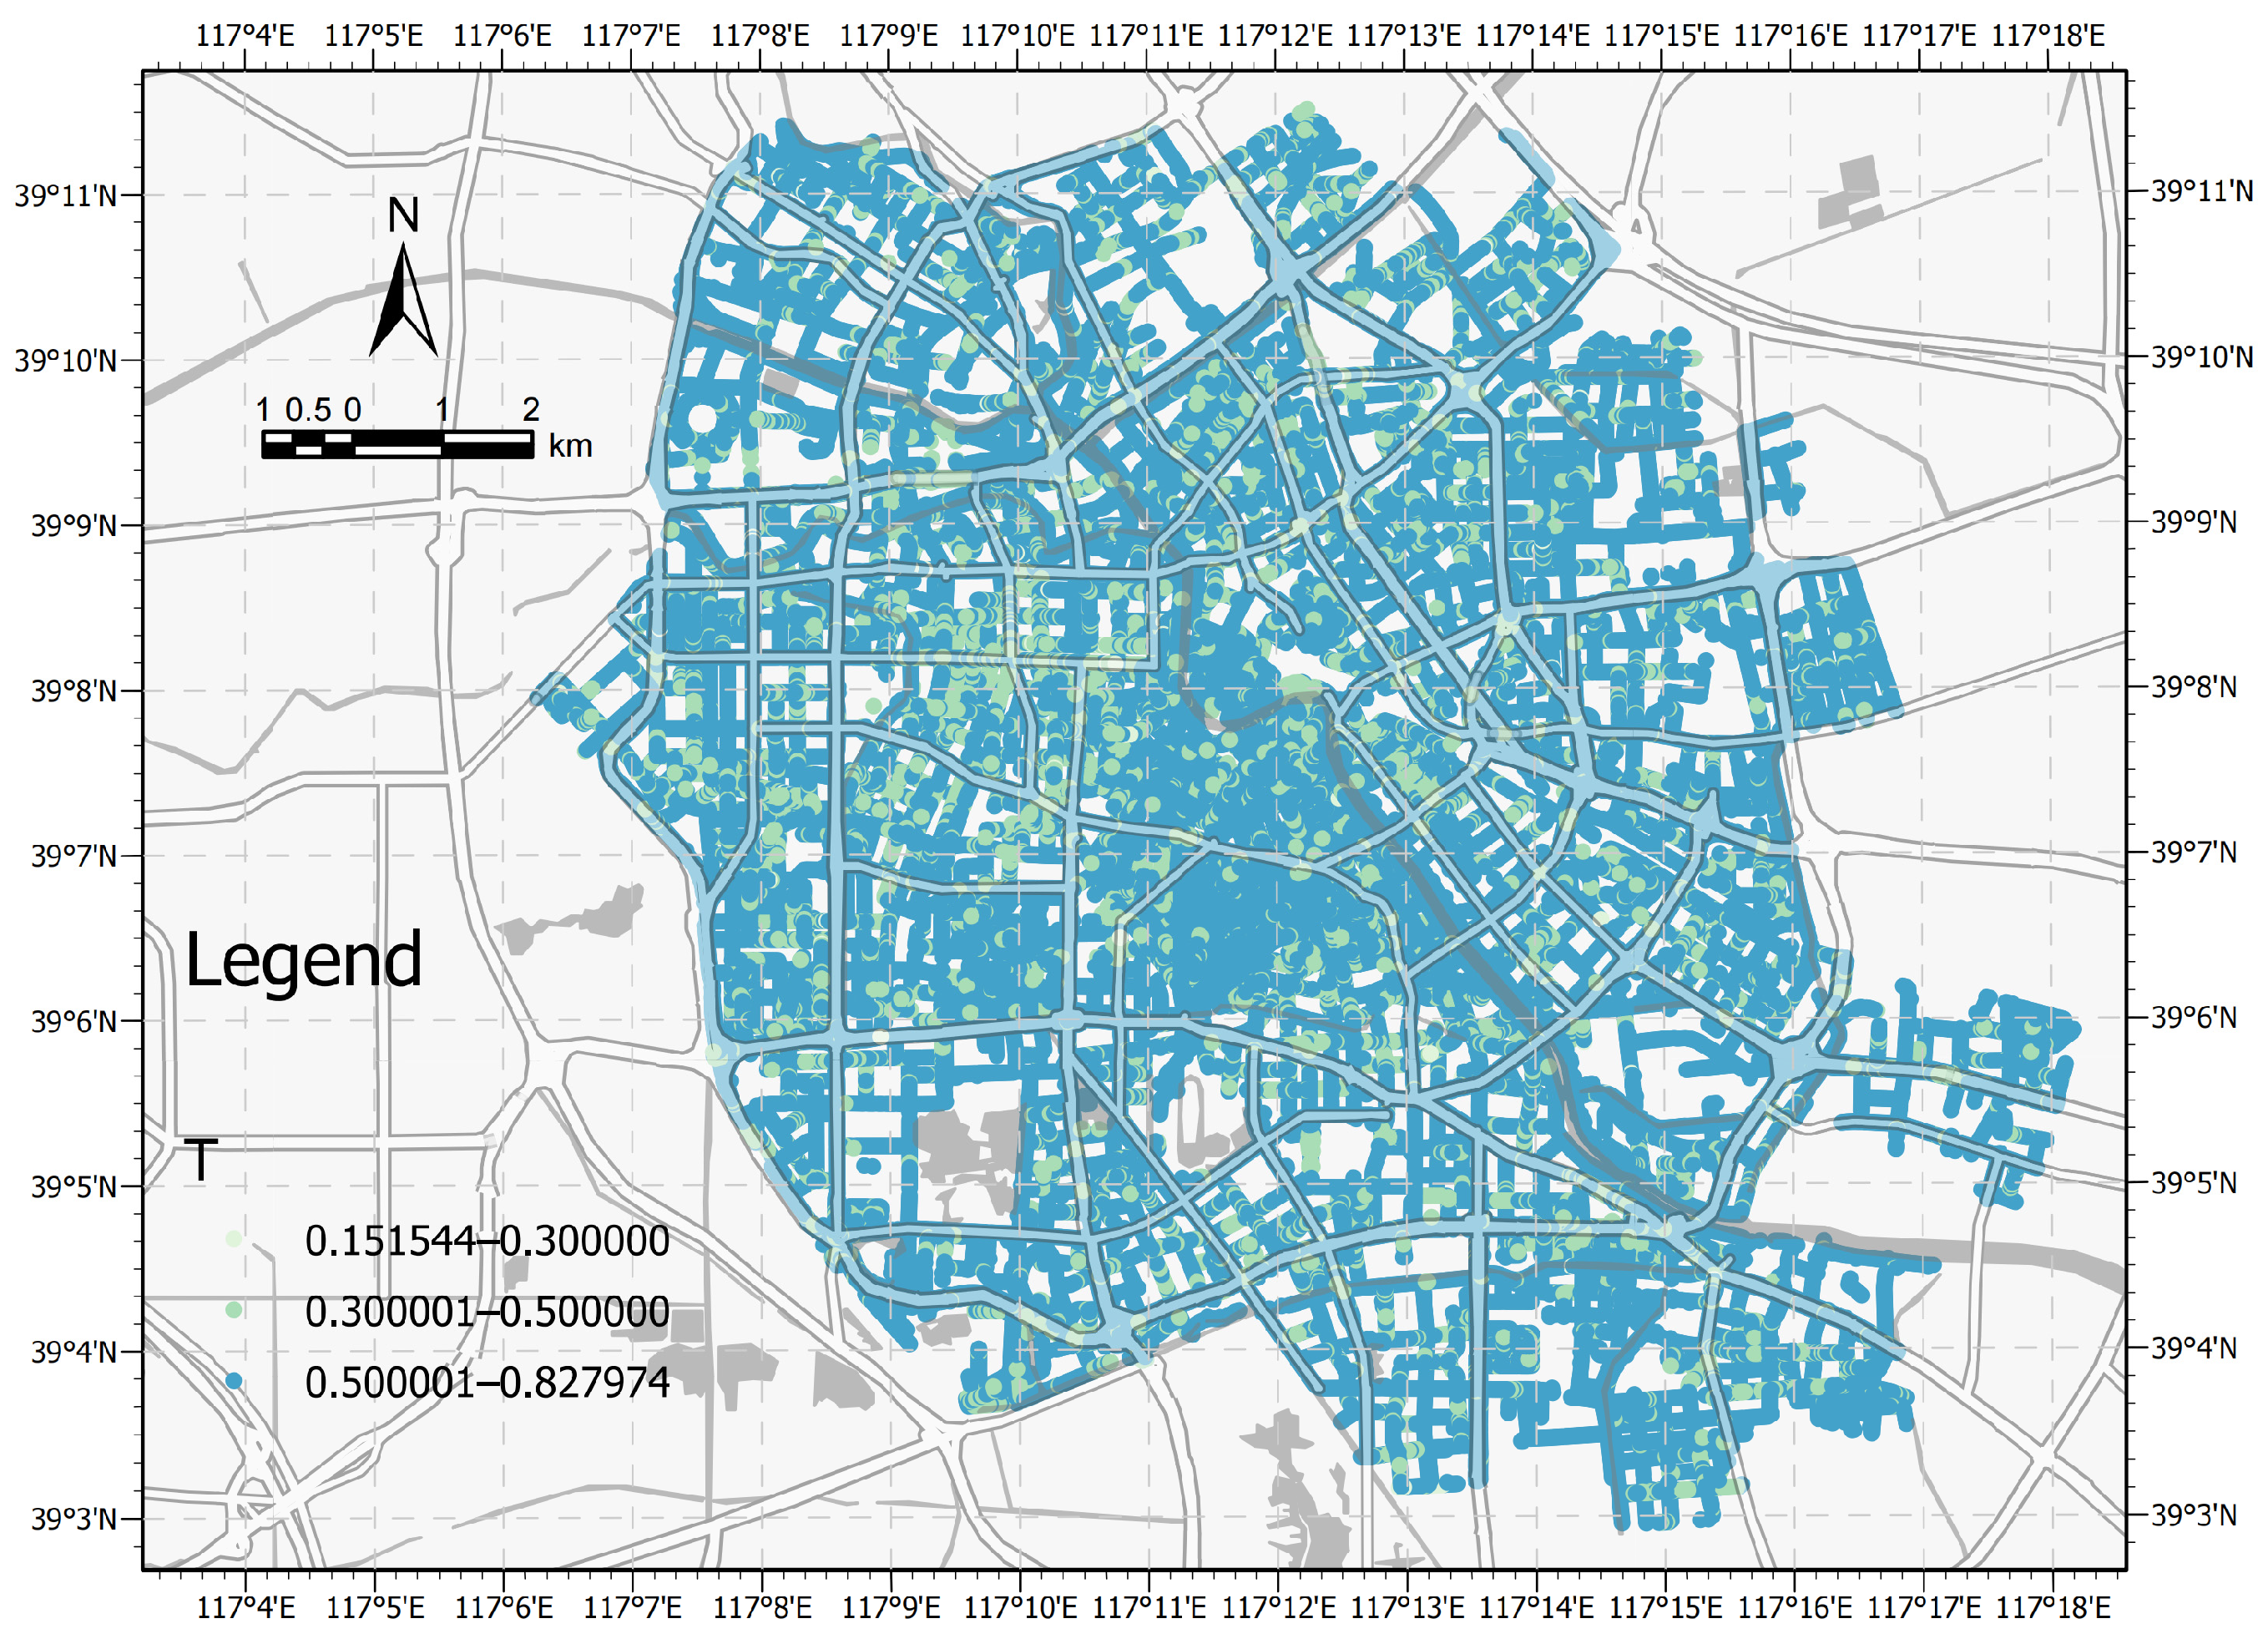
Figure 9 illustrates the spatial distribution of the coupling degree (C) between visual sensitivity and ecological sensitivity in the central urban area of Tianjin, reflecting the interaction strength between the two at the street scale. A higher coupling degree indicates stronger covariation and greater synergy between the visual and ecological systems. The figure also presents the coordination index (T), which represents a comprehensive evaluation index derived from the weighted average of visual sensitivity and ecological sensitivity, used to assess the overall development foundation of street spaces.
Figure 10 illustrates the spatial distribution pattern of the coupling coordination degree (D) between ecological sensitivity and visual sensitivity across 56,210 street-level points in the central urban area of Tianjin. Among these points, 40,944 (72.82%) have D values greater than 0.5, indicating a high level of consistency between the two dimensions in most areas. These “highly coupled regions” are primarily concentrated in the city’s core zones, including waterfront green corridors, major road axes, cultural tourism nodes, and streets with high green-view rates, such as the Haihe River corridor, the Wudadao area, and the surroundings of Gulou. In contrast, only 129 points (D < 0.3) exhibit poor coupling coordination, scattered in enclosed nodes along the urban periphery and major traffic arteries, with a very limited spatial extent. Overall, the ecological and perceptual systems in Tianjin’s central districts demonstrate a highly coupled and coordinated spatial pattern.
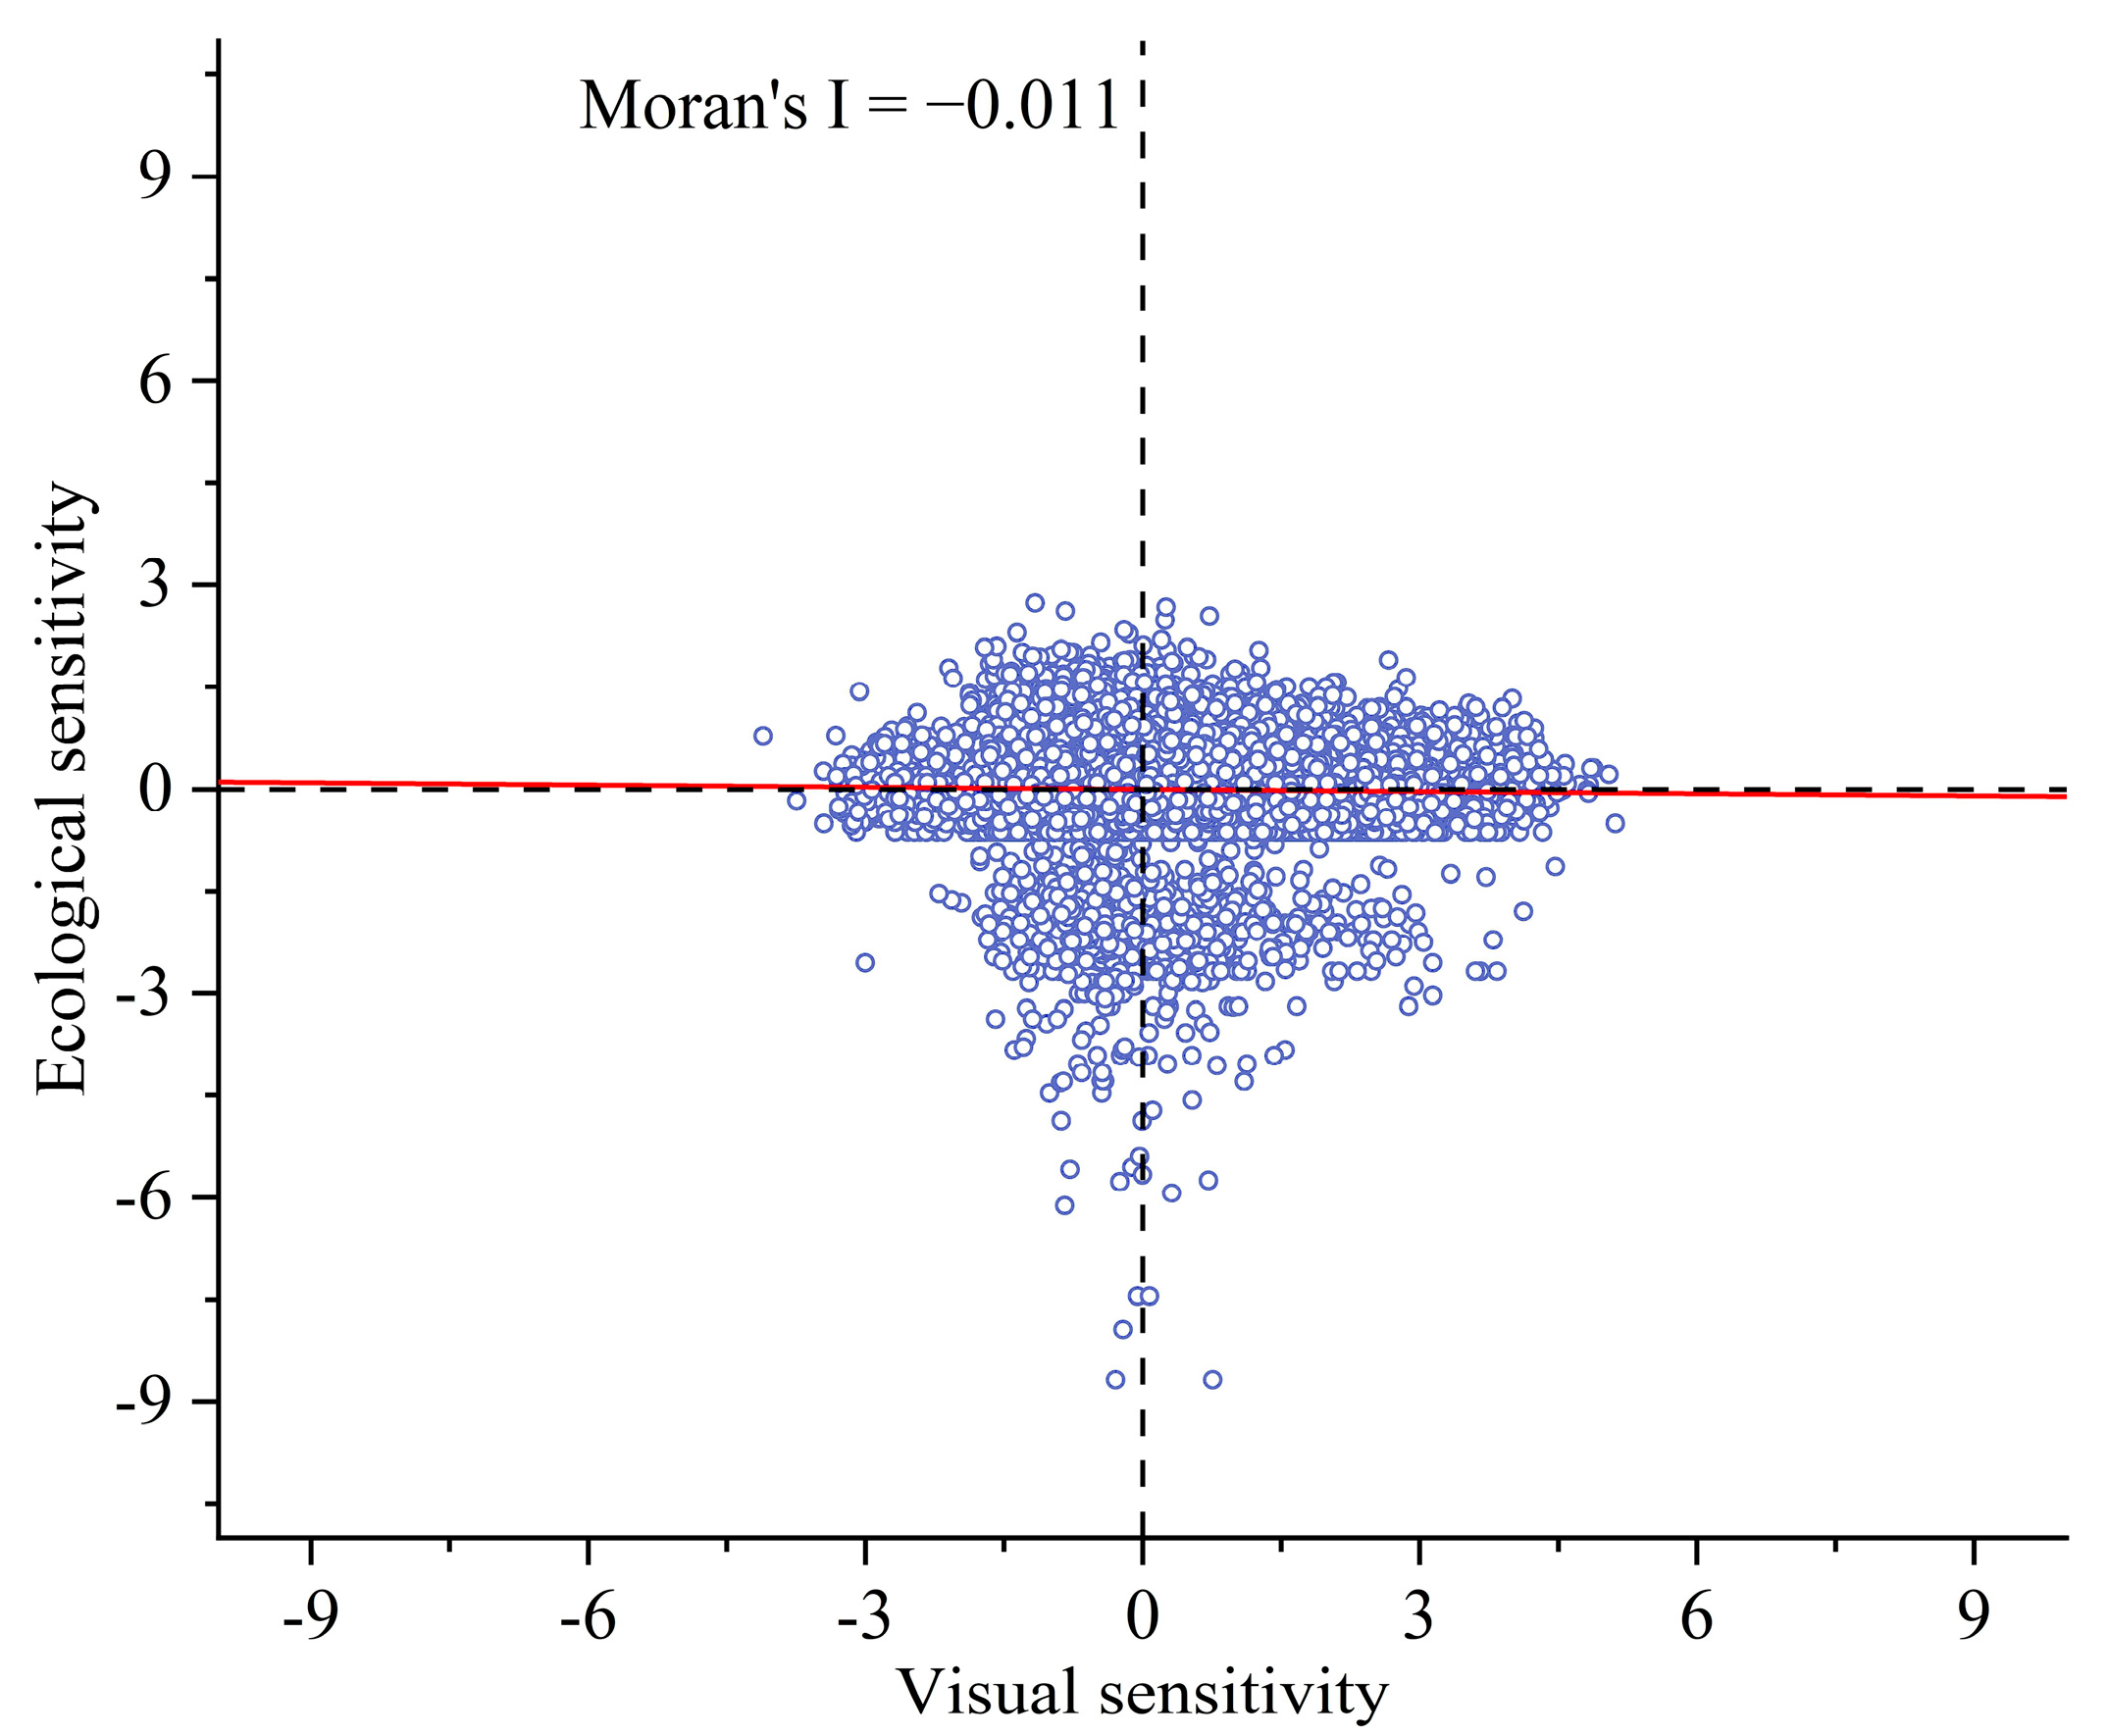
This study employed a bivariate Moran’s I analysis to examine the spatial autocorrelation between visual sensitivity and ecological sensitivity in the central urban area of Tianjin. By constructing a spatial analysis model with visual sensitivity as the independent variable and ecological sensitivity as the dependent variable, a global Moran’s I scatter plot was generated (Figure 11).
In this plot, the x-axis represents the visual sensitivity of street-level points, while the y-axis indicates the corresponding ecological sensitivity. The scatter plot is used to reveal the spatial coordination or mismatch patterns between the two variables. The results show that a substantial number of points are concentrated in the second quadrant (upper right) and the fourth quadrant (lower left), corresponding to areas characterized by high visual sensitivity–low ecological sensitivity (second quadrant) and low visual sensitivity–high ecological sensitivity (fourth quadrant). Moreover, the overall distribution of scatter points does not exhibit a clear linear trend, indicating a widespread spatial mismatch between the two dimensions.

3.4. Spatial Clustering Patterns of Visual–Ecological Sensitivity

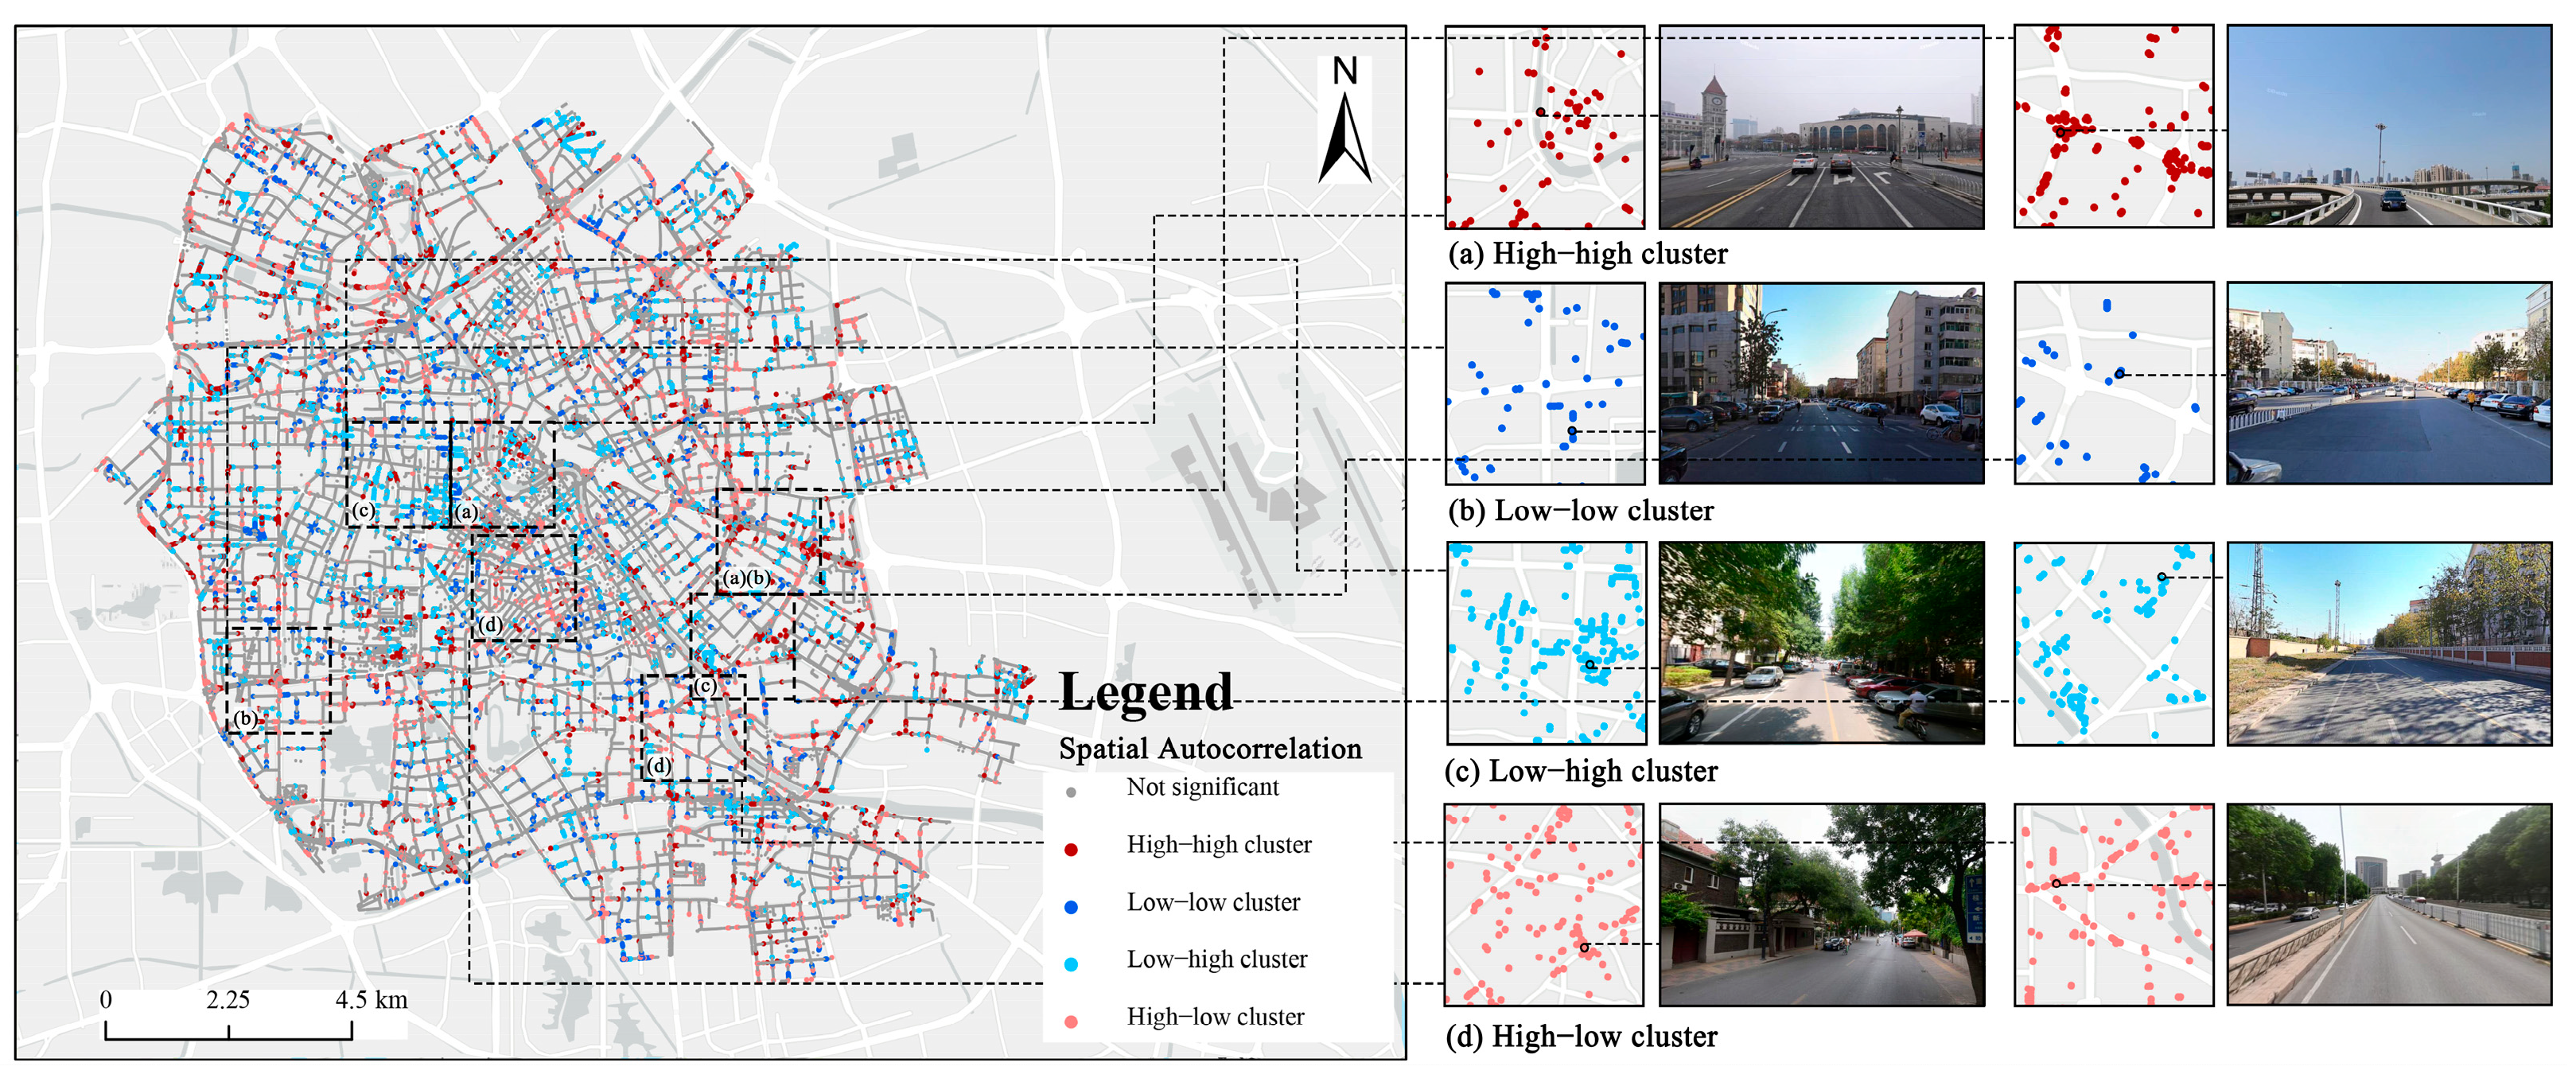
Through the Local Moran’s I analysis, as shown in Figure 12, the relationship between visual sensitivity and ecological sensitivity in the central urban area of Tianjin exhibits typical spatial clustering characteristics, which can be categorized into four types: High–High (high visual–high ecological, HH), Low–Low (low visual–low ecological, LL), Low–High (low visual–high ecological, LH), and High–Low (high visual–low ecological, HL).
HL clusters are primarily located in urban cores, such as elevated roadways and dense transportation hubs (Figure 12a). For example, along the Haihe River between the Ancient Culture Street and Italian Style Street, intersections exhibit strong visual appeal but suffer from poor ecological conditions. Similarly, the intersection of two overpasses near the Hedong District Government and Jinbin Avenue shows ecological vulnerability but remains visually prominent due to open sightlines and the visual emphasis created by road curvature.
Low-Low clusters are mainly found in peripheral urban areas or repetitive road segments (Figure 12b). For example, the Xingyuan Road corridor, surrounded by office buildings, has moderate vegetation coverage, but due to usage as parking or entrance areas, some parts exhibit poor ecological conditions and induce visual fatigue. In the same Hedong District overpass intersections, points in the mid-sections of the roads are rarely perceived, indicating that central road segments are less visually engaging and ecologically moderate.
Low-High clusters are commonly distributed in areas with good ecological quality but low spatial openness, such as vegetated streets in older residential neighborhoods or city edges (Figure 12c). For instance, streets in Huaiyuanli and Changshou residential areas, characterized by narrow 3 m-wide access roads with lush vegetation, perform well ecologically but lack visual appeal due to the aged built environment. Another example is the intersection of Yingdong Hot Spring Garden North Gate and Guangrui West Road, where greenery is abundant but fenced surroundings limit visual experience.
High-Low clusters are often located at street nodes such as T-intersections and cross-intersections (Figure 12d). Points clustered near the former residence of Xu Shichang in the Wudadao cultural tourism area display distinct architectural characteristics and lush roadside greenery. Similarly, on the approach to the elevated road at Xinhaidi Road in front of the Hexi Cultural Center, upward views and rich greenery on both sides contribute to high visual appeal despite limited ecological resilience.

4. Discussion

4.1. Drivers of Landscape–Visual Sensitivity Correlation

The correlation analysis highlights the differentiated impacts of various environmental elements on visual sensitivity. The strong positive association with People suggests that human presence and crowd activities significantly enhance visual attention, as dynamic elements in street scenes often stimulate emotional engagement and spatial recognition. Similarly, the positive relationship with Sky reflects the role of openness and visual permeability in improving visual experience, while the influence of advertising boards (AB) indicates that commercial visual stimuli can serve as perceptual attractors in dense urban environments.
Conversely, the strong negative correlations with Buildings and Vehicles imply that excessive enclosure from building façades or visual clutter caused by heavy traffic flows can suppress the perception of spatial quality, thereby reducing visual sensitivity. The unexpected negative relationships with Plants and Water may reflect contextual characteristics of the study area: vegetation and water bodies in many street-view samples appear as monotonous or obstructive elements, failing to enhance visual perception due to limited accessibility or poor design integration. Traffic signs (TS) and Mountains also show negative correlations, possibly because they function more as background elements rather than active visual stimuli within the street-level perspective.

4.2. Interactions Between Ecological and Visual Sensitivity

High ecological sensitivity areas are often closely associated with zones of functional complexity, such as commercial or historical-cultural districts, and areas with high traffic density. In contrast, low ecological sensitivity areas are typically related to urban green spaces, water systems, or low-intensity development zones. Areas with high ecological sensitivity are mostly concentrated in commercial cores or historical building clusters, where extensive hard paving, scarce green spaces, and heavy traffic result in weaker ecological carrying capacity. Medium sensitivity areas are generally located in mixed-use zones or older residential neighborhoods—for example, residential areas in Nankai and Hongqiao Districts—where green coverage is relatively low but not entirely impervious, placing their ecological sensitivity at a moderate level. Low ecological sensitivity areas are mainly found in newly developed zones or regions with abundant greenery, such as the vicinity of Shuixi Park, characterized by a strong ecological foundation and minimal environmental disturbance.
Areas with high visual sensitivity are significantly associated with urban core commercial and cultural districts as well as nodal road structures. Medium-value areas reflect characteristics of transitional functional zones and secondary road networks, while low-value areas are primarily concentrated in peripheral fast transit corridors or zones with weaker urban functions. High visual sensitivity areas are typically marked by rich building façades, strong historical and cultural ambiance, complex spatial forms, and high pedestrian density—factors that readily capture public visual attention and evoke emotional responses. In addition, intersections of major roads, crossroad junctions, and elevated road curves also exhibit high visual sensitivity, indicating that such street nodes generate strong visual stimulation due to dramatic shifts in sightlines. Low visual sensitivity areas are mainly distributed along the urban periphery, particularly in newly developed zones and linear fast road corridors in the southern and southeastern parts of the city. These areas are generally open in spatial form but lack visual focal points, with monotonous green space distribution and overall weak visual stimulation, resulting in perceived “cold zones” in the urban landscape.

4.3. Correlation Coordination Patterns and Spatial Correlation Mechanisms

In the central urban area of Tianjin, ecological sensitivity and visual sensitivity generally exhibit a high level of spatial coupling coordination. This result indicates that public visual perception responds strongly to ecologically favorable street spaces, suggesting that ecology and visual perception are not isolated at the street scale but instead have the potential for mutual reinforcement. Such a high degree of coupling provides a solid foundation for advancing ecology-oriented strategies guided by public participation and perception-driven spatial interventions.
This study employs bivariate Moran’s I analysis to explore the spatial autocorrelation between visual sensitivity and ecological sensitivity in the central urban area of Tianjin. By constructing a spatial analysis model with visual sensitivity as the independent variable and ecological sensitivity as the dependent variable, a global Moran’s I scatter plot was generated (Figure 9). The plot reveals a significant concentration of data points in the second quadrant (high visual sensitivity–low ecological sensitivity) and the fourth quadrant (low visual sensitivity–high ecological sensitivity), indicating a widespread spatial mismatch between the two indicators across most areas.
In the bivariate Moran’s I scatter plot, the second quadrant represents areas within the city that, despite exhibiting relatively low ecological vulnerability and strong environmental carrying capacity, attract significant public attention due to factors such as functional complexity, high traffic density, and prominent spatial forms. In contrast, the fourth quadrant encompasses areas with high ecological sensitivity that have not garnered widespread public attention, potentially due to issues such as enclosed spatial configurations, poor accessibility, or concealed green spaces. This discrepancy reveals a perceptual gap between ecological realities and public awareness, underscoring the need to incorporate public perspectives into urban planning to bridge the cognitive divide between subjective perception and objective conditions. Moreover, the overall distribution of scatter points does not exhibit a clear linear trend, indicating a widespread spatial mismatch between the two dimensions.
Compared with previous ecological sensitivity studies that primarily emphasize objective environmental indicators and expert-driven evaluations, this study shifts the analytical perspective toward a relational understanding of ecological and visual dimensions. Rather than embedding perception into ecological assessment, the study focuses on revealing how ecological quality and public visual attention interact and diverge within the same urban context. By bridging physical environmental data with social–perceptual information through a cross-modal analytical framework, this approach provides new empirical evidence for interpreting the coexistence, mismatch, and complementarity between human perception and ecological resilience. Such a perspective expands the scope of ecological sensitivity research from static environmental evaluation to a more dynamic exploration of human–environment coupling mechanisms, offering a pathway for more inclusive and perception-aware ecological planning.
From a methodological standpoint, the proposed framework demonstrates strong adaptability and interpretability across multiple data modalities. By combining deep learning–based visual feature extraction, sentiment analysis, and spatial statistical modeling, it provides a replicable workflow for integrating perceptual and ecological dimensions at fine spatial scales. The use of the coupling coordination degree model and bivariate Moran’s I further validates the robustness of the analytical process, as both models effectively capture non-linear relationships and localized interaction patterns. This multi-method integration enhances the reliability of the results, confirming that cross-modal data fusion can serve as a feasible and scalable approach for urban perception and ecological research.

4.4. Perceptual–Ecological Mismatch and Planning Implications

The typical spatial clustering results reveal the diverse combinations of ecological sensitivity and visual sensitivity within urban spaces. HH type areas are commonly found in transportation hubs, central business districts, and cultural tourism streets. These areas are characterized by both ecological vulnerability and high public attention, exhibiting the dual feature of “high perception–high risk,” and thus should be prioritized for urban ecological governance and public guidance. In contrast, LL type areas are mostly located in urban peripheries or along functionally repetitive road segments. Lacking perceptual highlights and ecological support, these areas represent “perceptual cold zones” in the city but hold potential for transformation into supplementary landscape–ecological nodes.
LH areas possess favorable ecological conditions but lack public attention due to spatial enclosure, weak accessibility, or deteriorated interfaces. Typical examples include old alleyways or streets surrounded by hedges. Such areas should enhance openness, visibility, and accessibility to better realize their ecological value. In contrast, HL areas, although characterized by weak ecological capacity, attract significant public attention through their prominent spatial forms and visual focal functions—such as intersections, historic façades, or elevated road crossings. These areas have become visual hotspots of urban public activity and thus require urgent ecological micro-renewal or green interventions.
Furthermore, through bivariate Moran’s I spatial coupling analysis, this study reveals the coexistence of ecological “blind spots” and perceptual “hotspots”, highlighting a certain degree of complementarity between ecological sensitivity and visual sensitivity at the urban scale. Ecological sensitivity emphasizes the evaluation of objective natural conditions, whereas visual sensitivity focuses more on the public’s subjective perceptions and emotional responses. The joint analysis of the two dimensions not only helps to bridge the gap between the “ecological reality” and the “perceptual map” of cities but also provides a more human-centered pathway to support urban renewal, green infrastructure planning, and street-space reconfiguration.
In particular, under the context of the “dual-carbon” goals, incorporating public perception into ecological risk governance can contribute to the establishment of a more inclusive, efficient, and sustainable urban ecological security framework, thereby fostering a collaborative planning model that integrates “ecological priority” with “perception empowerment”.
The coupling and spatial correlation patterns observed in Tianjin can thus be interpreted not only as local phenomena but also as representative of wider urban dynamics, underscoring the methodological value of the coupling coordination and Moran’s I approach.

4.5. Limitations

This study has several limitations. First, the street-view and social media data used may contain spatial and temporal inconsistencies, which could influence the accuracy of visual sensitivity modeling. Second, some ecological indicators, such as nighttime light intensity, were derived from datasets with relatively coarse spatial resolution, potentially affecting the precision of ecological sensitivity assessments at the street level. Third, the study focused on Tianjin’s central urban districts, and the generalizability of the findings to other cities or rural areas remains to be tested. Additionally, the coupling coordination and spatial autocorrelation methods employed can reveal spatial relationships but are limited in explaining underlying causal mechanisms. Future research may explore longitudinal datasets and incorporate multi-source validation to address these challenges.

5. Conclusions

Based on 56,210 street-level points in the central urban area of Tianjin, this study constructs an evaluation framework that integrates multi-source data with cross-modal perception to systematically explore the spatial relationship between ecological sensitivity and visual sensitivity. Ecological sensitivity was calculated using a traditional AHP model that incorporates indicators such as elevation, slope, NDVI, land use, and nighttime light. Visual sensitivity was derived by combining semantic segmentation of street-view images (ADE20K) and feature extraction through an MLP, together with sentiment analysis of social media comments using GPT-4o. By applying the coupling coordination degree model and bivariate Moran’s I analysis, this study reveals both the spatial synergies and mismatches between the two dimensions.
The results show that 72.82% of the points exhibit good coupling between ecological and visual sensitivity, indicating a certain level of synergy between ecological attributes and visual perception at most street scales. However, spatial mismatches remain relatively widespread. The study further identifies four typical spatial types: (1) HL areas (e.g., Wudadao intersections)—characterized by high visual attention but low ecological resilience, accounting for the largest proportion; (2) LH areas (e.g., Huaiyuanli community)—with high ecological value but low public perception, also occupying a relatively large share; (3) HH areas (e.g., Ancient Culture Street)—where both ecological and visual sensitivity are high, requiring caution regarding overlapping risks; and (4) LL areas—weak in both ecological and visual dimensions, requiring spatial redesign and perceptual activation.
This study underscores the importance of incorporating public visual perception into ecological assessment frameworks. While ecological sensitivity primarily reflects environmental vulnerability and carrying capacity, visual sensitivity captures the emotional engagement of the public with urban spaces. Integrating the two not only facilitates the identification of ecological “blind spots” and perceptual “hotspots” but also provides a scientific basis for optimizing green infrastructure, guiding street-level ecological governance, and implementing perception-oriented spatial interventions.
Although this study is situated in Tianjin, the coexistence of perceptual “hotspots” and ecological “blind spots” is likely to occur in many high-density cities worldwide. Therefore, the methodological framework and the implications for planning extend beyond the case study, providing guidance for human-centered ecological interventions in diverse urban contexts.
Moreover, this study offers a replicable spatial analytical pathway for identifying and evaluating the coupling relationship between ecology and perception in high-density cities, and contributes theoretical and practical references for ecology-oriented urban planning that prioritizes public experience, thereby supporting governance goals of carbon neutrality, equity, and livability.

Author Contributions

Conceptualization, Z.K. and Y.H.; methodology, Z.K. and Y.H.; software, C.X.; validation, Z.K., Y.G., and L.W.; formal analysis, Z.K. and C.X.; investigation, L.W. and Y.G.; resources, Z.H. and X.H.; data curation, C.X. and L.W.; writing—original draft preparation, Z.K. and C.X.; writing—review and editing, Y.G. and Y.H.; visualization, Y.G.; supervision, Y.H.; project administration, X.H. and X.W.; funding acquisition, Z.H., X.H., and X.W. All authors have read and agreed to the published version of the manuscript.

Funding

This research was funded by the National Natural Science Foundation of China (NSFC), grant number 52038007: “Reconstruction of Contemporary Building Systems Based on the Integration Mechanism of ‘Architecture-Human-Environment’ in the Chinese Context”.

Data Availability Statement

The raw data supporting the conclusions of this article will be made available by the authors on request.

Conflicts of Interest

Author Zhiqiu He was employed by the company Tianjin Xinjian Construction Co., Ltd.; Author Xiaoxu Heng was employed by the company Tianjin Port Bonded Zone Urban Renewal Investment and Construction Group. The authors declare that they have no known competing financial interests or personal relationships that could have appeared to influence the work reported in this paper.

References

  1. Serra Bellini, L.; Spanò, A.; Cittadini Bellini, M.; Giulio Tonolo, F. A heterogenous-source geoinformation system to manage climate-induced modifications on the landscape for sustainable development. Discov. Sustain. 2024, 5, 297. [Google Scholar] [CrossRef]
  2. Peng, J.; Zhao, S.; Dong, J.; Liu, Y.; Meersmans, J.; Li, H.; Wu, J. Applying Ant Colony Algorithm to Identify Ecological Security Patterns in Megacities. Environ. Model. Softw. 2019, 117, 214–222. [Google Scholar] [CrossRef]
  3. Makler-Pick, V.; Gal, G.; Gorfine, M.; Hipsey, M.R.; Carmel, Y. Sensitivity Analysis for Complex Ecological Models—A New Approach. Environ. Model. Softw. 2011, 26, 124–134. [Google Scholar] [CrossRef]
  4. Bayraktarov, E.; Low-Choy, S.; Singh, A.R.; Beaumont, L.J.; Williams, K.J.; Baumgartner, J.B.; Laffan, S.W.; Vasco, D.; Cosgrove, R.; Wraith, J.; et al. EcoCommons Australia Virtual Laboratories with Cloud Computing: Meeting Diverse User Needs for Ecological Modeling and Decision-Making. Environ. Model. Softw. 2025, 183, 106255. [Google Scholar] [CrossRef]
  5. Cai, B.; Shao, Z.; Fang, S.; Huang, X.; Huq, M.E.; Tang, Y.; Li, Y.; Zhuang, Q. Finer-Scale Spatiotemporal Coupling Coordination Model between Socioeconomic Activity and Eco-Environment: A Case Study of Beijing, China. Ecol. Indic. 2021, 131, 108165. [Google Scholar] [CrossRef]
  6. Mingwu, Z.; Haijiang, J.; Desuo, C.; Chunbo, J. The Comparative Study on the Ecological Sensitivity Analysis in Huixian Karst Wetland, China. Procedia Environ. Sci. 2010, 2, 386–398. [Google Scholar] [CrossRef]
  7. Kang, J.; Dong, W.; Liu, T.; Fang, L. Exploring Ecosystem Sensitivity Patterns in China: A Quantitative Analysis Using the Importance-Vulnerability-Sensitivity Framework and Neighborhood Effects Method. Ecol. Indic. 2024, 167, 112623. [Google Scholar] [CrossRef]
  8. Xu, Y.; Liu, R.; Xue, C.; Xia, Z. Ecological Sensitivity Evaluation and Explanatory Power Analysis of the Giant Panda National Park in China. Ecol. Indic. 2023, 146, 109792. [Google Scholar] [CrossRef]
  9. Bai, Y.; Guo, R. The Construction of Green Infrastructure Network in the Perspectives of Ecosystem Services and Ecological Sensitivity: The Case of Harbin, China. Glob. Ecol. Conserv. 2021, 27, e01534. [Google Scholar] [CrossRef]
  10. Sahraoui, Y.; Clauzel, C.; Foltête, J.-C. A Metrics-Based Approach for Modeling Covariation of Visual and Ecological Landscape Qualities. Ecol. Indic. 2021, 123, 107331. [Google Scholar] [CrossRef]
  11. Zheng, Y.; Lan, S.; Chen, W.Y.; Chen, X.; Xu, X.; Chen, Y.; Dong, J. Visual Sensitivity versus Ecological Sensitivity: An Application of GIS in Urban Forest Park Planning. Urban For. Urban Green. 2019, 41, 139–149. [Google Scholar] [CrossRef]
  12. Qi, T.; Zhang, G.; Wang, Y.; Liu, C.; Li, X. Research on Landscape Quality of Country Parks in Beijing as Based on Visual and Audible Senses. Urban For. Urban Green. 2017, 26, 124–138. [Google Scholar] [CrossRef]
  13. Gobster, P.H.; Ribe, R.G.; Palmer, J.F. Themes and Trends in Visual Assessment Research: Introduction to the Landscape and Urban Planning Special Collection on the Visual Assessment of Landscapes. Landsc. Urban Plan. 2019, 191, 103635. [Google Scholar] [CrossRef]
  14. Bubalo, M.; van Zanten, B.T.; Verburg, P.H. Crowdsourcing Geo-Information on Landscape Perceptions and Preferences: A Review. Landsc. Urban Plan. 2019, 184, 101–111. [Google Scholar] [CrossRef]
  15. Huang, W.; Zhao, X.; Lin, G.; Wang, Z.; Chen, M. How to Quantify Multidimensional Perception of Urban Parks? Integrating Deep Learning-Based Social Media Data Analysis with Questionnaire Survey Methods. Urban For. Urban Green. 2025, 107, 128754. [Google Scholar] [CrossRef]
  16. Guo, C.; Yang, Y. A Multi-Modal Social Media Data Analysis Framework: Exploring the Complex Relationships among Urban Environment, Public Activity, and Public Perception—A Case Study of Xi’an, China. Ecol. Indic. 2025, 171, 113118. [Google Scholar] [CrossRef]
  17. Dunkel, A. Visualizing the Perceived Environment Using Crowdsourced Photo Geodata. Landsc. Urban Plan. 2015, 142, 173–186. [Google Scholar] [CrossRef]
  18. Zhang, S.; Zhou, W. Recreational Visits to Urban Parks and Factors Affecting Park Visits: Evidence from Geotagged Social Media Data. Landsc. Urban Plan. 2018, 180, 27–35. [Google Scholar] [CrossRef]
  19. Song, X.P.; Richards, D.R.; He, P.; Tan, P.Y. Does Geo-Located Social Media Reflect the Visit Frequency of Urban Parks? A City-Wide Analysis Using the Count and Content of Photographs. Landsc. Urban Plan. 2020, 203, 103908. [Google Scholar] [CrossRef]
  20. Donahue, M.L.; Keeler, B.L.; Wood, S.A.; Fisher, D.M.; Hamstead, Z.A.; McPhearson, T. Using Social Media to Understand Drivers of Urban Park Visitation in the Twin Cities, MN. Landsc. Urban Plan. 2018, 175, 1–10. [Google Scholar] [CrossRef]
  21. Sessions, C.; Wood, S.A.; Rabotyagov, S.; Fisher, D.M. Measuring Recreational Visitation at U.S. National Parks with Crowd-Sourced Photographs. J. Environ. Manag. 2016, 183, 703–711. [Google Scholar] [CrossRef] [PubMed]
  22. Gifford, R.; Ng, C.F. The relative contribution of visual and auditory cues to environmental perception. J. Environ. Psychol. 1982, 2, 275–284. [Google Scholar] [CrossRef]
  23. Han, T.; Tang, L.; Liu, J.; Jiang, S.; Yan, J. The Influence of Multi-Sensory Perception on Public Activity in Urban Street Spaces: An Empirical Study Grounded in Landsenses Ecology. Land 2025, 14, 50. [Google Scholar] [CrossRef]
  24. Peng, Y.; Li, Z.; Shah, A.M.; Lv, B.; Liu, S.; Liu, Y.; Li, X.; Song, H.; Chen, Q. Decoding the Role of Urban Green Space Morphology in Shaping Visual Perception: A Park-Based Study. Land 2025, 14, 495. [Google Scholar] [CrossRef]
  25. Ito, K.; Kang, Y.; Zhang, Y.; Zhang, F.; Biljecki, F. Understanding urban perception with visual data: A systematic review. Cities 2024, 152, 105169. [Google Scholar] [CrossRef]
  26. Tang, F.; Zeng, P.; Wang, L.; Zhang, L.; Xu, W. Urban Perception Evaluation and Street Refinement Governance Supported by Street View Visual Elements Analysis. Remote Sens. 2024, 16, 3661. [Google Scholar] [CrossRef]
  27. Li, Z.; Hu, L.; Lin, A.; Chen, J.; Xu, Y. The greener, the richer, the happier?—Spatial distribution and coupling analysis of urban green space and residents’ emotion based on social media data. Ecol. Indic. 2025, 177, 113754. [Google Scholar] [CrossRef]
  28. Guo, Y.; Su, J.G.; Dong, Y.; Wolch, J. Application of land use regression techniques for urban greening: An analysis of Tianjin, China. Urban For. Urban Green. 2019, 38, 11–21. [Google Scholar] [CrossRef]
  29. Wu, Y.; Shi, K.; Chen, Z.; Liu, S.; Chang, Z. Developing improved time-series DMSP-OLS-like data (1992–2019) in China by integrating DMSP-OLS and SNPP-VIIRS. IEEE Trans. Geosci. Remote Sens. 2021, 60, 1–14. [Google Scholar] [CrossRef]
  30. Li, Z.; Liu, J.; Ma, R.; Xie, W.; Zhao, X.; Wang, Z.; Zhang, B.; Yin, L. Construction of Ecological Security Pattern Based on Ecosystem Services, Sensitivity, Connectivity, and Resistance—A Case Study in the Huang-Huai-Hai Plain. Land 2024, 13, 2243. [Google Scholar] [CrossRef]
  31. Zhang, Y.; Wang, M.; Yang, X.; Zhang, R. Urban Commercial Space Vitality Evaluation Method Based on Social Media Data: The Case of Shanghai. Land 2025, 14, 697. [Google Scholar] [CrossRef]
  32. Huang, J.; Obracht-Prondzynska, H.; Kamrowska-Zaluska, D.; Sun, Y.; Li, L. The Image of the City on Social Media: A Comparative Study Using “Big Data” and “Small Data” Methods in the Tri-City Region in Poland. Landsc. Urban Plan. 2021, 206, 103977. [Google Scholar] [CrossRef]
  33. Chaudhuri, A. Visual and Text Sentiment Analysis Through Hierarchical Deep Learning Networks; Springer: New York, NY, USA, 2019. [Google Scholar]
  34. Cvetojevic, S.; Juhász, L.; Hochmair, H.H. Positional Accuracy of Twitter and Instagram Images in Urban Environments. GIScience 2016, 1, 191–203. [Google Scholar] [CrossRef]
  35. Hartman, R.; Simova, T. How changing API terms changed Instagram’s domain? A bibliometric analysis. In Proceedings of the 2021 7th International Conference on Computer Technology Applications, Vienna, Austria, 13–15 July 2021; pp. 73–79. [Google Scholar]
  36. Chen, Y.; Zhang, Q.; Deng, Z.; Fan, X.; Xu, Z.; Kang, X.; Pan, K.; Guo, Z. Research on Green View Index of Urban Roads Based on Street View Image Recognition: A Case Study of Changsha Downtown Areas. Sustainability 2022, 14, 16063. [Google Scholar] [CrossRef]
  37. Zhao, P.; Zhang, L.; Xu, M. Assessing Urban Environmental Sensitivity Using Multi-Dimensional Data: A Case Study of Beijing. Environ. Sci. Technol. 2017, 51, 4641–4649. [Google Scholar] [CrossRef]
  38. Li, Y.; Zhang, X. A Framework for Integrating Big Data in Urban Environmental Assessments: The Role of Social Media. Environ. Impact Assess. Rev. 2021, 81, 106388. [Google Scholar] [CrossRef]
  39. Miao, P.; Li, C.; Xia, B.; Zhao, X.; Wu, Y.; Zhang, C.; Wu, J.; Cheng, F.; Pu, J.; Huang, P.; et al. Incorporating Ecosystem Service Trade-Offs and Synergies with Ecological Sensitivity to Delineate Ecological Functional Zones: A Case Study in the Sichuan-Yunnan Ecological Buffer Area, China. Land 2024, 13, 1503. [Google Scholar] [CrossRef]
  40. Huang, Q.; Li, T. Street View Image Classification for Urban Ecological Evaluation Based on Deep Learning Techniques. Remote Sens. Environ. 2019, 234, 111417. [Google Scholar] [CrossRef]
  41. Luo, Q.; Bao, Y.; Wang, Z.; Chen, X.; Wei, W.; Fang, Z. Vulnerability Assessment of Urban Remnant Mountain Ecosystems Based on Ecological Sensitivity and Ecosystem Services. Ecol. Indic. 2023, 151, 110314. [Google Scholar] [CrossRef]
  42. Chen, Z.; Wang, H.; Liu, S. Ecological Sensitivity Evaluation and Spatial Differentiation in Urban Areas Based on Multi-Source Data. Ecol. Indic. 2020, 98, 444–455. [Google Scholar] [CrossRef]
  43. Hu, C.; Zhao, J.; Zhang, L. A Novel Multi-Criteria Decision-Making Model for Ecological Sensitivity Assessment in Urban Regions. Environ. Model. Softw. 2018, 101, 40–49. [Google Scholar] [CrossRef]
  44. Feng, H.; Zhang, X.; Nan, Y.; Zhang, D.; Sun, Y. Ecological sensitivity assessment and spatial pattern analysis of land resources in Tumen River Basin, China. Appl. Sci. 2023, 13, 4197. [Google Scholar] [CrossRef]
  45. Wu, D.; Wu, H.; Zhao, X.; Zhou, T.; Tang, B.; Zhao, W.; Jia, K. Evaluation of Spatiotemporal Variations of Global Fractional Vegetation Cover Based on GIMMS NDVI Data from 1982 to 2011. Remote Sens. 2014, 6, 4217–4239. [Google Scholar] [CrossRef]
  46. Arellano, B.; Roca, J. Identifying urban sprawl by night lights: A pending issue. Proc. SPIE 2020, 11535, 115350H. [Google Scholar] [CrossRef]
  47. Wang, X.; Zhu, T.; Jiang, C. Landscape ecological risk based on optimal scale and its tradeoff/synergy with human activities: A case study of the Nanjing metropolitan area, China. Ecol. Indic. 2025, 170, 113040. [Google Scholar] [CrossRef]
  48. Guo, T.; Xu, Z.; Zhu, L.; Zhang, Y.; Zhao, X. Sub-District Level Spatiotemporal Changes of Carbon Storage and Driving Factor Analysis: A Case Study in Beijing. Land 2025, 14, 151. [Google Scholar] [CrossRef]
  49. Zheng, Y.; Zhou, Q.; He, Y.; Wang, C.; Wang, X.; Wang, H. An Optimized Approach for Extracting Urban Land Based on Log-Transformed DMSP-OLS Nighttime Light, NDVI, and NDWI. Remote Sens. 2021, 13, 766. [Google Scholar] [CrossRef]
  50. Zheng, Y.; Tang, L.; Wang, H. An improved approach for monitoring urban built-up areas by combining NPP-VIIRS nighttime light, NDVI, NDWI, and NDBI. J. Clean. Prod. 2021, 328, 129488. [Google Scholar] [CrossRef]
  51. Martinez-Sanchez, L.; Hufkens, K.; Kearsley, E.; Naydenov, D.; Czúcz, B.; van de Velde, M. Semantic Segmentation Dataset of Land Use/Cover Area Frame Survey (LUCAS) Rural Landscape Street View Images. Data Brief. 2024, 54, 110394. [Google Scholar] [CrossRef]
  52. Inoue, T.; Manabe, R.; Murayama, A.; Koizumi, H. The effect of culture-specific differences in urban streetscapes on the inference accuracy of deep learning models. ISPRS Ann. Photogramm. Remote Sens. Spat. Inf. Sci. 2022, 10, 73–80. [Google Scholar] [CrossRef]
  53. Lee, D.H.; Park, H.Y.; Lee, J. A Review on Recent Deep Learning-Based Semantic Segmentation for Urban Greenness Measurement. Sensors 2024, 24, 2245. [Google Scholar] [CrossRef] [PubMed]
  54. Zhang, H.; Han, H.; Qiao, L.; Zhuang, J.; Ren, Z.; Su, Y.; Xia, Y. Emotional-Health-Oriented Urban Design: A Novel Collaborative Deep Learning Framework for Real-Time Landscape Assessment. Int. J. Environ. Res. Public Health 2022, 19, 13308. [Google Scholar] [CrossRef]
  55. Sun, H.; Xu, H.; He, H.; Wei, Q.; Yan, Y.; Chen, Z.; Li, X.; Zheng, J.; Li, T. A Spatial Analysis of Urban Streets under Deep Learning Based on Street View Imagery. Sustainability 2023, 15, 14798. [Google Scholar] [CrossRef]
  56. Arulananth, T.S.; Kuppusamy, P.G.; Kumar, R.; Saadat, M.A.; Mahalakshmi, M.; Vasanth, K.; Chinnasamy, P. Semantic Segmentation of Urban Environments: Leveraging U-Net Deep Learning Model for Cityscape Image Analysis. PLoS ONE 2024, 19, e0300767. [Google Scholar] [CrossRef]
  57. Zhang, H.; Liu, H.; Kim, C. Semantic and Instance Segmentation in Coastal Urban Spatial Perception. Sustainability 2024, 16, 833. [Google Scholar] [CrossRef]
  58. Hong, Q. Exploring the spatial attributes of streets in Lu Xun’s hometown of Shaoxing, China, through image semantic segmentation. J. Chin. Archit. Urban. 2024, 6, 1736. [Google Scholar] [CrossRef]
  59. Chen, Z.; Hao, Y. Research on Street View Information Extraction Method Based on Convolutional Neural Network. In Proceedings of the 2024 IEEE 6th International Conference on Power, Intelligent Computing and Systems (ICPICS), Shenyang, China, 26–28 July 2024; pp. 525–530. [Google Scholar]
  60. Suzuki, M.; Mori, J.; Maeda, T.N.; Ikeda, J. The Economic Value of Urban Landscapes in a Suburban City of Tokyo: A Semantic Segmentation Approach Using Google Street View Images. J. Asian Archit. Build. Eng. 2022, 22, 1110–1125. [Google Scholar] [CrossRef]
  61. Hua, C.; Lv, W. Optimizing Semantic Segmentation of Street Views with SP-UNet for Comprehensive Street Quality Evaluation. Sustainability 2025, 17, 1209. [Google Scholar] [CrossRef]
  62. Li, X.; Chen, Y.; Wang, J. Graph Neural Networks Optimized with Gazelle Optimization Algorithm for Urban Plantscape Design Based on Large-Scale Street View. J. Eng. Sci. 2024, 20, 3154. [Google Scholar] [CrossRef]
  63. Pan, S.; Li, J.; Jiang, J. A Street View Semantic Segmentation Algorithm Based on DeeplabV3+ Architecture. In Proceedings of the 3rd International Conference on Artificial Intelligence, Automation, and High-Performance Computing (AIAHPC 2023), Wuhan, China, 31 March–2 April 2023; Volume 12717. [Google Scholar] [CrossRef]
  64. Ma, X.; Ma, C.; Wu, C.; Xi, Y.; Yang, R.; Peng, N.; Zhang, C.; Ren, F. Measuring Human Perceptions of Streetscapes to Better Inform Urban Renewal. Cities 2021, 110, 103086. [Google Scholar] [CrossRef]
  65. Benesty, J.; Chen, J.; Huang, Y.; Cohen, I. Pearson correlation coefficient. In Noise Reduction in Speech Processing; Springer: Berlin/Heidelberg, Germany, 2009; pp. 1–4. [Google Scholar]
  66. Gong, Y.; Wang, X.; Zhang, Q.; Li, H. Correlation Analysis of Landscape Structure and Water Quality in Wetland Parks: A Case Study in Suzhou, China. Water 2021, 13, 2075. [Google Scholar] [CrossRef]
Figure 1. Map of the study area. (a) Global location; (b) Detailed boundary of Tianjin’s central urban area. (Source of figure: produced by the author).
Land 14 02104 g001
Figure 2. This figure presents the collected INS city-related street view data. (a) Images from 2817 INS posts related to urban street views, with each image named sequentially according to the order in which the posts were collected; (b) The corresponding 21,213 textual comments extracted from the same 2817 INS posts, containing metadata such as Post ID, Comment ID, Nickname, Comment Sequence Number, Comment Content, Number of Comments, etc. The comments are named sequentially following the order of the collected posts, with primary comments and secondary comments labeled progressively.
Land 14 02104 g002
Figure 3. Baidu Street View Map data: 56,210 street view sampling points within the six central districts of Tianjin in 2020. (Source of figure: produced by the author).
Land 14 02104 g003
Figure 4. Research Framework. (Source of figure: produced by the author).
Land 14 02104 g004
Figure 5. Ecological Sensitivity of the Central Urban Area of Tianjin. (a) Slope; (b) FVC; (c) Nighttime light; (d) DEM; (e) Land use; (f) Sensitivity; (Source of figure: produced by the author).
Land 14 02104 g005
Figure 6. Schematic diagram of the neural network model construction process. Red lines indicate positive connection weights, while blue lines indicate negative connection weights between neurons. (Source of figure: produced by the author).
Land 14 02104 g006
Figure 7. Street-Level Ecological Sensitivity. (Source of figure: produced by the author).
Land 14 02104 g007
Figure 8. Street-Level Visual Sensitivity. (Source of figure: produced by the author).
Land 14 02104 g008
Figure 9. Spatial distribution of the coupling degree (C) and coordination index (T) between visual sensitivity and ecological sensitivity (Source of figure: produced by the author).
Land 14 02104 g009aLand 14 02104 g009b
Figure 10. Spatial distribution of the coupling coordination degree (D) between visual sensitivity and ecological sensitivity. (Source of figure: produced by the author).
Land 14 02104 g010
Figure 11. Global Moran’s I Scatter Plot. The red line represents the fitted trend line of the scatter points, illustrating the general relationship between visual sensitivity and ecological sensitivity.(Source of figure: produced by the author).
Land 14 02104 g011
Figure 12. Local spatial clustering categories of visual–ecological sensitivity (High–High, Low–Low, Low–High, High–Low). (Source of figure: produced by the author).
Land 14 02104 g012
Table 1. Data sources for ecological sensitivity assessment.
DataYearSpatial ResolutionSources
Land use202230 mhttps://zenodo.org/ (accessed on 4 January 2025)
NDVI202230 mhttps://www.nesdc.org.cn/ (accessed on 4 January 2025)
Nighttime light2022500 mhttps://dataverse.harvard.edu/dataset.xhtml?persistentId=doi:10.7910/DVN/GIYGJU (accessed on 4 January 2025)
DEM200030 mhttps://www.earthdata.nasa.gov/ (accessed on 4 January 2025)
Table 2. Judgment Matrix A.
Ecological SensitivityElevationSlopeFVCLand Use TypesNighttime LightWi
Elevation132790.4408
Slope0.333310.25450.1597
FVC0.541350.2936
Land use types0.14290.250.3333120.0657
Nighttime light0.11110.20.20.510.0403
Source of table: produced by the author.
Table 3. Pearson Correlation—Triangular Format.
1234567891011
visual sensitivity (1)1
Road (2)0.2881
Building (3)−0.806 **−0.0531
People (4)0.949 **0.213−0.728 *1
Mountain (5)−0.793 **−0.0520.968 **−0.718 *1
Sky (6)0.718 *−0.003−0.973 **0.645 *−0.975 **1
Plant (7)−0.828 **−0.2070.906 **−0.719 *0.845 **−0.862 **1
TS (8)−0.860 **−0.2140.925 **−0.758 **0.869 **−0.877 **0.995 **1
Water (9)−0.875 **−0.3580.652 *−0.808 **0.654 *−0.623 *0.795 **0.803 **1
AB (10)0.730 *0.124−0.819 **0.579−0.765 **0.754 **−0.883 **−0.875 **−0.654 *1
Vehicle (11)−0.962 **−0.1990.904 **−0.915 **0.900 **−0.848 **0.867 **0.897 **0.796 **−0.787 **1
* p < 0.05, ** p < 0.01 Source of table: produced by the author.
Disclaimer/Publisher’s Note: The statements, opinions and data contained in all publications are solely those of the individual author(s) and contributor(s) and not of MDPI and/or the editor(s). MDPI and/or the editor(s) disclaim responsibility for any injury to people or property resulting from any ideas, methods, instructions or products referred to in the content.