Article

Impact of Urban Redevelopment on Low-Income Residential Segregation in South Korea’s Metropolitan Cities, 2011–2020

Department of Urban Planning and Engineering, Pusan National University, Busan 46241, Republic of Korea
*
Author to whom correspondence should be addressed.
Land 2025, 14(3), 442; https://doi.org/10.3390/land14030442
Submission received: 8 December 2024 / Revised: 13 February 2025 / Accepted: 18 February 2025 / Published: 20 February 2025
(This article belongs to the Special Issue Spatial Justice in Urban Planning (Second Edition))

Abstract

:
Residential segregation, which has been centered on race and ethnicity, has recently expanded to include income and social class as social inequality has increased. In particular, South Korea is one of the countries where social inequality is increasing as a result of economic growth. Existing studies have considered a relationship between redevelopment and residential segregation with respect to income, but there is a lack of factual evidence incorporating analysis in terms of spatial units. We analyzed patterns of low-income residential segregation (LiRS) in South Korea from the macro and micro perspectives to determine the net effect of redevelopment on this phenomenon. By classifying recipients of the National Basic Livelihood Security System (NBLSS) as low-income people, we measured LiRS using the dissimilarity index, the isolation index, the location quotient, and local Moran’s I (LISA) in seven metropolitan cities in South Korea between 2011 and 2020. We explored the net effect of redevelopment on LiRS using propensity score matching (PSM), and we estimated that redevelopment would reduce LiRS by 0.0289. The findings reveal that low-income residential segregation declined from 2011 to 2020. PSM analysis indicates that redevelopment mitigates LiRS. This study provides insights into the need to consult with those responsible for low-income housing policies to ensure the positive impact of redevelopment on LiRS.

1. Introduction

In most countries that have experienced an economic crisis, socioeconomic polarization intensifies as the economy is revitalized to overcome the crisis [1]. South Korea’s income distribution structure—which deteriorated sharply after the 1997 foreign exchange crisis—has become polarized, widening the gap between low- and high-income earners [2]. People generally feel more secure around people who are similar to them. Therefore, even if no direct factors are at play, individuals will spontaneously seek to form communities with like-minded people [3]. Likewise, a neighborhood is not a single entity, but is spatially dependent on its geographically close neighbors, meaning that neighboring areas influence each other towards having similar tendencies [4]. In this context, closing the gap between low-income and non-low-income neighborhoods seems difficult. However, we need to pay attention to low-income residential segregation (LiRS) and devise ways to address it, as several urban studies have shown that the clustering of low-income people in certain neighborhoods can lead to numerous socioeconomic pathologies [5,6,7,8,9].
The spatial distribution of poverty plays an important role in understanding place-based structural inequality, such as income and social class, and residential segregation [10]. Relationships at the micro level of poverty are important, as people interact with their neighbors and act as key factors influencing each other’s lives and futures [11]. The need for a micro-level analysis of LiRS is highlighted by the view that the vicious cycle of poverty and widening income inequality is an important cause of political polarization destabilizing countries [12].
While the literature on residential segregation has primarily focused on residential segregation by race and ethnicity, there has been less academic interest in residential segregation by income and social class [13]. Residential segregation is also a key driver of economic inequality, with government intervention in the housing market leading to extreme racial and economic segregation between neighborhoods, as well as population-level inequality along racial and class lines, including wealth inequality, life expectancy gaps, and differences in economic mobility, which persist across generations [14,15,16,17]. The question of how public policy can reduce spatial inequality is not straightforward, as research has shown that segregation patterns persist over time [18,19]. Hence, we analyzed patterns of LiRS in the context of South Korea’s rapidly changing socioeconomic structure from both macro and micro perspectives. Our study also helps to deepen our understanding of the relationship between public policy and spatial inequality by identifying the net effect of redevelopment on LiRS.
In the early 1960s, South Korea’s steady economic growth and thriving manufacturing industry led to large-scale migration from rural to urban areas and subsequent housing shortages in cities [20]. Additionally, consumer preferences for where to live have shifted from single-family homes to apartments based on convenience, creating a significant demand for apartments [21]. To meet this demand, the redevelopment of existing low-rise neighborhoods has involved many private companies, resulting in profit-oriented housing development and the loss of affordable housing [22]. This has led to an influx of upper-middle class high-income earners into working-class neighborhoods, resulting in rents and housing prices that low-income earners cannot afford, giving rise to gentrification [23]. The central government has begun introducing new policies to address problems arising from profit-driven redevelopment (such as gentrification). Still, more research is needed on the relationship between LiRS and redevelopment to determine their effectiveness. We, therefore, investigated the impact of large-scale redevelopment on LiRS.
The Section 1 discusses the theoretical background of residential segregation in the context of poverty and urban redevelopment. The Section 2 describes the variables and introduces the propensity score matching (PSM) method, which is used to construct an index to measure residential segregation and the net effect of redevelopment. The Section 3 presents the results regarding the changes in LiRS and the impact of large-scale redevelopment. Finally, the results are evaluated, and their implications are discussed.

2. Previous Studies

2.1. Residential Segregation of Poverty

The theory of residential segregation developed based on the theory of racial segregation in the United States (US). The US has been undergoing rapid industrialization and urbanization since the 19th century, creating a gap between those who have been able to adapt and those who have not. Black people, who were less able to accumulate capital than their white counterparts, were pushed into poorer housing conditions, and slums were created as impoverished groups expanded. The emergence of slum-like concentrations of poverty and different spatial patterns of residence between white and black people led scholars to study residential segregation.
Some studies have analyzed the causes of residential segregation among poor and immigrant populations using Burgess’s concentric model. In contrast, others have examined residential segregation among specific ethnic groups in the wake of rapid immigration [24]. In sociology, there has been a debate between two major perspectives on the causes of concentrated poverty in US cities: one that combines the deindustrialization of central cities with class-based migration patterns among African Americans and one that stresses the importance of racial residential segregation [25,26]. More recently, research has focused less on residential segregation and more on the various urban problems arising from this phenomenon. For example, studies have suggested that the concentration of segregated low- and high-income neighborhoods can lead to social unrest, riots, increased crime, and distrust between segregated social groups [27,28,29].
Against this background, the causes of spatial segregation among the poor have been categorized into economic, racial, ethnic, and segregation-related categories due to uneven development [30]. Studies arguing that economic segregation is the root of spatial segregation among the poor indicate that people move to neighborhoods where socioeconomic resources are available [31]. As such, it has been suggested that the level of spatial segregation of poor racial and ethnic groups simply reflects economic disparities among them. Regarding racial and ethnic segregation, studies have shown that low-income white neighborhoods are significantly isolated from high-income white neighborhoods [32]. It has been asserted that segregation of the poor due to uneven development is the most basic concept in understanding the differentiation of urban spaces [33,34]. Uneven development is an important cause of social stratification and group segregation because newly redeveloped areas attract residents with socioeconomic resources. In contrast, old and neglected areas attract only low-income people [30]. Segregation also reflects socioeconomic status and patterns of social relations [35,36,37]. Patterns of social relations are divided according to the perceived desirability of others, which results in minority groups being unable to be neighbors with other groups, forcing the former to live in poor physical and social environments where segregation is the norm [38,39].

2.2. Urban Redevelopment and Changes in Residential Segregation

One of the dilemmas associated with urban redevelopment and social equity is that building something new through redevelopment often imposes social costs by replacing something old [40]. Housing policies such as redevelopment play a central role in creating urban inequality [41,42]. In the US, residents of neighborhoods targeted for urban renewal are predominantly black and low-income [43], and the public housing subsequently built for them is also highly segregated by race and class [44].
Other disciplines, such as history and sociology, have also discussed how housing segregation occurs, including redlining and exclusive zoning [25,44]. The negative impacts of redevelopment contribute to neighborhood segregation and the concentration of undesirable land use and negatively impact the potential for wealth accumulation for low-income people [45], further limiting their housing options [46].
As South Korea aims for rapid modernization and economic growth, redevelopment projects have been implemented to stimulate development. Economic growth and housing policies have had important consequences on economic performance, sociopolitical stability, and the formation of social welfare structures [47]. The state dominates urban planning in South Korea, which does not have equally distributed urban resources. Property owners in redevelopment areas act as agents of the state and push through redevelopment plans at the will of the state [48]. As a result of such redevelopment, low-income groups have been forced to relocate to make way for higher-income groups, and wealth that should have been distributed has ended up concentrated in a few areas. Decisions related to the allocation of public resources become highly contested when redevelopment involves existing low-income housing [40], with groups in favor of redevelopment prioritizing the accumulation of wealth from redevelopment over the improvement of living conditions for low-income groups, leading to further socio-spatial polarization [49].

3. Data and Method

3.1. Scope and Variables

Redevelopment changes the living environment and urban aesthetics by allowing for the construction of new areas in existing deteriorated zones. It is mainly implemented in large cities that have deteriorated due to many people having lived there for a long time. Therefore, we set the spatial scope of the analysis to seven metropolitan cities in South Korea. In South Korea, the sub-administrative divisions of a city are gu, gun, and dong. Dongs are integrated to become gus (or guns), while gus (or guns) are brought together to become cities. In this study, dongs denote neighborhoods, and gus (or guns) refer to districts. The spatial scope included 74 gus (or guns), but we used only 71 gus (or guns) due to a lack of data on two guns and one gu (Incheon Ongjin-gun, Incheon Ganghwa-gun, and Busan Gangseo-gu). The final PSM analysis included 710 observations, comprising 71 gus (or guns) over a 10-year period.
The period of this study was from 2011 to 2020, and we measured the degree of LiRS using recipients of the National Basic Livelihood Security System (NBLSS). The lack of micro-level income data in South Korea limits the ability to gauge the spatial concentration of low-income households. The demographic dataset of NBLSS recipients does not directly measure poverty below the poverty line and does not include the next-lowest income group. However, due to data availability and clarity, beneficiaries of the NBLSS were utilized as a proxy for low-income groups. The NBLSS is a system established to guarantee a minimum standard of living for low-income persons facing economic difficulties, targeting individuals with incomes below 32% of the median income. However, this criterion may exclude individuals below the relative poverty line, potentially limiting the representativeness of the study’s findings. Nevertheless, given the nature of the microdata, which could lead to the identification of individuals, the NBLSS data are the only low-income data available at the smallest regional unit. Therefore, focusing on NBLSS beneficiaries is the most realistic and appropriate variable to utilize for estimating the size of low-income groups, as it identifies those living below the subsistence level who are dependent on government protection.
Figure 1 illustrates the number of large-scale redevelopment projects that were carried out over a decade in seven metropolitan cities in South Korea. These large-scale redevelopments have been predominantly taking place in Seoul and Busan, showing an overall upward trend from 2011 to 2020. This focus on large-scale redevelopment projects is due to the significant impact of large-scale residential complexes on residential environments and local communities, offering advantages such as reduced management costs and various amenities through economies of scale. Notably, previous studies have classified residential complexes with over 500 households as large-scale developments [50,51]. So, this study used, as the criterion of redevelopment, initiatives involving over 500 households.
Additionally, the study focuses on seven major metropolitan cities in South Korea—Seoul, Busan, Daegu, Daejeon, Incheon, Gwangju, and Ulsan. Redevelopment typically occurs in aging residential areas, and regions with higher population densities tend to experience faster deterioration due to increased usage. While there are differences in population sizes among these metropolitan cities, the disparity between large cities and small to medium-sized cities in South Korea is more pronounced [52]. The selected metropolitan cities exhibit similar characteristics in terms of economic structure and administrative systems, making them appropriate subjects for this research.
The treatment variable in the PSM analysis is redevelopment status. It is based on the redevelopment of 500 units or more that have occurred in 71 gus (or guns) between 2011 and 2020, categorized by year of occupancy. The dependent variable is the low-income neighborhood segregation index, which is the average of the dissimilarity index, isolation index, and location quotient (LQ). The PSM variables and control variables affect the mean of the dependent variable, the low-income residential segregation index, the number of rental apartment units, the number of general apartment units, the average sales price of an apartment, the average rental price of an apartment, and the area of green space per person for each year of the data. These are the variables that are likely to influence residential segregation of low-income individuals. They are selected as both PSM and control variables. Regions with a high distribution of rental housing which targets low-income persons, as well as areas with lower average monthly rents or housing prices, are more likely to have a higher concentration of low-income individuals; thus, these factors have been controlled for. Additionally, areas with an abundance of green spaces tend to have relatively less residential space. The number of general apartments was selected to control for the impact of the housing supply structure on residential segregation of low-income persons. General apartments are primarily aimed at middle-income and higher-income groups, and an increase in such housing can lead to the concentration of specific income groups, thereby reinforcing spatial segregation between classes.
In studies related to residential segregation, variables such as employment opportunities and the distribution of public facilities are often considered influential factors [53,54]. However, in this study, the analysis unit used is the gu (or gun), which does not possess an independent labor market. For instance, the employment opportunities available to individuals residing in Seoul’s Gangnam-gu are not confined to Gangnam-gu, but are connected to the broader labor market of the capital area. Therefore, including employment opportunities as a variable at the individual gu (or gun) level was deemed inappropriate. Additionally, in South Korea’s metropolitan cities, basic public services are uniformly provided across most areas. Welfare-related institutional support is primarily administered at the eup-myeon-dong level (basic administration and welfare center), which is a smaller administrative district than the gu (or gun). Consequently, residents do not experience significant inconvenience in accessing basic public services, and as such, the distribution of public facilities was not considered a variable (Table 1).
Table 1. Variables and data.
VariablesData SourcesYear
NBLSS 1 recipientsStatistics Korea [55]2011, 2020
Large-scale redevelopment (500+ units) or not Korea Housing Association [56]2011, 2020
Rental apartment (Number of low-income rental apartment units)Ministry of Land, Infrastructure and Transport and Korea Land & Housing Corporation [57]2011, 2020
General apartment (Number of general apartment units)Korea Housing Association [56]2011, 2020
Average rental price (Average monthly apartment rental price)Korea Real Estate Board [58]2011, 2020
Average sale price (Average monthly apartment sale price)Korea Real Estate Board [58]2011, 2020
Green space area per personStatistics Korea [59]2011, 2020
1 NBLSS = National Basic Livelihood Security System.
Figure 1. Number of redevelopments over 500 households in South Korea (source: Korea Housing Association [56]).
Land 14 00442 g001

3.2. Residential Segregation Index

There are two ways to measure residential segregation: a global segregation measure, which has one value for each city and allows for cross-city comparisons, and a local segregation measure, which allows for comparisons of residential segregation across neighborhoods within a city. We used the index of dissimilarity and the index of isolation as global segregation measures and LQ and local Moran’s I (LISA) as local segregation measures to gauge segregation in low-income neighborhoods.
Residential segregation has five spatial dimensions: evenness, exposure, concentration, clustering, and centralization [60]. We used the dissimilarity index as a measure of evenness, the isolation index as a measure of exposure, LQ as a measure of concentration, and LISA as a measure of clustering.
Duncan and Duncan’s [61] dissimilarity index, which estimates how evenly a group of people is distributed across the entire analysis area, is the most widely used index, despite its limitations due to the aspatial nature of the checkerboard problem. No other metric determines equality more efficiently than the dissimilarity index [62]. When the two groups are completely segregated in terms of where they live, the value of the index is 1, which is the maximum value. The minimum value is 0, at which point the two groups are not separated; that is, the higher the degree of residential segregation, the closer the value is to 1.
D = 1 2 i X i X Y i Y ,
X i : The number of people with basic needs living in dong  i ;
X : The number of people with basic needs living in the gu (or gun) to which dong  i belongs;
Y i : The number of people without basic needs living in dong  i ;
Y : The number of people without basic needs living in the gu (or gun) to which dong  i belongs.
The dimension of global exposure measures the likelihood of interactions between mainstream and minority groups [60]. The two indicators of exposure are the interaction index and the isolation index, whose values add up to 1. The interaction index gauges the extent to which people from minority groups are exposed to people from mainstream groups. In contrast, the isolation index assesses the extent to which people from minority groups are exposed to each other. In this study, we used the isolation index to establish the degree of segregation in low-income neighborhoods. The closer the value of the isolation index is to 1, the more segregated the neighborhood.
P a a = a i A a i t i ,
a i : The number of people with basic needs living in dong  i ;
A : The number of people with basic needs living in the gu (or gun) to which dong i belongs;
t i : The total number of people living in the gu (or gun) to which dong i belongs).
As both a measure of regional equality and concentration, LQ has been used in economic geography and regional economics to evaluate the degree of specialization within a region [63]; it determines a group’s relative importance in a region compared to the same group in the rest of the country, as well as the group’s relative degree of specialization. If the value of LQ is greater than 1, the proportion of the studied group in region i is greater than that of the studied group in all regions. This implies that the study population is concentrated in region i. Conversely, a value less than 1 suggests that the population is scarce in the region.
L Q i = a i t i T A ,
a i : The number of people with basic needs living in gu (or gun i ;
A : The number of people with basic needs living in the city to which gu (or gun i belongs;
t i : The total number of people living in gu (or gun i ;
T : The total number of people living in the city to which gu (or gun i belongs.
Unlike LQ, which treats individual neighborhoods independently, LISA is a measure of local spatial autocorrelation and considers each neighborhood in relation to its neighbors [64]. The value of LISA is interpreted as positive spatial dependence if the proportion of a particular class is relatively high in the area and the proportion of that particular class in the neighboring area is also high, forming a cluster. On the other hand, if the share of a particular class is somewhat low in both the given area and the neighboring one, it is interpreted as negative spatial dependence. In this study, the particular class consists of NBLSS recipients.
Four patterns of spatial associations emerged from LISA. As described earlier, areas with high index values are called hotspots in the high–high (HH) pattern and are clusters with positive spatial dependence. If regions with low index values are adjacent, they are called cold spots in the low–low (LL) pattern and exhibit negative spatial dependence. A region with a high–low (HL) pattern has a high index value, in contrast to the low LISA index of its neighbors, and a low–high (LH) pattern is a cluster in which the region has a low index value, and its neighbors have a high index value.
I i = Z i m 2 j W i j Z j ,   m 2 = Z i 2 N ,
Z i : The deviation between the value of the variable and the mean value;
W i j : The spatially weighted matrix;
N : The sum of the observations.

3.3. Propensity Score Matching

Two main methods are used to evaluate policy effects: Propensity Score Matching (PSM) and Difference-in-Differences (DID). The DID is a statistical method that compares the before-and-after effects of a policy implemented at a specific point in time, and is typically used when policies are implemented simultaneously. However, urban redevelopment projects occur at different times and scales across various cities, thereby making the use of DID unsuitable for this study. Therefore, we employed PSM to assess the impact of redevelopment on residential segregation.
PSM is a statistical method that approximates random selection in a pure experiment by pairing individuals with similar attributes to a common variable represented by a covariate [65]. Propensity scores are balancing scores that summarize covariates and can reduce the matching dimensions to a single dimension, compared with the direct matching of covariates. Most observational studies comparing two or more variables are based on non-random sampling, which has the disadvantage of not controlling for selection bias. Therefore, we used PSM, a quasi-experimental technique, to control for selection bias and to test the effectiveness of redevelopment policies. The propensity score is the conditional probability of being assigned to a given treatment given a vector of covariates. In the equation below, e x i is the propensity score, x i denotes the covariate vector, D i = 1 is the treatment group, and D i = 0 is the control group.
e x i = P r ( D i = 1 X i )
There are several ways to match the treatment and control cases: 1:1 matching with nearest-neighbor matching, 1:N matching, caliper matching, and radius matching. Nearest-neighbor matching is a method of matching all participants in the treatment and control groups in the order of the smallest estimated difference in propensity scores. An intuitive way to minimize confounding is to match each participant in the treatment group individually with a participant in the control group; hence, we used 1:1 nearest-neighbor matching [66]. We employed a probit model to estimate the propensity score. Table 2 outlines the variables used for PSM.

4. Findings

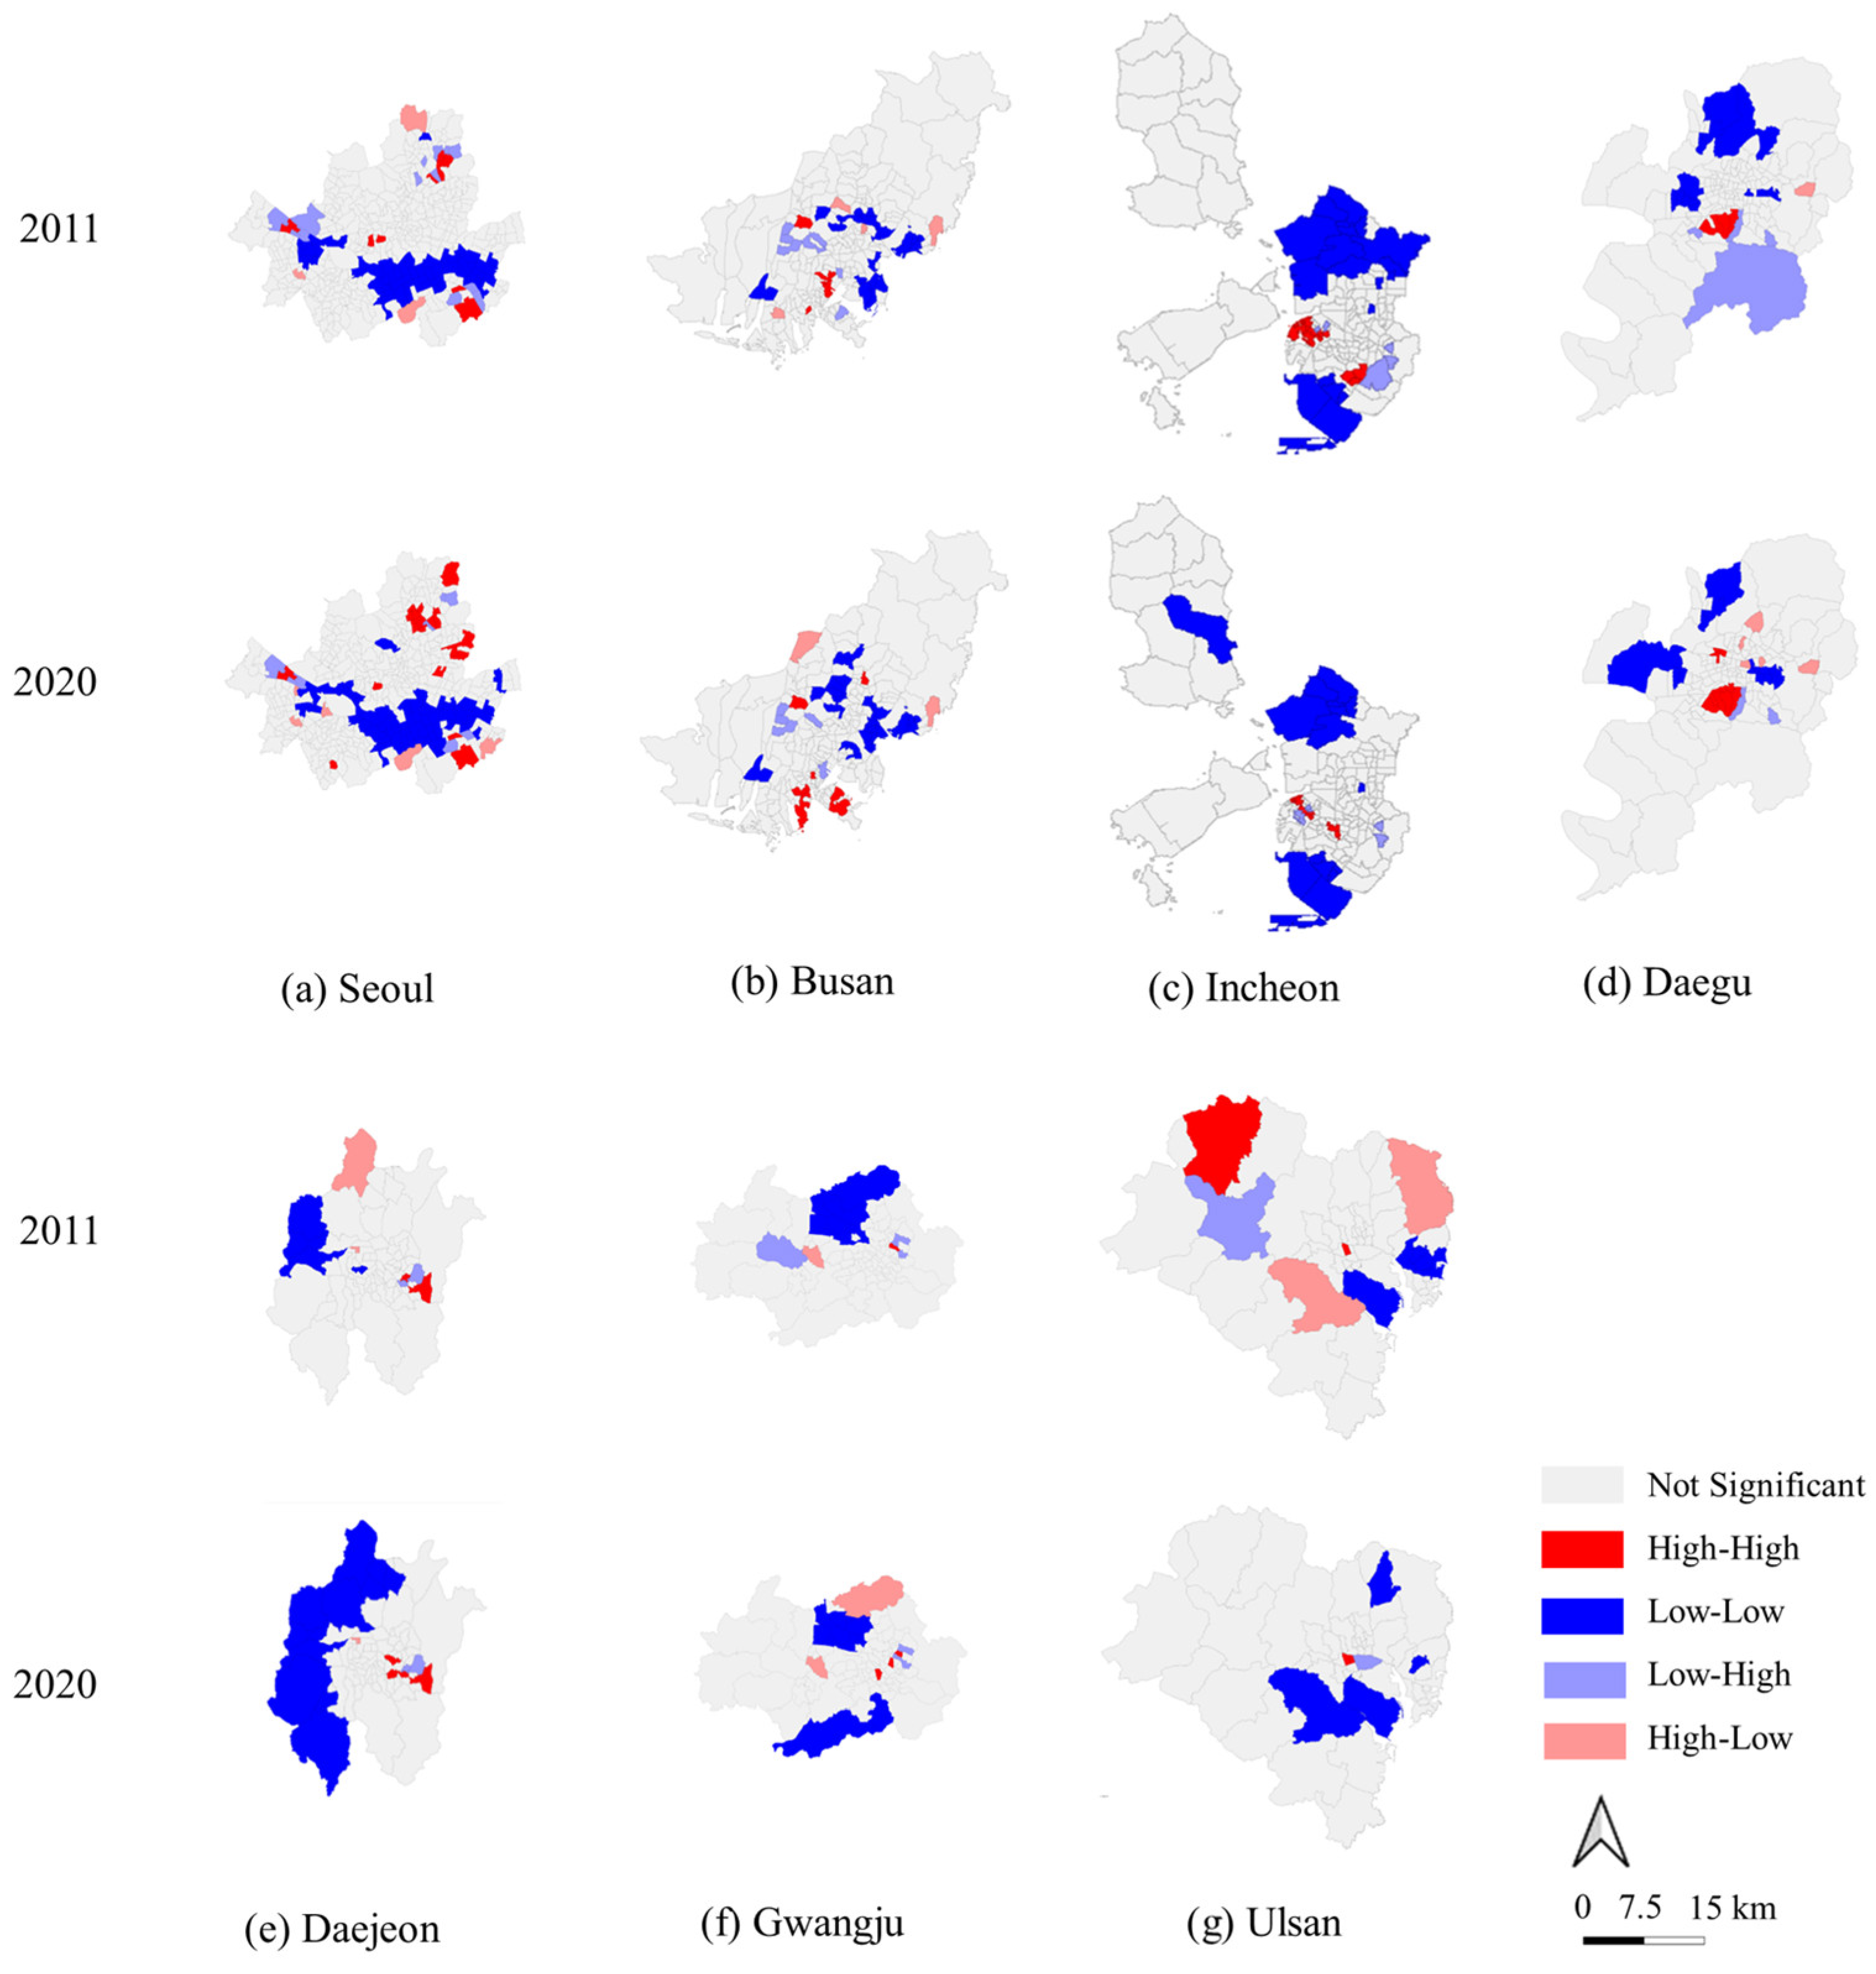
4.1. Changes in the Residential Segregation Index for the Seven Metropolitan Cities

First, we measured the degree of LiRS in South Korea using a constant index based on evenness, which is the most central and important of the five dimensions of residential segregation. Table 3 presents the dissimilarity index values for each city. In Table 3, the top 10 gus (or guns), with high index values, are shown in orange as the upper group, and the bottom 10 gus (or guns), with low index values, are displayed in blue as the lower group. Seoul Gangnam-gu, Seoul Gangseo-gu, Incheon Yeonsu-gu, and Seoul Seocho-gu demonstrate severe LiRS; more than half of the highest-scoring groups are located in Seoul. The index values for 2011 and 2020 show an overall decrease. Busan Jung-gu has the lowest values, followed by Daegu Nam-gu, Seoul Geumcheon-gu, and Seoul Seodaemun-gu. When examining the changes in ranking within the upper and lower groups, we found the changes in ranking to be relatively severe in the lower gu group.
Table 4 presents the measures of LiRS using the isolation index. In 2011 and 2020, Busan Sasang-gu had the highest isolation index among the 71 gus (or guns), followed by Busan Yeongdo-gu, Daegu Dalseo-gu, and Busan Buk-gu. Conversely, the least segregated gu, Ulsan Buk-gu, has the lowest isolation index in both years, similar to Busan Sasang-gu in the previous top group. Busan accounts for half of the upper half of the isolation index, while the lower half is dominated by the greater Seoul area, which accounts for nine out of ten gus (or guns) in 2011.
The measurement of LiRS through LQ is presented in Table 5. The LQ values of the upper groups are all greater than 1, indicating that low-income people are concentrated in these areas. Busan Dong-gu is located at the top of the upper group, followed by Busan Yeongdo-gu and Daegu Nam-gu, where the concentration of low-income people is also severe. In contrast, all cities and gus (or guns) in the lower group have LQ values lower than 1, suggesting a low concentration of low-income residents. Seocho-gu in Seoul has the lowest degree of segregation, followed by Yuseong-gu in Daejeon and Gangseo-gu in Busan. Interestingly, in Seoul and Busan, the upper and lower groups are dominated by gus (or guns). Seoul and Busan are more segregated than the other cities.
Figure 2 shows a map of the LISA analysis regarding the proportion of the total number of residents in each ward who are NBLSS recipients. In Seoul, the number of wards with LL, LH, and HL patterns did not change significantly; however, the number of spot areas with the HH pattern doubled. This means that the number of clusters with a high proportion of NBLSS recipients in the neighborhood and surrounding areas has doubled, indicating that low-income people are clustered together, and residential segregation has intensified. In Busan, the HH pattern increased approximately twofold, whereas the LL pattern increased slightly. In Daegu, the number of HH-pattern areas tripled, and the HL pattern also increased, in contrast to the low proportion of NBLSS recipients in the surrounding neighborhoods. Daejeon and Gwangju also saw an increase in HH-patterned neighborhoods, leading to increased segregation of low-income residents. Ulsan exhibited similar results over time. However, only Incheon demonstrated a significant decline in the number of HH-pattern neighborhoods compared to other cities, implying that the LiRS is easing up.

4.2. Impact of Redevelopment on LiRS

We determined the treatment and control groups for the PSM based on whether redevelopment was implemented. The treatment group was the group in which redevelopment occurred. Table 6 presents the basic statistics from the analyzed data. Of the 710 gus (or guns), we designated 181 as the treatment group and 529 as the control group. The mean of the residential segregation index was approximately 0.03 lower in the treatment group than in the control group, and the mean number of rental and regular apartment units was lower in the control group. Average sale and rental prices were 1.5 times higher in the treatment group. However, the average green space per person in the treatment group was less than half that in the control group.
Table 7 depicts the average changes in the variables of the control and treatment groups before and after the ultra-proximity neighborhood matching used in the study as a result of PSM before estimating the average treatment effect. We estimated the propensity score using the number of rental apartment units, the number of general apartment units, the average rental price, the average sales price, and green space per person as covariates. PSM resulted in improved homogeneity for all variables. Before matching, there was a statistically significant difference between the mean values of the treatment and control groups; however, after matching, none of the variables were significantly different. This suggests that the attributes of the two groups are similar.
To examine the effect of redevelopment on LiRS, we estimated the average treatment effect (ATT) based on the matching outcomes, which are shown in Table 8. The average treatment effect analysis showed an average difference of approximately 0.0289 between the treatment group with redevelopment and the control group without redevelopment. Therefore, assuming that all conditions are the same, the redevelopment of an area previously without redevelopment reduces the degree of LiRS by 0.0289.

5. Discussion and Conclusions

South Korea has undergone significant urban restructuring in the past two decades. In the early 2000s, the large-scale demolition of low-rise residential neighborhoods and redevelopment into high-rise apartments generated negative externalities, such as the destruction of communities, the displacement of existing residents, and the loss of affordable housing [67]. Redevelopment, initiated to improve low-income neighborhoods, has also increased LiRS by displacing poor local residents [68]. However, suppose the degree of LiRS is measured by the change in the dissimilarity index value. In that case, since the results of this study indicate that the overall dissimilarity index value fell from 2011 to 2020, this suggests that residential segregation declined. These results were likely influenced by a new approach to housing redevelopment called the New Town Exit Strategy, which began in 2012. Instead of demolition and redevelopment, the New Town Exit Strategy pursues a reconstruction program and small-scale, on-site demolition in older low-rise residential areas [69]. This strategy makes it more difficult to refurbish existing neighborhoods with high-density, high-rise developments, resulting in a diversity of residential spaces in urban centers that have otherwise become homogenous. Seoul’s boroughs contain many low-income subgroups within their segregation index values. Seoul and Busan have higher values than other metropolitan cities, which is consistent with previous research showing that high financial independence, a high proportion of youth, and high population density increase economic disparity [70].
The PSM analysis of the net effect of redevelopment revealed that neighborhoods with redevelopment have a lower LiRS index than those without. The conclusion that redevelopment reduces LiRS can be explained by the gentrification caused by redevelopment. Over the past 40 years, urban redevelopment in South Korea has aimed to maximize the housing supply and enhance the physical environment. Still, redevelopment programs have focused on maximizing landlords’ profits rather than improving the residential welfare of low-income residents or revitalizing communities. Consequently, low-income residents are pushed out of their neighborhoods and moved to the periphery, and they are replaced by middle- and high-income residents [49]. Thus, residential segregation can be explained by the dispersal of low-income local residents who now live in the same area because of redevelopment.
In the late 2000s, the South Korean government enacted laws mandating the inclusion of affordable housing in all new housing or redevelopment projects [71,72]. This decision was driven by concerns over gentrification, since middle-income groups began moving into newly built apartment complexes due to redevelopment, forcing the low-income residents who had lived in the previously underdeveloped areas to relocate. This policy was introduced with the expectation that social mixing would mitigate the growing residential segregation between income groups. As a result, affordable housing units were forcibly incorporated into new apartment complexes. However, many studies have suggested that such “social mix” policies, which allocate specific buildings to particular income groups, may lead to negative outcomes instead, such as the emergence of new conflicts and a greater amount of stigma [73,74,75].
Nevertheless, previous studies have mostly investigated these phenomena at the apartment-complex level. Contrastingly, this study measured the residential segregation of low-income groups at the district level (gu or gun), and the results indicate that redevelopment may actually alleviate residential segregation for low-income residents. This suggests that the impact of redevelopment on income-based residential segregation may vary, depending on the unit of analysis. Specifically, when measured at the apartment-complex level, redevelopment exacerbates segregation, while at the local district level (gu or gun), it appears to mitigate it. These contrasting results highlight that the impact of redevelopment may differ, based on the spatial unit of analysis. To gain a more accurate understanding of the manner in which redevelopment affects low-income residents’ relocation decisions and actions, further research at the individual level is needed.
The significance of this study is that it analyzes the micro-level spatial structure of poverty, which is at the center of structural inequality, and identifies the net effect of redevelopment on residential segregation. However, this study has some limitations. First, although we used PSM to reduce selection bias, we could not achieve complete randomization, which is not feasible in social science research. It is impossible to assume that the control group would have matched equally and similarly for all other factors. Because this study set the unit of analysis at the local level, the distributions of public facilities and employment opportunities were not used as control variables in the PSM. However, if a future study is conducted at a regional level, such as a labor market larger than the local level, the distribution of public services and employment opportunities may vary across units at the spatial level. So, these variables should be considered in extending the study to the regional level. Second, the manipulated variable for the low-income group, NBLSS recipients, does not accurately represent low-income people. Although this group is similar in meaning to the low-income group, it does not include everyone below the absolute or relative poverty lines. To address these issues, data on household income should be disaggregated to clarify which households fall below absolute or relative poverty lines. Households below absolute poverty and households below relative poverty may have different attributes when it comes to residential location decisions. Households below the absolute poverty line may have easier access to government subsidy housing, healthcare, and other benefits, while households below the relative poverty line are likely to be excluded. For this analysis, a consensus, and criteria for absolute and relative poverty lines that are appropriate to a society’s level of development will be required. Third, no clear conclusions can be drawn from the various measures of residential segregation. Continued efforts are required to develop a single indicator encompassing all five residential segregation dimensions. Finally, due to data limitations, this study did not include analyses of small and medium-sized cities. Future research should explore the effects of redevelopment in such cities as well, as they may exhibit different characteristics compared to metropolitan cities.
Development to address the housing shortage caused by rapid urbanization has led to an increase in the value of real estate and other assets and a rise in income inequality between those who have accumulated wealth and those who have not. In this context, we analyzed the changes in the residential segregation of low-income households in metropolitan cities, where there have been many changes in residences. We examined residential segregation from the macro perspective using the dissimilarity index and the isolation index and from the micro perspective using LQ and LISA. From a global standpoint, LiRS has generally eased, and in terms of exposure, LiRS is highest in Busan and lowest in Seoul. Low-income residents cluster in urban centers, which become less dense towards the outer periphery. PSM analyses controlling for apartment prices and residential environments showed redevelopment areas to be less segregated than non-redevelopment areas, with implications for urban development policies.
As many high-income earners move to the outer peripheries of cities to escape the complexity of urban life and enjoy life, low-income residents are concentrated in the city centers. In addition, urban growth is slowing, with many regulations now in place to prevent sprawl and allow for meaningful redevelopment. Large cities have extended the timeframe to be considered for redevelopment issues to 20–40 years. In this context, research on urban renewal and LiRS can serve as an important reference for the formulation and implementation of urban planning and housing policies; it can be used to formulate low-income housing policies because such research addresses changes in LiRS, which is not often dealt with, due to a lack of alternative indicators. The conclusion that redevelopment positively impacts LiRS highlights the need to consult with those responsible for low-income housing policies when selecting future redevelopment areas to ensure greater effectiveness.

Author Contributions

Conceptualization, C.L. and D.K.; methodology, C.L.; validation, C.L. and D.K.; formal analysis, C.L.; investigation, D.K.; data curation, C.L.; writing—original draft preparation, C.L. and D.K.; writing—review and editing, C.L. and D.K.; visualization, C.L.; supervision, D.K.; funding acquisition, D.K. All authors have read and agreed to the published version of the manuscript.

Funding

This work was supported by Korea Environment Industry &Technology Institute (KEITI) through “Climate Change R&D Project for New Climate Regime”, funded by Korea Ministry of Environment (MOE) (RS-2022-KE002124).

Data Availability Statement

All data were provided by Statistics Korea.

Conflicts of Interest

The authors declare no conflicts of interest.

References

  1. Piketty, T. Capital in the Twenty-First Century; Harvard University Press: Cambridge, MA, USA; London, UK, 2014; pp. 430–468. [Google Scholar]
  2. Park, C.; Hang, G. The financialization of non-financial firms: The case of South Korea, 1997–2015. Curr. Sociol. 2022, 70, 1085–1105. [Google Scholar] [CrossRef]
  3. Shalizi, C.R.; Thomas, A.C. Homophily and contagion are generically confounded in observational social network studies. Sociol. Method Res. 2011, 40, 211–239. [Google Scholar] [CrossRef] [PubMed]
  4. Jun, H. Spillover effects in neighborhood housing value change: A spatial analysis. Hous. Stud. 2022, 37, 1303–1330. [Google Scholar] [CrossRef]
  5. Brooks-Gunn, J.; Duncan, G.; Klebanov, P.K.; Sealand, N. Do neighborhoods influence child and adolescent development? Am. J. Sociol. 1993, 99, 353–395. [Google Scholar] [CrossRef]
  6. Jargowsky, P.A. Take the Money and Run: Economic Segregation in U.S. Metropolitan areas. Am. Sociol. Rev. 1996, 61, 984–998. [Google Scholar] [CrossRef]
  7. Massey, D.S.; Eggers, M.L. The ecology of inequality: Minorities and the concentration of poverty, 1970–1980. Am. J. Sociol. 1990, 95, 1153–1188. [Google Scholar] [CrossRef]
  8. Sampson, R.J.; Raudenbush, S.W.; Earls, F. Neighborhoods and violent crime: A multilevel study of collective efficacy. Science 1997, 277, 918–924. [Google Scholar] [CrossRef]
  9. Sampson, R.J.; Morenoff, J.D.; Gannon-Rowley, T. Assessing ‘neighborhood effects’: Social processes and new directions in research. Annu. Rev. Sociol. 2022, 28, 443–478. [Google Scholar] [CrossRef]
  10. Lobao, L.M.; Hooks, G.; Tickamyer, A.R. Poverty and inequality across space: Sociological reflections on the missing-middle subnational scale. Camb. J. Reg. Econ. Soc. 2008, 1, 89–113. [Google Scholar] [CrossRef]
  11. Sampson, R.J. Moving to inequality: Neighborhood effects and experiments meet social structure. Am. J. Sociol. 2008, 114, 189–231. [Google Scholar] [CrossRef] [PubMed]
  12. Gu, Y.; Wang, Z. Income inequality and global political polarization: The economic origin of political polarization in the world. J. Chin. Political Sci. 2022, 27, 375–398. [Google Scholar] [CrossRef] [PubMed]
  13. Owens, A. Income segregation between school districts and inequality in students’ achievement. Sociol. Educ. 2018, 91, 1–27. [Google Scholar] [CrossRef]
  14. Chetty, R.; Hendren, N.; Katz, L.F. The effects of exposure to better neighborhoods on children: New evidence from the moving to opportunity experiment. Am. Econ. Rev. 2016, 106, 855–902. [Google Scholar] [CrossRef] [PubMed]
  15. Oliver, M.; Shapiro, T. Black Wealth/White Wealth: A New Perspective on Racial Inequality; Routledge: New York, NY, USA, 2006. [Google Scholar]
  16. Sharkey, P.; Elwert, F. The legacy of disadvantage: Multigenerational neighborhood effects on cognitive ability. Am. J. Sociol. 2011, 116, 1934–1981. [Google Scholar] [CrossRef] [PubMed]
  17. Williams, D.R.; Collins, C. Racial residential segregation: A fundamental cause of racial disparities in health. Public Health Rep. 2001, 116, 404–416. [Google Scholar] [CrossRef]
  18. Faber, J. Contemporary echoes of segregationist policy: Spatial marking and the persistence of inequality. Urban Stud. 2021, 58, 1067–1086. [Google Scholar] [CrossRef]
  19. Sampson, R.J. Great American City: Chicago and the Enduring Neighborhood Effect; University of Chicago Press: Chicago, IL, USA, 2012. [Google Scholar]
  20. Ha, S. Housing crises and policy transformations in South Korea. Int. J. Hous. Policy 2010, 10, 255–272. [Google Scholar] [CrossRef]
  21. Lee, J.; Kim, G. A study on preference for shared housing as an alternative to college student housing welfare: Focusing on the Seoul metropolitan area. J. Korea Real Estate Anal. Assoc. 2020, 26, 81–97. [Google Scholar]
  22. Seo, J. Housing policy and urban sustainable development: Evaluating the process of high-rise apartment development in Korea. Urban Policy Res. 2016, 34, 330–342. [Google Scholar] [CrossRef]
  23. Ha, S. Housing regeneration and building sustainable low-income communities in Korea. Habitat Int. 2007, 31, 116–129. [Google Scholar] [CrossRef]
  24. Wirth, L. The Ghetto. Am. J. Sociol. 1928, 33, 57–71. [Google Scholar] [CrossRef]
  25. Massey, D.S.; Denton, N.A. American apartheid: Segregation and the making of the underclass. In Social Stratification, Class, Race, and Gender in Sociological Perspective; Grusky, D.B., Ed.; Routledge: New York, NY, USA, 2001; pp. 192–201. [Google Scholar]
  26. Wilson, W.J. The Truly Disadvantaged: The Inner City, the Underclass, and Public Policy, 2nd ed.; University of Chicago Press: Chicago, IL, USA, 2012. [Google Scholar]
  27. Malmberg, B.; Andersson, E.; Östh, J. Segregation and urban unrest in Sweden. Urban Geogr. 2013, 34, 1031–1046. [Google Scholar] [CrossRef]
  28. Musterd, S. Social and ethnic segregation in Europe: Levels, causes, and effects. J. Urban Aff. 2005, 27, 331–348. [Google Scholar] [CrossRef]
  29. Reardon, S.F.; Bischoff, K. Income inequality and income segregation. Am. J. Sociol. 2011, 116, 1092–1153. [Google Scholar] [CrossRef] [PubMed]
  30. Fong, E.; Shibuya, K. The spatial separation of the poor in Canadian cities. Demography 2000, 37, 449–459. [Google Scholar] [CrossRef]
  31. Tiebout, C.M. A pure theory of local expenditures. J. Polit. Econ. 1956, 64, 416–424. [Google Scholar] [CrossRef]
  32. Wang, Q.; Phillips, N.E.; Small, M.L.; Sampson, R.J. Urban mobility and neighborhood isolation in America’s 50 largest cities. Proc. Natl. Acad. Sci. USA 2018, 115, 7735–7740. [Google Scholar] [CrossRef]
  33. Harvey, D. Social Justice and the City; University of Georgia Press: Athens, GA, USA, 1973. [Google Scholar]
  34. Hill, E.W.; Wolman, H.L. City-suburban income disparities and metropolitan area employment: Can tightening labor markets reduce the gaps? Urban Aff. Rev. 1997, 32, 558–582. [Google Scholar] [CrossRef]
  35. Massey, D. Ethnic residential segregation: A theoretical synthesis and empirical review. Sociol. Soc. Res. 1985, 69, 315–350. [Google Scholar]
  36. Musterd, S.; Marcińczak, S.; van Ham, M.; Tammaru, T. Socioeconomic segregation in European capital cities. Increasing separation between poor and rich. Urban Geogr. 2017, 38, 1062–1083. [Google Scholar] [CrossRef]
  37. Park, R.; Burgess, E.; McKenzie, R. The City; University of Chicago Press: Chicago, IL, USA, 1984. [Google Scholar]
  38. Alba, R.D.; Logan, J.R. Variations on two themes: Racial and ethnic patterns in the attainment of suburban residence. Demography 1991, 28, 431–453. [Google Scholar] [CrossRef]
  39. Graif, C.; Lungeanu, A.I.; Yetter, A.M. Neighborhood isolation in Chicago: Violent crime effects on structural isolation and homophily in inter-neighborhood commuting networks, 2002–2013. Soc. Netw. 2017, 51, 40–59. [Google Scholar] [CrossRef] [PubMed]
  40. Thomas, J.M.; Hwang, H. Social equity in redevelopment and housing. J. Plan. Educ. Res. 2003, 23, 8–23. [Google Scholar] [CrossRef]
  41. Desmond, M. Eviction and the reproduction of urban poverty. Am. J. Sociol. 2012, 118, 88–133. [Google Scholar] [CrossRef]
  42. Desmond, M. Evicted: Poverty and Profit in the American City; Crown Publishing Group: New York, NY, USA, 2016. [Google Scholar]
  43. Fullilove, M.T. Root shock: The consequences of African American dispossession. J. Urban Health 2001, 78, 72–80. [Google Scholar] [CrossRef] [PubMed]
  44. Rothstein, R. The Color of Law: A Forgotten History of How Our Government Segregated America; Liveright Publishing Corporation: New York, NY, USA, 2017. [Google Scholar]
  45. Whittemore, A.H. Racial and class bias in zoning: Rezonings involving heavy commercial and industrial land use in Durham (NC). J. Am. Plann. Assoc. 2017, 83, 235–248. [Google Scholar] [CrossRef]
  46. Swope, C.B.; Hernández, D. Housing as a determinant of health equity: A conceptual model. Soc. Sci. Med. 2019, 243, 112571. [Google Scholar] [CrossRef]
  47. Ronald, R.; Kyung, S. Housing system transformations in Japan and South Korea: Divergent responses to neo-liberal forces. J. Contemp. Asia 2013, 43, 452–474. [Google Scholar] [CrossRef]
  48. Lee, S.Y. Cities for profit: Profit-driven gentrification in Seoul, South Korea. Urban Stud. 2018, 55, 2603–2617. [Google Scholar] [CrossRef]
  49. Ha, S. The Endogenous Dynamics of Urban Renewal and a Gentrification Process in Seoul. In Global Gentrifications: Uneven Development and Displacement; Lee, L., Shin, H.B., López-Morales, E., Eds.; Policy Press: London, UK, 2015; pp. 192–201. [Google Scholar]
  50. Han, S.; Bae, H. Changes in residential distribution by urban renewal: Does large-scale apartment complex cause residential segregation by income level? Korea Assoc. Policy Stud. 2021, 30, 111–135. [Google Scholar] [CrossRef]
  51. Oh, H.; Hwang, S. Identifying physical distinction in social-mix apartment complexes - Focusing on redeveloped apartment complexes. J. Urban Des. Inst. Korea 2022, 23, 143–157. [Google Scholar] [CrossRef]
  52. Lee, S.; Im, J.; Cho, K. Understanding spatial inequalities and stratification in transportation accessibility to social infrastructures in South Korea: Multi-dimensional planning insights. Sci. Rep. 2024, 14, 18445. [Google Scholar] [CrossRef] [PubMed]
  53. Scarpa, S. The impact of income inequality on economic residential segregation: The case of Malmö, 1991–2010. Urban Stud. 2015, 52, 906–922. [Google Scholar] [CrossRef]
  54. Sun, W.; Fu, Y.; Zheng, S. Local public service provision and spatial inequality in Chinese cities: The role of residential income sorting and land-use conditions. J. Reg. Sci. 2017, 57, 547–567. [Google Scholar] [CrossRef]
  55. Statistics Korea. Basic Statistics of Local Government. Available online: https://kosis.kr/statisticsList/statisticsListIndex.do?vwcd=MT_ZTITLE&menuId=M_01_01 (accessed on 9 December 2024).
  56. Korea Housing Association. Housing Plan. Available online: https://www.housing.or.kr/mbshome/mbs/home/jsp/saleinfo/iplan.jsp?id=home_020300000000 (accessed on 9 December 2024).
  57. Ministry of Land, Infrastructure and Transport and Korea Land & Housing Corporation. Myhome Portal. Available online: https://www.myhome.go.kr/hws/portal/sch/selectRentalHouseInfoListView.do (accessed on 9 December 2024).
  58. Korea Real Estate Board. Statistics for Real Estate. Available online: https://www.reb.or.kr/r-one/portal/main/indexPage.do (accessed on 9 December 2024).
  59. Statistics Korea. Urban Planning Status. Available online: https://kosis.kr/statHtml/statHtml.do?orgId=460&tblId=TX_315_2009_H1013&conn_path=I2 (accessed on 9 December 2024).
  60. Massey, D.S.; Denton, N.A. The dimensions of residential segregation. Soc. Forces 1988, 67, 281–315. [Google Scholar] [CrossRef]
  61. Duncan, O.D.; Duncan, B. A methodological analysis of segregation indexes. Am. Sociol. Rev. 1955, 20, 210–217. [Google Scholar] [CrossRef]
  62. Wong, D.W.S. Implementing spatial segregation measures in GIS. Comput. Environ. Urban Syst. 2003, 27, 53–70. [Google Scholar] [CrossRef]
  63. Burt, J.; Barber, G.; Rigby, D. Elementary Statistics for Geographers, 3rd ed.; Guildford Press: New York, NY, USA, 2009. [Google Scholar]
  64. Anselin, L. Local indicators of spatial association—LISA. Geogr. Anal. 1995, 27, 93–115. [Google Scholar] [CrossRef]
  65. Rosenbaum, P.R.; Rubin, D.B. The central role of the propensity score in observational studies for causal effects. Biometrika 1983, 70, 41–55. [Google Scholar] [CrossRef]
  66. Sainani, K.L. Propensity scores: Uses and limitations. PM R 2012, 4, 693–697. [Google Scholar]
  67. Weber, R.; Doussard, M.; Bhatta, S.D.; Mcgrath, D. Tearing the city down: Understanding demolition activity in gentrifying neighborhoods. J. Urban Aff. 2006, 28, 19–41. [Google Scholar] [CrossRef]
  68. Tach, L.; Emory, A.D. Public housing redevelopment, neighborhood change, and the restructuring of urban inequality. Am. J. Sociol. 2017, 123, 686–739. [Google Scholar] [CrossRef]
  69. Yang, H.J. Spatio-temporal changes of housing features in response to urban renewal initiatives: The case of Seoul. Sustainability 2020, 12, 7918. [Google Scholar] [CrossRef]
  70. Park, Y. Determinants of economic segregation and spatial distribution of poverty. J. Distrib. Sci. 2019, 17, 21–30. [Google Scholar] [CrossRef]
  71. Ronald, R.; Lee, H. Housing policy socialization and de-commodification in South Korea. J. Hous. Built Environ. 2012, 27, 111–131. [Google Scholar] [CrossRef]
  72. Yang, S.; Kim, H.; Kim, S.N.; Ahn, K. What is achieved and lost in living in a mixed-income neighborhood? Findings from South Korea. J. Hous. Built Environ. 2018, 33, 807–828. [Google Scholar] [CrossRef]
  73. Bricocoli, M.; Cucca, R. Social mix and housing policy: Local effects of a misleading rhetoric. The case of Milan. Urban Stud. 2016, 53, 77–91. [Google Scholar] [CrossRef]
  74. Kleinhans, R. Social implications of housing diversification in urban renewal: A review of recent literature. J. Hous. Built Environ. 2004, 19, 367–390. [Google Scholar] [CrossRef]
  75. Levin, I.; Santiago, A.; Arthurson, K. Creating mixed communities through housing policies: Global perspectives. J. Urban Aff. 2021, 44, 291–304. [Google Scholar] [CrossRef]
Figure 2. LISA analysis for seven metropolitan cities.
Land 14 00442 g002
Table 2. Variables of PSM.
CategoryVariablesDefinition
Dependent variableLiRS 1 indexAverage of the dissimilarity index, the isolation index, and the LQ values
Independent variableLarge-scale redevelopment (500+ units) or notYes = 1; No = 0
Control variables (PSM variables)Rental apartmentNumber of low-income rental apartment units
General apartmentNumber of general apartment units
Average rental priceAverage monthly apartment rental price
Average sale priceAverage monthly apartment sale price
Green space per personGreen space area per person
1 LiRS = low-income residential segregation.
Table 3. Dissimilarity index of LiRS for seven metropolitan cities.
Metropolitan CityGu/GunYearMetropolitan CityGu/GunYear
2011202020112020
SeoulJongno0.230260.31955BusanYeongdo0.263240.22162
Jung0.180220.15027Dong0.100780.14384
Yongsan0.313170.32799Seo0.187620.20480
Seongdong0.121180.14888Jung0.049660.05804
Gwangjin0.185690.21003DaejeonDaedeok0.361790.25563
Dongdae-mun0.142640.13354Yuseong0.299700.21750
Jungnang0.176780.12259 Seo0.330520.29497
Seongbuk0.115680.16593Jung0.266150.24626
Gangbuk0.202650.13066Dong0.276360.16487
Dobong0.228920.25726DaeguDal-seong0.179230.21331
Nowon0.325350.26870 Dalseo0.414750.40093
Eunpyeong0.204250.12535Suseong0.291690.31424
Seodaemun0.104470.11887Buk0.236320.29185
Mapo0.177890.16223Nam0.059640.10294
Yangcheon0.260720.27647Seo0.125020.13662
Gangseo0.519230.35587Dong0.235960.21827
Guro0.258950.20036Jung0.108120.16205
Geomcheon0.070580.13542GwangjuGwang-san0.447550.21311
Yeongdeung-po0.262870.28664 Buk0.350020.29145
Dongjak0.151690.14324Nam0.194320.20038
Gwanak0.179690.13223Seo0.317120.31226
Seocho0.380100.34526Dong0.135290.14563
Gangnam0.538440.45123IncheonSeo0.249610.25424
Songpa0.353000.31596Gye-yang0.191530.12627
Gangdong0.236090.25385 Bu-pyeong0.239190.20547
BusanGijang0.126470.11241Nam-dong0.224460.16065
Sasang0.343570.33331Yeonsu0.439280.49956
Suyeong0.112560.12247Michuhol0.144770.16230
Yeonje0.206470.18930 Dong0.172190.22339
Geumjeong0.223370.25369Jung0.273160.28477
Saha0.324300.22978UlsanUlju0.242830.18762
Haeundae0.387960.38523Buk0.137670.11006
Buk0.374770.36277Dong0.348430.28255
Nam0.175150.21294Jung0.114280.16297
Dongnae0.176460.15886 Nam0.301230.30118
Busanjin0.122470.13586
Upper group (10 gus (or guns) with large index values, orange shading), lower group (10 gus (or guns) with smaller index values, blue shading).
Table 4. Isolation index of LiRS by seven metropolitan cities.
Metropolitan CityGu/GunYearMetropolitan CityGu/GunYear
2011202020112020
SeoulJongno0.018790.04642BusanYeongdo0.089690.14184
Jung0.032280.04433Dong0.086710.10788
Yongsan0.034000.06050Seo0.072320.10460
Seongdong0.020990.03715Jung0.050690.08643
Gwangjin0.015820.04027DaejeonDaedeok0.071870.07483
Dongdae-mun0.026800.04647Yuseong0.026730.02795
Jungnang0.028450.06577Seo0.052400.05946
Seongbuk0.020760.04228Jung0.047770.07046
Gangbuk0.043300.07310 Dong0.084740.09339
Dobong0.016560.05724DaeguDal-seong0.045840.04743
Nowon0.058430.07846 Dalseo0.095560.10931
Eunpyeong0.032010.05096Suseong0.073460.08679
Seodaemun0.018730.03343Buk0.062830.06854
Mapo0.020070.03088Nam0.053550.09838
Yangcheon0.019680.04983Seo0.047590.08859
Gangseo0.095220.09712Dong0.062050.06952
Guro0.019190.03310Jung0.055940.06418
Geomcheon0.029980.05015GwangjuGwang-san0.079540.06564
Yeongdeung-po0.026590.03612Buk0.089440.10733
Dongjak0.016210.03400Nam0.052150.07091
Gwanak0.021730.04427Seo0.059110.08053
Seocho0.015650.02818Dong0.061770.06930
Gangnam0.081710.08227IncheonSeo0.020570.04793
Songpa0.016570.03842Gye-yang0.017150.05310
Gangdong0.017650.04028Bu-pyeong0.036090.06715
BusanGijang0.040150.05871 Nam-dong0.037580.06352
Sasang0.125970.17106 Yeonsu0.054190.05717
Suyeong0.032240.02954Michuhol0.025190.06172
Yeonje0.041390.05876 Dong0.040770.07182
Geumjeong0.044360.07299Jung0.043620.05327
Saha0.064840.08035UlsanUlju0.019290.02911
Haeundae0.067450.09218Buk0.011890.02140
Buk0.094710.11772Dong0.023990.04615
Nam0.029610.04963Jung0.022960.04116
Dongnae0.027330.04273Nam0.020640.04154
Busanjin0.039010.06047
Upper group (10 gus (or guns) with large index values, orange shading), lower group (10 gus (or guns) with smaller index values, blue shading).
Table 5. LQ of LiRS by seven metropolitan cities.
Metropolitan CityGu/GunYearMetropolitan CityGu/GunYear
2011202020112020
SeoulJongno0.854800.75831BusanYeongdo1.464511.76436
Jung1.288681.00727Dong1.833971.69719
Yongsan0.870470.85721Seo1.524881.50058
Seongdong0.940770.83483Jung1.242351.45630
Gwangjin0.660480.85701DaejeonDaedeok1.309741.23217
Dongdae-mun1.172341.08812Yuseong0.432610.48658
Jungnang1.180441.59062Seo0.687230.79551
Seongbuk0.948780.89108Jung1.176791.20759
Gangbuk1.505851.64396 Dong1.546171.49248
Dobong0.645871.08645DaeguDal-seong0.956610.74048
Nowon1.777991.50532Dalseo0.997860.96541
Eunpyeong1.216281.21289Suseong0.880150.82178
Seodaemun0.859950.81869Buk0.826410.73356
Mapo0.804170.67863Nam1.258021.69370
Yangcheon0.702730.90238Seo1.059611.50786
Gangseo1.540431.22121Dong1.030421.01375
Guro0.667750.71594Jung1.259481.04380
Geomcheon1.437201.19352GwangjuGwang-san0.753660.76193
Yeongdeung-po0.911270.66459Buk1.087871.15122
Dongjak0.708210.78240Nam1.044251.00745
Gwanak0.909771.03264Seo0.887580.95237
Seocho0.327050.40526Dong1.320501.07267
Gangnam0.785540.67594IncheonSeo0.615360.73503
Songpa0.462040.60963Gye-yang0.572281.01120
Gangdong0.679780.80277Bu-pyeong1.091021.14578
BusanGijang0.911090.94030Nam-dong1.039171.07526
Sasang1.119281.12271Yeonsu1.057670.52791
Suyeong0.736910.46656Michuhol0.884181.11621
Yeonje0.847210.82200Dong1.364611.16285
Geumjeong0.868350.92475Jung1.201510.74571
Saha1.048721.10094UlsanUlju0.899660.82127
Haeundae0.809030.83883Buk0.689110.68763
Buk1.351871.22403Dong0.782371.13856
Nam0.635220.69771Jung1.396811.20923
Dongnae0.574510.69304Nam0.828560.98015
Busanjin0.897270.96526
Upper group (10 gus (or guns) with large index values, orange shading), lower group (10 gus (or guns) with smaller index values, blue shading). LiRS = low-income residential segregation, LQ = location quotient.
Table 6. Basic statistics of two group in PSM.
VariablesControl groupTreatment Group
ObservationMeanStd. Dev.ObservationMeanStd. Dev.
Average residential segregation index5290.4341980.1106821810.4030910.099859
Rental apartments529149.7278404.9609181180.9613533.4318
General apartment529376.1607939.4394181408.2928816.6966
Average selling price529309,268.5202,479.5181458,088.6319,928.9
Average rental price5292558.181218.8151813498.2641662.985
Green space per person529190.5873358.789918188.34387190.707
Table 7. Changes in the homogeneity of the control and treatment groups.
Variables(Un)
Matched
Mean%
Bias
%
Reduct |Bias|
t-TestV(T)
/V(C)
Control GroupTreatment Grouptp > |t|
Rental apartmentU180.96149.736.6 0.820.4111.74 *
M180.96202.06−4.532.4−0.370.7150.89
General apartmentU408.29376.163.7 0.410.6820.76
M408.29512.94−11.9−225.7−0.980.3280.48 *
Average rental priceU3498.32558.264.5 8.110.0001.86 *
M3498.33388.17.688.30.650.5161.13
Average sales priceU460,000310,00055.6 7.260.0002.50 *
M460,000410,00017.269.11.590.1132.07 *
Green space per personU88.344190.59−35.6 −3.660.0000.28 *
M88.34485.0461.196.80.170.8671.08 *
* If the variance ratio is outside [0.75, 1.34] for U and [0.75, 1.34] for M.
Table 8. Effect of redevelopment on low-income residential segregation.
StatusTreatedControlsDifferenceS.E.T-Stat
Unmatched0.4030904540.434197681−0.0311072270.00930296−3.34
ATT0.4030904540.431952413−0.0288619580.013362742−2.16
ATU0.4341976810.418813721−0.01538396
ATE −0.018819901
ATT = average treatment effect on the treated, ATU = average treatment effect on the untreated, ATE = average treatment effect.
Disclaimer/Publisher’s Note: The statements, opinions and data contained in all publications are solely those of the individual author(s) and contributor(s) and not of MDPI and/or the editor(s). MDPI and/or the editor(s) disclaim responsibility for any injury to people or property resulting from any ideas, methods, instructions or products referred to in the content.

