Article

A Comprehensive Approach to Identifying the Supply and Demand of Urban Park Cultural Ecosystem Services in the Megalopolis Area of Shanghai, China

1
School of Arts, Qingdao Agricultural University, Qingdao 266000, China
2
Department of Design, Shanghai Academy of Fine Arts, Shanghai University, Shanghai 200444, China
3
School of Architecture, Planning and Environmental Policy, University College Dublin, D14 E099 Dublin, Ireland
4
College of Architecture and Urban Planning, Tongji University, Shanghai 200092, China
*
Authors to whom correspondence should be addressed.
Land 2025, 14(3), 455; https://doi.org/10.3390/land14030455
Submission received: 25 January 2025 / Revised: 11 February 2025 / Accepted: 20 February 2025 / Published: 22 February 2025

Abstract

:
Urban parks are vital public spaces that provide cultural ecosystem services (CESs) that enhance the well-being of city dwellers. As the demand for CESs has greatly increased, the imbalance between CES supply and demand has become prominent. Accurately identifying whether the supply of CESs meets the demand supports urban park planning and management. However, the CES supply–demand gap lies not only in the quantitative resource deficits, but also in the spatial mismatch between supply and demand. At present, scientific quantification methods for urban park CES supply and demand that comprehensively consider both quantitative and spatial relationships remain inadequate. To fill this gap, we propose an integrated framework that combines spatial and quantitative analysis to identify the supply and demand of urban park CESs, using Shanghai as the study area. The framework consists of three major steps: (1) mapping the CES supply and demand of urban parks; (2) identifying the CES supply–demand relationship by combining quantitative analysis through bivariate mapping with spatial analysis using spatial statistics; (3) categorizing the supply–demand relationship into four scenarios based on quantity balance and spatial matching, with three corresponding planning proposals. The results show that 136 sub-districts belong to the quantity balance and space matching type, while 79 sub-districts belonging to the imbalanced quantities type, including 41 belonging to the quantity imbalance and space mismatching type. Notably, only 15 sub-districts face a situation where supply is less than demand. Our findings provide a solid basis for identifying key areas of CES supply–demand conflict and prioritizing targeted planning interventions. This approach not only improves the efficiency of CES provision, but also addresses the growing demand for high-quality CESs in rapidly urbanizing regions.

1. Introduction

Urban parks are the most important natural spaces in cities and contribute significantly to the well-being and quality of life of residents [1]. The ecological and social benefits of urban parks that mitigate environmental problems and improve living standards can be considered as ecosystem services (ESs) [2,3]. These services can be categorized as regulating services (e.g., noise pollution control [4] and cooling [5,6]), cultural services (e.g., aesthetic landscape values [7,8] and recreational activities [9]), and a limited number of provisioning services (e.g., biodiversity conservation [10]). With the development of society and the increasing spiritual needs of residents, urban parks provide spaces for people to relax, communicate, meditate, and participate in political and social activities [11,12]. Moreover, these parks foster social cohesion by creating opportunities for social interaction, thereby shaping collective identity and memory, and ultimately contributing to the identity of the city [13]. The profound CESs of urban parks are gradually being recognized, and are increasingly valued by people. As a result, CESs are increasingly becoming the primary function of the urban park system.
However, despite the importance of CESs to residents, it is challenging to explicitly address them, due to their intangibility and reliance on human perception [14,15]. This makes it difficult to fully exploit their benefits in urban environments. In the context of compact urban development, where land is scarce and valuable, the construction of urban parks has not been prioritized [16]. Urban expansion and changes in land use have led to the fragmentation and compaction of urban park green spaces, resulting in a significant shortage of urban parks. As a result, the CESs of urban parks are often overlooked, and are one of the least spatially mapped ES categories [17].
Meanwhile, the high-density, high-intensity, and high-speed process of urbanization has led to the rapid growth of urban populations and an ever-increasing demand for a better quality of life [18]. As a result, the contradiction between supply and demand in spatial distribution has become prominent in many cities [19]. To address this issue, it is essential to accurately assess the supply–demand relationship of CESs provided by urban parks, thereby enabling scientific planning and management of these spaces [20].
Interest in understanding the supply and demand of CESs provided by parks has received considerable attention in urban research [21,22,23]. When assessing CESs, the majority of studies have primarily focused on quantitative differences, with related research focusing on budget [24,25], gap [11,26], and balance [27,28,29]. However, when it comes to guiding resource allocation, the results of such quantitative analyses lack persuasiveness and practicality, due to a critical oversight in the quantitative assessment of supply and demand [30,31]. This oversight concerns an important aspect of urban development: the cumulative and continuous nature of urban growth during rapid urbanization, which leads to regional imbalances in the construction of urban parks [32]. Residential activities are concentrated in densely populated urban spaces, while large urban parks are often located on the outskirts of central urban areas, which have lower population densities and better ecological environments, resulting in a spatial mismatch between the supply and demand areas of CESs provided by urban parks [33,34].
Current research on the spatial analysis of CES supply and demand is usually determined by expert evaluations [35,36] and the calculation of spatial indicators [37]. However, there is still a debate about the accuracy and reliability of expert-based evaluation in CES mapping, due to the limitation of not capturing the high spatial heterogeneity of CES demand [38]. When using the spatial indicator calculation method, which is not constrained by either the scale or the complexity of the model operation, attention should be paid to the comparability of dimensions at the supply and demand levels of CESs [39]. In this assessment method, it is common practice is to standardize or grade the spatial distribution of CES supply and demand across different units through spatial overlay analysis. In particular, for the scientific layout and optimization of urban parks, it is essential to consider both the quantitative and spatial dimensions of CES supply and demand for urban parks [40].
As the development of urban parks has not been a priority in China, especially during the rapid urbanization process, it is particularly important to assess their CESs [21,41]. The construction of urban parks in Shanghai started relatively early, and has sophisticated planning concepts. The first urban park in modern Chinese history was born in Shanghai, which can, to some extent, reflect the evolutionary process of urban parks in China [42]. Meanwhile, Shanghai has a highly developed economy and an extremely high population density, and the contradiction between the supply and demand of CESs has become increasingly apparent [43]. Given its superior location conditions, special historical background, and severe imbalance between supply and demand, research on Shanghai’s urban parks is of great significance.
In this study, we propose an integrated framework to comprehensively identify the relationship between the CES supply and demand of urban parks. By using Shanghai city as a case study area, this research contributes in three crucial aspects related to CESs of urban parks. First, we mapped the CES supply and demand of urban parks using an integrated spatial quantitative index system based on ecological and socio-economic indicators, as well as multi-source data. Second, we identified the relationship of CES supply and demand by combining quantitative analysis through bivariate mapping with spatial analysis using spatial statistics. Third, we categorized the supply–demand relationship into four scenarios and proposed optimal proposals.

2. Material and Methods
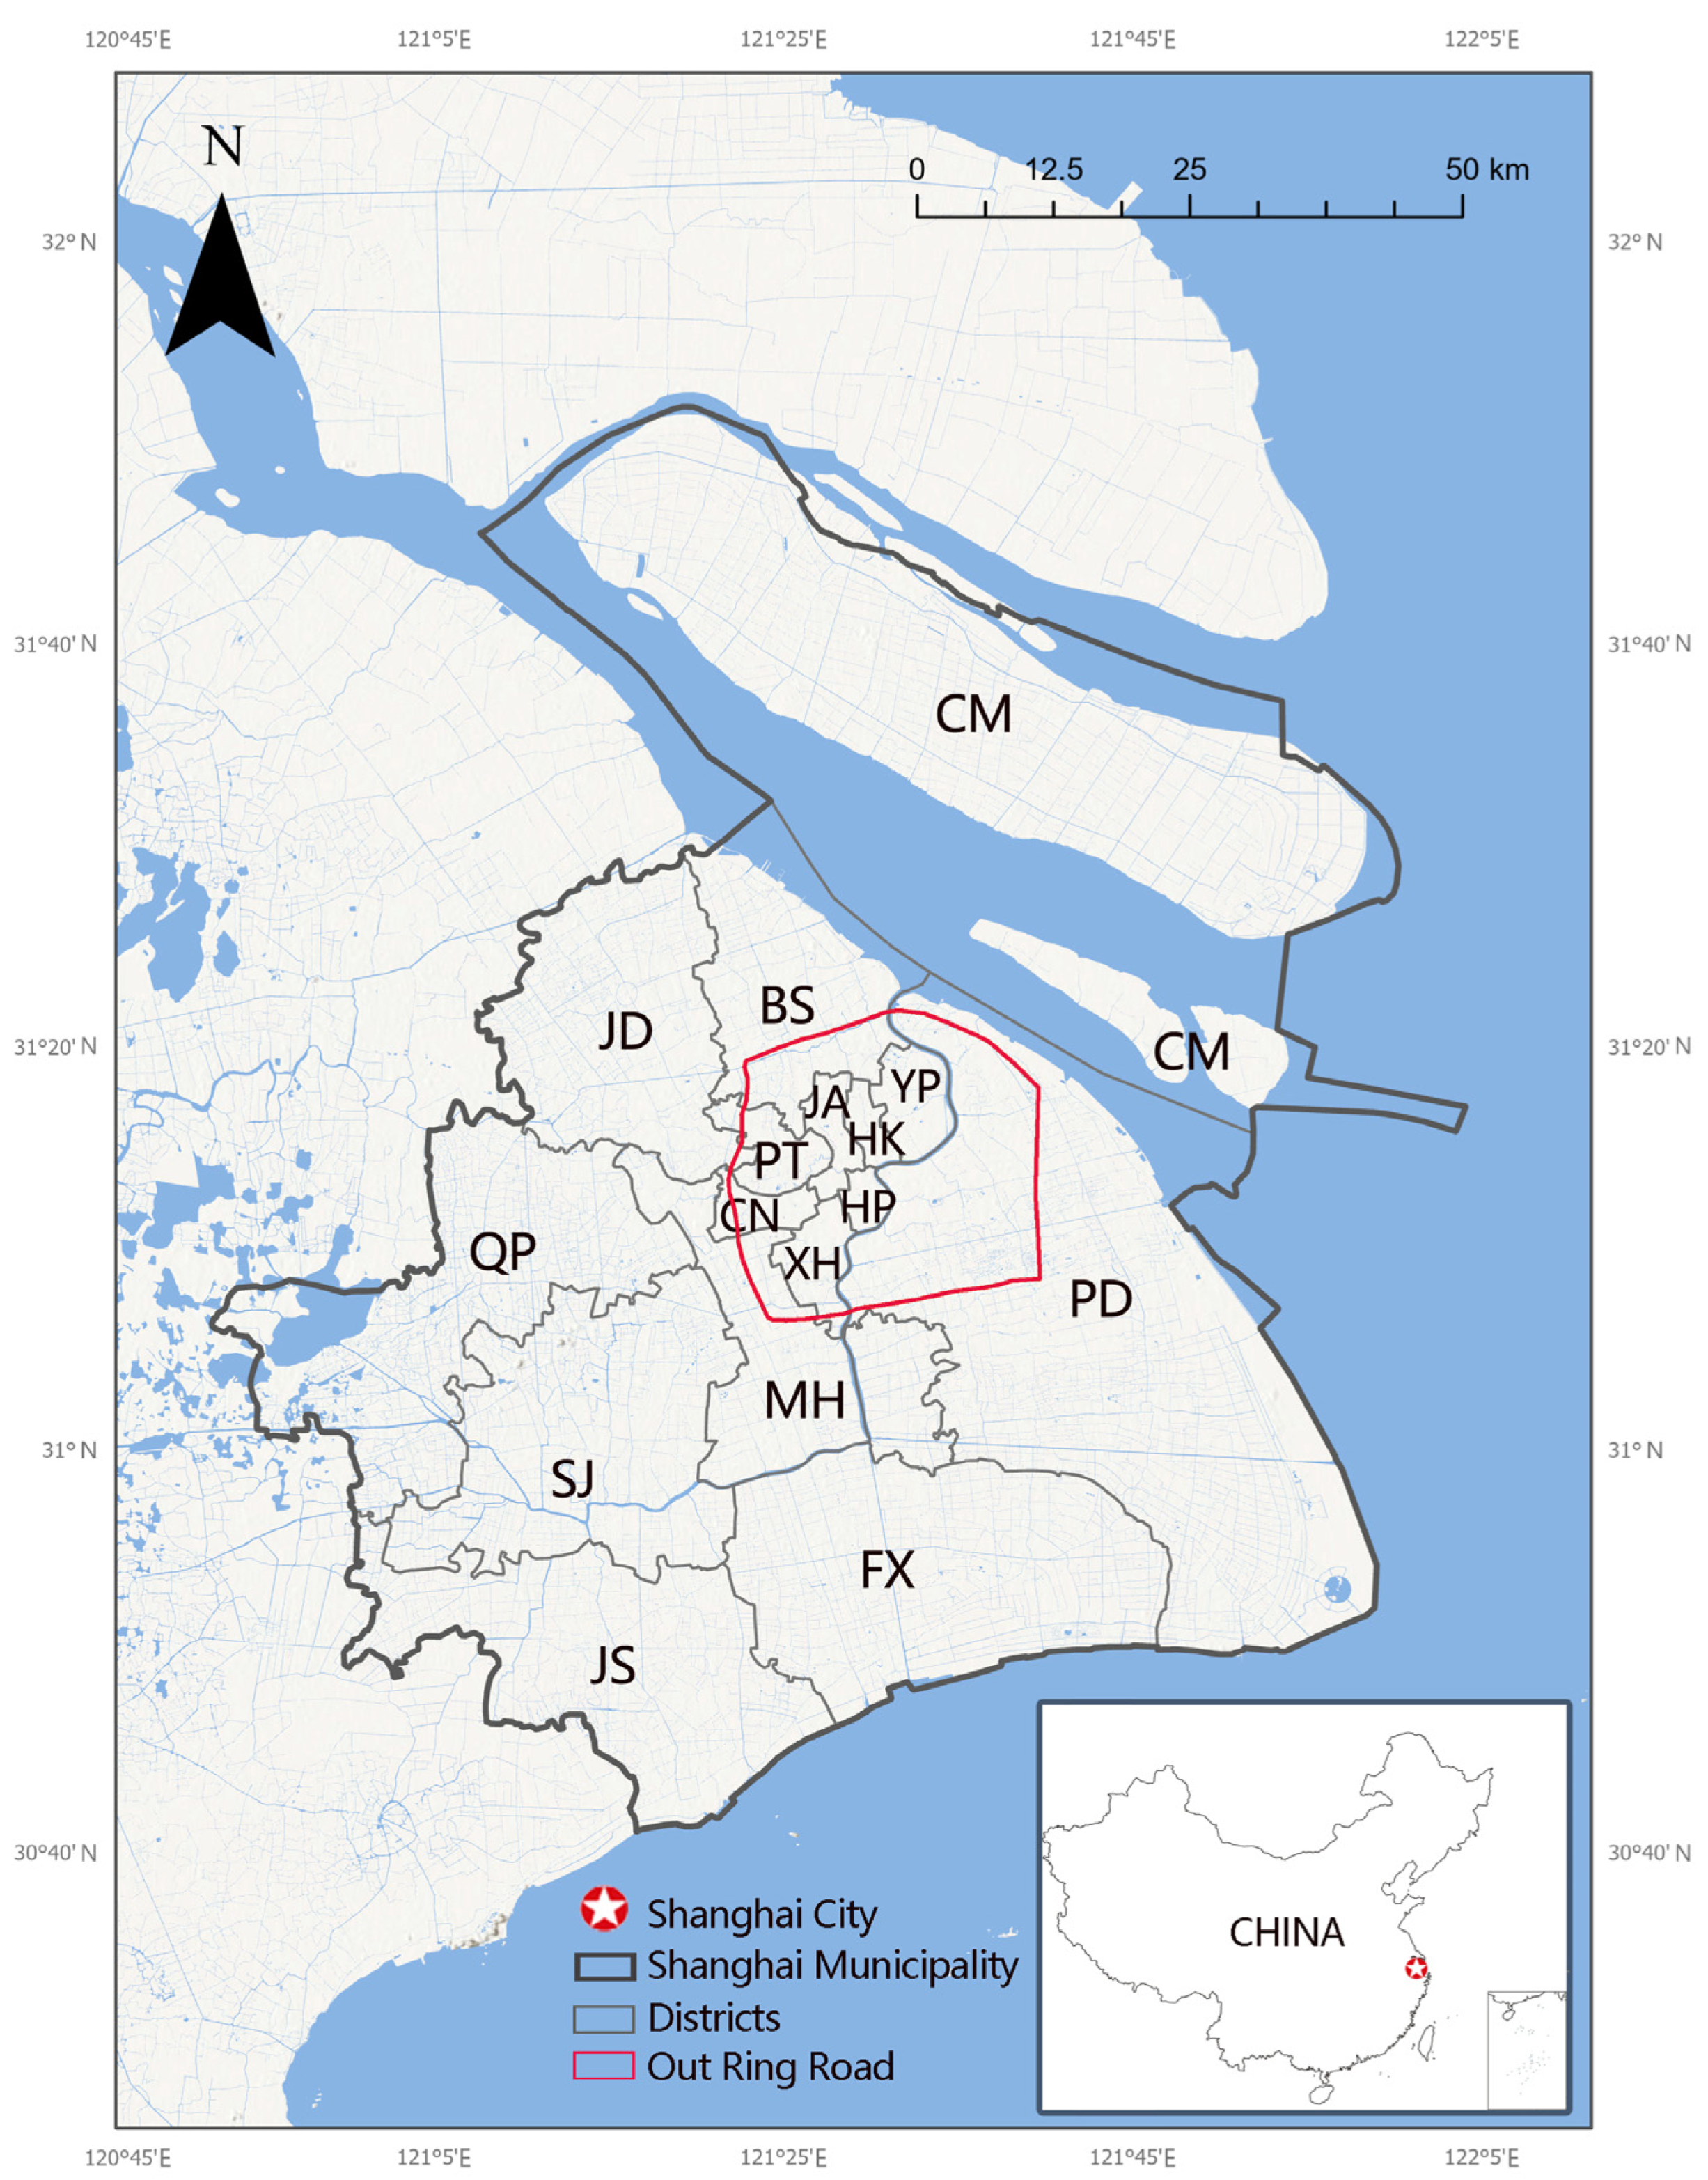
2.1. Study Area

Shanghai is located at the estuary of the Yangtze River, covering an area of 6340 km2 with a built-up area of 1237.85 km2, lying between longitudes 120°52′ E and 122°12′ E and latitudes 30°40′ N and 31°53′ N (Figure 1).
Shanghai has been developed into a modern metropolis that integrates economy, finance, trade, shipping, technological innovation, and culture. It has a population of 24 million and a GDP of 3.87 trillion CNY. There are 16 districts in Shanghai, with a total of 108 sub-districts, 106 towns, and 2 townships. According to China’s three-tier administrative division system, sub-districts mainly focus on urban district management and services. Towns have a more comprehensive function in economic development, infrastructure construction, and social affairs in rural–urban fringe areas and suburbs. The few townships also have their own characteristics in agricultural production and rural affairs management. During the rapid urbanization process in Shanghai, the three-tier administrative divisions have become indistinguishable, just as is the case in many existing urban studies in China [34]. For simplicity and clarity, we use “sub-district” in the following sections. Central Shanghai is mainly within the Outer Ring Road, which consists of 11 districts: seven complete districts (i.e., Huangpu, Xuhui, Changning, Jing’an, Putuo, Hongkou, Yangpu) and four parts of specific districts (i.e., Pudong, Minhang, Baoshan, and Jiading). There are also five outer suburban districts (i.e., Chongming, Fengxian, Jinshan, Songjiang, and Qingpu).

2.2. Data

This research involved the integration of multi-source data, such as remote sensing datasets, statistical datasets, survey datasets, and open datasets, to subsequently produce the mapping of CES supply and demand.
(1) Statistical datasets: (1) A total of 304 parks (Figure 2) were used for the assessment, which were divided into four types: comprehensive parks (41), theme parks (18), community parks (221), and pocket parks (24) (Table 1). The distribution of urban parks in Shanghai was obtained from the Shanghai Landscape and City Appearance Administrative Bureau (https://lhsr.sh.gov.cn/ (accessed on 1 September 2019)). The locations of all the parks were extracted from open maps, with their boundaries interpreted visually by a high-resolution Google Earth image. (2) The population data of Shanghai in 2019 were obtained from the Shanghai Bureau of Statistics and the Sixth National Population Census. Before the estimation, all the information was digitized in a geographic information system (GIS).
(2) Remote sensing datasets: The boundaries of all the parks in Shanghai were obtained by interpreting Landsat 8 OLI_TIRS satellite imagery at 10 m resolution in September 2019. The data were obtained from the USGS Data Center (https://glovis.usgs.gov/ (accessed on 1 September 2019)). This served as the primary data source to obtain the biophysical metrics of the parks, such as the water area ratio, grassland area ratio, and naturalness index.
(3) Survey datasets: The number of cultural and educational activities was obtained from the Shanghai Landscape and City Appearance Administrative Bureau (https://lhsr.sh.gov.cn/ (accessed on 1 May 2019)).
(4) Open datasets: (1) The boundaries of Shanghai and the districts were obtained from the National Platform for Common GeoSpatial Information Services (https://www.tianditu.gov.cn/ (accessed on 1 May 2019)). (2) The street map was obtained from Open Street Map (www.openstreetmap.org (accessed on 1 September 2019)). (3) Transportation infrastructure data were obtained from open maps (https://lbsyun.baidu.com/ (accessed on 1 September 2019)) to extract the location of subway stations, bus stations, and parking lots. (4) Points of interest (POIs) were obtained from Baidu Open Maps (https://lbsyun.baidu.com/ (accessed on 1 September 2019)). (5) The environmental quality score of urban parks was obtained from the Dianping website (https://www.dianping.com (accessed on 1 May 2019)).

3. Methods

The proposed framework was divided into three subsections: mapping of CES supply and demand (Section 3.1), comprehensive analysis of the CES supply and demand combining quantitative analysis and spatial analysis (Section 3.2), identification of four supply–demand scenarios (Section 3.3), and provision of planning proposals (Figure 3).

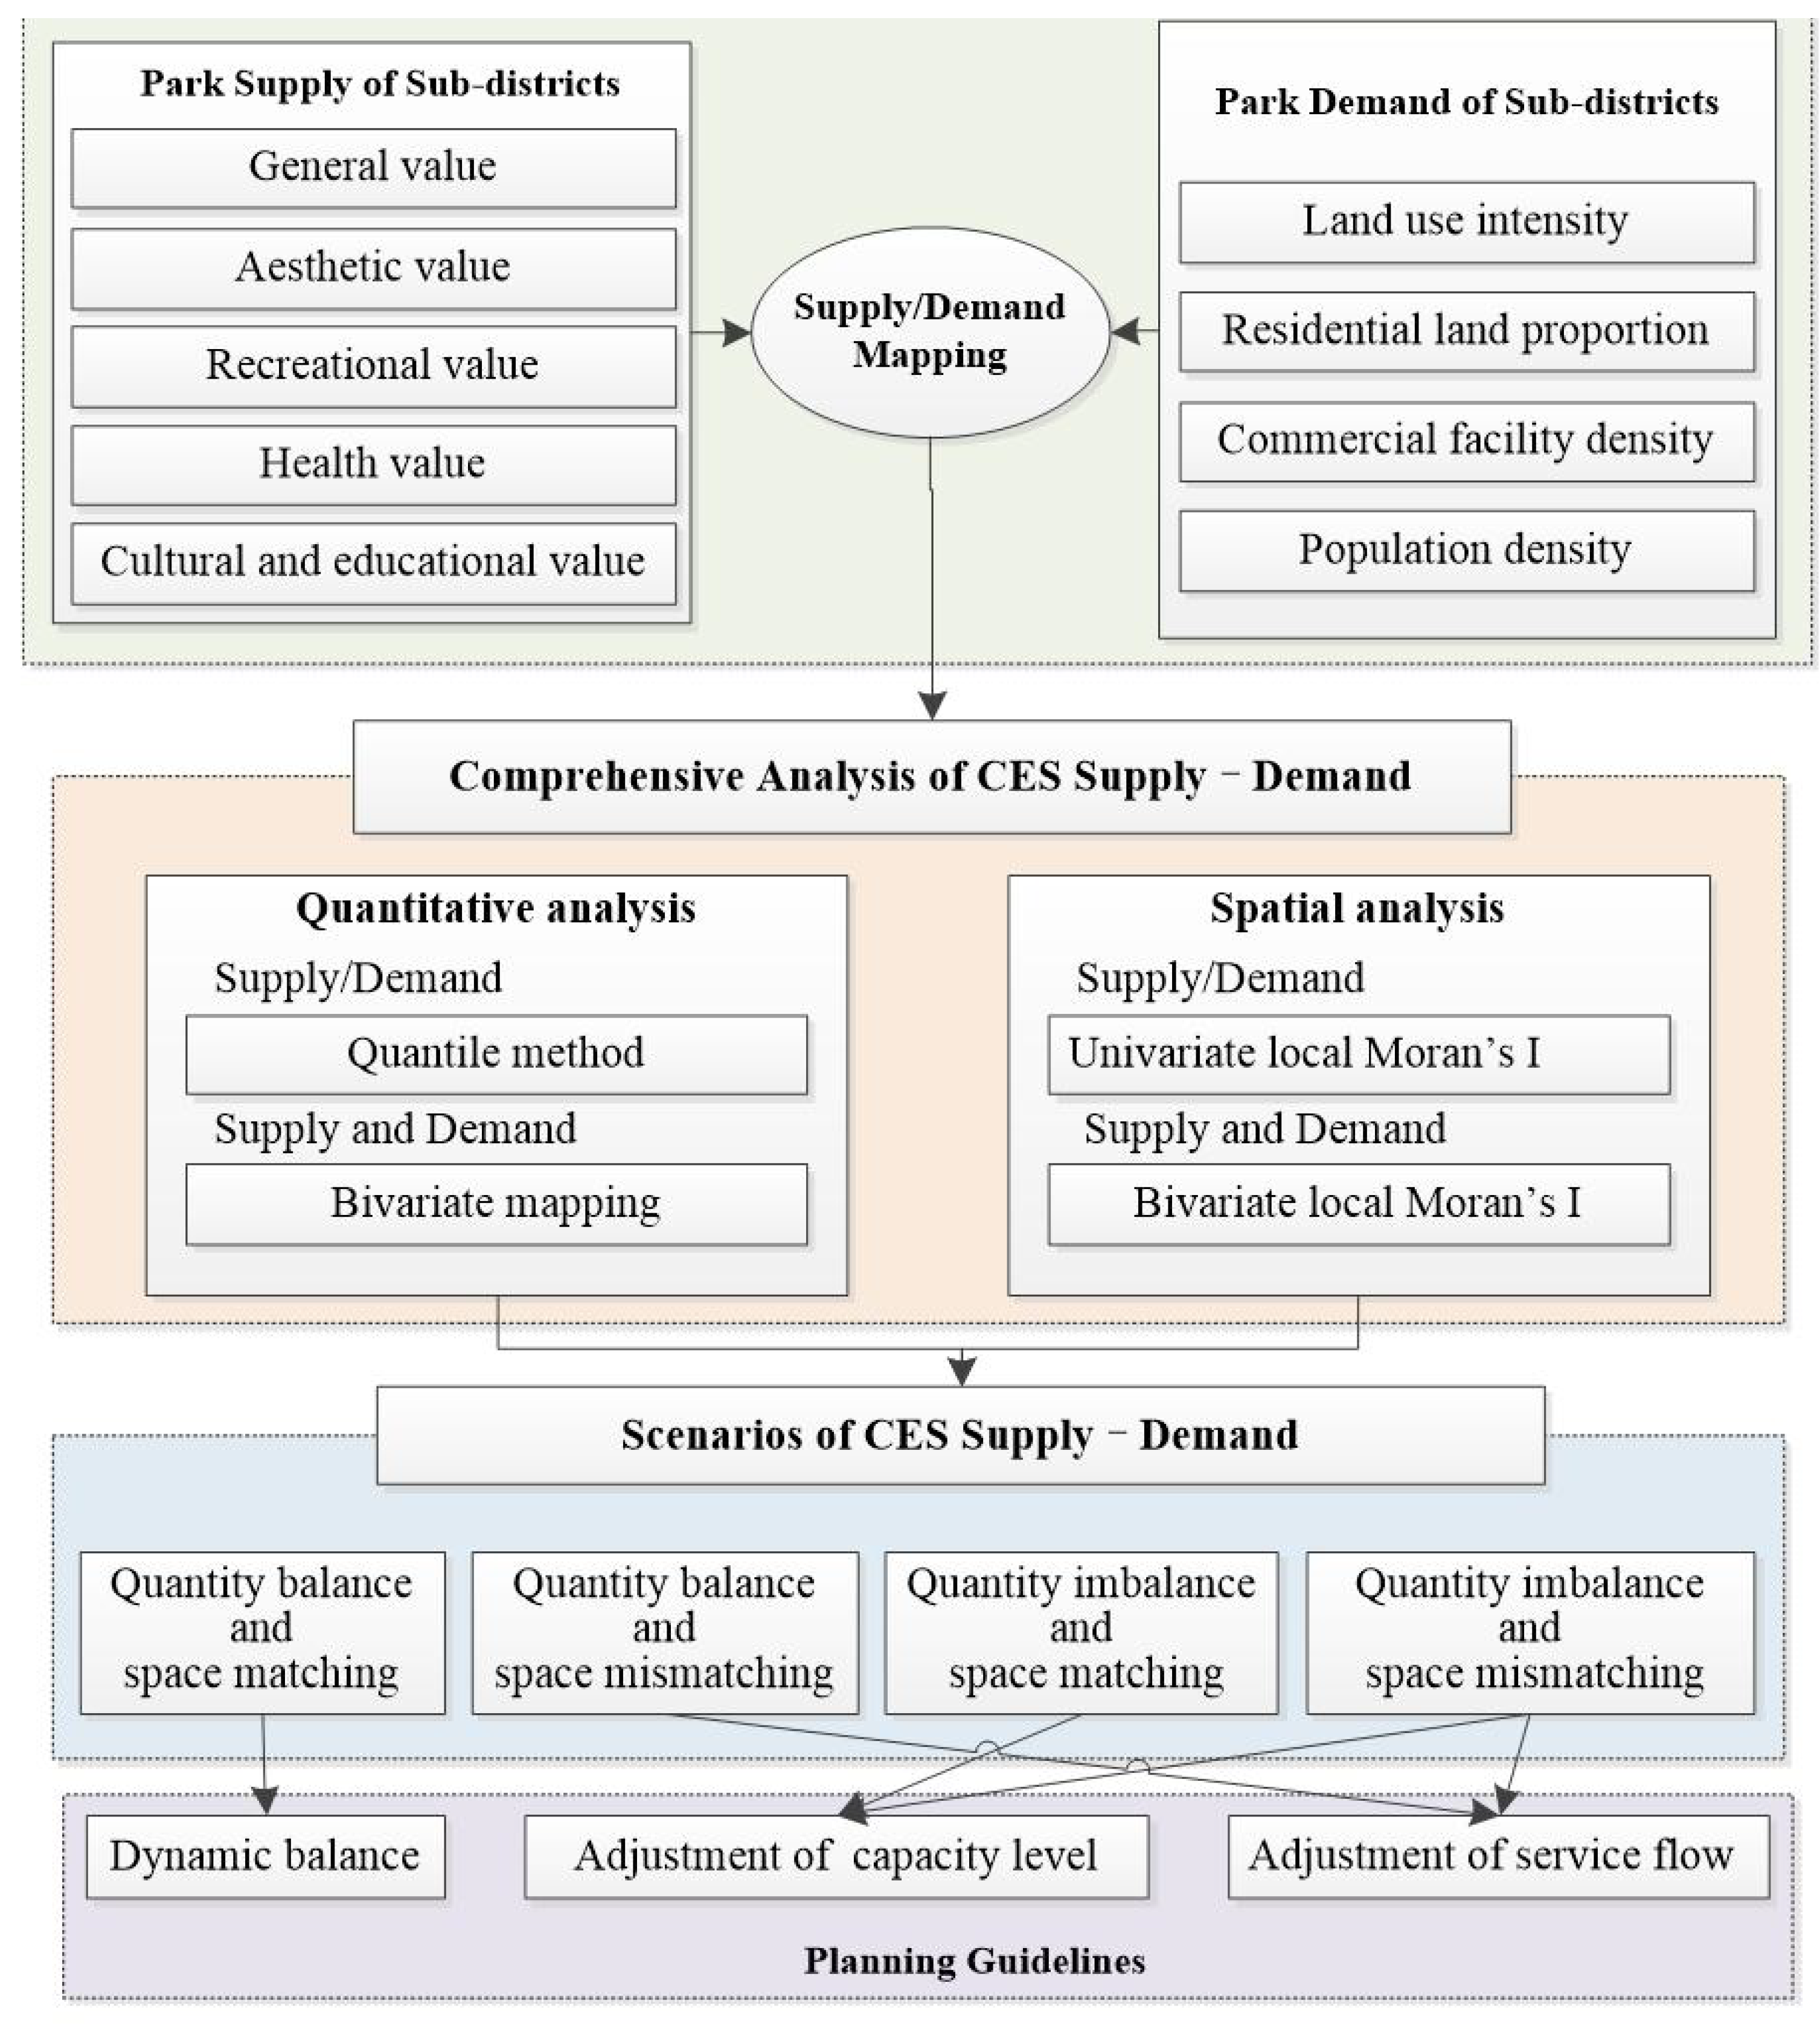
3.1. Mapping the CES Supply and Demand of Urban Parks

3.1.1. Supply

The supply of CESs can be effectively characterized by comprehensively considering the integrated configuration within parks, rather than simply focusing on the differences between different vegetation community types.
On the supply side, some certain studies have proposed a holistic representation of the supply capacity of CESs within urban parks, which is the general value of urban parks that includes three dimensions [44,45]: the availability, which reflects the ability to meet the needs of residents; the accessibility, which means the convenience for residents to reach the parks; and the attractiveness, which reflects the intensity of residents’ willingness to visit the parks.
General Value. The three categories of general value variables included seven characteristics of urban parks (Table 2). Because each variable was expressed in different units, we had to perform a standardization process on the raw indicators before calculating the value. The raw indicators were standardized as follows:
S i = X i X m i n X m a x X m i n × 100 , S i 0 ; 100
where S i is the standardized indicator of the i-th unit, X i is a partial indicator of the i-th unit, and X m a x and X m i n refer to the minimum and maximum values of a given indicator for all units.
The general value of urban parks is calculated as follows:
S G = A V A + A C C + A T T
where AVA, ACC, and ATT are the availability, accessibility, and attractiveness of urban parks in sub-districts, respectively.
In addition to the general factors that influence the CES supply, specific park characteristics also influence various cultural values that are of particular value. Currently, assessments of CESs in urban parks focus primarily on single types of services, with particular emphasis on recreational and aesthetic values. Comprehensive assessments that include multiple types of CES are relatively rare. Perceptions of CES are complex; emphasizing only one or a few services may compromise the accuracy of the overall assessment of CESs, thereby making it difficult for the assessment results to effectively guide the planning and management of urban parks. In this study, the effect mechanism of urban parks in realizing the special value of CESs was summarized as 4 approaches: (1) physical activity promotion, which promotes health value; (2) social cohesion promotion, which promotes recreation value; (3) cultural knowledge learning, which promotes education value; and (4) aesthetic experience, which promotes aesthetic value.
Aesthetic Value (AV). In this study, two representative variables were used to describe the landscape aesthetics of urban parks, including (1) openness: the amount of space that can be perceived by residents [46], which is measured by dividing the sum of grassland, waterbody area, and squares in urban parks by the area of urban parks; and (2) naturalness: the naturalness of each park is assessed by dividing the total area of forest, wetland, water body, and grassland by the area of urban parks [47].
Recreational Value (RV). (1) Recreation facility richness: the number of recreation facility POIs, including recreation sites, amusement parks, fishing parks, picking gardens, camping sites, and water activity centers, etc. (2) Popularity: the number of POIs of characteristic scenic spots with relatively high popularity, including national-level scenic spots, tourist attractions, provincial-level scenic spots, world heritage sites, etc.
Health Value (HV). (1) Sports area, which reflects the sports service level of urban parks, and can be obtained by counting the areas of park paths, paved areas, and sports facilities within the park. (2) Sports facility richness: the number of POIs of sports service facilities in the urban park, including comprehensive gymnasiums, tennis courts, basketball courts, soccer fields, skating rinks, etc.
Cultural and Educational Value (CEV). (1) Activity number, which refers to the number of cultural activities, such as cultural popularization, exhibitions, and educational popularization, organized in urban parks. (2) Scenic spots number, which refers to the number of memorable scenic spot POIs with human historical value within the park, including red tourist attractions, mosques, memorial halls, churches, world heritage sites, temples, and Taoist temples.
The special value of urban parks was calculated as follows:
S S = A V j   +   R V j   +   H V j   +   C E V j D i j 2 j = 1 n A V j   +   R V j   +   H V j   +   C E V j D i j 2
where   S S is the special value of the CES supply of urban parks, A V j is the aesthetic value of park j, R V j is the recreational value of park j, H V j is the health value of park j, A C E V j is the cultural and educational value of park j, Dij is the Euclidean distance between the centroid of the unit and the centroid of unit j, and n is the number of all parks j.
The CES supply of urban parks was calculated as follows:
S = S G × 1 A A p = 1 n   S p s S S
where S p s is the total area of the urban park service radius, and A A is the area of the sub-district where the park is located.

3.1.2. Demand

On the demand side, urban parks, as public service facilities, have undergone a change in their spatial distribution, shifting from an emphasis on “land equity” to “human equity”. However, the current evaluation indicators still prioritize regional equity and spatial equity, neglecting user considerations, which hinders the balanced distribution of parks. Therefore, we have incorporated user needs and introduced economic and social indicators to evaluate the level of residents’ demand for parks. The CES demand in this study is the number of potential CESs that human society can obtain or hope to obtain [35,48].
Based on the influencing factors of CES demand, four indicators were selected to reflect the beneficiaries of the sub-district, including land use intensity (LUI), residential land proportion (RLP), commercial facility density (CFD), and population density (PD) [9,31,49,50,51,52]. We used the logarithmic transformation method to deal with the large fluctuations in population density and commercial facility density between different sub-districts in Shanghai [38]. The total CES demand of urban parks was calculated as follows:
D = l g P D j × L U I j × R L P j × l g C F D j
where D   represents the potential demand for CESs of the sub-district; and PD is the population density of sub-district j, which is expressed as the number of people per square kilometer, and directly reflects the quantitative demand of residents for parks. LUI is the percentage of the total area that is built-up land area, which reflects the intensity of CES consumption by humans. The higher the LUI in a land, the more parks are required to compensate its residents for the loss of a natural environment [21]. The residential land proportion refers to the percentage of the total built-up land area that is residential land area, which is used to indicate the preference of CES demand in the sub-district [52]. The CFD is determined by the density of commercial facility POIs: the location data of commercial facility POIs include restaurants, supermarkets, bars, coffee shops, business clubs, ATMs, banks, medical institutions, cinemas, gymnasiums, theaters, KTV etc.; a higher CFD indicates that these facilities can attract a high flow of people, leading to a greater potential for CES demand.

3.2. Quantitative Analysis and Spatial Analysis

3.2.1. Bivariate Analysis of CES Supply and Demand

Bivariate analysis is used to display two variables on a map by combining two different datasets [30,53]. The quantile method [54] was used to classify both supply and demand into three classes: high (H, >80%), medium (M, 20–80%), and low (L, <20%), which represent the level of supply capacity and the demand level, respectively. By mapping the interaction between the CES supply and demand, three types of supply–demand relationships emerged: supply exceeds demand (S > D); supply equals demand (S = D); and supply is less than demand (S < D).

3.2.2. Spatial Cluster Analysis of CES Supply and Demand

1.
Univariate Local Moran’s I
We used the univariate Local Moran’s I or a local indicator of spatial association [35,36,37,38,39,55] to analyze the spatial association of the urban parks CESs between the supply (demand) of a sub-district and its neighboring supply (demand). It is calculated as follows [56]:
I i = ( x i x ¯ ) S 2 j W i j ( x j x ¯ )
where x refers to the CES supply (or demand) of sub-district i and its neighboring sub-district j; S2 is the variance and x ¯ is the mean of the CES supply (or demand) across all sub-districts; and Wij is a spatial weight matrix that represents the spatial relationship between sub-district i and its neighboring sub-district j. In this study, we used the first-order Queen contiguity matrix, where Wij = 1 if sub-districts i and j share an edge or a common vertex, and it equals 0 otherwise. The local Moran’s I was calculated using the GeoDa software (1.22.0.8) (http://geodacenter.github.io (accessed on 1 September 2024). Four different types of LISA clusters were identified for CES supply (or demand) at the sub-district level. (1) High–High (H-H): a sub-district and its surroundings both had a high value. (2) High–Low (H-L): the value was high in a sub-district while low in its surroundings. (3) Low–High (L-H): a low-value sub-district was surrounded by neighbors with high-value surroundings. (4) Low–Low (L-L): a sub-district and its surrounding sub-district both had low values.
2.
Bivariate Local Moran’s I
Bivariate local Moran’s I (bi-LISA) was used to explore the spatial correlations between two spatial variables [56]. This method was employed to explore the spatial correlations of CES supply and demand for urban parks between a sub-district and its neighboring sub-district [21]. It was calculated as follows:
I B , i = Z x , i j = 1 . j i N W i , j Z y , j
where x is the CES supply of sub-district i, while y is the CES demand of its surrounding sub-district j; Wij is the spatial weight matrix, and has the same meaning as that in Equation (2); and Zx and Zy are the standardized z-scores of x and y, respectively.
Four different types of LISA clusters were identified for the CES supply and demand of the sub-district. (1) High Supply–High Demand (H-H) clusters represented a sub-district with a high supply and its surroundings also had a high demand value. (2) High Supply–Low Demand (H-L) clusters implied that the supply value in a sub-district was high, while the demand value in its surroundings was low. (3) Low Supply–High Demand (L-H) clusters indicated that a sub-district with a low supply value was surrounded by neighbors with a high demand value. (4) Low Supply–Low Demand (L-L) clusters indicated a that sub-district had a low supply value and its surrounding sub-district also had a low demand value.

3.3. Spatial Scenarios of CES Supply–Demand

We reclassified the sub-districts by overlaying the bivariate map and the bi-LISA map, which identified four spatial types of sub-districts [57]:
(I)
Quantity balance and space matching: includes areas where S = D and the spatial distribution is characterized by H-H or L-L. In these areas, the supply capacity and demand level are relatively consistent, so the dynamic equilibrium between supply and demand in changing environments needs to be further explored.
(II)
Quantity balance and space mismatching: includes areas where S = D, as well as areas where the spatial distribution is characterized by H-L or L-H. This region needs to optimize the distribution of supply and demand units, and adjust the CES flow of supply and demand to achieve a coordinated state.
(III)
Quantity imbalance and space matching: includes areas where S > D or S < D, as well as areas where spatial distribution is characterized by H-H or L-L. This region, which is mainly characterized by S < D, needs to increase its supply capacity while reducing the demand level in order to achieve coordination between supply and demand.
(IV)
Quantity imbalance and space mismatching: includes areas where S > D or S < D, as well as areas where the spatial distribution is characterized by H-L or L-H. This region needs to adjust both supply and demand levels and CES flow simultaneously.

4. Results

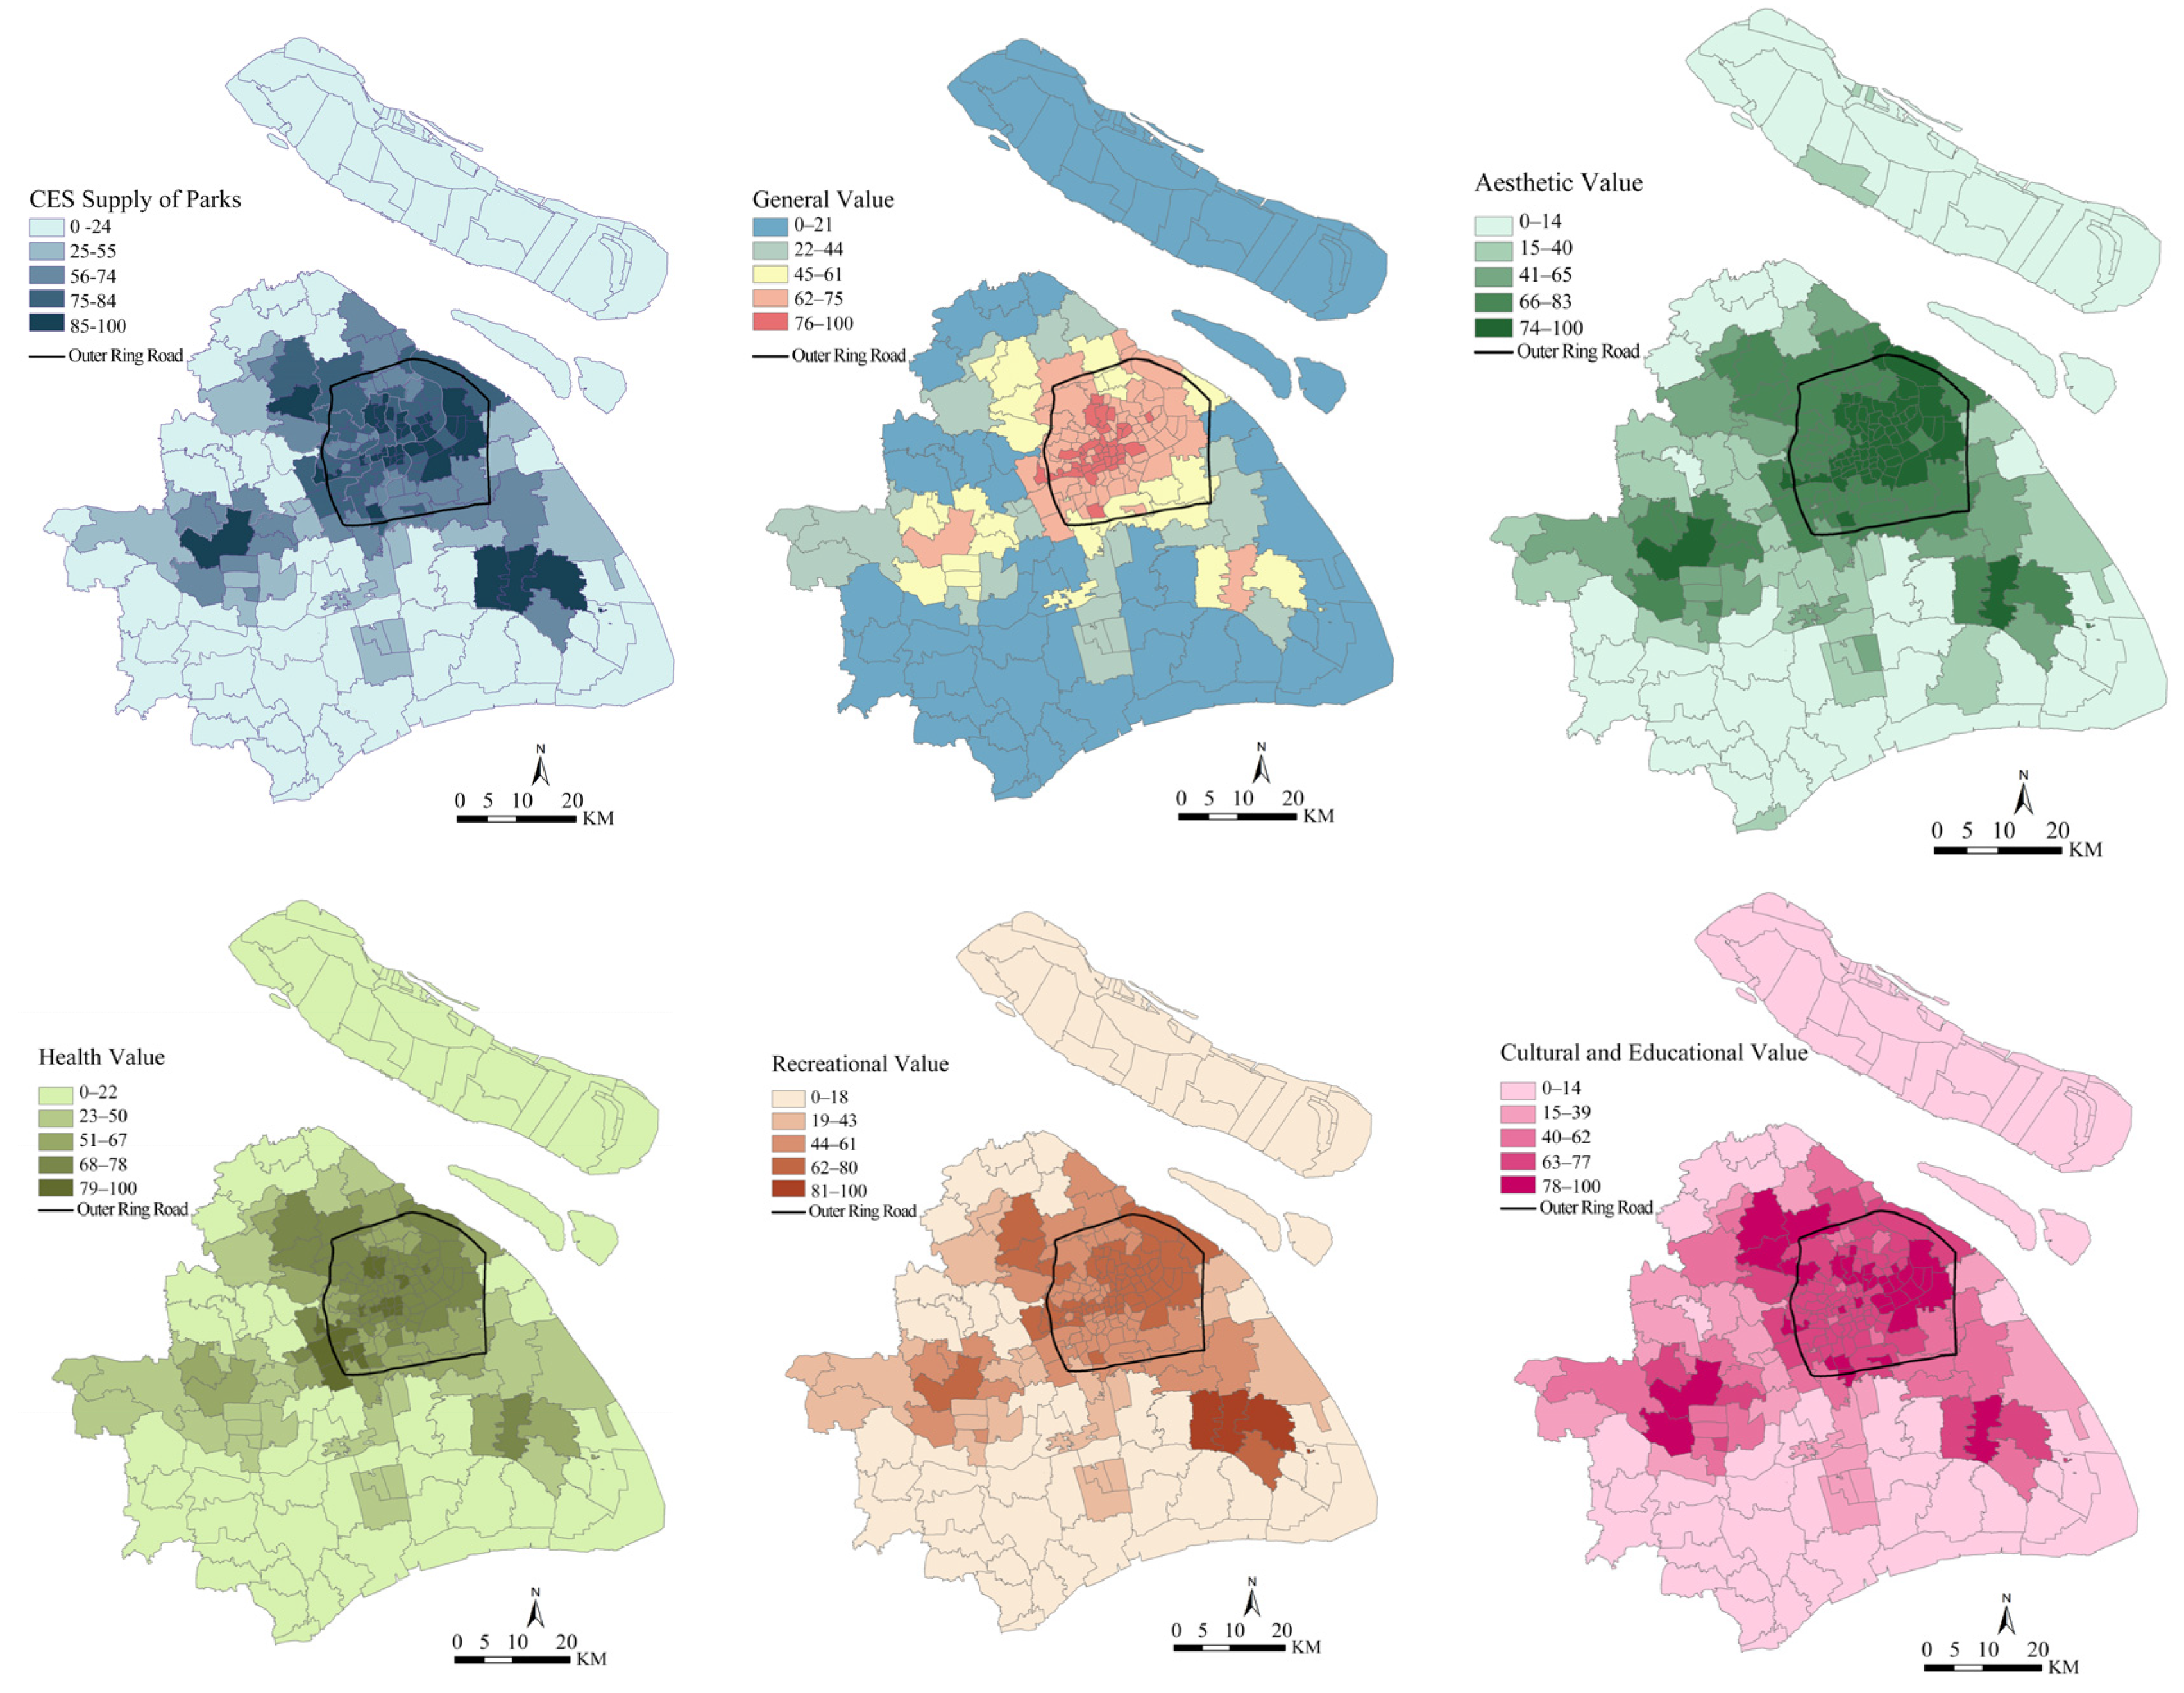
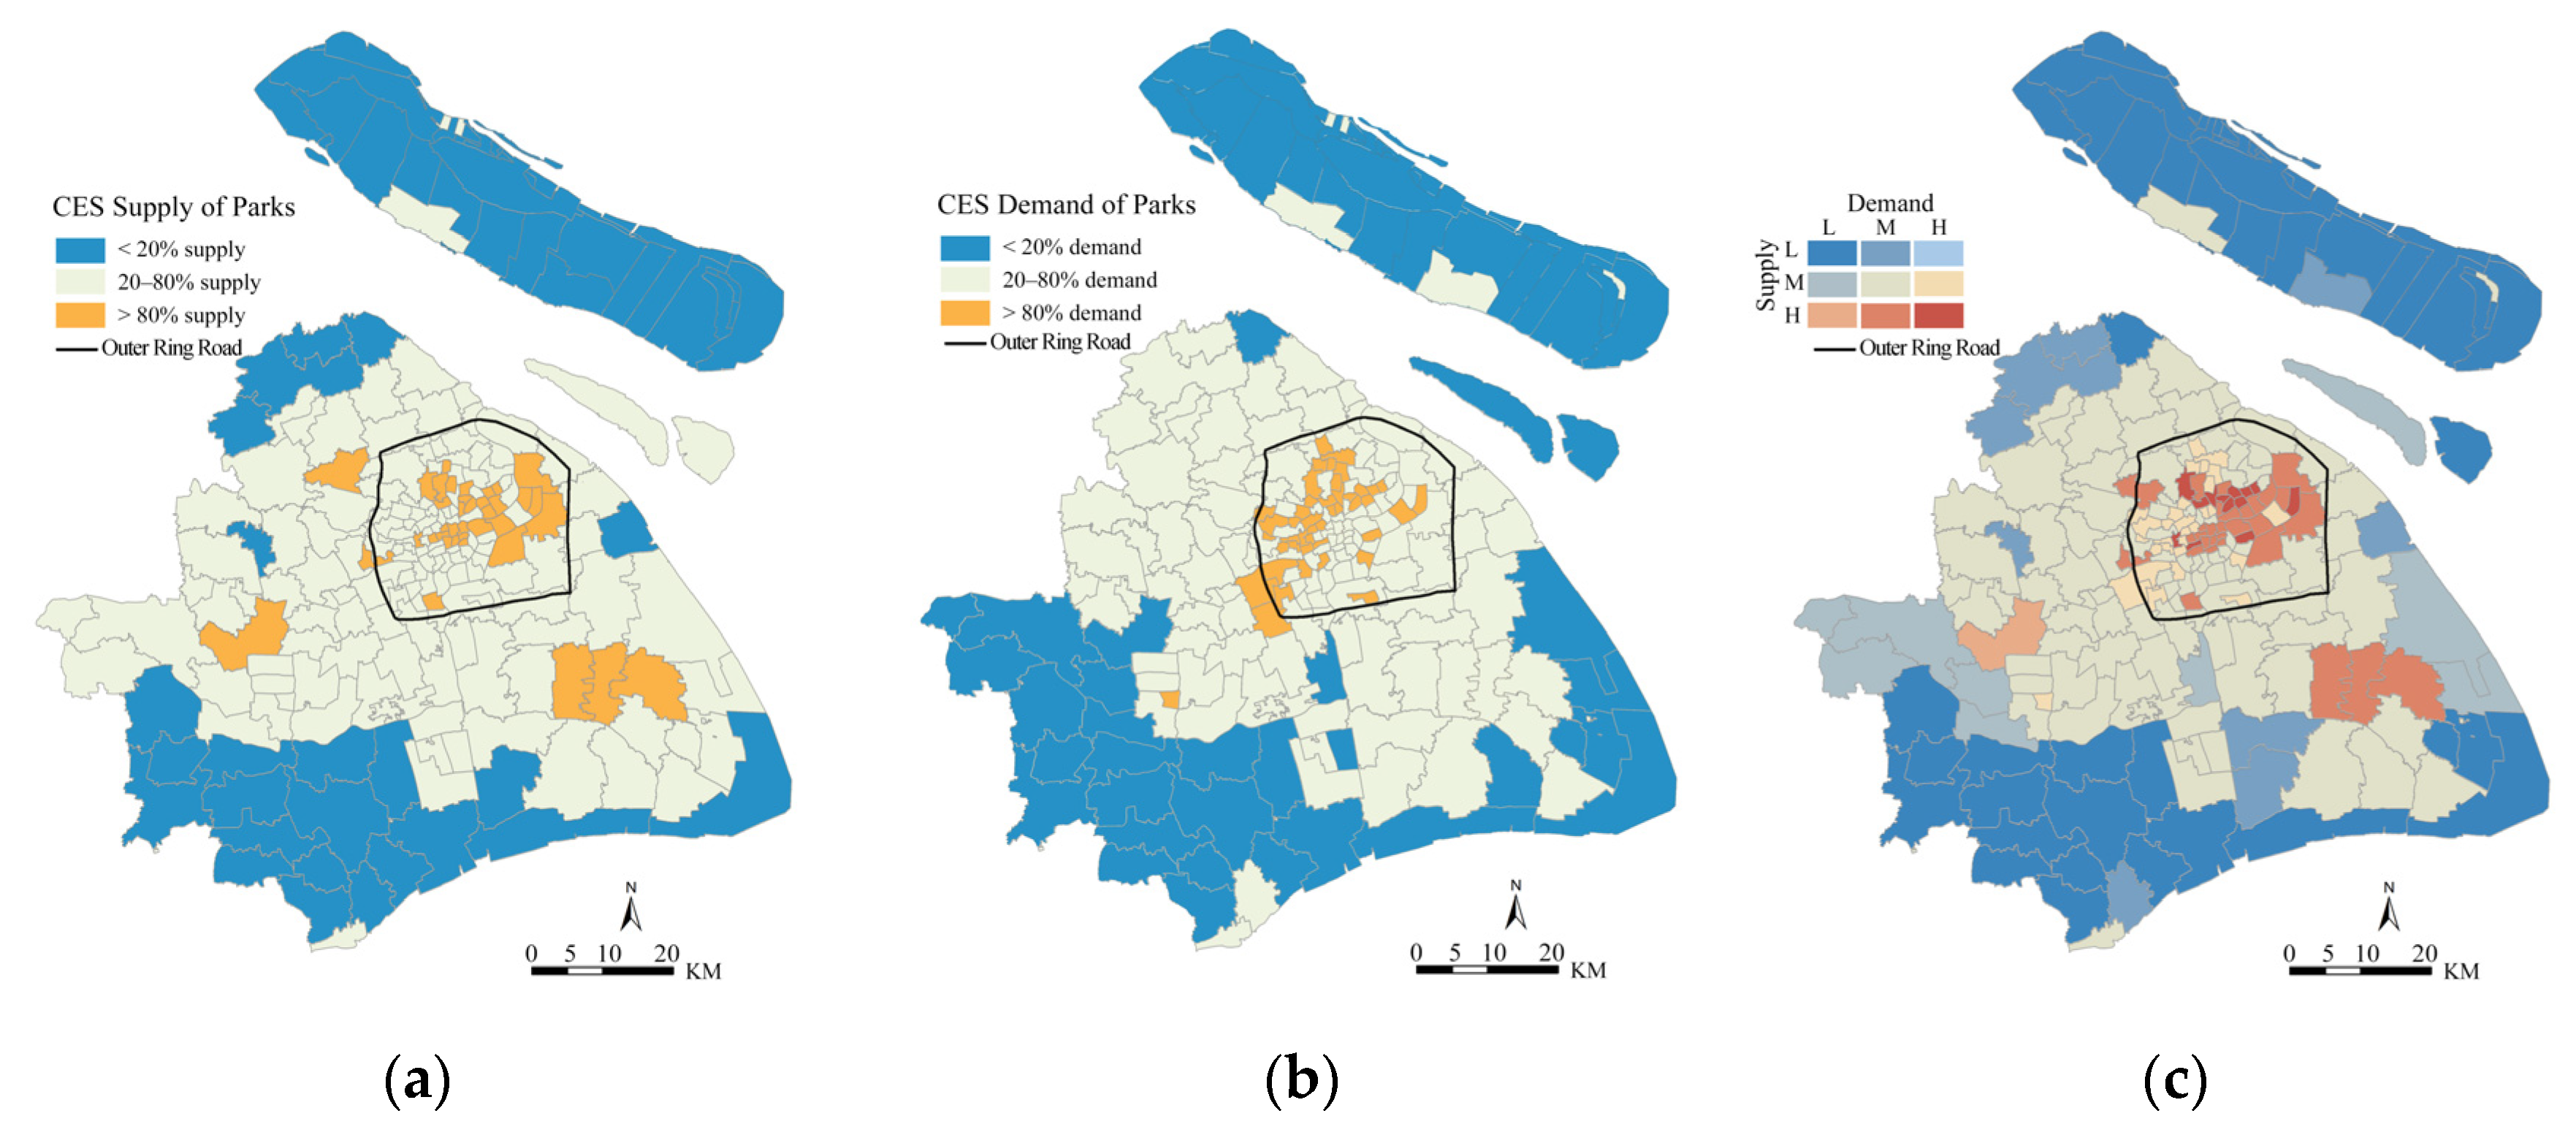
4.1. CES Supply and Demand of Urban Parks

4.1.1. CES Supply of Urban Parks

The CES supply of parks in Shanghai has a pronounced gradient distribution and multi-center characteristics, which are manifested as a gradual decline from the city center to the suburbs and a further decline to the outer suburbs, while also having small high-value centers in the inner suburbs, which is similar to the general value distribution (Figure 4). There are 95 sub-districts (44.19%) in the high-supply areas. Notably, the parks in this region occupy a significant area, accounting for 63.59% of Shanghai’s total park area (903.41 hm2), and large comprehensive parks are particularly prevalent here. Medium-supply sub-districts are distributed around urban centers and suburban areas, including 36 sub-districts, accounting for 16.74% of the total sub-districts. Low-supply sub-districts are mainly located in more outlying areas, such as Jinshan, Fengxian, Chongming, and northern Jiading, and account for 39.07% of all sub-districts.

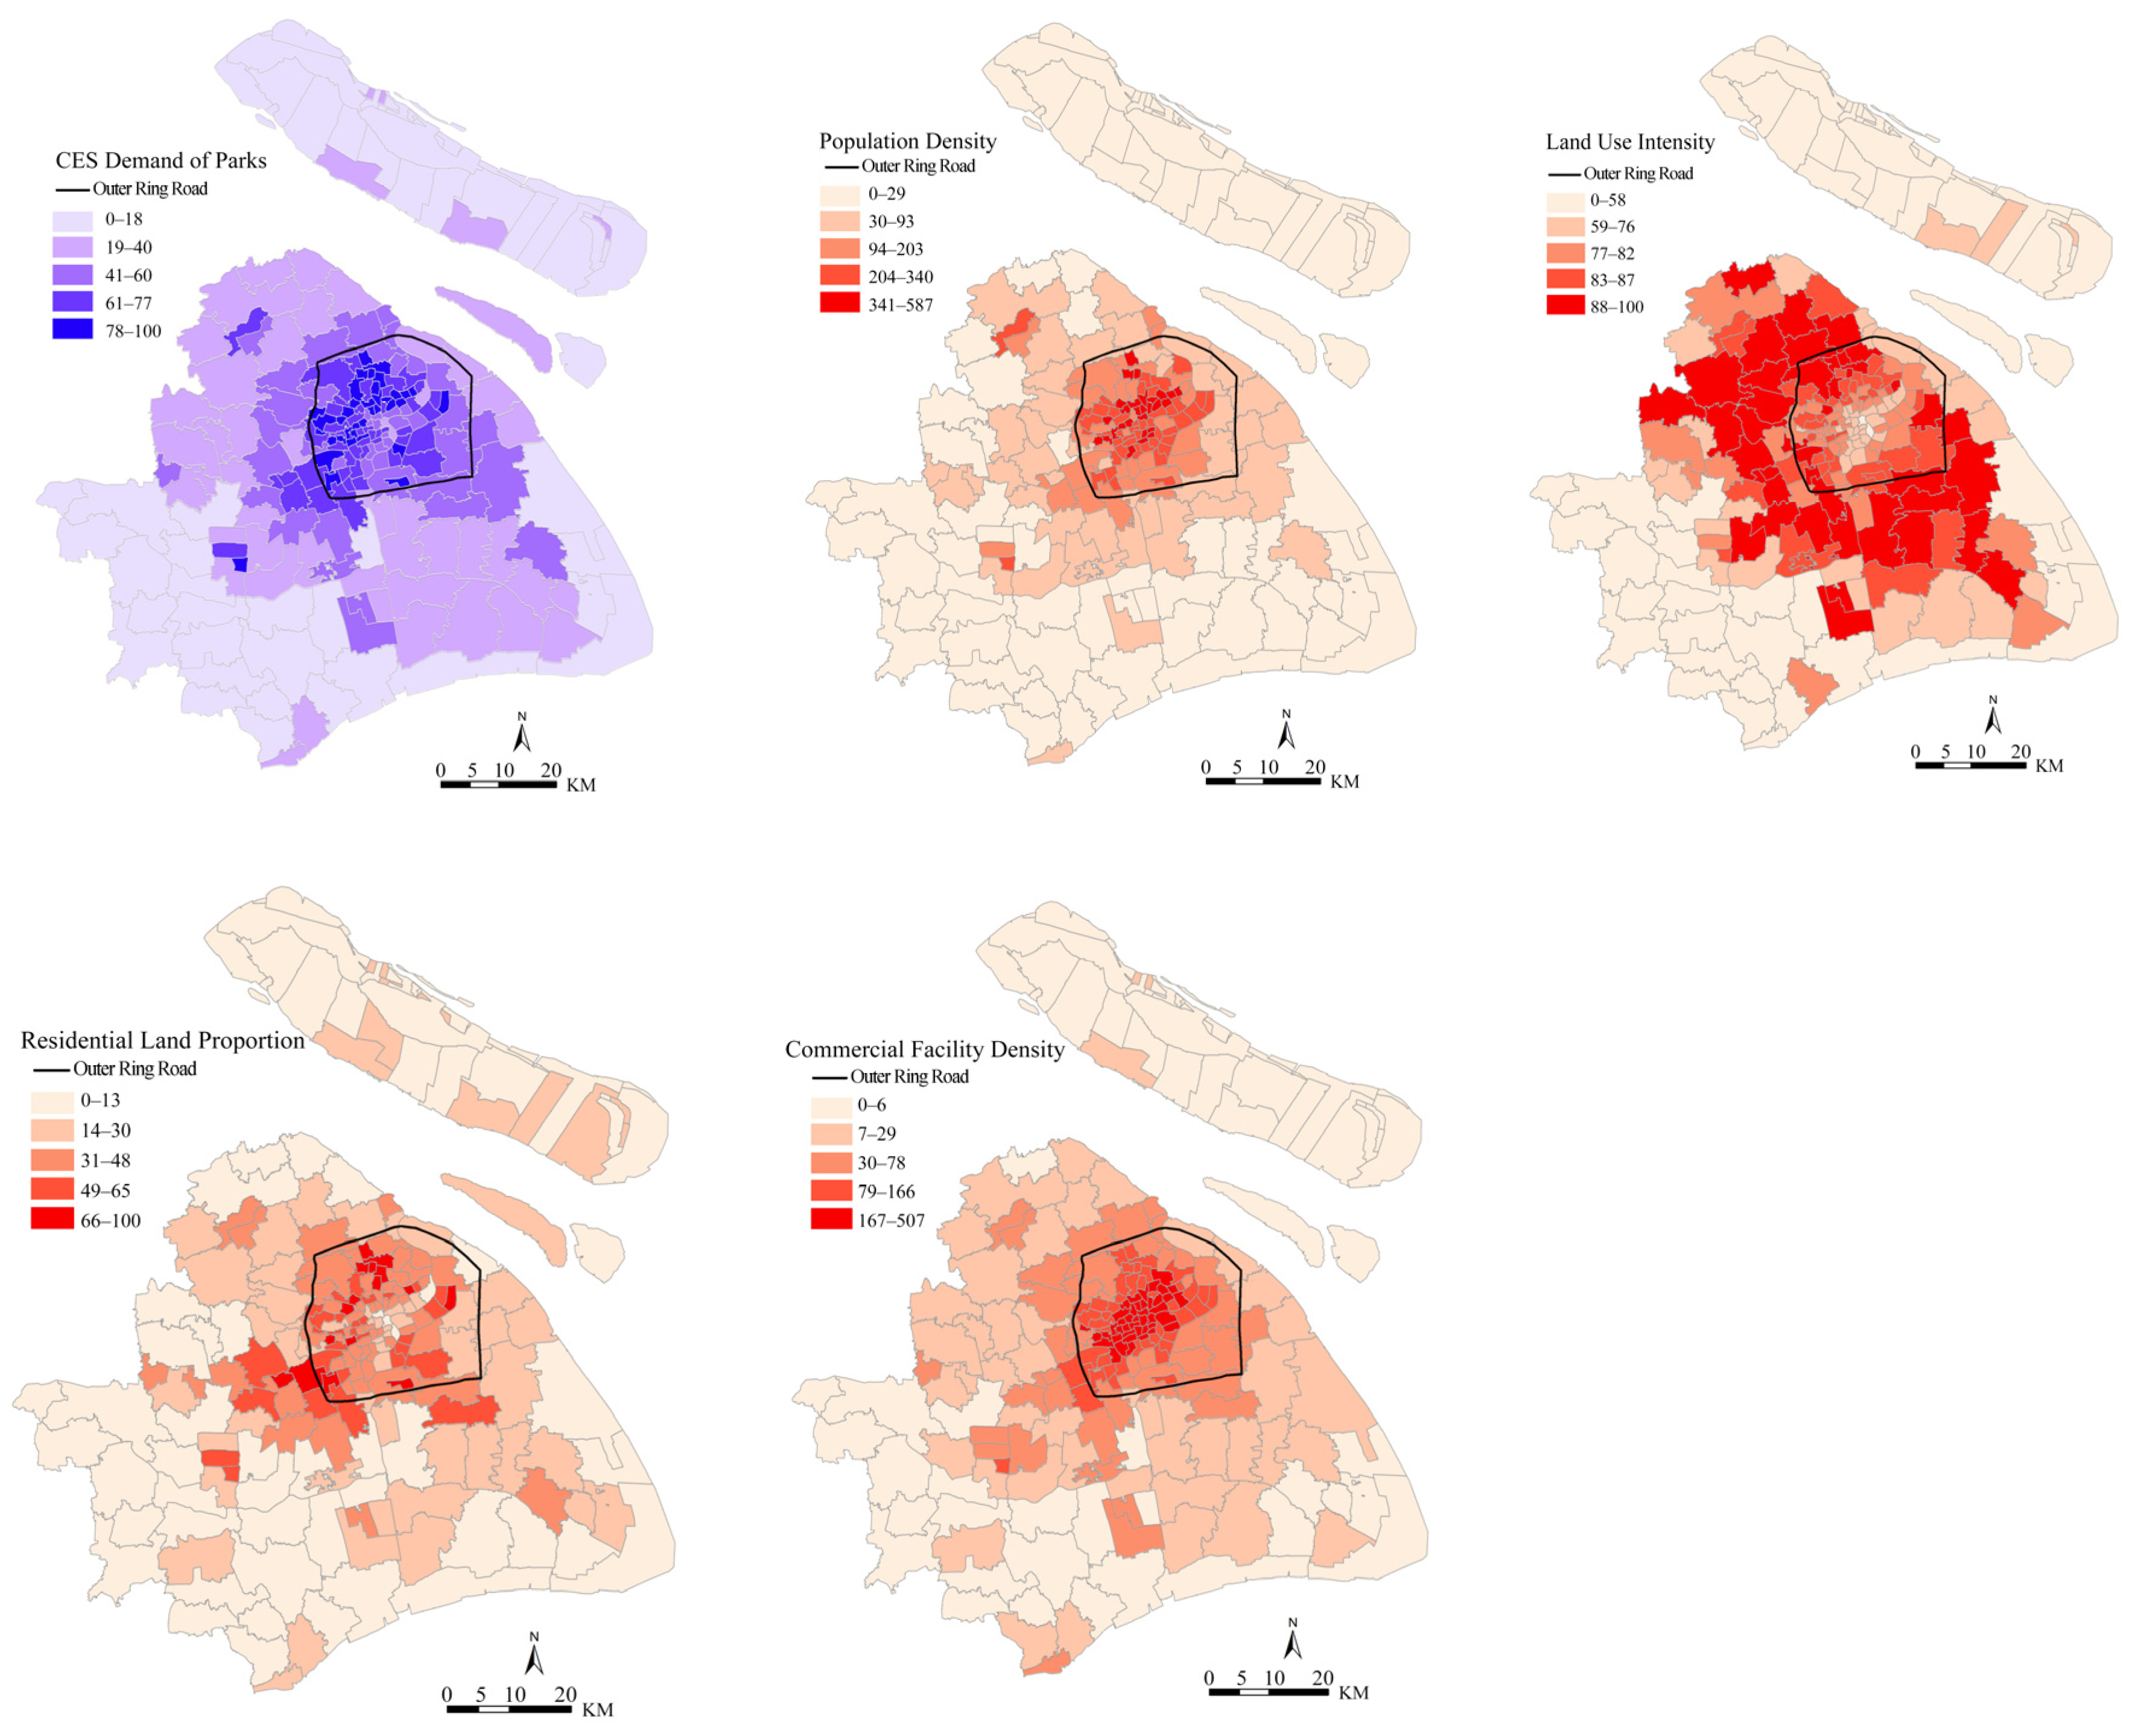
4.1.2. CES Demand of Urban Parks

A total of 82 sub-districts (38.14%) had a high demand for parks, distributed not only in central urban areas, such as Jing’an, Yangpu, and Hongkou, but also in suburban districts, such as central Songjiang. A total of 88 sub-districts (40.90%) had a low demand for parks, widely distributed in the outer suburban areas, especially in Chongming, Jinshan, and southern Songjiang. A total of 20.93% of the sub-districts had a medium demand for parks, mainly concentrated in the peripheral areas surrounding the central urban area, such as the center of the Pudong district, which had similar patterns of population density (Figure 5).

4.2. Quantitative Analysis of CES Supply–Demand in Urban Parks

The sub-districts with high supply (>80%) were relatively heterogeneously distributed across the 215 sub-districts, while the sub-districts with low supply (<20%) were largely located in the outer suburbs (Figure 6a). Thus, supply was mainly influenced by the number and total area of urban parks, as large parks such as Gucun Park (265 ha), Chenshan Botanical Garden (207 ha), and Shanghai Wildlife Park (153.41 ha) were typically located in high-supply sub-districts.
Sub-districts with low demand (<20%) for parks were widely distributed in the outer suburban areas, while high-demand (>80%) sub-districts were concentrated in central urban districts (Figure 6b). Thus, high-demand sub-districts were located in densely populated and highly developed areas within each sub-district, while low-demand sub-districts were primarily located in areas of low land development and sparse population density.
The CES supply exceeded the demand (S > D), and the CES supply was less than the demand (S < D), in 39 sub-districts, respectively, accounting for 18.13% of all the sub-districts. However, there were significant differences in their total areas. Specifically, the S > D sub-districts covered an area of 1084.55 km2, accounting for 16.92% of Shanghai, while the S < D covered an area of 584.03 km2, accounting for 9.11% of Shanghai (Figure 6c). The S > D sub-districts were scattered in the west and east of Shanghai, while the S < D sub-districts were located in the north and south. It is noteworthy that there was a similar spatial distribution pattern for both S > D and S < D areas, not only in the central urban area with a concentrated population and abundant park resources, but also in the suburban areas with less developed areas and insufficient park resources.

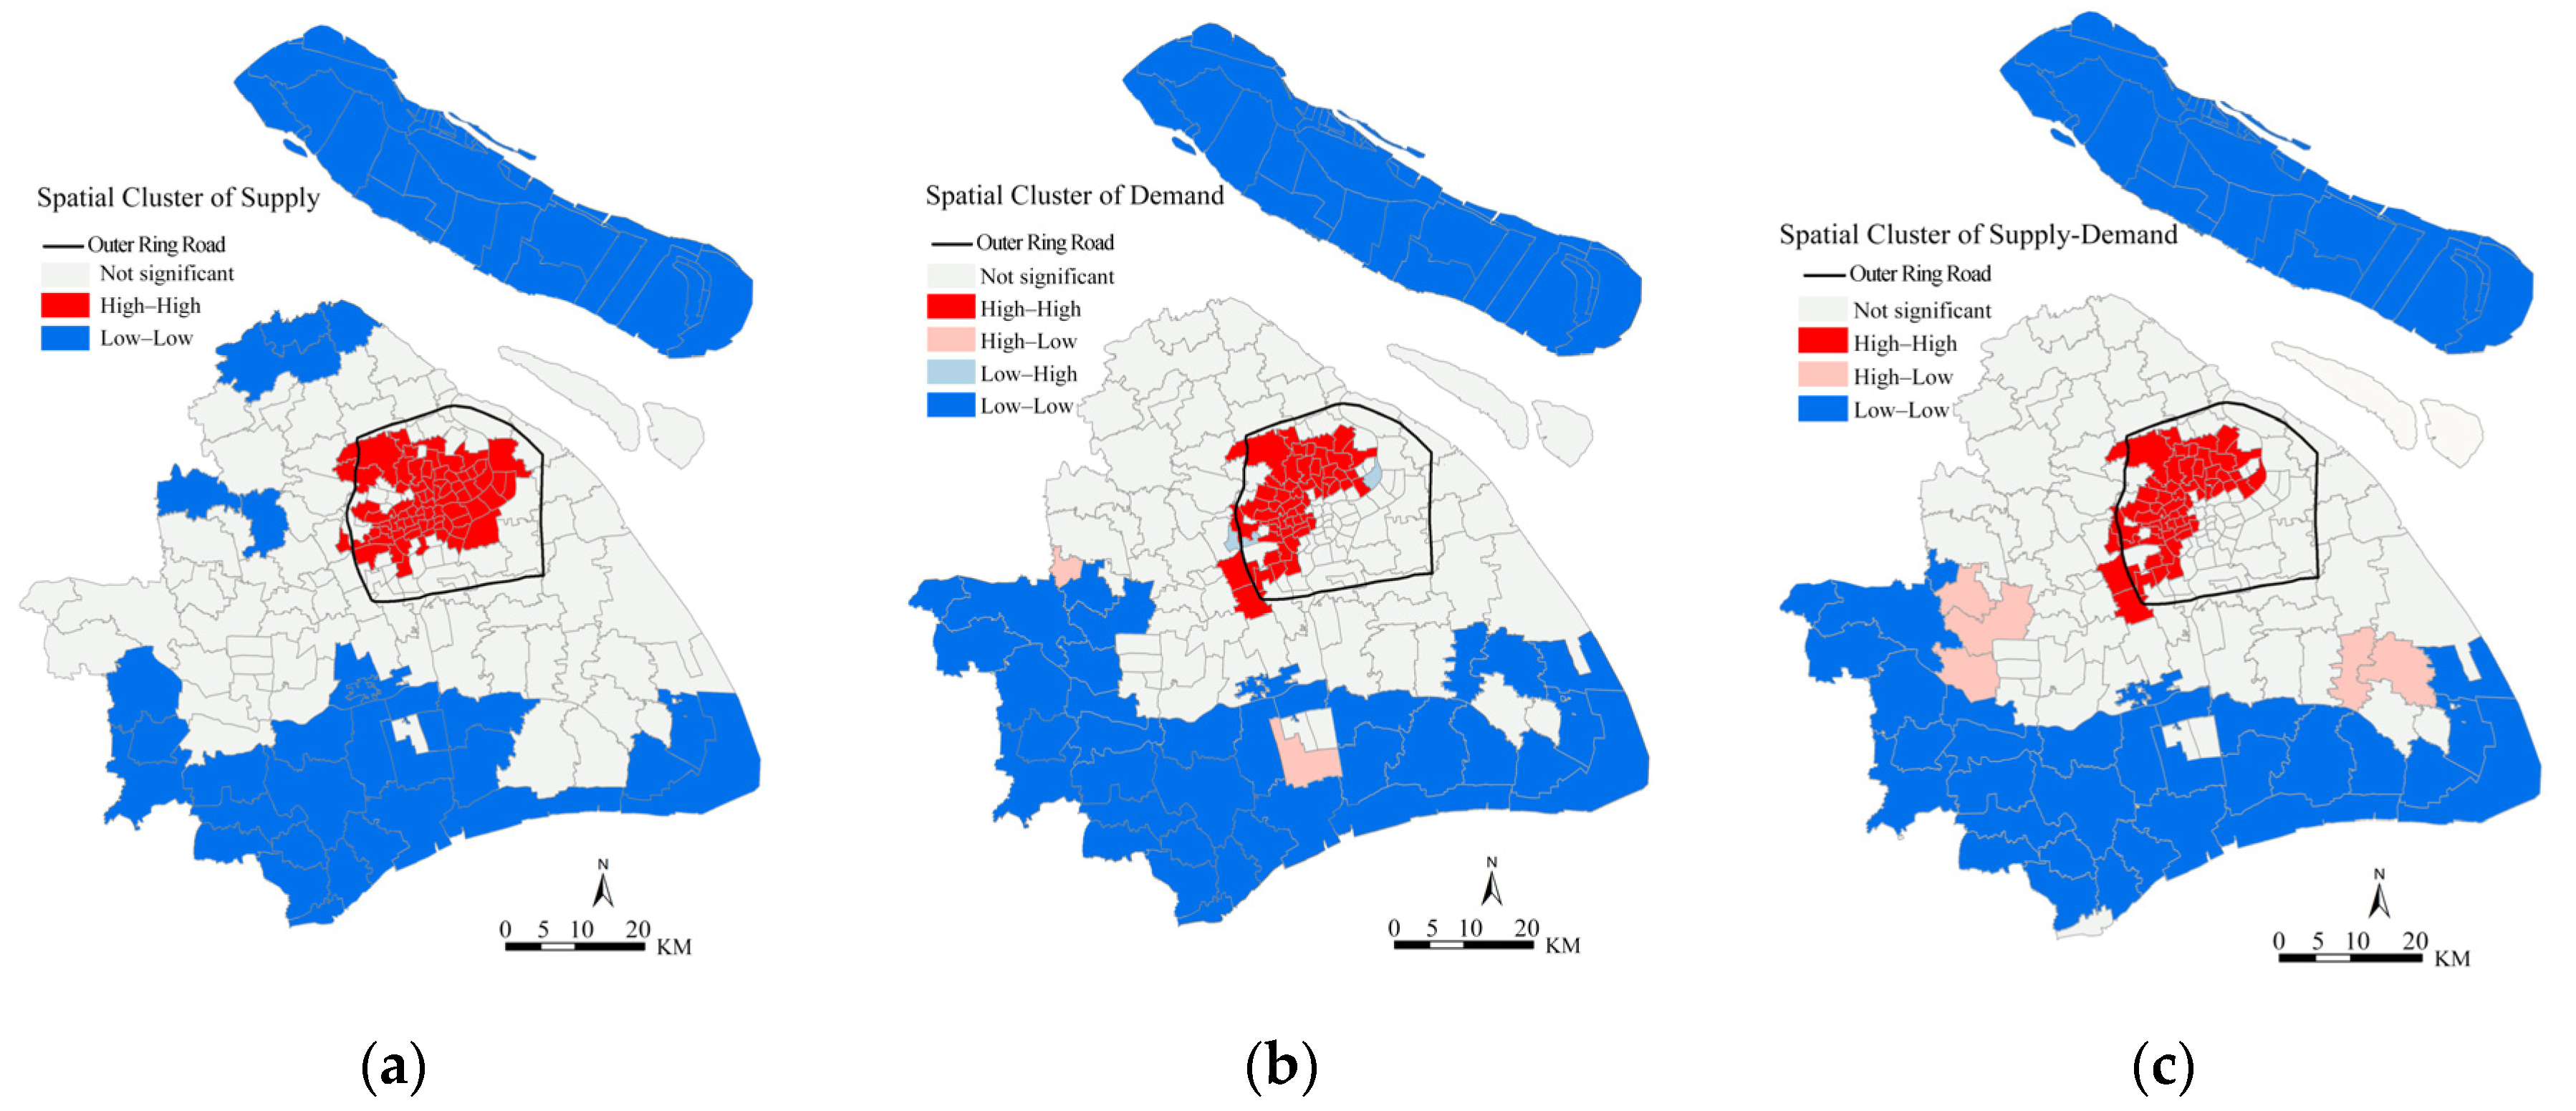
4.3. Spatial Analysis of CES Supply–Demand

According to the univariate local Moran’s I for the supply (Figure 7a), the H-H sub-districts were mainly concentrated in the central urban areas of Huangpu, Yangpu, Hongkou, Jingan, Changning, and the northern Pudong district, amounting to 75 sub-districts. Both the sub-districts and their neighboring areas had significantly high levels of CES supply. The number of L-L sub-districts was 49, and these sub-districts were mainly concentrated in the suburbs, including Jinshan, Fengxian, Chongming, and northern Jiading. Both these sub-districts and their surroundings were significantly low in terms of CES supply. Notably, there were no H-L and L-H sub-districts.
According to the univariate local Moran’s I for the demand (Figure 7b), the distribution of 55 H-H sub-districts was similar to that of the high-demand (>80%) sub-districts. The demand for the CESs in these sub-districts and their surrounding areas was significantly high, making the supply of CESs in these sub-districts particularly valuable. The number of L-L sub-districts was 50, and these sub-districts were mainly concentrated in the Chongming district and the south of Shanghai. The CES demand in both these sub-districts and their surrounding areas was significantly low. There were two H-L sub-districts, located in the Fengxian district and Qingpu district, respectively. Compared to their neighboring areas, these two sub-districts have more commercial facilities and a higher population density, resulting in higher CES demand. They are characterized by large industrial land areas and dedicated areas for public administration and public services. Due to their relatively small population, the demand for CESs in these sub-districts is lower than that in their neighboring sub-districts.
From the perspective of the bivariate local Moran’s I (Figure 7c), 57 sub-districts exhibited an H-H pattern, primarily concentrated in the inner urban area. Similarly, 47 sub-districts exhibited an L-L pattern, similar to the univariate local Moran’s I for the demand for CESs in parks. In addition, there were five sub-districts with an H-L pattern scattered in the Songjiang, Pudong, and Qingpu districts around the L-L sub-districts. The spatial relationships between the supply/demand in one sub-district and the supply/demand of its neighbors indicated the possibility of CES sharing among sub-districts.

4.4. Spatial Identification of Supply and Demand for Parks

Three types of spatial relationship of sub-districts, aside from the type of quantity balance and space mismatching, can be identified in Shanghai (Figure 8). There are 136 sub-districts, and 63.26% belong to the type of quantity balance and space matching.
In addition, there are a total of 79 streets with quantity imbalance, accounting for 36.74% of the total. It is noteworthy that 38 sub-districts belong to the type of quantity imbalance with space matching, accounting for 17.67%. Among the areas where supply exceeds demand, there are 10 H-H sub-districts and 4 L-L sub-districts. In the areas where demand exceeds supply, there are 20 H-H sub-districts and 4 L-L sub-districts. H-H sub-districts show a relatively concentrated distribution of park resources that effectively serve the surrounding residents with high demand, and the supply–demand relationship is in a dynamic balance. The L-L sub-districts show an overall scarcity of park supply and low demand in terms of spatial consistency. Due to the low levels of both supply and demand, changes in supply and demand are relatively slow and stable.
The most notable spatial type is quantity imbalance and space mismatch, which involves a total of 41 sub-districts. Of these, 26 sub-districts have supply exceeding demand, while 15 sub-districts have demand exceeding supply. Sub-districts in the S > D category have a notable imbalance in the supply–demand relationship, which is manifested by insufficient demand, resulting in wasted park resources. Therefore, it is necessary to continually adjust the park use to meet the changing demands of residents. Sub-districts in the S < D category are concentrated in the northern part of Jiading and the central urban area, especially along the west bank of the Huangpu River. In these areas, there is an urgent need to plan for potential new park areas for residents.

5. Discussion

5.1. Supply–Demand Assessment of Urban Park CESs in Megalopolis Area

Urban parks are one of the most important near-natural spaces in the built environment of cities, and as an important spatial carrier of urban habitat, they can provide ecosystem services to cities while effectively improving the quality of the urban habitat [58]. Ecosystem services include four categories: supporting services, provisioning services, regulating services, and cultural services [59]. Compared with natural ecosystem services, CESs play a more important role in the urban “socio-economic-natural” complex ecosystem [60]. With the continuous improvement of urban living standards and habitat requirements, the cultural service function of urban parks has received more and more attention [61].
In the process of China’s rapid urbanization and development, the phenomenon of irrational layout of urban parks is widespread [62], which seriously affects the efficiency of CESs. The reasons are twofold: First, the supply and demand of urban park CESs have not been fully recognized. Urban park development tends to emphasize scale and quantity, without paying sufficient attention to the impact of the spatial layout on the effective supply capacity and its alignment with the spatial characteristics of residents’ demand [63]. Second, the intangibility of CESs and the uncertainty of residents’ subjective feelings pose challenges to quantitative assessment, especially the assessment of residents’ demand and the relationship between the supply and demand of CESs in urban parks [64]. Therefore, identifying and optimizing the supply–demand relationship of CESs in urban parks is important for optimizing park planning and promoting sustainable urban development.
In China’s rapid urbanization process, residents’ activities are concentrated in densely populated urban construction areas, and large urban parks are often distributed in sparsely populated suburban areas with better ecological environments, resulting in an imbalance in the spatial configuration of the supply and demand of urban park CESs [65,66]. However, contrary to the findings of existing studies, which suggest a “low supply-high demand in central areas and high supply-low demand in suburbs” pattern [67], our research shows that Shanghai’s urban parks exhibit a distinct “center–periphery” differentiation. Specifically, high-supply and high-demand spaces are clustered in the central urban area, while low-supply and low-demand spaces are concentrated in remote suburban areas [68]. This spatial pattern of CES supply of urban parks agrees with the former perspective that core-city areas do not necessarily provide less ecosystem services than their surroundings [69]. Some scholars have come to a similar conclusion when evaluating the CESs of the urban green space system in Shanghai [70].
We argue that this distribution pattern reflects the historical cumulative effect and the continuity of urban development inertia on socio-spatial structure and park construction [71]. On the supply side, the historical cumulative effect is evident in the number and size of parks. Central urban areas, with their earlier and more established park development, feature a large number of parks with obvious clustering characteristics in their spatial distribution. On the demand side, the historical accumulation and continuation of urban functional and social spaces play a significant role [72]. The central urban area has long served as the political, cultural, and commercial center of the city. Supported by strong financial backing from local governments and well-developed public services, it has become a hub for high-density population agglomeration, leading to high levels of overall demand. In contrast, urban areas outside the central city, especially in outlying suburbs, began to develop later. These areas have a relatively low intensity of urban development, face resource and economic disadvantages, and have lower levels of resident demand.
Therefore, it is crucial to integrate the quantitative and spatial relationships between supply and demand, and to identify key areas of supply–demand mismatch. By accurately locating sub-districts with “quantitative imbalance and spatial mismatch”, and implementing targeted regulatory measures in areas with the most pronounced supply–demand contradictions and urgent need for intervention, we can significantly improve land use efficiency in high-density metropolitan areas and alleviate the supply–demand imbalance of urban park CESs.

5.2. Methodological Advantages

At present, the assessment of CES supply and demand is in the exploratory stage, and there are difficulties in constructing the relationship between CES supply and demand in urban parks [73]. Previous studies have mainly focused on the evaluation of single supply or demand; there is a relative lack of comprehensive assessment of the supply and demand of urban park CESs. Recently, scholars have changed from a single evaluation to a comprehensive consideration of supply and demand, seeking a more scientific and perfect spatial quantification method [74,75].
The relationship between the supply and demand of CESs is manifested in quantitative and spatial relationships [76,77]. In terms of quantitative relationships, there are three scenarios: (1) supply is greater than demand: the supply meets the residents’ demand, but the CESs may not be fully utilized; (2) supply is less than demand: the supply does not meet the residents’ demand, resulting in an oversupply of services; (3) supply is equal to demand: residents’ demand for CESs is met within the urban park capacity, which is a relatively reasonable condition for realizing sustainable development. CES studies that consider quantitative relationships play a positive role in promoting equity in park allocation [78].
However, CESs in urban parks are typically demand-driven services [79]. People need to come to the park in order to enjoy the various services provided by the park, which means that special attention should be paid to the spatial relationships between the supply and demand [80]. Especially in the process of megacity development, the city center is highly developed, with significant differences in infrastructure, transportation facilities, and population density compared to suburban areas [81]. The spatial mismatch between supply and demand for urban park CESs is evident. For example, new large-scale parks are often located in suburban areas, where the demand of residents is relatively low, while urban parks in high-demand urban center areas are smaller due to land constraints.
More and more studies have considered supply and demand in order to identify the spatial differentiation of CESs in urban parks. In current research, the supply side takes “parks” as the main body, and researchers often choose physical quality indicators for evaluation, such as green space area, naturalness, water body area, and so on [9,82]. These indicators link the structure and function of the ecosystem, and, to some extent, express the service process and formation mechanism. On the demand side, the focus is on “residents”, with one model emphasizing the residents’ subjective preferences and behaviors toward urban parks, while the other model mostly adopts objective indicators, such as population density and service radius [83]. However, there are challenges. First, the units and scales of CESs are generally different between supply and demand, making it difficult to compare the two variables [84]. Furthermore, in terms of research scale, studies mainly focus on small or medium scales (e.g., central urban areas [85,86], protected areas [87]), or on specific types (e.g., community parks [88], historic parks [89]) at specific scales (e.g., a specific park [20]), which makes it difficult to fully reflect the CESs of different types and scales of parks in the city.
Therefore, we took Shanghai as the study area, and used bivariate mapping and bivariate local Moran’s I to compare the supply and demand of urban park CESs. In the high-density environment of megacities, excessive development and construction will seriously limit the development space of urban parks, and scarcity places high demands on the service performance of urban park CESs [90]. Bivariate mapping not only identified areas with high supply and demand, but also depicted the demand and supply of different levels in quantity, such as sub-districts with low supply and high demand [30,32]. However, even if these results show low supply and high demand, it does not mean that there is not enough supply [46]. By using the bivariate local Moran’s I, we could evaluate the relationship between the CES supply in a sub-district and the demand in its neighboring areas [80]. The combination of quantitative and spatial analysis allowed for further identification of uneven sub-districts with quantity imbalance and space mismatching.
Measuring supply and demand is the foundation and prerequisite for improving urban park CESs. Studies on the identification of urban park CES supply and demand can provide a decision-making basis for the planning and management of parks in megacities.

5.3. Suggestions for Optimizing Urban Park CESs for Different Spatial Petterns

In this study, we derived four scenarios of CES supply–demand based on quantity analysis and spatial analysis: (1) Quantity balance and space matching: these areas constitute a balanced state of service supply and demand; further exploration is needed to meet the dynamic balance of supply and demand in a changing environment. (2) Quantity balance and space mismatching: in the case of spatial mismatch, a matched state of supply and demand should be achieved through service flow management. (3) Quantity imbalance and space matching: in the case of quantity imbalance, it is necessary to optimize the characteristics of urban parks and adjust the distribution of demand, thereby increasing the supply capacity and reducing the demand level to achieve a balanced state of supply and demand. (4) Quantity imbalance and space mismatching: in the case of both spatial mismatch and quantity imbalance, it is necessary to simultaneously adjust both supply and demand levels and facilitate service flow.
(1)
Regulation for supply and demand toward dynamic balance
Optimization and improvement measures should be implemented for spaces where quantity balance and space matching exist, to mitigate the risk of supply–demand contradictions that will be exacerbated by future urban population growth. Optimization strategies include (1) improving the network structure and connectivity of the urban park system, to facilitate the connection and sharing of parks in adjacent areas; and (2) expanding leisure spaces and service facilities specifically designed for the elderly and children, to enhance the refinement of park services.
(2)
Adjustment of capacity level for quantity balance
In terms of the quantitative relationship of CES supply–demand, differentiated optimization strategies should be implemented, in conjunction with the characteristics of the spatial types of supply and demand.
For areas where supply exceeds demand, it is essential to make rational and full use of existing park resources to ensure a sustainable supply of CESs. Specific optimization strategies include (1) leveraging the strengths of both the “new town” and the “old town” to achieve a balanced layout of urban parks; and (2) making internal adjustments within the existing parks to optimize their spatial layout structure.
For areas where the supply is less than the demand, there are problems such as inadequate park and incomplete coverage. It is imperative to implement optimization and improvement measures, and the specific optimization strategies include (1) increasing the quantity, scale, and functions of urban parks by constructing pocket parks, adding vertical greening, and opening up affiliated green spaces; and (2) reasonably arranging transportation service facilities and constructing a series of low-traffic green corridors to improve the accessibility of parks.
(3)
Adjustment of service flow for spatial match
In general, there is a spatial differentiation between supply and demand for CESs. Based on the results of the spatial relationship of supply–demand, high-demand agglomeration spaces and low-demand agglomeration areas for CESs can be identified.
High-demand agglomeration areas for parks are typically located in old urban areas where commerce is prosperous, spatial vitality is high, and the population is dense, resulting in heavy loads on urban parks. Due to the high intensity of urban development and limited land availability, it is difficult to increase the number of parks. Therefore, more attention should be paid to the needs of residents. For example, in the social context of an aging population and the implementation of the three-child policy, priority should be given to the elderly, youth, and children [91].
Agglomeration areas with low demand for parks are typically located in suburban areas of the city. The primary focus of optimization in these areas should be on stimulating demand, for example, by increasing the supply of high-quality parks and encouraging the relocation of the urban population to these areas.
In addition, the development of urban space should be guided by the construction of parks. The planning of the urban park system should be integrated into urban planning to promote the construction of the park network. Large ecological areas within the urban development boundary, among other elements, should be included in the urban park system to increase the number of parks.

5.4. Limitations and Future Perspectives

This study evaluated the supply and demand of CESs in urban parks using the proxy indicator approach. However, these indicators still have limitations in objectively and comprehensively reflecting the actual supply capabilities and demand levels of CESs in urban parks. On the supply side, discrepancies in construction standards and infrastructure quality exist not only between different park types, but also within the same park type located in different locations, leading to variations in supply capacity. Particularly on the demand side, due to the inherent subjectivity of CESs, this study used socio-economic indicators, such as the level of urban development, the residential land proportion, the density of commercial facilities, and population density, to reflect the intensity of human consumption of ecosystem services. Although these can indicate the level of human demand to some extent, they overlook the differences in cultural demand among different social cohorts, including the elderly, children, the disabled, and the unemployed. Future research efforts should focus on exploring more precise and comprehensive indicators of the supply and demand of CESs in urban parks, and conducting validations of their scientific and reliable nature. Specifically, with regard to demand, a comprehensive effort should be made to understand the preferences and expectations of different segments of the population with regard to CESs [92]. For example, more sophisticated service and safety facilities should be provided for the elderly, a variety of outdoor activity spaces should be provided for youth and children, and more accessible and barrier-free facilities and sites should be provided for people with disabilities [93].

6. Conclusions

As the standard of living in cities continues to improve, and the demand for the quality of the human environment continues to rise, the CESs provided by urban parks are receiving more and more attention. How to integrate the CES theory into urban park planning strategies, and how to accurately characterize the relationship between urban parks and residents’ demands, are two key issues that this research focused on. Therefore, this study proposed an integrated framework combining spatial and quantitative analyses to identify the supply and demand of urban park CESs, and provide effective references for urban park planning and management. In order to accurately represent the CESs in urban parks, this research developed a spatially explicit method for mapping the supply and demand of CESs in urban parks at the sub-district scale. In addition, it introduced a comprehensive method to identify the CESs in urban parks not only in terms of the total amount of supply and demand, but also from the perspective of their spatial relationship, by overlaying the bivariate mapping method and bivariate local Moran’s I. The main conclusions are as follows:
(1)
According to the results of quantitative analysis, the CES supply exceeds the demand (S > D), and the CES supply is less than the demand (S < D), in 39 sub-districts, respectively, accounting for 18.13% of all the sub-districts.
(2)
From the perspective of spatial analysis, 57 sub-districts show an H-H pattern, mainly concentrated in the inner urban area. There are 47 sub-districts showing an L-L pattern, mainly concentrated in the Chongming district and the southern suburb of Shanghai. Five sub-districts show an H-L pattern, scattered around the L-L sub-districts in the Songjiang, Pudong, and Qingpu districts.
(3)
Combining spatial and quantitative analysis, three types of spatial relationships can be identified in Shanghai. There are 136 sub-districts belonging to the type of quantity balance and space matching. Among the 79 sub-districts of unbalanced quantities, there are a total of 41 sub-districts belonging to the quantity imbalance and space mismatching type. Among them, only 15 sub-districts face a situation where supply is less than demand.
The innovation of this study lies in the comprehensive approach based on quantitative analysis and spatial analysis to identify the supply and demand of urban park CESs. This approach helps us to identify the highest-priority areas for urban park construction, especially in the context of the contradiction between residents’ demand for green space and the lack of green space in the metropolitan area. This research framework and the results obtained from Shanghai can enhance our comprehensive understanding of park CESs and can provide a valuable basis for policy formulation in urban green infrastructure planning.

Author Contributions

Conceptualization, Y.Y.; Methodology, Y.Y.; Software, Y.Y. and L.J.; Investigation, L.W.; Resources, S.L.; Writing—original draft, Y.Y.; Writing—review & editing, Y.Y., X.M. and S.L.; Supervision, S.L.; Project administration, S.L.; Funding acquisition, Y.Y. All authors have read and agreed to the published version of the manuscript.

Funding

This research was funded by Shandong Province Natural Science Foundation for Youths, grant number ZR2024QE329; Key Projects of Art Science in Shandong Province, grant number L2024Z05100522.

Data Availability Statement

The original contributions presented in the study are included in the article, further inquiries can be directed to the corresponding author.

Conflicts of Interest

The authors declare no conflict of interest.

References

  1. Wang, Z.; Miao, Y.; Xu, M.; Zhu, Z.; Qureshi, S.; Chang, Q. Revealing the differences of urban parks’ services to human wellbeing based upon social media data. Urban For. Urban Green. 2021, 63, 127233. [Google Scholar] [CrossRef]
  2. de Groot, R.S.; Wilson, M.A.; Boumans, R.M.J. A typology for the classification, description and valuation of ecosystem functions, goods and services. Ecol. Econ. 2002, 41, 393–408. [Google Scholar] [CrossRef]
  3. Woodruff, S.C.; BenDor, T.K. Ecosystem services in urban planning: Comparative paradigms and guidelines for high quality plans. Landsc. Urban Plan. 2016, 152, 90–100. [Google Scholar] [CrossRef]
  4. Arsalan, M.; Chamani, A.; Zamani-Ahmadmahmoodi, R. Sustaining tranquility in small urban green parks: A modeling approach to identify noise pollution contributors. Sustain. Cities Soc. 2024, 113, 105655. [Google Scholar] [CrossRef]
  5. Yu, Z.; Yang, G.; Zuo, S.; Jrgensen, G.; Vejre, H. Critical review on the cooling effect of urban blue-green space: A threshold-size perspective. Urban For. Urban Green. 2020, 49, 126630. [Google Scholar] [CrossRef]
  6. Li, P.; Wu, W.; Yin, Y. Enhanced accessibility to park cooling services in developed areas: Experimental insights on the walkability in large urban agglomerations. Build. Environ. 2025, 272, 112665. [Google Scholar] [CrossRef]
  7. Yoshimura, N.; Hiura, T. Demand and supply of cultural ecosystem services: Use of geotagged photos to map the aesthetic value of landscapes in Hokkaido. Ecosyst. Serv. 2017, 24, 68–78. [Google Scholar] [CrossRef]
  8. Li, J.; Huang, Z.; Zhu, Z.; Ding, G. Coexistence Perspectives: Exploring the impact of landscape features on aesthetic and recreational values in urban parks. Ecol. Indic. 2024, 162, 112043. [Google Scholar] [CrossRef]
  9. Paracchini, M.L.; Zulian, G.; Kopperoinen, L.; Maes, J.; Schägner, J.P.; Termansen, M.; Zandersen, M.; Perez-Soba, M.; Scholefield, P.A.; Bidoglio, G. Mapping cultural ecosystem services: A framework to assess the potential for outdoor recreation across the EU. Ecol. Indic. 2014, 45, 371–385. [Google Scholar] [CrossRef]
  10. Li, Y.; Li, R.; Li, Q.; Zhao, X.; Zhao, P.; Yan, P.; Zhang, S.; Gu, L.; Xue, J. Study on the synergistic mechanisms of fungal biodiversity and ecosystem multifunctionality across vegetation diversity gradients. Sci. Total Environ. 2025, 964, 178563. [Google Scholar] [CrossRef]
  11. Guo, R.; Ann Diehl, J.; Zhang, R.; Wang, H. Spatial equity of urban parks from the perspective of recreational opportunities and recreational environment quality: A case study in Singapore. Landsc. Urban Plan. 2024, 247, 105065. [Google Scholar] [CrossRef]
  12. Pelletier, M.; Heagney, E.; Kovač, M. Valuing recreational services: A review of methods with application to New South Wales National Parks. Ecosyst. Serv. 2021, 50, 101315. [Google Scholar] [CrossRef]
  13. Peters, K.; Elands, B.; Buijs, A. Social interactions in urban parks: Stimulating social cohesion? Urban For. Urban Green. 2010, 9, 93–100. [Google Scholar] [CrossRef]
  14. Riechers, M.; Barkmann, J.; Tscharntke, T. Perceptions of cultural ecosystem services from urban green. Ecosyst. Serv. 2016, 17, 33–39. [Google Scholar] [CrossRef]
  15. Tian, T.; Huang, S.; Wu, Y.; Zeng, P.; Liu, Y.; Che, Y. Non-ecological factors affect human interaction with urban nature and perception of cultural ecosystem services. Sustain. Cities Soc. 2024, 112, 105643. [Google Scholar] [CrossRef]
  16. De Luca, C.; Calcagni, F.; Tondelli, S. Assessing distributional justice around Cultural Ecosystem Services (CES) provided by urban green areas: The case of Bologna. Urban For. Urban Green. 2024, 101, 128556. [Google Scholar] [CrossRef]
  17. Crossman, N.D.; Burkhard, B.; Nedkov, S.; Willemen, L.; Petz, K.; Palomo, I.; Drakou, E.G.; Martín-Lopez, B.; McPhearson, T.; Boyanova, K.; et al. A blueprint for mapping and modelling ecosystem services. Ecosyst. Serv. 2013, 4, 4–14. [Google Scholar] [CrossRef]
  18. Hosseini, S.J.F.; Laing, R. The role of plant clinics in sustainability of urban green spaces in Tehran. Int. J. Sustain. Dev. World Ecol. 2011, 18, 128–133. [Google Scholar] [CrossRef]
  19. Lee, G.; Hong, I. Measuring spatial accessibility in the context of spatial disparity between demand and supply of urban park service. Landsc. Urban Plan. 2013, 119, 85–90. [Google Scholar] [CrossRef]
  20. Zhang, Y.; Fu, B.; Sun, J.; Da Silva, R.F.B. Quantifying supply and demand of cultural ecosystem services from a dynamic perspective. Land Use Policy 2025, 148, 107414. [Google Scholar] [CrossRef]
  21. Liu, Z.; Huang, Q.; Yang, H. Supply-demand spatial patterns of park cultural services in megalopolis area of Shenzhen, China. Ecol. Indic. 2021, 121, 107066. [Google Scholar] [CrossRef]
  22. Riechers, M.; Barkmann, J.; Tscharntke, T. Diverging perceptions by social groups on cultural ecosystem services provided by urban green. Landsc. Urban Plan. 2018, 175, 161–168. [Google Scholar] [CrossRef]
  23. Nowak-Olejnik, A.; Działek, J.; Hibner, J.; Liro, J.; Madej, R.; Sudmanns, M.; Haase, D. The benefits and disbenefits associated with cultural ecosystem services of urban green spaces. Sci. Total Environ. 2024, 926, 172092. [Google Scholar] [CrossRef]
  24. Burkhard, B.; Kandziora, M.; Hou, Y.; Müller, F. Ecosystem Service Potentials, Flows and Demands—Concepts for Spatial Localisation, Indication and Quantification. Landsc. Online 2014, 34, 1–32. [Google Scholar] [CrossRef]
  25. Wu, J.; Jin, X.; Wang, H.; Feng, Z. Evaluating the supply-demand balance of cultural ecosystem services with budget expectation in Shenzhen, China. Ecol. Indic. 2022, 142, 109165. [Google Scholar] [CrossRef]
  26. Richards, D.R.; Law, A.; Tan, C.S.Y.; Shaikh, S.F.E.A.; Carrasco, L.R.; Jaung, W.; Oh, R.R.Y. Rapid urbanisation in Singapore causes a shift from local provisioning and regulating to cultural ecosystem services use. Ecosyst. Serv. 2020, 46, 101193. [Google Scholar] [CrossRef]
  27. Wu, X.; Liu, S.; Zhao, S.; Hou, X.; Xu, J.; Dong, S.; Liu, G. Quantification and driving force analysis of ecosystem services supply, demand and balance in China. Sci. Total Environ. 2019, 652, 1375–1386. [Google Scholar] [CrossRef] [PubMed]
  28. Zhai, T.; Wang, J.; Jin, Z.; Qi, Y.; Fang, Y.; Liu, J. Did improvements of ecosystem services supply-demand imbalance change environmental spatial injustices? Ecol. Indic. 2020, 111, 106068. [Google Scholar] [CrossRef]
  29. Guo, M.; Liu, B.; Tian, Y.; Xu, D. Equity to Urban Parks for Elderly Residents: Perspectives of Balance between Supply and Demand. Int. J. Environ. Res. Public Health 2020, 17, 8506. [Google Scholar] [CrossRef] [PubMed]
  30. Shen, J.; Du, S.; Huang, Q.; Yin, J.; Zhang, M.; Wen, J.; Gao, J. Mapping the city-scale supply and demand of ecosystem flood regulation services—A case study in Shanghai. Ecol. Indic. 2019, 106, 105544. [Google Scholar] [CrossRef]
  31. Xin, R.; Skov-Petersen, H.; Zeng, J.; Zhou, J.; Li, K.; Hu, J.; Liu, X.; Kong, J.; Wang, Q. Identifying key areas of imbalanced supply and demand of ecosystem services at the urban agglomeration scale: A case study of the Fujian Delta in China. Sci. Total Environ. 2021, 791, 148173. [Google Scholar] [CrossRef] [PubMed]
  32. Jin, C.; Weibin, Y.; Dongjin, H.; Xisheng, H. Supply and demand relationship and its spatial heterogeneity of urban parks in downtown area of Fuzhou. J. Zhejiang AF Univ. 2023, 40, 1300–1310. [Google Scholar]
  33. Bing, Z.; Qiu, Y.; Huang, H.; Chen, T.; Zhong, W.; Jiang, H. Spatial distribution of cultural ecosystem services demand and supply in urban and suburban areas: A case study from Shanghai, China. Ecol. Indic. 2021, 127, 107720. [Google Scholar] [CrossRef]
  34. Shen, Y.; Sun, F.; Che, Y. Public green spaces and human wellbeing: Mapping the spatial inequity and mismatching status of public green space in the Central City of Shanghai. Urban For. Urban Green. 2017, 27, 59–68. [Google Scholar] [CrossRef]
  35. Burkhard, B.; Kroll, F.; Nedkov, S.; Müller, F. Mapping ecosystem service supply, demand and budgets. Ecol. Indic. 2012, 21, 17–29. [Google Scholar] [CrossRef]
  36. Balázsi, Á.; Dänhardt, J.; Collins, S.; Schweiger, O.; Settele, J.; Hartel, T. Understanding cultural ecosystem services related to farmlands: Expert survey in Europe. Land Use Policy 2021, 100, 104900. [Google Scholar] [CrossRef]
  37. La Rosa, D.; Spyra, M.; Inostroza, L. Indicators of Cultural Ecosystem Services for urban planning: A review. Ecol. Indic. 2016, 61, 74–89. [Google Scholar] [CrossRef]
  38. Peng, J.; Wang, X.; Liu, Y.; Zhao, Y.; Xu, Z.; Zhao, M.; Qiu, S.; Wu, J. Urbanization impact on the supply-demand budget of ecosystem services: Decoupling analysis. Ecosyst. Serv. 2020, 44, 101139. [Google Scholar] [CrossRef]
  39. van Berkel, D.B.; Verburg, P.H. Spatial quantification and valuation of cultural ecosystem services in an agricultural landscape. Ecol. Indic. 2014, 37, 163–174. [Google Scholar] [CrossRef]
  40. Cai, Y.; Zhang, J.; Gu, Q.; Wang, C. An Analytical Framework for Assessing Equity of Access to Public Electric Vehicle Charging Stations: The Case of Shanghai. Sustainability 2024, 16, 6196. [Google Scholar] [CrossRef]
  41. Gai, S.; Fu, J.; Rong, X.; Dai, L. Users’ views on cultural ecosystem services of urban parks: An importance-performance analysis of a case in Beijing, China. Anthropocene 2022, 37, 100323. [Google Scholar] [CrossRef]
  42. Lang, Z.; Jing, L.; Li, F. Layout of urban green system: Characteristics and trend. City Palnning Rev. 2009, 33, 32–36. [Google Scholar]
  43. Liang, H.; Yan, Q.; Yan, Y.; Zhang, Q. Using an improved 3SFCA method to assess inequities associated with multimodal accessibility to green spaces based on mismatches between supply and demand in the metropolitan of Shanghai, China. Sustain. Cities Soc. 2023, 91, 104456. [Google Scholar] [CrossRef]
  44. Biernacka, M.; Kronenberg, J. Classification of institutional barriers affecting the availability, accessibility and attractiveness of urban green spaces. Urban For. Urban Green. 2018, 36, 22–33. [Google Scholar] [CrossRef]
  45. Fan, P.Y.; Chun, K.P.; Mijic, A.; Tan, M.L.; Liu, M.S.; Yetemen, O. A framework to evaluate the accessibility, visibility, and intelligibility of green-blue spaces (GBSs) related to pedestrian movement. Urban For. Urban Green. 2022, 69, 127494. [Google Scholar] [CrossRef]
  46. Lin, Y.; Zhang, M.; Gan, M.; Huang, L.; Zhu, C.; Zheng, Q.; You, S.; Ye, Z.; Shahtahmassebi, A.; Li, Y.; et al. Fine identification of the supply–demand mismatches and matches of urban green space ecosystem services with a spatial filtering tool. J. Clean. Prod. 2022, 336, 130404. [Google Scholar] [CrossRef]
  47. Willemen, L.; Verburg, P.; Hein, L.; van Mensvoort, M. Spatial Characterization of Landscape Functions. Landsc. Urban Plan. 2008, 88, 34–43. [Google Scholar] [CrossRef]
  48. Schröter, M.; Barton, D.N.; Remme, R.P.; Hein, L. Accounting for capacity and flow of ecosystem services: A conceptual model and a case study for Telemark, Norway. Ecol. Indic. 2014, 36, 539–551. [Google Scholar] [CrossRef]
  49. Guo, S.; Yang, G.; Pei, T.; Ma, T.; Song, C.; Shu, H.; Du, Y.; Zhou, C. Analysis of factors affecting urban park service area in Beijing: Perspectives from multi-source geographic data. Landsc. Urban Plan. 2019, 181, 103–117. [Google Scholar] [CrossRef]
  50. Schirpke, U.; Meisch, C.; Marsoner, T.; Tappeiner, U. Revealing spatial and temporal patterns of outdoor recreation in the European Alps and their surroundings. Ecosyst. Serv. 2018, 31, 336–350. [Google Scholar] [CrossRef]
  51. Sun, W.; Ren, J.; Zhai, J.; Li, W. ‘Just green enough’ in urban renewal: A multifunctional and pragmatic approach in realizing multiscale urban green space optimization in built-up residential areas. Urban For. Urban Green. 2023, 82, 127891. [Google Scholar] [CrossRef]
  52. Lynch, A.J. The role and potential of residential open space in a suburban green space network. Urban For. Urban Green. 2021, 58, 126971. [Google Scholar] [CrossRef]
  53. Emrich, C.T.; Cutter, S.L. Social Vulnerability to Climate-Sensitive Hazards in the Southern United States. Weather. Clim. Soc. 2011, 3, 193–208. [Google Scholar] [CrossRef]
  54. Stuerck, J.; Poortinga, A.; Verburg, P.H. Mapping ecosystem services: The supply and demand of flood regulation services in Europe. Ecol. Indic. 2014, 38, 198–211. [Google Scholar] [CrossRef]
  55. Anselin, L. Local indicators of spatial association—Lisa. Geogr. Anal. 1995, 27, 93–115. [Google Scholar] [CrossRef]
  56. Anselin, L.; Rey, S.J. Modern Spatial Econometrics in Practice: A Guide to Geoda, Geodaspace and Pysal; Geoda Press LLC: Chicago, IL, USA, 2014. [Google Scholar]
  57. Wentao, Y.; Xin, H.; Yuncai, W. Measurements of the supply and demand for the flood regulation ecosystem services of green infrastructure: A review. Acta Ecol. Sin. 2019, 39, 1165–1177. [Google Scholar]
  58. Mexia, T.; Vieira, J.; Príncipe, A.; Anjos, A.; Silva, P.; Lopes, N.; Freitas, C.; Santos-Reis, M.; Correia, O.; Branquinho, C.; et al. Ecosystem services: Urban parks under a magnifying glass. Environ. Res. 2018, 160, 469–478. [Google Scholar] [CrossRef] [PubMed]
  59. Assesment, M.E. Ecosystems and human well-being: Synthesis. Phys. Teach. 2005, 34, 534. [Google Scholar]
  60. Derek, M.; Kulczyk, S.; Grzyb, T.; Woźniak, E. ‘This is my magical place here’. Linking cultural ecosystem services and landscape elements in urban green spaces. Ecosyst. Serv. 2025, 71, 101699. [Google Scholar] [CrossRef]
  61. Wang, Y.; Shi, X.; Cheng, K.; Zhang, J.; Chang, Q. How do urban park features affect cultural ecosystem services: Quantified evidence for design practices. Urban For. Urban Green. 2022, 76, 127713. [Google Scholar] [CrossRef]
  62. Fu, Y.; Yang, J.; Wang, Z.; Zhang, B.; Xue, J.; Zeng, Y.; Li, F. Reassessing urban park accessibility: An improved two-step floating catchment area method based on the physical activity services perspective. Urban For. Urban Green. 2024, 101, 128446. [Google Scholar] [CrossRef]
  63. Yang, L.; Lu, Y.; Cao, M.; Wang, R.; Chen, J. Assessing accessibility to peri-urban parks considering supply, demand, and traffic conditions. Landsc. Urban Plan. 2025, 257, 105313. [Google Scholar] [CrossRef]
  64. Tian, T.; Dong, Q.; Zeng, P.; Liu, Y.; Yu, T.; Che, Y. How to accurately assess cultural ecosystem services by spatial value transfer? An answer based on the analysis of urban parks. Urban For. Urban Green. 2023, 82, 127875. [Google Scholar] [CrossRef]
  65. Guo, S.; Luo, Y.; Cao, Y.; Zhang, Y.; Yu, J. Cultural ecosystem services show superiority in promoting subjective mental health of senior residents: Evidences from old urban areas of Beijing. Urban For. Urban Green. 2023, 86, 128011. [Google Scholar] [CrossRef]
  66. Huang, Y.; Hong, X.; Zheng, Y.; Zhang, Y.; Li, Z. Assessment and optimization of spatial equity for urban parks: A case study in Nanjing, China. Ecol. Indic. 2024, 166, 112449. [Google Scholar] [CrossRef]
  67. Wei, J.; Chen, M.; Chu, C.; Zhao, C.; Xia, X.; Li, Y. Assessing cultural ecosystem services supply–demand balance of urban parks in the context of old and new urban districts. Ecol. Indic. 2024, 159, 111688. [Google Scholar] [CrossRef]
  68. Li, H.; Liu, Y. Neighborhood socioeconomic disadvantage and urban public green spaces availability: A localized modeling approach to inform land use policy. Land Use Policy 2016, 57, 470–478. [Google Scholar] [CrossRef]
  69. Larondelle, N.; Haase, D. Urban ecosystem services assessment along a rural–urban gradient: A cross-analysis of European cities. Ecol. Indic. 2013, 29, 179–190. [Google Scholar] [CrossRef]
  70. Wang, Y.; Qian, X.; Cai, M.; Zhao, Z. Evaluation and Promotion of Cultural Service Function of Green Space Ecosystems in Mega Cities: A Case Study of Shanghai. J. Beijing For. Univ. (Soc. Sci.) 2023, 22, 52–59. [Google Scholar]
  71. Zhou, C.; Jiang, H.; Gao, J. Formation mechenism of social spatial differentiation of the urban public services: A case study on the parks of Guangzhou. City Plan. Rev. 2013, 37, 84–89. [Google Scholar]
  72. Yao, S.; Li, Y.; Quan, X.; Xu, J. Applying the driver-pressure-state-impact-response model to ecological restoration: A case study of comprehensive zoning and benefit assessment in Zhejiang Province, China. Glob. Ecol. Conserv. 2024, 55, e3222. [Google Scholar] [CrossRef]
  73. Kalinauskas, M.; Bogdzevič, K.; Gomes, E.; Inácio, M.; Barcelo, D.; Zhao, W.; Pereira, P. Mapping and assessment of recreational cultural ecosystem services supply and demand in Vilnius (Lithuania). Sci. Total Environ. 2023, 855, 158590. [Google Scholar] [CrossRef] [PubMed]
  74. Zhu, J.; Lu, H.; Zheng, T.; Rong, Y.; Wang, C.; Zhang, W.; Yan, Y.; Tang, L. Vitality of Urban Parks and Its Influencing Factors from the Perspective of Recreational Service Supply, Demand, and Spatial Links. Int. J. Environ. Res. Public Health 2020, 17, 1615. [Google Scholar] [CrossRef]
  75. Xu, S.; Li, J.; Gao, X.; Zhao, H.; Hu, J.; Yuan, S. Framework for analyzing the relationship between supply, demand, and flow of recreational services in urban park green spaces. Ecol. Indic. 2024, 166, 112403. [Google Scholar] [CrossRef]
  76. Cai, W.; Jiang, W.; Du, H.; Chen, R.; Cai, Y. Assessing Ecosystem Services Supply-Demand (Mis)Matches for Differential City Management in the Yangtze River Delta Urban Agglomeration. Int. J. Environ. Res. Public Health 2021, 18, 8130. [Google Scholar] [CrossRef] [PubMed]
  77. Geijzendorffer, I.R.; Martín-López, B.; Roche, P.K. Improving the identification of mismatches in ecosystem services assessments. Ecol. Indic. 2015, 52, 320–331. [Google Scholar] [CrossRef]
  78. Cheng, X.; Van Damme, S.; Li, L.; Uyttenhove, P. Evaluation of cultural ecosystem services: A review of methods. Ecosyst. Serv. 2019, 37, 100925. [Google Scholar] [CrossRef]
  79. Liu, W.; Dong, C.; Chen, W. Mapping and Quantifying Spatial and Temporal Dynamics and Bundles of Travel Flows of Residents Visiting Urban Parks. Sustainability 2017, 9, 1296. [Google Scholar] [CrossRef]
  80. Dang, H.; Li, J. Supply-demand relationship and spatial flow of urban cultural ecosystem services: The case of Shenzhen, China. J. Clean. Prod. 2023, 423, 138765. [Google Scholar] [CrossRef]
  81. Xia, C.; Yeh, A.G.; Zhang, A. Analyzing spatial relationships between urban land use intensity and urban vitality at street block level: A case study of five Chinese megacities. Landsc. Urban Plan. 2020, 193, 103669. [Google Scholar] [CrossRef]
  82. Qiao, Y.; Sun, H.; Qi, J.; Liu, S.; Li, J.; Ji, Y.; Wang, H.; Peng, Y. Examining water bodies’ cooling effect in urban parks with buffer analysis and random forest regression. Urban Clim. 2025, 59, 102301. [Google Scholar] [CrossRef]
  83. Syrbe, R.; Walz, U. Spatial indicators for the assessment of ecosystem services: Providing, benefiting and connecting areas and landscape metrics. Ecol. Indic. 2012, 21, 80–88. [Google Scholar] [CrossRef]
  84. Tao, Y.; Wang, H.; Ou, W.; Guo, J. A land-cover-based approach to assessing ecosystem services supply and demand dynamics in the rapidly urbanizing Yangtze River Delta region. Land Use Policy 2018, 72, 250–258. [Google Scholar] [CrossRef]
  85. Chen, J.; Liu, B.; Li, S.; Jiang, B.; Wang, X.; Lu, W.; Hu, Y.; Wen, T.; Feng, Y. Actual supply-demand of the urban green space in a populous and highly developed city: Evidence based on mobile signal data in Guangzhou. Ecol. Indic. 2024, 169, 112839. [Google Scholar] [CrossRef]
  86. Jiang, Q.; Wang, G.; Li, J. Public Perception of Cultural Ecosystem Services in Urban Parks: A Case Study of Urban Parks of Jinan City Proper. Landsc. Archit. 2022, 29, 127–133. [Google Scholar]
  87. Torres, A.C.; Prévot, A.; Nadot, S. Small but powerful: The importance of French community gardens for residents. Landsc. Urban Plan. 2018, 180, 5–14. [Google Scholar] [CrossRef]
  88. Zhong, S.; Li, F.; Liu, Z. Evaluation and optimization strategies of cultural ecosystem services in community parks in central urban area of Beijing. J. Beijing For. Univ. 2024, 46, 126–137. [Google Scholar]
  89. Dai, D.; Chen, Y.; Dai, K. Evaluating cultural ecosystem services in China’s modern historic parks: A sentiment computing approach. Urban For. Urban Green. 2024, 95, 128314. [Google Scholar] [CrossRef]
  90. Xing, L.; Liu, Y.; Liu, X.; Wei, X.; Mao, Y. Spatio-temporal disparity between demand and supply of park green space service in urban area of Wuhan from 2000 to 2014. Habitat Int. 2018, 71, 49–59. [Google Scholar] [CrossRef]
  91. Wu, J.; Wang, L.; Pijanowski, B.; Omrani, H.; Liang, A. Greenspace equity across variation in residential densities: Insights for urban sustainability. Habitat Int. 2025, 157, 103310. [Google Scholar] [CrossRef]
  92. Cao, H.; Li, P.; Song, W.; Chen, J.; Chen, C. Does supply match demand? Assessing the relationship between urban parks and residents from the perspective of equity and efficiency. Urban For. Urban Green. 2024, 99, 128469. [Google Scholar] [CrossRef]
  93. Qin, J.; Tong, S.; Wang, Q. Exploring the disparities in urban park accessibility from multiple demand perspectives: A case study in Beijing, China. Ecol. Indic. 2024, 163, 112124. [Google Scholar] [CrossRef]
Figure 1. Location of Shanghai and its districts, China. District abbreviations: BS (BaoShan); YP (YangPu); HK (HongKou); JA (JingAn); PT (PuTuo); JD (JiaDing); CN (ChangNing); MH (MinHang); XH (XuHui); HP (HuangPu); PD (PuDong); JS (JinShan); CM (ChongMing); QP (QingPu); FX (FengXian); SJ (SongJiang).
Land 14 00455 g001
Figure 2. Distribution of urban parks in Shanghai.
Land 14 00455 g002
Figure 3. The framework for identifying the supply and demand of CESs in urban parks.
Land 14 00455 g003
Figure 4. The distribution of CES supply in Shanghai. The CES supply of parks; general value; aesthetic value; health value; recreational value; and cultural and educational value.
Land 14 00455 g004
Figure 5. The distribution of CES demand in Shanghai. The CES demand of parks; population density; land use intensity; residential land proportion; and commercial facility density.
Land 14 00455 g005
Figure 6. Spatial distribution of CES supply and demand using bivariate mapping: (a) supply distribution by quantiles; (b) demand distribution by quantiles; and (c) bivariate mapping of supply–demand.
Land 14 00455 g006
Figure 7. Spatial distribution of CES supply and demand using Local Moran’s I: (a) cluster of CES supply; (b) cluster of CES demand; (c) cluster of CES supply–demand.
Land 14 00455 g007
Figure 8. Spatial pattern of CES supply–demand in Shanghai.
Land 14 00455 g008
Table 1. Functions and size of different parks in Shanghai.
Types of ParksFeatures and FunctionNumberService Radius (km)Area Range (ha)Average Area (ha)
Comprehensive parksMunicipal and regional parks suitable for conducting various outdoor activities, equipped with comprehensive recreational facilities providing multiple services.4133.55~140.328.28
Theme parksParks with specific themes and corresponding service facilities, including zoos, botanical parks, historical parks, and heritage parks, etc.1851.6~20749.78
Community parksParks equipped with basic recreational facilities, primarily serving residents within a certain community for nearby daily leisure activities.22110.35~51.74.51
Small-scale urban parksParks that are independently sited, relatively small in scale or varied in shape, conveniently accessible to nearby residents, and offer certain recreational functions.240.50.07~7.471.11
Table 2. Variables that may affect the general supply of urban parks.
TypesFormulaVariablesDescriptionsUnitsFormula
Availability
(AVA)
AVA = PAC + PCR + PSRPark Area Per Capita (PAC)The park area per capita of urban parksm2 P A C = S P P
where S P is the total area of urban parks, and P is the total population of the city.
Park Area Coverage Rate (PCR)The park coverage rate of urban parks% P C R = S P   S b
where S P is the total area of urban parks, and S b is the urban built-up area of the city.
Park Service Coverage Rate (PSR)The coverage rate of parks benefits residents in geographical regions% P S R = S p s S b
where S P s is the total area of the urban parks’ service radius, and S b is the urban built-up area of the city.
Accessibility
(ACC)
ACC = PL × TCIPark Location (PL)The distance to the urban centermCalculated in ArcGIS 10.7, the network distance from the park centroid to the centroid of the urban built-up area was derived using
Transportation Facilities Coverage Index (TCI)The number of transportation facilities (bus, subway, park) within an 800 m buffer of the park- T C I = T S b
where T is the total amount of transportation POIs, and S b is the urban built-up area of the city.
Attractiveness
(ATT)
A T T = 1 A A p = 1 n   S p s ( P E Q + P G R )
where   S p s is the total area of the urban park’s service radius, and A A is the area of the sub-district where the park is located.
Park Environmental Quality (PEQ)The status of the greening, scenery, detailed landscape, and quality of the park environment.GradePEQ = i = 1 N p S i , p N p
N p   is   the   number   of   valid   comments ,   and   S i , p   is   the   score   given   by   each   user   i   to   park   p .
Park Green Coverage Ratio (PGR)The vegetation coverage rate of urban parks% P G R = S V S P
where   S P is the total area of urban parks, S V   is the total area of the vegetation in parks.
* Among them, ATT is the park-level variable, while the others are sub-district-level factors. In order to unify the research scale, it is necessary to convert the park-level indicators to the sub-district scale.
Disclaimer/Publisher’s Note: The statements, opinions and data contained in all publications are solely those of the individual author(s) and contributor(s) and not of MDPI and/or the editor(s). MDPI and/or the editor(s) disclaim responsibility for any injury to people or property resulting from any ideas, methods, instructions or products referred to in the content.

