Abstract
In the age of digital twins, the digitalization of the urban environment is one of the key aspects in the optimization of urban management. The goal of urban digitalization is to provide a digital representation of physical infrastructure, data, information, and procedures for the management of complex anthropogenic systems. To meet this new goal, one must be able to understand the urban system through the integrated use of different methods in a multi-level approach. In this context, mobile surveying is a consolidated method for data collection in urban environments. A recent innovation, the mobile mapping system (MMS), is a versatile tool used to collect geospatial data efficiently, accurately, and quickly, with reduced time and costs compared to traditional survey methods. This system combines various technologies such as GNSS (global navigation satellite system), IMU (inertial measurement unit), LiDAR (light detection and ranging), and high-resolution cameras to map and create three-dimensional models of the surrounding environment. The aim of this study was to analyze the limitations, possible implementations, and the state of the art of MMSs for road infrastructure monitoring in order to create a DT (digital twin) for road infrastructure management, with a specific focus on extracting value-added information from a survey dataset. The case study presented here was part of the Turin Digital Twin project. In this context, an MMS was tested in a specific area to evaluate its potential and integration with other data sources, adhering to the multi-level and multi-sensor approach of the DT project. A key outcome of this work was the integration of the extracted information into a comprehensive geodatabase, transforming raw geospatial data into a structured tool that supports predictive maintenance and strategic road asset management toward DT implementation.
1. Introduction
As urban environments evolve in response to globalized societies, data-driven processes, and ecological imperatives, there is a growing need for innovative tools that can capture, analyze, and manage the complexity of contemporary urban spaces. This study integrated a MMS (mobile mapping system) within the framework of urban morphology to address the challenge of monitoring road infrastructure in dense urban environments, using the city of Turin as a case study. The effective management of road infrastructure has become a critical challenge for modern cities, particularly as urban areas grow in complexity and scale. Road networks, as essential components of urban infrastructure, require constant monitoring and maintenance to ensure safety, efficiency, and sustainability. However, the traditional methods of road asset management often struggle to meet the demands of modern urban environments due to their time-consuming nature, limited scalability, and inability to provide comprehensive insights.
MMSs are increasingly being used in the field of urban road monitoring. They offer a highly efficient way to collect, analyze, and manage data regarding road conditions and infrastructure. These systems integrate multiple sensors, such as LiDAR (light detection and ranging), cameras, GNSS (global navigation satellite system), and IMU (inertial measurement unit), which are mounted on vehicles and precisely collect data in real time as the vehicle moves through the urban environment. MMSs are extremely effective in monitoring urban road conditions, including detecting potholes, cracks, ruts, and other surface changes. LiDAR’s ability to map a surface in three dimensions, combined with high-resolution imagery, allows road authorities to pinpoint defects down to the millimeter. Urban roads are densely built up with infrastructure such as traffic lights, signs, barriers, drainage systems, and sidewalks; this system can map and catalogue these elements, aiding in asset management and road maintenance as well as ensuring that infrastructure complies with regulations and safety standards. Furthermore, road signage and markings can be checked for visibility, reflectivity, and compliance with traffic regulations. This is particularly important in urban settings, where worn-out signs or faded lane markings can pose safety risks. Camera systems can also help with recognizing and classifying traffic signs. All these aspects can contribute to the implementation of digital twins, which are digital replicas of urban road environments and essential for urban planning, simulations, and decision-making processes related to traffic management, infrastructure expansion, or smart city initiatives.
The case study presented focused on the Spina Centrale, a transformative infrastructure project that plays a central role in reshaping Turin’s urban landscape and is integrated into the broader Turin Digital Twin initiative. In this context, an MMS was tested in a specific area to evaluate its potential and integration with other data sources, adhering to the multi-level and multi-sensor approach of the DT project. Since 2022, the municipality of Turin, in collaboration with the Politecnico di Torino, has been developing a digital twin of the entire city based on aerial hybrid data acquisition, with the aim of creating an accessible, navigable digital environment that reflects the behavior of the real world and tracks its evolution over time, including the impact of future urban development [1,2,3]. The current DT of Turin was built upon aerial data acquired in 2022 using a Leica CityMapper-2, developed by Leica Geosystem (part of Hexagon, Heerbrugg, Switzerland), a hybrid airborne sensor combining optical and LiDAR technologies. The Leica CityMapper-2 system is equipped with four oblique RGB cameras inclined at 45°, two nadir-facing cameras (RGB and NIR), a LiDAR unit, and integrated GNSS/IMU technology for precise georeferencing. This aerial survey was conducted at an altitude of approximately 1000 m, achieving a GSD (ground sampling distance) of 5 cm and a point density of 30–40 points per square meter.
In summary, this paper focuses on leveraging an MMS to support road infrastructure monitoring within the broader framework of the Turin Digital Twin project. The project aims to integrate data from multiple sources, including aerial and terrestrial datasets, to create an accurate and dynamic representation of Turin’s road network. By addressing specific challenges such as the scalability of traditional methods and the need for multi-dimensional data, this study contributes to the ongoing development of innovative tools for urban infrastructure management.
The remainder of this paper is organized as follows: Section 1 reviews the state of the art in road infrastructure digitalization and MMS technologies. Section 2 introduces the dataset and methodologies employed in this study, while Section 3 presents the results of the analysis. Finally, Section 4 discusses the implications of the findings and outlines future directions for research and application.
1.1. Aim of This Paper
This research addresses the municipality’s need for an innovative and scalable system for road asset management, leveraging an MMS to enhance urban infrastructure monitoring. By integrating multi-sensor data into a structured framework, this approach provides actionable insights to support urban planners, policymakers, and researchers in developing sustainable and data-driven maintenance strategies.
Effective road management is essential for ensuring safety, cost-efficiency, and urban mobility. The deterioration of pavement—such as cracks, potholes, and deformations—poses risks for both vehicles and pedestrians, reducing braking efficiency and increasing accident likelihood. From an economic perspective, continuous monitoring enables preventive maintenance, the slowing of pavement degradation, and reducing costly emergency interventions. Additionally, well-maintained roads improve the overall quality of life by minimizing traffic disruptions and ensuring smoother mobility.
Modern urban analysis requires high-resolution spatial data, often at a millimeter scale, which traditional aerial datasets alone cannot provide. While the Leica CityMapper-2, used in the initial phase of the Turin DT initiative, provided a macro-scale perspective of the urban fabric, its resolution was insufficient for detecting the details of road surface conditions. To address this limitation, a terrestrial MMS survey was conducted using a RIEGL VMY-2 (RIEGL Laser Measurement System, Horn, Austria) equipped with dual LiDAR sensors and a spherical camera (Teledyne FLIR, Wilsonville, OR, USA) to capture high-density 3D point clouds.
This integration of aerial and terrestrial data enables a multi-scale approach, ensuring both large-scale contextualization and high-precision local analysis. The MMS dataset, having a range accuracy of 10 mm and a density of 1100 points per square meter, significantly enhances the detection of road defects and infrastructure elements.
The core objective of this study was to demonstrate how MMS technologies can be employed to build an urban infrastructure management system. By extracting value-added information from high-resolution MMS datasets, this methodology supports several municipal functions, including the following:
- -
- Pavement condition assessment: enabling predictive maintenance and optimized intervention planning.
- -
- Urban asset inventory: mapping horizontal road markings, utility poles, traffic signs, and overhead structures to enhance road safety and regulatory compliance.
- -
- Integration into a DT: structuring data into a dynamic model that supports real-time monitoring and decision making for urban planning.
By structuring geospatial data into an integrated management system, this approach bridges the gap between raw sensor data and actionable urban planning tools.
This study not only highlights the advantages of MMS-based monitoring but also explores the potential for scalable and transferable solutions that are applicable to other urban environments. The seamless integration with DT frameworks paves the way for next-generation infrastructure management, transforming road systems into dynamic, data-driven networks capable of adapting to evolving urban needs.
Beyond providing a one-time assessment of road conditions, this research aimed to establish a continuous monitoring framework, leveraging MMS technology to systematically update the DT of Turin. Given the dynamic nature of urban environments, especially road pavement conditions, an ongoing data acquisition strategy is essential to ensure timely interventions, optimize maintenance efforts, and support sustainable urban management.
1.2. Road Infrastructure Digitalization
This section provides an overview of the current progress and methods of digitizing road infrastructure for management purposes.
Digitizing road infrastructure represents a transformative step toward modernizing transportation networks and enhancing urban sustainability. This process integrates advanced technologies to enable real-time monitoring, data-driven decision making, and improved efficiency in managing road systems. At its core, digitalization combines geospatial data, IoT sensors, and artificial intelligence, creating smarter systems capable of addressing the challenges of contemporary cities. The alignment of digitalization efforts with global sustainability goals is particularly significant. By optimizing resource usage and reducing environmental impact, these technologies contribute to better air quality and reduced carbon emissions. For example, energy-efficient lighting systems on highways and traffic flow optimization not only lower operational costs but also support eco-friendly urban development.
IoT-enabled devices are pivotal in the digital transformation of road infrastructure, providing real-time data on critical parameters such as traffic flow, structural integrity, and environmental conditions. These devices act as the backbone for proactive measures like predictive maintenance, allowing potential issues to be identified and resolved before they escalate into costly or disruptive problems. However, creating a comprehensive and accurate digital replica of road assets requires integrating data from diverse sensors and technologies. Artificial intelligence and machine learning significantly enhance the value of these datasets by analyzing large volumes of information, generating actionable insights for traffic management, condition maintenance, energy optimization, and efficient resource allocation [4,5]. Yet, the diversity of the urban environment necessitates inputs from multiple sources to create a holistic representation of road infrastructure.
Digital twins exemplify this integration, representing one of the most impactful advancements in infrastructure digitalization [6,7]. These high-fidelity, real-time digital replicas of physical road assets rely on the data collected through a combination of terrestrial, aerial, and satellite technologies. Terrestrial systems, such as mobile mapping platforms equipped with LiDAR, cameras, and GNSS, provide millimeter-level details of pavement conditions and structural elements. Aerial systems contribute a large-scale context through orthophotos and elevation models, while satellite imagery offers long-term monitoring and regional overviews. The synergy of these technologies ensures that DTs are not merely static models but dynamic tools capable of simulating scenarios, optimizing infrastructure usage, and preparing for disasters with unprecedented accuracy. By synthesizing data from multiple sensors and platforms, cities can make informed decisions, enhance their resilience, and ensure their infrastructure evolves to meet modern demands. These multi-sensor, multi-technology approaches underscore the necessity of integrating diverse datasets to capture the full complexity of urban road systems. It is only through such comprehensive methodologies that cities can fully realize the potential of digital twins, ensuring they serve as effective tools for sustainable urban management and infrastructure optimization.
In this context, the digitalization of road infrastructure relies on advanced mapping systems to create a comprehensive dataset that captures all elements of the road network. This dataset must be grounded in geospatial information to accurately define the location and attributes of each feature. Key elements, such as damage details, road signs, and road markings, must be precisely georeferenced to ensure their accurate representation within the digital model. This geospatial foundation allows for the integration of various data types, enabling detailed analyses and facilitating the development of digital twins. By mapping both the physical and functional aspects of road infrastructure, this approach ensures that each component is not only correctly positioned but also contextually relevant within the broader system.
While the potential of digitalizing road infrastructure is vast, there are challenges to overcome. Ensuring interoperability between systems, managing the high initial costs of adopting advanced technologies, and addressing skill gaps in personnel are key hurdles. Despite these obstacles, the benefits of digitalization—sustainability, efficiency, and resilience—make it an essential pursuit for the future of urban infrastructure. This shift not only transforms the way cities manage transportation networks but also sets the foundation for smarter, more adaptive, and sustainable urban systems. It is a vital step in aligning urban growth with the needs of the 21st century, ensuring cities remain functional, resilient, and environmentally responsible.
1.3. State of the Art of MMSs for Road Infrastructure Monitoring
This section aims to present the state of the art in the MMSs used for road infrastructure monitoring, emphasizing the main types of MMS solutions that have become prominent in the industry today. Based on their form factor and use cases, MMSs can be categorized into four primary types: handheld systems, wearable systems, trolley-based systems, and vehicle-mounted systems. The handheld and wearable system solutions involve portable devices equipped with LiDAR, cameras, and GNSS receivers. They are ideal for capturing high-detail data in areas that are difficult to access with vehicles, such as narrow streets or construction sites. The portability of these systems allows for flexibility in mapping complex environments with obstacles like buildings, trees, or other infrastructure elements. Trolley-based systems are mounted on trolleys that can be pushed manually or autonomously through an environment. They are particularly effective for collecting detailed data on pedestrian areas, parks, or paved walkways. Trolley-based systems are often equipped with high-resolution cameras and LiDAR sensors, providing a detailed view of road conditions, cracks, and other surface deformations. Vehicle-mounted systems are the most widely used MMS solutions for road infrastructure monitoring. Mounted on cars, vans, or trucks, they combine multiple sensors to capture large-scale road and infrastructure data efficiently. Vehicle-mounted systems are highly scalable, capable of covering large areas in short periods, and are often used in urban environments for comprehensive road condition assessment and monitoring.
In recent years, the MMSs for road monitoring have undergone significant advancements, driven by the integration of cutting-edge technologies such as LiDAR, GNSS, IMU, high-resolution cameras, and AI (artificial intelligence). The combination of these technologies allows for the accurate detection of road defects, such as potholes, cracks, ruts, and surface deformations, while facilitating the cataloguing of infrastructure elements like traffic signs, lights, barriers, and sidewalks. This evolution has been particularly impactful in urban settings, where dense infrastructure requires high-precision mapping. These systems are now capable of generating millimeter-level accuracy, enabling detailed assessments of road surfaces, ensuring infrastructure compliance with safety regulations, leveraging AI algorithms to automate the recognition of road features and defects, as well as significantly improving the efficiency and accuracy of road maintenance planning and urban infrastructure management. In summary, the current MMS solutions are versatile and can be tailored to different use cases based on their mobility and scale of operation. While handheld and wearable systems offer flexibility and access to hard-to-reach areas, vehicle-mounted systems provide efficiency and scalability, making them ideal for large-scale road monitoring projects, as in the case of the Turin DT.
An MMS mounted on a vehicle for urban applications typically consists of several key components designed to collect high-precision spatial data in real time. Specifically, these systems include LiDAR sensors, which emit laser pulses to measure the distance between the sensor and the surrounding objects. LiDAR sensors are evolving rapidly, with demand driven by their roles in 3D mapping, autonomous driving, and urban infrastructure monitoring. Solid-state LiDAR and MEMS (microelectromechanical system)-based LiDAR systems are becoming popular for vehicle-mounted applications due to their compact size and cost-effectiveness [8,9]. A GNSS receiver ensures the precise geolocation of the vehicle during data collection by using satellite signals, while the IMU tracks the vehicle’s orientation and movement. When used together, GNSS and IMU data correct for sudden movements or interruptions in satellite signals, ensuring continuous and precise positioning, even in challenging environments such as tunnels or urban canyons [10,11]. Multiple cameras are often employed to capture high-quality images of the surroundings, providing the visual context that complements the 3D data. Additionally, a central computing system processes the data collected by these various sensors in real time or stores them for post-processing. The integration of these elements allows for the detailed mapping and monitoring of urban road infrastructure.
The increasing use of MMSs for urban road monitoring is supported by various studies that have highlighted their effectiveness. Papers such as those referenced in [10,12] provide detailed analyses of different MMS configurations, exploring their technical specifications, precision, and use cases. The papers emphasize the adaptability of MMSs for a variety of urban applications, from road surface monitoring to infrastructure management. One of the key advantages of MMSs, as discussed in [13,14], is the significant improvements in data collection speed and efficiency over traditional methods like manual inspection. By allowing data acquisition while the vehicle is in motion, MMSs drastically reduce the time needed for road condition detection, enabling the collection of data across large areas within short time frames. This high-frequency data collection ensures that road conditions are assessed more promptly, facilitating better maintenance planning and resource allocation.
Studies [11,15] discuss various data collection methods employed in MMSs, with a specific focus on the importance of accurate positioning and orientation technologies like GNSS and IMU. These components are critical in ensuring the precision of the point cloud data, as they allow the system to track the vehicle’s position and movement accurately. This ensures that the integrity of the spatial data collected—whether from LiDAR sensors or high-resolution cameras—is maintained, even in challenging urban environments where satellite signals might be obstructed. These also emphasize the role of oblique imaging in improving the quality of point clouds in photogrammetric applications. Oblique images provide additional perspectives of objects that would otherwise be hidden in nadir views, contributing to a more complete and detailed reconstruction of the environment. This is particularly useful in urban areas where buildings and other infrastructure create complex geometries. Accurate positioning and orientation technologies work in tandem with oblique imaging to enhance the overall accuracy and quality of the 3D models generated, making the MMS a powerful tool for urban mapping applications.
Following [11,14,15], MMSs have been transforming the way road maintenance management is handled, offering numerous benefits compared to traditional methods like manual inspections. One of the most important advantages of an MMS is its speed and efficiency in data collection. By mounting the system on a vehicle, it can capture road condition data in real time as the vehicle moves. This allows for large sections of the road network to be surveyed in a short time, leading to more frequent updates on road conditions. With faster data collection, cities can assess and address road issues more promptly, ensuring that maintenance operations are carried out in a timely and efficient manner. In addition to speed, MMS technology provides extremely detailed 3D data. The LiDAR sensors enable the creation of high-resolution 3D maps of roads and the surrounding infrastructure, identifying specific road damage such as cracks, potholes, and surface deformations with incredible precision. The high-resolution cameras that are part of the system can colorize the LiDAR point clouds, offering a visual context to the 3D data and further aiding in the documentation of road conditions. Another critical benefit of the MMS is its potential for cost reduction and risk mitigation. Traditional manual inspections can be time-consuming and costly, requiring extensive fieldwork. MMSs, by comparison, drastically reduce the need for such labor-intensive efforts, cutting down on labor costs and making data collection more efficient. Additionally, the detailed 3D information collected allows for the better planning of maintenance operations, which helps avoid emergency repairs, which tend to be more expensive. In terms of safety, an MMS reduces the exposure of workers to dangerous road environments, as fewer on-site inspections are required.
The data collected by MMSs are also highly versatile and can be integrated into GISs (Geographic Information Systems) and BIMs (Building Information Models). This integration facilitates the creation of comprehensive databases of road infrastructure that can be used for a range of applications, from maintenance planning to traffic simulations. The ability to centralize and analyze this information greatly improves the management of urban road infrastructure [16,17,18]. Furthermore, MMS technology can leverage advancements in automation. The use of machine learning and computer vision techniques allows for the automated detection and classification of road damage, further improving the efficiency of the entire process. This automation minimizes the need for manual data interpretation and allows authorities to address road issues more quickly and effectively [19,20].
In summary, the MMS offers an accurate, efficient, and cost-effective approach to road maintenance management. By integrating advanced technologies, MMSs provide detailed data that enhance the planning and execution of maintenance tasks, ultimately leading to better-maintained road infrastructure and reduced costs over time.
The current market for these sensors is rapidly evolving, driven by advancements in technologies like LiDAR, GNSS, IMU, and high-resolution cameras. Leading companies are offering systems that integrate multiple high-performance sensors for a wide range of urban applications, including road infrastructure monitoring. As technologies like LiDAR, GNSS, IMU, and high-resolution cameras continue to improve, MMSs are becoming faster, more accurate, and easier to operate, opening new opportunities in fields like smart city planning, asset management, and road infrastructure maintenance. Table 1 summarizes the vehicle-mounted MMSs currently available on the market from leading companies. From this table, it is possible to understand the impact of MMSs on the market, showcasing the range of available technologies and their varying specifications. This diversity reflects the growing interest in MMS applications both in academic research and in practical implementation, especially in urban environments [21,22]. MMSs are able to semi-automatically produce high-quality information and thus contribute to the smart city and DT concepts.

Table 1.
This table provides an overview of the main vehicle-mounted systems offered by the leading companies in the MMS market.
MMS technology is one of the most innovative solutions for road infrastructure digitalization, offering advanced capabilities for mapping, monitoring, and maintaining road assets such as signage, traffic signals, and pavement conditions. Its ability to generate regularly updated and georeferenced inventories of urban infrastructure minimizes the reliance on traditional labor-intensive inspections, enhancing decision-making processes and operational efficiency [11].
As highlighted in previous studies [14,23,24,25], MMSs play a crucial role in road asset management by providing accurate, high-resolution datasets. Integrating MMS-derived data into urban management workflows enables automatic change detection, replacing manual surveys with automated monitoring approaches. This is particularly relevant for road maintenance, where the early detection of pavement defects improves safety and extends infrastructure lifespan. Moreover, the adoption of MMS technology significantly enhances road safety by enabling the early identification of critical issues [26]. MMS data have been successfully applied to assess the positioning of speed signs before road curves [27], to ensure compliance with traffic regulations, and to evaluate sight distances for passing lanes on highways [28], directly contributing to improved transportation planning.
The impact of this technological progress is evident in various cities that are actively developing DTs and incorporating MMS technology into their frameworks.
For example, Singapore has integrated an MMS into its national digital twin initiative through the SLA (Land Survey Division of the Singapore Land Authority) since 2017 [29]. Similarly, Milan began incorporating MMS technology in 2022, acquiring data for 2555 km of streets to support urban infrastructure management [30,31]. In Vienna, an MMS has been used to complement aerial datasets, improving the precision of urban models [32,33]. Meanwhile, the 3DNL project, a collaborative initiative, integrates both aerial and terrestrial data acquisition for applications such as asset management, solar capacity calculation, and shadow analysis [34].
These real-world applications underscore the growing importance of MMSs in urban digitalization efforts, reinforcing the need for innovative methodologies that effectively integrate multi-sensor data into scalable management frameworks. This research builds on these advancements by demonstrating how MMS technology can enhance urban infrastructure monitoring, particularly for road asset management, through the extraction of value-added geospatial information.
2. Materials and Methods
2.1. Study Area
The urban area selected for data collection is presented in Figure 1 and included a portion of the Cit Turin neighborhood, part of the 3rd district precinct of Turin, for an area of about 1.15 km2. The selected area, marked by the presence of the Spina Centrale, served as a strategic setting for this study for multiple reasons. The Spina Centrale is one of Turin’s most significant infrastructure projects in recent years, designed to connect the northern and southern parts of the city with a new arterial road. This infrastructure has spurred substantial urban transformation in the area over the past 15 years, which has been further enhanced by strategic developments like a high-speed railway station, a skyscraper, and the expansion of the Politecnico di Torino’s university campus. This area also encompasses important public infrastructure, including the city’s courthouse, the bus terminal, several metro stations, a public park, and a neighborhood market. The dense urban fabric, described in Figure 2, combined with shaded streets, as illustrated in Figure 3 through an orthophoto obtained from aerial surveys, highlight the limitations in acquiring and conducting detailed analyses of imagery. Shaded streets, in particular, complicate accurate identification and monitoring of road and infrastructure conditions.
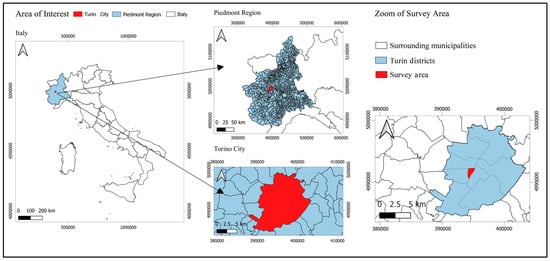
Figure 1.
Localization of the area of interest.
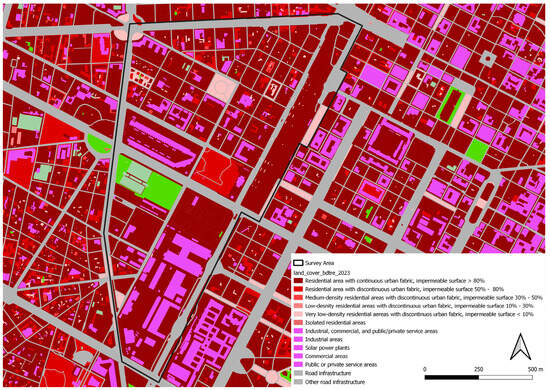
Figure 2.
Map of the urban density of the studied area, obtained from the Land Cover Piemonte dataset provided by the Geoportale Piemonte. The map shows the spatial distribution of land use and urban density, providing valuable information on the characteristics of the built environment. Note in particular that the study area consists of a residential area with continuous urban fabric with 80% being impermeable surfaces.
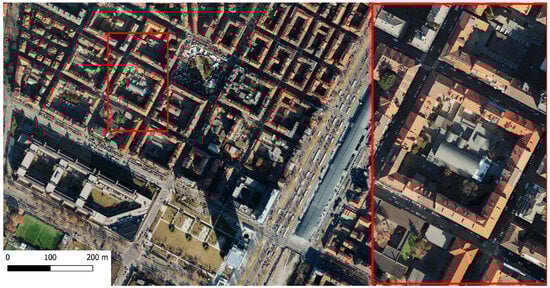
Figure 3.
An orthophoto (dated February 2022, flight altitude 1000 m) illustrates, with a magnified area, the urban environment with dense shading caused by very close buildings and narrow streets.
The urban morphology of the study area is characterized by a predominantly residential, well-defined architecture to the west of the historic center, which is known for its distinctive, regularly structured character. This is typical of 19th and early 20th century urban expansions, with rectilinear streets forming a well-organized grid. This expansion reflects the idea of an ordered city, with European influences and a strong link to the rational and functional urban planning model.
The development of the urban layout is characterized by a regular pattern, which is typical of areas planned during the Italian post-unification period. This layout reflects the influence of a regular grid, which guarantees an even distribution of urban spaces. The blocks are medium to large and feature mostly continuous buildings, with inner courtyards serving as semi-private spaces for residents.
The majority of the edifices are multi-story palaces, frequently exhibiting a profuse decorative character. The area is characterized by significant examples of Art Nouveau architecture, including the Palazzo della Vittoria and the Palazzo Fenoglio-Lafleur. However, the city also boasts modern construction, such as the Intesa Sanpaolo skyscraper, which was designed by Renzo Piano and has become an iconic element of Turin’s new contemporary skyline.
The city also boasts a rich variety of commercial activities, markets, schools, and green spaces, including small gardens and tree-lined areas, contributing to the overall livability of the city.
These factors made this area an exemplary case study for the project, as it presents significant challenges, such as the need to overcome the limitations imposed by aerial-only data acquisition. Thus, this section of the city provided a complex and relevant context to test and demonstrate the effectiveness of mobile mapping systems in integrating and enhancing data for urban infrastructure monitoring.
2.2. Sensor and System Overview
The ground acquisition sensor used in this study was a RIEGL VMY-2 (RIEGL Laser Measurement Systems, Horn, Austria), a highly precise and compact dual-scanner mobile mapping system, tailored for capturing detailed spatial data in complex urban environments, as shown in Figure 4. It integrates two high-resolution RIEGL miniVUX-HA LiDAR (RIEGL Laser Measurement Systems, Horn, Austria) sensors mounted in an angled orientation, which significantly enhance the data’s coverage and precision. This configuration supports efficient data capture at a rate of up to 300 scan lines per second and achieves a pulse repetition rate of 600 kHz, yielding a dense point cloud that effectively captures detailed environmental features. In addition to its advanced LiDAR capabilities, the VMY-2 offers optional integration with high-resolution cameras, enabling simultaneous image acquisition alongside LiDAR data. This fusion of geometric 3D data and visual imagery results in a comprehensive dataset, ideal for applications requiring high levels of detail, such as urban infrastructure monitoring and complex mapping tasks. The system’s design allows it to capture high-density point cloud patterns even at common traffic speeds, maintaining accuracy even with single-pass acquisitions. At speeds of up to 80 km/h, it achieves an average point density of 1100 points per square meter on pavement surfaces. The LiDAR sensors provide a full 360-degree field of view and maintain a range accuracy of 10 mm, making the VMY-2 exceptionally suited for capturing intricate details in urban infrastructure contexts.
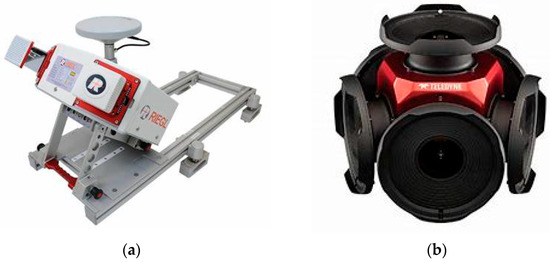
Figure 4.
(a) The LiDAR sensor: Riegl VMY-2; (b) the spherical camera: Teledyne FLIR Ladybug.
In summary, the RIEGL VMY-2 sensor setup includes multiple integrated components essential for high-precision data acquisition. This configuration consists of the following:
- -
- GNSS antenna: this antenna works alongside the IMU for precise georeferencing, crucial for mapping exact locations even in challenging urban environments.
- -
- Two LiDAR sensors: the dual RIEGL mini VUX-HA LiDAR units are angled to maximize spatial coverage and accuracy, capturing high-density point clouds suitable for detailed 3D mapping.
- -
- IMU/GNSS unit: this unit combines inertial measurements with GNSS data, compensating for vehicle movement and improving positional accuracy, especially in areas where GNSS signals may be obstructed.
- -
- Spherical camera: This camera captures 360-degree panoramic images, providing a comprehensive visual context that enhances the LiDAR data, supporting a more detailed analysis of infrastructure elements. For this acquisition, the FLIR Ladybug6 camera (Teledyne FLIR, Wilsonville, OR, USA) was used, known for its high-resolution output and precise image stitching capabilities. Specifically designed for mobile mapping applications, the Ladybug6 can capture high-quality spherical images from moving platforms, enabling it to document the environment in real time with exceptional clarity. This integration allows for seamless visual and geometric data fusion, which is beneficial for complex urban mapping and infrastructure monitoring tasks.
- -
- Control unit: serving as the system’s central processing hub, the control unit manages data synchronization, sensor control, and storage.
Although the alternative MMS platforms listed in Table 1 offer comparable functionalities, the selection of the RIEGL VMY-2 was based on its specific technical advantages and its suitability for the objectives of this study. The high-resolution data acquisition of the LiDAR system provided millimeter-level accuracy, which is crucial for the assessment of road conditions. In addition, the dual-scanner setup with its angled LiDAR orientation ensured improved coverage of vertical and horizontal elements, making it well suited for mapping the urban road network. The integration of a spherical camera was essential for the extraction of semantic attributes, especially for surface defects.
2.3. Dataset Overviews and Characteristics
The dataset used in this study was collected during a field survey conducted on 23 October 2023, with the primary objective of supporting the implementation and continuous updating of the Turin DT, providing detailed information about the urban environment. It comprised two main components: a LiDAR-generated point cloud and panoramic images as shown by Figure 5. Together, these elements provided a comprehensive representation of the physical and visual characteristics of the road network. Table 2 summarizes the amount of data acquired during the field survey. The point cloud was enriched with two key attributes: intensity values and RGB values extracted from the panoramic images. The intensity value in a point cloud represents the reflectance or strength of the laser signal returned to the LiDAR sensor after interacting with a surface [35]. This value is influenced by several factors, including the materials’ properties of the surface, the angle at which the laser strikes the surface, and the distance between the sensor and the surface. Due to these dependencies, intensity values play a crucial role in point cloud analysis, offering detailed insights into the physical characteristics of scanned environments. One of the primary applications of intensity values is material differentiation within the scanned environment. For example, road markings, which have a distinct reflectance compared to the surrounding pavement, can be effectively identified using intensity data. This feature classification capability enhances the usability of the point cloud in tasks like road condition monitoring and infrastructure analysis [36,37]. Combined with RGB values, which provide color context, the dataset is a powerful tool for comprehensive urban infrastructure assessment.
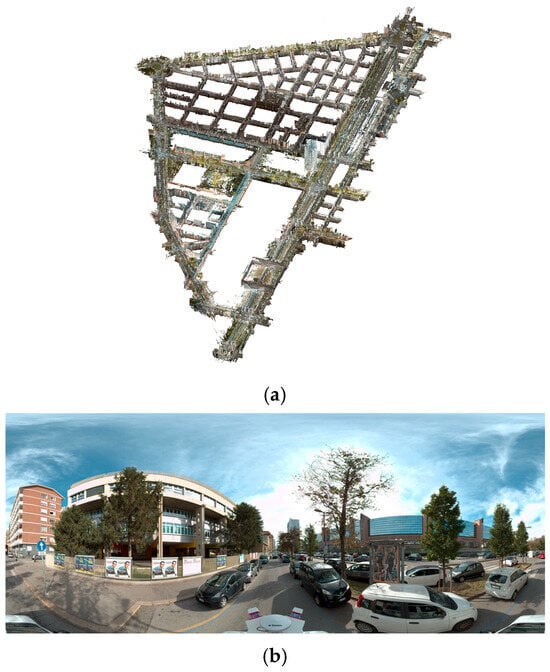
Figure 5.
(a) Terrestrial point cloud; (b) panoramic image.
Table 2.
Detail of the dataset acquired with MMS sensors.
This dataset was specifically developed to support the Turin DT project, with a focus on the road network and addressing the critical need for precise geospatial information. The integration of aerial and ground datasets, as illustrated in Figure 6, demonstrates the complementary nature of these two data sources in building a comprehensive understanding of urban infrastructure.
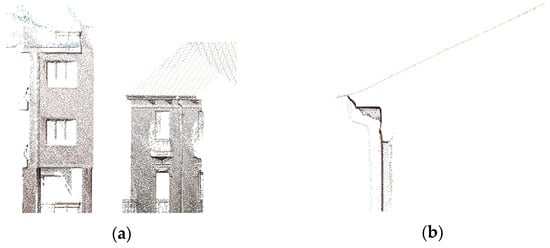
Figure 6.
The integration of the aerial and terrestrial datasets is illustrated by (a) zooming in on the roof area of a building and (b) analyzing a profile of the same building. This comparison highlights how the aerial sensor captures the roof, while the terrestrial LiDAR sensor provides detailed data on the building façade.
The combination of terrestrial LiDAR and high-resolution imagery provides a multi-dimensional perspective on road assets. This enables a wide range of analyses, from detailed structural assessments of road surfaces to broader environmental interactions, such as the impact of vegetation or adjacent infrastructure. This integrated approach ensures the dataset’s suitability for creating accurate digital replicas, facilitating the better planning, monitoring, and management of urban infrastructure within the DT framework.
The integration process involved aligning the datasets within a unified geospatial framework to ensure spatial consistency and accuracy. This was achieved initially through a georeferencing and registration phase in which both datasets were aligned using GNSS data to establish a common coordinate system. The aerial and terrestrial datasets were cross-validated to ensure accurate alignment, particularly in areas where overlap occurred, such as intersections or dense urban zones. The aerial data provided a top-down view, serving as the base layer for large-scale context, while the terrestrial point cloud was integrated to fill gaps in detail and provide high-resolution data for specific features, such as road markings, cracks, and vertical poles. Discrepancies between the datasets, such as mismatches due to shadowing in aerial images or occlusions in terrestrial scans, were resolved by prioritizing the dataset with higher accuracy for the feature of interest.
Given the substantial volume of data acquired, the final point cloud, which integrated both RGB and intensity values, was classified and segmented into four primary classes: building, ground, vegetation, and facility. This classification was performed through a combination of automated algorithms and manual verification, ensuring both efficiency and accuracy in the categorization process.
- -
- Ground: This class encompasses all points corresponding to road surfaces, pavement, and terrain. It serves as the foundation for detailed analyses, including assessments of road surface conditions and the detection of road markings, making it critical for road infrastructure management.
- -
- Buildings: Points representing vertical structures, such as façades and rooftops, are categorized into this class. These data contribute to urban morphology studies and complement the aerial dataset, supporting city-wide urban planning and structural analysis.
- -
- Vegetation: Points associated with trees, shrubs, and other vegetation are classified separately to enable the exclusion of non-infrastructure features from road-focused analyses. This segmentation helps streamline computational processes and improves the focus on the relevant infrastructure.
- -
- Facilities: This class includes elements such as poles, streetlights, traffic signs, and wires, providing a comprehensive inventory of urban infrastructure assets. This detailed categorization aids in the management and maintenance of essential urban systems.
This classification framework not only organizes the data for targeted analysis but also ensures that each class contributes meaningfully to the broader objectives of urban asset management and infrastructure planning. This classification process, shown in Figure 7, is essential for streamlining subsequent analyses, particularly at the street level, where the focus lies primarily on the ground class. By isolating ground-level data, the workflow becomes more efficient and enables detailed assessments of road surfaces and related infrastructure.

Figure 7.
Classified point cloud; color legend: red—building, orange—ground, green—vegetation, grey—facilities, pink—car.
2.4. Data Analysis and Feature Extraction for Road Asset Management
This section outlines the methodologies developed during this study to extract actionable insights for road asset management. These methodologies focused on processing the raw dataset into structured information as well as leveraging advanced tools and techniques to support decision making and infrastructure planning. By integrating multi-sensor data, such as the LiDAR-derived point clouds and high-resolution imagery, the process ensures a comprehensive understanding of the road network and its features. The methodology begins with the classification of the point cloud, identifying major elements such as ground, buildings, vegetation, and facilities. From the classified dataset, the ground class is segmented to focus specifically on the road surface. This segmentation enables the analysis of key road surface attributes, such as pavement conditions and the extraction of road markings.
These analyses are crucial for assessing the functionality and safety of road infrastructure, allowing for the identification of critical features and conditions. By isolating and examining these specific elements, this study demonstrates the potential of advanced geospatial datasets to streamline road management processes and support the development of targeted maintenance strategies.
The analysis of the road surface identified both the geometric and material conditions as well as the horizontal road markings, integrating data from point clouds and high-resolution images obtained from both the aerial and terrestrial datasets. To evaluate the condition of the road pavement, two distinct methodologies were applied: a manual approach, involving detailed inspection and annotation; and an automated approach, which employed advanced algorithms to streamline the detection and classification of the surface features.
The manual approach began with analyzing aerial orthophotos to identify primary issues affecting the road surface, such as potholes and cracks. However, this method quickly presented significant limitations. The orthophoto shown in Figure 8, while metrically accurate, is inherently two-dimensional and lacks the capability to provide three-dimensional depth information. This absence of a third dimension hinders the accurate assessment of surface conditions, such as the depth and severity of damage. Additionally, the image resolution, with a pixel size of 5 cm, proved insufficient to detect and analyze the finer details of road surface problems. Moreover, the shadows present in the orthophoto, particularly in densely built urban areas, obscured portions of the road surface, making it impossible to identify defects in those regions. The manual validation process required the cross-checking and confirming of the identified issues, which further compounded these challenges, making the workflow more time-intensive and less efficient. Furthermore, the scalability of this approach was severely constrained by the vast amount of data involved. Applying this methodology citywide would be infeasible due to the significant time and cost required for manual analysis. These limitations underscore the need for more advanced and automated methods to handle large datasets while providing accurate and detailed road condition assessments.
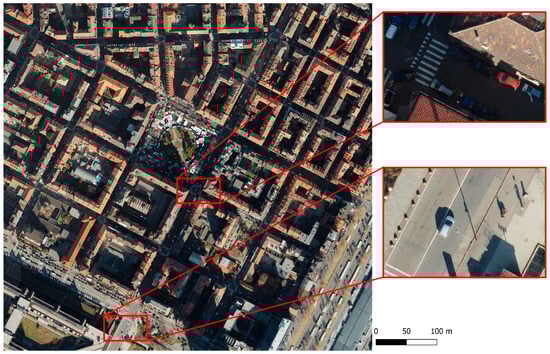
Figure 8.
Aerial orthophoto (dated February 2022, flight altitude 1000 m) showing two zoomed-in areas: (above) a region affected by shadows, illustrating the challenges with identifying road surface defects due to poor visibility; (bottom) a shadow-free area, demonstrating the resolution of the orthophoto at ground level, highlighting both its strengths and its limitations in capturing detailed surface conditions.
Recognizing the necessity of overcoming these limitations, the focus shifted to ground-based data. This transition aimed to bridge the gap between centimeter-scale observations and millimeter-scale precision, enabling more detailed readings of road defects. Ground-based data offered the advantage of higher resolution and three-dimensional depth, providing a more robust foundation for accurate and scalable road surface analysis.
The analyses conducted in this second phase utilized both the point cloud and panoramic images acquired with the MMS, employing an automated approach. This method was implemented using LiDAR360MLS V8.0, dedicated software developed by GreenValley International (Berkeley, CA, USA) for road infrastructure analysis. The analysis of the point cloud focused on its intensity values, which were crucial for detecting surface-level details such as pavement damage. These values allowed for a precise examination of road conditions, identifying cracks, potholes, and other irregularities. Meanwhile, the analysis of panoramic images relied on a deep learning model to extract visual features and detect road markers with high accuracy. This integrated approach demonstrated the capability of the automatic approach to handle massive datasets, accelerating the detection process while maintaining precision. The synergy between LiDAR-derived intensity values and advanced image-based analysis underscored the potential of combining multi-modal data for comprehensive road infrastructure assessments. The analyses produced critical outputs, including the typology of the detected damage, its geospatial position, the extent of the affected area, and the severity of each issue. Additionally, the analysis provided the Pavement Condition Index (PCI), a globally recognized metric for assessing road conditions. Despite the accuracy achieved with this analysis, a subsequent validation phase was necessary to refine the results and generate a more reliable model of the road conditions. This validation phase involved a manual review to identify and correct any incoherent or erroneous detections within the dataset. By cross-checking the automated outputs, this step ensured that the final model accurately represented the road surface’s actual condition, thereby enhancing the reliability of the derived insights for infrastructure management.
The final output of this assessment was delivered as a geospatial vector, containing all extracted information, as shown in Figure 9, ready for integration into infrastructure management systems or further analysis to build up a geodatabase of road assets.
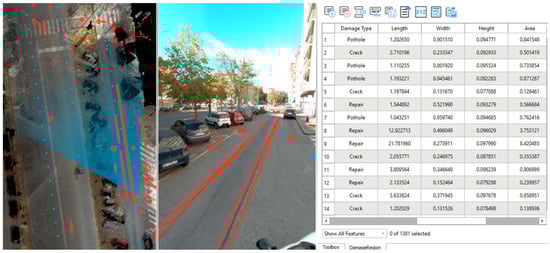
Figure 9.
Extract from the damage analysis phase. From left to right: the point cloud, the panoramic image, and the attribute table of the damage vectors. In the representation, the vectors shown in red indicate the detected defects, while the blue markers denote the positions of the images used in the analysis. This visualization demonstrates the integration of multiple data sources to identify and geolocate road surface damage accurately.
Changing the objective, the focus shifted to analyzing the dataset specifically to extract road markers. This analysis involved leveraging both the point cloud and panoramic images to identify and classify various types of road markings, such as lane dividers, pedestrian crossings, and directional arrows. By utilizing the high-resolution attributes of the dataset, the analysis aimed to detect these features accurately and georeference them within the road network to again obtain vectors to integrate into a geodatabase of road assets. Advanced algorithms, including machine learning and image processing techniques, were applied to automate the detection process, which improved efficiency and scalability compared to manual methods. An example of this analysis is shown in Figure 10.
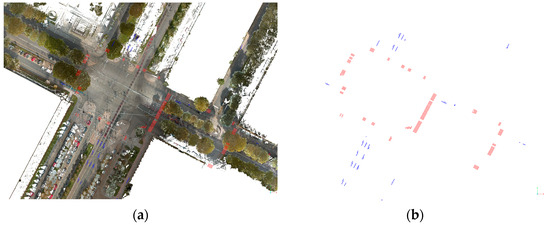
Figure 10.
Example of horizontal signage detection: blue vectors represent directional indicators, while red vectors highlight pedestrian crossings. (a) The overlay of vectors on the point cloud with RGB values, demonstrating their spatial alignment. (b) The vector extraction, highlighting discrepancies in geometry due to low signal reflectivity. This issue corresponds to the poor physical condition of the element, reflecting its degraded state in reality.
Recognizing road assets from the classified point cloud involved segmenting the facilities category to isolate and identify all vertical poles present in the environment, as shown in Figure 11. This step was crucial for accurately mapping infrastructure elements such as streetlights, signposts, and utility poles. By detecting and cataloguing these vertical elements, the analysis contributed to a comprehensive understanding of road-related assets, forming the basis for improved asset management and maintenance strategies. This recognition process not only highlighted the spatial distribution of these vertical features but also provides essential data for urban planning, traffic management, and safety assessments. The segmentation process was performed by leveraging both the geometric and intensity attributes of the classified point cloud. Specifically, the facility class was targeted to isolate vertical pole-like structures. This process involved the following:
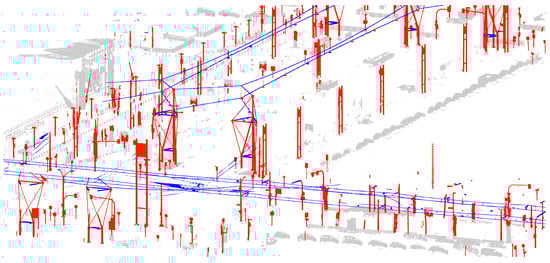
Figure 11.
Visualization of the point cloud class for vertical poles (red) and wires (blue), which are key components of road infrastructure. This classification enhances the understanding of the facility elements that shape the urban environment, providing critical data for infrastructure management and planning.
- -
- Feature identification: Utility poles were identified based on their distinct vertical geometry, cylindrical shape, and spatial distribution within the point cloud. Points with characteristics such as a consistent height and narrow diameter were flagged as potential poles.
- -
- Algorithmic segmentation: Automated algorithms were applied to segment the identified utility poles from other facility elements, such as traffic signs or wires. A machine learning model, GV_Road_MLS developed by GreenValley International, was utilized to improve classification accuracy by recognizing patterns in intensity values and spatial relationships.
- -
- Manual refinement: a manual validation step was conducted to ensure accuracy and to correct misclassifications, particularly in areas where poles overlapped with other vertical elements or were partially obscured.
3. Results
The results demonstrate the effectiveness of the proposed approach for integrating road assets into the broader DT framework of the city. This methodology highlights the strategic use of geospatial data acquired through MMSs in complex urban contexts. The results are structured in alignment with the primary stages of the developed workflow, encompassing the integration of multisource datasets, the classification of the point cloud, and the extraction of features critical for road asset management.
The integration of aerial and terrestrial datasets proved essential in constructing a comprehensive DT of the urban environment. This integration capitalized on the complementary strengths of both data sources to enhance the accuracy and completeness of the road asset mapping and analysis. The aerial dataset, acquired using a Leica CityMapper-2 system, offered a large-scale perspective with a GSD of 5 cm, ideal for capturing macro-level features like road layouts, building rooftops, and general urban morphology. However, when limited to two-dimensional orthophotos, the aerial data lacked the resolution and depth needed to detect fine ground-level details, such as road surface conditions and vertical infrastructure elements.
Conversely, the terrestrial dataset, captured using a RIEGL VMY-2 MMS, provided millimeter-level accuracy and high-density point clouds. This dataset was particularly valuable for capturing detailed road surface geometry and vertical features like poles and signage. By integrating these datasets, the approach addressed the critical limitations of each data source, combining the large-scale context of aerial data with the high-resolution detail of terrestrial acquisitions. The result was a multi-dimensional representation of the urban road network that facilitated a cohesive DT capable of depicting both expansive urban layouts and intricate infrastructure details.
The classification of the point cloud enabled the detailed and targeted analyses of road infrastructure by organizing the dataset into specific categories: ground, buildings, vegetation, and facilities. This systematic organization facilitated the extraction of key features essential for urban asset management. Notably, the ground class allowed for the precise analysis of road surfaces, enabling the identification of cracks, potholes, and road markings, which is critical for pavement condition assessments. The facility class provided an accurate inventory of vertical infrastructure, such as poles and signs, supporting maintenance and planning activities, as shown in Figure 12. Additionally, the exclusion of non-relevant features, such as vegetation, optimized computational resources and ensured focus on critical infrastructure elements. These classification results formed the basis for advanced applications, such as detailed road surface assessments, the development of an urban asset inventory, and seamless integration into the Turin DT. By structuring the data in this way, the classification enhanced both the accuracy and the actionable insights derived from the analyses, supporting scalable and efficient urban management systems.
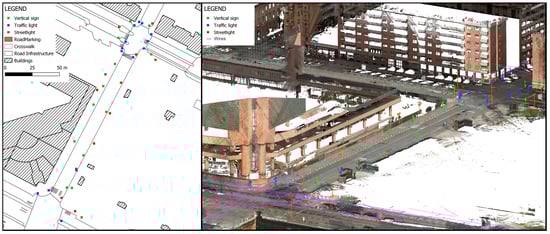
Figure 12.
Geospatial representation of extracted urban assets. On the left, the map displays the position of traffic lights, streetlights, and vertical signs geolocated from the segmented point cloud. On the right, the corresponding point cloud visualization highlights these elements using the same colors, showcasing their spatial distribution and classification within the urban environment.
The road pavement analysis leveraged both the classified point cloud and panoramic images to assess surface conditions comprehensively. This integrated approach enabled the detection, characterization, and mapping of various defects, including the following:
- -
- Cracks: identified using intensity values from the point cloud and visual patterns from panoramic images, classified by length, width, and severity.
- -
- Potholes: detected by analyzing elevation variations in the point cloud, quantified by depth and area.
- -
- Deformations: irregularities such as rutting and bumps, identified through geometric inconsistencies.
The analysis produced detailed quantitative outputs, including defect counts, spatial distribution, severity classification, and the PCI, a standardized metric summarizing the overall road network condition. The results are visualized in Figure 13 through pavement condition maps, offering actionable insights for targeted maintenance and preventive measures. The thematic map facilitates the identification of critical areas requiring immediate attention and helps with strategizing long-term maintenance plans.

Figure 13.
This map categorizes road segments based on their assessed condition, ranging from 0 to 100, where 100 represent the best condition, allowing for the data-driven prioritization of maintenance activities.
The pavement condition map was incorporated into the municipal geodatabase, making this information readily available within the city’s existing infrastructure management system. This integration ensures that the extracted data are not only accessible but also actionable, supporting municipal workflows for planning, maintenance scheduling, and long-term infrastructure management. The enriched geodatabase significantly enhances the municipality’s ability to prioritize road maintenance efforts based on severity, ensuring a more strategic allocation of resources and facilitating data-driven decision making.
Furthermore, by integrating this thematic map into the municipal geodatabase, the methodology supports not only the current assessment of pavement conditions but also its periodic update. This approach lays the foundation for a long-term road monitoring system, where new MMS acquisitions can be systematically incorporated into the DT to track infrastructure evolution and prioritize interventions dynamically.
Finally, the results include a comprehensive geodatabase comprising vertical structures, such as utility poles, and horizontal elements, such as road markings and detected defects. The integration of the extracted road infrastructure data into a structured geodatabase represents a fundamental step in supporting the DT framework of the municipality. A well-structured geodatabase serves as the backbone for digital urban management, enabling the seamless incorporation of multisource datasets, real-time updates, and spatial analyses, essential for predictive maintenance and strategic planning. This application not only facilitates detailed analysis and visualization but also supports integration into advanced platforms like GISs and BIMs, ensuring that the information is accessible and actionable for infrastructure management and urban planning.
The creation of such an enriched dataset underlines the potential of multisource geospatial data to revolutionize the management of urban road assets and contribute to the overall goals of sustainable and resilient urban development. By incorporating this structured geodatabase into a DT framework, municipalities can move from traditional asset management approaches to a more data-driven and adaptive urban planning strategy that ensures sustainable infrastructure management and improved urban resilience.
4. Discussion
This section discusses the implications, limitations, and potential of the methodologies developed and applied in this study. By analyzing the integration of multisource datasets, such as aerial and terrestrial acquisitions, alongside advanced geospatial processing techniques, it is clear how these approaches contribute to enhancing urban infrastructure management. The discussion also reflects on the broader impact of this work on urban morphology and the opportunities for future advancements. The limitations identified, including gaps in data and computational demands, are balanced by the significant advantages of the proposed methods, such as rapid data acquisition, high precision, and comprehensive urban analyses. Through a focus on the integration of geospatial data into DT frameworks, this section highlights the transformative potential of this approach for sustainable urban development. Additionally, the role of multi-sensor data fusion, segmentation processes, and thematic mapping in supporting decision making and maintenance planning is critically examined, paving the way for future research and applications.
One of the primary limitations encountered during this study was the lack of comprehensive data coverage in certain areas, which hindered a seamless and complete analysis. Despite the integration of multisource datasets, gaps in data due to occlusions or inaccessible locations highlighted the challenges of relying on existing datasets alone. Additionally, the sheer amount of data generated by the point clouds and imagery imposed significant computational demands, requiring advanced processing capabilities and storage solutions. These challenges emphasize the need for optimized workflows and scalable systems to handle such extensive datasets efficiently.
Despite these limitations, the proposed methodology demonstrated several significant advantages. The use of an MMS enabled rapid data acquisition, capturing large areas of urban infrastructure in a fraction of the time required with traditional methods. Furthermore, the datasets produced by the MMS were both precise and accurate, ensuring reliable analyses. The integration of multisource data—including high-resolution aerial and terrestrial datasets—enhanced the completeness of the analyses, providing a holistic view of the urban environment. This multi-dimensional approach proved essential for overcoming the limitations of individual datasets and highlighted the potential of MMSs for urban infrastructure management.
The road pavement analysis demonstrated the effectiveness of combining point-cloud- and image-based data for comprehensive assessments. This integration significantly improved the detection and characterization of surface defects, such as cracks, potholes, and deformations. However, challenges such as shadows in the aerial imagery and noise in the point cloud required additional validation steps to ensure accuracy. These findings underline the necessity of multi-sensor integration for robust evaluations and highlight the potential of this approach for sustainable road infrastructure management. Similarly, the analysis of horizontal road signage illustrated the value of integrating multisource data for detailed infrastructure assessments. The resulting geospatial vector, enriched with geographic positioning and functional attributes, not only supports maintenance workflows but also enhances traffic management and regulatory compliance. The accurate georeferencing and classification of road markings further enable their seamless incorporation into DT frameworks, allowing for real-time monitoring and improved decision making. By including both geographic and functional attributes, the extracted vectors contribute to a detailed and meaningful representation of the road network, highlighting the importance of road markings in traffic organization. Nonetheless, challenges such as the detection of faded or worn markings underline the need for the continued refinement of the methodology.
The segmentation of utility poles showcased the potential of advanced point cloud processing techniques for urban infrastructure management. By isolating and categorizing these vertical elements, the approach provided a detailed inventory of streetlights, traffic signals, and other poles critical to urban functionality. This segmentation supports maintenance planning, asset management, and integration into broader urban planning initiatives. However, occlusions and overlapping features presented challenges, emphasizing the need for improved algorithms and complementary datasets to enhance accuracy.
The results collectively demonstrate the transformative potential of integrating MMS-derived datasets with advanced analysis techniques for urban infrastructure management. By addressing challenges such as data integration, classification, and feature extraction, this methodology provides a robust framework for constructing and maintaining DTs of urban environments.
Comparing these results with an example from the existing literature [14,19,23,24,25,26,27,28] that focuses on specific use cases of MMSs for road infrastructure monitoring, this research demonstrates a scalable and generalizable methodology that maximizes the use of the collected data within a DT framework. Unlike studies based on ad hoc data acquisitions, this research utilized datasets collected primarily for the implementation and continuous updating of the Turin DT. This distinction highlights the adaptability of the proposed approach, as it does not rely on purpose-specific data collection campaigns but rather integrates seamlessly into broader urban digitalization efforts. The integration of MMS data into the DT of Turin is not only a case-specific implementation but also a replicable strategy for cities adopting similar technologies. By structuring the collected data into a dynamic and constantly updated system, this approach exceeds traditional asset mapping and defect detection to enable a more holistic and forward-looking strategy for urban management. The ability to incorporate high-resolution geospatial data into a DT enables municipalities to transition from isolated monitoring initiatives to a connected and evolving digital infrastructure that supports a wide range of applications beyond road maintenance.
Furthermore, this approach, centered on the integration of multisource geospatial datasets and advanced analytics, significantly impacts urban morphology by redefining how cities can be analyzed, managed, and transformed. Urban morphology, as the study of the form and structure of cities, benefits from such data-driven methods in several ways:
- -
- Enhanced understanding of urban systems: The combination of high-resolution point clouds, imagery, and DT frameworks enables a more detailed and accurate representation of urban forms. Features like building façades, street layouts, vegetation, and infrastructure assets are mapped with high precision, offering insights into spatial relationships, densities, and connectivity. This deeper understanding of urban systems can support morphological studies by revealing the patterns and structures that were previously difficult to quantify.
- -
- Dynamic representation of morphology: This approach provides real-time or near-real-time updates, enabling the dynamic monitoring of urban changes. As cities evolve, the ability to capture these transformations supports adaptive planning and informed decision making, particularly in fast-growing or rapidly changing urban areas.
- -
- Improved integration of infrastructure into urban form: By focusing on road assets, utility poles, and horizontal signage, this methodology integrates the functional elements of urban infrastructure into the morphological analysis. Roads and their associated features often shape the skeleton of cities, influencing land use, accessibility, and development patterns. Analyzing these elements enriches the understanding of their role in defining urban form and functionality.
- -
- Addressing inefficiencies in urban space: Thanks to this approach, it is possible to identify underutilized or degraded urban spaces, such as poorly maintained roads or outdated infrastructure. These insights can drive revitalization projects that transform neglected areas into active components of the urban fabric, thereby reshaping the city’s morphology.
- -
- Scalability: The developed methodology can be extended beyond the current case study, allowing for a city-wide implementation in Turin. By integrating regularly updated MMS data into the DT, municipalities can transition from occasional road surveys to a dynamic, continuously evolving monitoring system. This not only improves infrastructure resilience but also aligns with broader smart city initiatives aimed at sustainable urban development.
The integration of semantic attributes into the geometric dataset transforms raw geospatial data into a meaningful resource, enhancing its value for urban asset management. By classifying features such as road surface conditions, signage types, and utility pole attributes, the dataset enables a multi-dimensional understanding of urban infrastructure. This semantic enrichment is pivotal for creating actionable insights, supporting decision making, and allowing seamless integration into advanced platforms like GISs, BIMs, and DTs [38,39,40].
The integration of aerial and terrestrial datasets proved to be transformative for urban morphology studies, providing unprecedented insights into the form and structure of urban environments. While aerial imagery captured large-scale features such as building layouts and road networks, the high-resolution terrestrial data enriched the analysis by detailing ground-level features, vertical structures, and surface conditions. This combined approach offers a more understanding of urban spaces, bridging the gap between macro-level planning and micro-level management. By integrating these datasets into a DT framework, the methodology facilitates dynamic and real-time monitoring of urban infrastructure, enabling cities to simulate scenarios, anticipate changes, and plan interventions effectively. This integration is particularly impactful for urban morphology, as it allows for the continuous assessment of spatial relationships, connectivity, and the evolution of urban forms in response to developmental pressures and maintenance needs.
Overall, the proposed methodology underscores the transformative potential of integrating multisource datasets and advanced analytics for urban infrastructure management. While limitations such as data gaps and computational demands remain, the benefits of rapid data acquisition, high-resolution analyses, and holistic representations of urban spaces far outweigh these challenges. By advancing the integration of geospatial technologies into urban planning and maintenance workflows, this approach provides a robust foundation for the sustainable management and evolution of modern cities.
5. Conclusions
This concluding section synthesizes the outcomes of this study, highlighting the contributions and implications of integrating the multisource geospatial data for urban infrastructure management. By leveraging MMS and DT frameworks, this research achieved significant advancements in the accuracy and efficiency of road asset monitoring. These methodologies underline the transformative potential of modern geospatial technologies in addressing the complexities of urban environments. This section not only reflects on the achievements and challenges encountered but also explores future directions, including the incorporation of additional sensors, enhanced data integration with GIS and BIM platforms, and the development of thematic mapping tools. These forward-looking approaches aim to address the current limitations and extend the applicability of this research, laying the groundwork for more sustainable and resilient urban infrastructure systems.
This study highlights the potential of integrating multisource geospatial data and advanced analytics for road asset management and urban infrastructure planning. The proposed methodology, leveraging MMS and DT frameworks, demonstrated its ability to provide precise, actionable insights into road surface conditions, horizontal signage, and utility poles. However, while the results underscore the robustness and scalability of the approach, they also reveal opportunities for further advancements. Future implementations of this methodology could extend its applicability to a broader range of urban infrastructure elements. Expanding the scope to include additional features such as sidewalks and bike lanes would create a more holistic representation of the urban environment. This would further enhance the utility of DT models, enabling comprehensive urban planning and resource management. A key future direction involves the seamless integration of geospatial data into GIS and BIM platforms. Such integration would support interoperability, allowing datasets to be shared and used across multiple systems for a variety of applications; enhance data visualization, enabling stakeholders to interact with and interpret complex data through intuitive, multi-layered visual interfaces; and improve decision making by combining GISs’ spatial analysis capabilities with BIMs’ detailed representation of infrastructure components, supporting more informed planning and maintenance workflows.
In conclusion, the integration of advanced geospatial technologies, multi-sensor data, and analytical frameworks represents a powerful approach to modern urban infrastructure management. While this study provides a robust foundation, the path forward involves continuous refinement and innovation. By incorporating new data sources, enhancing integration with GISs and BIMs, and developing thematic tools for strategic planning, this methodology has the potential to improve the management of road networks and contribute significantly to the creation of smarter, more resilient cities.
Future developments will focus on establishing a structured workflow for periodic MMS acquisitions, ensuring that the DT remains a continuously evolving tool for urban management. By automating data integration and change detection processes, this approach can further support predictive maintenance strategies, improving the long-term sustainability of urban infrastructure.
Author Contributions
Conceptualization, V.S.; methodology, V.S.; software, V.S.; validation, V.S., P.B. and L.L.R.; data curation, V.S.; formal analysis, V.S.; investigation, V.S., P.B. and L.L.R.; resources, P.B.; writing—original draft preparation, V.S.; writing—review and editing, V.S., L.L.R. and P.B.; visualization, V.S.; supervision, P.B.; project administration, P.B.; funding acquisition, P.B. All authors have read and agreed to the published version of the manuscript.
Funding
This research was funded by the European Union NextGenerationEU, under the PRIN 2022 project, Ministerial Decree No. 104 of 2 February 2022, titled “Navigation To Go (NATOGO)”.
Data Availability Statement
The raw data supporting the conclusions of this article will be made available by the authors upon request.
Acknowledgments
The authors would like to express their gratitude to Digitarca s.r.l. for their support of data acquisition and initial processing and thanks to all those who supported this research.
Conflicts of Interest
The authors declare no conflicts of interest.
References
- Boccardo, P.; La Riccia, L.; Yadav, Y. Urban echoes: Exploring the dynamic realities of cities through digital twins. Land 2024, 13, 635–657. [Google Scholar] [CrossRef]
- La Riccia, L.; Scolamiero, V.; Yadav, Y.; Eusebio, A. Turin digital twins: Initiatives and challenges. Trends Earth Obs. 2024, 16, 16–20. [Google Scholar]
- Anselmo, S.; Ferrara, M.; Corgnati, S.P.; Boccardo, P. Aerial urban observation to enhance energy assessment and planning towards climate-neutrality: A pilot application to the city of Turin. Sustain. Cities Soc. 2023, 99, 104938. [Google Scholar] [CrossRef]
- Singh, R.; Sharma, R.; Akram, S.V.; Gehlot, A.; Buddhi, D.; Malik, P.K.; Arya, R. Highway 4.0: Digitalization of highways for vulnerable road safety development with intelligent IoT sensors and machine learning. Saf. Sci. 2021, 143, 105407. [Google Scholar] [CrossRef]
- Hassan, M.U.; Steinnes, O.M.H.; Gustafsson, E.G.; Løken, S.; Hameed, I.A. Predictive maintenance of Norwegian road network using deep learning models. Sensors 2023, 23, 2935. [Google Scholar] [CrossRef]
- Consilvio, A.; Hernández, J.S.; Chen, W.; Brilakis, I.; Bartoccini, L.; Di Gennaro, F.; van Welie, M. Towards a digital twin-based intelligent decision support for road maintenance. Transp. Res. Procedia 2023, 69, 791–798. [Google Scholar] [CrossRef]
- Sanfilippo, R.; Canini, P.; Carrera, E.; Neidhart, M.; Eberle, R.; Wieland, M. The digitalization of the Tunnel Schöneich-Using a digital twin to improve operation and maintenance workflows of an existing road tunnel. In Expanding Underground-Knowledge and Passion to Make a Positive Impact on the World; CRC Press: Boca Raton, FL, USA, 2023; pp. 2877–2884. [Google Scholar]
- Yoo, H.W.; Druml, N.; Brunner, D.; Schwarzl, C.; Thurner, T.; Hennecke, M.; Schitter, G. MEMS-based lidar for autonomous driving. Elektrotech. Inftech. 2018, 135, 408–415. [Google Scholar] [CrossRef]
- Wang, D.; Watkins, C.; Xie, H. MEMS mirrors for LiDAR: A review. Micromachines 2020, 11, 456–480. [Google Scholar] [CrossRef]
- Puente, I.; González-Jorge, H.; Martínez-Sánchez, J.; Alrias, P. Review of mobile mapping and surveying technologies. Measurement 2013, 46, 2127–2145. [Google Scholar] [CrossRef]
- Elhashash, M.; Albanwan, H.; Qin, R. A review of mobile mapping systems: From sensors to applications. Sensors 2022, 22, 4262. [Google Scholar] [CrossRef]
- Martino, A.; Breggion, E.; Balletti, C.; Guerra, F.; Renghini, G.; Centanni, P. Digitization approaches for urban cultural heritage: Last generation MMS within Venice outdoor scenarios. Int. Arch. Photogramm. Remote Sens. Spat. Inf. Sci. 2023, 48, 265–272. [Google Scholar] [CrossRef]
- Karyawan, I.D.M.A.; Hariyadi, H.; Iskandarsyah, D.; Mahendra, M. Integrating MMS and GIS to improve the efficiency and speed of mapping of urban road damage conditions in Mataram, Indonesia. Geogr. Tech. 2024, 19, 19–33. [Google Scholar] [CrossRef]
- Sairam, N.; Nagarajan, S.; Ornitz, S. Development of mobile mapping system for 3D road asset inventory. Sensors 2016, 16, 367. [Google Scholar] [CrossRef] [PubMed]
- Lee, E.; Park, S.; Jang, H.; Choi, W.; Sohn, H.-G. Enhancement of low-cost UAV-based photogrammetric point cloud using MMS point cloud and oblique images for 3D urban reconstruction. Measurement 2024, 226, 114158. [Google Scholar] [CrossRef]
- Treccani, D.; Adami, A.; Brunelli, V.; Fregonese, L. Mobile mapping system for historic built heritage and GIS integration: A challenging case study. Appl. Geomat. 2024, 16, 293–312. [Google Scholar] [CrossRef]
- D’amico, F.; Bianchini Ciampoli, L.; Di Benedetto, A.; Bertolini, L.; Napolitano, A. Integrating non-destructive surveys into a preliminary BIM-oriented digital model for possible future application in road pavements management. Infrastructures 2022, 7, 10. [Google Scholar] [CrossRef]
- Bertolini, L.; D’amico, F.; Napolitano, A.; Ciampoli, L.B.; Gagliardi, V.; Manalo, J.R.D. A BIM-Based Approach for Pavement Monitoring Integrating Data from Non-Destructive Testing Methods (NDTs). Infrastructures 2023, 8, 81. [Google Scholar] [CrossRef]
- Alshaiba, O.; Núñez-Andrés, M.A.; Lantada, N. Automatic manhole extraction from MMS data to update basemaps. Autom. Constr. 2020, 113, 103110. [Google Scholar] [CrossRef]
- Javanmardi, M.; Javanmardi, E.; Gu, Y.; Kamijo, S. Towards high-definition 3D urban mapping: Road feature-based registration of mobile mapping systems and aerial imagery. Remote. Sens. 2017, 9, 975. [Google Scholar] [CrossRef]
- Yang, B. Developing a Mobile Mapping System for 3D GIS and Smart City Planning. Sustainability 2019, 11, 3713. [Google Scholar] [CrossRef]
- Sofia, H.; Anas, E.; Faïz, O. Mobile mapping, machine learning and digital twin for road infrastructure monitoring and maintenance: Case study of mohammed VI bridge in Morocco. In Proceedings of the 2020 IEEE International Conference of Moroccan Geomatics (Morgeo), Casablanca, Morocco, 11–13 May 2020; pp. 1–6. [Google Scholar]
- Stricker, R.; Eisenbach, M.; Sesselmann, M.; Debes, K.; Gross, H.M. Improving Visual Road Condition Assessment by Extensive Experiments on the Extended GAPs Dataset. In Proceedings of the International Joint Conference on Neural Networks, Budapest, Hungary, 14–19 July 2019; pp. 1–8. [Google Scholar]
- Eisenbach, M.; Stricker, R.; Sesselmann, M.; Seichter, D.; Gross, H. Enhancing the quality of visual road condition assessment by deep learning. In Proceedings of the 26th World Road Congress, Abu Dhabi, United Arab Emirates, 6–10 October 2019; pp. 6–10. [Google Scholar]
- Aoki, K.; Yamamoto, K.; Shimamura, H. Evaluation model for pavement surface distress on 3D point clouds from mobile mapping system. Int. Arch. Photogramm. Remote Sens. Spat. Inf. Sci. 2012, 39, 87–90. [Google Scholar] [CrossRef]
- Wu, H.; Yao, L.; Xu, Z.; Li, Y.; Ao, X.; Chen, Q.; Li, Z.; Meng, B. Road pothole extraction and safety evaluation by integration of point cloud and images derived from mobile mapping sensors. Adv. Eng. Inform. 2019, 42, 100936. [Google Scholar] [CrossRef]
- Koloushani, M.; Ozguven, E.E.; Fatemi, A.; Tabibi, M. Mobile mapping system-based methodology to perform automated road safety audits to improve horizontal curve safety on rural roadways. Comput. Res. Prog. Appl. Sci. Eng. 2020, 6, 263–275. [Google Scholar]
- Agina, S.; Shalkamy, A.; Gouda, M.; El-Basyouny, K. Automated assessment of passing sight distance on rural highways using mobile LiDAR data. Transp. Res. Rec. 2021, 2675, 676–688. [Google Scholar] [CrossRef]
- Soon, K.H.; Khoo, V.H.S. CityGML modelling for Singapore 3D national mapping. Int. Arch. Photogramm. Remote Sens. Spat. Inf. Sci. 2017, 42, 37–42. [Google Scholar] [CrossRef]
- Franzini, M.; Casella, V.M.; Monti, B. The Digital Twin of the Metropolitan Area of Milan: Quality Assessment of Aerial and Terrestrial Data. In Geomatics for Environmental Monitoring: From Data to Services, ASITA 2023. Communications in Computer and Information Science; Springer: Cham, Switzerland, 2024; Volume 2088, pp. 152–171. [Google Scholar]
- Franzini, M.; Casella, V.M.; Monti, B. Assessment of Leica CityMapper-2 LiDAR Data within Milan’s Digital Twin Project. Remote Sens. 2023, 15, 5263. [Google Scholar] [CrossRef]
- Lehner, H.; Kordasch, S.L.; Glatz, C.; Agugiaro, G. Digital geoTwin: A CityGML-Based Data Model for the Virtual Replica of the City of Vienna, Recent Advances in 3D Geoinformation Science. In Proceedings of the 18th 3D GeoInfo Conference, Munich, Germany, 13–14 September 2023; pp. 517–541. [Google Scholar]
- Lehner, H.; Dorffner, L. Digital geoTwin Vienna: Towards a Digital Twin City as Geodata Hub. PFG J. Photogramm. Remote Sens. Geoinf. Sci. 2020, 88, 63–75. [Google Scholar] [CrossRef]
- Ávila Eça de Matos, B.; Dane, G.Z.; Van Tilburg, T.; Verstappen, J.; de Vries, B. State-of-the-Art of the Urban Digital Twin Ecosystem in the Netherlands. In Proceedings of the 3rd International Smart Cities in Smart Regions Conference, Breda, The Netherlands, 20–22 April 2022; pp. 37–53. [Google Scholar]
- Reymann, C.; Lacroix, S. Improving LiDAR point cloud classification using intensities and multiple echoes. In Proceedings of the IEEE/RSJ International Conference on Intelligent Robots and Systems (IROS), Hamburg, Germany, 28 September–2 October 2015; pp. 5122–5128. [Google Scholar]
- Tan, W.; Qin, N.; Ma, L.; Li, Y.; Du, J.; Cai, G.; Yang, K.; Li, J. Toronto-3D: A large-scale mobile LiDAR dataset for semantic segmentation of urban roadways. In Proceedings of the IEEE/CVF Conference on Computer Vision and Pattern Recognition Workshops, Seattle, WA, USA, 14–19 June 2020; pp. 797–806. [Google Scholar]
- La Guardia, M.; Masiero, A.; Bonora, V.; Alessandrini, A. Urban point cloud classification with automated processing based on deep learning open-source solutions. Int. Arch. Photogramm. Remote Sens. Spatial Inf. Sci. 2024, 48, 267–272. [Google Scholar] [CrossRef]
- Cepa, J.J.; Pavón, R.M.; Alberti, M.G.; Caramés, P. Towards BIM-GIS integration for road intelligent management system. J. Civ. Eng. Manag. 2023, 29, 621–638. [Google Scholar] [CrossRef]
- Cepa, J.J.; Alberti, M.G.; Pavón, R.M.; Calvo, J.A. Integrating BIM and GIS for an Existing Infrastructure. Appl. Sci. 2024, 14, 10962. [Google Scholar] [CrossRef]
- Barrile, V.; La Foresta, F.; Calcagno, S.; Genovese, E. Innovative System for BIM/GIS Integration in the Context of Urban Sustainability. Appl. Sci. 2024, 19, 8704. [Google Scholar] [CrossRef]
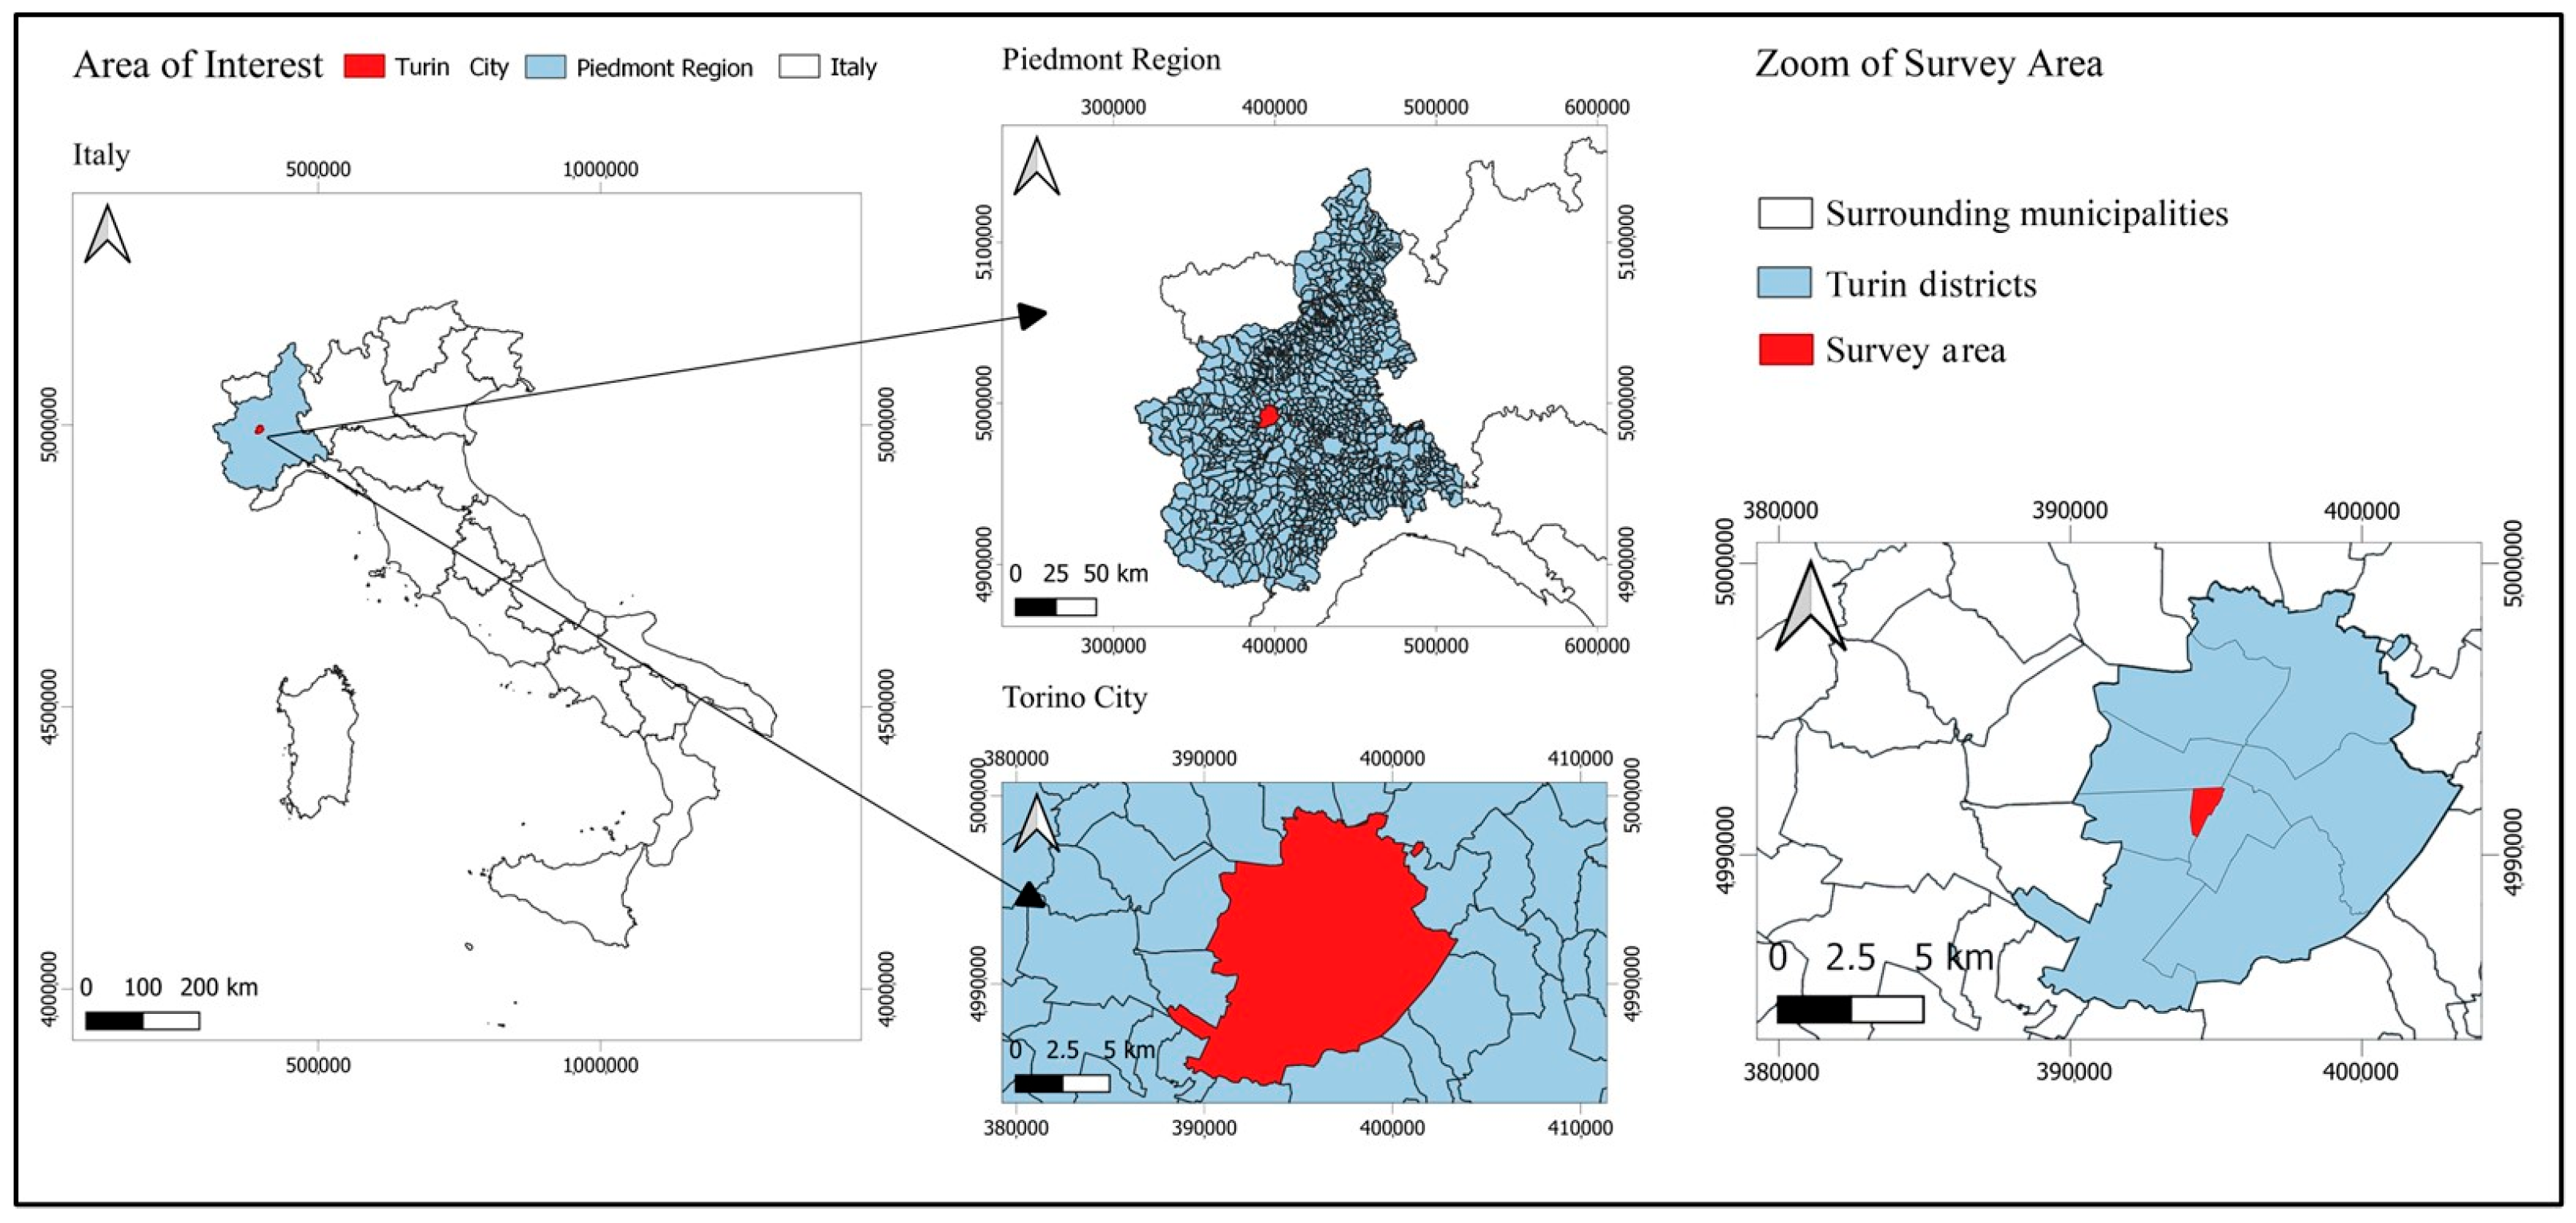
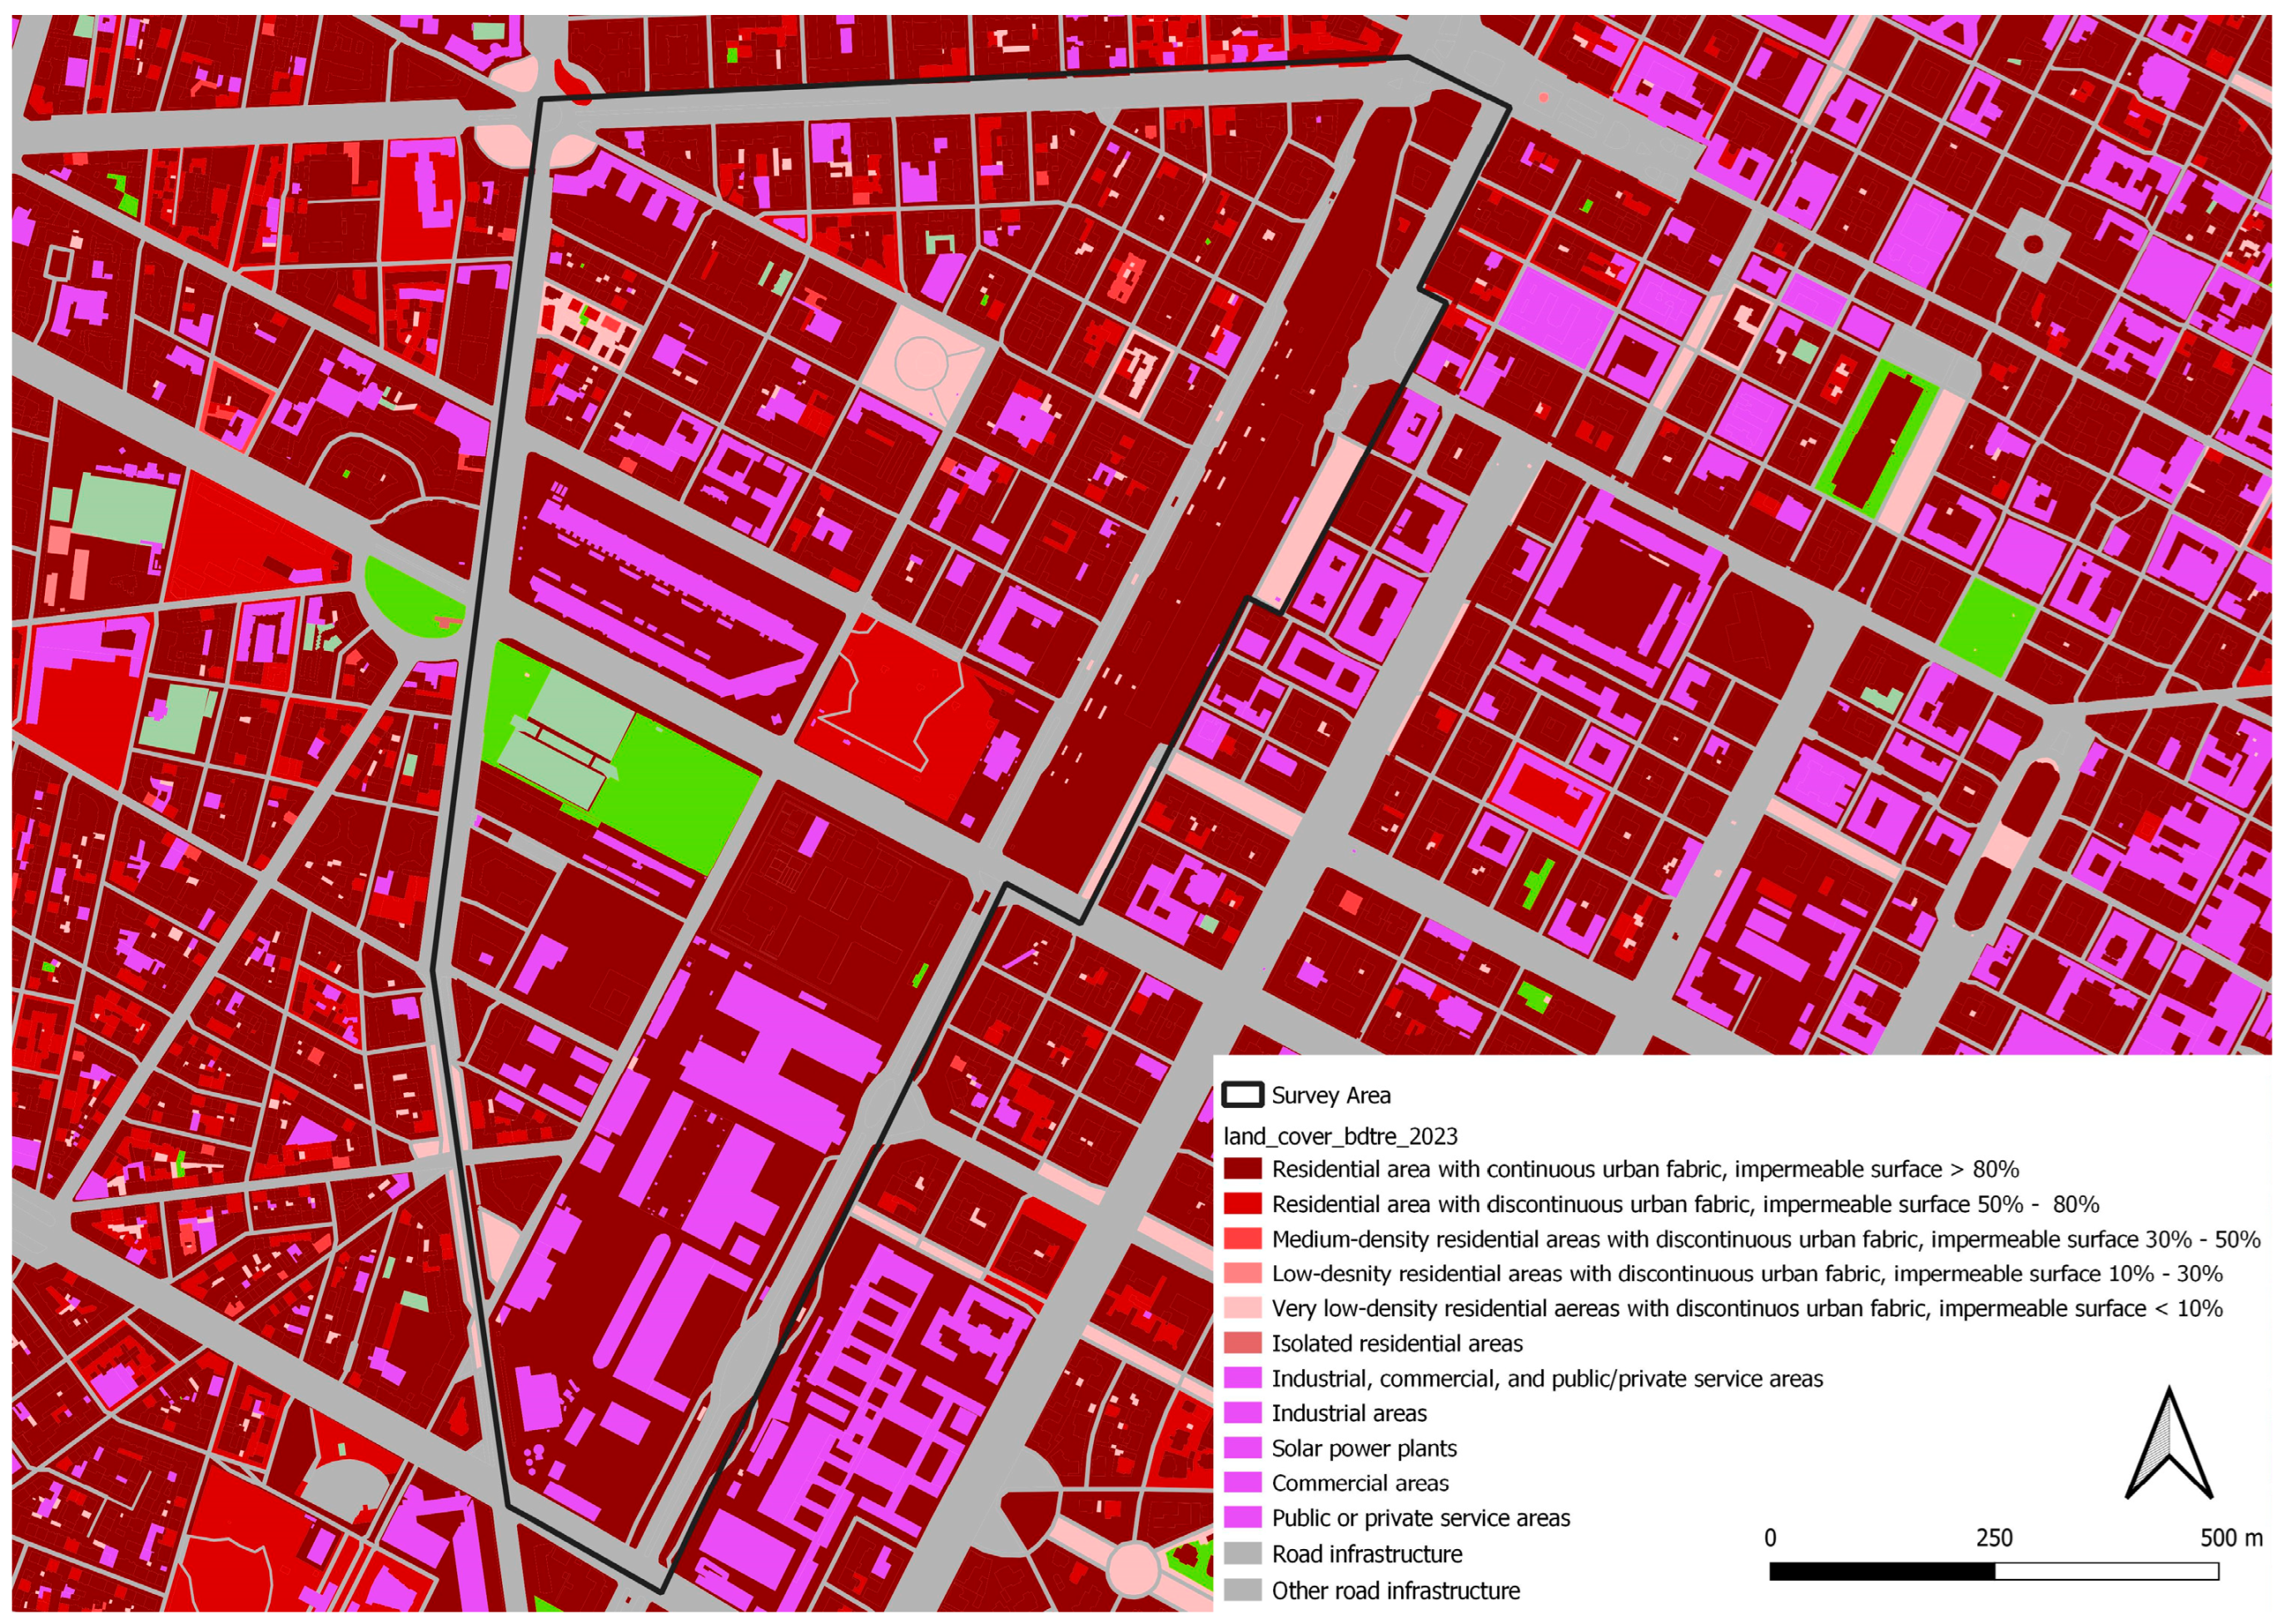
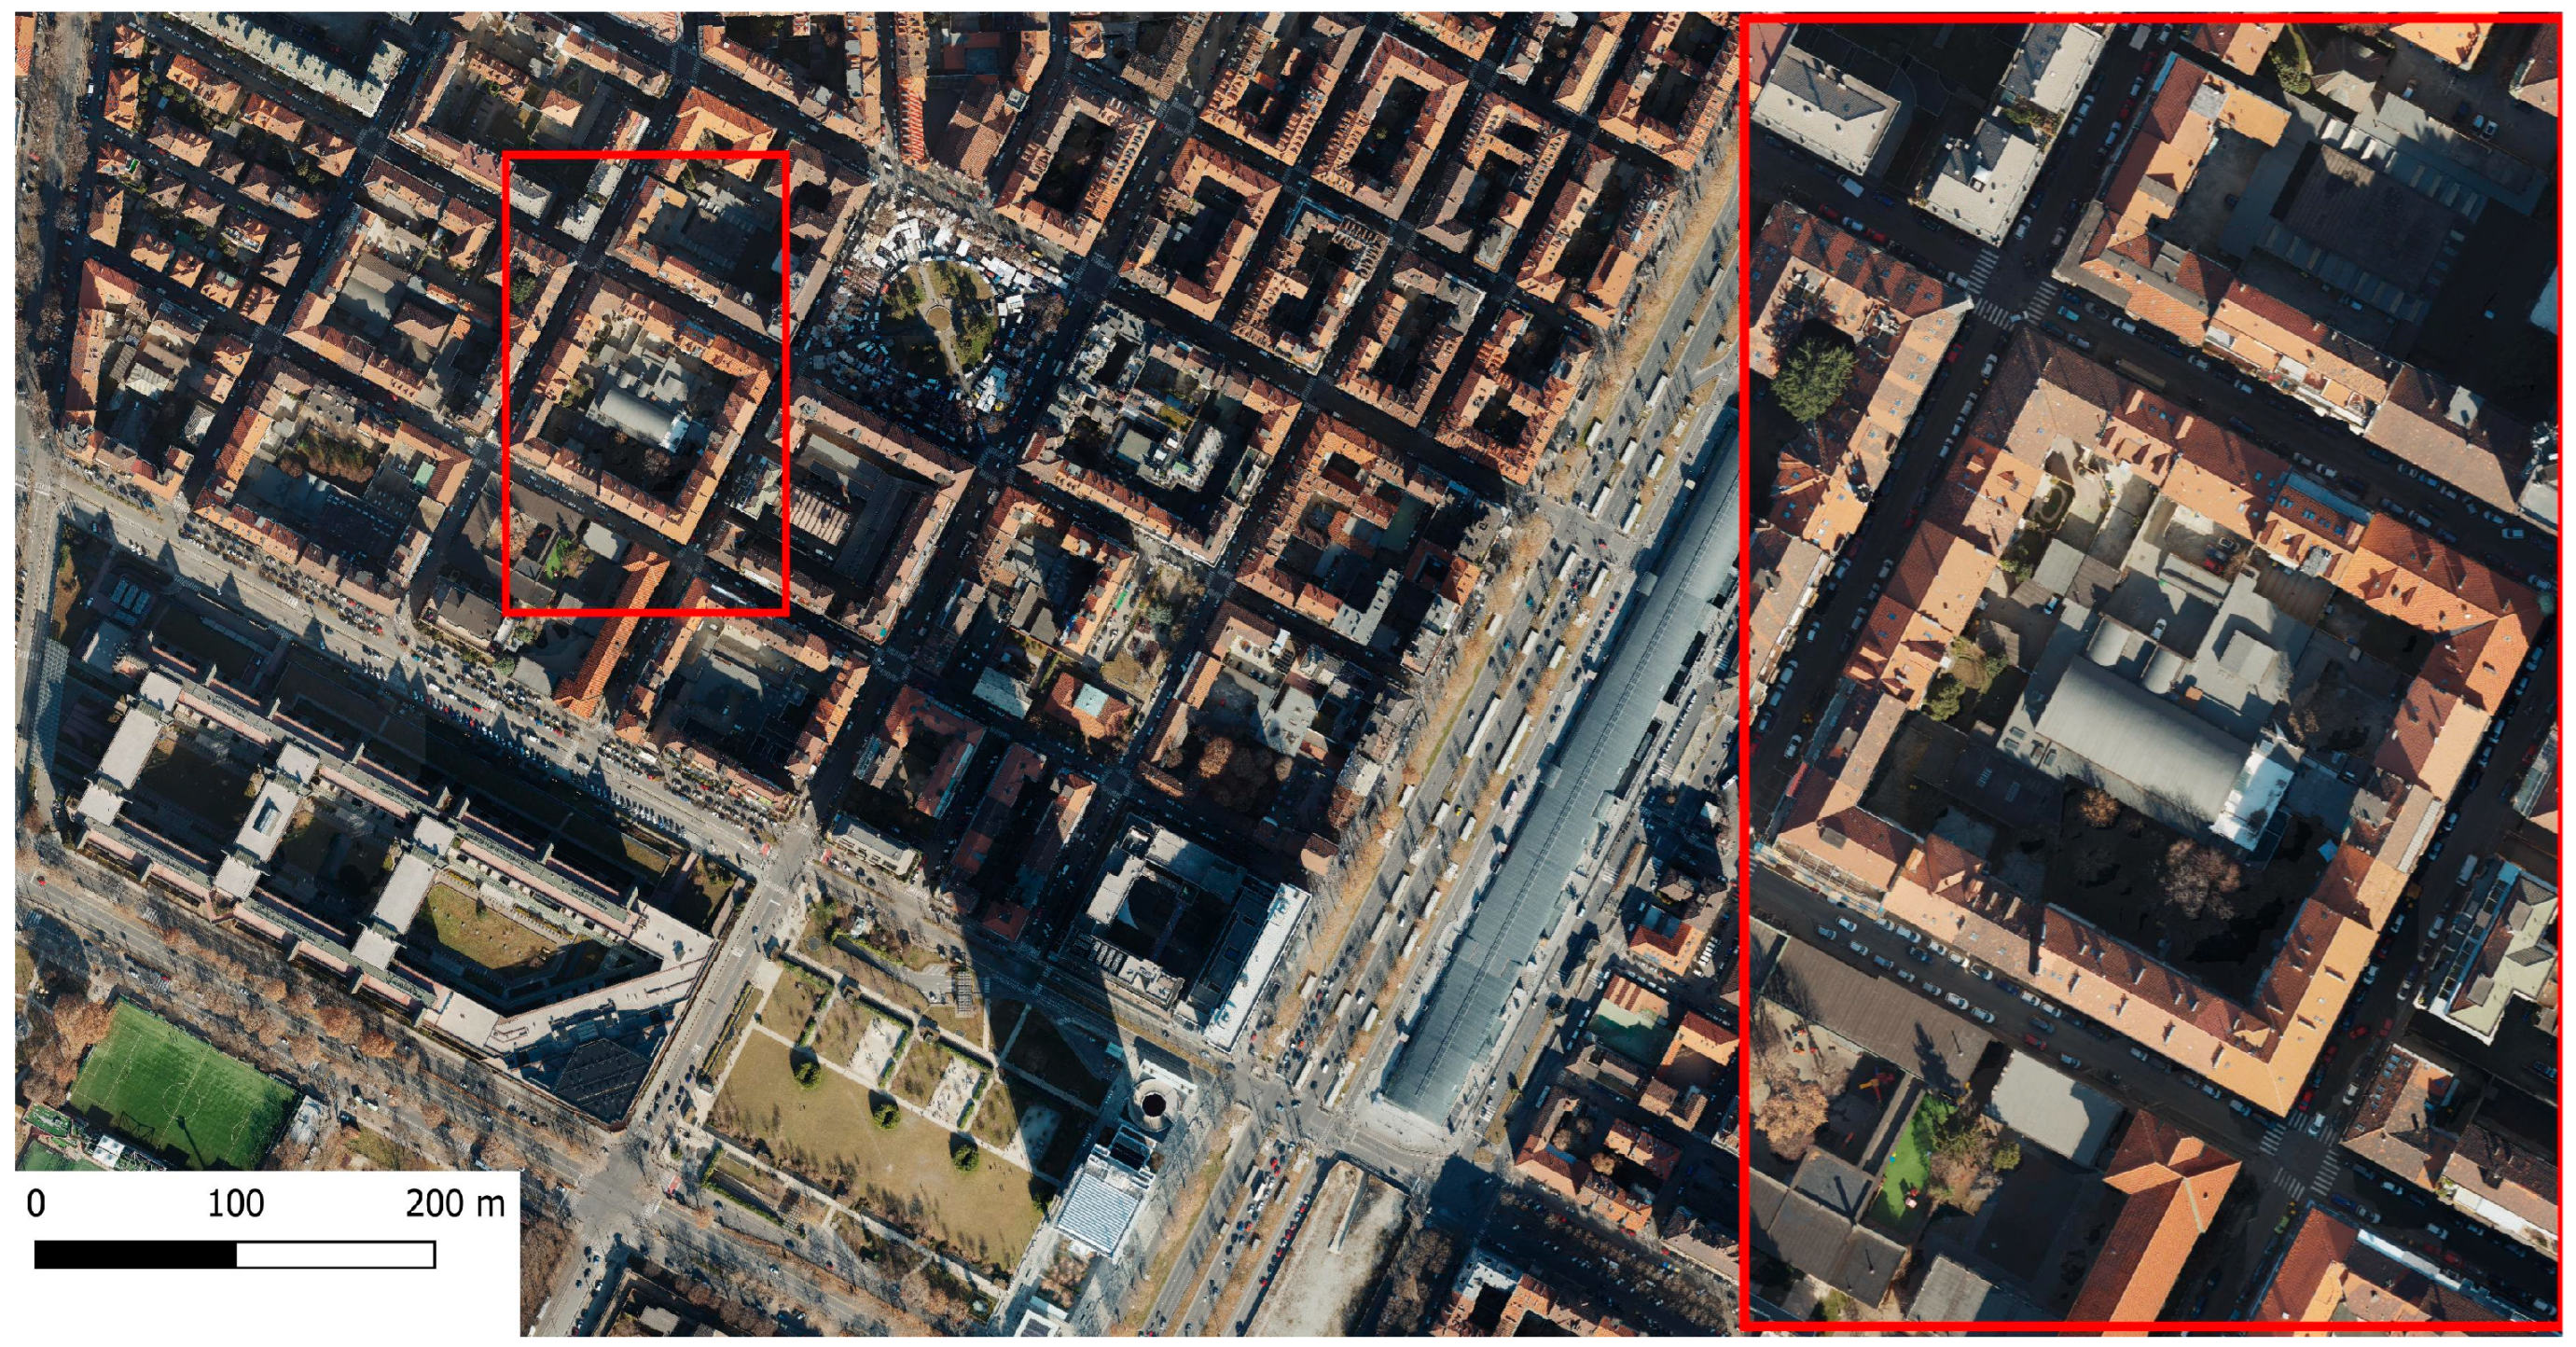
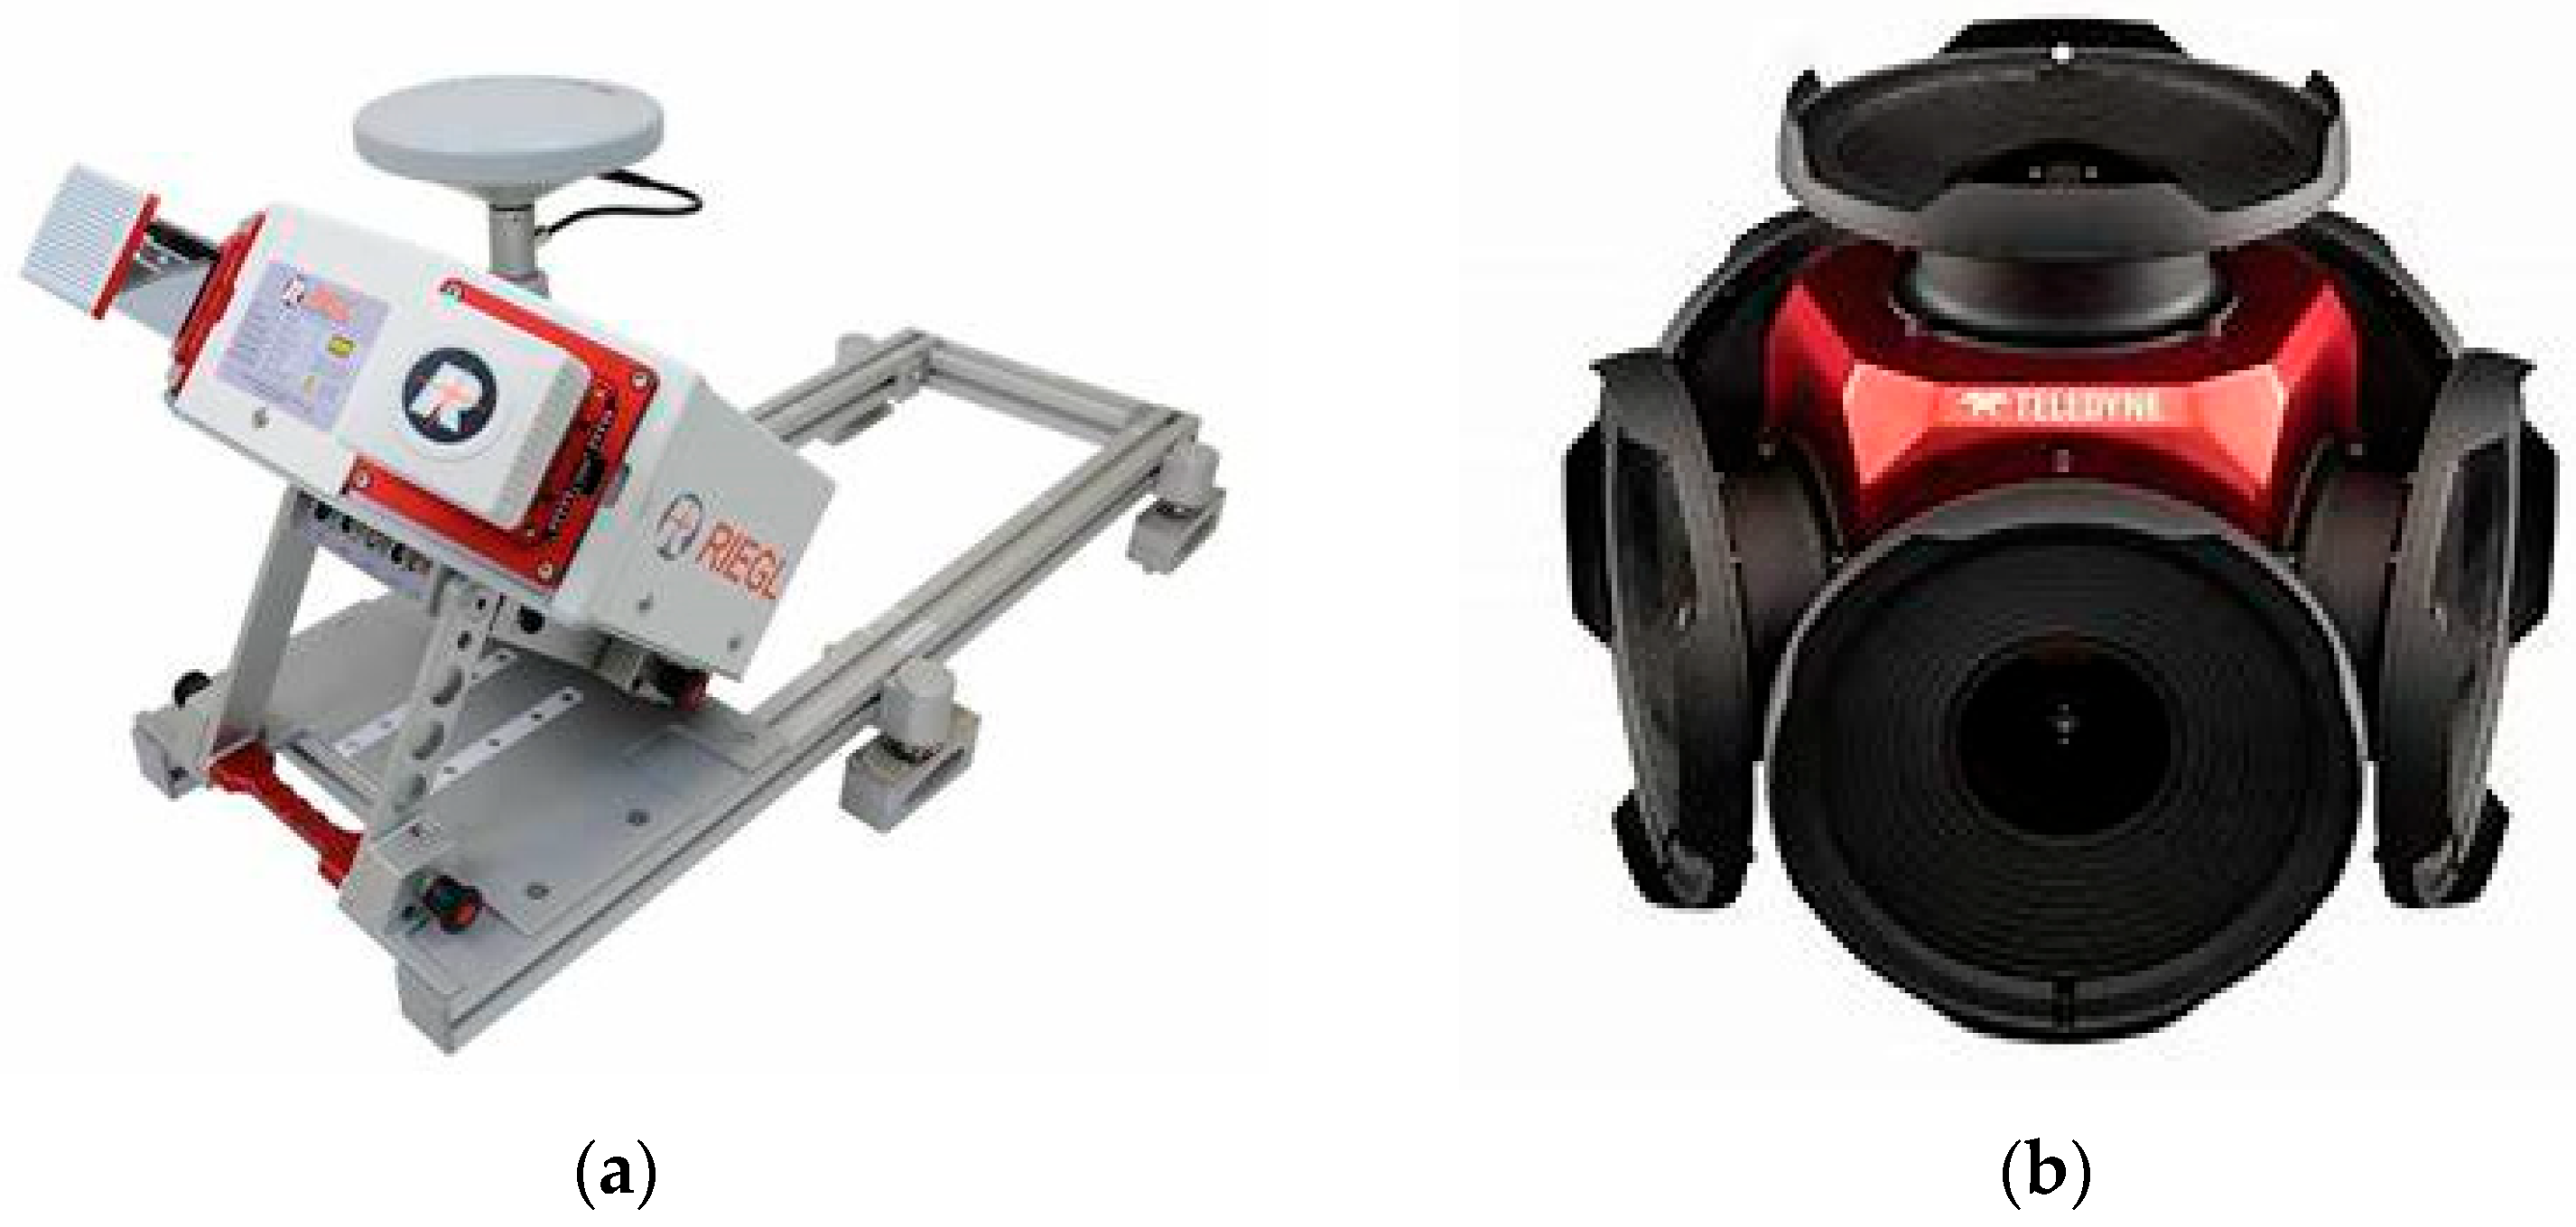

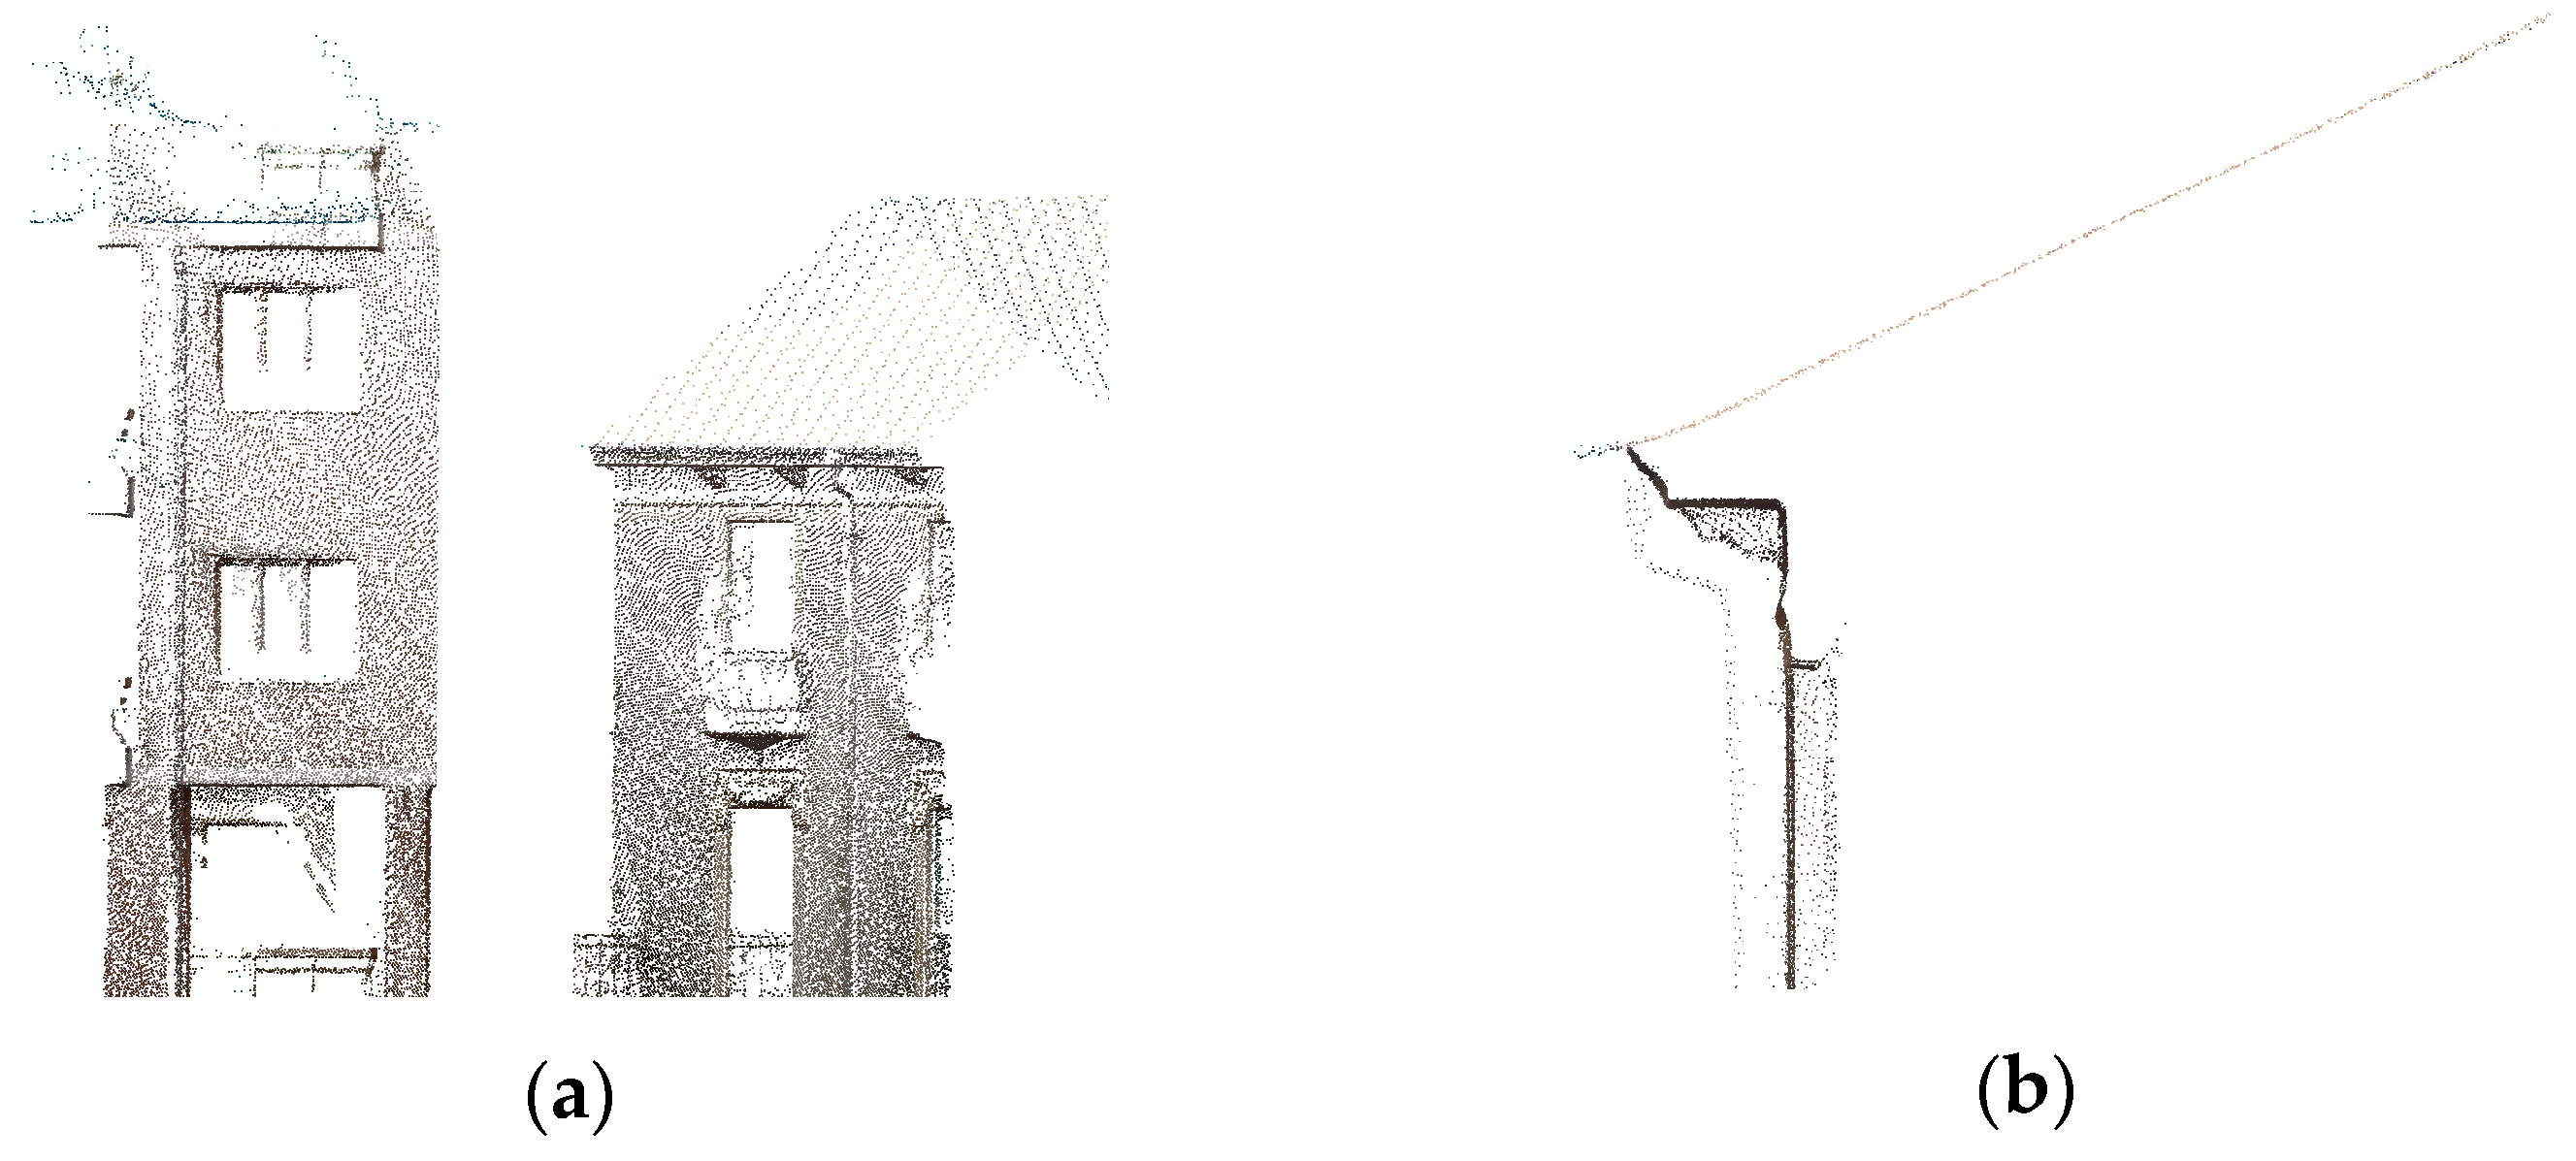
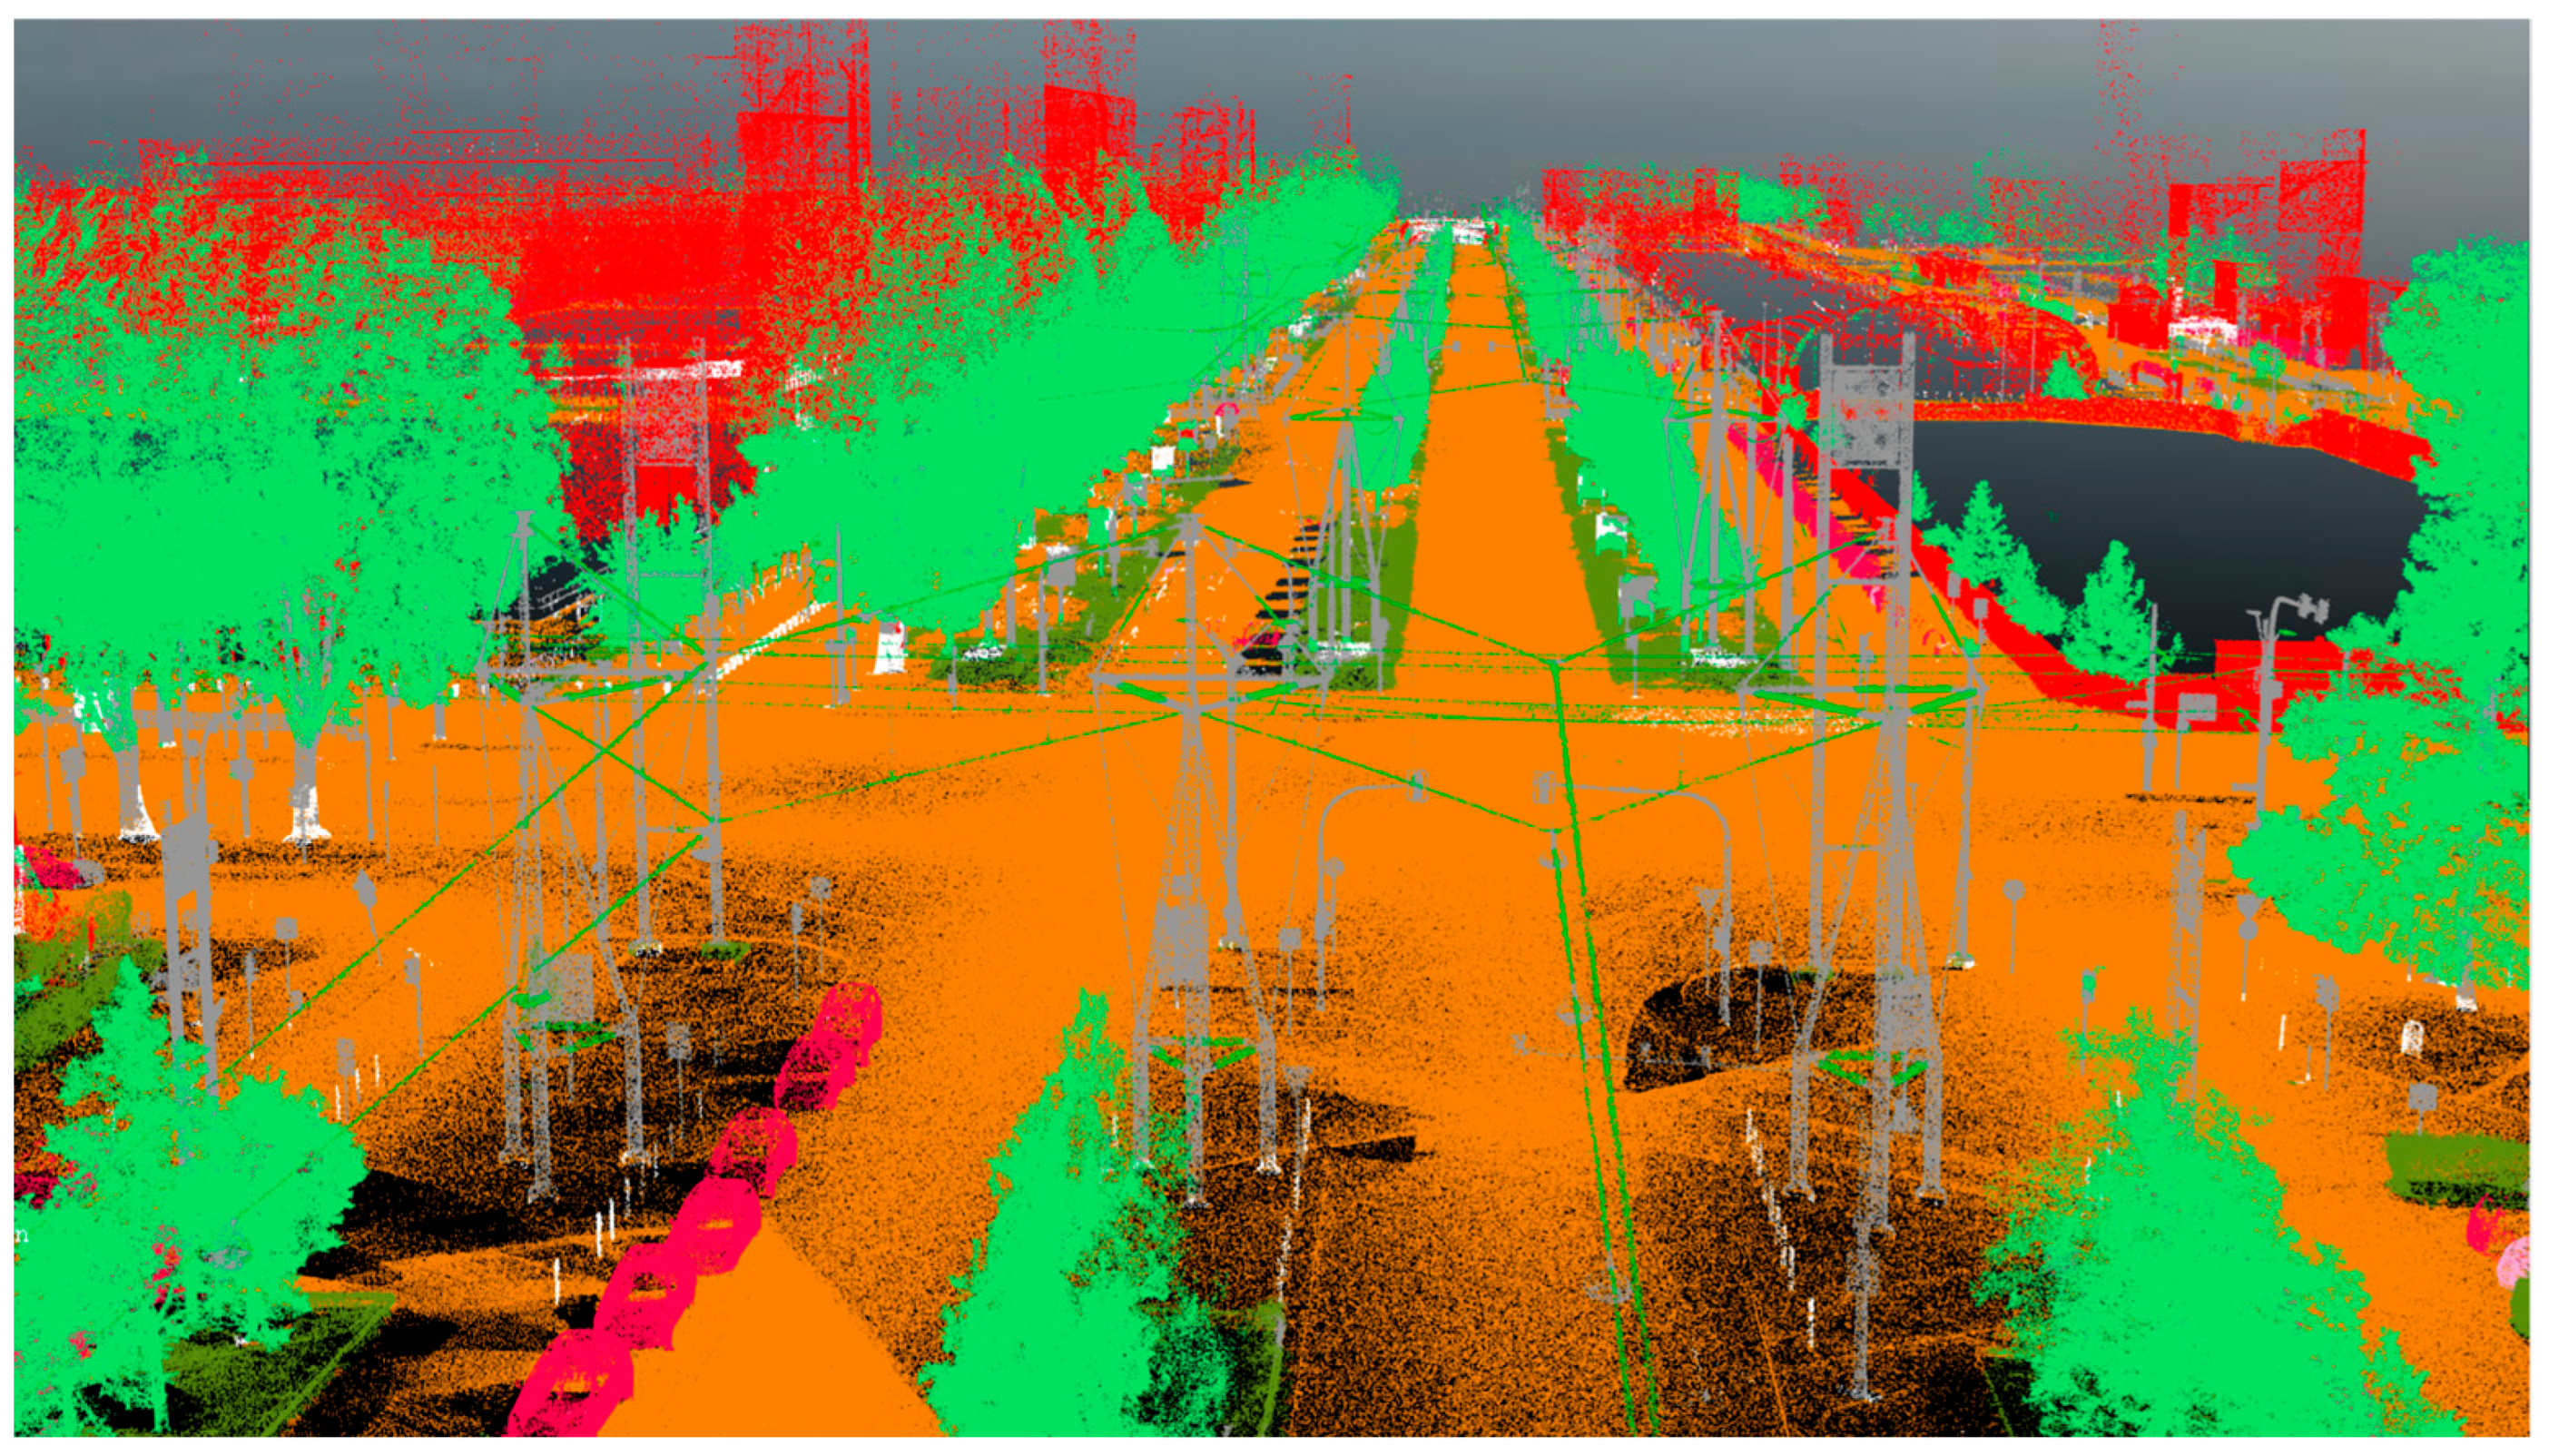
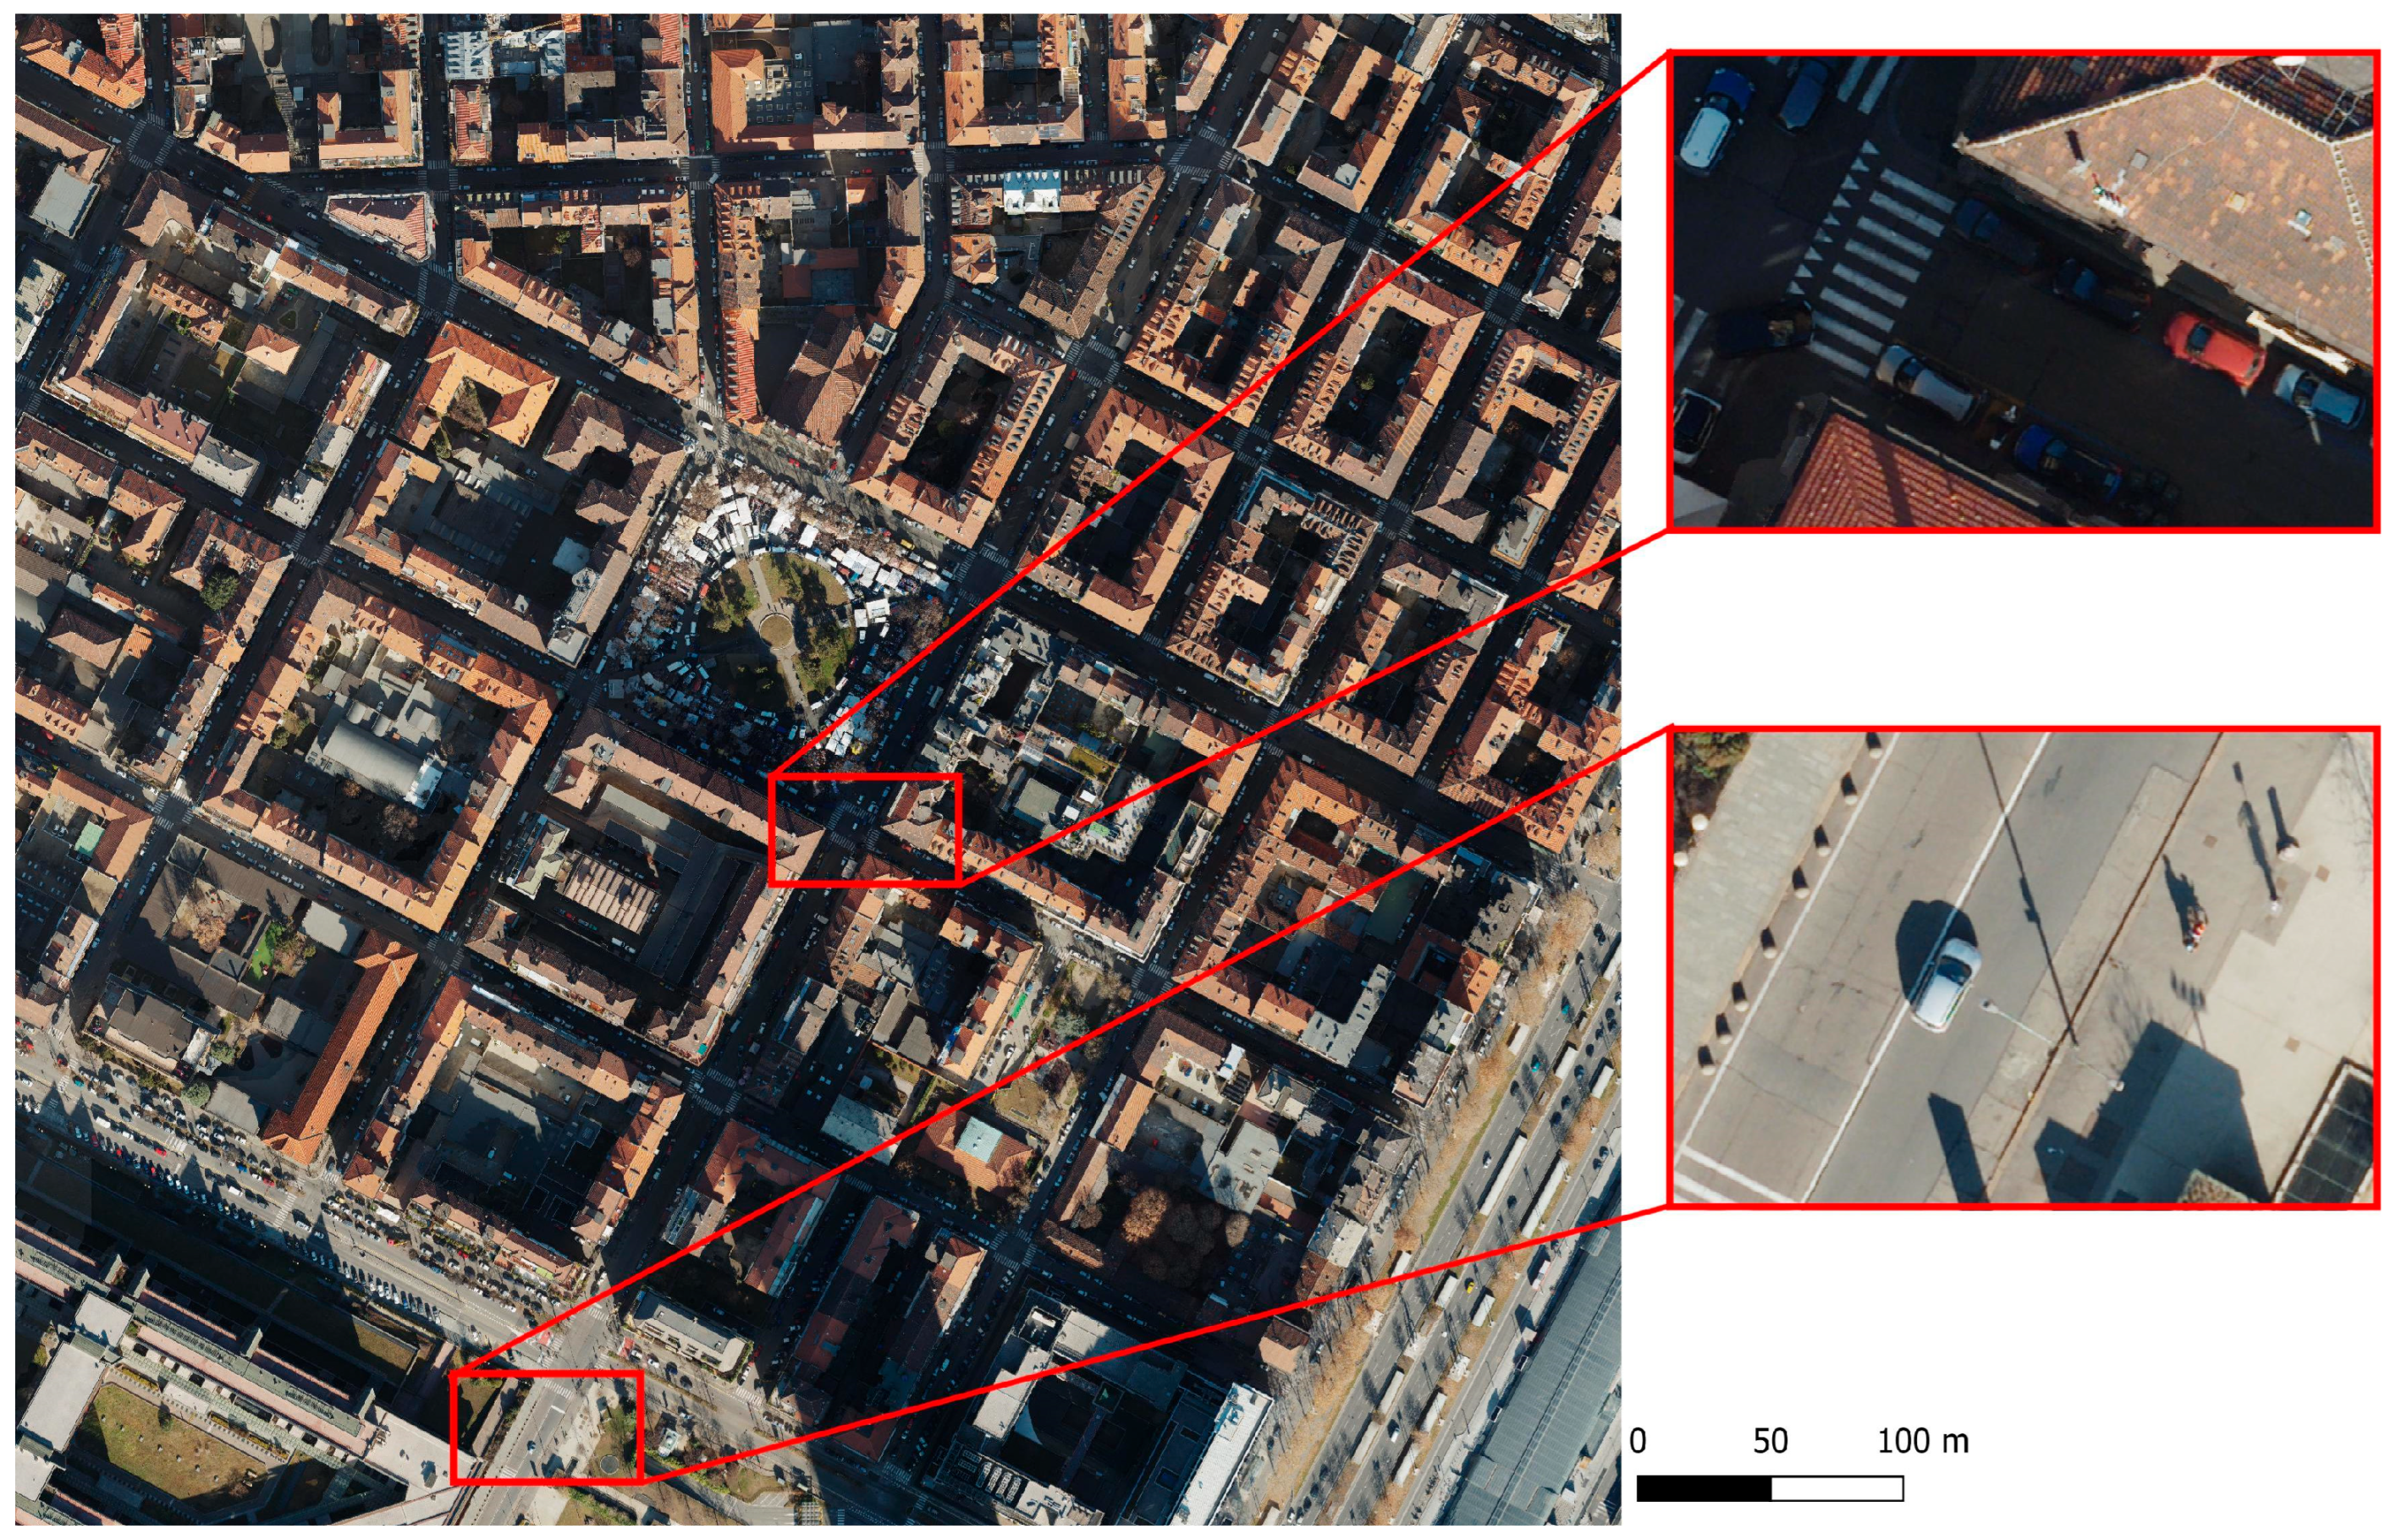
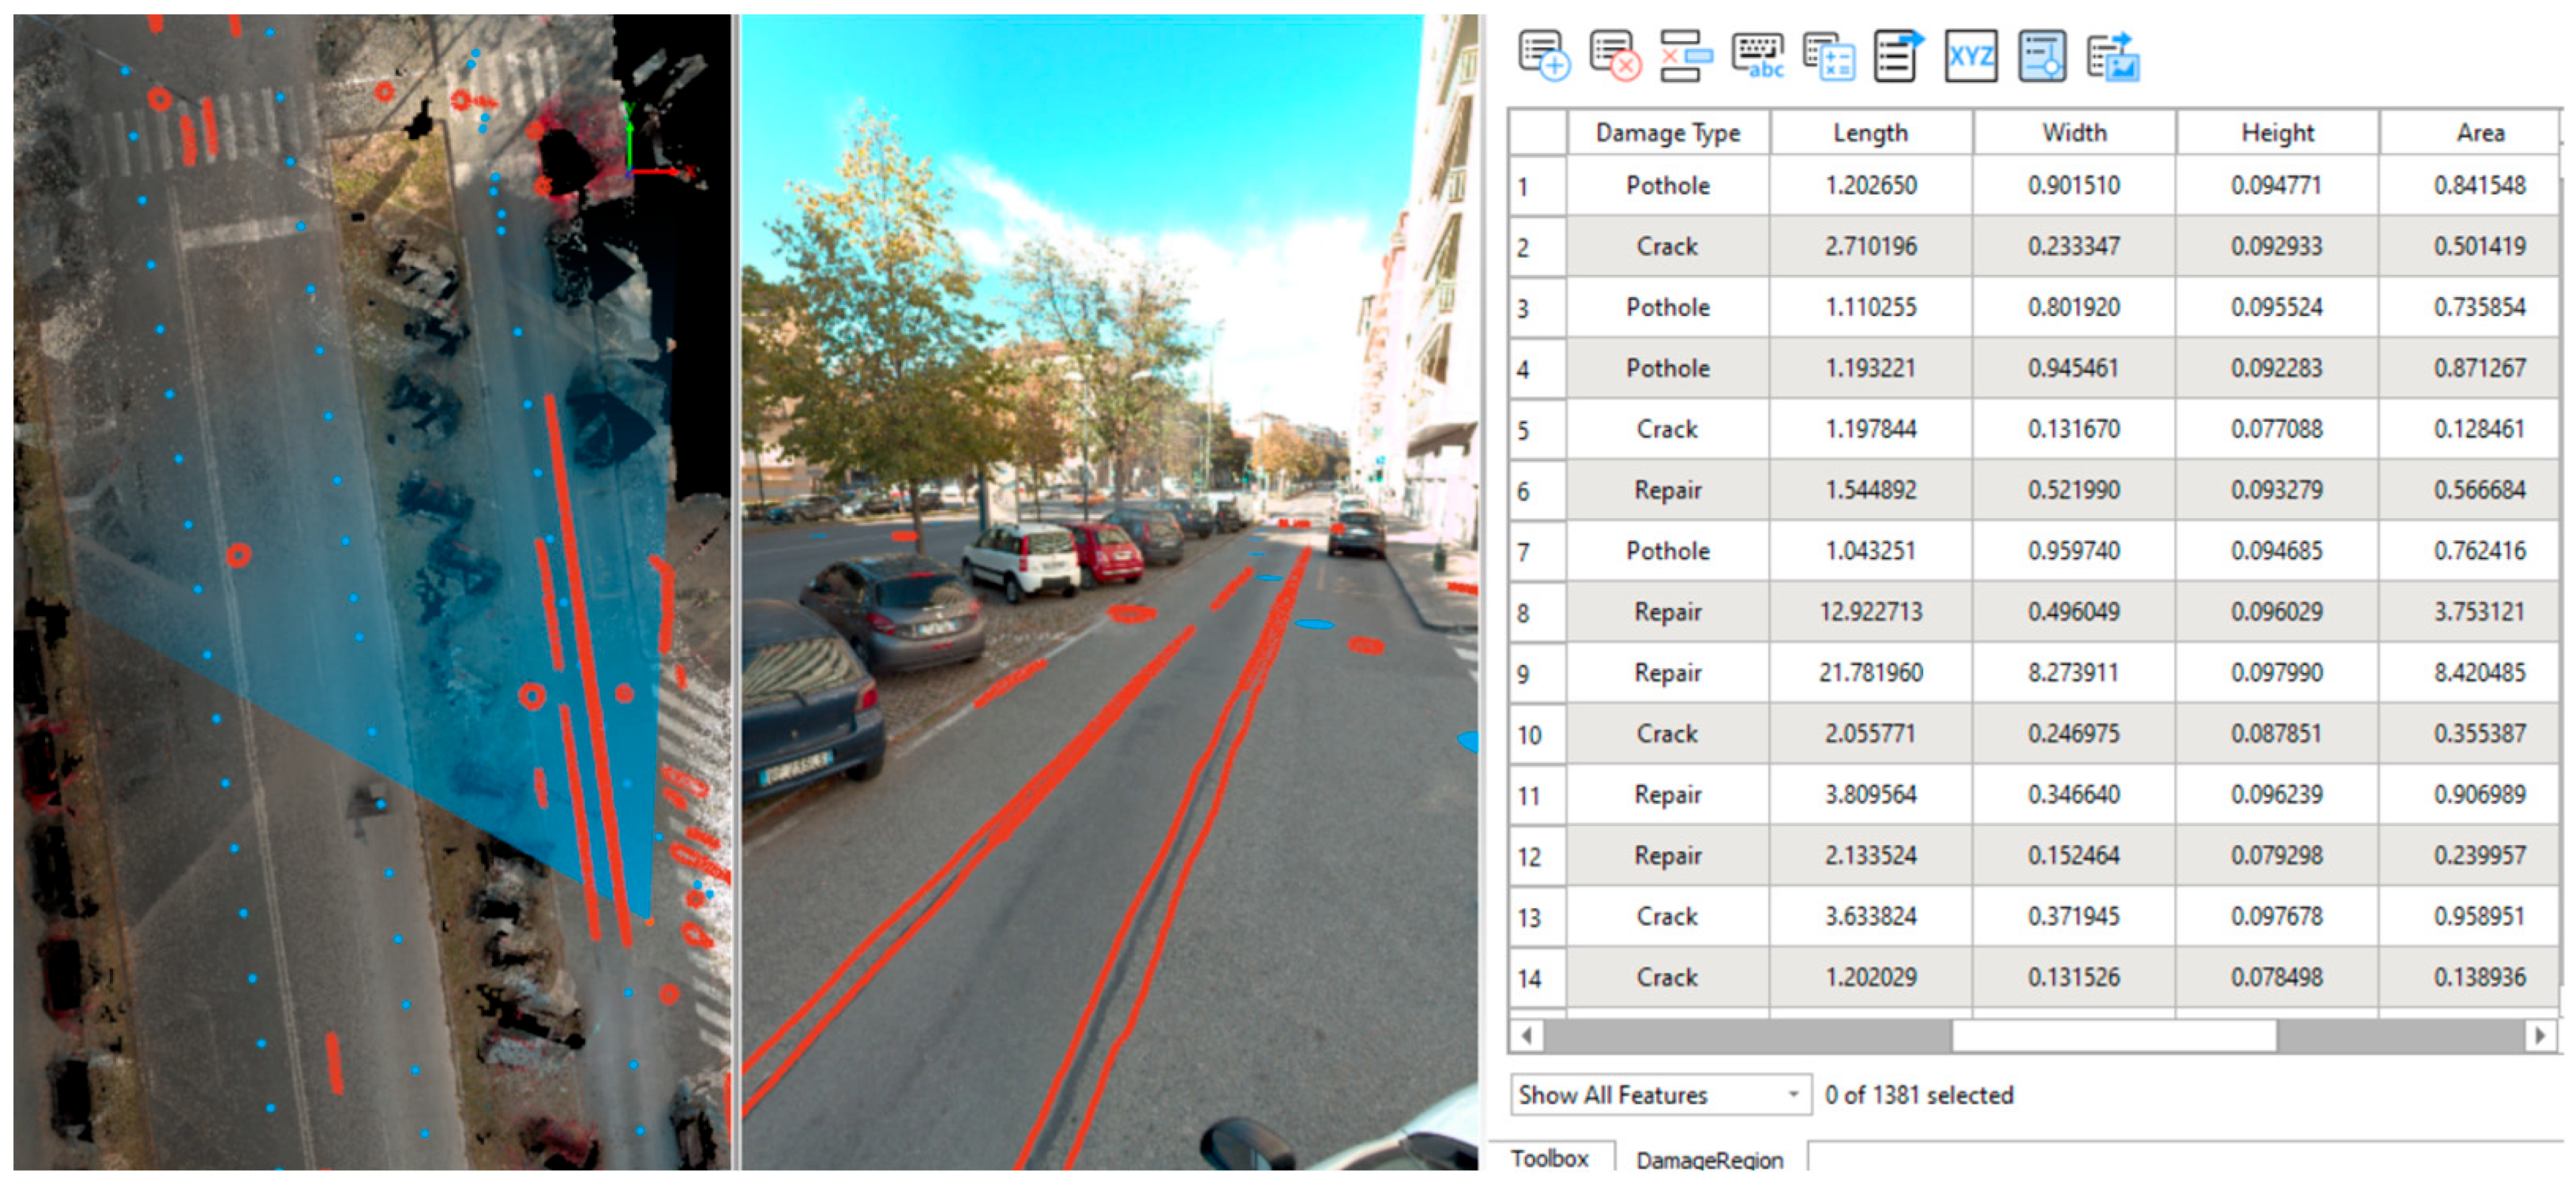
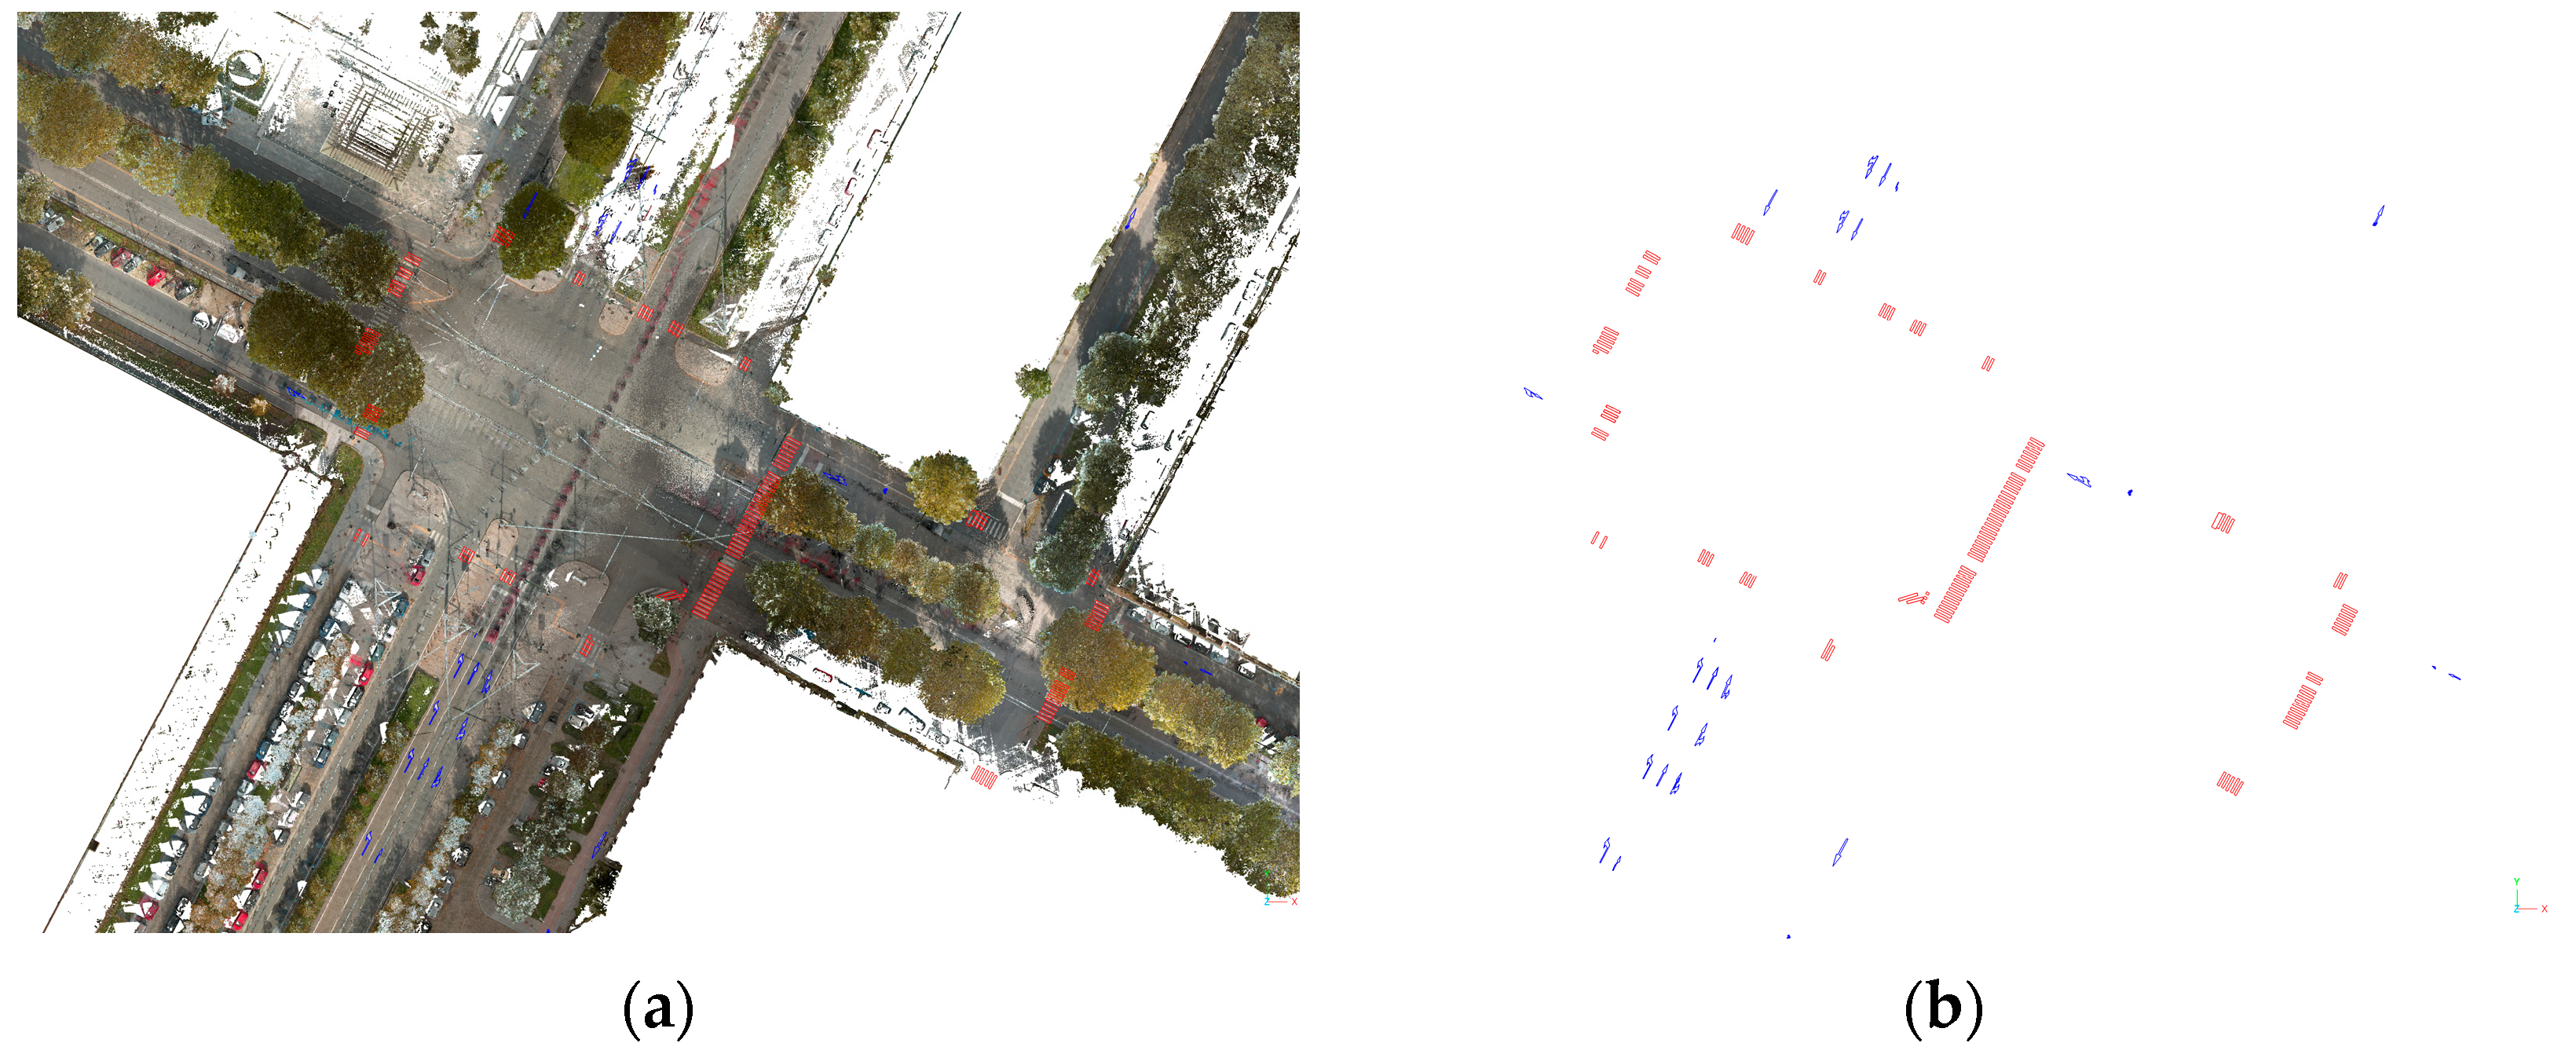
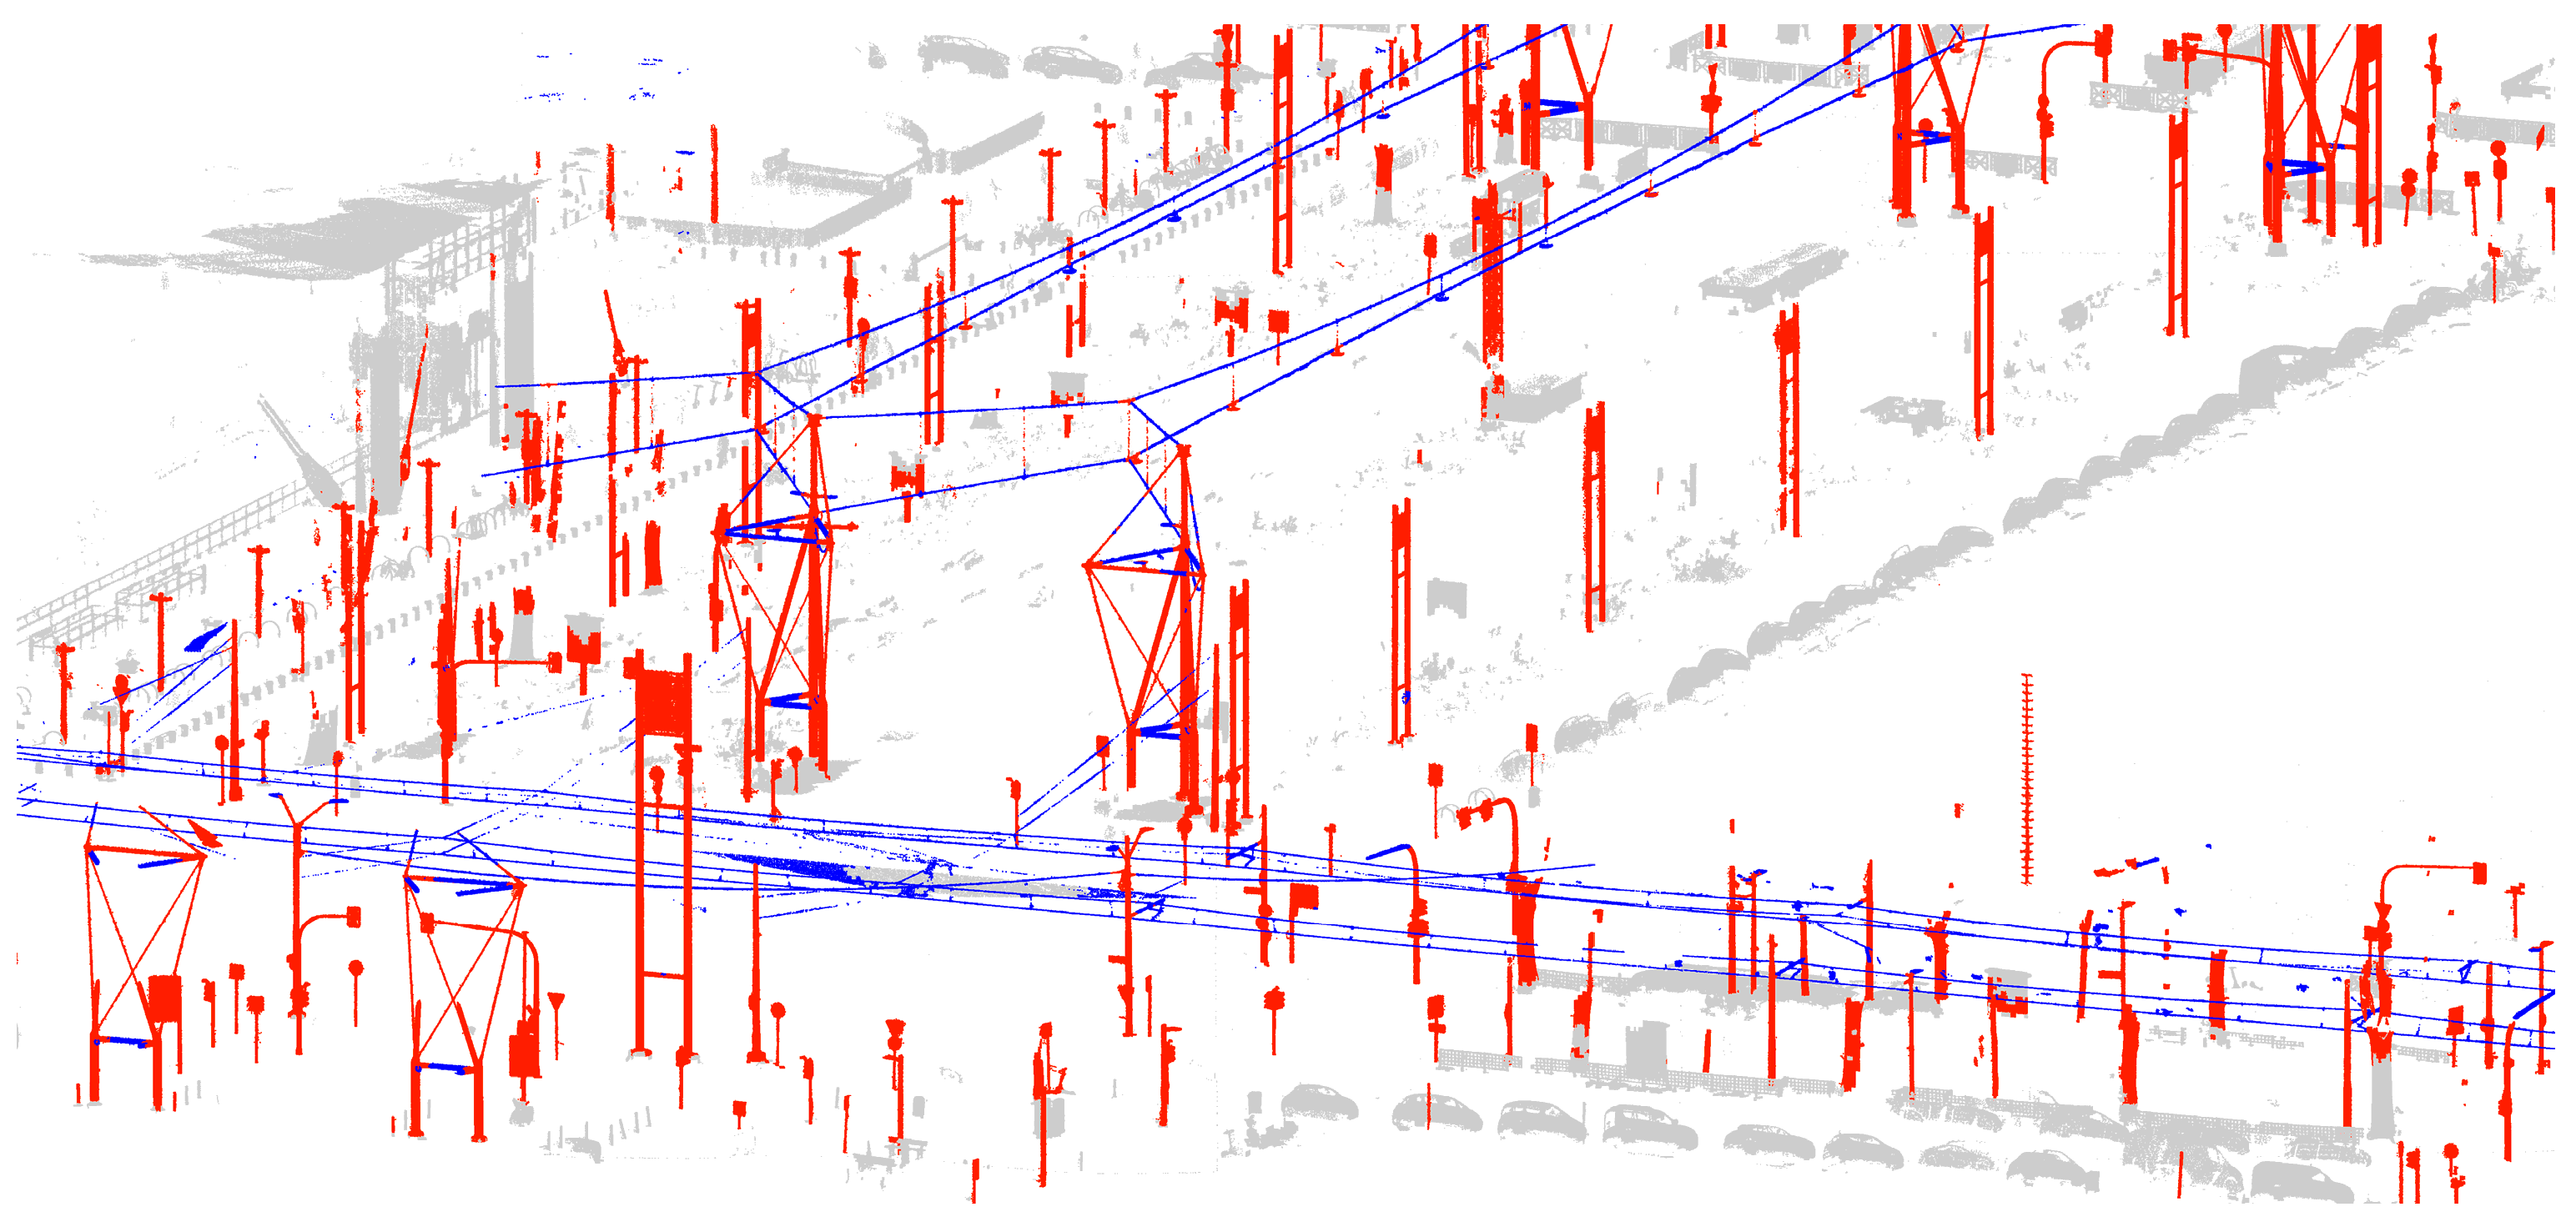
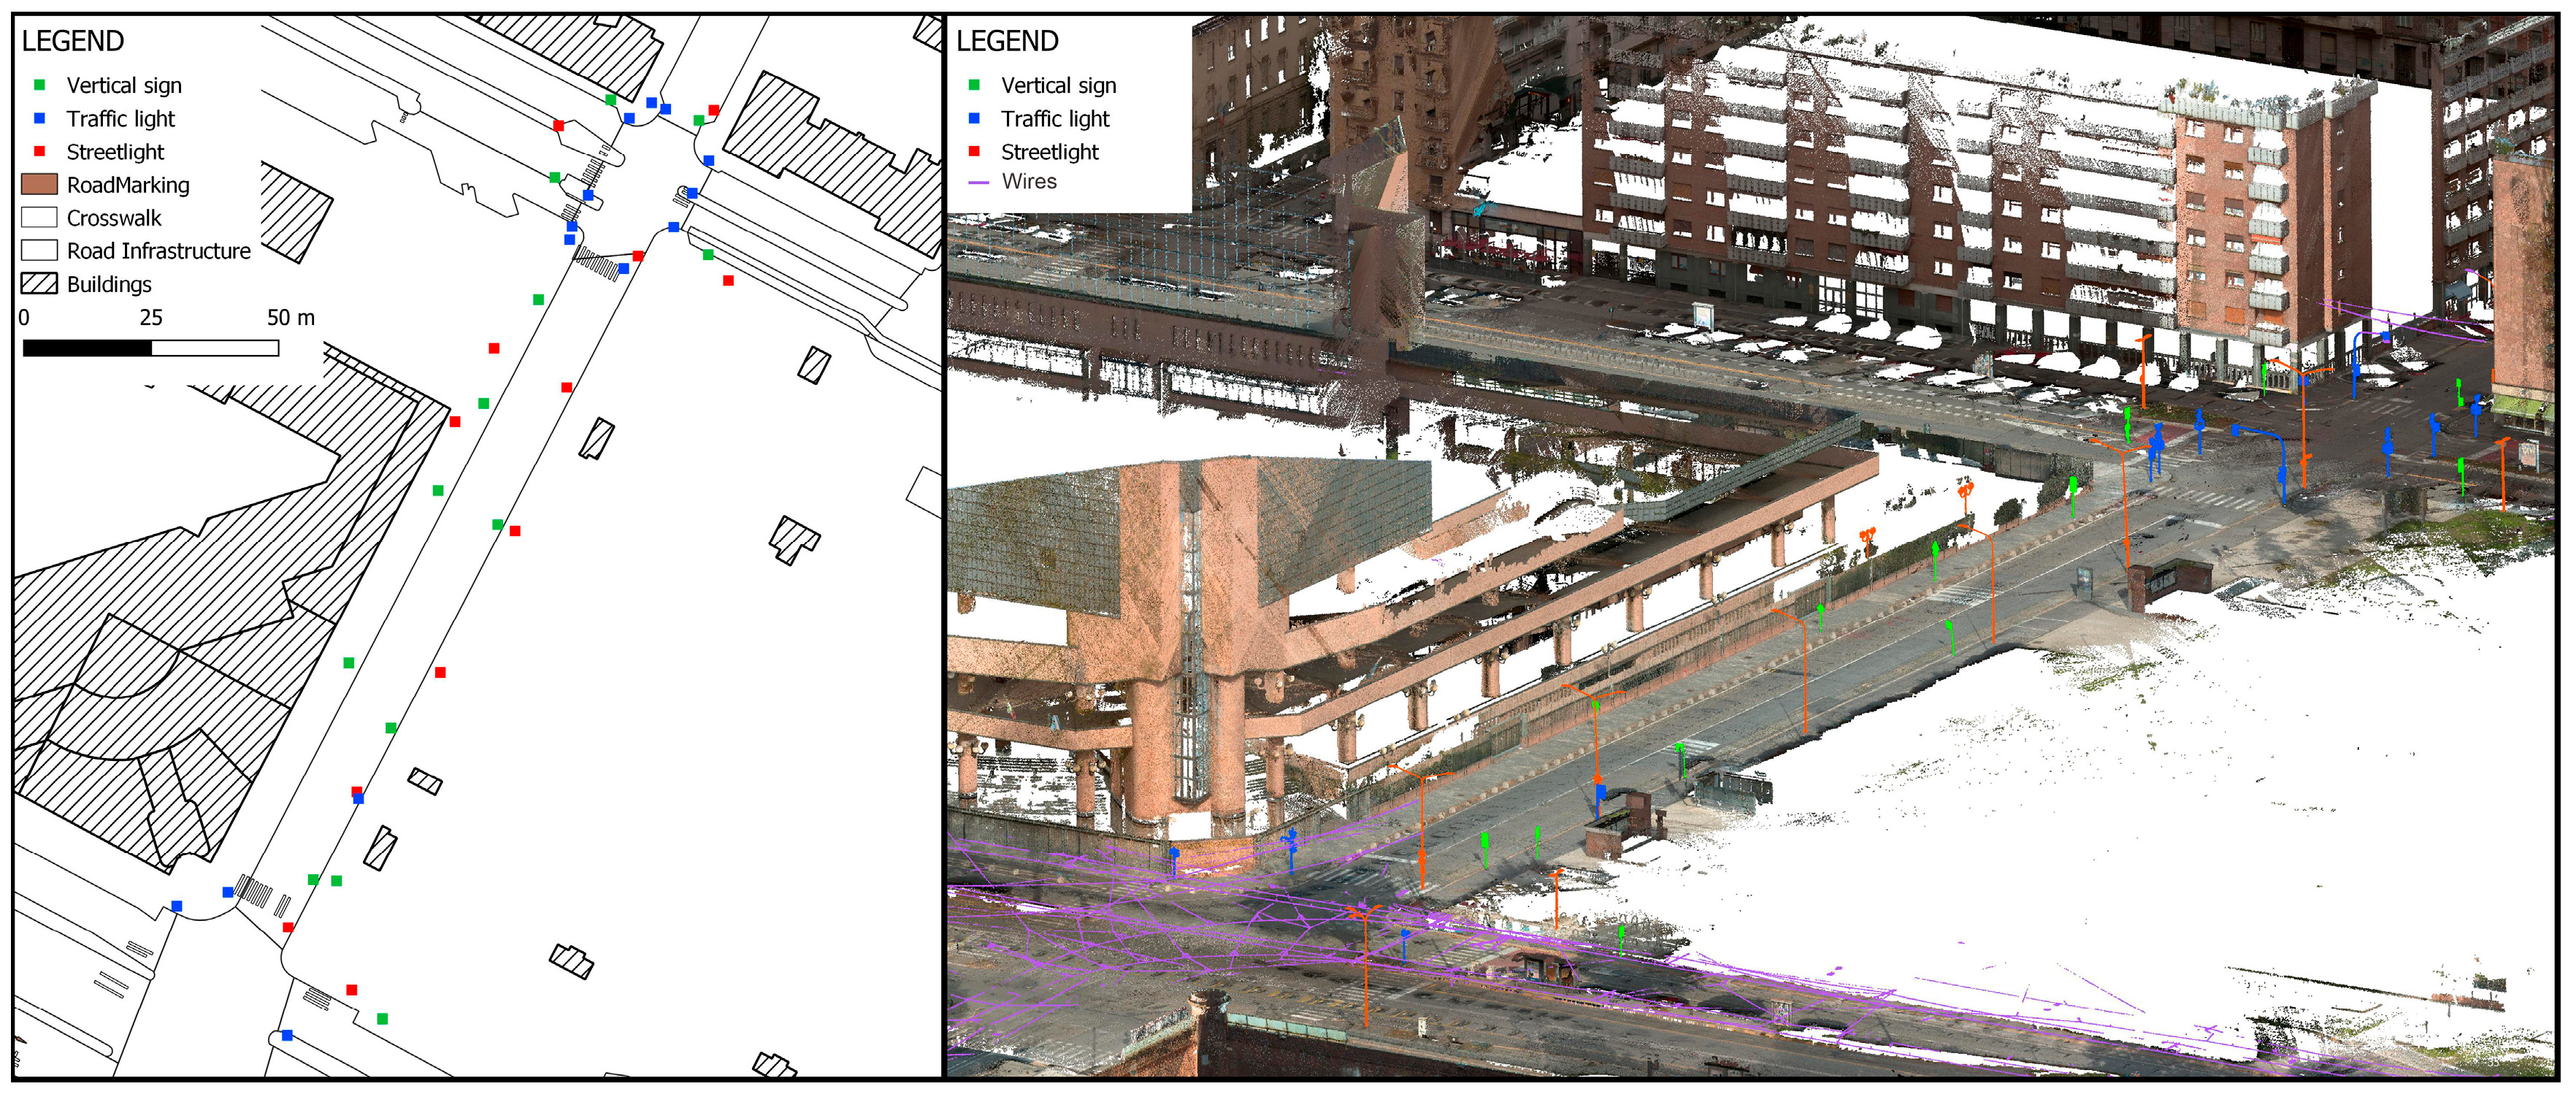
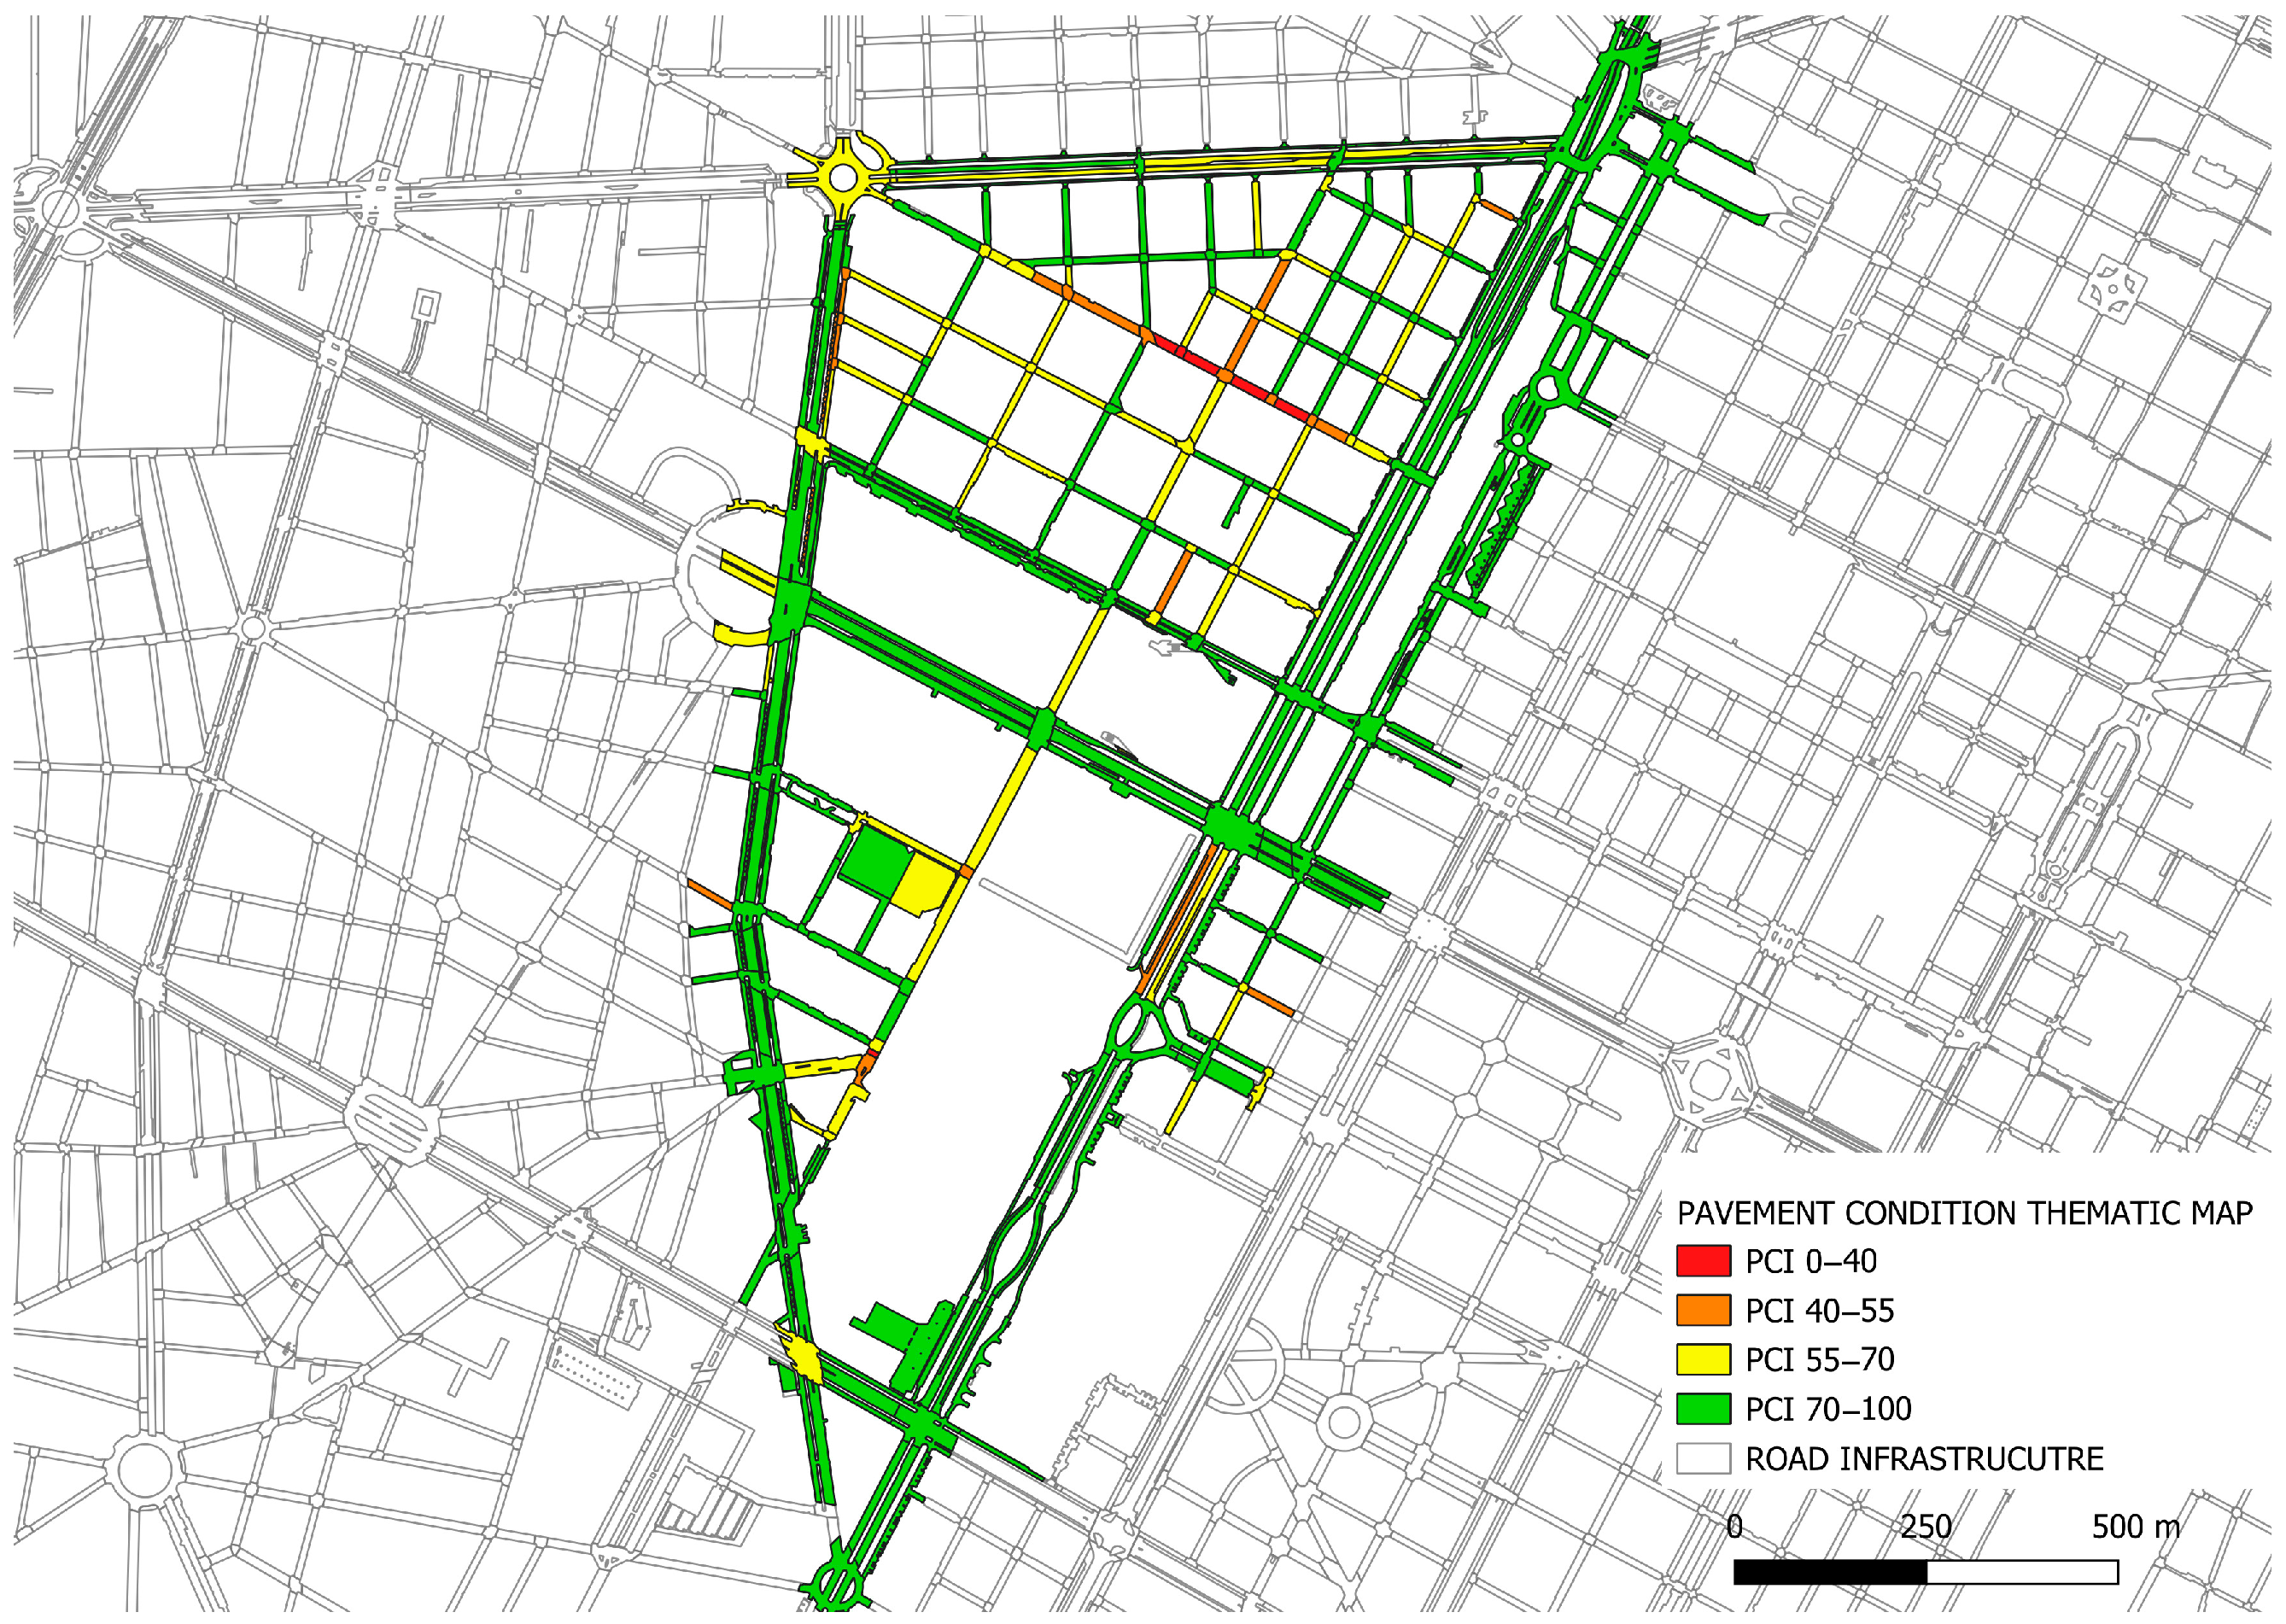
Disclaimer/Publisher’s Note: The statements, opinions and data contained in all publications are solely those of the individual author(s) and contributor(s) and not of MDPI and/or the editor(s). MDPI and/or the editor(s) disclaim responsibility for any injury to people or property resulting from any ideas, methods, instructions or products referred to in the content. |
© 2025 by the authors. Licensee MDPI, Basel, Switzerland. This article is an open access article distributed under the terms and conditions of the Creative Commons Attribution (CC BY) license (https://creativecommons.org/licenses/by/4.0/).