Article

Spatiotemporal Dynamics and Response of Land Surface Temperature and Kernel Normalized Difference Vegetation Index in Yangtze River Economic Belt, China: Multi-Method Analysis

1
School of Urban Construction, Chengdu Polytechnic, Chengdu 611433, China
2
School of Architecture and Urban Planning, Chongqing University, Chongqing 400030, China
3
Key Laboratory of New Technology for Construction of Cities in Mountain Area, Chongqing University, Chongqing 400044, China
4
School of Tourism, Xi’an International Studies University, Xi’an 710128, China
5
School of Urban Planning and Design, Peking University, Shenzhen 518055, China
6
College of Public Administration, Huazhong University of Science and Technology, Wuhan 430079, China
*
Author to whom correspondence should be addressed.
Land 2025, 14(3), 598; https://doi.org/10.3390/land14030598
Submission received: 17 February 2025 / Revised: 10 March 2025 / Accepted: 11 March 2025 / Published: 12 March 2025
(This article belongs to the Special Issue Vegetation Cover Changes Monitoring Using Remote Sensing Data)

Abstract

:
As global climate change intensifies, its impact on the ecological environment is becoming increasingly pronounced. Among these, land surface temperature (LST) and vegetation cover status, as key ecological indicators, have garnered widespread attention. This study analyzes the spatiotemporal dynamics of LST and the Kernel Normalized Difference Vegetation Index (KNDVI) in 11 provinces along the Yangtze River and their response to climate change based on MODIS Terra satellite data from 2000 to 2020. The linear regression showed a significant KNDVI increase of 0.003/year (p < 0.05) and a LST rise of 0.065 °C/year (p < 0.01). The Principal Component Analysis (PCA) explained 74.5% of the variance, highlighting the dominant influence of vegetation cover and urbanization. The K-means clustering identified three regional patterns, with Shanghai forming a distinct group due to low KNDVI variability. The Generalized Additive Model (GAM) analysis revealed a nonlinear LST–KNDVI relationship, most evident in Hunan, where cooling effects weakened beyond a KNDVI threshold of 0.25. Despite a 0.07 KNDVI increase, high-temperature areas in Chongqing and Jiangsu expanded by over 2500 km2, indicating limited LST mitigation. This study reveals the complex interaction between LST and the KNDVI, which may provide scientific basis for the development of regional ecological management and climate adaptation strategies.

1. Introduction

As we enter the 21st century, the impact of global climate change has intensified, introducing unprecedented challenges and uncertainties to natural environments and ecosystems worldwide [1,2]. Among the regions most affected, the Yangtze River Economic Belt stands out due to its vital role as an ecological and economic hub in China and Asia. This region not only regulates the regional climate and maintains the water resource balance but also supports agricultural productivity and preserves biodiversity [3,4]. However, the rapid rise in global temperatures and the increasing frequency of extreme climate events, such as prolonged droughts and floods, have disrupted the ecological balance in this critical area [5,6,7]. These disruptions have been further exacerbated by rapid urbanization, with impervious surface areas in major metropolitan regions (e.g., Chongqing, Nanjing, and Shanghai) increasing by 30–45% from 2010 to 2020, significantly intensifying the urban heat island (UHI) effect [8,9]. Despite numerous studies highlighting the effects of climate change globally, a focused examination of its impacts on vital regions like the Yangtze River Economic Belt remains limited, emphasizing the need for region-specific research.
The advent and advancement of remote sensing technology have significantly enhanced our ability to monitor and analyze large-scale ecological changes with high temporal and spatial resolution [10,11,12,13,14]. Among the various remote sensing metrics, the Kernel Normalized Difference Vegetation Index (KNDVI) has emerged as a particularly effective tool for capturing vegetation health and growth dynamics [15,16,17]. Unlike traditional indices, KNDVI mitigates the saturation issues commonly observed in Normalized Difference Vegetation Index (NDVI), providing a more sensitive detection of vegetation variations, especially in densely vegetated regions [18,19]. This index has been extensively utilized in vegetation monitoring, ecological assessment, and climate change research, offering deeper insights into the adaptive mechanisms of ecosystems under climatic stress [16,20,21,22,23]. Although existing studies have explored the relationship between vegetation indices and LST, most of them focus on the NDVI, which has certain limitations in detecting vegetation variability in densely forested or agricultural areas. The use of KNDVI in assessing vegetation responses to climate change in large-scale ecological regions, such as the Yangtze River Economic Belt, remains understudied [21,24,25,26,27]. However, there is still a lack of comprehensive studies combining the KNDVI with other environmental variables like land surface temperature (LST) in regions with complex climates, such as the Yangtze River Economic Belt, indicating a significant research gap.
Previous studies have extensively explored the relationship between LST and vegetation indices, such as NDVI and KNDVI, particularly in the context of urban heat islands and drought monitoring [28,29,30,31,32]. These studies have not only improved our understanding of the interaction between surface temperature and the KNDVI but also provided a scientific basis for future environmental monitoring and management. However, research on the Yangtze River Economic Belt remains fragmented, with most studies concentrating on individual cities like Wuhan and Nanjing rather than taking a holistic, basin-wide approach. Moreover, the spatial heterogeneity of LST–KNDVI relationships across different provinces within the Belt has yet to be systematically investigated. The current research focuses on the following aspects [11,14,33,34,35,36]. For the study of the urban heat island effect, some studies show that there is a scaling effect in the spatial correlation between urban surface temperature and the NDVI, and this effect shows obvious differences in different seasons and different neighboring ranges [12,22,37,38,39,40]. When measuring the spatial correlation between LST and the KNDVI, the spatial and temporal scale effects need to be considered. Some drought monitoring studies showed negative correlations between LST and the KNDVI, and were used for drought assessment [12,26,41,42,43,44,45]. There is a significant correlation between LST and the NDVI during the growing season, which can be utilized for drought assessment [46,47]. In addition, the KNDVI showed a higher spatial consistency in capturing vegetation responses to drought stress compared to the NDVI, especially during drought events when the sensitivity of the KNDVI increased [17,22,48,49,50,51]. For vegetation growth condition assessment, the KNDVI was developed to mitigate the saturation effect observed in the standard NDVI by capturing higher order differences between the near-infrared and red light spectral bands [15,23,52]. Nevertheless, most of these studies have focused on short-term seasonal variations rather than long-term climate trends, leading to gaps in understanding how vegetation cover responds to prolonged climate stress.
Despite these advancements, most existing studies focus on global or national scales [53,54,55], with limited attention to regional heterogeneity within complex ecosystems like the Yangtze River Economic Belt. Although the correlation between LST and the KNDVI has been demonstrated in previous studies, the specific spatiotemporal patterns of their interactions across the provinces within the Yangtze River Economic Belt remain poorly understood. The lack of research at finer spatial scales hinders our ability to design effective regional climate adaptation and mitigation strategies. This oversight has led to a significant gap in understanding the spatial heterogeneity of climate change impacts within the region and their implications for vegetation cover. Therefore, it is of great practical significance to deeply analyze the characteristics of LST and KNDVI changes in different provinces of the Yangtze River Economic Belt in different time periods, and to explore the response mechanism of vegetation cover to climate change and its regional differences.
To address these knowledge gaps, this study aims to achieve the following: (1) analyze the spatiotemporal variations of the KNDVI and LST across the Yangtze River Economic Belt from 2000 to 2020; (2) investigate the nonlinear interactions between the KNDVI and LST using the Generalized Additive Model (GAM); (3) identify the dominant environmental drivers affecting KNDVI–LST relationships using Principal Component Analysis (PCA); and (4) apply K-means clustering to categorize different climate adaptation responses across the provinces. By integrating these methods, this study provides a more comprehensive understanding of vegetation resilience and urban heat mitigation in the Yangtze River Basin, offering scientific insights for developing region-specific ecological planning and climate adaptation strategies. Through this study, we aim to elucidate the sensitivity and adaptability of vegetation cover in the Yangtze River Economic Belt to climate change, providing scientific support for the formulation of regional climate adaptation strategies and ecological protection policies. The findings of this study are expected to contribute to a deeper understanding of climate–vegetation interactions at a regional scale, and offer valuable guidance for policymakers in designing sustainable land-use and environmental conservation strategies, both within China and in other regions facing similar climatic challenges.

2. Study Area and Data

2.1. Study Area

The research area of this paper is the Yangtze River Economic Belt, one of China’s most important economic regions (Figure 1). It covers 11 provinces and municipalities, including Shanghai, Jiangsu, Zhejiang, Anhui, Jiangxi, Hubei, Hunan, Chongqing, Sichuan, Yunnan, and Guizhou, with an area of about 2.05 million square kilometers, accounting for 21% of China’s total area. The Yangtze River Economic Belt spans the eastern, central, and western regions of China; the climate in this region is diverse, with the eastern part characterized by a subtropical monsoon climate, hot and rainy in summer, mild and less rainy in winter; while the western part is mainly characterized by a plateau mountain climate, with distinct vertical climate differences, forming a unique vertical climate zone from the subtropical river valleys to the ice and snow zones of the high mountains. The types of land-use are rich, with the eastern part mainly consisting of arable land and construction land, making it an important agricultural production base and urban dense area in China. The central and western parts are mainly forest and grassland, with rich forest resources and grassland ecosystems. However, with the rapid development of urbanization and industrialization, the Yangtze River Economic Belt is facing ecological and environmental pressures, such as water pollution, soil degradation, and the reduction of biodiversity, and it is urgent to strengthen ecological protection and sustainable development. By selecting these representative provinces, this study aims to explore the impacts of early 21st-century climate change on the KNDVI, utilizing extensive remote sensing data to analyze vegetation responses. The results will support predictions of future ecological changes and offer valuable insights for policymakers.

2.2. Data Sources and Processing Methods

To comprehensively analyze the trends of the KNDVI and land surface temperature (LST) in the Yangtze River Economic Belt from 2000 to 2020, this study utilizes the MODIS Terra satellite product dataset, processed and analyzed through the Google Earth Engine (GEE) platform. Specifically, the MOD09GA product was used to study vegetation index changes, while the MOD11A1 product was employed to analyze land surface temperature variations, covering the period from 1 January 2000 to 31 December 2020.
For the vegetation index analysis, a custom cloud masking function, maskClouds, was employed to effectively eliminate the interference of cloud cover and cloud shadows, ensuring data accuracy. After cloud masking, a scale factor of 1 × 10⁻⁴ was applied to the selected images for unit conversion, allowing the calculation of the KNDVI. This index, derived from the reflectance in the red and near-infrared bands, accurately reflects the physiological state of vegetation. The KNDVI was calculated as the annual mean value to capture the general vegetation condition throughout the year. The processed annual KNDVI data were exported and visually represented using color mapping, revealing long-term vegetation trends.
For land surface temperature analysis, this study selected the LST_Day_1km band from the MOD11A1 product for each year within the specified time range. Given the Yangtze River Economic Belt’s frequent rainy weather, which results in more missing LST values, a linear interpolation method was applied to fill the missing data, ensuring a complete and accurate dataset. After applying the scale factor and adjusting the temperature units, the annual average land surface temperature was calculated to provide a consistent measure of thermal conditions. To visually present the temperature distribution across the Yangtze River Economic Belt, a set of visualization parameters, including temperature ranges and a color gradient palette, were established. The annual LST and KNDVI images were exported in GeoTIFF format to Google Drive, providing a solid data foundation for further analysis.

3. Research Methods

To comprehensively investigate the complex spatiotemporal interactions between the Kernel Normalized Difference Vegetation Index (KNDVI) and land surface temperature (LST) in the major provinces along the Yangtze River, we employed a combination of analytical techniques: linear regression, Principal Component Analysis (PCA), K-Means clustering, and Generalized Additive Models (GAM). The integration of these methods allows for a robust exploration of both linear and nonlinear relationships, as well as the identification of distinct regional patterns in the data. Linear regression is used to estimate temporal trends in KNDVI and LST, PCA reduces the dimensionality of the dataset to identify key factors influencing vegetation and temperature changes, K-Means clustering aids in grouping provinces with similar change patterns over 21 years, and GAM provides a flexible framework to model and understand the nonlinear dynamics between KNDVI and LST. To ensure the robustness of our clustering and modeling choices, we further applied evaluation metrics, such as the elbow method and silhouette score in K-Means clustering, and used cross-validation and Akaike Information Criterion (AIC) for GAM model selection. By using these complementary approaches, we aim to capture the diverse and multifaceted ecological responses to climate change, ensuring a comprehensive analysis that informs future ecological management strategies.

3.1. Trend Analysis

We employed linear regression to estimate the trends of KNDVI and LST from 2000 to 2020. The slope of the regression line represents the trend over time [29,30,56]. The model is expressed as:
y = β 0 + β 1 t + ϵ
where y represents the annual raster values of KNDVI and LST, t is the explanatory variable representing the year, β 0 is the intercept, β 1 is the slope, indicating the trend over time, and ϵ is the error term.
To assess the significance of the trends, we calculated the p-values for the regression slopes. Trends were considered significant at p < 0.05. The trend results were categorized into three classes: 1 for significant increasing trends, 0 for no significant change, and −1 for significant decreasing trends. We conducted a statistical analysis to determine the proportion of each category using the following formula:
P e r c e n t a g e i = ( C o u n t i C o u n t )   × 100
where C o u n t i represents the frequency of the i-th category, and C o u n t is the total frequency across all categories.

3.2. Principal Component Analysis (PCA)

PCA was used to reduce the dimensionality of the dataset and identify key factors influencing KNDVI and LST changes. PCA converts correlated variables into uncorrelated principal components that capture the maximum variance in the data. The process involved standardizing the data and calculating the covariance matrix. The principal components were derived from the eigenvalues and eigenvectors of the covariance matrix. The mathematical expression is:
C = 1 n X T X
where C is the covariance matrix, X is the standardized data matrix, and n is the number of observations. The components with the highest eigenvalues were selected for further analysis to highlight the main drivers of vegetation and temperature changes in the Yangtze River Economic Belt.

3.3. K-Means Clustering

The K-Means clustering algorithm is a widely used method aimed at effectively assigning n samples into k clusters [15,31,57]. This study focuses on investigating the variation patterns of KNDVI and LST across 11 provinces within the Yangtze River Economic Belt over a period of 21 years. Through clustering analysis, we seek to identify provinces with similar patterns of change, thereby revealing whether these variations follow the same pattern across different years. Specifically, this method iteratively minimizes the sum of the squared distances from each sample point to its nearest cluster center (centroid). The objective function of the algorithm can be expressed as minimizing the total distance of each point to its respective cluster center, ensuring that each province is assigned to the cluster that best represents its annual changes in KNDVI and LST [46,47]. This approach not only aids in identifying spatial and temporal variation patterns within the Yangtze River Economic Belt but also serves as an effective data analysis tool for further environmental and ecological research. The objective function can be expressed as follows:
J = i = 1 k x C i x μ i 2
where C i represents the i-th cluster of provinces, x is the point belonging to C i , μ i is the mean vector of C i , and J is the within-cluster sum of squares. The algorithm attempts to minimize this value.
To determine the optimal number of clusters, we applied the Elbow Method, which evaluates the within-cluster sum of squares (WSS) for different values of k. The optimal k is selected at the point where the rate of decrease in WSS slows down, forming an “elbow” in the plot. Additionally, we computed the Silhouette Score to measure the clustering quality, where higher values indicate better-defined clusters. Based on these metrics, k = 3 was selected as the optimal number of clusters. The mathematical formula is as follows:
W k = i = 1 k x C i | x μ i | 2
where W k is the sum of squares of the total errors for each clustering center (WSS, Within-Cluster Sum of Squares), which decreases with increasing values of k, but with “elbow points” at the optimal k. The W k is the sum of squares of the total errors for each clustering center (WSS, Within-Cluster Sum of Squares).
Silhouette Score is added as a supplementary measure:
S i = b i a i m a x ( a i , b i )
where a i is the average distance from point i to other points in the same cluster and b i is the average distance from point i to the nearest other clusters; a higher value of S i indicates better clustering.

3.4. Generalized Additive Model

In this study, we employed a Generalized Additive Model (GAM) to analyze the relationship between KNDVI and LST (Land Surface Temperature) [33,34]. GAM is a flexible regression technique that allows the response variable to be modeled as a smooth function of the explanatory variables, making it well suited for capturing the nonlinear relationships often found in environmental and ecological data. This model is particularly useful for studying complex interactions between variables in such datasets, as it extends the framework of Generalized Linear Models (GLMs) by incorporating smooth functions, providing additional flexibility. The model can be expressed as follows:
g E Y = β 0 + s 1 x 1 + s 2 x 2 + + s p x p
where g(⋅) is the link function, E(Y) is the expected value of the response variable Y, β 0   is the intercept, and s j x j is the smooth function applied to the j-th explanatory variable x j , with p representing the number of explanatory variables.
To model the nonlinear relationship between KNDVI and LST, we employed a cubic spline basis function, given by the following:
S x = j = 1 p β j B j ( x )
where B j ( x ) are the B-spline basis functions, and β j are the associated coefficients. The smoothness of the fitted curve was controlled using the Generalized Cross-Validation (GCV) criterion, ensuring an optimal balance between model complexity and predictive accuracy. Additionally, the optimal GAM model was selected using the Akaike Information Criterion (AIC), minimizing overfitting while preserving explanatory power.

4. Results

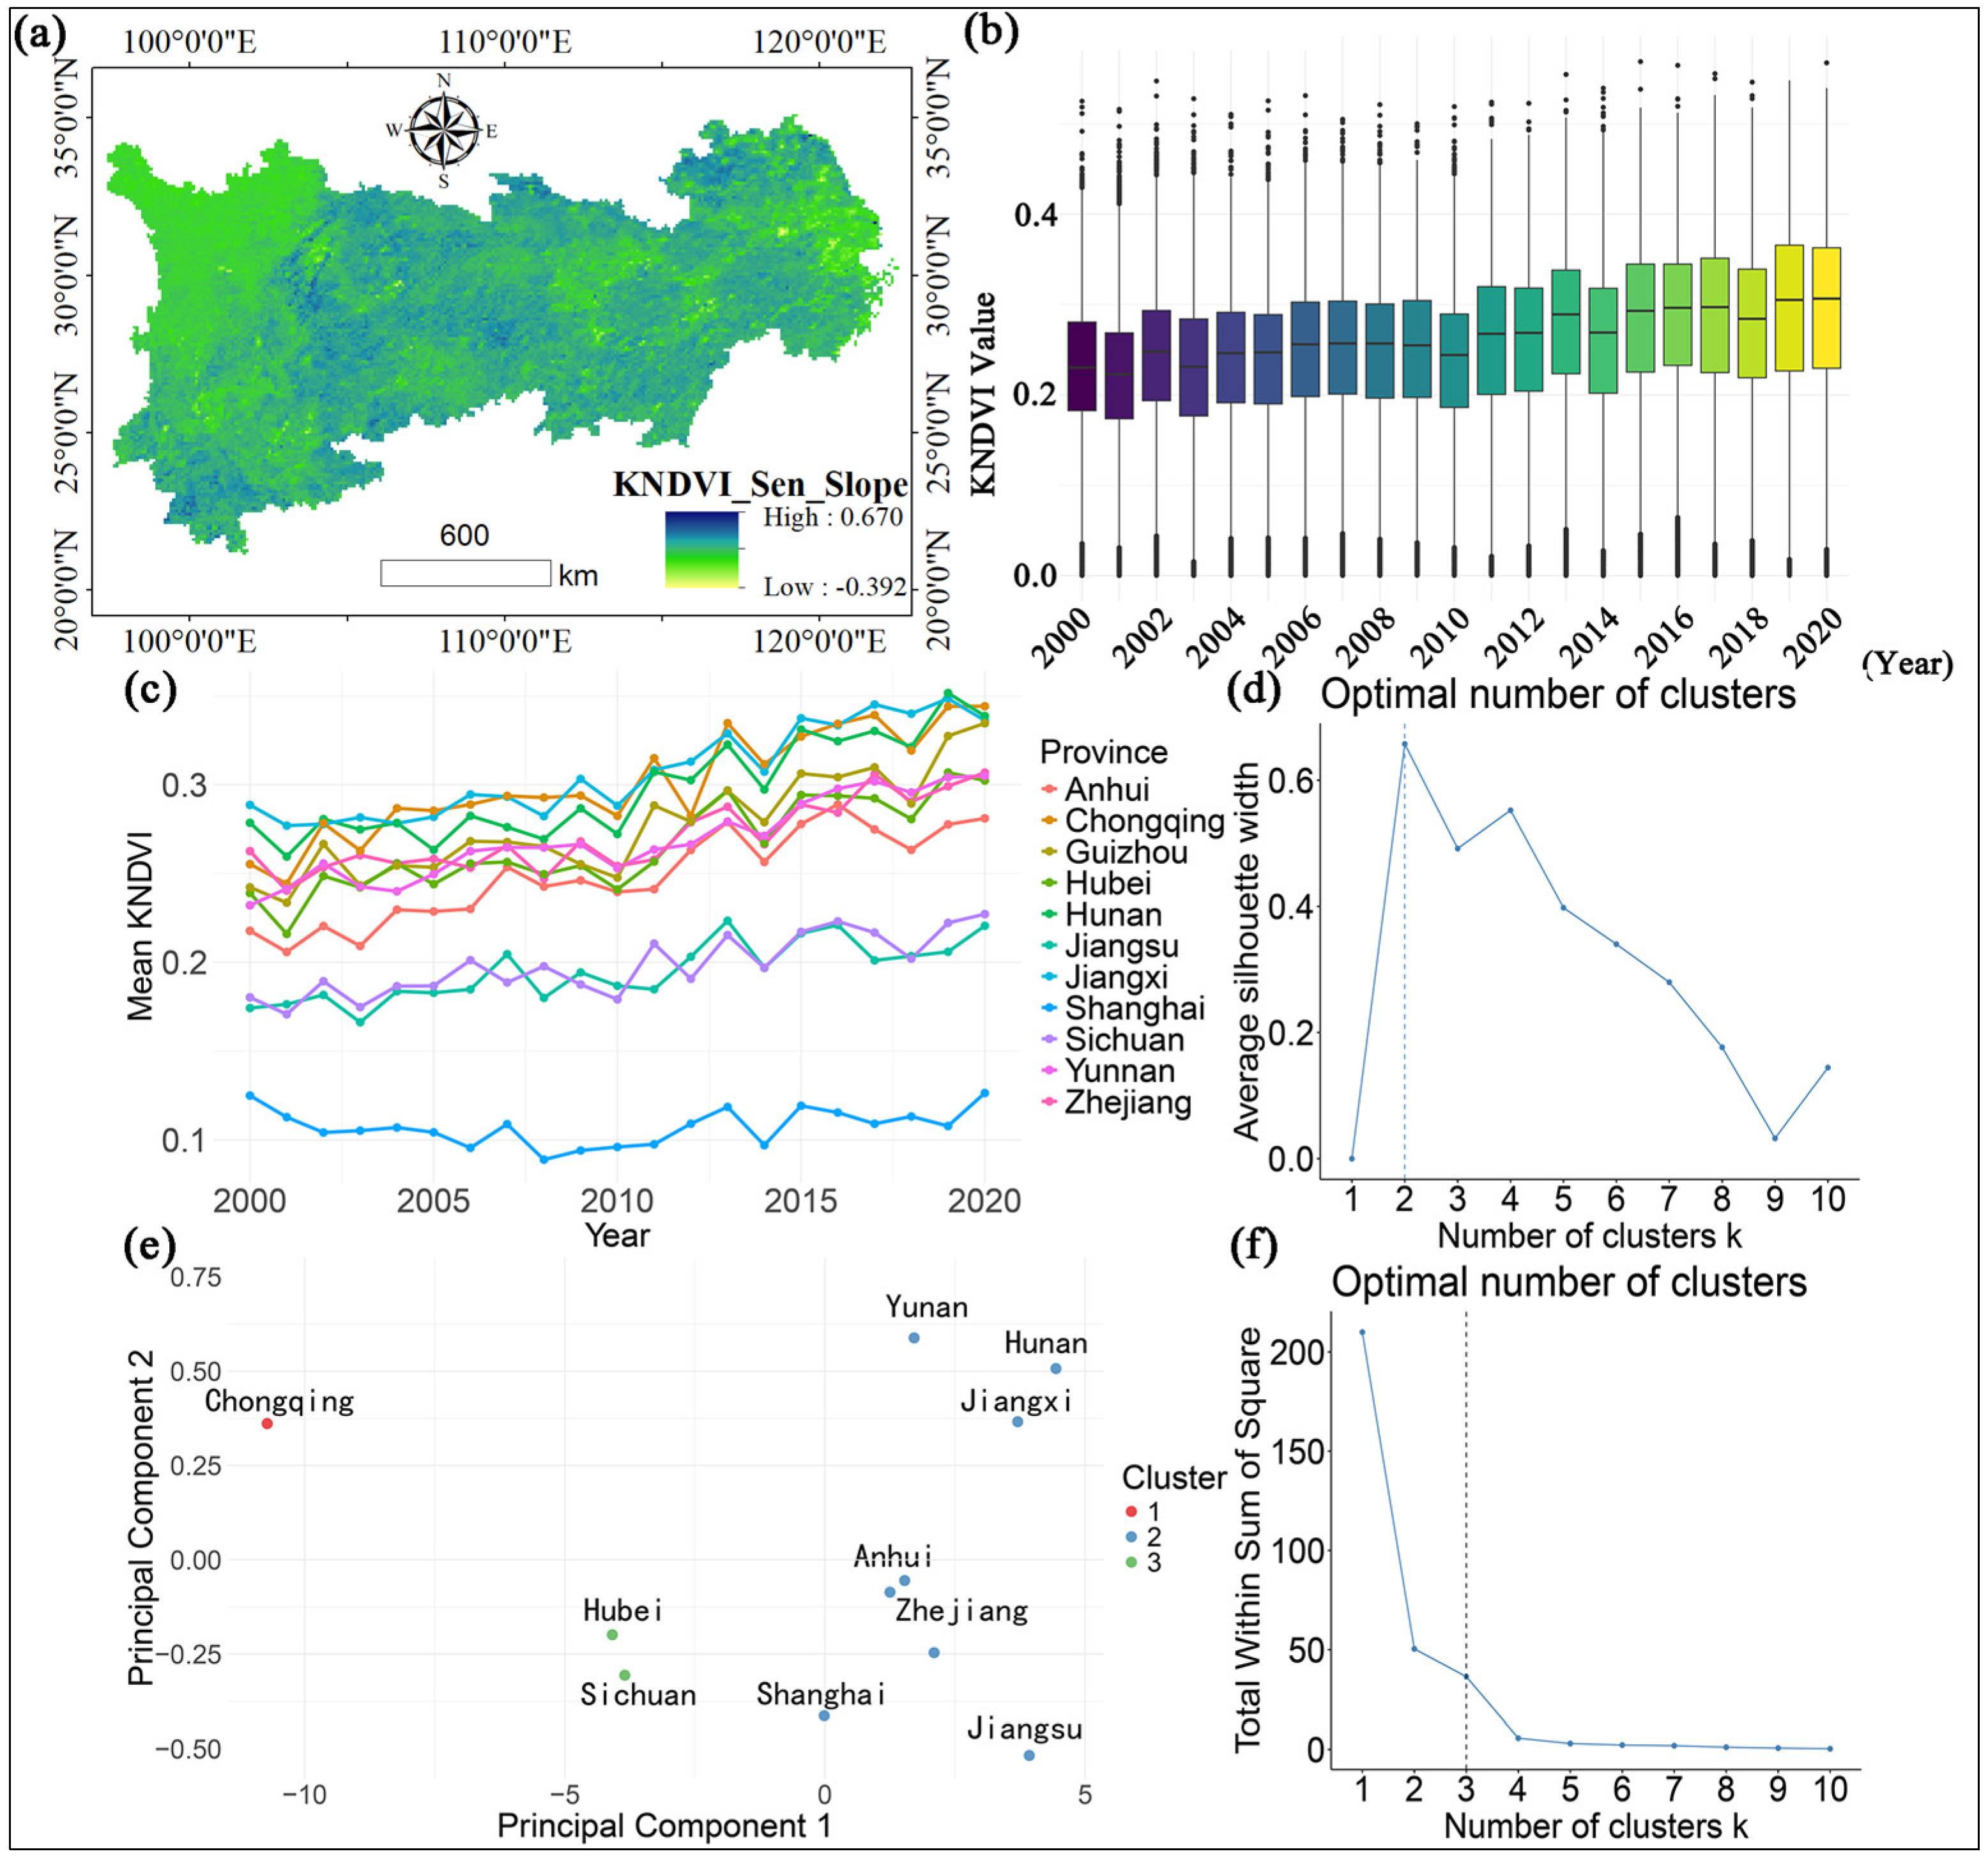
4.1. Analysis of KNDVI Trends over the Years

The spatial distribution of the KNDVI trends (Figure 2a) reveals significant variations in vegetation vitality from 2000 to 2020, assessed using Sen’s slope method. Most areas exhibit a positive trend (green shades), indicating improved vegetation, with the highest growth (0.670) concentrated in the east and southeast. However, some southwestern and central regions show a decline (as low as −0.392), likely due to land-use changes, urbanization, or climate factors. Time series analysis (Figure 2b,c) shows a gradual increase in the mean KNDVI from 0.22 to 0.28, with higher variability in later years. Regionally, Shanghai’s KNDVI remains stable (0.08–0.12), while Yunnan and Chongqing show notable increases, reaching 0.34 and 0.30, respectively. Jiangsu and Sichuan display different growth patterns, with Jiangsu steadily increasing and Sichuan showing moderate growth. Cluster analysis (Figure 2d,e) identifies three optimal clusters, with Shanghai forming a distinct group due to minimal fluctuations. Principal Component Analysis (Figure 2f) supports these findings, highlighting Chongqing’s distinct KNDVI variations, while Jiangsu and Sichuan exhibit more stable trends. Overall, vegetation changes are influenced by climate and land-use dynamics, underscoring the need for targeted ecological management.

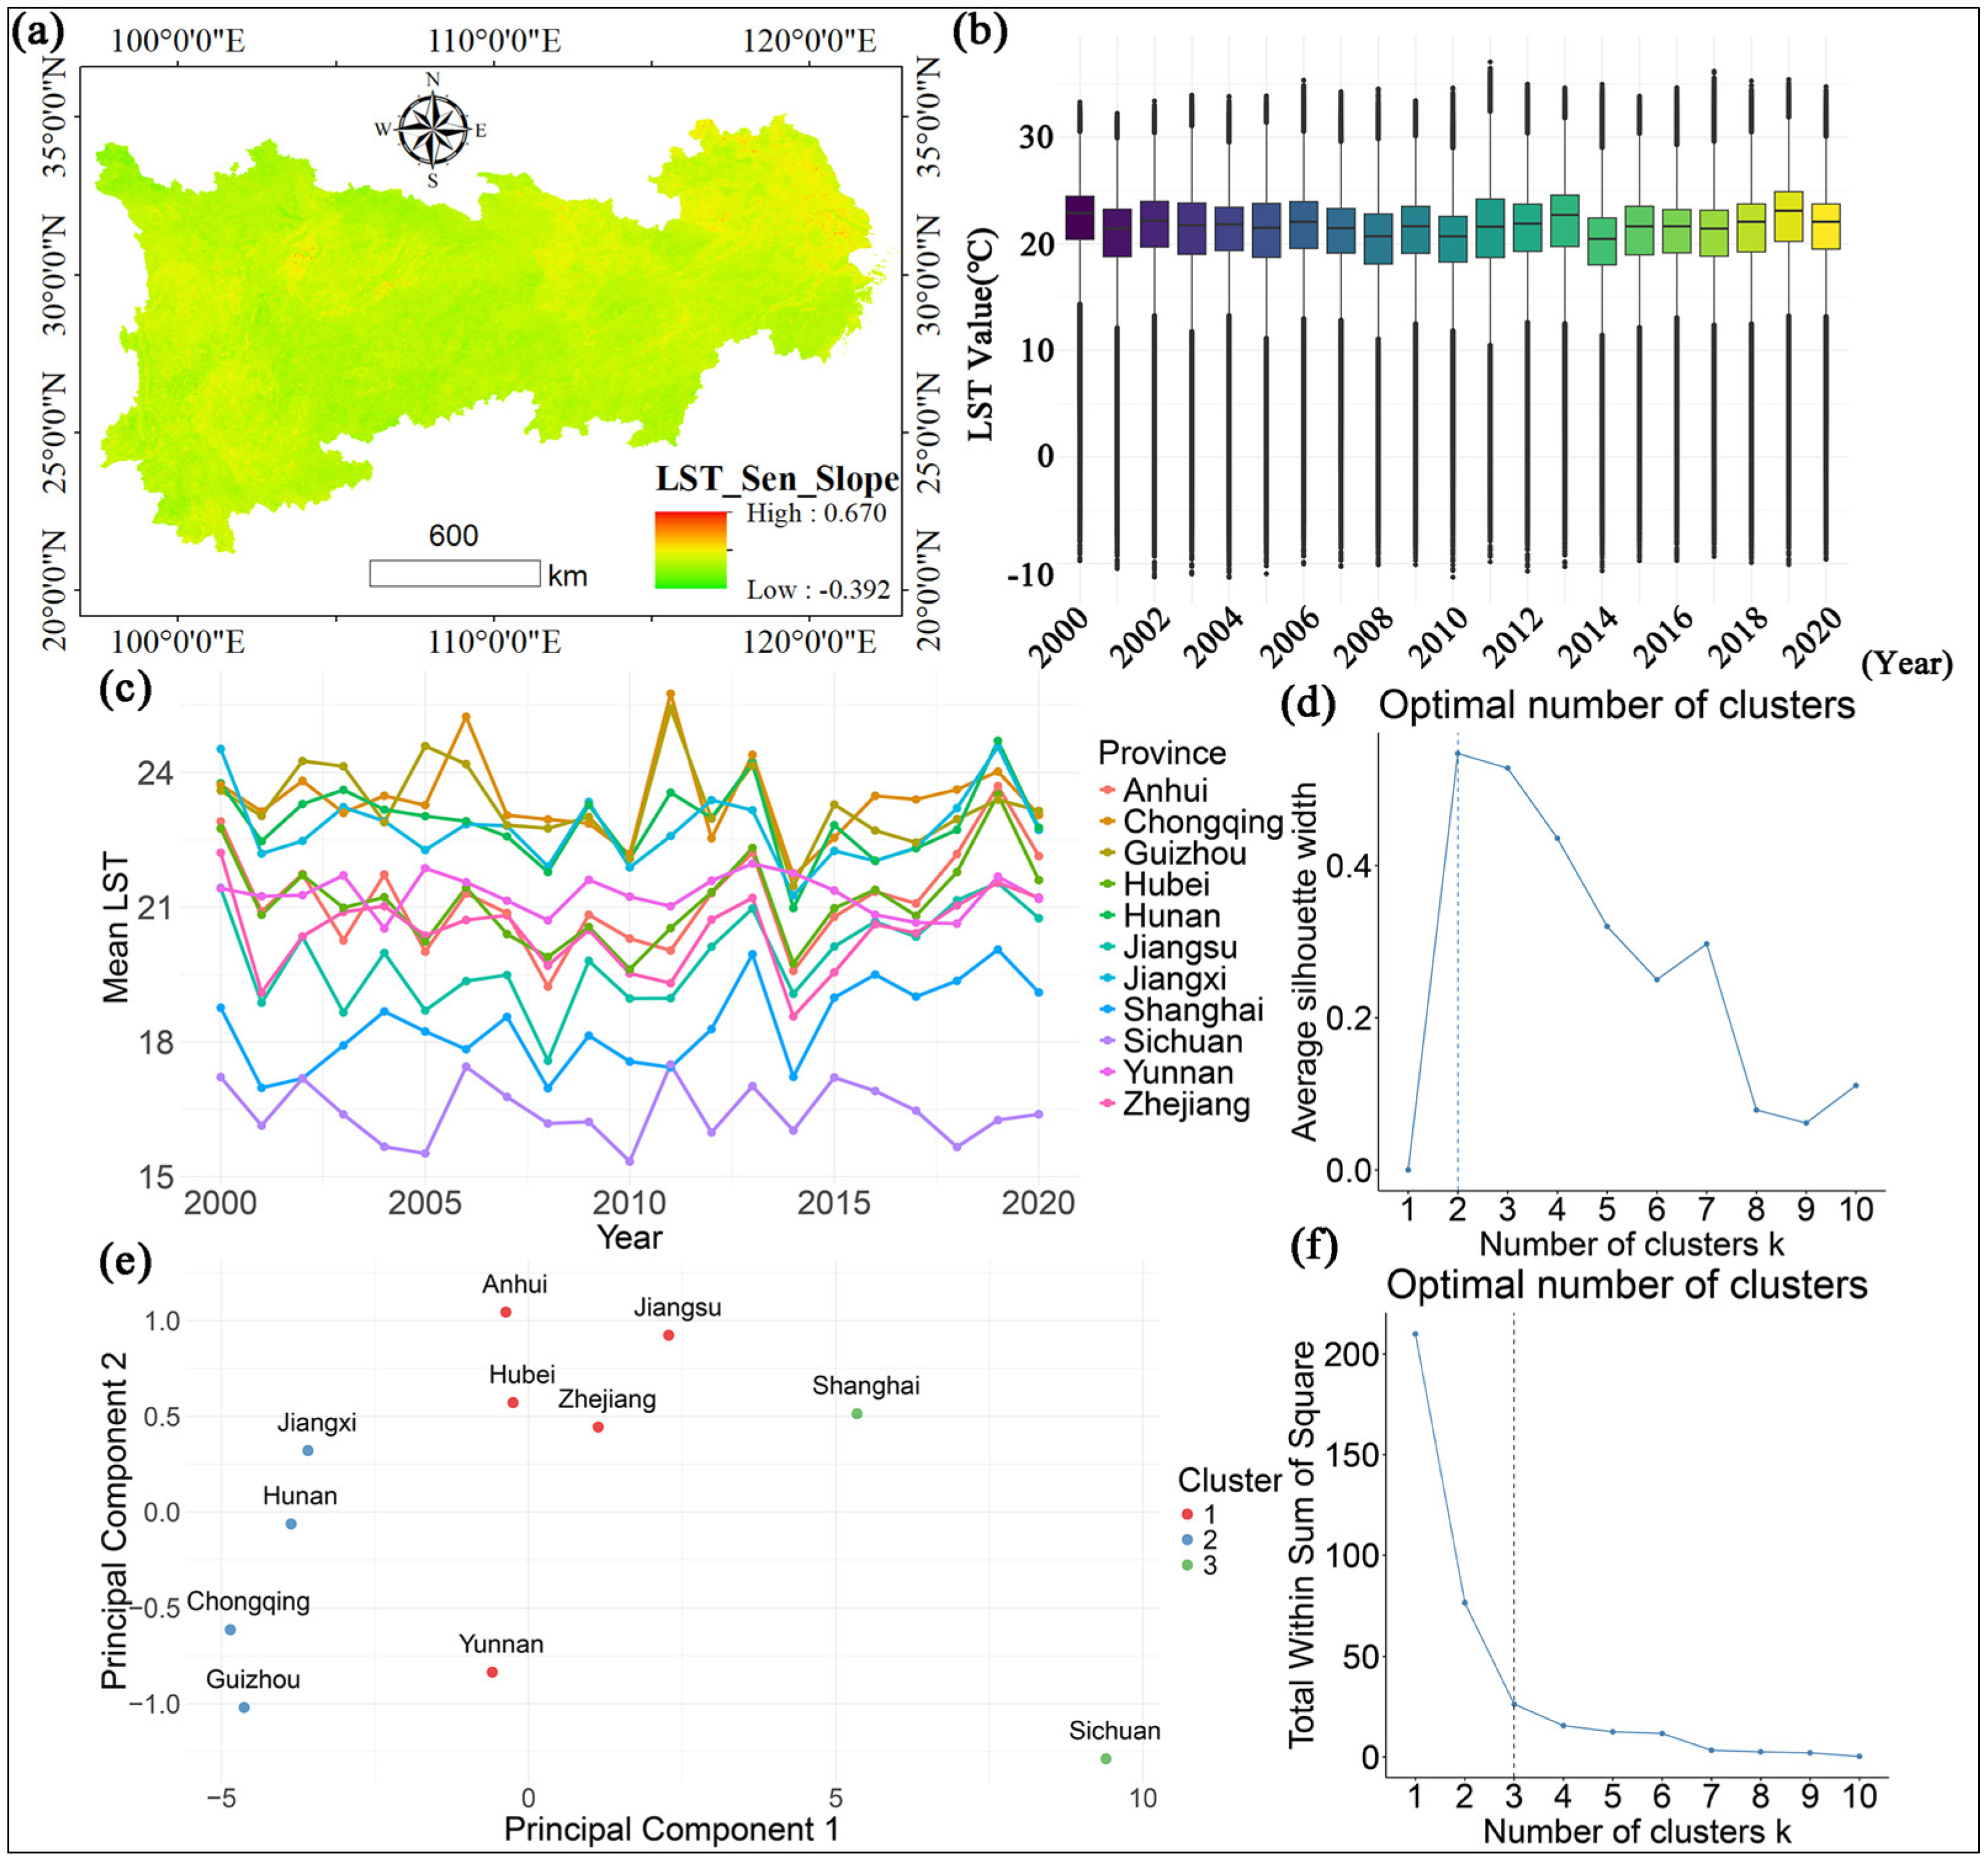
4.2. Analysis of LST Trends over the Years

Figure 3 illustrates the spatiotemporal trends of the land surface temperature (LST) from 2000 to 2020. Figure 3a shows the spatial distribution of LST trends, with central and western regions experiencing significant warming (up to 0.670 °C per year), likely due to urbanization and land-use changes, while southeastern areas show slight cooling (as low as −0.392 °C per year). Figure 3b depicts the interannual variation in LST, revealing an overall upward trend, with mean LST rising from 20.12 °C to 21.43 °C and a notable increase after 2010. Figure 3c highlights regional differences, where Shanghai remains stable (16.98–20.06 °C), Sichuan stays low (15.34 °C), and Anhui and Chongqing show steady warming. The clustering analysis (Figure 3d,f) identifies three groups: Cluster 1 (Anhui, Hubei, Jiangsu, Yunnan, and Zhejiang) with the highest warming, Cluster 2 (Chongqing, Guizhou, Hunan, and Jiangxi) with moderate trends, and Cluster 3 (Shanghai and Sichuan) with distinct variations. PCA (Figure 3e) further confirms Sichuan’s unique warming pattern, while Yunnan, Guizhou, and Chongqing exhibit lower variability. These results suggest that LST changes are driven by climate, urbanization, and land-use patterns, providing insights for climate adaptation strategies.

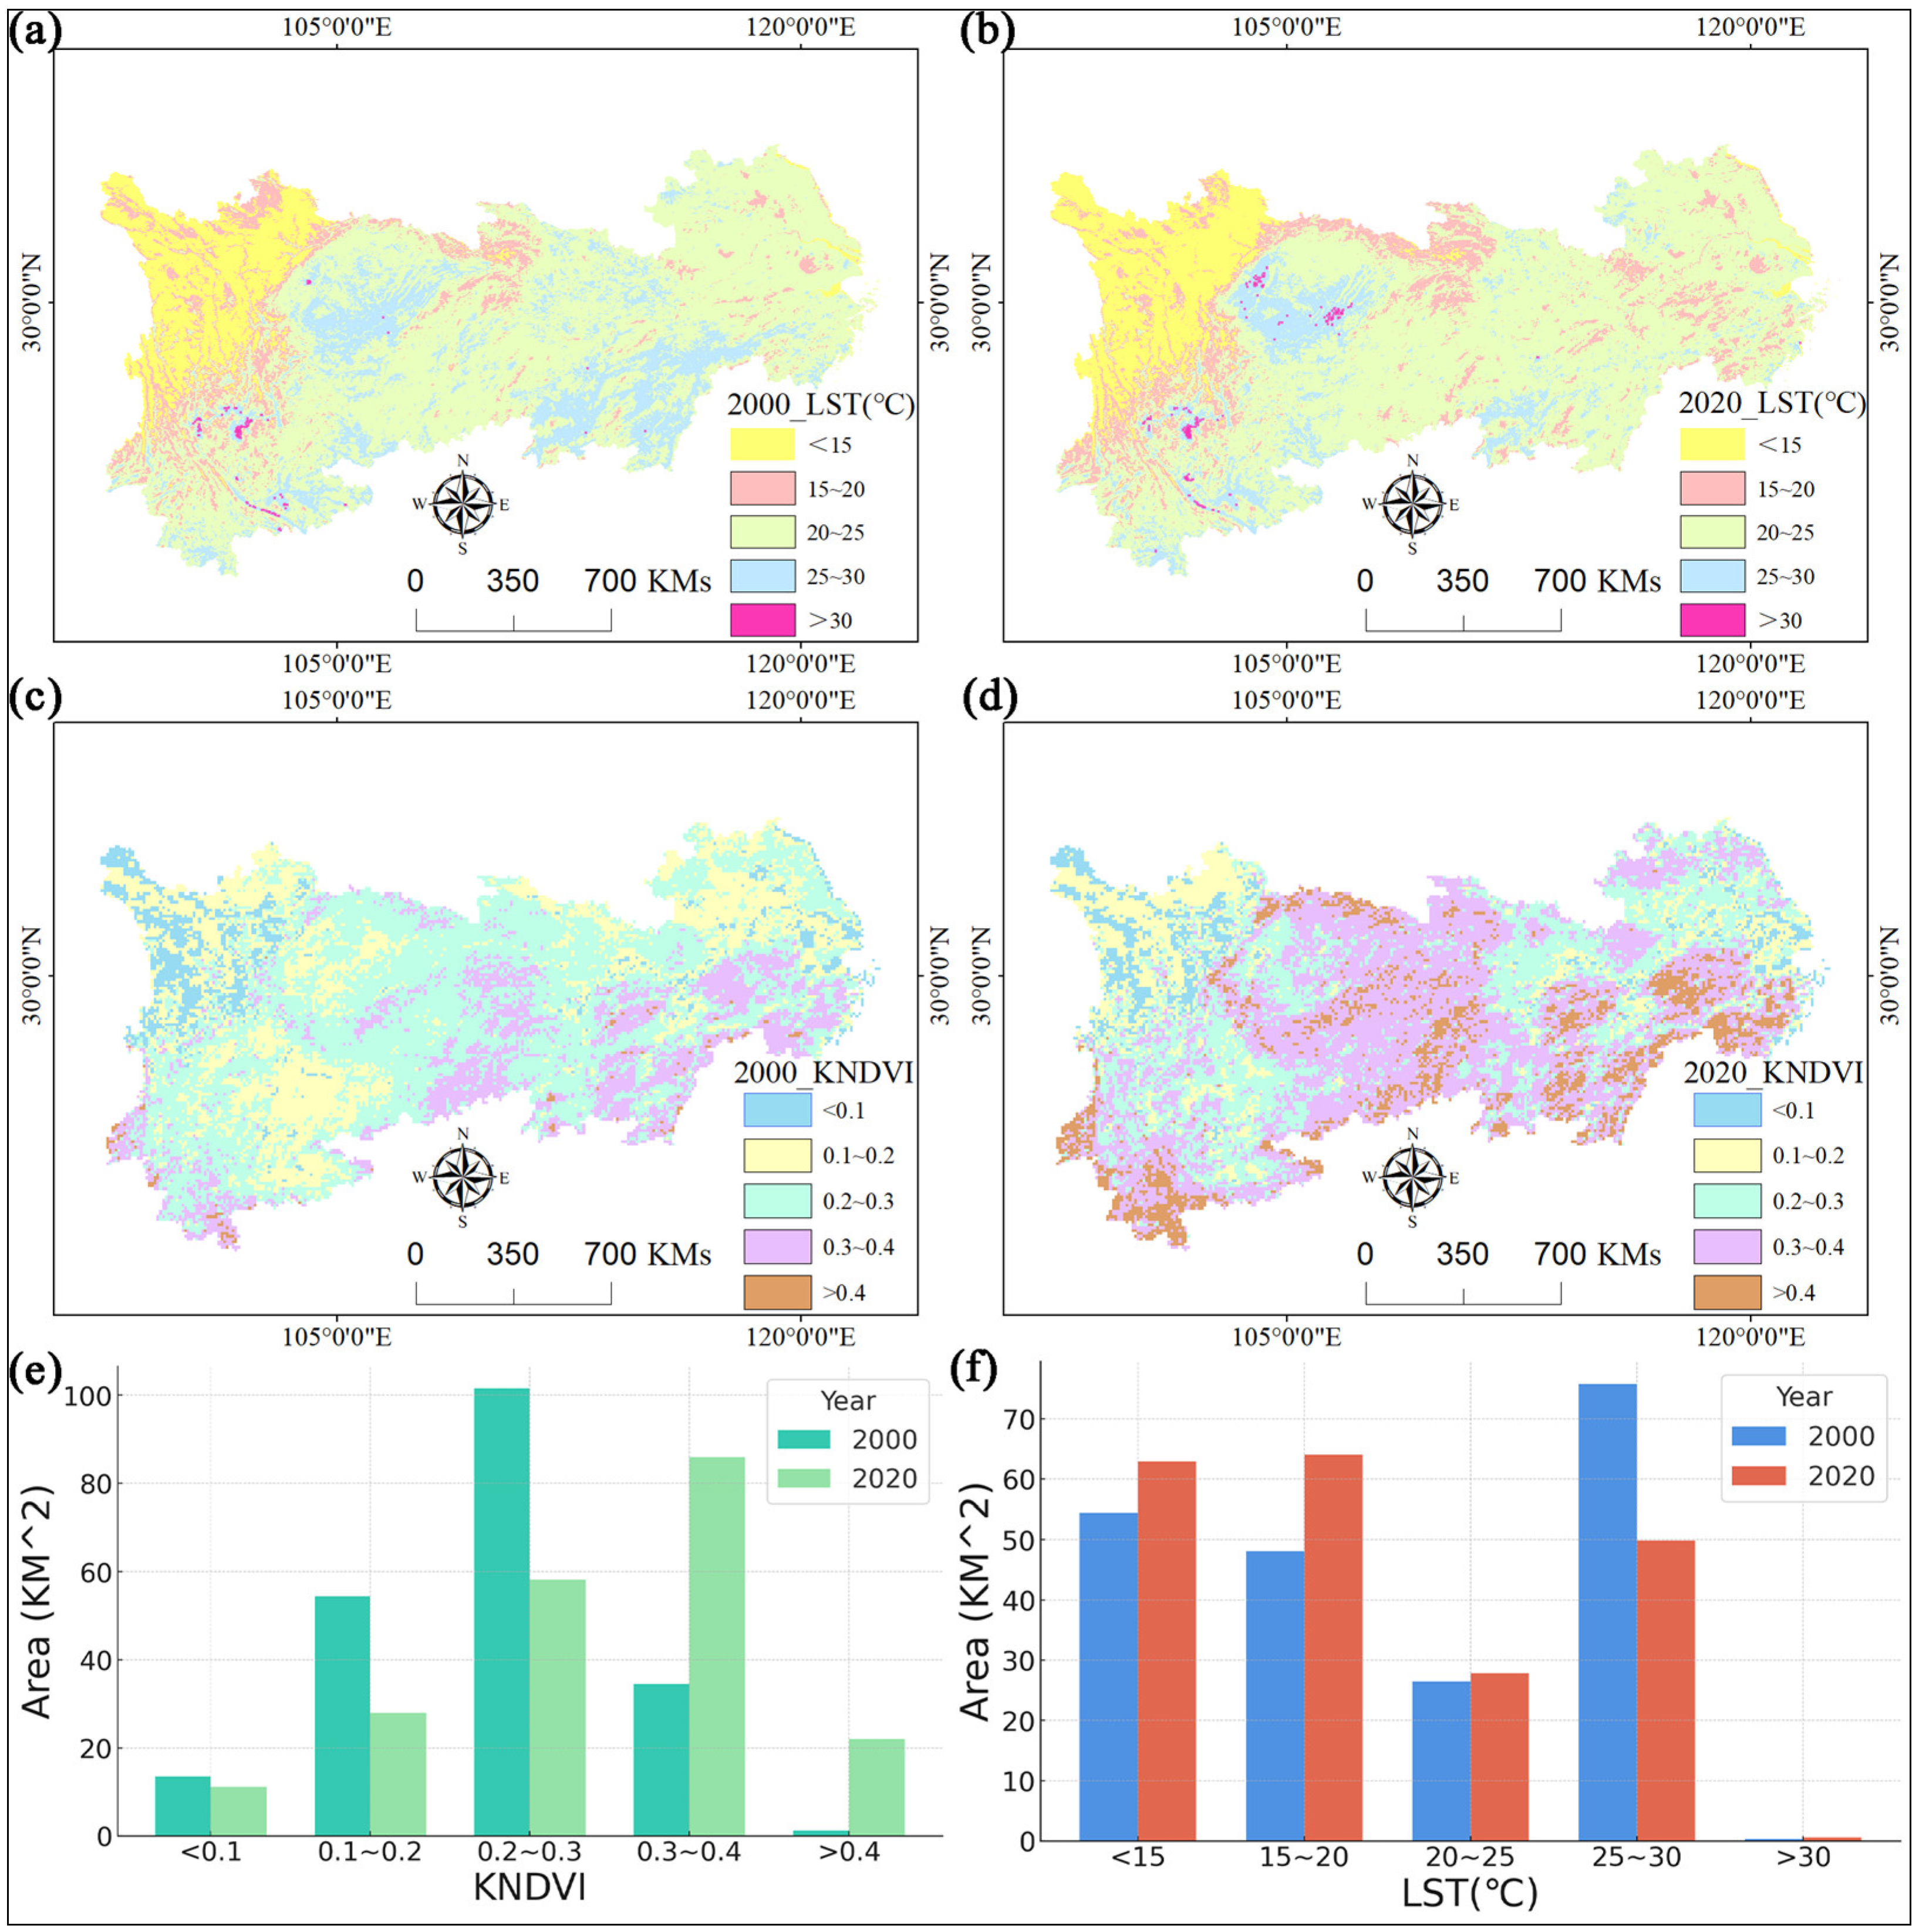
4.3. Analysis of LST Response to KNDVI in 2000 and 2020

From 2000 to 2020, significant spatiotemporal changes occurred in the LST and the KNDVI in the Yangtze River Economic Belt. Figure 4a,b show the spatial distribution of LST in 2000 and 2020, respectively. In 2000, the area with LST < 15 °C was quite large, covering 544,900 km2, but by 2020, this area had increased further to 629,200 km2 (Figure 4f). Meanwhile, the areas with a LST ranging from 15–20 °C and 20–25 °C expanded from 481,300 km2 and 265,000 km2 in 2000 to 640,500 km2 and 278,100 km2 in 2020, respectively, indicating an expansion of the mid-to-low temperature ranges. Although the area of high-temperature regions (LST > 30 °C) also increased by 2020, the absolute area remained relatively small, growing from 3000 km2 in 2000 to 5500 km2 in 2020 (Figure 4f).
Regarding the KNDVI changes, Figure 4c,d reveal that in 2000, the KNDVI was primarily concentrated in the 0.20–0.30 range, covering an area of 1,015,400 km2 (Figure 4e). However, by 2020, this area had decreased to 582,500 km2, while the area with a KNDVI in the 0.30–0.40 range had significantly increased, from 345,000 km2 in 2000 to 858,800 km2 in 2020 (Figure 4e). Additionally, the area with a KNDVI >0.40 expanded substantially, from 11,900 km2 in 2000 to 219,900 km2 in 2020, indicating a significant improvement in vegetation coverage over this period (Figure 4e). Further pixel-level analysis indicated spatial heterogeneity in LST and KNDVI changes. In less urbanized areas, an increase in the KNDVI was generally associated with stable or reduced LST values, while in highly urbanized regions, both the KNDVI and LST showed increasing trends.
In summary, from 2000 to 2020, both vegetation coverage and land surface temperature in the Yangtze River Economic Belt exhibited complex dynamic changes. As temperature ranges shifted, the health and extent of vegetation also changed correspondingly, particularly with a notable expansion in areas with mid-to-high KNDVI values. This highlights the improvement in regional vegetation quality and the complex impacts of climate change on ecosystems.
From 2000 to 2020, significant spatiotemporal changes occurred in the land surface temperature (LST) and Kernel Normalized Difference Vegetation Index (KNDVI) in the Yangtze River Economic Belt. Figure 5a,b illustrate the relationship between LST and the KNDVI distribution across different temperature ranges. In 2000, areas with a LST of 20–25 °C accounted for the largest proportion of land, with KNDVI values primarily concentrated between 0.20 and 0.30, covering 647,000 km2. By 2020, as LST shifted to the 25–30 °C range, the land area with a KNDVI of 0.30–0.40 significantly expanded to 619,000 km2. This suggests a notable improvement in vegetation cover within higher temperature ranges, reflecting the adaptability of vegetation to rising temperatures. However, these changes also highlight the increasing impact of climate change on regional ecosystems, posing new challenges for future ecological management and climate adaptation strategies.

4.4. Analysis of LST Response to KNDVI in Different Provinces

This study analyzed the relationship between land surface temperature (LST) and the standardized vegetation index (KNDVI), revealing significant variations in the regulatory effects of vegetation cover on temperature across different provinces (Figure 6). In Sichuan (R2 = 0.423, p < 0.001), Hunan (R2 = 0.331, p < 0.001), and Anhui (R2 = 0.192, p < 0.001), the relationship between the KNDVI and LST was particularly strong, indicating that vegetation cover in these regions plays a significant role in regulating surface temperature, effectively reducing LST or mitigating its increasing trend. Additionally, Hubei (R2 = 0.283, p < 0.001) and Yunnan (R2 = 0.25, p < 0.001) also demonstrated relatively high explanatory power, further supporting the crucial role of vegetation in temperature regulation. However, in some provinces, the relationship between LST and the KNDVI exhibited nonlinear characteristics. For example, in Hunan, LST initially increased with the KNDVI when the KNDVI was below 0.25, but beyond this threshold, the trend became uncertain or even reversed. Meanwhile, Yunnan exhibited a U-shaped LST–KNDVI relationship, suggesting that the cooling effect of vegetation varies across different levels of vegetation cover. Additionally, despite being geographically adjacent, Sichuan and Chongqing displayed distinct LST responses to the KNDVI, indicating that regional factors such as topography, climate, and urbanization processes may significantly influence the cooling capacity of vegetation. In highly urbanized areas, such as Chongqing (R2 = 0.063, p = 0.0287) and Jiangsu (R2 = 0.127, p < 0.001), although the LST–KNDVI relationship was statistically significant, the explanatory power was relatively low, suggesting that LST is more influenced by factors such as urban expansion, increased impervious surfaces, and industrial emissions. However, in Shanghai, a highly urbanized city (R2 = 0.295, p = 3.32 × 10⁻⁶), vegetation still exhibited a noticeable regulatory effect on LST, emphasizing that even in urban environments, green spaces remain critical for temperature regulation. Overall, this study highlights that vegetation cover plays a significant role in regulating LST in most provinces, particularly in regions with effective ecological protection, whereas highly urbanized areas are subject to additional influencing factors. Furthermore, the spatial heterogeneity of the LST–KNDVI relationship across different regions, along with the observed nonlinear patterns, suggests that future research should incorporate finer-scale land-use data to better understand the environmental determinants of this relationship, providing insights for ecological management and urban planning.

5. Discussion

5.1. Interaction Between Vegetation Cover and Land Surface Temperature

The link between the KNDVI and LST reflects fundamental vegetation cooling processes, where increased vegetation enhances transpiration and shading, reducing surface temperatures [58,59]. However, this cooling effect varies across landscapes, being stronger in vegetation-rich areas while weakening in highly urbanized zones [60,61]. Our analysis of KNDVI and LST trends from 2000 to 2020 across the Yangtze River Economic Belt reveals complex interactions between vegetation cover and land surface temperature. During the past two decades, LST has significantly increased, particularly in Chongqing and Jiangsu, where high-temperature zones (LST > 30 °C) expanded from 3000 km2 in 2000 to 5500 km2 in 2020, highlighting the substantial impact of urbanization and land-use change. Interestingly, a nonlinear relationship between LST and the KNDVI was observed in some provinces, particularly Hunan, where LST initially rises with the KNDVI up to a threshold (~0.331) before reversing and decreasing as vegetation cover further increases. This threshold aligns with studies conducted in similar climate regions, such as the North China Plain (KNDVI ≈ 0.35) and temperate forests in North America (KNDVI ≈ 0.3), suggesting that in humid subtropical zones a KNDVI range of approximately 0.3–0.35 may mark the turning point where vegetation cooling effects become dominant [62,63]. However, in arid and semi-arid regions, such as the Sahel and western China, the cooling effect is observed at lower KNDVI values (~0.25) due to lower biomass density and evapotranspiration potential [64,65]. These findings highlight the complexity of LST–KNDVI dynamics, where regional climate conditions and land-use patterns shape their interactions. Moreover, changes in vegetation cover also reflect LST influences. For instance, the area of low-KNDVI regions (<0.1) has decreased from 135,400 km2 in 2000 to 111,200 km2 in 2020, suggesting that, despite overall warming trends, vegetation vitality has improved in certain regions, possibly due to reforestation policies and ecological restoration projects.

5.2. Impact of Urbanization on Ecosystems

Urbanization has intensified LST increases, particularly in the 25–30 °C range, where the area with a KNDVI between 0.30 and 0.40 expanded from 345,000 km2 in 2000 to 858,800 km2 in 2020, indicating the vegetation’s adaptation to rising temperatures [22,36,61]. However, urbanization-driven land-use changes have significantly altered the LST–KNDVI relationship, as increasing vegetation cover in some urban areas has not effectively mitigated rising temperatures. For example, Shanghai, one of the most urbanized cities in China with an urbanization rate exceeding 90%, has experienced rapid population growth from 16.4 million in 2000 to 24.9 million in 2020 [66]. Simultaneously, the impervious surface area in Shanghai expanded by 48.2% between 2000 and 2020, reaching approximately 5800 km2. Despite the increasing urban density, green spaces and urban parks have played a crucial role in mitigating urban heat island (UHI) effects, as reflected in the fact that Shanghai’s LST increase was relatively moderate compared to cities like Chongqing and Nanjing [67]. This finding underscores the importance of urban green infrastructure, aligning with previous studies demonstrating vegetation’s role in reducing urban heat stress [38,39,68]. However, the effectiveness of urban greening varies across regions. In contrast to Shanghai, Chongqing and Jiangsu experienced significant LST increases despite notable KNDVI growth. In Chongqing, the impervious surface area expanded from 1900 km2 in 2000 to 3400 km2 in 2020, reducing vegetation cooling efficiency. Similarly, in Jiangsu, extensive urban sprawl and industrial expansion have contributed to a 37% increase in high-temperature zones (LST > 30 °C) over two decades. These findings highlight that while urban vegetation can alleviate heat stress, its effectiveness is contingent upon spatial distribution, land-use planning, and urban density [69,70]. From a policy perspective, cities like Shanghai have implemented progressive urban greening policies, such as the “Shanghai Ecological Network Plan” and vertical greening initiatives, which integrate vegetation into high-density areas. In contrast, cities like Chongqing and Nanjing have primarily focused on large-scale afforestation projects, which, while beneficial, may not be as effective in mitigating localized urban heat islands [71]. This suggests that tailored urban planning strategies, integrating green roofs, permeable surfaces, and strategic tree planting, are essential for optimizing vegetation cooling effects in different urban contexts [72,73,74].

5.3. Regional Differences and Ecological Responses to Climate Change

KNDVI–LST relationships exhibit clear regional variations. In vegetation-rich areas, like Sichuan, Hunan, and Anhui, a negative correlation is evident, meaning vegetation effectively mitigates temperature increases. However, in highly urbanized areas like Chongqing and Jiangsu, despite a rising KNDVI, LST continues to increase significantly, suggesting that urban expansion may weaken vegetation’s cooling effect. This highlights the importance of region-specific ecological planning, particularly in fast-growing urban centers [62,75]. Nevertheless, this study is limited by the spatial resolution of MODIS data, which may not fully capture fine-scale variations in urban vegetation and microclimate effects [16,22,63]. Future research should integrate higher-resolution satellite imagery (e.g., Sentinel-2 and LiDAR) and seasonal analyses of the KNDVI and LST to improve the understanding of vegetation’s thermal regulation across diverse landscapes, particularly in complex urban environments where land-use heterogeneity plays a crucial role [64,65,76].

5.4. Response of LST and KNDVI to Climate Change

The interactions between LST, KNDVI, and climate change are key to understanding ecosystem resilience [77]. Our findings indicate that rising temperatures have expanded high-temperature zones, altering vegetation dynamics across the Yangtze River Economic Belt. In regions with high vegetation cover, an increased KNDVI suggests adaptation, possibly driven by favorable climatic conditions such as rainfall and soil nutrients. However, in urbanized regions, climate change exacerbates the urban heat island effect, reducing vegetation’s cooling capacity [78,79]. Moreover, the nonlinear responses observed in certain regions (e.g., Hunan Province) suggest that beyond certain thresholds, vegetation’s regulatory effect on LST weakens or even reverses, reflecting long-term climate adaptation challenges. These findings underscore the necessity of proactive climate adaptation measures, particularly in rapidly urbanizing and climate-sensitive areas [80]. Policies integrating urban greening with climate resilience strategies—such as increasing permeable surfaces, implementing large-scale tree-planting projects, and designing climate-adaptive urban planning—are essential for mitigating LST rise and maintaining ecological stability [67,81,82].

5.5. Limitations and Future Research Directions

Despite its significant findings, this study has several limitations: (1) Spatial and Temporal Resolution Constraints: The MODIS data (1 km resolution) may not fully capture urban microclimate variations. Future studies should integrate higher-resolution data (e.g., Sentinel-2 and Landsat) and ground-based measurements to improve accuracy. (2) Limited Consideration of Other Influencing Factors: LST is affected by multiple factors beyond KNDVI, including land-use types, anthropogenic heat, and impervious surfaces. Incorporating socioeconomic and physical environmental datasets (e.g., population density and road networks) could enhance the explanatory power. (3) Uncertainty in Nonlinear Modeling: Although the GAM model effectively captures nonlinear relationships, its model-dependent smoothing effects introduce uncertainties. Future research should explore alternative statistical models or deep learning approaches to achieve more robust results. (4) Lack of Policy Impact Assessment: While urban greening strategies are discussed, their actual cooling effects require empirical validation. Future studies should evaluate the effectiveness of specific policies over time using real-world impact data. To address these limitations, future research should combine higher-resolution data, a broader range of variables, improved validation methods, and thorough policy assessments for a more comprehensive understanding of LST–KNDVI interactions.

6. Conclusions

In this study, we used the GAM model, combined with the K-Means cluster analysis and PCA analysis to explore the response of LST to the KNDVI in the Yangtze River Economic Belt between 2000 and 2020, revealing the complex relationship between vegetation cover and land surface temperature. The following conclusions can be drawn: (1) KNDVI values in the southwest and central regions of the Yangtze River Economic Belt declined significantly, with the declining area accounting for 6.6% of the total land area, which indicated that the vegetation vigor in these regions was significantly weakened. However, the KNDVI values of most regions showed an increasing trend, covering 89.42% of the land, indicating that the vegetation condition of the region as a whole showed a good improving trend, and only 3.98% of the region did not undergo a significant change. (2) The areas with an increasing LST (60.8%) are mainly distributed in the western and central regions, while the areas with a decreasing LST (39.2%) are mainly concentrated in the southeastern part and some sporadic areas. From the inter-annual trend of the LST in the region during the period from 2000 to 2020 it can be seen that the LST shows an increasing trend in general, especially after 2010, with a more significant increase. (3) The LST in high-temperature regions (>30 °C) expanded significantly, especially in the western and central regions, where the trend of increasing temperature is particularly prominent. At the same time, the vegetation cover in these regions also changed significantly. In 2000, the KNDVI was mainly concentrated in the region with a LST of 20–25 °C, with the largest area with a KNDVI of 0.20–0.30. The area with a KNDVI of 0.20–0.30 was the highest. However, by 2020, the area of the region with a KNDVI of 0.30–0.40 expanded significantly as the LST increased in the 25–30 °C interval. (4) The strength of the correlation between the KNDVI and LST varies across regions, and this relationship is significant in most provinces. The relationship between LST and the KNDVI was particularly strong in the Sichuan, Hunan, and Anhui provinces, where the model explained 43%, 34.3%, and 22.2% of the variability, respectively.

Author Contributions

Conceptualization, methodology, investigation, writing—original draft, H.Z.; investigation, data curation, C.H. and P.W.; formal analysis, investigation, resources, data curation, writing—original draft preparation, writing—review and editing, A.W. and M.Z.; supervision, project administration, M.Z. All authors have read and agreed to the published version of the manuscript.

Funding

This research received no external funding.

Data Availability Statement

The original contributions presented in this study are included in the article; further inquiries can be directed to the corresponding author.

Conflicts of Interest

The authors declare no conflicts of interest.

References

  1. Fu, Y.; Tan, X.; Yao, Y.; Wang, L.; Shan, Y.; Yang, Y.; Jing, Z. Uncovering Optimal Vegetation Indices for Estimating Wetland Plant Species Diversity. Ecol. Indic. 2024, 166, 112367. [Google Scholar] [CrossRef]
  2. Wang, A.; Zhang, M.; Chen, E.; Zhang, C.; Han, Y. Impact of Seasonal Global Land Surface Temperature (LST) Change on Gross Primary Production (GPP) in the Early 21st Century. Sustain. Cities Soc. 2024, 110, 105572. [Google Scholar] [CrossRef]
  3. Luo, M.; Jia, X.; Zhao, Y.; Ye, X.; Ren, K.; Mu, Q.; Kang, S.; Wang, H.; Li, J. Spatial Variations of the Relationships between Bacterial Diversity and Forest Ecosystem Multifunctionality in the Qinling Mountains, China. Appl. Soil Ecol. 2024, 203, 105638. [Google Scholar] [CrossRef]
  4. Wang, X.; Biederman, J.A.; Knowles, J.F.; Scott, R.L.; Turner, A.J.; Dannenberg, M.P.; Köhler, P.; Frankenberg, C.; Litvak, M.E.; Flerchinger, G.N.; et al. Satellite Solar-Induced Chlorophyll Fluorescence and near-Infrared Reflectance Capture Complementary Aspects of Dryland Vegetation Productivity Dynamics. Remote Sens. Environ. 2022, 270, 112858. [Google Scholar] [CrossRef]
  5. Zheng, Z.; Schmid, B.; Zeng, Y.; Schuman, M.C.; Zhao, D.; Schaepman, M.E.; Morsdorf, F. Remotely Sensed Functional Diversity and Its Association with Productivity in a Subtropical Forest. Remote Sens. Environ. 2023, 290, 113530. [Google Scholar] [CrossRef]
  6. Ming, L.; Wang, Y.; Liu, G.; Meng, L.; Chen, X. Analysis of Vegetation Dynamics from 2001 to 2020 in China’s Ganzhou Rare Earth Mining Area Using Time Series Remote Sensing and SHAP-Enhanced Machine Learning. Ecol. Inform. 2024, 84, 102887. [Google Scholar] [CrossRef]
  7. Zhang, H.; Ma, C.; Liu, P. Dynamic Evaluation of the Ecological Evolution and Quality of Arid and Semi-Arid Deserts in the Aibugai River Basin Based on an Improved Remote Sensing Ecological Index. Ecol. Inform. 2024, 82, 102727. [Google Scholar] [CrossRef]
  8. Wang, Q.; Moreno-Martínez, Á.; Muñoz-Marí, J.; Campos-Taberner, M.; Camps-Valls, G. Estimation of Vegetation Traits with Kernel NDVI. ISPRS J. Photogramm. Remote Sens. 2023, 195, 408–417. [Google Scholar] [CrossRef]
  9. Zhang, G.; Zhang, S.; Wang, H.; Yew Gan, T.; Su, X.; Wu, H.; Shi, L.; Xu, P.; Fu, X. Evaluating Vegetation Vulnerability under Compound Dry and Hot Conditions Using Vine Copula across Global Lands. J. Hydrol. 2024, 631, 130775. [Google Scholar] [CrossRef]
  10. Liang, S.; Xu, D.; Luo, D.; Xiao, A.; Yuan, X. Study on the Impact of Land Use and Climate Change on the Spatiotemporal Evolution of Vegetation Cover in Chongqing, China. Atmosphere 2025, 16, 25. [Google Scholar] [CrossRef]
  11. Dias, T.C.; Silveira, L.F.; Pironkova, Z.I.; Francisco, M.R. Greening and Browning Trends in a Tropical Forest Hotspot: Accounting for Fragment Size and Vegetation Indices. Remote Sens. Appl. Soc. Environ. 2022, 26, 100751. [Google Scholar] [CrossRef]
  12. Yang, Z.; Huang, Y.; Duan, Z.; Tang, J. Capturing the Spatiotemporal Variations in the Gross Primary Productivity in Coastal Wetlands by Integrating Eddy Covariance, Landsat, and MODIS Satellite Data: A Case Study in the Yangtze Estuary, China. Ecol. Indic. 2023, 149, 110154. [Google Scholar] [CrossRef]
  13. Zhang, T.; Lin, Z.; Wang, L.; Zhang, W.; Zhang, Y.; Hu, Y. The Heterogeneous Effects of Microscale-Built Environments on Land Surface Temperature Based on Machine Learning and Street View Images. Atmosphere 2024, 15, 549. [Google Scholar] [CrossRef]
  14. Liu, Q.; Qiao, J.; Li, M.; Dun, Y.; Zhu, X.; Ji, X. Spatiotemporal Evolution of Ecological Environmental Quality and Its Dynamic Relationships with Landscape Pattern in the Zhengzhou Metropolitan Area: A Perspective Based on Nonlinear Effects and Spatiotemporal Heterogeneity. J. Clean. Prod. 2024, 480, 144102. [Google Scholar] [CrossRef]
  15. Ding, Y.; Zhang, L.; He, Y.; Cao, S.; Gusev, A.; Guo, Y.; Ran, L.; Wei, X.; Mikalai, F. Nonlinear Effects of Agricultural Drought on Vegetation Productivity in the Yellow River Basin, China. Sci. Total Environ. 2024, 948, 174903. [Google Scholar] [CrossRef]
  16. Fu, D.; Jin, X.; Jin, Y.; Mao, X. Extraction of Grassland Irrigation Information in Arid Regions Based on Multi-Source Remote Sensing Data. Agric. Water Manag. 2024, 302, 109010. [Google Scholar] [CrossRef]
  17. Zhang, X.; Jia, W.; Lu, S.; He, J. Ecological Assessment and Driver Analysis of High Vegetation Cover Areas Based on New Remote Sensing Index. Ecol. Inform. 2024, 82, 102786. [Google Scholar] [CrossRef]
  18. Patel, S.; Indraganti, M.; Jawarneh, R.N. A Comprehensive Systematic Review: Impact of Land Use/Land Cover (LULC) on Land Surface Temperatures (LST) and Outdoor Thermal Comfort. Build. Environ. 2024, 249, 111130. [Google Scholar] [CrossRef]
  19. Martinelli, L.; Matzarakis, A. Influence of height/width proportions on the thermal comfort of courtyard typology for Italian climate zones. Sustain. Cities Soc. 2017, 29, 97–106. [Google Scholar] [CrossRef]
  20. Cui, P.; Xv, D.; Tang, J.; Lu, J.; Wu, Y. Assessing the Effects of Urban Green Spaces Metrics and Spatial Structure on LST and Carbon Sinks in Harbin, a Cold Region City in China. Sustain. Cities Soc. 2024, 113, 105659. [Google Scholar] [CrossRef]
  21. Tanoori, G.; Soltani, A.; Modiri, A. Machine Learning for Urban Heat Island (UHI) Analysis: Predicting Land Surface Temperature (LST) in Urban Environments. Urban Clim. 2024, 55, 101962. [Google Scholar] [CrossRef]
  22. Zhang, M.; Tan, S.; Zhang, C.; Chen, E. Machine Learning in Modelling the Urban Thermal Field Variance Index and Assessing the Impacts of Urban Land Expansion on Seasonal Thermal Environment. Sustain. Cities Soc. 2024, 106, 105345. [Google Scholar] [CrossRef]
  23. Xiang, Y.; Ye, Y.; Peng, C.; Teng, M.; Zhou, Z. Seasonal Variations for Combined Effects of Landscape Metrics on Land Surface Temperature (LST) and Aerosol Optical Depth (AOD). Ecol. Indic. 2022, 138, 108810. [Google Scholar] [CrossRef]
  24. Lin, X.; Chen, J.; Wu, T.; Yi, S.; Chen, J.; Han, X. Time-Series Simulation of Alpine Grassland Cover Using Transferable Stacking Deep Learning and Multisource Remote Sensing Data in the Google Earth Engine. Int. J. Appl. Earth Obs. Geoinf. 2024, 131, 103964. [Google Scholar] [CrossRef]
  25. Nuñez, Y.; Hoyos, N.; Arellana, J. High Land Surface Temperatures (LSTs) Disproportionately Affect Vulnerable Socioeconomic Groups in Barranquilla, Colombia. Urban Clim. 2023, 52, 101757. [Google Scholar] [CrossRef]
  26. Mandal, B.; Goswami, K.P. Evaluating the Influence of Biophysical Factors in Explaining Spatial Heterogeneity of LST: Insights from Brahmani-Dwarka Interfluve Leveraging Geodetector, GWR, and MGWR Models. Phys. Chem. Earth Parts ABC 2025, 138, 103836. [Google Scholar] [CrossRef]
  27. Kanjin, K.; Alam, B.M. Assessing Changes in Land Cover, NDVI, and LST in the Sundarbans Mangrove Forest in Bangladesh and India: A GIS and Remote Sensing Approach. Remote Sens. Appl. Soc. Environ. 2024, 36, 101289. [Google Scholar] [CrossRef]
  28. Yao, X.; Zeng, X.; Zhu, Z.; Lan, Y.; Shen, Y.; Liu, Q.; Yang, F. Exploring the Diurnal Variations of the Driving Factors Affecting Block-Based LST in a “Furnace City” Using ECOSTRESS Thermal Imaging. Sustain. Cities Soc. 2023, 98, 104841. [Google Scholar] [CrossRef]
  29. Moradi Fard, M.; Thonet, T.; Gaussier, E. Deep k-Means: Jointly clustering with k-Means and learning representations. Pattern Recognit. Lett. 2020, 138, 185–192. [Google Scholar] [CrossRef]
  30. Askari, S. Fuzzy C-Means clustering algorithm for data with unequal cluster sizes and contaminated with noise and outliers: Review and development. Expert Syst. Appl. 2021, 165, 113856. [Google Scholar] [CrossRef]
  31. Yang, Z.; Zhang, A.; Sudjianto, A. GAMI-Net: An explainable neural network based on generalized additive models with structured interactions. Pattern Recognit. 2021, 120, 108192. [Google Scholar] [CrossRef]
  32. Prata, D.N.; Rodrigues, W.; Bermejo, P.H. Temperature significantly changes COVID-19 transmission in (sub)tropical cities of Brazil. Sci. Total Environ. 2020, 729, 138862. [Google Scholar] [CrossRef] [PubMed]
  33. Xu, C.; Huang, G.; Zhang, M. Comparative Analysis of the Seasonal Driving Factors of the Urban Heat Environment Using Machine Learning: Evidence from the Wuhan Urban Agglomeration, China, 2020. Atmosphere 2024, 15, 671. [Google Scholar] [CrossRef]
  34. Wang, A.; Zhang, M.; Kafy, A.-A.; Tong, B.; Hao, D.; Feng, Y. Predicting the impacts of urban land change on LST and carbon storage using InVEST, CA-ANN and WOA-LSTM models in Guangzhou, China. Earth Sci. Inform. 2023, 16, 437–454. [Google Scholar] [CrossRef]
  35. Wang, A.; Zhang, M.; Ren, B.; Zhang, Y.; Kafy, A.-A.; Li, J. Ventilation analysis of urban functional zoning based on circuit model in Guangzhou in winter, China. Urban Clim. 2023, 47, 101385. [Google Scholar] [CrossRef]
  36. Nazarian, N.; Krayenhoff, E.S.; Bechtel, B.; Hondula, D.M.; Paolini, R.; Vanos, J.; Cheung, T.; Chow, W.T.L.; de Dear, R.; Jay, O.; et al. Integrated Assessment of Urban Overheating Impacts on Human Life. Earths Future 2022, 10, e2022EF002682. [Google Scholar] [CrossRef]
  37. Wang, Y.; Li, X.; Zhang, C.; He, W. Influence of spatiotemporal changes of impervious surface on the urban thermal environment: A case of Huai’an central urban area. Sustain. Cities Soc. 2022, 79, 103710. [Google Scholar] [CrossRef]
  38. Li, Y.; Sun, Y.; Li, J.; Gao, C. Socioeconomic drivers of urban heat island effect: Empirical evidence from major Chinese cities. Sustain. Cities Soc. 2020, 63, 102425. [Google Scholar] [CrossRef]
  39. Zhang, Q.; Kong, Q.; Zhang, M.; Huang, H. New-type urbanization and ecological well-being performance: A coupling coordination analysis in the middle reaches of the Yangtze River urban agglomerations, China. Ecol. Indic. 2024, 159, 111678. [Google Scholar] [CrossRef]
  40. Zhang, M.; Yiğit, İ.; Adigüzel, F.; Hu, C.; Chen, E.; Siyavuş, A.E.; Elmastaş, N.; Ustuner, M.; Kaya, A.Y. Impact of Urban Surfaces on Microclimatic Conditions and Thermal Comfort in Burdur, Türkiye. Atmosphere 2024, 15, 1375. [Google Scholar] [CrossRef]
  41. Shaamala, A.; Yigitcanlar, T.; Nili, A.; Nyandega, D. Strategic tree placement for urban cooling: A novel optimisation approach for desired microclimate outcomes. Urban Clim. 2024, 56, 102084. [Google Scholar] [CrossRef]
  42. Jingzhong, Y.; Lu, P. Differentiated childhoods: Impacts of rural labor migration on left-behind children in China. J. Peasant Stud. 2011, 38, 355–377. [Google Scholar] [CrossRef] [PubMed]
  43. Zhang, M.; Chen, E.; Zhang, C.; Liu, C.; Li, J. Multi-Scenario Simulation of Land Use Change and Ecosystem Service Value Based on the Markov–FLUS Model in Ezhou City, China. Sustainability 2024, 16, 6237. [Google Scholar] [CrossRef]
  44. Zhu, J.; Yuan, X.; Yuan, X.; Liu, S.; Guan, B.; Sun, J.; Chen, H. Evaluating the sustainability of rural complex ecosystems during the development of traditional farming villages into tourism destinations: A diachronic emergy approach. J. Rural Stud. 2021, 86, 473–484. [Google Scholar] [CrossRef]
  45. Wang, S.; Shi, C.; Fang, C.; Feng, K. Examining the spatial variations of determinants of energy-related CO2 emissions in China at the city level using Geographically Weighted Regression Model. Appl. Energy 2019, 235, 95–105. [Google Scholar] [CrossRef]
  46. Weiskopf, S.R.; Rubenstein, M.A.; Crozier, L.G.; Gaichas, S.; Griffis, R.; Halofsky, J.E.; Hyde, K.J.; Morelli, T.L.; Morisette, J.T.; Muñoz, R.C.; et al. Climate change effects on biodiversity, ecosystems, ecosystem services, and natural resource management in the United States. Sci. Total Environ. 2020, 733, 137782. [Google Scholar] [CrossRef]
  47. Pascual, L.S.; Segarra-Medina, C.; Gómez-Cadenas, A.; López-Climent, M.F.; Vives-Peris, V.; Zandalinas, S.I. Climate change-associated multifactorial stress combination: A present challenge for our ecosystems. J. Plant Physiol. 2022, 276, 153764. [Google Scholar] [CrossRef]
  48. Cao, J. Urban expansion weakens the contribution of local land cover to urban warming. Urban Clim. 2022, 45, 101285. [Google Scholar] [CrossRef]
  49. Kyprianou, I. Urban vulnerability in the EMME region and sustainable development goals: A new conceptual framework. Sustain. Cities Soc. 2022, 80, 103763. [Google Scholar] [CrossRef]
  50. Mahmood, R.; Jia, S.; Lv, A.; Zhu, W. A preliminary assessment of environmental flow in the three rivers’ source region, Qinghai Tibetan Plateau, China and suggestions. Ecol. Eng. 2020, 144, 105709. [Google Scholar] [CrossRef]
  51. Zhang, M.; Zhang, C.; Kafy, A.-A.; Tan, S. Simulating the Relationship Between Land Use/Cover Change and Urban Thermal Environment Using Machine Learning Algorithms in Wuhan City, China. Land 2022, 11, 14. [Google Scholar] [CrossRef]
  52. Li, R.; Jin, W. The role of the Yangtze River Protection Law in the emergence of adaptive water governance in China. Ecol. Soc. 2023, 28, art32. [Google Scholar] [CrossRef]
  53. Zhou, S.; Yu, B.; Zhang, Y. Global concurrent climate extremes exacerbated by anthropogenic climate change. Sci. Adv. 2023, 9, eabo1638. [Google Scholar] [CrossRef]
  54. Guo, C.; Bai, Z.; Shi, X.; Chen, X.; Chadwick, D.; Strokal, M.; Zhang, F.; Ma, L.; Chen, X. Challenges and strategies for agricultural green development in the Yangtze River Basin. J. Integr. Environ. Sci. 2021, 18, 37–54. [Google Scholar] [CrossRef]
  55. Chiatante, G.; Pellitteri-Rosa, D.; Torretta, E.; Nonnis Marzano, F.; Meriggi, A. Indicators of biodiversity in an intensively cultivated and heavily human modified landscape. Ecol. Indic. 2021, 130, 108060. [Google Scholar] [CrossRef]
  56. Nicholson, E.; Watermeyer, K.E.; Rowland, J.A.; Sato, C.F.; Stevenson, S.L.; Andrade, A.; Brooks, T.M.; Burgess, N.D.; Cheng, S.T.; Grantham, H.S.; et al. Scientific foundations for an ecosystem goal, milestones and indicators for the post-2020 global biodiversity framework. Nat. Ecol. Evol. 2021, 5, 1338–1349. [Google Scholar] [CrossRef]
  57. Avtar, R.; Komolafe, A.A.; Kouser, A.; Singh, D.; Yunus, A.P.; Dou, J.; Kumar, P.; Gupta, R.D.; Johnson, B.A.; Minh, H.V.T.; et al. Assessing sustainable development prospects through remote sensing: A review. Remote Sens. Appl. Soc. Environ. 2020, 20, 100402. [Google Scholar] [CrossRef]
  58. Zhu, Z.; Qiu, S.; Ye, S. Remote sensing of land change: A multifaceted perspective. Remote Sens. Environ. 2022, 282, 113266. [Google Scholar] [CrossRef]
  59. Nwakaire, C.M.; Onn, C.C.; Yap, S.P.; Yuen, C.W.; Onodagu, P.D. Urban Heat Island Studies with emphasis on urban pavements: A review. Sustain. Cities Soc. 2020, 63, 102476. [Google Scholar] [CrossRef]
  60. Jennewein, J.S.; Lamb, B.T.; Hively, W.D.; Thieme, A.; Thapa, R.; Goldsmith, A.; Mirsky, S.B. Integration of Satellite-Based Optical and Synthetic Aperture Radar Imagery to Estimate Winter Cover Crop Performance in Cereal Grasses. Remote Sens. 2022, 14, 2077. [Google Scholar] [CrossRef]
  61. Lu, J.; Li, J.; Fu, H.; Tang, X.; Liu, Z.; Chen, H.; Sun, Y.; Ning, X. Deep Learning for Multi-Source Data-Driven Crop Yield Prediction in Northeast China. Agriculture 2024, 14, 794. [Google Scholar] [CrossRef]
  62. Zhang, M.; Kafy, A.-A.; Ren, B.; Zhang, Y.; Tan, S.; Li, J. Application of the Optimal Parameter Geographic Detector Model in the Identification of Influencing Factors of Ecological Quality in Guangzhou, China. Land 2022, 11, 1303. [Google Scholar] [CrossRef]
  63. Dong, Y.; Liu, G.; Wu, X.; Wang, L.; Xu, H.; Yang, S.; Wu, T.; Abakumov, E.; Zhao, J.; Cui, X.; et al. Spatiotemporal Variations in Compound Extreme Events and Their Cumulative and Lagged Effects on Vegetation in the Northern Permafrost Regions from 1982 to 2022. Remote Sens. 2025, 17, 169. [Google Scholar] [CrossRef]
  64. Chen, Z.; Liu, X.; Feng, H.; Wang, H.; Hao, C. The Spatiotemporal Evolution of Vegetation in the Henan Section of the Yellow River Basin and Mining Areas Based on the Normalized Difference Vegetation Index. Remote Sens. 2024, 16, 4419. [Google Scholar] [CrossRef]
  65. Cao, X.; Chen, W.; Xing, Y.; Chen, Y.; Chen, X.; Wang, X.; Wu, D.; Niu, X.; Pu, W.; Liu, J.; et al. The Changes in Remoted Land Surface Temperature (LST) Triggered by Natural and Socioeconomic Factors in Typical Chinese Cities. Urban Clim. 2024, 58, 102151. [Google Scholar] [CrossRef]
  66. Jiang, H.; Xu, X.; Guan, M.; Wang, L.; Huang, Y.; Jiang, Y. Determining the contributions of climate change and human activities to vegetation dynamics in agro-pastural transitional zone of northern China from 2000 to 2015. Sci. Total Environ. 2020, 718, 134871. [Google Scholar] [CrossRef] [PubMed]
  67. Gu, Z.; Chen, X.; Ruan, W.; Zheng, M.; Gen, K.; Li, X.; Deng, H.; Chen, Y.; Liu, M. Quantifying the direct and indirect effects of terrain, climate and human activity on the spatial pattern of kNDVI-based vegetation growth: A case study from the Minjiang River Basin, Southeast China. Ecol. Inform. 2024, 80, 102493. [Google Scholar] [CrossRef]
  68. Verrall, B.; Pickering, C.M. Alpine vegetation in the context of climate change: A global review of past research and future directions. Sci. Total Environ. 2020, 748, 141344. [Google Scholar] [CrossRef]
  69. Wang, Z.; Fu, B.; Wu, X.; Li, Y.; Feng, Y.; Wang, S.; Wei, F.; Zhang, L. Vegetation resilience does not increase consistently with greening in China’s Loess Plateau. Commun. Earth Environ. 2023, 4, 336. [Google Scholar] [CrossRef]
  70. Qin, G.; Wang, N.; Wu, Y.; Zhang, Z.; Meng, Z.; Zhang, Y. Spatiotemporal variations in eco-environmental quality and responses to drought and human activities in the middle reaches of the Yellow River basin, China from 1990 to 2022. Ecol. Inform. 2024, 81, 102641. [Google Scholar] [CrossRef]
  71. Liu, S.; Wu, L.; Zhen, S.; Lin, Q.; Hu, X.; Li, J. Terrain or climate factor dominates vegetation resilience? Evidence from three national parks across different climatic zones in China. For. Ecosyst. 2024, 11, 100212. [Google Scholar] [CrossRef]
  72. Hoffmann, R.; Dimitrova, A.; Muttarak, R.; Crespo Cuaresma, J.; Peisker, J. A meta-analysis of country-level studies on environmental change and migration. Nat. Clim. Change 2020, 10, 904–912. [Google Scholar] [CrossRef]
  73. Reba, M.; Seto, K.C. A systematic review and assessment of algorithms to detect, characterize, and monitor urban land change. Remote Sens. Environ. 2020, 242, 111739. [Google Scholar] [CrossRef]
  74. Cao, Q.; Liu, Y.; Georgescu, M.; Wu, J. Impacts of landscape changes on local and regional climate: A systematic review. Landsc. Ecol. 2020, 35, 1269–1290. [Google Scholar] [CrossRef]
  75. Ye, B.; Jiang, J.; Liu, J.; Zheng, Y.; Zhou, N. Research on quantitative assessment of climate change risk at an urban scale: Review of recent progress and outlook of future direction. Renew. Sustain. Energy Rev. 2021, 135, 110415. [Google Scholar] [CrossRef]
  76. Unal Cilek, M.; Cilek, A. Analyses of land surface temperature (LST) variability among local climate zones (LCZs) comparing Landsat-8 and ENVI-met model data. Sustain. Cities Soc. 2021, 69, 102877. [Google Scholar] [CrossRef]
  77. Dastour, H.; Hassan, Q.K. A Multidimensional Machine Learning Framework for LST Reconstruction and Climate Variable Analysis in Forest Fire Occurrence. Ecol. Inform. 2024, 83, 102849. [Google Scholar] [CrossRef]
  78. Ma, Y.; He, X.; Shangguan, D.; Li, D.; Dai, S.; He, B.; Yang, Q. Impacts of Climate Change and Anthropogenic Activities on Vegetation Dynamics Considering Time Lag and Accumulation Effects: A Case Study in the Three Rivers Source Region, China. Sustainability 2025, 17, 2348. [Google Scholar] [CrossRef]
  79. He, J.; Zhou, W.; Qian, M.; Zha, E.; Cao, A.; Shi, X. Unveiling Differentiation Characteristics of Vegetation Restoration Potential for Browning Areas in China’s Hilly and Gully Region. Land 2025, 14, 52. [Google Scholar] [CrossRef]
  80. He, L.; Yuan, Y.; He, Z.; Pang, J.; Zhao, Y.; Zeng, W.; Cen, Y.; Xiao, Y. Spatiotemporal Variations of Vegetation NPP Based on GF-SG and kNDVI and Its Response to Climate Change and Human Activities: A Case Study of the Zoigê Plateau. Forests 2025, 16, 32. [Google Scholar] [CrossRef]
  81. Feng, X.; Tian, J.; Wang, Y.; Wu, J.; Liu, J.; Ya, Q.; Li, Z. Spatio-Temporal Variation and Climatic Driving Factors of Vegetation Coverage in the Yellow River Basin from 2001 to 2020 Based on kNDVI. Forests 2023, 14, 620. [Google Scholar] [CrossRef]
  82. Wang, Y.; Zhang, N.; Chen, M.; Zhao, Y.; Guo, F.; Huang, J.; Peng, D.; Wang, X. Prediction and Spatiotemporal Dynamics of Vegetation Index Based on Deep Learning and Environmental Factors in the Yangtze River Basin. Forests 2025, 16, 460. [Google Scholar] [CrossRef]
Figure 1. Location Analysis Map.
Land 14 00598 g001
Figure 2. The analysis of KNDVI trends over the years is presented as follows: (a) shows the spatial distribution of KNDVI trends across the study area, while (b) depicts the overall regional trend over time. (c) provides a provincial breakdown of annual KNDVI changes. (d,e) summarize key factors driving these variations using PCA. (f) highlights clusters of provinces with similar KNDVI change patterns, complementing the provincial breakdown in (c).
Land 14 00598 g002
Figure 3. The analysis of LST trends over the years is summarized as follows: (a) presents the spatial distribution of LST trends across the region, while (b) illustrates the overall regional trend over time. (c) provides a provincial breakdown of annual LST changes. (d,e) highlight the key factors influencing these trends through PCA. (f) groups provinces with similar LST change patterns, complementing the provincial breakdown in (c).
Land 14 00598 g003
Figure 4. The statistical distribution of the LST and KNDVI in 2000 and 2020 is as follows: (a,b) display the spatial distribution of LST in 2000 and 2020, respectively. (c,d) show the spatial distribution of the KNDVI for the same years. (e) presents a bar chart comparing the area distribution of the KNDVI values between 2000 and 2020, while (f) provides a similar comparison for LST.
Land 14 00598 g004
Figure 5. Combined analysis of KNDVI and LST ((a) is 2D density plot of KNDVI and LST in 2000, and (b) is 2D density plot of KNDVI and LST in 2020).
Land 14 00598 g005
Figure 6. The relationship between the KNDVI and average LST across provinces is analyzed as follows: Different colors represent yearly trends, with solid lines showing yearly regression fits and a thick black line indicating the overall trend. Circular points represent yearly data, and triangle points denote the mean KNDVI and LST values for each province. Subfigures illustrate the analysis for: (a) Anhui, (b) Chongqing, (c) Guizhou, (d) Hubei, (e) Hunan, (f) Jiangsu, (g) Jiangxi, (h) Shanghai, (i) Sichuan, (j) Yunnan, and (k) Zhejiang.
Land 14 00598 g006
Disclaimer/Publisher’s Note: The statements, opinions and data contained in all publications are solely those of the individual author(s) and contributor(s) and not of MDPI and/or the editor(s). MDPI and/or the editor(s) disclaim responsibility for any injury to people or property resulting from any ideas, methods, instructions or products referred to in the content.

