Article

Evaluation of Urban Flood Susceptibility Under the Influence of Urbanization Based on Shared Socioeconomic Pathways

1
Ecological Civilization Collaborative Innovation Center, Hainan University, Haikou 570228, China
2
School of Computing and Artificial Intelligence, Hainan College of Software Technology, Qionghai 571400, China
3
Hainan Provincial Engineering Research Center for Spatial Data Application, Hainan College of Software Technology, Qionghai 571400, China
4
Department of Construction Economics and Management, Guangzhou Urban Construction Vocational School, Guangzhou 510006, China
*
Author to whom correspondence should be addressed.
Land 2025, 14(3), 621; https://doi.org/10.3390/land14030621
Submission received: 17 February 2025 / Revised: 3 March 2025 / Accepted: 13 March 2025 / Published: 14 March 2025

Abstract

:
Urban flood susceptibility has emerged as a critical challenge for cities worldwide, exacerbated by rapid urbanization. This study evaluates urban flood susceptibility under different Shared Socioeconomic Pathways (SSPs) in the context of urbanization. A coupled modeling approach integrating the System Dynamics (SD) model and the Future Land Use Simulation (FLUS) model was employed to project future land use changes under sustainable development, moderate development, and conventional development scenarios. Additionally, an XGBoost model was developed to assess urban flood susceptibility. The results indicate that urban construction land will continue to increase over the next 30 years, with the extent of growth varying across different scenarios. Notably, under the conventional development scenario, rapid economic growth leads to a significant expansion of built-up land and a sharp decline in ecological land, which in turn exacerbates the urban flood susceptibility. Consequently, urban flood susceptibility is projected to increase across all three scenarios, albeit at varying rates. Specifically, under the sustainable development scenario, 27% of Guangzhou is projected to face high flood risk. In the moderate development scenario, the area classified as high-risk increased by 868.73 km2. Under the conventional development scenario, the high-risk area expanded from 1282.9 km2 in 2020 to 2761.33 km2, representing a 16% increase. These differences are primarily attributed to changes in land use, which alter surface runoff and subsequently enhance the city’s vulnerability to waterlogging. This study provides a comprehensive framework for assessing urban flood susceptibility in the context of urbanization, offering valuable insights for formulating targeted flood prevention and mitigation strategies.

1. Introduction

Urban flood has become one of the serious challenges faced by cities worldwide [1,2,3]. With global climate change and rapid urbanization, the frequency and intensity of urban extreme rainfall events have been continuously increasing, resulting in more frequent urban flood and causing significant economic and societal losses [4,5,6]. Urban flooding not only paralyzes transportation networks [7], disrupting daily commuting and hindering the normal functioning of cities, but also inflicts substantial damage on urban infrastructure [8,9]. Roads may be eroded, bridges may collapse, and drainage systems may fail, with repairs requiring significant investments of labor, materials, and financial resources. More critically, severe flooding poses a direct threat to human life, potentially resulting in casualties and extensive property damage, thereby undermining urban socioeconomic stability [10,11]. According to statistics, flood-related disasters have caused economic losses amounting to billions of dollars over the past decade. What is worse, with global climate change and rapid urbanization, the frequency and intensity of extreme rainfall events in urban areas are increasing, leading to a growing incidence of urban waterlogging disasters. Prior to urbanization, hydrological processes were predominantly governed by natural mechanisms, wherein rainfall was regulated through vegetation interception, natural infiltration, and storage in rivers and lakes. However, rapid urbanization has profoundly altered land use patterns [12] and landscape surface characteristics [13]. For instance, agricultural land and forests have increasingly been converted into infrastructure, such as buildings, parking lots, and highways [14]. These transformations have induced irreversible impacts on urban hydrological processes, primarily manifested in reduced surface permeability, diminished vegetation interception, and shortened runoff concentration time. Consequently, peak runoff rates have surged, infiltration capacity has declined, and the accelerated accumulation of surface runoff has led to frequent urban pluvial flooding events [15,16]. At the same time, rapid urbanization increases population density, expands community exposure, and consequently elevates the risk of urban waterlogging [17]. Fundamentally, urbanization itself is not the root cause of these issues. Rather, the core challenge lies in the unregulated expansion of impervious surfaces and the lagging development of urban flood control infrastructure amid rapid urbanization. Thus, the key to mitigating urban flood risks lies in the rational planning of urban landscapes to accommodate both the needs of urban residents and hydrological sustainability. Establishing and integrating comprehensive flood risk management strategies within the urbanization framework is essential for addressing the challenges posed by rapid urban expansion. Nevertheless, existing urban flood risk assessment studies predominantly adopt static perspectives to address an inherently dynamic problem, rendering them insufficient for capturing the evolving nature of flood risks in future urban landscapes. Therefore, it is crucial to conduct in-depth research on urban flooding and develop predictive models to assess its dynamic evolution under urbanization. Such efforts are essential for enhancing flood resilience and informing effective urban flood risk management strategies.
In this study, accurately predicting the occurrence and development trends of urban flood susceptibility is crucial for effectively mitigating their impact. Since the 1970s, risk assessment models for urban hydrological processes have undergone rapid advancement, with several predominant methodologies emerging. The Historical Disaster Mathematical Statistics (HDMS) method evaluates urban flood risk by leveraging recorded historical flood disaster data, conceptualizing flood risk as a composite outcome of hazard and vulnerability [18]. Its primary workflow involves constructing a statistical analysis model based on historical data and integrating official disaster records to quantify urban flood risk. Owing to its methodological simplicity and reliance solely on historical records, HDMS has been widely adopted for urban flood risk assessments. However, this method has limitations, including the difficulty of obtaining historical data and the fact that past urban waterlogging disasters may not accurately represent future events [19].
The Index Analysis Method (IAM) establishes an evaluation index system based on the key components of urban flood risk and subsequently quantifies risk levels according to each index. Due to its relatively straightforward computational principles, IAM has been widely applied in large-scale urban flood risk assessments. However, this method imposes stringent data volume and accuracy requirements for each index, making its practical implementation challenging. Multi-Criteria Decision Analysis (MCDA) offers a flexible framework for urban flood risk assessment [12,20], with the critical aspect being the allocation of weight coefficients to flood risk indicators. Common subjective weighting approaches include the Analytic Hierarchy Process (AHP), Set Pair Analysis (SPA), and Fuzzy Comprehensive Evaluation (FCE), all of which rely on expert judgment and domain knowledge for scoring [21]. However, these methods are susceptible to biases and knowledge limitations, leading to uncertainties and subjectivity in weight determination. Furthermore, MCDA lacks adaptability to rapid changes in both natural and social environments. Scenario Simulation Analysis (SSA) primarily encompasses hydrological and hydraulic models, with the SWMM—an integrated rainfall-runoff model—being one of the most widely applied hydrological models for urban watershed runoff management and planning [22]. Nevertheless, hydrological and hydraulic models demand extensive datasets, involve complex operational processes, and are prone to errors, thereby constraining their widespread application to some extent.
Simplified models refer to frameworks derived from complex systems theory, where structural and dimensional intricacies are reduced for practical applications [23,24]. These models have been widely employed in large-scale systems characterized by high complexity. In the context of urban hydrological processes, simplified models focus on establishing relationships between key environmental conditions and flood risk, demonstrating strong operational efficiency [25]. Consequently, they serve as valuable complements to hydrological and hydraulic models for the rapid assessment of urban flood risk. Numerous studies have explored hydrological process simplifications based on water balance models. One prominent approach is machine learning (ML), which represents a subset of simplified models capable of autonomously extracting urban flood characteristics based on intelligent algorithms. ML offers a novel and reliable framework for urban flood risk assessment [26]. Similar to MCDA, ML is highly flexible, requiring only relatively simple spatial datasets while exhibiting strong computational efficiency and generalizability [27]. Moreover, ML demands fewer high-resolution datasets compared to SSA [23], making it a widely adopted methodology in urban flood risk assessment [28]. For instance, Tehrany et al. employed a decision tree classification method to evaluate flood susceptibility in Kota Bharu, Malaysia, achieving high simulation accuracy [29]. GBoost (Extreme Gradient Boosting) is an efficient machine learning algorithm that has been widely applied in urban waterlogging assessment due to its high accuracy, efficiency, interpretability, and flexible scalability. Based on the Gradient Boosting framework, XGBoost iteratively optimizes the loss function to progressively reduce prediction errors, resulting in high prediction accuracy. Additionally, XGBoost incorporates regularization terms (L1 and L2 regularization) into the objective function, effectively preventing overfitting and enhancing the model’s generalization capability. The interpretability of the XGBoost model, when coupled with SHAP and PDP packages, allows for a clear assessment of the contribution of various factors influencing urban waterlogging and reveals the critical thresholds of key variables. As urban waterlogging is influenced by multiple factors (such as rainfall intensity, topography, and building density) with nonlinear interactions, the tree-based structure of XGBoost can automatically identify these complex relationships, thereby improving the accuracy of urban waterlogging prediction models.
In addition to the urban flood susceptibility assessment model, forecasting future land use changes is a prerequisite for assessing their impact on urban flooding. However, land use change is a complex system influenced by multiple interacting factors. The System Dynamics (SD) model is a powerful tool for predicting the long-term evolution of such complex systems by capturing the feedback loops and interactions among different subsystems [30,31]. This capability allows the SD model to effectively reflect the interdependencies between system structure, function, and dynamic behavior, making it widely applied in land use change prediction. Nevertheless, traditional quantitative prediction models can only estimate changes in the overall quantity of different land use types, without accounting for their spatial distribution. Consequently, they are inadequate for studying the spatial dynamics of land use transitions. In contrast, spatial prediction models can simulate the temporal and spatial evolution of land use patterns. In many cases, multiple land use conversion processes occur simultaneously and influence one another, making multi-category land use change simulation more effective in determining future land use patterns. Given the competitive and interactive nature of land use types, relying solely on spatial prediction models is insufficient, as they often fail to incorporate the influences of policies, climate change, and socioeconomic factors. Notably, climate change has a significant impact on forested and agricultural lands [32,33]. Therefore, in long-term, multi-scenario simulations of land use dynamics, it is essential to integrate top-down quantitative prediction models, such as the SD model, with bottom-up spatial prediction models, such as the Future Land Use Simulation (FLUS) model. This hybrid modeling approach allows for a more comprehensive representation of land use changes by incorporating natural factors—including future global warming, precipitation variability, policy shifts, and socioeconomic development—into the coupled framework [34]. Additionally, the adoption of an adaptive inertia and competition mechanism enhances the model’s ability to address the complexities of land use interactions and transition probabilities within urban environments.
Guangzhou, one of China’s four major first-tier cities, is an area with high economic and population density, and serves as a hub for technological innovation in China. As a coastal city, Guangzhou is prone to frequent typhoons and concentrated rainfall, making it highly susceptible to urban waterlogging disasters. Moreover, under the context of China’s economic reform and opening-up, Guangzhou has undergone rapid urbanization, which has exacerbated the occurrence of urban waterlogging, a trend expected to persist for decades. However, previous studies have largely relied on historical or static data to assess urban waterlogging disasters, with limited focus on evaluating the changes in urban flood susceptibility driven by dynamic urbanization processes.
Building upon this foundation, this study proposes an urban flood susceptibility assessment framework that responds to urbanization dynamics. By coupling the XGBoost model with the FLUS model, this study analyzes the impact of urbanization on flood susceptibility. The primary objectives of this research are as follows: (1) Assess the influence of urbanization on flood susceptibility under different development scenarios. (2) Develop an XGBoost model for evaluating urban flood susceptibility. (3) Forecasts the spatial and temporal patterns of flood susceptibility across different scenarios. This study provides a quantifiable decision-support system for balancing urban expansion with flood risk management, thereby promoting sustainable urban development.

2. Materials and Methods

2.1. Materials

2.1.1. Study Area

Guangzhou, located in southern China (112°57′–114°3′ E, 22°26′–23°56′ N), spans a total area of 7434.40 km2 and has a population of approximately 18.83 million (Figure 1). As a major economic and technological innovation hub, Guangzhou is one of the most economically vibrant and densely populated regions in China. Guangzhou is characterized by a subtropical monsoon climate and receives an annual average rainfall surpassing 1800 mm, primarily concentrated between May and August. Under the dual pressures of climate change and rapid urbanization, Guangzhou is highly susceptible to urban pluvial flooding, leading to significant economic and infrastructural losses.

2.1.2. Data Source

The urban flood susceptibility assessment dataset comprises flood-prone locations and evaluation indicators (Table 1). Based on the characteristics of Guangzhou and a comprehensive literature review [35,36], seven key factors were selected as assessment indicators: Impervious Surface Percentage (ISP), Digital Elevation Model (DEM), Road Density (RD), Distance from the Waterway (DW), Fractional Vegetation Cover (FVC), Slope (SLOP), and Soil Water Retention (SWR). The flood-prone location data were obtained from the Guangzhou Water Resources Bureau and the Toutiao news platform. Remote sensing imagery used for calculating FVC and ISP was sourced from Landsat 8. Soil type, hydrological networks, and road data were acquired from OpenStreetMap (OpenStreetMap: (https://www.openhistoricalmap.org/, accessed on 18 September 2024)), while DEM data were obtained from the Geospatial Data Cloud, with slope data derived from the DEM.
In the System Dynamics (SD) model, the data included historical socioeconomic data (Gross Domestic Product (GDP) and population figures from 2010 to 2020), historical meteorological data (average temperature and precipitation), land use data, future economic projections, future population projections, and climate change data.
In the Future Land Use Simulation (FLUS) model, 12 land use driving factors were selected, considering the practical conditions of Guangzhou and data availability [37,38]. These factors were categorized into three dimensions: natural environment, socioeconomic factors, and geographical accessibility. Natural environmental factors included elevation, slope, and soil type, with digital elevation data obtained from the Geospatial Data Cloud and soil type data retrieved from the National Earth System Science Data Center. Socioeconomic factors encompassed population and GDP. Geographical accessibility, which represents the fundamental premise of transforming natural landscapes into artificial ones [39], was quantified using seven distance-based indicators: proximity to government offices, schools, railways, highways, primary roads, secondary roads, and tertiary roads. The data for these indicators were sourced from OpenStreetMap (OpenStreetMap: (https://www.openhistoricalmap.org/, accessed on 18 September 2024)). A detailed summary of data sources is provided in Table 1.
Table 1. Data sources for future urban development simulation.
DataData TypeData Source
Population (2010–2020)TableGuangdong Statistical Yearbook (2010—2020)
GDP (2010–2020)Table
Annual Average Temperature (2010–2020)TableNational Climate Data Center of China
Annual Average Precipitation (2010–2020)Table
Land Use (2010, 2020)RasterGlobeLand30: Global Geo-information Public Product (https://web.archive.org/web/20230605074258/http://globallandcover.com/home.html, accessed on 25 September 2024)
GDP (2021–2050)TableNanjing University [40]
Population (2021–2050)TableTsinghua University [41]
Digital Elevation ModelRasterGeospatial Data Cloud
Soil TypeRasterChinese Resources and Environment Science and Data Center
Water System NetworkshapefileOpenStreetMap (https://www.openhistoricalmap.org/, accessed on 25 September 2024)
Road Networkshapefile
Remote Sensing ImageRasterGeospatial Data Cloud

2.2. Methodology

This study constructs an integrated framework by coupling the FLUS and XGBoost model to forecast the future urban flood susceptibility. First, the System Dynamics (SD) and FLUS models are employed to project future land use changes in Guangzhou. Subsequently, a XGBoost-based urban flood susceptibility assessment framework is constructed. Finally, the projected land use data under different development scenarios (SSP1-2.6, SSP2-4.5, and SSP5-8.5) are input into the trained XGBoost model to analyze the spatio-temporal variations in urban flood susceptibility across Guangzhou.

2.2.1. Land Use Prediction Model

(1)
Scenario
ScenarioMIP is one of the key sub-projects of CMIP6, designed as a matrix of different Shared Socioeconomic Pathways (SSPs) and Representative Concentration Pathways (RCPs), incorporating projections of future socioeconomic development. The SSP scenarios are established based on the current national and regional conditions, as well as future development plans, to depict specific socioeconomic trajectories. SSPs encompass seven quantitative dimensions: lifestyle, environment and natural resources, policy and institutions, economic development, human development, population and human resources, and technological advancement. ScenarioMIP integrates SSPs and RCPs to formulate eight future scenario combinations, these scenario combinations are collectively referred to as Shared Socioeconomic Pathways (SSPs). In this study, SSP1-2.6, SSP2-4.5, and SSP5-8.5 are selected as the representative future scenarios, corresponding to sustainable development (SSP1-2.6) under climate change, moderate development (SSP2-4.5), and conventional development (SSP5-8.5) trajectories, respectively. These scenarios have been widely applied in numerous previous studies [16,42,43,44]. Specifically, the sustainable development scenario represents a situation where global efforts to reduce emissions are actively pursued, aiming to achieve the 2 °C temperature target set by the Paris Agreement. The moderate development scenario reflects a “middle path” for socioeconomic development, characterized by partial emissions reduction without a complete transition to a low-carbon economy. The conventional development scenario represents the most pessimistic emission pathway, simulating a future with high energy consumption, rapid economic growth, and no climate policy interventions.
(2)
System Dynamics Model
System dynamics (SD) is a modeling approach designed to study the structure, functionality, and dynamic behavior of feedback-driven systems. By capturing the interactions and feedback loops among different subsystems, SD models enable the prediction of complex system evolution [30,31]. This approach effectively represents the interrelationships between system structure, function, and dynamic behavior. Currently, SD models are widely employed in both the public and private sectors for policy formulation and analysis, providing valuable insights into decision-making processes across various domains.
The land use system is a highly complex and interconnected framework comprising multiple subsystems, including the climate subsystem, land use subsystem, economic subsystem, and population subsystem. The interactions among these subsystems significantly influence their respective trajectories, with the population subsystem playing a particularly pivotal role, as demographic shifts drive changes across other subsystems. Urban and rural population dynamics are encapsulated within the population subsystem. The increasing demand for agricultural products is often a direct consequence of population growth, which, in turn, alters the minimum required area of arable land. The economic subsystem exerts substantial influence over both the population and land use subsystems. Economic expansion, particularly through increased investments in urban development, leads to a reduction in agricultural land and an expansion of built-up areas. Consequently, the economic subsystem is expected to have a profound impact on land use changes [45]. The climate subsystem primarily affects croplands, grasslands, and forests through long-term variations in precipitation and temperature. Temperature fluctuations influence the growth and regeneration capacity of croplands, forests, and grasslands in distinct ways. Similarly, a moderate increase in precipitation may suffice to meet vegetation water demands, thereby inducing changes in agricultural and forested areas. Land use changes, particularly land conversion processes, are closely linked to the land use subsystem [46]. In this study, the land use subsystem includes six distinct categories: constructed lands, cultivated lands, grasslands, forest lands, water area, and unused land. The transformation processes of each land use type are influenced by a range of socioeconomic and climatic factors, as well as the constraints arising from the interactions between different land use categories. To systematically analyze these interdependencies, a system dynamics model for the study area is developed using Vensim software 10.3.0 (http://vensim.com/, accessed on 25 September 2024), ensuring a comprehensive representation of the feedback mechanisms driving land use evolution (Figure 2).
The SD model is established by analyzing the interconnections and interactions among subsystems using land use data from the Guangzhou spanning 2000 to 2020. Through multiple validation processes, the quantitative relationships and dynamic variations among subsystems are derived [34]. Based on the experimental results, the period from 2010 to 2020 is selected as the historical simulation phase. An SD model is constructed using Vensim PLE software 10.3.0 (http://vensim.com/, accessed on 25 September 2024) [47]. To evaluate the accuracy of the model, the simulated land use demand for 2020 is compared with actual land use data from the same year. The accuracy of the simulation is evaluated using the Relative Error (RE) method [48], calculated as per Equation (1). Finally, with 2020 as the baseline year, the validated model is employed to project land use demand changes for 2030–2050 under three SSP scenarios, incorporating relevant parameters associated with each SSP scenario.
R E = s h h × 100 %
where s represents the predicted land use demand, and h represents the historical land use value. A smaller RE indicates a more accurate prediction of land use demand.
(3)
Future land use simulation model
Building upon the land use demand provided by the System Dynamics (SD) model, the Future Land Use Simulation (FLUS) model first employs an artificial neural network to predict the probability of occurrence for each land use type at the grid level. Subsequently, the interactions among various land use types are then modeled using an adaptive inertia and competition mechanism. This process facilitates the determination of the land use classification for each individual grid cell [34].
Building upon the land use demand estimated by the SD model, the FLUS model is applied to simulate the spatial distribution of future land use. This simulation integrates land use data from 2010 to 2020 alongside twelve key influencing factors, such as GDP, POP, soil type, precipitation, elevation, slope, temperature, and distance to infrastructure (e.g., schools, highways, government offices, railways, and roads of varying classifications—primary, secondary, and tertiary). An ANN model is then employed to assess the likelihood of each land use type within individual grid cells. To capture the interactions and competition between different land use categories, an adaptive inertia and competition mechanism is introduced. Finally, land use predictions are used to modify the corresponding urban flood susceptibility indicators (such as ISP, FVC, and SWR), and then the changed indicators are input into the trained XGBoost model to generate future urban flood susceptibility.
For model validation, this study employs the period from 2010 to 2020 for historical validation. The 2010 data, along with the 12 influencing factors, are input into the FLUS model to predict the spatial distribution of land use in 2020. The predicted land use for 2020 is then compared with actual observations, and the model’s accuracy and reliability are assessed using Overall Accuracy (OA) [49] and Figure of Merit (FoM) [50] as evaluation metrics. The calculation methods for OA and FoM are provided as follows:
O A = k = 1 n O A k N
OA is a probability metric that quantifies the proportion of correctly classified land use types in a randomly selected sample. Its value ranges from 0 to 1, where a higher OA indicates greater model accuracy. Specifically, O A k represents the number of correctly classified samples for a given land use type k, while n denotes the total number of land use categories.
F O M = 1 max N a , N b k = 1 N d 1 1 + β d k 2
FOM ranges between 0 and 1 and is calculated relative to the simulation year. It is defined as the ratio between the number of correctly simulated land use pixels and the total number of observed and simulated land use pixels. Specifically, Na represents the number of pixels in the simulated land use results, while Nb denotes the number of pixels in the actual land use data. Additionally, d(k) is the distance between the kth pixel in the observed land use data and its corresponding pixel in the simulated results, serving as a proportional adjustment factor.

2.2.2. XGBoost Model

Extreme gradient lifting tree (XGBoost) is a new machine learning function library, which supports gradient enhancement algorithms. Its algorithm architecture is robust and flexible, and it can quickly screen and identify related feature variables reliably and has strong prediction ability, which is not easily affected by the quality of training data. By performing second-order Taylor expansion on the loss function and adding regularization to reduce the complexity of the model, it overcomes the disadvantage of the classification tree method easily over-fitting [51] and will be able to perform continuity analysis in advance and take advantage of the sparsity of data to reduce arithmetic power consumption. Therefore, this paper will use the extreme gradient lifting tree method to analyze the coupling relationship of cultivated land resources elements and screen the key elements affecting the change in cultivated land quality from the natural-human two-dimensional elements of cultivated land resources. The core idea of the extreme gradient lifting tree algorithm is to generate a tree in each iteration, fit the residual of the predicted value of the last iteration by learning a new function, and then train a new tree based on the generated tree, which retains more objective function information and improves the training speed of the model [52]. The principle is as follows:
(1)
Assume a given data set, where there is a sample number, a sample feature, the determination that a function can estimate the dependent variable from the input variable, and assignment of the number of iterations. The formula is as follows:
D = x i , y i : i = 1 , 2 , n , x i R j , y i R
y ^ i = k = 1 K f k x i = y ^ i K 1 + f k x i    
where n is the number of samples at the monitoring point. xi and yi denotes the feature vector of the i point, and y ^ i denotes the prediction waterlogging depth. f k x i is the tree model obtained after k-th iteration.
The objective function of XGBoost is as follows:
      L = i = 1 n l ( y i , y ^ i ) + k = 1 K Ω f k  
Ω f k = γ T + 1 2 λ ω 2      
where l ( y i , y ^ i ) is the loss function (e.g., mean squared error for regression tasks; logistic loss for classification tasks). Ω f k is the regularization term applied to the model complexity (for each tree f). γ is a parameter that controls the complexity of the tree (the minimum number of leaves required to add another tree). T is the number of leaves in the tree. ω represents the weight (or value) of each tree branches.
The gradient and Hessian (second-order derivative) are used for optimization in the boosting algorithm. Given the loss function l ( y i , y ^ i ), the gradient and Hessian for the i-th data point can be defined as follows:
g i = l y i , y ^ i y ^ i
h i = 2 l y i , y ^ i y ^ 2 i
where g i is the first derivative (the gradient) used to minimize the loss function. h i is the second derivative (the Hessian), which helps adjust the direction and size of the step taken during the optimization.
After preliminary data processing, the proportion used as the training set is 0.8, and the proportion for the test set is 0.2. Establishing a cultivated land quality evaluation model based on XGBoost, R2 was used as the evaluation index to test the effect of the model. The key step of the XGBoost model is the setting of super parameters. Grid Search CV (a function that automatically iterates multiple parameter combinations and returns the most suitable parameter combination) is selected to determine the optimal parameter combination. Super parameters include minimum child weight, max depth, gamma, estimators, and learning rate, and five times cross validation is performed.

3. Results

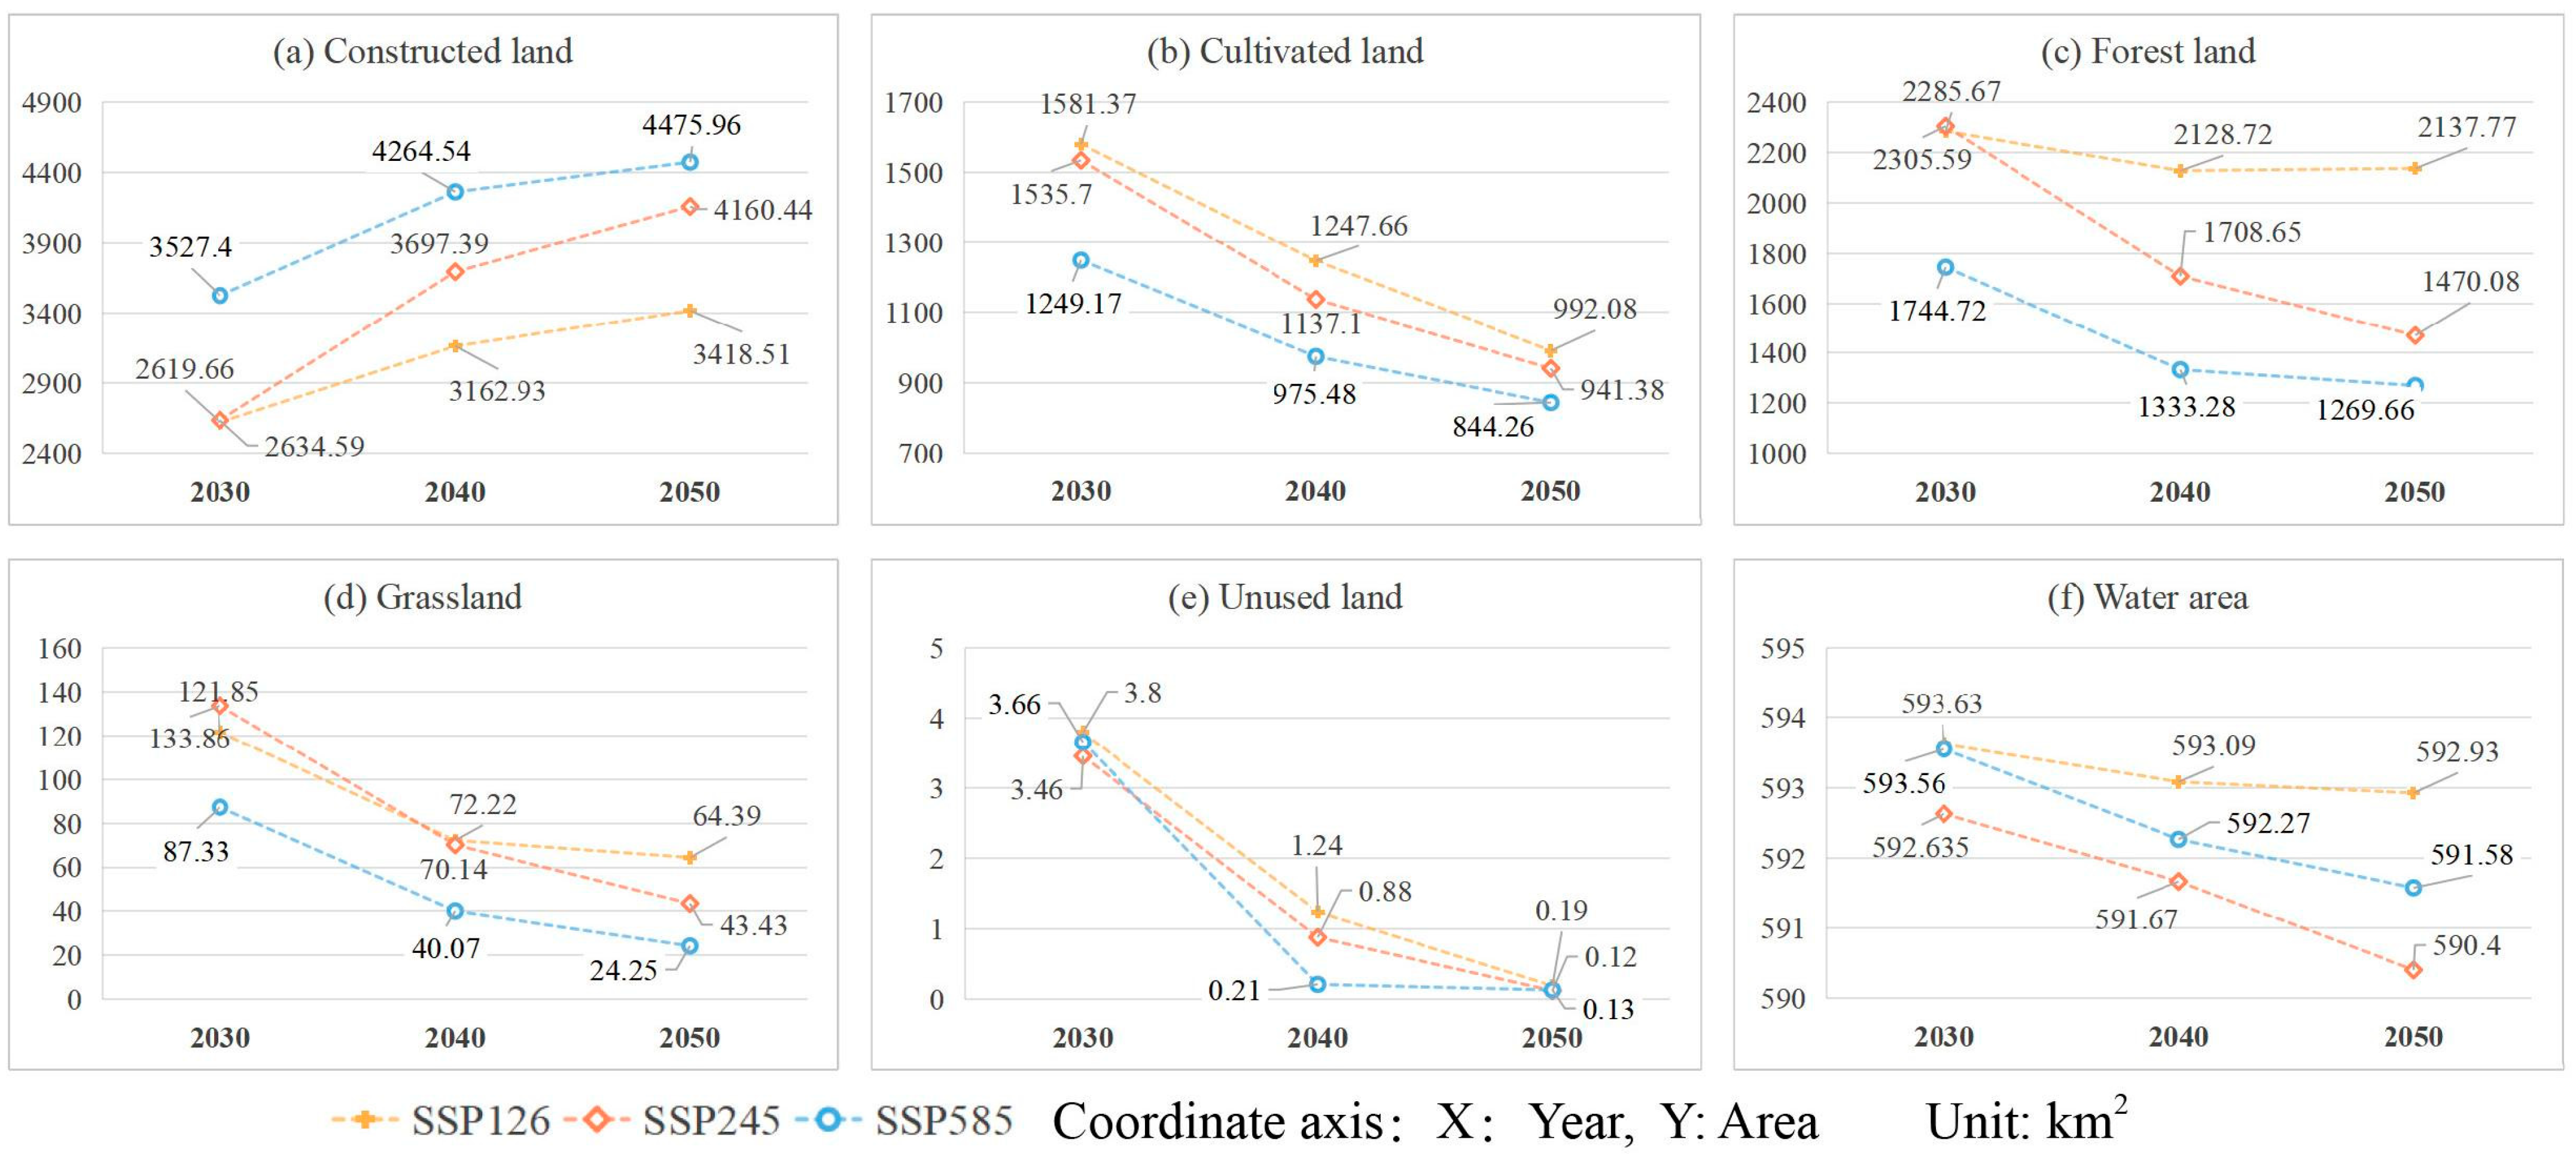
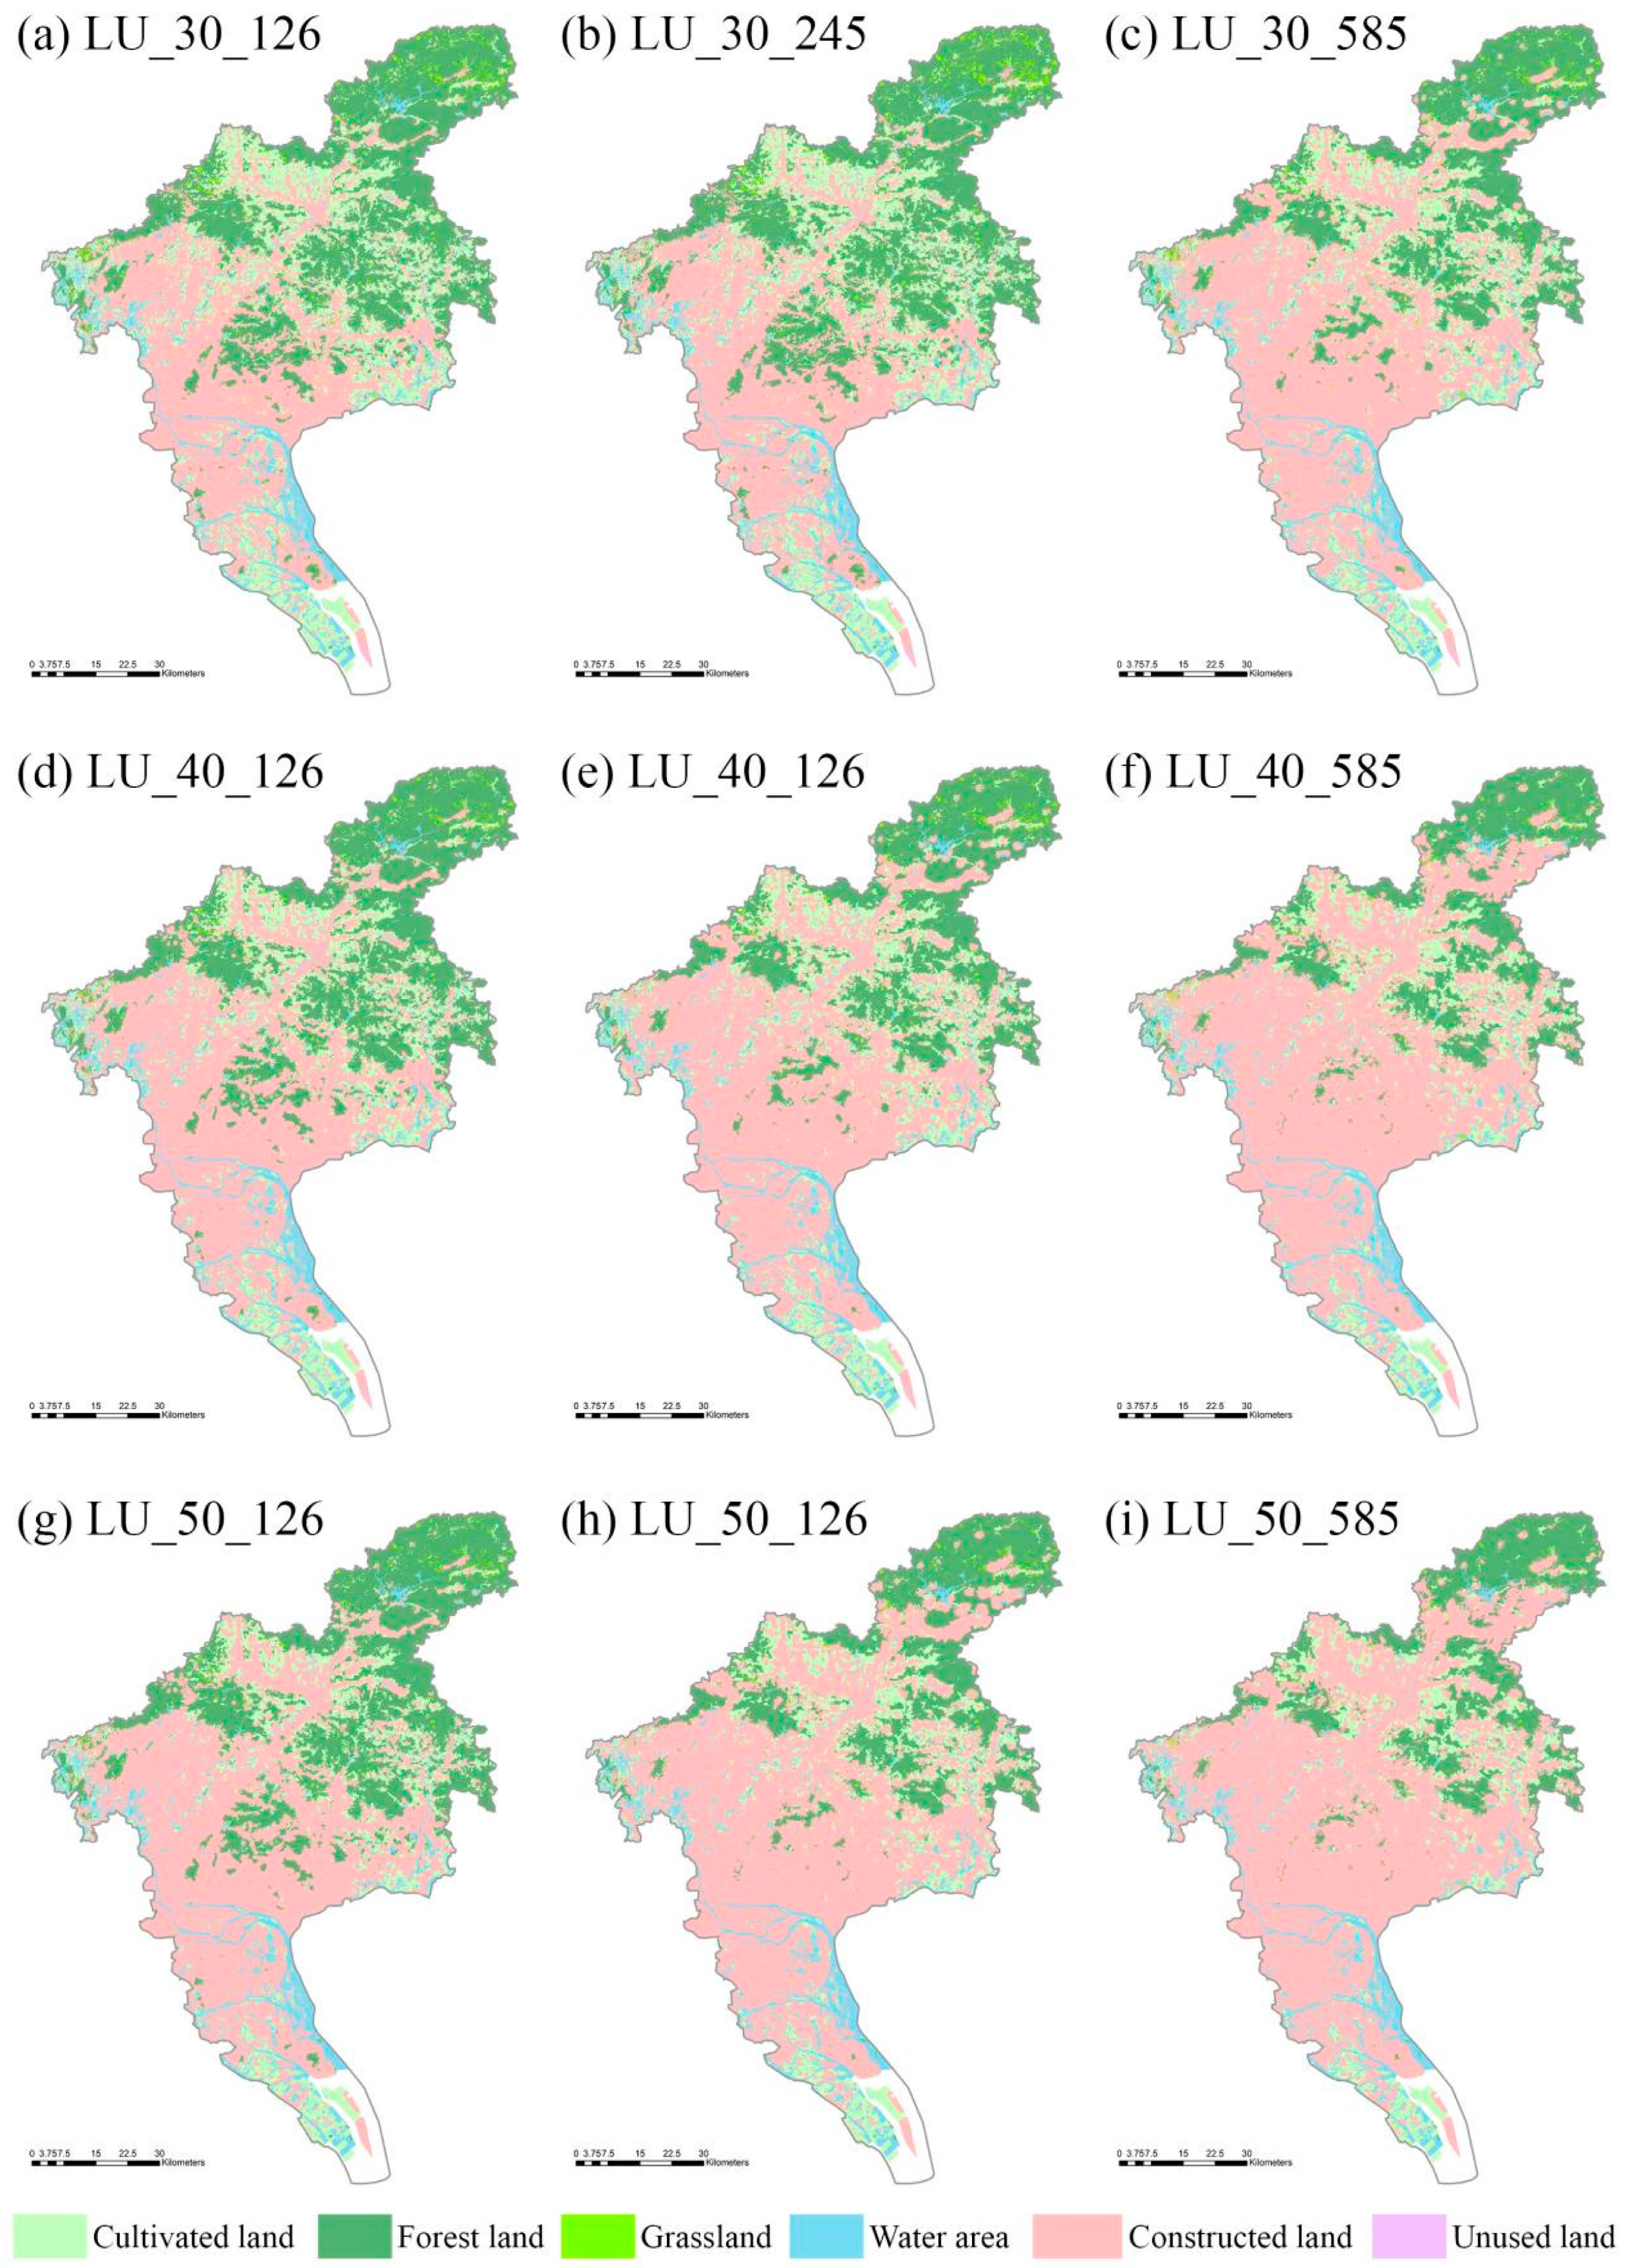
3.1. The Results of Future Urbanization

Urbanization is one of the most prominent manifestations of human activity, typically accompanied by rapid changes in land use patterns, leading to an increase in impervious surfaces. In this study, the SD model achieved a relative error (RE) of 8.15%, indicating its effectiveness in accurately reflecting real-world land use demand. Figure 3 presents the land use demand changes in next 30 years. Due to rapid population growth, the area of constructed land is expected to continuously expand from 2021 to 2050 across all three future scenarios. Conversely, the areas of cropland, forest, and grassland are projected to decline steadily.
The OA and FoM of the FLUS model were 0.784 and 0.22, respectively, demonstrating good accuracy, which indicates that the FLUS model can effectively reflect the real land use dynamics in Guangzhou and is feasible for simulating future land use pattern changes. Figure 4 shows the spatio-temporal changes in land use patterns under the SSP scenarios from 2030 to 2050 based on the land use demand prediction. This study found that the expansion of urban construction land was mainly concentrated in the old urban areas of Guangzhou and expanded outward along the existing construction land. The distribution pattern of construction land was closely related to population agglomeration and economic growth, as the expansion of construction land is the most direct reflection of human activities and the natural environment. Additionally, rapid population growth was a driving force for the conversion of various land use types into construction land. At the same time, the swift economic development of Guangzhou spurred increased investments in fixed assets within the city, resulting in changes in various land use patterns. Forest land was mainly distributed in Conghua District and Zengcheng District, and cultivated land was distributed in Nansha District and Conghua District.

3.1.1. SSP1-2.6

Under the SSP1-2.6 sustainable development scenario, urban expansion progresses at a slower pace, with the constructed land reaching 3527.40 km2 by 2050. In contrast to the continuous expansion of constructed land, forested land is expected to decrease initially and then increase, influenced by policies such as land conversion from farming to forestry and afforestation efforts. The total cropland area is expected to shrink by 589.29 km2, accounting for one-third of its 2020 extent. Additionally, grassland coverage is projected to decline sharply, with its total area decreasing to just 64.39 km2 by 2050—only half of its 2020 extent. The expansion of constructed land primarily occurs at the expense of existing grasslands and croplands.

3.1.2. SSP2-4.5

The SSP2-4.5 scenario represents a moderate development pathway. As anticipated, the rate of constructed land expansion is moderate. By 2050, the area of constructed land is projected to increase to 4160.44 km2, more than twice that of 2020. In contrast, the area of forest land continues to decrease. The areas of cultivated land and grassland are expected to shrink to 1470.08 km2 and 43.43 km2, respectively. The expansion of constructed land has encroached upon a larger portion of forested areas, with development spreading outward from existing urbanized regions.

3.1.3. SSP5-8.5

Under the extreme SSP5-8.5 scenario, constructed land experiences a sharp increase. By 2050, the total area of constructed land is projected to expand to 4475.96 km2, more than twice in 2020. This rapid expansion of constructed land is primarily driven by the emphasis on rapid economic development in the SSP5-8.5 scenario, with minimal consideration given to ecological factors. This results in a surge in population growth and economic development, leading to increased demand for land. In contrast, from 2020 to 2050, substantial reductions are anticipated in the areas of forest, cropland, and grassland. Notably, the area of grassland is expected to decrease to 24.25 km2, a mere 12.12% of the grassland area in 2020. Under the extreme SSP5-8.5 scenario, the expansion of constructed land will lead to the disappearance of significant amounts of forest and grassland by 2050.

3.2. The Results of Urban Waterlogging

3.2.1. Model Performance

The dataset was randomly divided into training and testing sets, and the model’s accuracy was assessed using the coefficient of determination (R2). After multiple iterations of training, the average R2 for the XGBoost model was 0.605, with a maximum R2 of 0.741. These results indicate that the model performs well, demonstrating that the XGBoost model can effectively simulate urban flood susceptibility.

3.2.2. Urban Flood Susceptibility

The future urban development scenario indicators were input into the trained XGBoost model to simulate urban flood susceptibility under various urban development scenarios. The results are presented in Table 2. The findings reveal significant changes in urban flood susceptibility from 2030 to 2050, with varying trends across the different scenarios: slow increases in SSP1-2.6, substantial increases in SSP2-4.5, and a sharp rise in SSP5-8.5. By 2050, the area at high risk of urban flooding in Guangzhou expands dramatically, particularly under the conventional development scenario (SSP5-8.5), where 36% of the region faces high or very high risk of flooding (Figure 5). The trends in medium-risk areas exhibit substantial variation, with a marked increase in SSP5-8.5 and a gradual increase in SSP2-4.5. The changes in low-risk areas are less pronounced, with only slight alterations observed. However, areas classified as very low risk show a considerable reduction, especially under the extreme development scenario (SSP5-8.5), where the area decreases from 2504.86 km2 to 1821.13 km2, a reduction of 17%.
Figure 6 illustrates the spatial distribution of urban flood susceptibility in Guangzhou from 2030 to 2050 under different development scenarios. The urban flood risk under urban development exhibits significant spatial clustering. Areas at high-risk and above for urban flooding are primarily concentrated in the older urban areas of Guangzhou, such as Yuexiu District, Tianhe District, Haizhu District, and Liwan District. In contrast, low-risk and very low risk urban flooding areas are distributed in the northern parts of Guangzhou, including Conghua District and Zengcheng District. As the scenarios and time periods evolve, urban flood susceptibility demonstrates distinct spatial patterns of change. By 2050, areas at high risk and above show a significant increase, extending outward along the existing flood risk zones. This extension predominantly occurs in a northerly direction. Although the direction of urban flood risk extension remains consistent across different scenarios, the rate of increase varies. The spatial growth of urban flood risk aligns closely with the expansion of urban construction land.

4. Discussion

4.1. Analysis of Future Urbanization Trends

Over the next three decades, urban expansion will be influenced by different SSP scenarios. While the overall trend remains similar, the scale and magnitude of changes differ significantly.
Under the SSP5-8.5 scenario, which emphasizes rapid economic development with insufficient consideration for ecological factors, the economy expands at a high rate, attracting large influxes of population. This results in sharp population growth and increased economic activities. Consequently, the demand for urban construction land surges, and other land use types are rapidly converted for urban construction purposes. The expansion of construction land is not only a reflection of urban development but also a direct manifestation of the interaction between human activities and the natural environment. In the case of the Guangzhou, its rapid economic growth has driven substantial fixed asset investments, further accelerating changes in land use patterns and significantly increasing the area of urban construction land [53].
The SSP2-4.5 scenario, which strikes a balance between economic growth and ecological protection, represents a middle-ground development model. In this scenario, the rates of population growth and economic development gradually slow down [48]. Consequently, the expansion of urban construction land is significantly reduced, resulting in more stable land use changes that maintain a balance between ecological conservation and economic development.
The SSP1-2.6 scenario, designed for sustainable development, adheres to an ecology-first principle, decisively rejecting economic growth at the expense of the environment. Through the implementation of scientific population policies to control growth and the orderly expansion of construction land, this model aims for harmonious urban development.

4.2. Analysis of Urban Flood Susceptibility Changes

Based on multi-scenario simulation data from urbanization models, this study systematically evaluates the spatial pattern evolution of urban flood susceptibility over the next 30 years. The results indicate an overall upward trend in urban flood susceptibility across all three SSP scenarios, though the rates of increase vary significantly. Specifically, under the SSP1-2.6 sustainable development scenario, the area of high flood susceptibility increases by 3%, while the area of very high flood susceptibility rises by 4%. This finding highlights that even under stringent environmental constraints, urban flood susceptibility will continue to rise, underscoring the long-term and complex nature of urban flood prevention and disaster mitigation efforts.
In the SSP2-4.5 moderate development scenario, urban flood susceptibility shows steady growth, with an increase that falls between the trends observed in the SSP1-2.6 and SSP5-8.5 scenarios. This reflects the trade-off effect between economic growth and ecological protection. Notably, under the SSP5-8.5 extreme development scenario, urban flood susceptibility shows a sharp upward trend, with the area of very high and high susceptibility reaching 136% and 134%, respectively, compared to the SSP1-2.6 scenario. This significant difference is primarily attributed to the development model prioritizing economic growth over ecological protection in the SSP5-8.5 scenario, which leads to chaotic urban expansion and drastic changes in land use patterns.
From a mechanistic perspective, the spatial differentiation of urban flood susceptibility is primarily driven by two key factors: firstly, the rapid expansion of construction land around urban built-up areas directly increases the impermeable surface area, reducing surface permeability and significantly raising the surface runoff coefficient [54,55]. Secondly, the land cover changes during the rapid urbanization process, particularly the conversion of agricultural and forest land to urban construction land, further accelerates the accumulation of surface runoff. This dual effect is particularly pronounced under the SSP5-8.5 scenario, leading to a significant increase in urban flood risk. In contrast, the scientific urban planning under the SSP1-2.6 scenario, through controlling the spread of urban areas and optimizing land use structures, mitigates the growth trend of urban flood susceptibility to some extent. This finding provides important scientific evidence for the development of differentiated urban flood control strategies.

4.3. Limitations and Prospects

This evaluation method demonstrates a strong capability in assessing urban flood vulnerability within the context of urbanization and SSP scenarios, with its reliability and applicability validated. However, the method still faces certain limitations. Firstly, using only 2020 data to validate the model in future land use change predictions may lead to biased results. Therefore, future research should incorporate cross-validation techniques with iterative cycles to ensure model accuracy. Additionally, the hydrological and dynamic processes of urban watersheds are complex and uncertain, and due to the lack of future observational data for validation, the accuracy of the evaluation results cannot be quantitatively verified. Nonetheless, this study trained the XGBoost model using historical data, achieving an average R2 of 0.605 and a maximum R2 of 0.741, which serves as the threshold indicator for assessing the model’s accuracy and reliability. Although there is uncertainty in future data, the acceptable deviation in the simulated outputs indicates that the model is feasible and can be used to reliably predict urban flood susceptibility associated with global climate and land use changes under different future scenarios.
Given the limitations of the current study, future research should focus on the following areas: First, more detailed evaluations of urban flood susceptibility in low-lying areas are needed, with particular emphasis on exploring the quantitative relationship between the expansion of impermeable surfaces and flood risk. Second, a coupled analysis of climate change factors and urbanization processes should be incorporated to provide a comprehensive assessment of the evolving urban flood risk trends. Advancing these research directions will contribute to the refinement of urban flood susceptibility assessment methodologies and provide more reliable scientific support for urban flood prevention and disaster reduction decision-making.

5. Conclusions

This study, using Guangzhou as a case study, establishes an integrated framework coupling the FLUS and XGBoost models to comprehensively analyze the impact of urbanization on urban flood susceptibility under different SSP scenarios. The land use prediction models (SD and FLUS) effectively reveal the trends in land use changes under various SSP scenarios. Under the SSP5-8.5 scenario, driven by strong economic growth, the rapid expansion of urban constructed land is accompanied by a significant reduction in forest land, cultivated land, and grassland areas. The SSP2-4.5 scenario presents a more balanced outlook, with moderate growth in urban constructed land and relatively stable changes in other land use types. In the SSP1-2.6 scenario, urban expansion is slow, and it places a strong emphasis on ecological restoration, particularly forestland. These findings underscore the substantial influence of urbanization pathways on land use dynamics. The XGBoost model demonstrates good performance in simulating urban flood susceptibility, with an average R2 of 0.605 and a maximum R2 of 0.741. The results indicate that, from 2030 to 2050, urban flood susceptibility increases across all scenarios, with significant differences in the rate of increase. The spatial distribution of flood susceptibility also exhibits distinct patterns, with high-risk areas concentrated in Guangzhou’s older urban districts and low-risk areas concentrated in the northern suburbs. The growth in flood susceptibility is spatially correlated with the expansion of urban built-up areas, suggesting that changes in land use play a crucial role in the evolution of flood susceptibility. This study integrates the XGBoost model and future urban development model, offering quantitative evidence to inform climate-resilient urban planning and infrastructure prioritization under rapid urbanization scenarios projected for the mid-21st century.

Author Contributions

Conceptualization, X.F. and Y.L.; methodology, X.F., Y.L. and H.Y.; software, X.F., F.X., F.C. and H.Y.; validation, F.X., Y.L. and F.C.; formal analysis, X.F., F.X. and Y.L.; investigation, Y.L., F.X. and Y.L.; resources, X.F., F.X. and Y.L.; data curation, Y.L. and F.C.; writing—original draft preparation, X.F.; writing—review and editing, X.F.; visualization, H.Y.; supervision, H.Y.; project administration, X.F.; funding acquisition, Y.L. All authors have read and agreed to the published version of the manuscript.

Funding

This research was funded by the “Rising Star in the South China Sea” of Hainan Province (NHXXRCXM202322) and the Education Department of Hainan Province, project number: Hnky2024-76.

Data Availability Statement

This study did not report any publicly archived datasets.

Conflicts of Interest

The authors declare neither conflicts of interest nor competing interests.

References

  1. Ren, H.C.; Pang, B.; Zhao, G.; Yu, H.J.; Tian, P.N.; Xie, C.R. Incorporating dynamic drainage supervision into deep learning for accurate real-time flood simulation in urban areas. Water Res. 2025, 270, 122816. [Google Scholar] [CrossRef] [PubMed]
  2. Wan, J.Q.; Shen, Y.F.; Xue, F.C.; Yan, X.; Qin, Y.W.; Yang, T.; Yang, G.; Wang, Q.J. DSC-YOLOv8n: An advanced automatic detection algorithm for urban flood levels. J. Hydrol. 2024, 643, 132028. [Google Scholar] [CrossRef]
  3. Yin, D.K.; Zhang, X.Y.; Cheng, Y.H.; Jia, H.F.; Jia, Q.M.; Yang, Y. Can flood resilience of green-grey-blue system cope with future uncertainty? Water Res. 2023, 242, 120315. [Google Scholar] [CrossRef] [PubMed]
  4. Singh, J.; Karmakar, S.; PaiMazumder, D.; Ghosh, S.; Niyogi, D. Urbanization alters rainfall extremes over the contiguous United States. Environ. Res. Lett. 2020, 15, 074033. [Google Scholar] [CrossRef]
  5. Wang, Q.; Cai, X.T.; Tang, J.Y.; Yang, L.; Wang, J.; Xu, Y.P. Climate feedbacks associated with land-use and land-cover change on hydrological extremes over the Yangtze River Delta Region, China. J. Hydrol. 2023, 623, 129855. [Google Scholar] [CrossRef]
  6. Yang, Z.; Burn, D.H. Automatic feature selection and weighting for the formation of homogeneous groups for regional IDF estimation. J. Hydrol. 2019, 575, 292–307. [Google Scholar] [CrossRef]
  7. Qiao, M.L.; Haraguchi, M.; Lall, U. Enhancing urban resilience to extreme weather: The roles of human transition paths among multiple transportation modes. Int. J. Geogr. Inf. Sci. 2024, 1–20. [Google Scholar] [CrossRef]
  8. Anni, A.H.; Cohen, S.; Praskievicz, S. Sensitivity of urban flood simulations to stormwater infrastructure and soil infiltration. J. Hydrol. 2020, 588, 125028. [Google Scholar] [CrossRef]
  9. Kim, J.; Park, J.; Park, S.; Kang, J. Enhancing water management and urban flood resilience using Hazard Capacity Factor Design (HCFD) model: Case study of Eco-Delta city, Busan. Sustain. Cities Soc. 2024, 115, 105851. [Google Scholar] [CrossRef]
  10. Wang, P.; Li, Y.B.; Zhang, Y.H. An urban system perspective on urban flood resilience using SEM: Evidence from Nanjing city, China. Nat. Hazards 2021, 109, 2575–2599. [Google Scholar] [CrossRef]
  11. Zheng, J.X.; Chen, X.; Kawaike, K.; Yamanoi, K.; Koshiba, T.; Huang, G.R. Response of urban flood resilience to climate change: An exploration with a novel performance-based metric considering the socioeconomic impacts of damage costs. J. Hydrol. 2024, 645, 132260. [Google Scholar] [CrossRef]
  12. Chen, X.L.; Zhang, H.; Chen, W.J.; Huang, G.R. Urbanization and climate change impacts on future flood risk in the Pearl River Delta under shared socioeconomic pathways. Sci. Total Environ. 2021, 762, 143144. [Google Scholar] [CrossRef] [PubMed]
  13. Jodar-Abellan, A.; Valdes-Abellan, J.; Pla, C.; Gomariz-Castillo, F. Impact of land use changes on flash flood prediction using a sub-daily SWAT model in five Mediterranean ungauged watersheds (SE Spain). Sci. Total Environ. 2019, 657, 1578–1591. [Google Scholar] [CrossRef]
  14. Miguez, M.G.; Rezende, O.M.; Veról, A.P. City Growth and Urban Drainage Alternatives: Sustainability Challenge. J. Urban Plan. Dev. 2015, 141, 04014026. [Google Scholar] [CrossRef]
  15. Huong, H.T.L.; Pathirana, A. Urbanization and climate change impacts on future urban flooding in Can Tho city, Vietnam. Hydrol. Earth Syst. Sci. 2013, 17, 379–394. [Google Scholar] [CrossRef]
  16. Wang, M.; Liu, M.; Zhang, D.; Zhang, Y.; Su, J.; Zhou, S.; Bakhshipour, A.E.; Tan, S.K. Assessing hydrological performance for optimized integrated grey-green infrastructure in response to climate change based on shared socio-economic pathways. Sustain. Cities Soc. 2023, 91, 104436. [Google Scholar] [CrossRef]
  17. Prana, A.M.; Dionisio, R.; Curl, A.; Hart, D.; Gomez, C.; Apriyanto, H.; Prasetya, H. Informal adaptation to flooding in North Jakarta, Indonesia. Prog. Plan. 2024, 186, 100851. [Google Scholar] [CrossRef]
  18. Sado-Inamura, Y.; Fukushi, K. Empirical analysis of flood risk perception using historical data in Tokyo. Land Use Policy 2019, 82, 13–29. [Google Scholar] [CrossRef]
  19. Xu, H.S.; Ma, C.; Lian, J.J.; Xu, K.; Chaima, E. Urban flooding risk assessment based on an integrated k-means cluster algorithm and improved entropy weight method in the region of Haikou, China. J. Hydrol. 2018, 563, 975–986. [Google Scholar] [CrossRef]
  20. Mahmoud, S.H.; Gan, T.Y. Multi-criteria approach to develop flood susceptibility maps in arid regions of Middle East. J. Clean. Prod. 2018, 196, 216–229. [Google Scholar] [CrossRef]
  21. Tang, X.; Hong, H.; Shu, Y.; Tang, H.; Li, J.; Liu, W. Urban waterlogging susceptibility assessment based on a PSO-SVM method using a novel repeatedly random sampling idea to select negative samples. J. Hydrol. 2019, 576, 583–595. [Google Scholar] [CrossRef]
  22. Mohanty, M.P.; Vittal, H.; Yadav, V.; Ghosh, S.; Rao, G.S.; Karmakar, S. A new bivariate risk classifier for flood management considering hazard and socio-economic dimensions. J. Environ. Manag. 2020, 255, 109733. [Google Scholar] [CrossRef] [PubMed]
  23. Chen, J.L.; Huang, G.R.; Chen, W.J. Towards better flood risk management: Assessing flood risk and investigating the potential mechanism based on machine learning models. J. Environ. Manag. 2021, 293, 112810. [Google Scholar] [CrossRef]
  24. Khan, T.A.; Shahid, Z.; Alam, M.; Su’ud, M.M.; Kadir, K.; IEEE. Early Flood Risk Assessment using Machine Learning: A Comparative study of SVM, Q-SVM, K-NN and LDA. In Proceedings of the 2019 13th International Conference on Mathematics, Actuarial Science, Computer Science and Statistics (MACS), Karachi, Pakistan, 14–15 December 2019. [Google Scholar]
  25. Zhang, S.H.; Pan, B.Z. An urban storm-inundation simulation method based on GIS. J. Hydrol. 2014, 517, 260–268. [Google Scholar] [CrossRef]
  26. Ghosh, S.; Das, A. Wetland conversion risk assessment of East Kolkata Wetland: A Ramsar site using random forest and support vector machine model. J. Clean. Prod. 2020, 275, 123475. [Google Scholar] [CrossRef]
  27. Tang, X.Z.; Shu, Y.Q.; Liu, W.; Li, J.F.; Liu, M.N.; Yu, H.F. An Optimized Weighted Naive Bayes Method for Flood Risk Assessment. Risk Anal. 2021, 41, 2301–2321. [Google Scholar] [CrossRef]
  28. Seleem, O.; Ayzel, G.; de Souza, A.C.T.; Bronstert, A.; Heistermann, M. Towards urban flood susceptibility mapping using data-driven models in Berlin, Germany. Geomat. Nat. Hazards Risk 2022, 13, 1640–1662. [Google Scholar] [CrossRef]
  29. Tehrany, M.S.; Pradhan, B.; Jebur, M.N. Spatial prediction of flood susceptible areas using rule based decision tree (DT) and a novel ensemble bivariate and multivariate statistical models in GIS. J. Hydrol. 2013, 504, 69–79. [Google Scholar] [CrossRef]
  30. Costanza, R.; Ruth, M. Using dynamic modeling to scope environmental problems and build consensus. Environ. Manag. 1998, 22, 183–195. [Google Scholar] [CrossRef]
  31. Haghani, A.; Lee, S.Y.; Byun, J.H. A system dynamics approach to land use/transportation system performance modeling-Part I: Methodology. J. Adv. Transp. 2003, 37, 1–41. [Google Scholar] [CrossRef]
  32. Bakker, M.M.; Govers, G.; Kosmas, C.; Vanacker, V.; van Oost, K.; Rounsevell, M. Soil erosion as a driver of land-use change. Agric. Ecosyst. Environ. 2005, 105, 467–481. [Google Scholar] [CrossRef]
  33. Wolf, J.; Bindraban, P.S.; Luijten, J.C.; Vleeshouwers, L.M. Exploratory study on the land area required for global food supply and the potential global production of bioenergy. Agric. Syst. 2003, 76, 841–861. [Google Scholar] [CrossRef]
  34. Liu, X.P.; Liang, X.; Li, X.; Xu, X.C.; Ou, J.P.; Chen, Y.M.; Li, S.Y.; Wang, S.J.; Pei, F.S. A future land use simulation model (FLUS) for simulating multiple land use scenarios by coupling human and natural effects. Landsc. Urban Plan. 2017, 168, 94–116. [Google Scholar] [CrossRef]
  35. Khosravi, K.; Shahabi, H.; Pham, B.T.; Adamowski, J.; Shirzadi, A.; Pradhan, B.; Dou, J.; Ly, H.B.; Gróf, G.; Ho, H.L.; et al. A comparative assessment of flood susceptibility modeling using Multi-Criteria Decision-Making Analysis and Machine Learning Methods. J. Hydrol. 2019, 573, 311–323. [Google Scholar] [CrossRef]
  36. Liu, R.; Chen, Y.; Wu, J.P.; Gao, L.; Barrett, D.; Xu, T.B.; Li, L.Y.; Huang, C.; Yu, J. Assessing spatial likelihood of flooding hazard using naïve Bayes and GIS: A case study in Bowen Basin, Australia. Stoch. Environ. Res. Risk Assess. 2016, 30, 1575–1590. [Google Scholar] [CrossRef]
  37. Liang, X.; Guan, Q.F.; Clarke, K.C.; Liu, S.S.; Wang, B.Y.; Yao, Y. Understanding the drivers of sustainable land expansion using a patch-generating land use simulation (PLUS) model: A case study in Wuhan, China. Comput. Environ. Urban Syst. 2021, 85, 101569. [Google Scholar] [CrossRef]
  38. Wang, Z.Y.; Li, X.; Mao, Y.T.; Li, L.; Wang, X.R.; Lin, Q. Dynamic simulation of land use change and assessment of carbon storage based on climate change scenarios at the city level: A case study of Bortala, China. Ecol. Indic. 2022, 134, 108499. [Google Scholar] [CrossRef]
  39. Schielein, J.; Miranda, J.; de Souza, R.A.; Boerner, J.; Henderson, J. The role of accessibility for land use and land cover change in the Brazilian Amazon. Appl. Geogr. 2021, 132, 102419. [Google Scholar] [CrossRef]
  40. Jing, C.; Su, B.D.; Zhai, J.Q.; Wang, Y.J.; Lin, Q.G.; Gao, M.N.; Jiang, S.; Chen, Z.Y.; Jiang, T. Gridded value-added of primary, secondary and tertiary industries in China under Shard Socioeconomic Pathways. Sci. Data 2022, 9, 309. [Google Scholar] [CrossRef]
  41. Wang, X.Y.; Meng, X.F.; Long, Y. Projecting 1 km-grid population distributions from 2020 to 2100 globally under shared socioeconomic pathways. Sci. Data 2022, 9, 563. [Google Scholar] [CrossRef]
  42. Chou, J.M.; Sun, M.Y.; Dong, W.J.; Zhao, W.X.; Li, J.N.; Li, Y.M.; Zhou, J.Y. Assessment and Prediction of Climate Risks in Three Major Urban Agglomerations of Eastern China. Sustainability 2021, 13, 13037. [Google Scholar] [CrossRef]
  43. Li, J.Y.; Chen, X.; Kurban, A.; Van de Voorde, T.; De Maeyer, P.; Zhang, C. Coupled SSPs-RCPs scenarios to project the future dynamic variations of water-soil-carbon-biodiversity services in Central Asia. Ecol. Indic. 2021, 129, 107936. [Google Scholar] [CrossRef]
  44. Yuan, J.C.; Lin, Q.Y.; Chen, S.S.; Zhao, H.; Xie, X.; Cai, Z.Y.; Zhang, J.T.; Cheng, T.T.; Hua, M.; Zhang, R.H. Influence of global warming and urbanization on regional climate of Megacity: A case study of Chengdu, China. Urban Clim. 2022, 44, 101227. [Google Scholar] [CrossRef]
  45. Wei, H.B.; Zhang, L.Y.; Liu, J. Hydrodynamic Modelling and Flood Risk Analysis of Urban Catchments under Multiple Scenarios: A Case Study of Dongfeng Canal District, Zhengzhou. Int. J. Environ. Res. Public Health 2022, 19, 14630. [Google Scholar] [CrossRef]
  46. Doelman, J.C.; Stehfest, E.; Tabeau, A.; van Meijl, H.; Lassaletta, L.; Gernaat, D.; Hermans, K.; Harmsen, M.; Daioglou, V.; Biemans, H.; et al. Exploring SSP land-use dynamics using the IMAGE model: Regional and gridded scenarios of land-use change and land-based climate change mitigation. Glob. Environ. Change-Hum. Policy Dimens. 2018, 48, 119–135. [Google Scholar] [CrossRef]
  47. He, S.T.; Wang, D.J.; Zhao, P.; Chen, W.L.; Li, Y.; Chen, X.Q.; Jamali, A.A. Dynamic simulation of debris flow waste-shoal land use based on an integrated system dynamics-geographic information systems model. Land Degrad. Dev. 2022, 33, 2062–2075. [Google Scholar] [CrossRef]
  48. Wang, M.; Chen, F.R.; Zhang, D.Q.; Chen, Z.J.; Su, J.; Zhou, S.Q.; Li, J.J.; Chen, J.T.; Li, J.Y.; Tan, S.K. Data-driven approach to spatiotemporal dynamic risk assessment of urban flooding based on shared socio-economic pathways. Ecol. Indic. 2023, 154, 110764. [Google Scholar] [CrossRef]
  49. Yamashita, Y.; Sugawa, S. Power Efficiency Figure of Merit for Image Sensors. Ieee Trans. Electron Devices 2019, 66, 512–517. [Google Scholar] [CrossRef]
  50. Sui, C.H.; Tian, Y.; Xu, Y.P.; Xie, Y. Unsupervised Band Selection by Integrating the Overall Accuracy and Redundancy. IEEE Geosci. Remote Sens. Lett. 2015, 12, 185–189. [Google Scholar]
  51. Zhou, S.; Liu, Z.; Wang, M.; Gan, W.; Zhao, Z.; Wu, Z. Impacts of building configurations on urban stormwater management at a block scale using XGBoost. Sustain. Cities Soc. 2022, 87, 104235. [Google Scholar] [CrossRef]
  52. Wang, M.; Li, Y.; Yuan, H.; Zhou, S.; Wang, Y.; Ikram, R.M.A.; Li, J. An XGBoost-SHAP approach to quantifying morphological impact on urban flooding susceptibility. Ecol. Indic. 2023, 156, 111137. [Google Scholar] [CrossRef]
  53. Wang, M.; Fu, X.; Zhang, D.; Chen, F.; Liu, M.; Zhou, S.; Su, J.; Tan, S.K. Assessing urban flooding risk in response to climate change and urbanization based on shared socio-economic pathways. Sci. Total Environ. 2023, 880, 163470. [Google Scholar] [CrossRef] [PubMed]
  54. Halecki, W.; Mlynski, D. Urban flood dilemmas: How European cities growth shapes flood risk and resilience strategies? J. Environ. Manag. 2025, 374, 124161. [Google Scholar] [CrossRef]
  55. Seleem, O.; Heistermann, M.; Bronstert, A. Efficient Hazard Assessment for Pluvial Floods in Urban Environments: A Benchmarking Case Study for the City of Berlin, Germany. Water 2021, 13, 2476. [Google Scholar] [CrossRef]
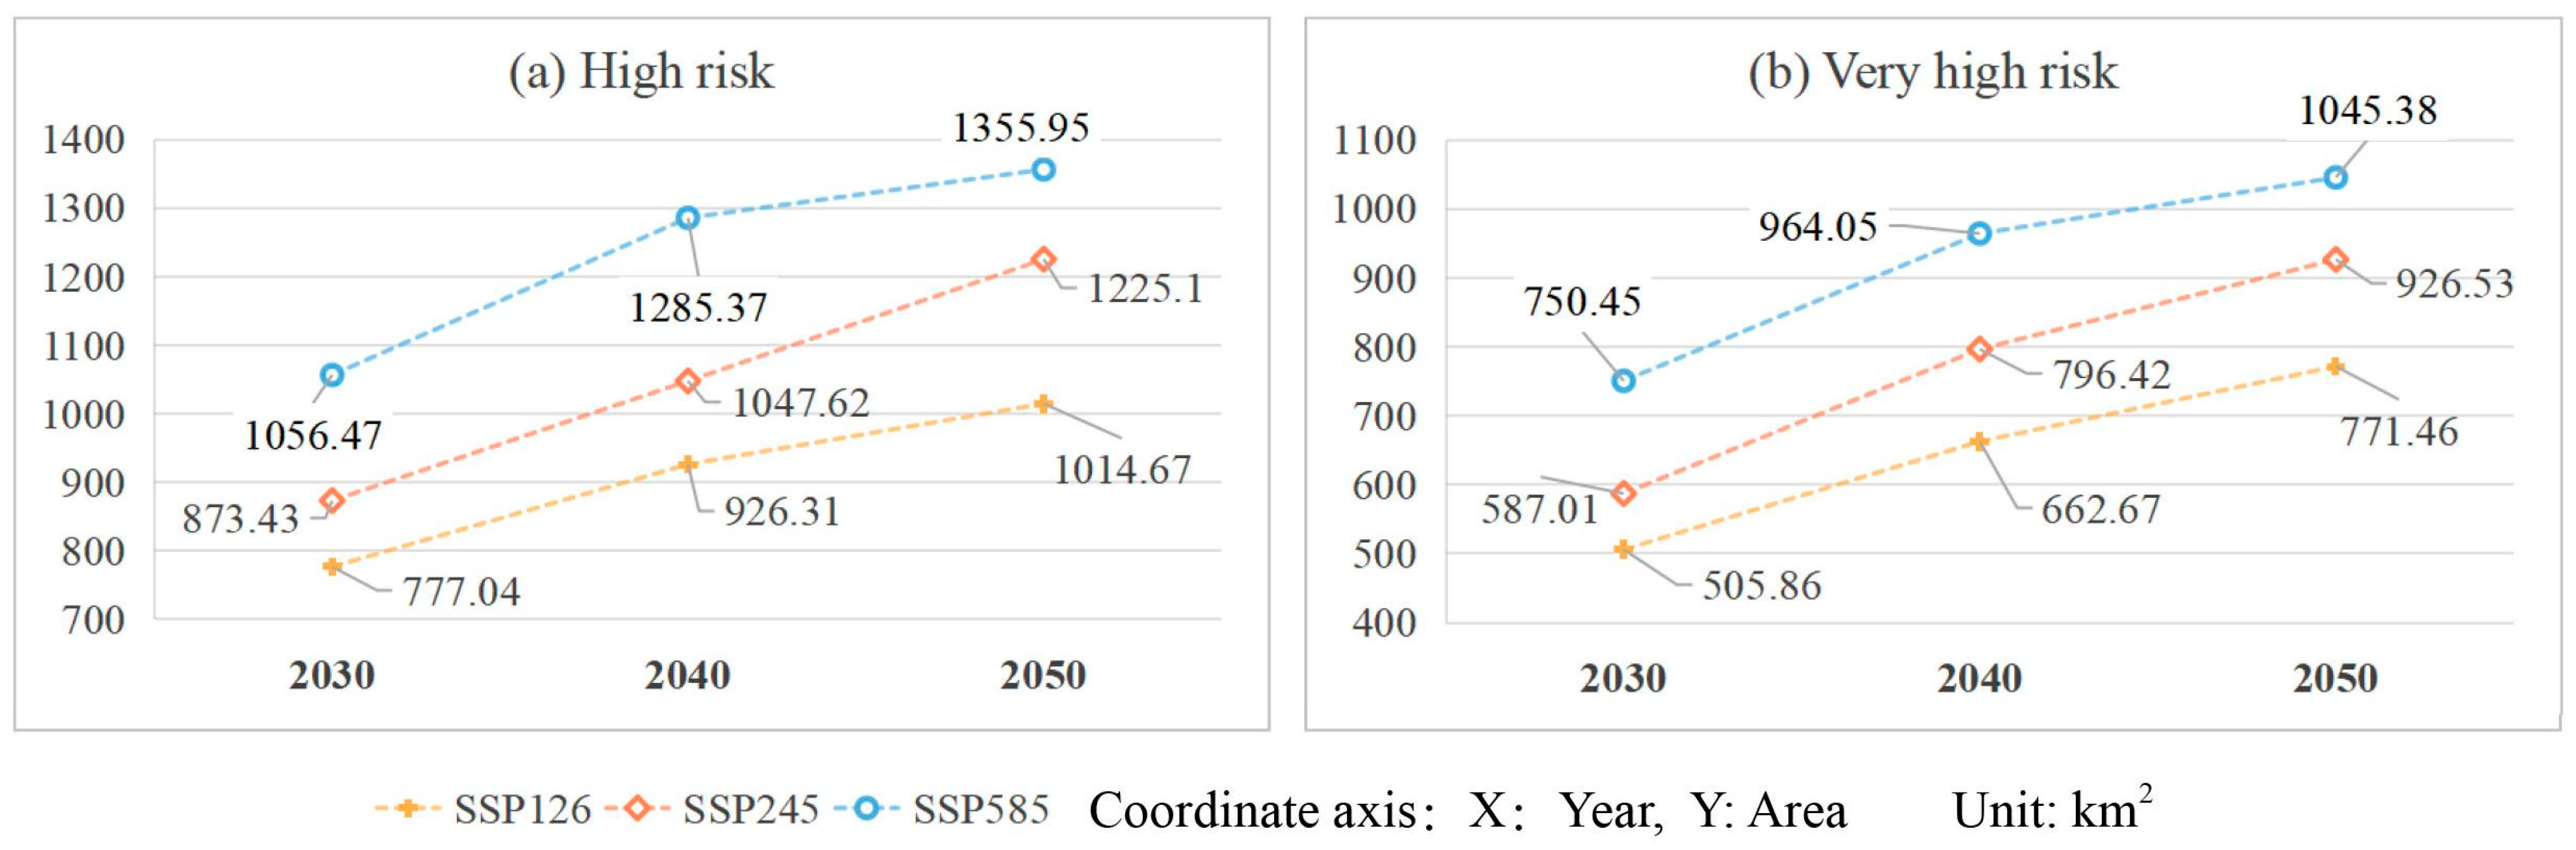
Figure 1. Study area (Guangzhou, China).
Land 14 00621 g001
Figure 2. The SD model’s causal feedback chart of LULC demand change in Guangzhou.
Land 14 00621 g002
Figure 3. Changes of land use demand in 2030–2050 in Guangzhou, China.
Land 14 00621 g003
Figure 4. The spatio-temporal changes in future urbanization in Guangzhou, China. (a,d,g) represents the spatio-temporal changes in future urbanization under a sustainable development scenario; (b,e,h) denotes the spatio-temporal changes in future urbanization under a moderate development scenario; (c,f,i) denotes the spatio-temporal changes in future urbanization under a conventional development scenario.
Land 14 00621 g004
Figure 5. Changes in urban flood susceptibility in 2030–2050 in Guangzhou, China.
Land 14 00621 g005
Figure 6. The spatio-temporal changes in urban flood susceptibility in Guangzhou, China. (a,d,g) represents the spatio-temporal changes in urban flood susceptibility under a sustainable development scenario; (b,e,h) denotes the spatio-temporal changes in urban flood susceptibility under a moderate development scenario; (c,f,i) denotes the spatio-temporal changes in urban flood susceptibility under a conventional development scenario.
Land 14 00621 g006
Table 2. Changes in urban flood susceptibility in 2030–2050 in Guangzhou, China.
ClassVery LowLowMediumHighVery High
Risk range0–0.030.03–0.20.20–0.450.45–0.8>0.8
km2%km2%km2%km2%km2%
SSP126-20302907.570.441570.850.24883.140.13777.040.12505.860.08
SSP245-20302788.560.421402.350.21993.110.15873.430.13587.010.09
SSP585-20302504.860.381250.390.191082.280.161056.470.16750.450.11
SSP126-20402714.170.411355.510.20985.800.15926.310.14662.670.10
SSP245-20402460.620.371245.790.191094.010.161047.620.16796.420.12
SSP585-20401961.450.301176.110.181257.480.191285.370.19964.050.15
SSP126-20502650.450.401197.380.181010.500.151014.670.15771.460.12
SSP245-20502126.360.321185.920.181180.550.181225.100.18926.530.14
SSP585-20501821.130.271134.080.171287.910.191355.950.201045.380.16
Disclaimer/Publisher’s Note: The statements, opinions and data contained in all publications are solely those of the individual author(s) and contributor(s) and not of MDPI and/or the editor(s). MDPI and/or the editor(s) disclaim responsibility for any injury to people or property resulting from any ideas, methods, instructions or products referred to in the content.

