Article

Dynamics of Ecosystem Services Driven by Land Use Change Under Natural and Anthropogenic Driving Trajectories in the Kaduna River Basin, Nigeria

1
School of Geographical Sciences, Hebei Normal University, Nan’erhuan East Road No. 20, Shijiazhuang 050024, China
2
School of Environment, Beijing Normal University, Xinjiekouwai Street No. 19, Beijing 100875, China
3
Key Laboratory of Spatial Data Mining and Information Sharing of Ministry of Education, Fuzhou University, Xueyuan Road No. 2, Fuzhou 350108, China
4
Shandong Key Laboratory of Eco-Environmental Science for the Yellow River Delta, Shandong University of Aeronautics, Binzhou 256600, China
*
Author to whom correspondence should be addressed.
Land 2025, 14(4), 706; https://doi.org/10.3390/land14040706
Submission received: 12 February 2025 / Revised: 24 March 2025 / Accepted: 24 March 2025 / Published: 26 March 2025
(This article belongs to the Section Land Planning and Landscape Architecture)

Abstract

:
Land use changes under natural and anthropogenic driving factors have spatiotemporal ecological consequences, and these need to be identified to protect biodiversity and the robustness of ecosystems. While driving factor research has mainly focused on the impacts of univariate statistical correlation, the analysis of the natural and anthropogenic compound driving factors and the spatiotemporal correspondence between the dynamic characteristics of ecological function evolution and the natural and anthropogenic driving processes has been ignored. On the basis of land use change, spatiotemporal ecosystem services and natural and anthropogenic driving process trajectories were linked and characterized in this study. In the Kaduna River Basin (KRB), Nigeria, an important river basin the country, land use change during 2000–2020 caused by both natural and anthropogenic processes significantly changed the ecosystem services. The single anthropogenic driving trajectories were 1.3 times greater than the single natural driving trajectories and 2.02 times greater than the compound driving trajectories. Carbon storage has increased by 15.6% (8.5 × 10⁶ t) and is growing at a decreasing rate, whereas urbanization and reverse succession are the main drivers of carbon stock decline. Water yield has steadily increased but is threatened by the decline induced by restoration, reverse succession, and urbanization. Habitat quality initially increased (0.03) but then decreased (0.01), with urbanization and reclamation being the main drivers of its degradation throughout the study period. This study integrates land use, driving processes, and ecosystem services into a cohesive analytical framework, thereby overcoming the limitations of previous research that examined land use in conjunction with each of the other two elements separately. New developments and methodological steps in watershed management can indicate directions to reconcile and mitigate the conflict between socioeconomic growth and improved ecological functioning in watershed ecosystems.

1. Introduction

Land use is a comprehensive representation of human activities and natural resources [1,2]. Land use change reshapes natural landscapes, modifies Earth system functionality [3,4], and has influenced approximately one-third of the worldwide land area in just six decades [5]. Land use change is a crucial component of current strategies for monitoring environmental changes and managing natural resources [6,7,8]. Rapid changes in land use, especially in developing countries [9], such as China [10], Ethiopia [11], and Nigeria [12], have caused a reduction in various vital resources [13].
Global land use changes can affect a wide range of ecosystem services at multiple scales [14,15]. Furthermore, river basin watershed ecosystems are among the world’s most valuable ecosystems, contributing significantly to biodiversity, vital ecological functions, and significant socioeconomic advantages [16]. However, many terrestrial, freshwater and estuarine ecosystems in river basins have experienced accelerated loss and degradation due to the combined impacts of more severe anthropogenic and natural disruptions in recent decades globally [17,18]. Understanding the ecological consequences of land use changes under anthropogenic and natural driving factors (e.g., GDP, population, temperature, precipitation, succession, reclamation) is essential for sustainable biodiversity and ecosystem services [19,20].
Natural alterations and anthropogenic disturbances drive the degradation of river basins and the loss of valuable ecosystem services [21,22]. The driving factors, land use changes, and responses of critical ecological functions may reveal the linkages between river basins and land reclamation in great detail [23,24]. Current research has focused primarily on the driving factors of ecological function or land use change, as well as the relationship between ecological function and land use [4]. Moreover, driving factor research has mainly focused on the impacts of climate, terrain, population, and economic indicators and has been implemented mostly by geographical detectors or multiple regression analyses, such as the least squares method (OLS), geographically weighted regression (GWR), and spatiotemporal geographically weighted regression (GTWR). These methods, which are based on univariate statistical correlation, ignore the analysis of the natural and anthropogenic compound driving factors [25] and the spatiotemporal correspondence between the dynamic characteristics of ecological function or landscape pattern evolution and the natural and anthropogenic driving processes. Furthermore, these studies do not consider how changes in land use patterns caused by driving factors affect ecological functioning [26].
The direction (i.e., from land use A to B) and magnitude (i.e., the area of land conversion) of land use change processes at spatiotemporal scales that are driven by nature and humans can represent the driving process [18,27,28]. Studies have highlighted the evidence and measurements of spatiotemporal changes in land use [29,30,31]. In addition, previous studies have examined land use changes over time [32,33]. However, it may be advantageous to clarify their gains and losses over the entire study period by considering the accumulated changes in land use types across all periods [34]. The interplay between ecological protection and socioeconomic growth can be better understood by analyzing how ecosystem services in river basins respond to spatiotemporal driving processes [35]. However, the majority of recent research has concentrated on how changes in land use affect ecosystem services during each period [36]. Some studies have focused on more features reflected in the trajectory of land use transfer [10,37]. It is unclear how the trajectory of land use change affects the spatiotemporal dynamics of ecosystem services and how they are related to underlying natural and anthropogenic driving processes [18].
This study aims to reveal the ecological functional response of the natural–human compound driving factors under continuous land use change by quantifying and separating the contributions of different types of anthropogenic activities and natural processes. Studies have shown the effectiveness of spaceborne imagery in monitoring and assessing the ecological impacts of land use changes worldwide [38], including studies in western Africa (Ghana) [39], northern Africa (Egypt) [40], and central Africa (Rwanda) [41]. In Nigeria, river basin watershed ecosystems, as vital food-centered agricultural areas supporting more than half of Nigeria’s maize production, have experienced rapid population growth and significantly accelerated urbanization. Okeleye et al. [42] and Awoniran et al. [43] investigated land use changes and their impacts on ecosystem services. Fasona et al. [44] and Odiji et al. [45] investigated specific drivers of land use changes and policy challenges. However, previous research that examined land use in conjunction with driving factors and ecological functions separately has limitations, resulting in gaps in the understanding of the drivers of land use changes and their associated ecological impacts. For that reason, we used the Kaduna River Basin (KRB) in Nigeria, the largest population and economic entity in Africa, as a case study. In this context, the study focuses on (1) identifying the driving process of land use change and mapping the driving process trajectory on the basis of the land use change trajectory; (2) measuring important ecological functions of the region (e.g., water yield, carbon storage and habitat quality); and (3) linking and characterizing the temporal–spatial ecosystem services and natural-anthropogenic driving process trajectories. Although the scope of this study is limited to the KRB, the methodology is applicable to national and global contexts.

2. Materials and Methods

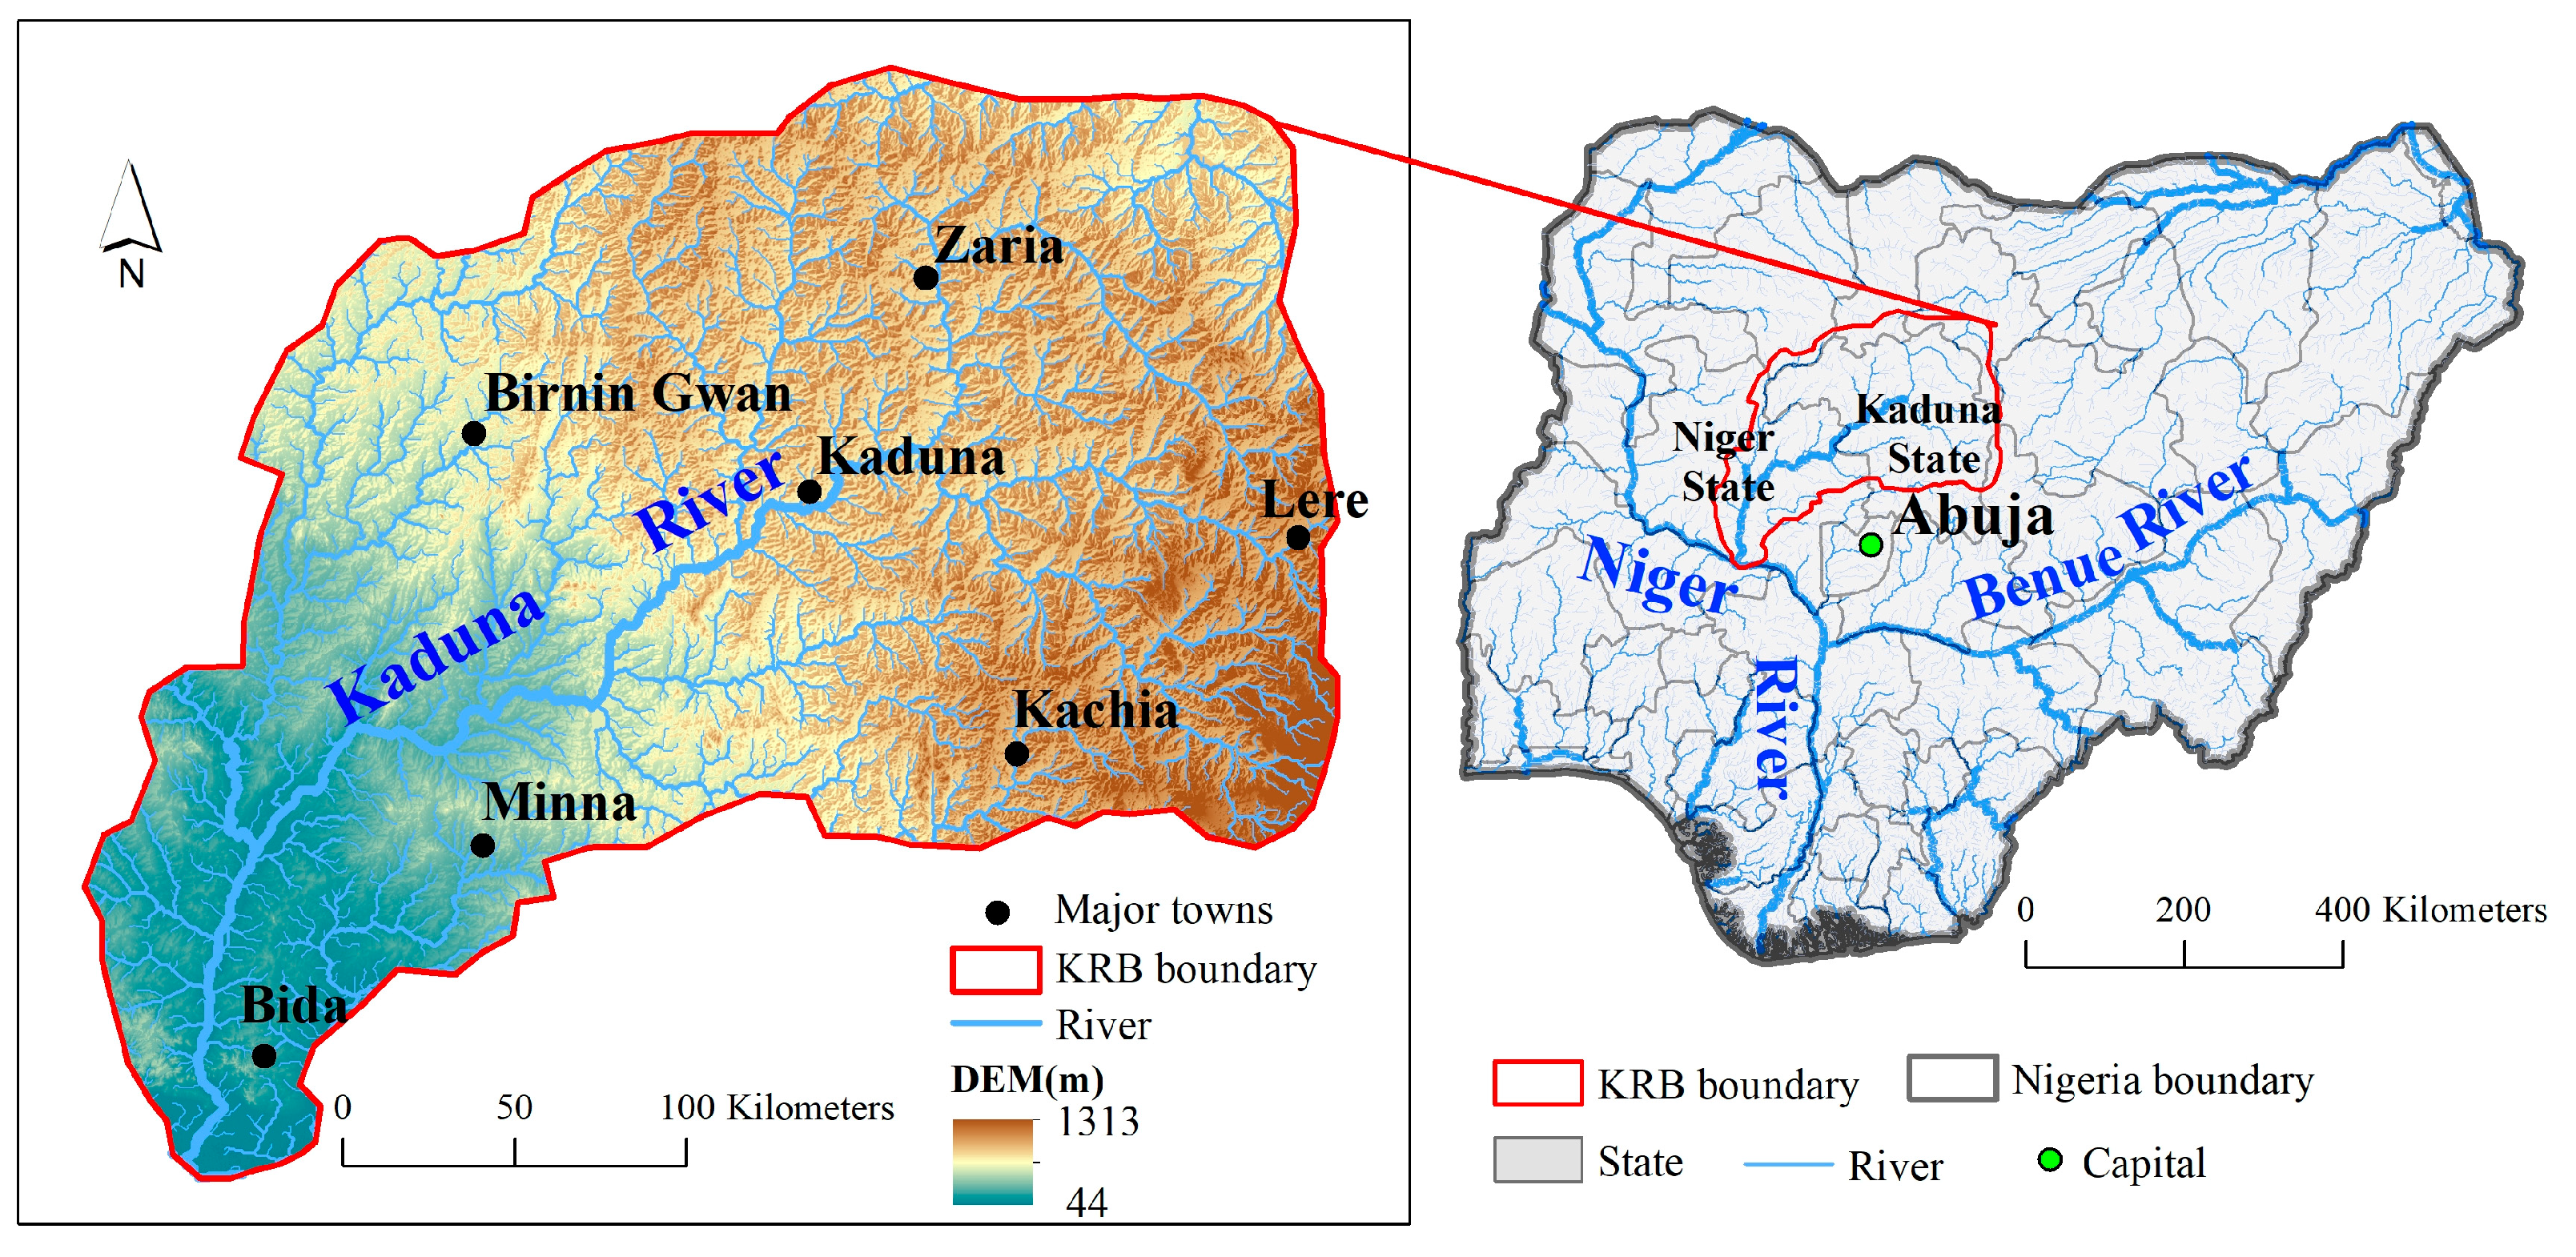
2.1. Study Area and Materials

Formed by the main tributary (the Kaduna River) of the Niger River, the Mother River of Nigeria and the third longest river of Africa, the KRB has become one of the most important river basins in West Africa. The KRB spans the Guinea and Sudanese Savannah ecoregions, with absolute positions of 8°45′15″—11°40′5″ N and 5°25′48″—8°45′36″ E. Most of the KRB is in Kaduna State (Figure 1). The Kaduna River originates in the Shere Mountains in Plateau State and mainly runs through open tropical savanna woodland, flowing through different topographic and geological zones to the northwest. The tropical continental climate is most common in the basin. During the rainy season, many places are vulnerable to seasonal flooding. The KRB supports various activities, including fishing and industry, and hosts numerous wildlife habitats, which contribute to an important river basin in the country. However, owing to industrial development and resource exploitation in Nigeria in recent decades, the basin is at great risk of destruction of ecosystem services, serious environmental pollution, and persistent drought for agricultural and hydrological drought hazards [46]. The study area, which is the drainage basin for the Kaduna River, does not cover the entire basin, covering an area of 65,878 km2. We delineated its boundary using the river basin dataset from the HydroSHEDS website (https://www.hydrosheds.org/ (accessed on 20 February 2025)) and referred to relevant literature [47].
In this study, the following data were used: (1) GLC30 data from 2000, 2010 and 2020 were used to track the spatiotemporal spatial distribution of land use (https://www.webmap.cn/mapDataAction.do?method=globalLandCover (accessed on 24 March 2025)). The GLC30 dataset refers to the GlobeLand30 dataset, a global land cover dataset with a 30 m spatial resolution developed under China’s National High-Technology Research and Development Program (the 863 Program). The data product uses a sampling model for accuracy assessment. This involves selecting a subset of global data frames, deploying numerous validation samples, and calculating metrics. The overall accuracy and kappa coefficients for the GlobeLand30 data are as follows: 80.33% and 0.76 for V2000, 83.50% and 0.78 for V2010, and 85.72% and 0.82 for V2020. The land uses were reclassified into six classes (Table 1). (2) Meteorological data from the Nigerian Meteorological Agency and the Worldclim website (http://www.worldclim.org (accessed on 20 February 2025)) were used to determine the temperature, precipitation, and total solar radiation in the KRB. (3) The DEM (30 m) for the KRB was obtained from NASA (https://asterweb.jpl.nasa.gov/gdem.asp (accessed on 20 February 2025)).

2.2. Modeling and Mapping Ecosystem Services

The InVEST 10.6 model uses maps as information sources and outputs for spatially explicit expression. In this research, we used ecosystem services as proxies for the ecological impacts of the land use change process and identified three key ecosystem services: carbon storage, water yield, and habitat quality [48].
(1)
Carbon storage.
Generally, carbon storage consists of above- and belowground biomass, dead matter and soil organic matter.
C i = C a b o v e + C b e l o w + C s o i l + C d e a d
where C i (t/hm2) is the total carbon density of land use type i, C a b o v e is the aboveground carbon density, C b e l o w is the belowground carbon density, C s o i l is the soil organic carbon density, and C d e a d is the dead organic matter. The carbon density parameters of the four carbon pools (Table 1) refer to the Global Leaf Area Index in the Resource and Environment Data Center of the Chinese Academy of Sciences (https://www.resdc.cn/ (accessed on 20 February 2025)) and wetland carbon pools in [18]. Given the variation in soil organic carbon content across different climate zones [49], the soil carbon storage data used in this study were determined on the basis of the local climate conditions in Nigeria. Additionally, we validated the accuracy of our data by cross-referencing it with the literature, particularly that of [50]. This study revealed that carbon storage in Nigeria ranges from 0 to 408 t/hm2.
(2)
Water yield.
The surface water yield contributions of each watershed were estimated via the InVEST 10.6 model.
Y ( x ) = 1 A E T x P x × P ( x )
where x is the grid cell, Y ( x ) is the annual water yield (mm), P(x) is the annual precipitation, and AET(x) is the actual evapotranspiration. The input data utilized in the model include land use distribution, precipitation distribution, potential evapotranspiration calculated via the FAO Penman–Monteith method, and the vegetation evapotranspiration coefficient table determined with reference to the user manual.
(3)
Habitat quality.
The InVEST 10.6 model calculates a relative value (i.e., from 0 to 1), known as the habitat quality index, on the basis of habitat suitability, distance, and sensitivity of the habitat to threats, where higher values indicate better habitat conditions. In previous studies [51,52], the threat factor weights, maximum threat distances, habitat suitability scores, and sensitivity of each habitat type to the threat factors were determined, as shown in Table 2 and Table 3. Specifically, farmlands, grasslands, forests, and wetlands provide abundant food resources and have high species adaptability [53,54]. The principle for setting habitat sensitivity values is that the higher the sensitivity is, the more easily the area is disturbed by human activities and the slower its recovery rate.

2.3. Mapping Continuous Land Use Change and Driving Process Trajectories

According to the spatiotemporal dynamic characteristics of the compound drive, a method was established to study the driving process trajectory of land use change. A conceptual diagram of the driving process trajectory in the T1, T2, and T3 periods is shown in Figure 2. To analyze the process of each driver’s influence on the region from the spatial scale, the driving process of land use change can be characterized by their attributes and spatial associations. Attribute association refers to the identification of the driving process type. By comparing the initial and endpoint land use types, the six corresponding driving processes during a given period (2000–2010/2010–2020) can be interpreted, as shown in Table 4 [10,18]. These processes (Table 4) may include ecosystem succession (e.g., from grassland via shrub to forest), reverse succession (e.g., from forest via shrub to grassland), reclamation (from forest/shrub/grassland/wetland to cultivated land), urbanization (from forest/shrubland/wetland to constructed land) and restoration (from cultivated land to forest/shrub/wetland). The cause-and-effect links within the land use changes were used to identify the potential anthropogenic and natural driving processes [18,55,56,57].
Then, the map algebra tool in ArcGIS was used to obtain the spatial pattern of continuous land use change over successive decades (i.e., 2000 to 2010 and 2010 to 2020), and the corresponding spatial distribution pattern of the driving process was obtained to achieve spatial association. Finally, they were overlaid to observe and pursue the continuous change trajectory of land use and driving process throughout the study period.

3. Results

3.1. Changes in the Spatial Distribution of Land Use

As shown in Figure 3, the land use distribution map for each year indicates that bare land is located primarily in the west. By 2020, the bare land in the west had been converted into farmland and grassland. The forest is distributed mainly to the southeast of Kaduna city. Due to economic development, part of the forest was cut down so that the land in the area became bare in the later stage. The constructed land expanded from 2000 to 2020, with the towns of Bida and Zaria gradually becoming evident on the map. In addition, the area of wetlands is decreasing.
The changes in the area and proportion of each land use type indicate a considerable increase in agricultural activities in the region (Table 5). Grassland, which covered 39.61% and 40.56% of the total area in 2000 and 2010, respectively, experienced a minor change during this period; this could be due to less conversion of grassland to farmland. However, from 2010 to 2020, the area of grassland declined rapidly, and a large area of grassland was converted to farmland. The amount of bare soil has decreased as it has been converted to either farmland or naturally turned into grassland, which transformed from 21.53% in 2000 to 10.61% in 2010 and 9.26% in 2020. The constructed land area also changed slightly from 0.77% in 2000 to 1.12% in 2020.

3.2. Land Use Change Trajectories and Corresponding Driving Processes

The spatial data of land use change in the two periods from 2000 to 2020 were obtained through map algebra calculations (Figure 4a–c), and the spatial pattern of each driving process in the two periods was obtained according to the identification method in Table 1 (Figure 4). This study compares and statistically analyzes the annual change area of land use change under different driving processes in different periods (Figure 4d–f). From 2000 to 2010, succession (S) occurred mainly in bare land, reverse succession (Rs) occurred mainly in southeastern grasslands and forests, and reclamation (Rc) occurred in eastern grasslands. The KRB experienced extensive succession (S), followed by reclamation (Rc), reverse succession (Rs), restoration (Re) and urbanization (U). From 2010 to 2020, the driving process was mainly reclamation (Rc), which was widely distributed in the study area.
Restoration (Re) accounted for approximately 3.2 × 10⁵ hm2 during 2000–2010 and changed to approximately 1.5 × 10⁵ hm2 during 2010–2020, which represents a reasonable decrease. This suggests that the extent of restoration expansion decreased over the study period. The restoration of land abandoned after reclamation and development could involve anthropogenic or natural processes. Reclamation (Rc), on the other hand, increased from 7.7 × 10⁵ hm2 during 2000–2010 to 9.9 × 10⁵ hm2 during 2010–2020. This indicates that agricultural activities have had a greater impact on regional expansion. However, the urbanization (U) area was essentially the same in both periods, indicating that the urbanization trend was consistent and slow. Succession (S) decreased from 9.2 × 10⁵ hm2 during 2000–2010 to 2.3 × 10⁵ hm2 during 2010–2020. This may indicate a reduction in regions where simple to complex ecosystem succession occurs naturally. The natural succession-driven processes of the two periods also show less overlap, indicating that the transition from relatively complex to more complex ecosystems may be more challenging.

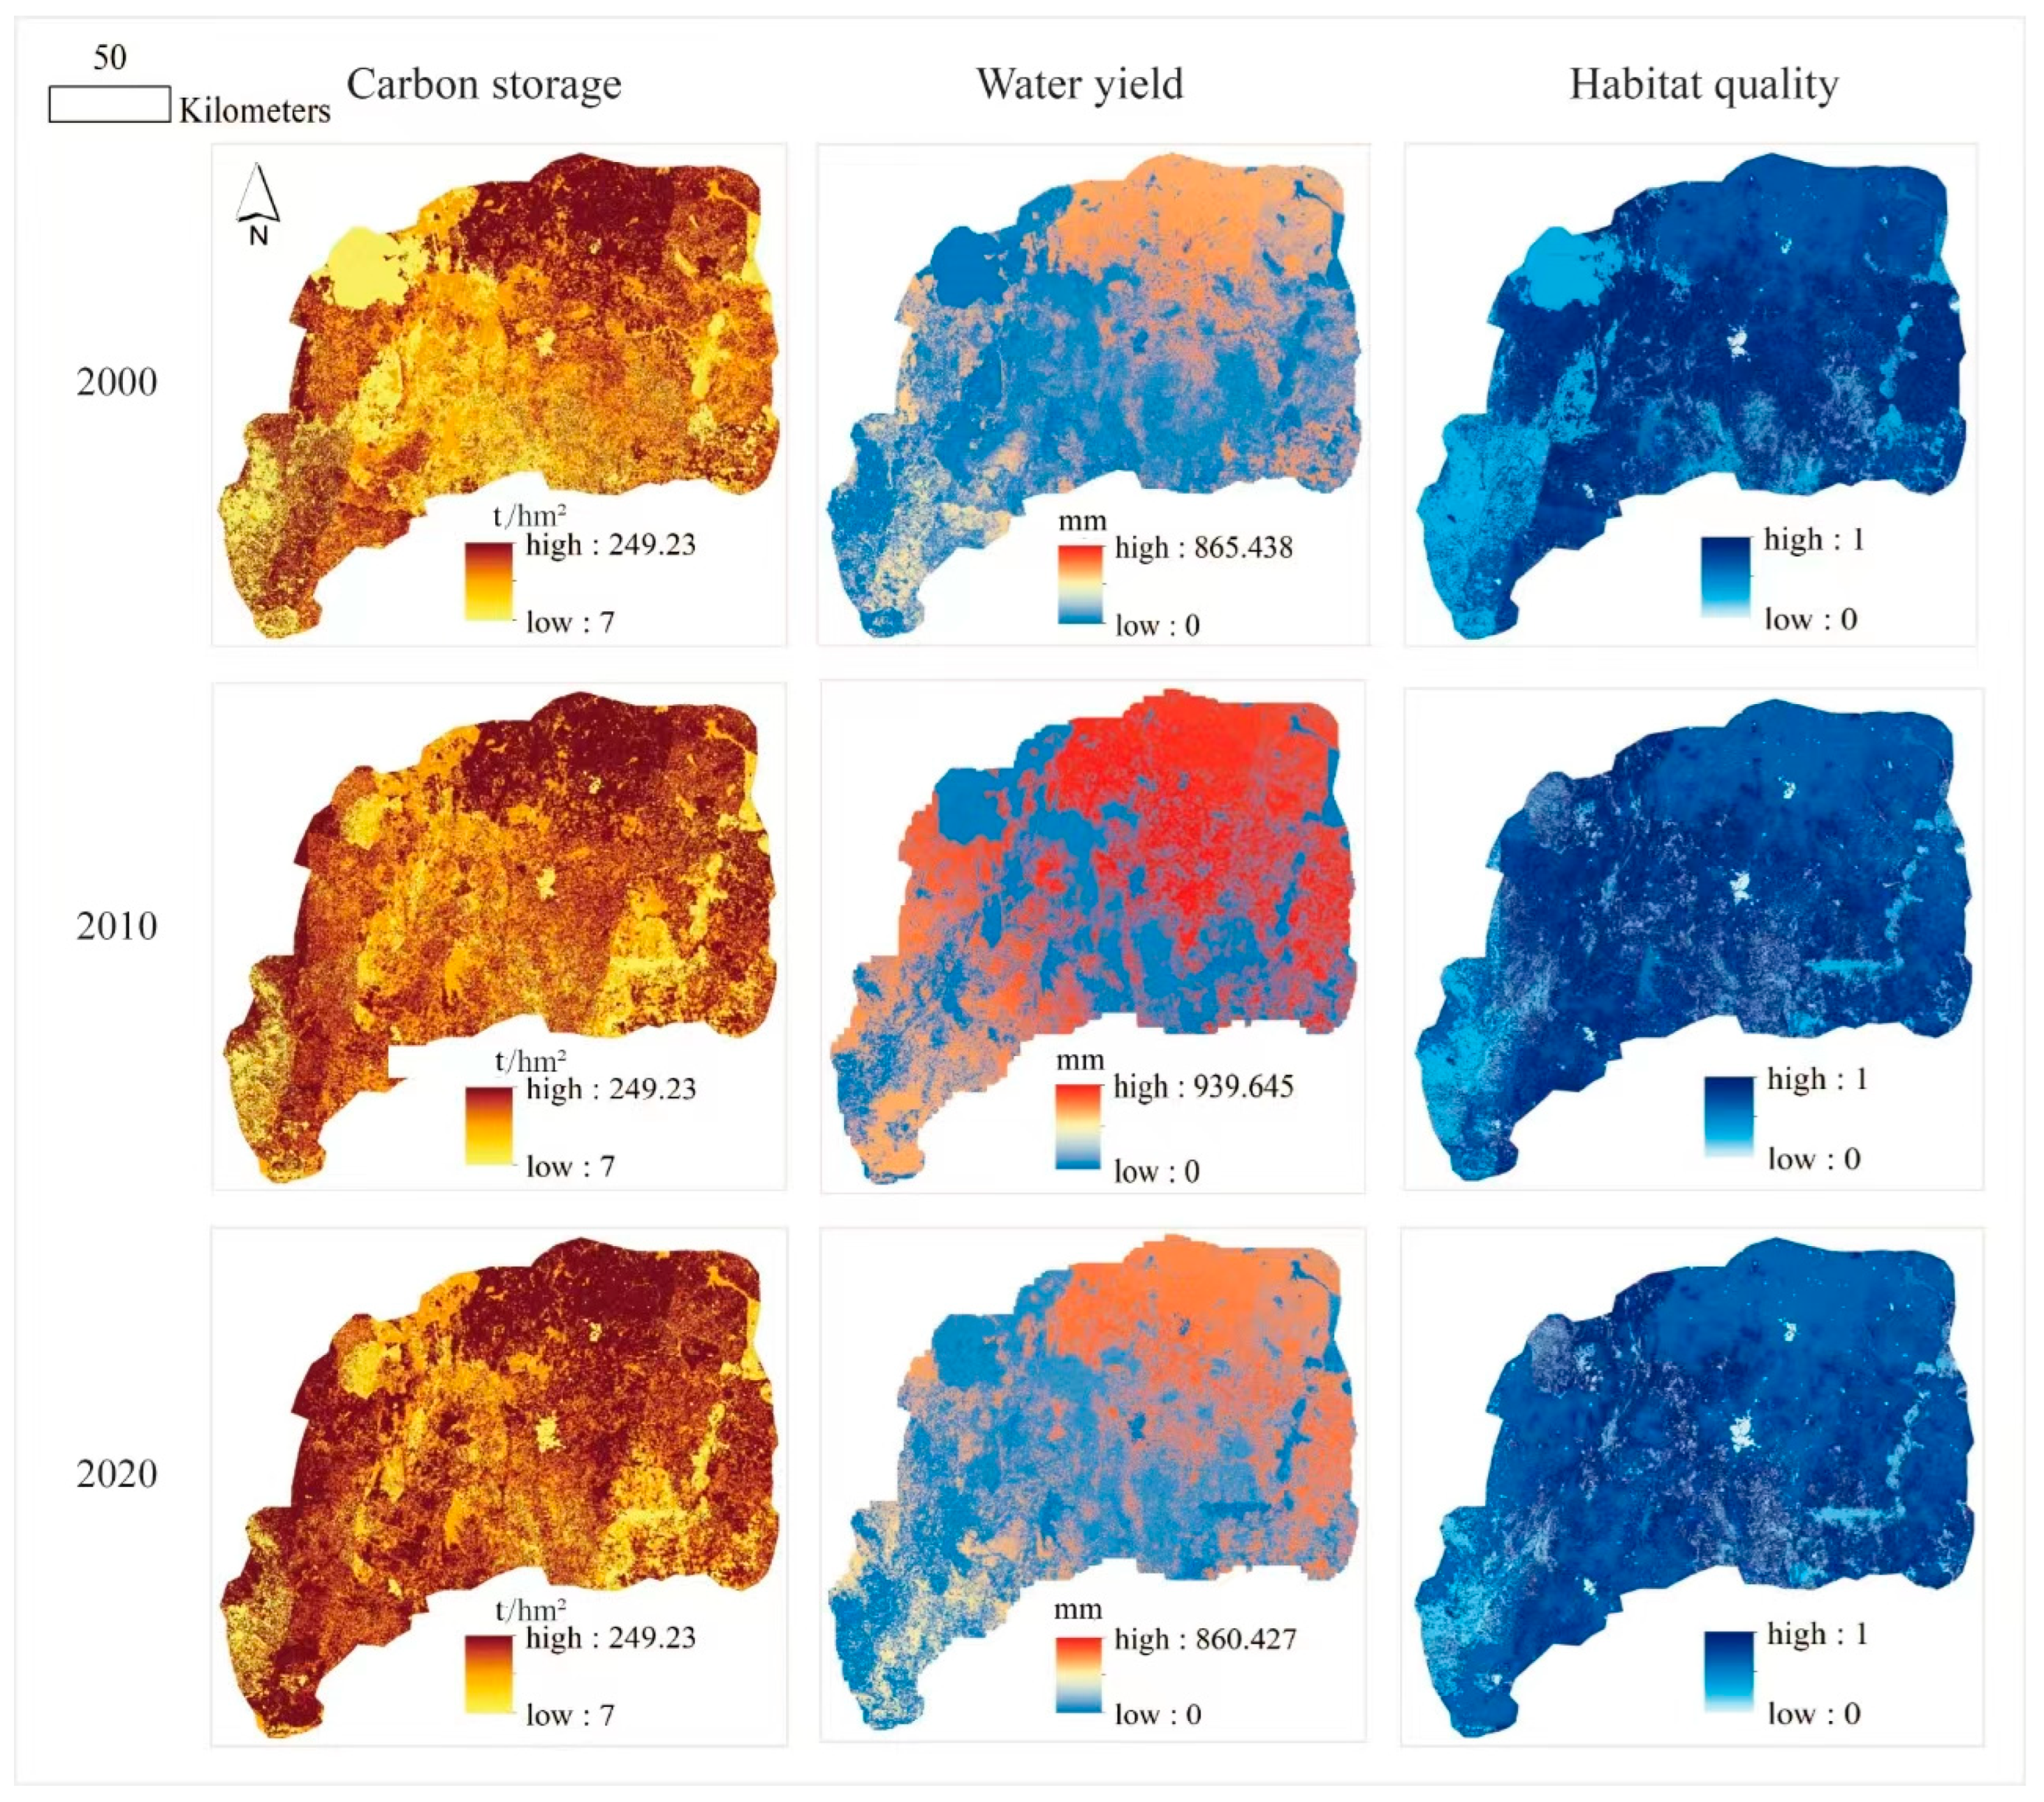
3.3. Spatiotemporal Dynamic Analysis of Ecosystem Services

(1)
Carbon storage.
The carbon storage in 2000, 2010, and 2020 were 54.4 × 10⁶, 62.5 × 10⁶ and 62.9 × 10⁶ t, respectively, showing a gradually increasing trend during 2000–2020, with the growth rate decreasing from 14.7% to 0.6%. Owing to the influence of soil and regional ecosystem differences, carbon storage clearly differed across regions (Figure 5). From 2000 to 2020, the area occupied by medium and high levels of carbon storage expanded. By 2020, 89% of the study area featured medium and high levels, and the low-level area was mainly bare soil and constructed land. High carbon storage is concentrated mainly in the northern part of Zaria town.
(2)
Water yield.
The water yields in 2000, 2010, and 2020 were 16.3 × 10⁹, 23.2 × 10⁹, and 30.2 × 10⁹ m3, respectively, indicating a steady increase. Owing to the influences of regional precipitation and land use, the maximum water supply significantly differed (Figure 5). The high supply was concentrated in the northeast. The medium supply was mainly distributed in Niger State. The high supply of this basin gradually expanded from the northeastern region in 2000 to the east-central area of the KRB, occupying 38.4% of the study area in 2020.
(3)
Habitat quality.
The average values of habitat quality in the KRB in 2000, 2010, and 2020 were 0.71, 0.74, and 0.73, respectively, indicating fluctuating changes. Habitat quality exhibits significant regional differences due to factors such as land use and biological adaptability (Figure 5). In 2000, the habitat quality in the western region was poorest, whereas that in the transverse middle of the basin was the best. The northwestern region improved in terms of habitat quality in 2010. Finally, there was a decrease in good habitat quality in the center in 2020, but the southwestern region experienced a shift from extremely low to medium habitat quality, with some areas still having low habitat quality.

4. Discussion

4.1. Driving Process Trajectories Under Natural and Anthropogenic Loads

The spatial distributions of the driving process trajectories involved in land use change in the KRB from 2000 to 2020 were obtained (Figure 6a). During the study period, the single driving trajectory was dominant, and the compound driving trajectories larger than 100,000 hm2 included SRc, ReRc, and SRs (Figure 6b). These three influential compound driving trajectories all correspond to the process of ecosystem improvement and subsequent degradation. The coastal wetland landscape change was driven by five types (Figure 6c); 41.52% of the land use change in the KRB was driven by anthropogenic factors, with 139.21 × 10⁴ hm2; 31.96% was driven by natural factors; 20.59% of the study area was driven by natural and anthropogenic compound factors from 2000 to 2020, resulting in an area of 68.98 × 10⁴ hm2; and multiple natural processes contributed the least, with an area of only 19.66 × 10⁴ hm2. In other words, the primary driver behind land use change in the KRB was the single anthropogenic driving trajectory, which was 1.3 times greater than the natural driving trajectory and 2.02 times greater than the compound driving trajectory.
The single driving trajectory with the greatest impact was reclamation (Rc). This finding indicates that anthropogenic activities were responsible for the changes in the affected areas. Nigeria is Africa’s most populous country, and its population is growing rapidly. It is projected to become the third-largest country in the world by 2050 [58]. The increasing population drives a higher demand for food, which in turn necessitates the expansion of arable land to meet this demand. Succession (S) and reverse succession (Rs) followed, indicating that the region has a good chance of progressing from simple to complex ecosystems through natural succession, that positive succession dominated by nature is stronger than degeneration, and that the region has a good self-healing ability.
These factors are followed by restoration (Re), which demonstrates that some ecological restoration projects have also been completed in this area, but the single restoration trajectory affects less than 1/6 of the reclamation area. A previous study recommended the creation of buffer zones around wetlands to prevent further encroachment [59]. The driving trajectory area of reclamation (Rc) after restoration (Re) is only slightly smaller than that of the single restoration trajectory, reflecting the region’s poor ecological restoration planning, thereby reducing the restoration effect. This has occurred despite the implementation of the Land Use Act here, with the introduction of a land use tax and an awareness of land use planning. Therefore, the restoration of damaged areas in the basin should meet both the needs of ecological protection and socioeconomic development. It is essential to maintain the integrity of river basin ecosystems and the continuity of habitat succession while considering economic benefits [52]. This study, which is based on a systematic and holistic approach, provides guidance for the construction and optimization of ecological security patterns at the regional scale.

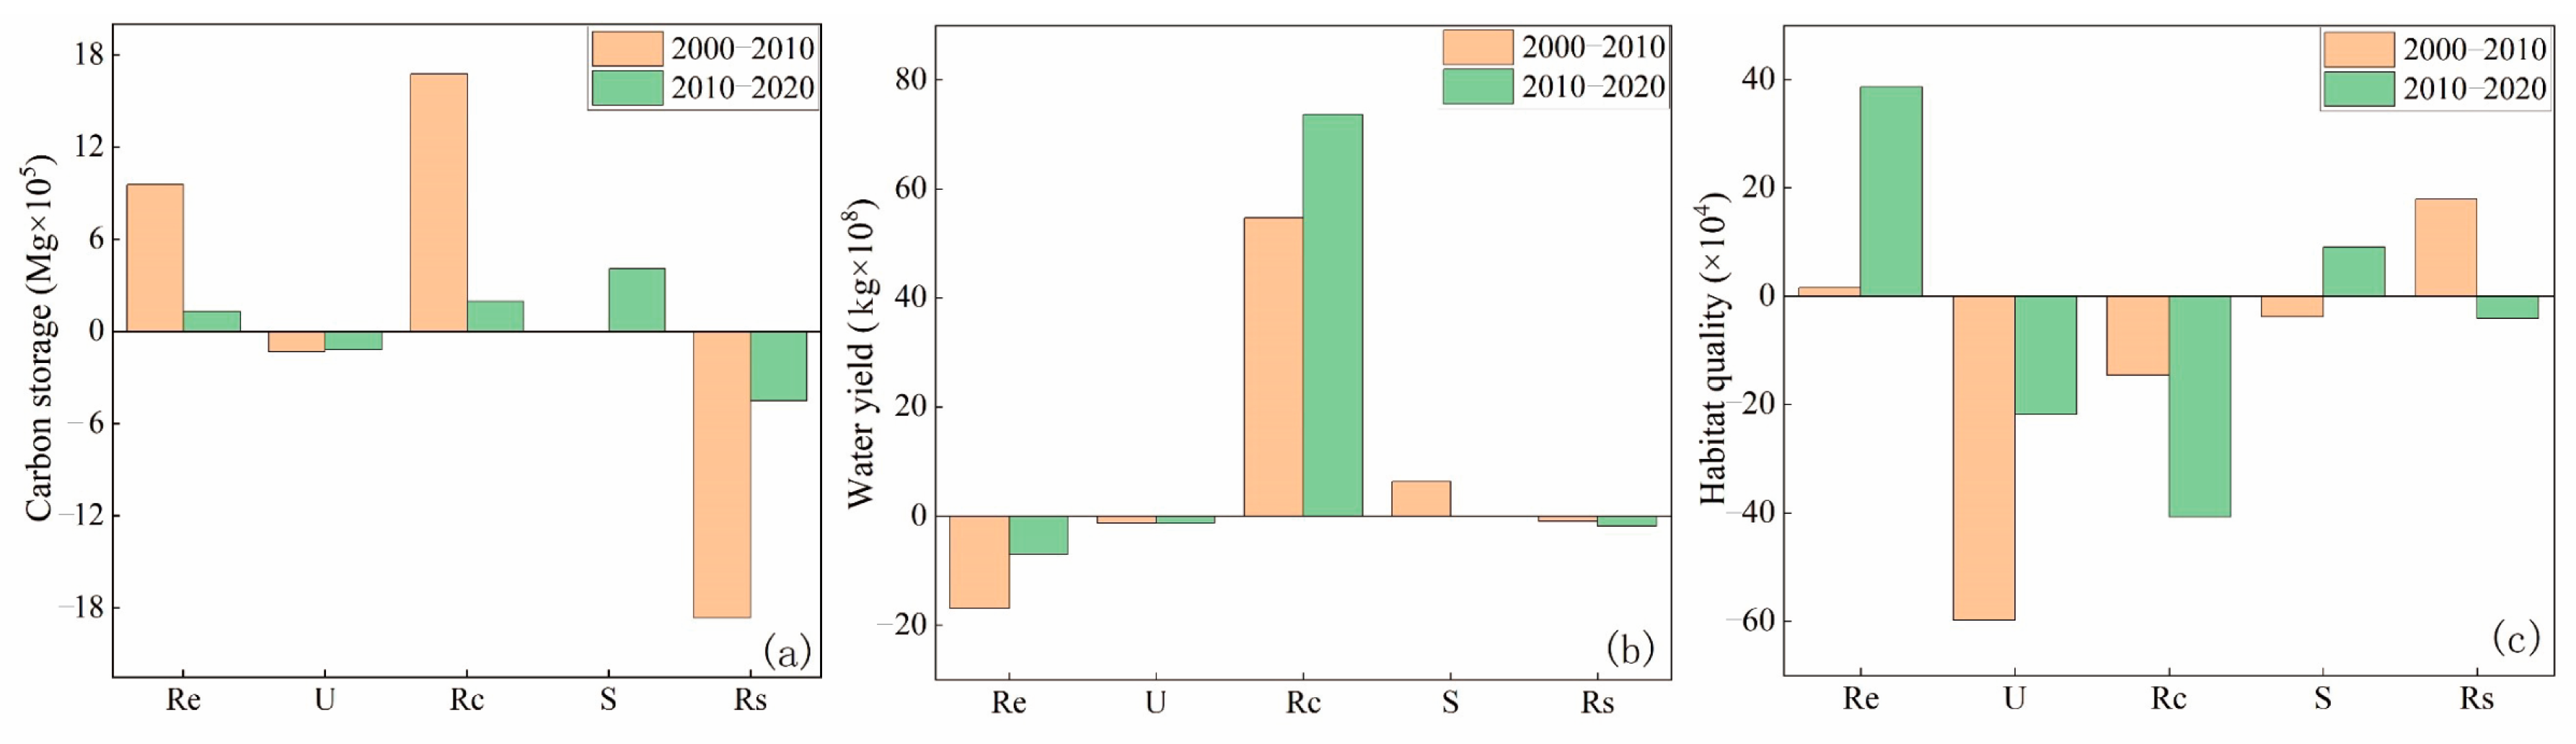
4.2. Gain or Loss of Ecosystem Services Under the Driving Process

The research approach of this study vividly portrays the continuous evolution of individual spatial landscape units over an extended duration, effectively capturing the dynamics of land use and ecosystem services [34]. To detect anthropogenic impacts on natural ecosystems, it is crucial to carefully examine the linkages between driving forces and ecosystem services according to the trajectory of land use change [28]. In particular, understanding the transformation process of ecosystem services under multiple drivers holds greater significance for river basins where anthropogenic and natural processes are usually complicated [23,60].
As shown in Figure 7, the main driving processes of carbon storage changes during 2000–2010 were reverse succession (Rs), reclamation (Rc), and restoration (Re). Among them, reverse succession (Rs), as the main factor of carbon storage reduction, resulted in a decrease of 1.86 × 10⁶ t. Reclamation (Rc) was one of the leading factors of carbon storage increase during 2000–2010, increasing by 1.67 × 10⁶ t. During 2010–2020, the five factors all had a certain impact on carbon storage. Reverse succession (Rs) and urbanization (U) reduced carbon storage, whereas succession (S) led to an increase of 0.41 × 10⁶ t. During 2000–2020, both urbanization (U) and reverse succession (Rs) contributed the most to the decline in carbon stocks.
The main driving factors causing changes in water yield during 2000–2010 were reclamation (Rc), restoration (Re), and succession (S). Among them, reclamation (Rc), as the foremost driver of increased water yield, led to an increase of 54.64 × 10⁸ m3. Restoration (Re) was one of the main factors causing a decrease in water yield, which resulted in a decrease of 16.89 × 10⁸ m3. During 2010–2020, reclamation (Rc) and restoration (Re) had great impacts on water yield. Among them, restoration (Re) caused a decrease in water yield, and reclamation (Rc), as one of the driving factors causing an increase in water yield during this period, caused an increase in water yield of 73.63 × 10⁸ m3. During 2000–2020, restoration (Re), reverse succession (Rs), and urbanization (U) were the driving factors for the decrease in water yield.
For habitat quality, urbanization (U) had a significant effect on degradation in the basin during 2000–2010, while habitat degradation was mainly due to reclamation (Rc), followed by urbanization (U) during 2010–2020. Moreover, reverse succession (Rs) had a positive effect on habitat quality during 2000–2010, whereas restoration (Re) had a greater effect on habitat quality during 2010–2020. Both urbanization (U) and reclamation (Rc) had negative effects on habitat quality throughout the study period from 2000 to 2020.
Farmland in the basin is a major carbon reservoir [61], and Rc led to a trade-off in habitat quality in the KRB from 2000 to 2020. As stated by [62], a synergistic effect could only be possible if the KRB has a typical and well-preserved subtropical forest system, which is not the case. From 2000 to 2020, a synergistic effect occurred between the carbon stock and water yield. In the case of the KRB, increased farming activities (i.e., Rc) and increased grassland (e.g., Re or S) provide more vegetation, ultimately leading to increased carbon stocks and improved water yields.

4.3. Implications and Limitations

The results demonstrate that, consistent with previous studies [59], the overall area of constructed land in the KRB expanded from 2000 to 2020, whereas wetlands, forests, and grasslands experienced a decline. Specifically, in the Kaduna Metropolitan Region, constructed land increased from 73 km2 in 1986 to 240 km2 in 2020, whereas riparian vegetation decreased from 88 km2 in 1986 to 71 km2 in 2020, primarily due to encroachment by agricultural expansion and urban construction. However, an inflection point was observed in the change in constructed land between 2010 and 2020, during which the total amount of constructed land actually decreased (Figure 3). Despite this, the main urban areas of the four major cities (Kaduna, Zaria, Minna, and Bida) continued to expand. For example, the main urban area of Kaduna city increased from 149 km2 to 162 km2 and then to 232 km2 between 2000 and 2020 (Figure 3). The scattered expansion of constructed land in 2010 was mainly concentrated in the central-eastern part of the KRB, particularly in the river valleys, covering an area of over 350 km2, which were classified as rainfed cropland and herbaceous cover cropland in the GLC_FCS30D global 30 m land use classification product (https://data.casearth.cn/dataset (accessed on 1 March 2025)). Compared with GLC_FCS30D, which achieves an overall accuracy of 80.88% (±0.27%) for major land cover types, the constructed land in 2010 was underestimated (682 km2), whereas that in 2020 was overestimated (893 km2).
Moreover, this study relies on land use data that are subject to errors in remote sensing interpretation, which may affect the accuracy of identifying driving processes and trajectories. Future research should incorporate field surveys to validate data accuracy and define appropriate spatial scale thresholds for determining driving processes, thereby optimizing research outcomes.

5. Conclusions

To map the driving process of land use change, this paper applies a dynamic trajectory analysis method to series and continuous multiple time factors and integrates the dynamic time into the spatial distribution. The research method proposed in this paper not only breaks through the static driving mechanism research of the status quo pattern on the basis of statistical analysis but also separates the spatiotemporal patterns of the natural and human disturbance driving factors, and the influence of the driving process on river basins is spatially and quantitatively characterized. By integrating the spatial pattern distributions of ecosystem services, this study overcomes the deficiency of separate studies on the relationships between land use and function or between land use and driving factors.
This study revealed that land use change trajectories, particularly those driven by natural and anthropogenic factors, significantly affect ecosystem services. Between 2000 and 2020, the primary drivers of land use change in the KRB were reclamation (Rc), succession (S), reserve succession (Rs), and restoration (Re). The single anthropogenic driving trajectories were 1.3 times greater than the single natural driving trajectories and 2.02 times greater than the compound driving trajectories in the KRB. The carbon storage increased by 15.6% (8.5 × 10⁶ t) and increased at a decreasing rate. Reserve succession contributed to decreased carbon storage, with reclamation and restoration being the factors that increased it. The water yield has steadily increased. Restoration was the primary cause of reduced water yield, but reclamation led to an increase. The habitat quality initially increased (0.03) but then decreased (0.01). Urbanization significantly degraded habitats from 2000 to 2010, while reclamation was the primary cause of habitat degradation from 2010 to 2020. Reserve succession and restoration positively affected habitat quality. This insight is critical for understanding the impact of land use change on ecosystems in river basins and can be used to design optimal management strategies for the field of land planning, promoting the harmonious co-development of human and natural systems.

Author Contributions

Conceptualization, L.Z. and X.L.; Methodology, L.Z.; Software, Q.Z.; Validation, X.W.; Formal analysis, U.A.; Writing—original draft, L.Z.; Writing—review & editing, X.L. All authors have read and agreed to the published version of the manuscript.

Funding

This research was funded by the Shandong Joint Foundation of the National Natural Science Foundation of China (No. U22A20558), the National Natural Science Foundation of China (No. 32171572), the Hebei Academy of Social Sciences (20230303050), and the Research Fund of Hebei Normal University (L2025B26). And the APC was funded by the Research Fund of Hebei Normal University (L2025B26).

Data Availability Statement

The datasets used and/or analyzed during the current study are available from the corresponding author upon reasonable request.

Conflicts of Interest

The authors declare that they have no known competing financial interests or personal relationships that could have appeared to influence the work reported in this paper.

References

  1. Foley, J.A.; DeFries, R.; Asner, G.P.; Barford, C.; Bonan, G.; Carpenter, S.R.; Chapin, F.S.; Coe, M.T.; Daily, G.C.; Gibbs, H.K.; et al. Global Consequences of Land Use. Science 2005, 309, 570–574. [Google Scholar] [CrossRef] [PubMed]
  2. Rahaman, S.; Kumar, P.; Chen, R.; Meadows, M.E. Nanjing University Remote Sensing Assessment of the Impact of Land Use and Land Cover Change on the Environment of Barddhaman District, West Bengal, India. Front. Environ. Sci. 2020, 8, 127. [Google Scholar] [CrossRef]
  3. Turner, B.L.; Lambin, E.F.; Reenberg, A. The emergence of land change science for global environmental change and sustainability. Proc. Natl. Acad. Sci. USA 2007, 104, 20666–20671. [Google Scholar] [CrossRef]
  4. Liu, J.Y.; Zhang, Z.X.; Zhang, S.W.; Yan, C.Z.; Wu, S.X.; Li, R.D.; Kuang, W.H.; Shi, W.J.; Huang, L.; Ning, J.; et al. Review and prospect of remote sensing research on land use change in China: Based on the guidance of Peng’s academic thought. J. Geo-Inf. Sci. 2020, 22, 680–687. [Google Scholar]
  5. Winkler, K.; Fuchs, R.; Rounsevell, M.; Herold, M. Global land use changes are four times greater than previously estimated. Nat. Commun. 2021, 12, 2501. [Google Scholar]
  6. Rawart, J.S.; Biswas, V.; Kumar, M. Changes in land use/cover using geospatial techniques.: A case study of Ramnagar town area, district Nainital, Uttarakhand, India. Egypt. J. Remote Sens. Space Sci. 2013, 16, 111–117. [Google Scholar]
  7. Aryal, K.; Maraseni, T.; Apan, A. Transforming agroforestry in contested landscapes: A win-win solution to trade-offs in ecosystem services in Nepal. Sci. Total Environ. 2022, 857, 159301. [Google Scholar]
  8. Grafius, D.; Corstanje, R.; Harris, J. Linking ecosystem services, urban form and green space configuration using multivariate landscape metric analysis. Landsc. Ecol. 2018, 33, 557–573. [Google Scholar] [CrossRef] [PubMed]
  9. Sankhala, S.; Singh, B. Evaluation of urban sprawl and land use/land cover change using Remote sensing and GIS techniques: A case study of Jaipur City, India. Int. J. Emerg. Technol. Adv. Eng. 2014, 4, 66–72. [Google Scholar]
  10. Ma, T.T.; Li, X.W.; Bai, J.H.; Cui, B.S. Tracking three decades of land use and land cover transformation trajectories in China’s large river deltas. Land Degrad. Dev. 2019, 30, 799–810. [Google Scholar]
  11. Tadesse, A.; Tolossa, D.; Tsehaye, S.; Yayeh, D. Dynamics of land use and land cover changes in Amibara and Awash-fentale districts, Ethiopia. Remote Sens. Appl. Soc. Environ. 2024, 36, 101315. [Google Scholar]
  12. Ologunde, O.H.; Kelani, M.O.; Biru, M.K.; Olayemi, A.B.; Nunes, M.R. Land Use and Land Cover Changes: A Case Study in Nigeria. Land. 2025, 14, 389. [Google Scholar]
  13. Cheruto, M.C.; Kauti, M.K.; Kisangau, P.D.; Kariuki, P.C. Assessment of land use and Land cover change using GIS and remote sensing techniques: A case study of Makueni County, Kenya. Journal of Remote Sensing. GIS 2016, 5, 175. [Google Scholar]
  14. Liu, H.; Shu, C.; Zhou, T.T.; Liu, P. Trade-off and synergy relationships of ecosystem services and driving force analysis based on land cover change in Altay Prefecture. J. Resour. Ecol. 2021, 12, 777–790. [Google Scholar]
  15. Costanza, R.; de Groot, R.; Sutton, P.; van der Ploeg, S.; Anderson, S.J.; Kubiszewski, I.; Farber, S.; Turner, R.K. Changes in the global value of ecosystem services. Glob. Environ. Change-Hum. Policy Dimens. 2014, 26, 152–158. [Google Scholar] [CrossRef]
  16. Stammel, B.; Fischer, C.; Cyffka, B.; Albert, C.; Damm, C.; Dehnhardt, A.; Fischer, H.; Foeckler, F.; Gerstner, L.; Hoffmann, T.G.; et al. Assessing land use and flood management impacts on ecosystem services in a river landscape (Upper Danube, Germany). River Res. Appl. 2020, 37, 209–220. [Google Scholar] [CrossRef]
  17. Fox, C.A. River Basin Development. In International Encyclopedia of Human Geography, 2nd ed.; Elsevier: Oxford, UK, 2020; pp. 1–8. [Google Scholar] [CrossRef]
  18. Ma, T.T.; Li, X.W.; Bai, J.H.; Ding, S.Y.; Zhou, F.W.; Cui, B.S. Four decades’ dynamics of coastal blue carbon storage driven by land use/land cover transformation under natural and anthropogenic processes in the Yellow River Delta, China. Sci. Total Environ. 2019, 655, 741–750. [Google Scholar]
  19. Mallinis, G.; Koutsias, N.; Arianoutsou, M. Monitoring land use/land cover transformations from 1945 to 2007 in two peri-urban mountainous areas of Athens metropolitan area, Greece. Sci. Total Environ. 2014, 490, 262–278. [Google Scholar] [CrossRef]
  20. Teixeira, Z.; Teixeira, H.; Marques, J.C. Systematic processes of land use/land cover change to identify relevant driving forces: Implications on water quality. Sci. Total Environ. 2014, 470–471, 1320–1335. [Google Scholar]
  21. Bhomia, R.K.; Van Lent, J.; Rios, J.M.G.; Hergoualc’h, K.; Coronado, E.N.H.; Murdiyarso, D. Impacts of Mauritia flexuosa degradation on the carbon stocks of freshwater peatlands in the Pastaza-Maranon river basin of the Peruvian Amazon. Mitig. Adapt. Strateg. Glob. Change 2019, 24, 645–668. [Google Scholar]
  22. Lawler, J.J.; Lewis, D.J.; Nelson, E.; Plantinga, A.J.; Polasky, S.; Withey, J.C.; Helmers, D.P.; Martinuzzi, S.; Pennington, D.N.; Radeloff, V.C. Projected land-use change impacts on ecosystem services in the United States. Proc. Natl. Acad. Sci. USA 2014, 111, 7492–7497. [Google Scholar] [PubMed]
  23. Quintero-Gallego, M.E.; Quintero-Angel, M.; Vila-Ortega, J.J. Exploring land use/land cover change and drivers in Andean mountains in Colombia: A case in rural Quindio. Sci. Total Environ. 2018, 634, 1288–1299. [Google Scholar]
  24. Meng, C.; Liu, H.; Li, Y.; Wang, Y.; Li, X.; Shen, J.L.; Gong, D.L.; Zhang, M.M.; Wu, J.S. Landscape patterns of catchment and land-use regulate legacy phosphorus releases in subtropical mixed agricultural and woodland catchments. Sci. Total Environ. 2022, 804, 150055. [Google Scholar]
  25. Zheng, L.; Wang, Y.; Li, J. Quantifying the spatial impact of landscape fragmentation on habitat quality: A multi-temporal dimensional comparison between the Yangtze River Economic Belt and Yellow River Basin of China. Land Use Policy 2023, 125, 106463. [Google Scholar]
  26. Zhi, L.H.; Ma, T.T.; Gao, Y.; Li, X.W.; Shao, D.D.; Guo, W.H.; Cui, B.S. Human-natural coupling driving processes for spatiotemporal dynamics of coastal wetlands under reclamation. Acta Ecol. Sin. 2024, 44, 9626–9635. [Google Scholar]
  27. Hietel, E.; Waldhardt, R.; Otte, A. Analysing land-cover changes in relation to environmental variables in Hesse, Germany. Landsc. Ecol. 2004, 19, 473–489. [Google Scholar]
  28. Xystrakis, F.; Psarras, T.; Koutsias, N. A process-based land use/land cover change assessment on a mountainous area of Greece during 1945–2009: Signs of socio-economic drivers. Sci. Total Environ. 2017, 587–588, 360–370. [Google Scholar]
  29. Tiwari, M.K.; Saxena, A. Change Detection of Land Use/Landcover Pattern in an round Mandideep and Obedullaganj Area, using Remote Sensing and GIS. Int. J. Imaging Syst. Technol. 2011, 2, 398–402. [Google Scholar]
  30. Newbold, T.; Hudson, L.N.; Hill, S.L.L.; Contu, S.; Lysenko, I.; Senior, R.A.; Börger, L.; Bennett, D.J.; Choimes, A.; Collen, B.; et al. Global effects of land use on local terrestrial biodiversity. Nature 2015, 520, 45–50. [Google Scholar]
  31. Ebenezer, P.A.; Kavitha, A.R. A Review on Use of Land Metrics in Land Use and Land Cover. In Proceedings of the 2021 5th International Conference on Electronics, Communication and Aerospace Technology (ICECA), Coimbatore, India, 2–4 December 2021; pp. 320–325. [Google Scholar]
  32. Tolessa, T.; Senbeta, F.; Kidane, M. The impact of land use/land cover change on ecosystem services in the central highlands of Ethiopia. Ecosyst. Serv. 2017, 23, 47–54. [Google Scholar]
  33. Minta, M.; Kibret, K.; Thorne, P.; Nigussie, T.; Nigatu, L. Land use and land cover dynamics in Dendi-Jeldu hilly-mountainous areas in the central Ethiopian highlands. Geoderma 2018, 314, 27–36. [Google Scholar] [CrossRef]
  34. Zomlot, Z.; Verbeiren, B.; Huysmans, M.; Batelaan, O. Trajectory analysis of land use and land cover maps to improve spatial-temporal patterns, and impact assessment on groundwater recharge. J. Hydrol. 2017, 554, 558–569. [Google Scholar] [CrossRef]
  35. Davis, J.L.; Currin, C.A.; O’Brien, C.; Raffenburg, C.; Davis, A. Living shorelines: Coastal resilience with a blue carbon benefit. PLoS ONE 2015, 10, e0142595. [Google Scholar] [CrossRef] [PubMed]
  36. Rukundo, E.; Liu, S.; Dong, Y.; Rutebuka, E.; Asamoah, E.F.; Xu, J.W.; Wu, X. Spatiotemporal dynamics of critical ecosystem services in response to agricultural expansion in Rwanda, East Africa. Ecol. Indic. 2018, 89, 696–705. [Google Scholar] [CrossRef]
  37. Wang, C.D.; Li, X.; Yu, H.J.; Wang, Y.T. Tracing the spatial variation and value change of ecosystem services in Yellow River Delta, China. Ecol. Indic. 2019, 96, 270–277. [Google Scholar] [CrossRef]
  38. De Rosa, M.; Odgaard, M.V.; Staunstrup, J.K.; Staunstrup, J.K.; Hermansen, J.E. Identifying land use and land-use changes (LULUC): A Global LULUC Matrix. Environ. Sci. Technol. 2017, 51, 7954–7962. [Google Scholar] [CrossRef]
  39. Awotwi, A.; Anornu, G.K.; Quaye-Ballard, J.A.; Annor, T. Monitoring land use and land cover changes due to extensive gold mining, urban expansion, and agriculture in the Pra River Basin of Ghana, 1986–2025. Land Degrad. Dev. 2018, 29, 3331–3343. [Google Scholar] [CrossRef]
  40. El Gammal, E.A.; Salem, S.M.; El Gammal, A.E.A. Change detection studies on the world’s biggest artificial lake (Lake Nasser, Egypt). Egypt. J. Remote Sens. Space Sci. 2010, 13, 89–99. [Google Scholar] [CrossRef]
  41. Akinyemi, F.O. Land change in the central Albertine rift: Insights from analysis and mapping of land use-land cover change in north-western Rwanda. Appl. Geogr. 2017, 87, 127–138. [Google Scholar] [CrossRef]
  42. Okeleye, S.O.; Okhimamhe, A.A.; Sanfo, S.; Fürst, C. Impacts of Land Use and Land Cover Changes on Migration and Food Security of North Central Region, Nigeria. Land 2023, 12, 1012. [Google Scholar] [CrossRef]
  43. Awoniran, D.R.; Adewole, M.B.; Adegboyega, S.A. Assessment of environmental responses to land use/land cover dynamics in the Lower Ogun River Basin, Southwestern Nigeria. Afr. J. Environ. Sci. Technol. 2014, 8, 152–165. [Google Scholar] [CrossRef]
  44. Fasona, M.; Adeonipekun, P.A.; Agboola, O.; Akintuyi, A.; Anifowose, Y.; Bello, A.; Ogundipe, O.; Soneye, A.; Omojola, A. Incentives for collaborative governance of natural resources: A case study of forest management in southwest Nigeria. Environ. Dev. 2019, 30, 76–88. [Google Scholar]
  45. Odiji, C.A.; Ahmad, H.S.; Adepoju, M.O.; Odia, B.; Hamza, D.D.; Akpabio, W.E. Analysis and prediction of land use/land cover changes and its impacts on the corridors of cattle grazing routes in Benue state, Nigeria. Geol. Ecol. Landsc. 2022, 8, 498–512. [Google Scholar]
  46. Durowoju, O.S.; Ologunorisa, T.E.; Akinbobola, A. Assessing agricultural and hydrological drought vulnerability in a savanna ecological zone of Sub-Saharan Africa. Nat. Hazards 2022, 111, 2431–2458. [Google Scholar]
  47. Jo, F.; Garba, S.J.a.; Ao, A.A. comparison of ANFIS and ANN-based models in river discharge forecasting. New Ground Res. J. Phys. Sci. 2014, 1, 1–16. [Google Scholar]
  48. Mu, Y.L.; Guo, Y.; Li, X.W.; Li, P.; Bai, J.H.; Linke, S.; Cui, B.S. Cost-effective integrated conservation and restoration priorities by trading off multiple ecosystem services. J. Environ. Manag. 2022, 320, 115915. [Google Scholar] [CrossRef] [PubMed]
  49. Scharlemann, J.P.W.; Tanner, E.V.J.; Hiederer, R.; Kapos, V. Global soil carbon: Understanding and managing the largest terrestrial carbon pool. Carbon Manag. 2014, 5, 81–91. [Google Scholar] [CrossRef]
  50. Ravilious, C.; Kapos, V.; Osti, M.; Bertzky, M.; Bayliss, J.L.; Dahiru, S.; Dickson, B. Carbon, biodiversity and ecosystem services: Exploring co-benefits. In Nigeria: Preliminary Results; UNEP-WCMC: Cambridge, UK, 2010. [Google Scholar]
  51. Chen, C.; Liu, J.; Bi, L. Spatial and temporal changes of habitat quality and its influential factors in China based on the InVEST model. Forests 2023, 14, 374. [Google Scholar] [CrossRef]
  52. Zhi, L.H.; Zhou, F.W.; Li, X.W.; Ma, T.T.; Shao, D.D.; Bai, J.H.; Cui, B.S.; Guo, W.H. Maximal multiple ecosystem services for coastal wetlands by integrating their conservation and restoration pattern in the Yellow River Delta, China. J. Nat. Resour. 2023, 38, 3150–3165. [Google Scholar] [CrossRef]
  53. Swift, M.J.; Izac, A.N.; Van Noordwijk, M. Biodiversity and ecosystem services in farmlandscapes—Are we asking the right questions? Agric. Ecosyst. Environ. 2004, 104, 113–134. [Google Scholar] [CrossRef]
  54. Petermann, J.S.; Buzhdygan, O.Y. Grassland biodiversity. Curr. Biol. 2021, 31, R1195–R1201. [Google Scholar] [PubMed]
  55. Bianchi, T.S.; Allison, M.A. Large-river delta-front estuaries as natural "recorders" of global environmental change. Proc. Natl. Acad. Sci. USA 2009, 106, 8085–8092. [Google Scholar] [PubMed]
  56. Kim, W. Geomorphology flood-built land. Nat. Geosci. 2012, 5, 521–522. [Google Scholar] [CrossRef]
  57. Kirwan, M.L.; Megonigal, J.P. Tidal wetland stability in the face of human impacts and sea-level rise. Nature 2013, 504, 53–60. [Google Scholar]
  58. Alegbeleye, O.M.; Rotimi, Y.O.; Shomide, P.; Oyediran, A.; Ogundipe, O.; Akintunde-Alo, A. Land use land cover (LULC) analysis in Nigeria: A systematic review of data, methods, and platforms with future prospects. Bull. Natl. Res. Cent. 2024, 48, 127. [Google Scholar]
  59. Muhammad, L.A.; Auwal, F.A. Geospatial analysis of land use changes and wetland dynamics in Kaduna Metropolis, Kaduna, Nigeria. Sci. World J. 2024, 19, 687–696. [Google Scholar]
  60. Jew, E.K.K.; Dougill, A.J.; Sallu, S.M. Tobacco cultivation as a driver of land use change and degradation in the miombo woodlands of south-west Tanzania. Land Degrad. Dev. 2017, 28, 2636–2645. [Google Scholar]
  61. Braun, D.; Damm, A.; Hein, L.; Petchey, O.L.; Schaepman, M.E. Spatio-temporal trends and trade-offs in ecosystem services: An Earth observation based assessment for Switzerland between 2004 and 2014. Ecol. Indic. 2018, 89, 828–839. [Google Scholar]
  62. Wang, D.C.; Gong, J.H.; Chen, L.D.; Zhang, L.H.; Song, Y.Q.; Yue, Y.J. Comparative analysis of land use/cover change trajectories and their driving forces in two small watersheds in the western Loess Plateau of China. Int. J. Appl. Earth Obs. Geoinf. 2013, 21, 241–252. [Google Scholar]
Figure 1. The boundary and location of the Kaduna River Basin (KRB).
Land 14 00706 g001
Figure 2. Schematic diagram of the driving process trajectory analysis based on the land use change trajectory. T1, T2, and T3 represent the land use distributions of the three periods, and the numbers in the figure represent each land use type, i.e., 2: bare soil, 3: grassland, 4: forest, 5: wetland, and 6: constructed. Stable means that the land use did not change during the T1–T3 period, and Rs, U, R, and S represent reverse succession, urbanization, restoration, and succession, respectively.
Land 14 00706 g002
Figure 3. Changes in the spatial distribution and area of land use during the study period in the Kaduna River Basin.
Land 14 00706 g003
Figure 4. Land use change during 2000–2010 (a) and during 2010–2020 (b), trajectory of land use change throughout 2000–2020 (c) and distribution patterns of driving processes for the change of land use during 2000–2010 (d) and during 2010–2020 (e) and the corresponding areas (f) in the Kaduna River Basin. The numbers of the legend in (ac) represent the land use type codes in Table 1, i.e., 1: farmland, 2: bare soil, 3: grassland, 4: forest, 5: wetland, and 6: constructed. The double-digit represents land use change, and the triple-digit represents the land use change trajectory (e.g., 11 among 11 to 66 indicates that land use has been farmland without change in each period; 123 among 111 to 666 indicates that the land change trajectory is from cultivated land via bare land to grassland). S: Succession, Rs: Reverse succession, Re: Restoration, Rc: Reclamation, U: Urbanization, No: Unchanged.
Land 14 00706 g004
Figure 5. Spatial distribution of ecosystem services in the Kaduna River Basin.
Land 14 00706 g005
Figure 6. Spatial distributions of process trajectory types driven by land use change (a), influence area (b) and classification statistics of single and multiprocess natural and anthropogenic (c) driving trajectories in the Kaduna River Basin. S: Succession, Rs: Reverse succession, Re: Restoration, Rc: Reclamation, U: Urbanization, No: Stable.
Land 14 00706 g006
Figure 7. The amount of carbon storage (a), water yield (b) and habitat quality (c) in each driving process over time in the Kaduna River Basin. S: Succession, Rs: Reverse succession, Re: Restoration, Rc: Reclamation, U: Urbanization.
Land 14 00706 g007
Table 1. Land use types and the components of their carbon pools.
CodeLand Use TypeCabove
(t/hm2)
Cbelow
(t/hm2)
Csoil
(t/hm2)
Cdead
(t/hm2)
1Farmland208.550.2313.95
2Bare soil0117.70
3Grassland17.314.0723.613.95
4Forest118.1927.7793.629.65
5Wetland1023.419.80
6Constructed land0070
Note: “hm2” is the same as “ha”.
Table 2. Threat factor information table.
Threat FactorMaximum Threat Distance (m)WeightDecay
Farmland40.7line
Constructed land80.9exponential
Table 3. Habitat suitability and habitat sensitivity parameters.
CodeLand Use TypeHabitat SuitabilityHabitat Sensitivity Parameters
FarmlandConstructed Land
1Farmland0.50.560.72
2Bare soil0.30.210.27
3Grassland0.80.70.9
4Forest0.60.140.18
5Wetland0.60.420.54
6Constructed land000
Table 4. Types of driving processes corresponding to change of regional land use types in the Kaduna River Basin. The numbers in the land use change column represent the land use types in Table 1, e.g., 2–3 represents the change in land use type from bare land (i.e., land use code 2) to grassland (i.e., land use code 3).
Driving ProcessLand Use ChangeDescription of the ProcessDriving Process Properties
Succession (S)2–3, 2–4, 2–5, 3–4, 3–5, 5–4Evolve from simple ecosystems to complex ecosystemsNatural
Reverse succession (Rs)3–2, 4–2, 4–3, 4–5, 5–2, 5–3Evolve from complex ecosystems to simple ecosystemsNatural
Restoration (Re)1–2, 1–3, 1–4, 1–5, 6–1, 6–2, 6–3, 6–4, 6–5Restoration of land abandoned after reclamation and developmentNatural and Anthropogenic
Reclamation (Rc)2–1, 3–1, 4–1, 5–1Natural lands are developed by humans into farm landAnthropogenic
Urbanization (U)1–6, 2–6, 3–6, 4–6, 5–6Human exploitation of the landAnthropogenic
Unchanged (No) The land class has not changed
1: farmland, 2: bare soil, 3: grassland, 4: forest, 5: wetland, 6: constructed land.
Table 5. Land use area and its proportion in the Kaduna River Basin.
YearLand Use Type Area (km2) and Proportion (%)
FarmlandBare SoilGrasslandForestWetlandConstructed Land
200021,91514,75527,1493427772528
31.97%21.53%39.61%5.00%1.13%0.77%
201026,473727027,7995261810933
38.62%10.61%40.56%7.68%1.18%1.36%
202035,291635021,5403906689770
51.49%9.26%31.42%5.70%1.00%1.12%
Disclaimer/Publisher’s Note: The statements, opinions and data contained in all publications are solely those of the individual author(s) and contributor(s) and not of MDPI and/or the editor(s). MDPI and/or the editor(s) disclaim responsibility for any injury to people or property resulting from any ideas, methods, instructions or products referred to in the content.

