

From Fertile Grounds to Sealed Fields: Assessing and Mapping Soil Ecosystem Services in Forlì’s Urban Landscape (NE Italy)
Abstract
:1. Introduction
| “La terra che fé già la lunga prova | |
| e di Franceschi sanguinoso mucchio, | |
| sotto le branche verdi si ritrova” | |
| Dante Alighieri, Inferno, Canto XXVII |
2. Materials and Methods
2.1. Study Area
2.2. Available Soil Data and Urban Soil Survey
2.3. Soil Functions and SESs Assessment
2.4. Mapping Urban Soils Properties and Ecosystem Services
3. Results
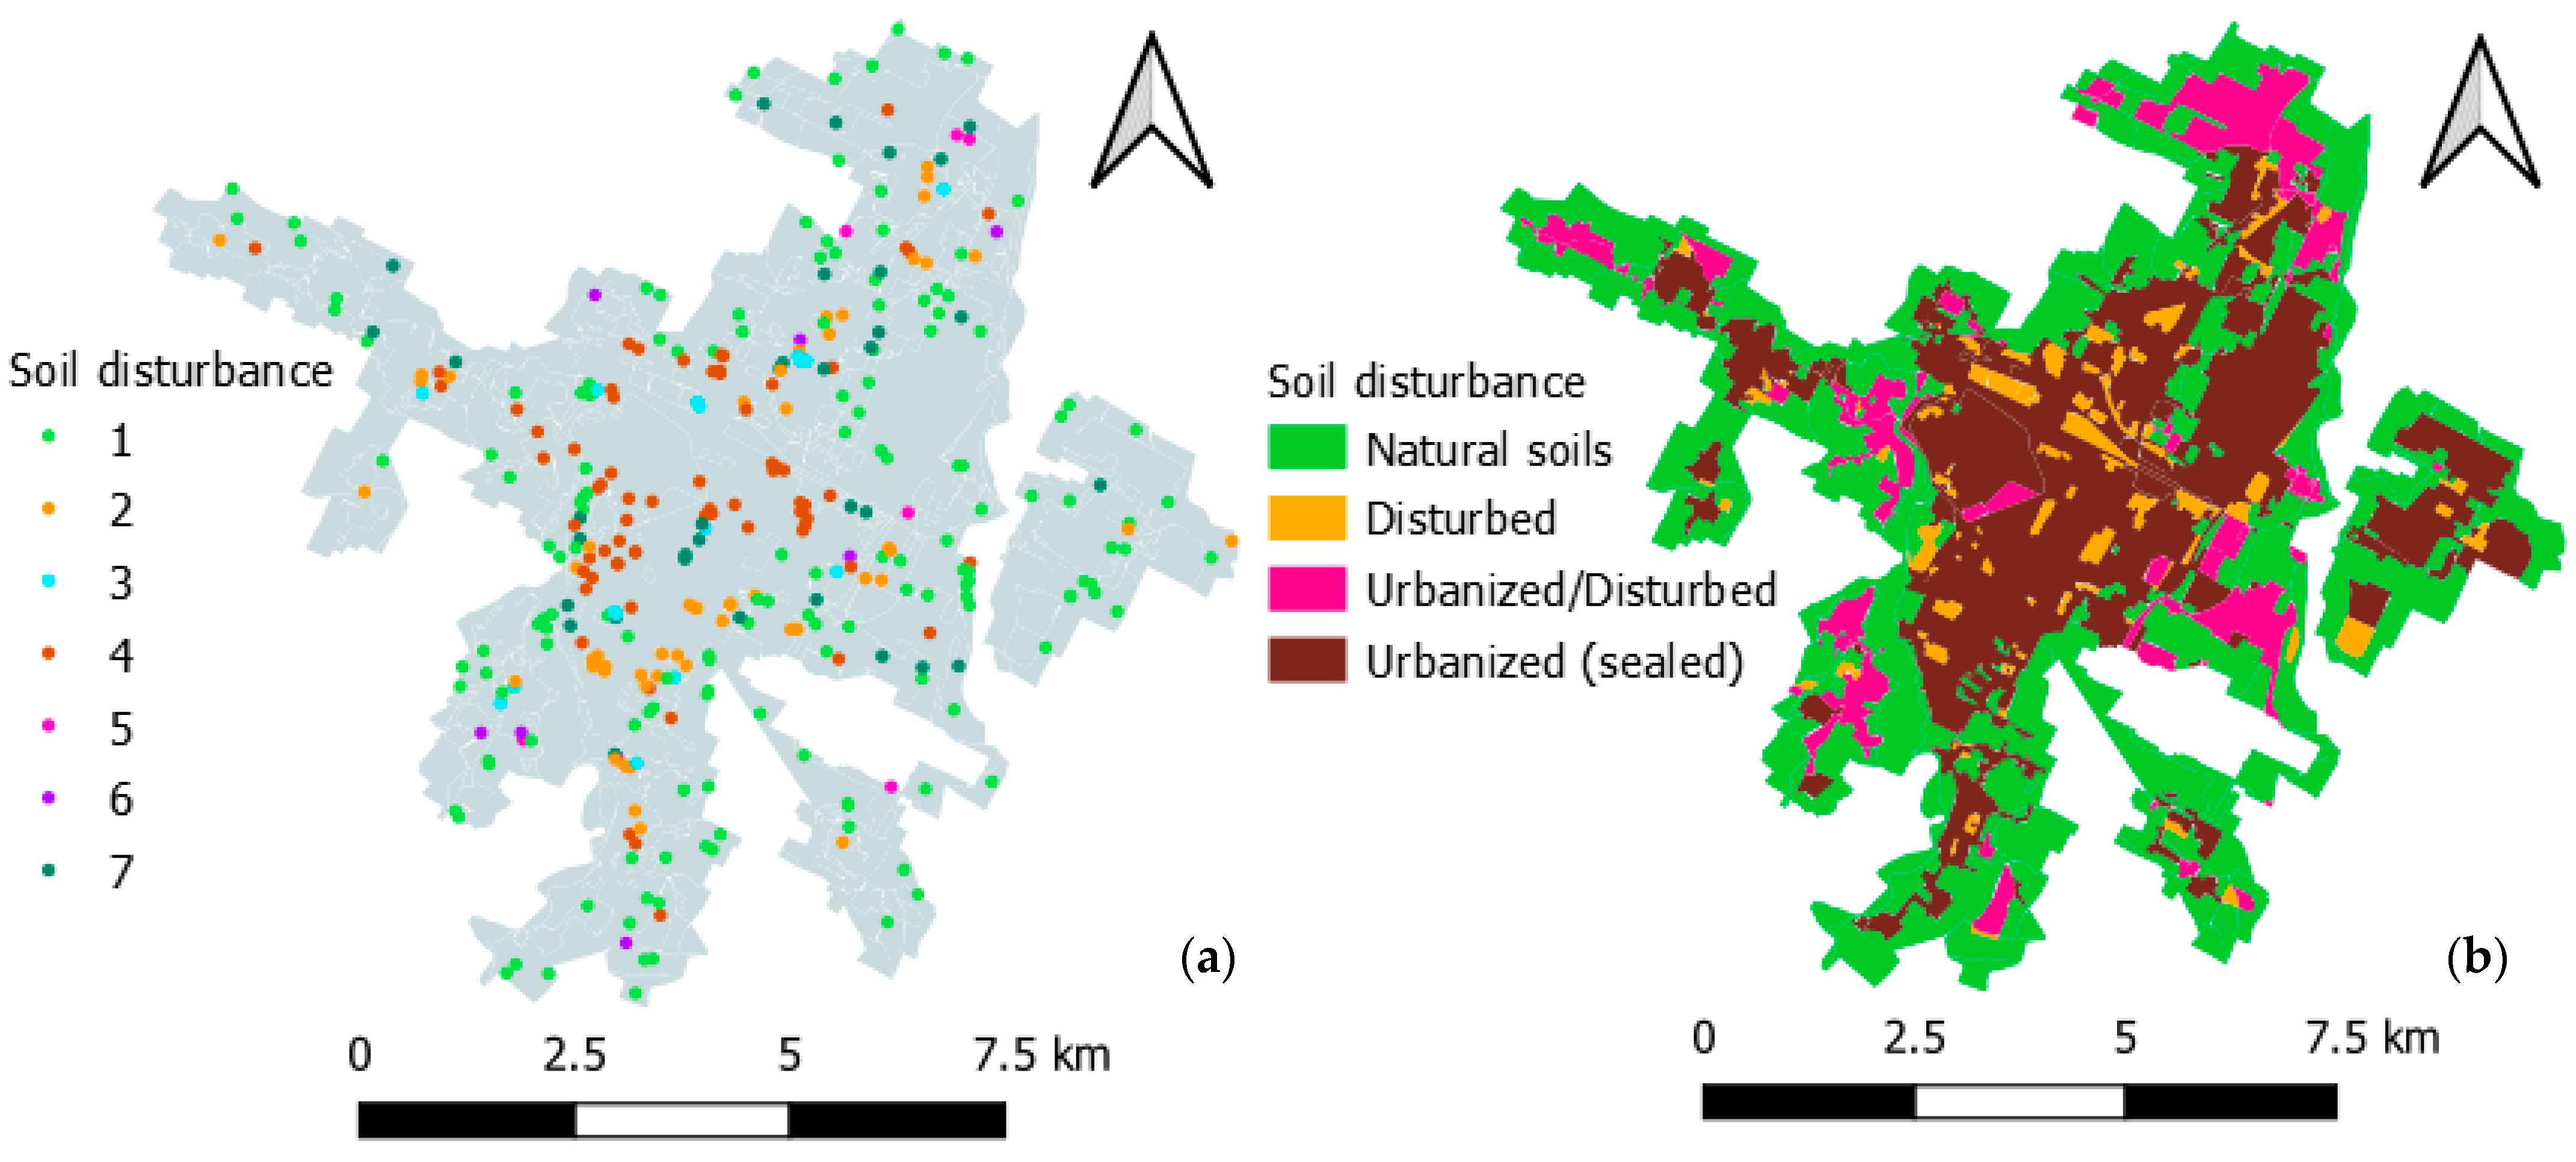
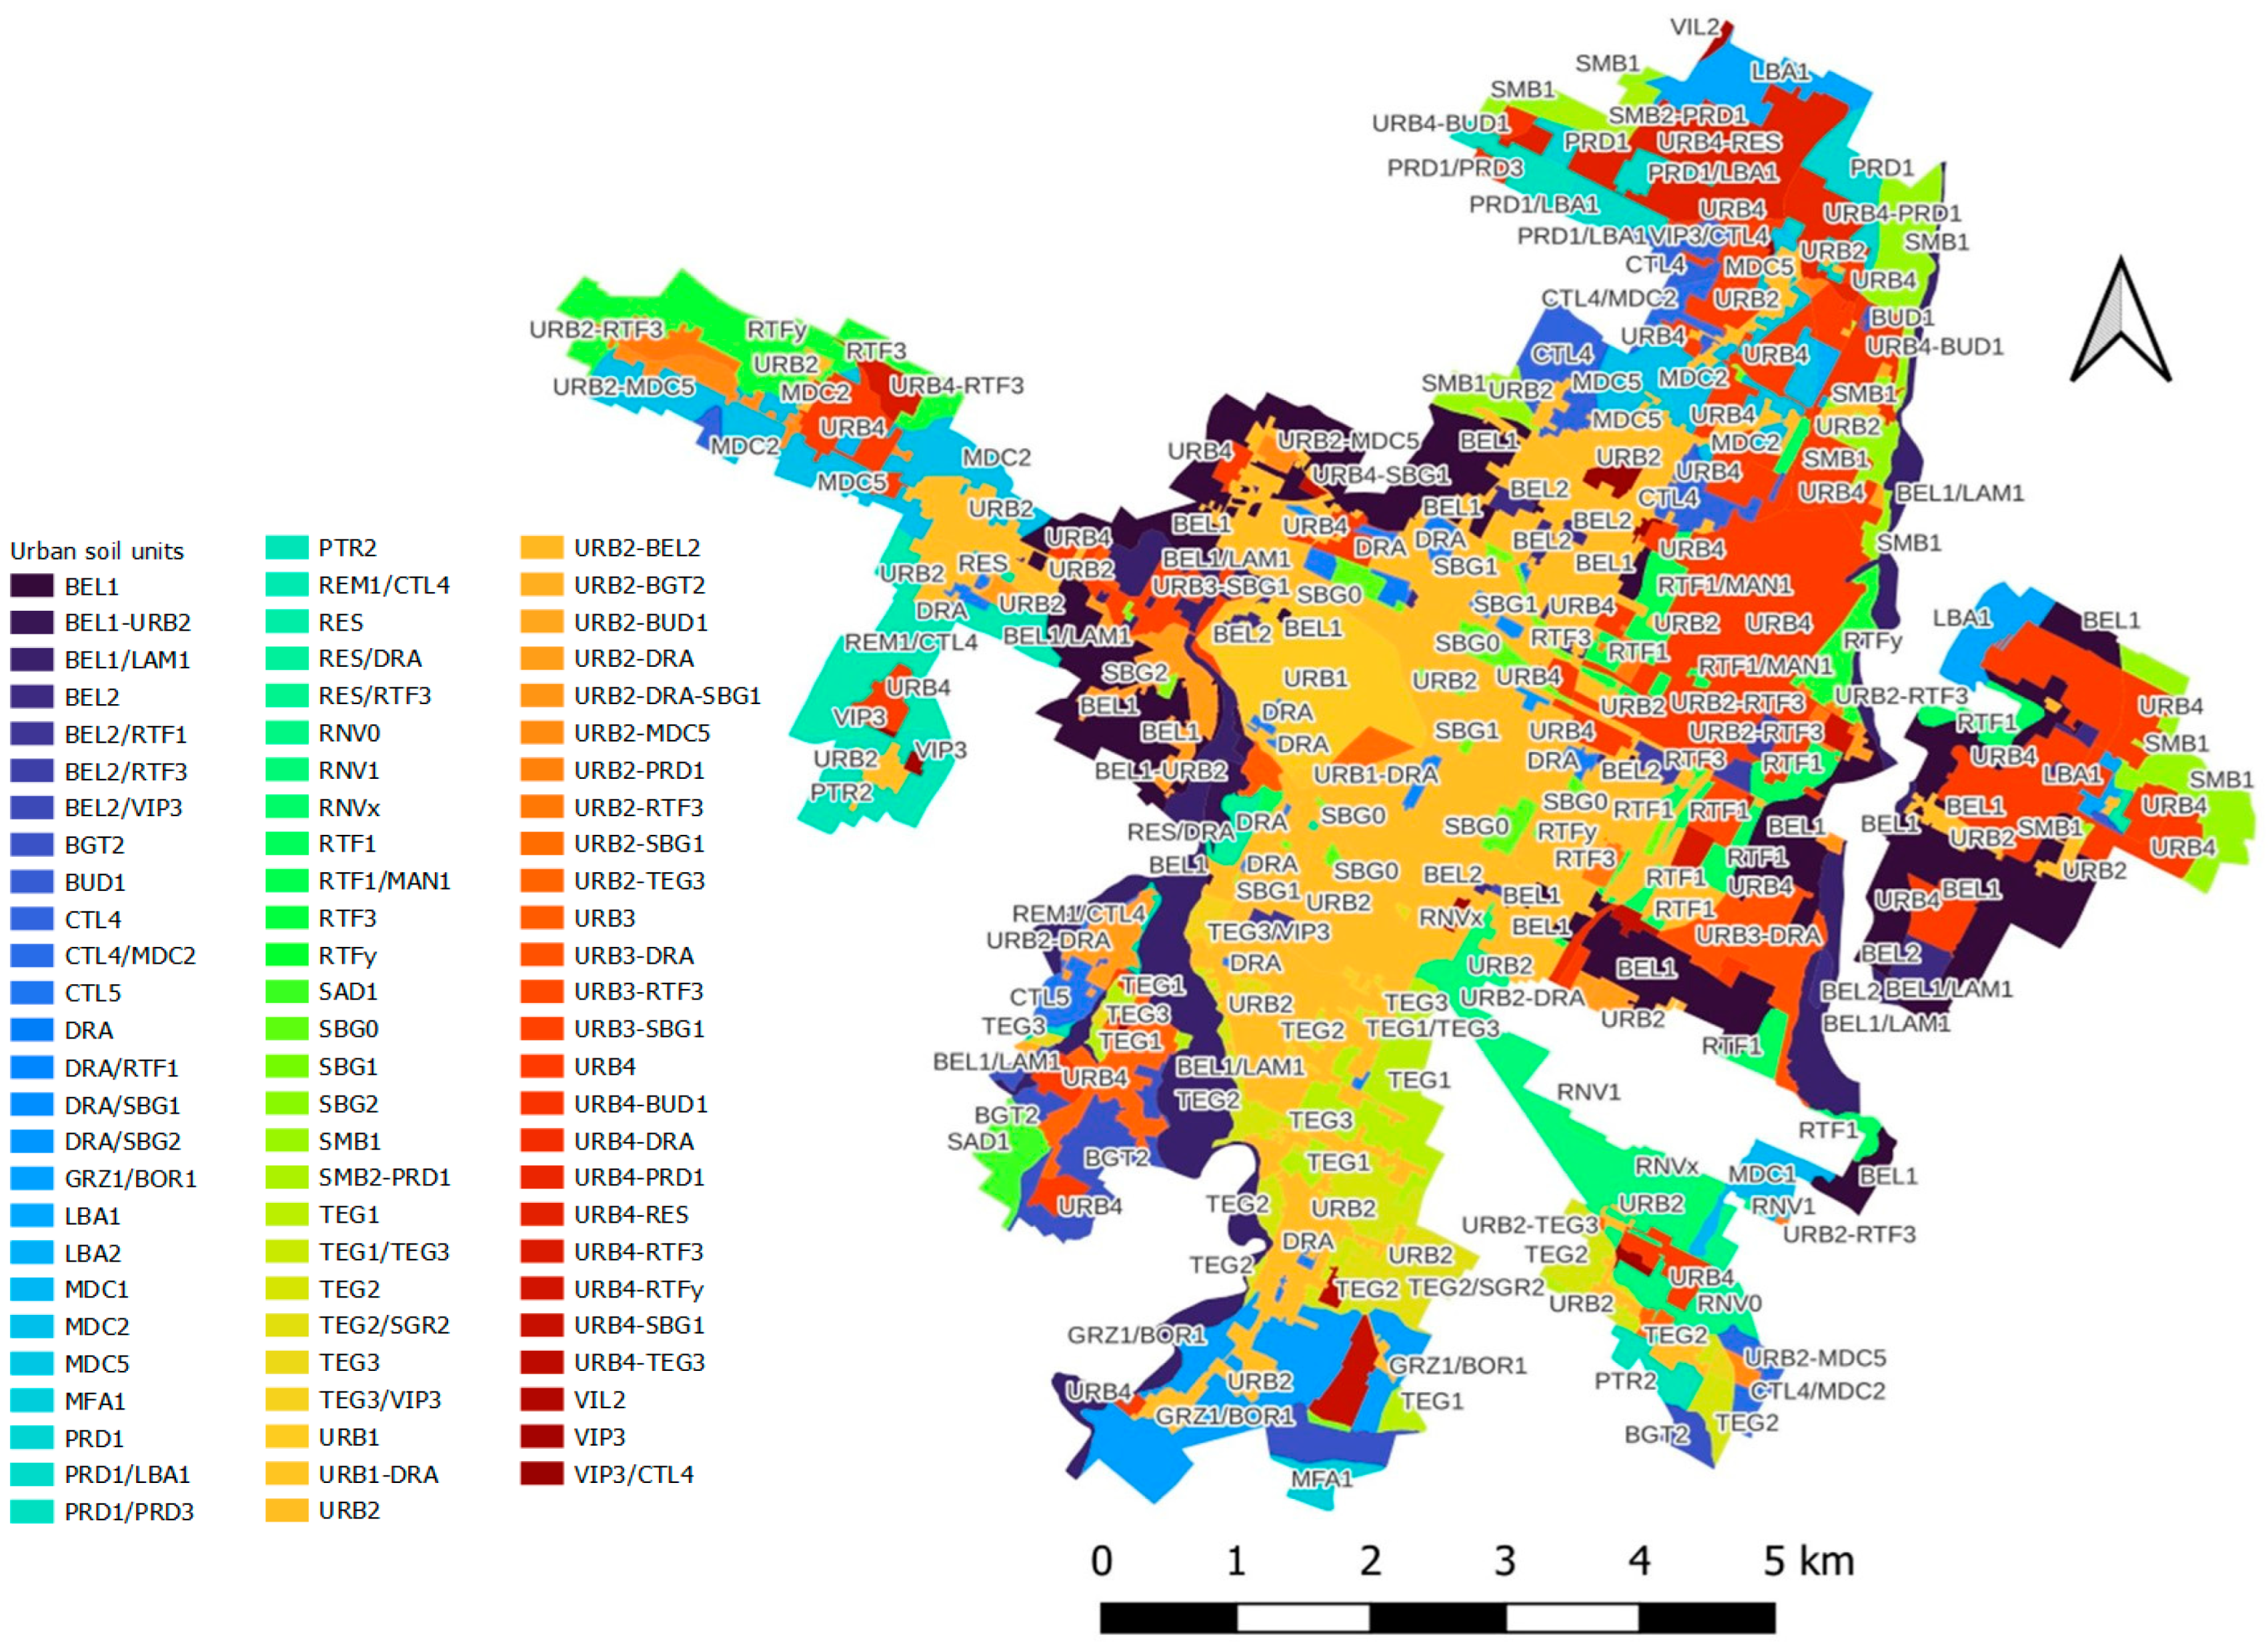
3.1. Urban Soil Map 1:10,000 and Degree of Soil Disturbance
- Undisturbed “natural” soils found in agricultural areas but also in public parks and uncultivated land;
- Disturbed soils with superficial fill of allochthonous soil material in the topsoil;
- Deep disturbance in place: like 2 but the disturbance is deeper with overturned horizons and buried soil;
- All fill: often it is made of building material mixed with soil with high percentages of coarse elements so that augering and sampling are impeded;
- Disturbed after sampling;
- Urbanized and sealed;
- Natural topsoils reworked: no fill, mixing of Ap with bricks and artifacts. The bricks can be from the Roman age. They occur quite frequently also in agricultural areas.
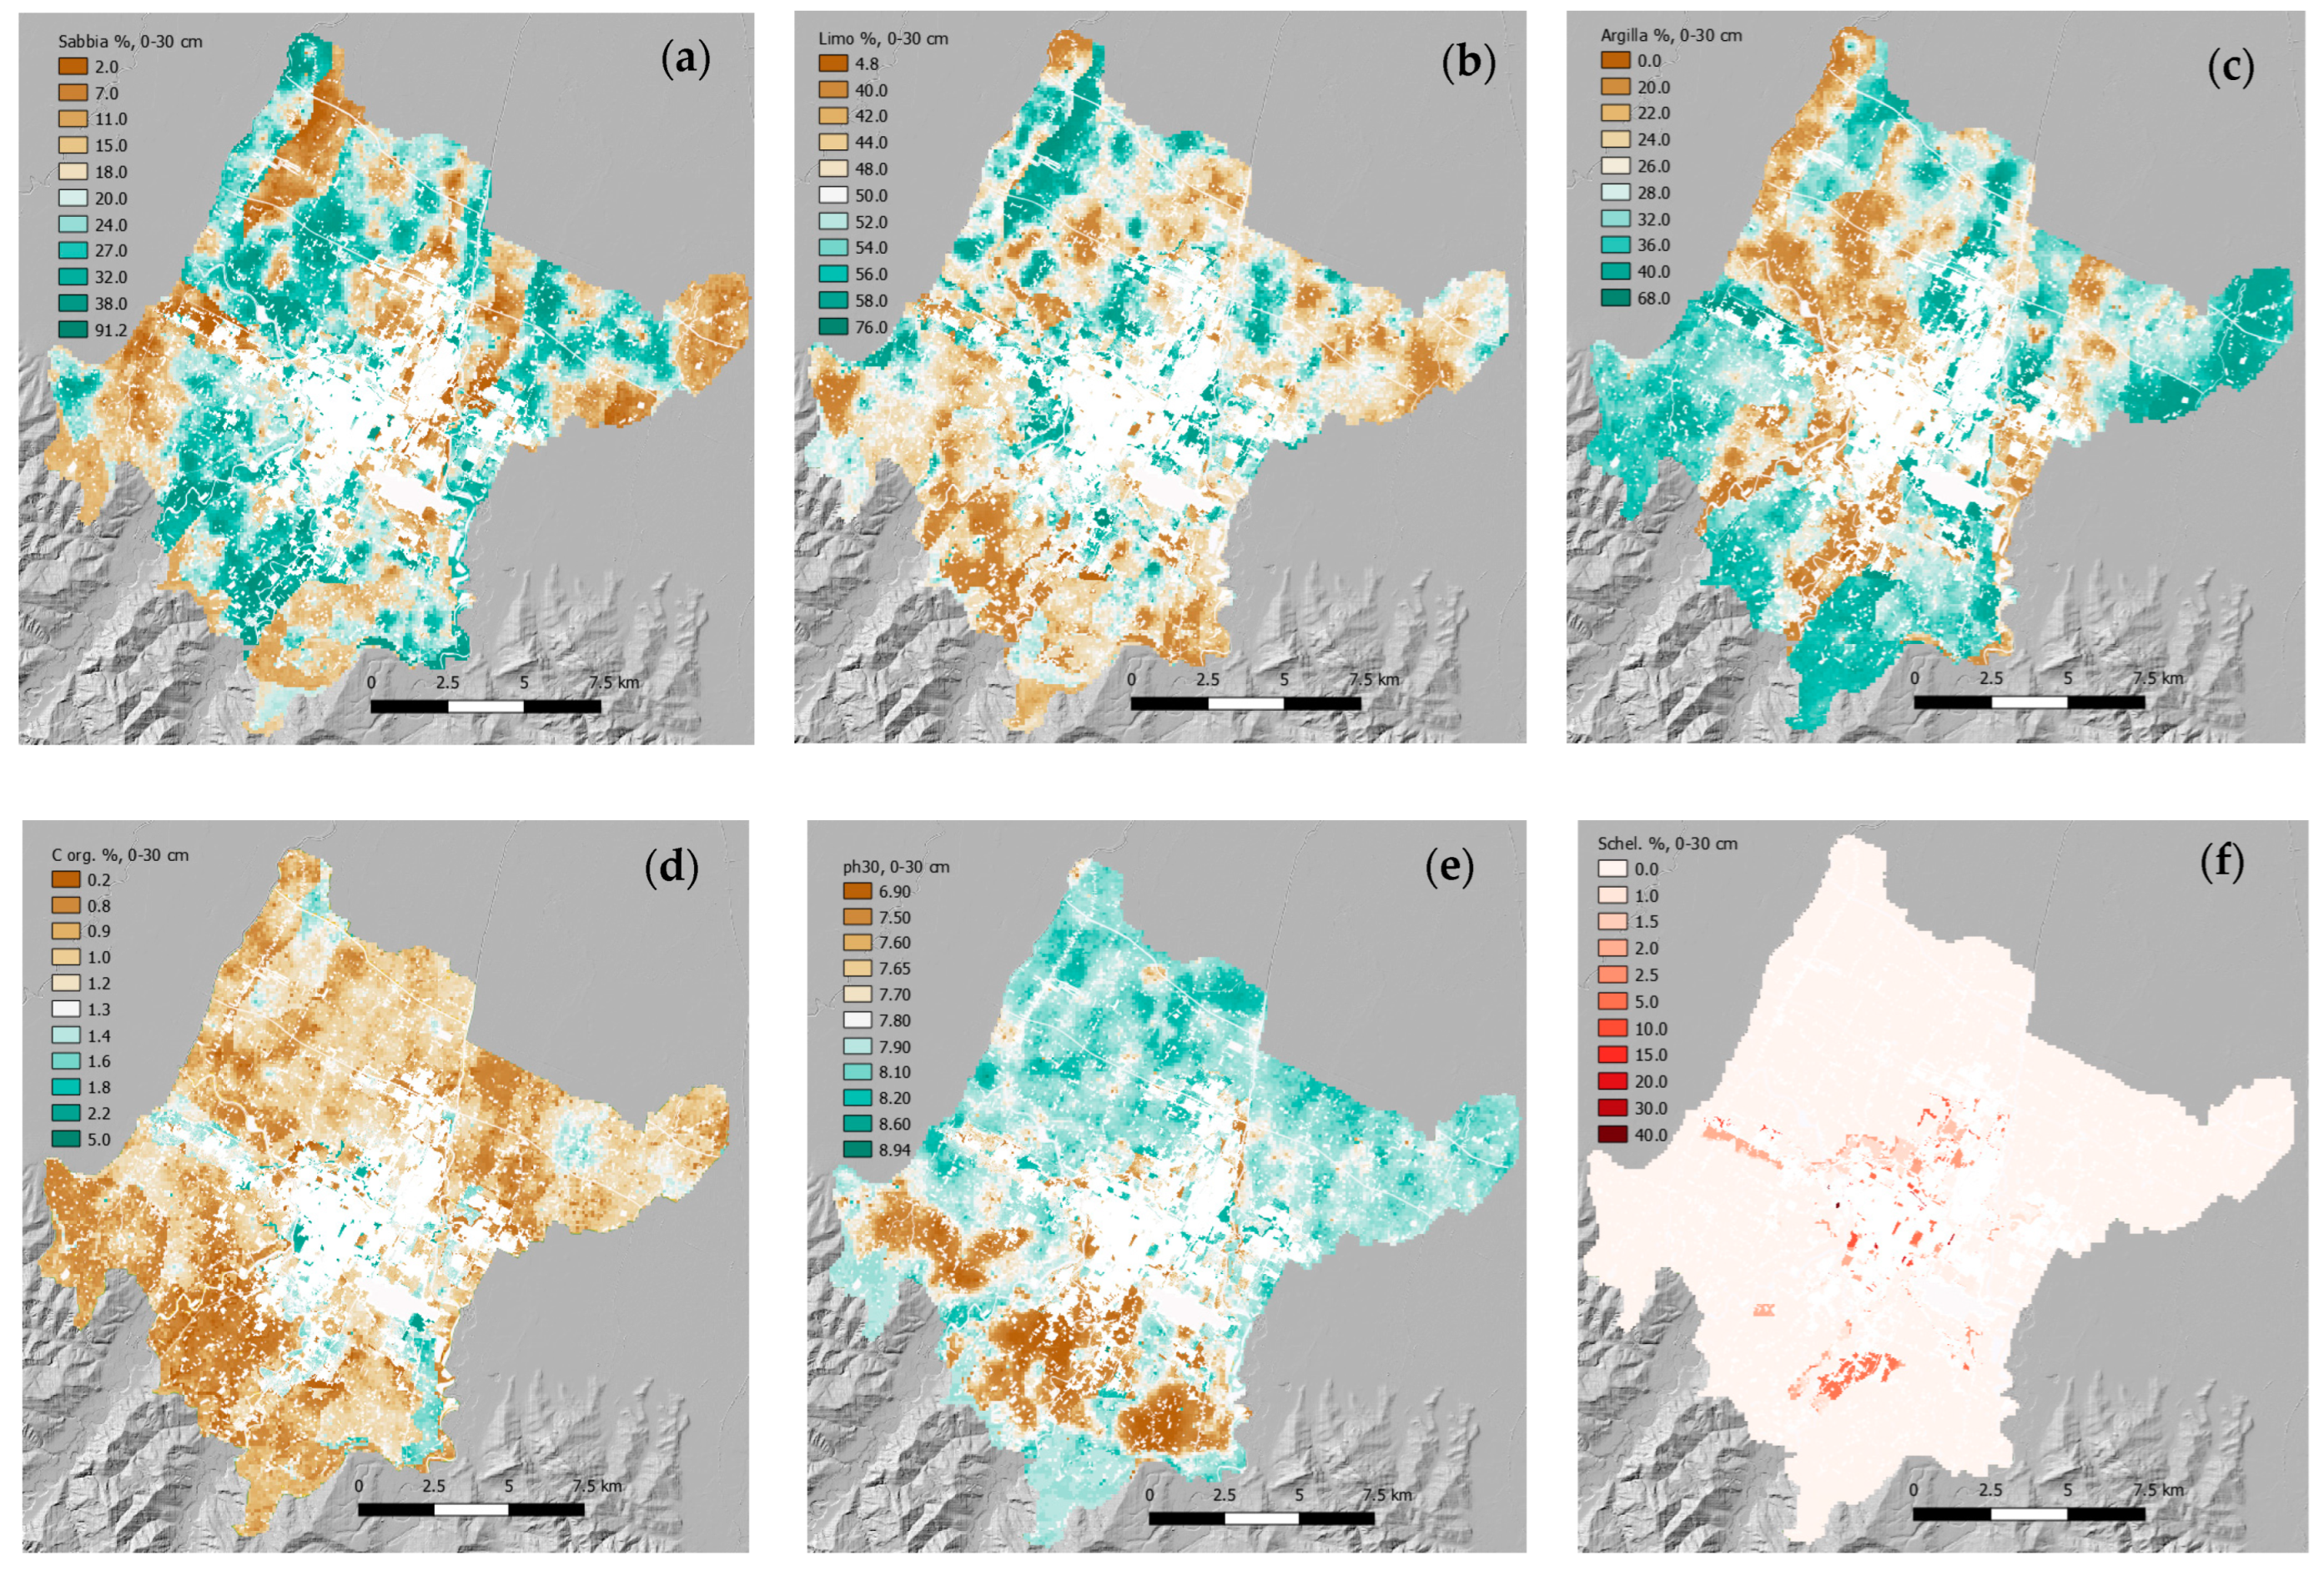
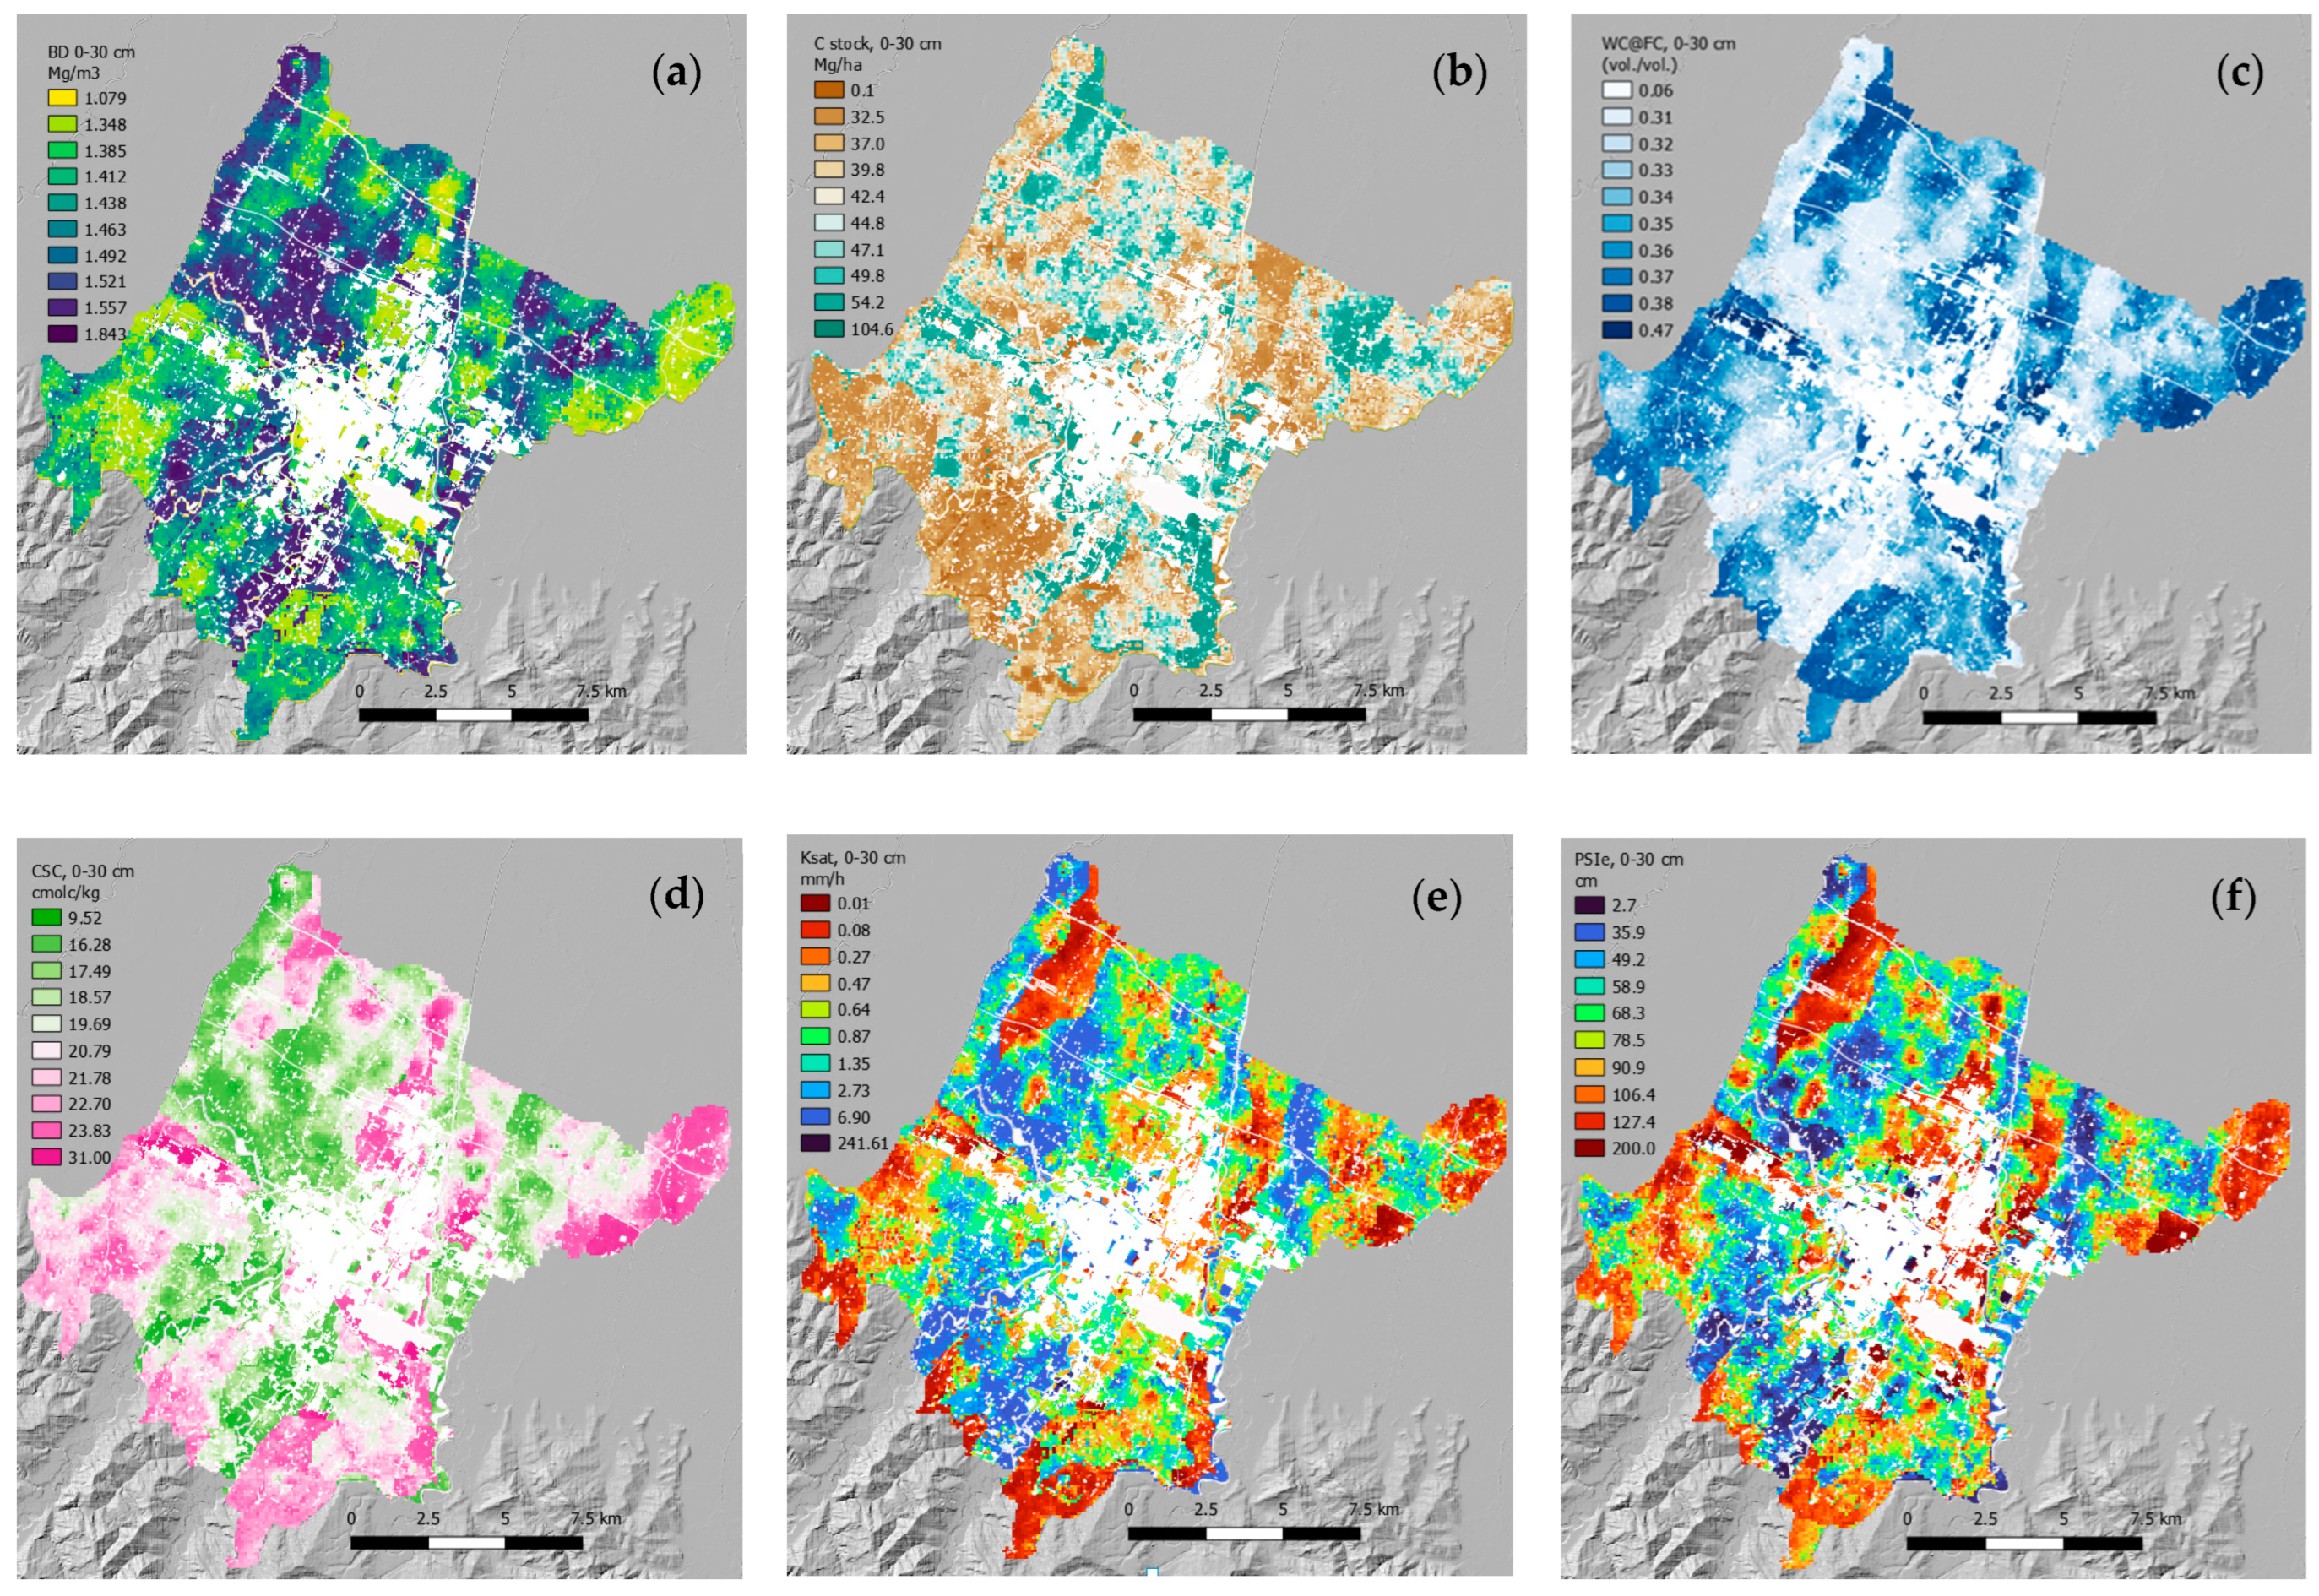
3.2. Maps of Soil Properties
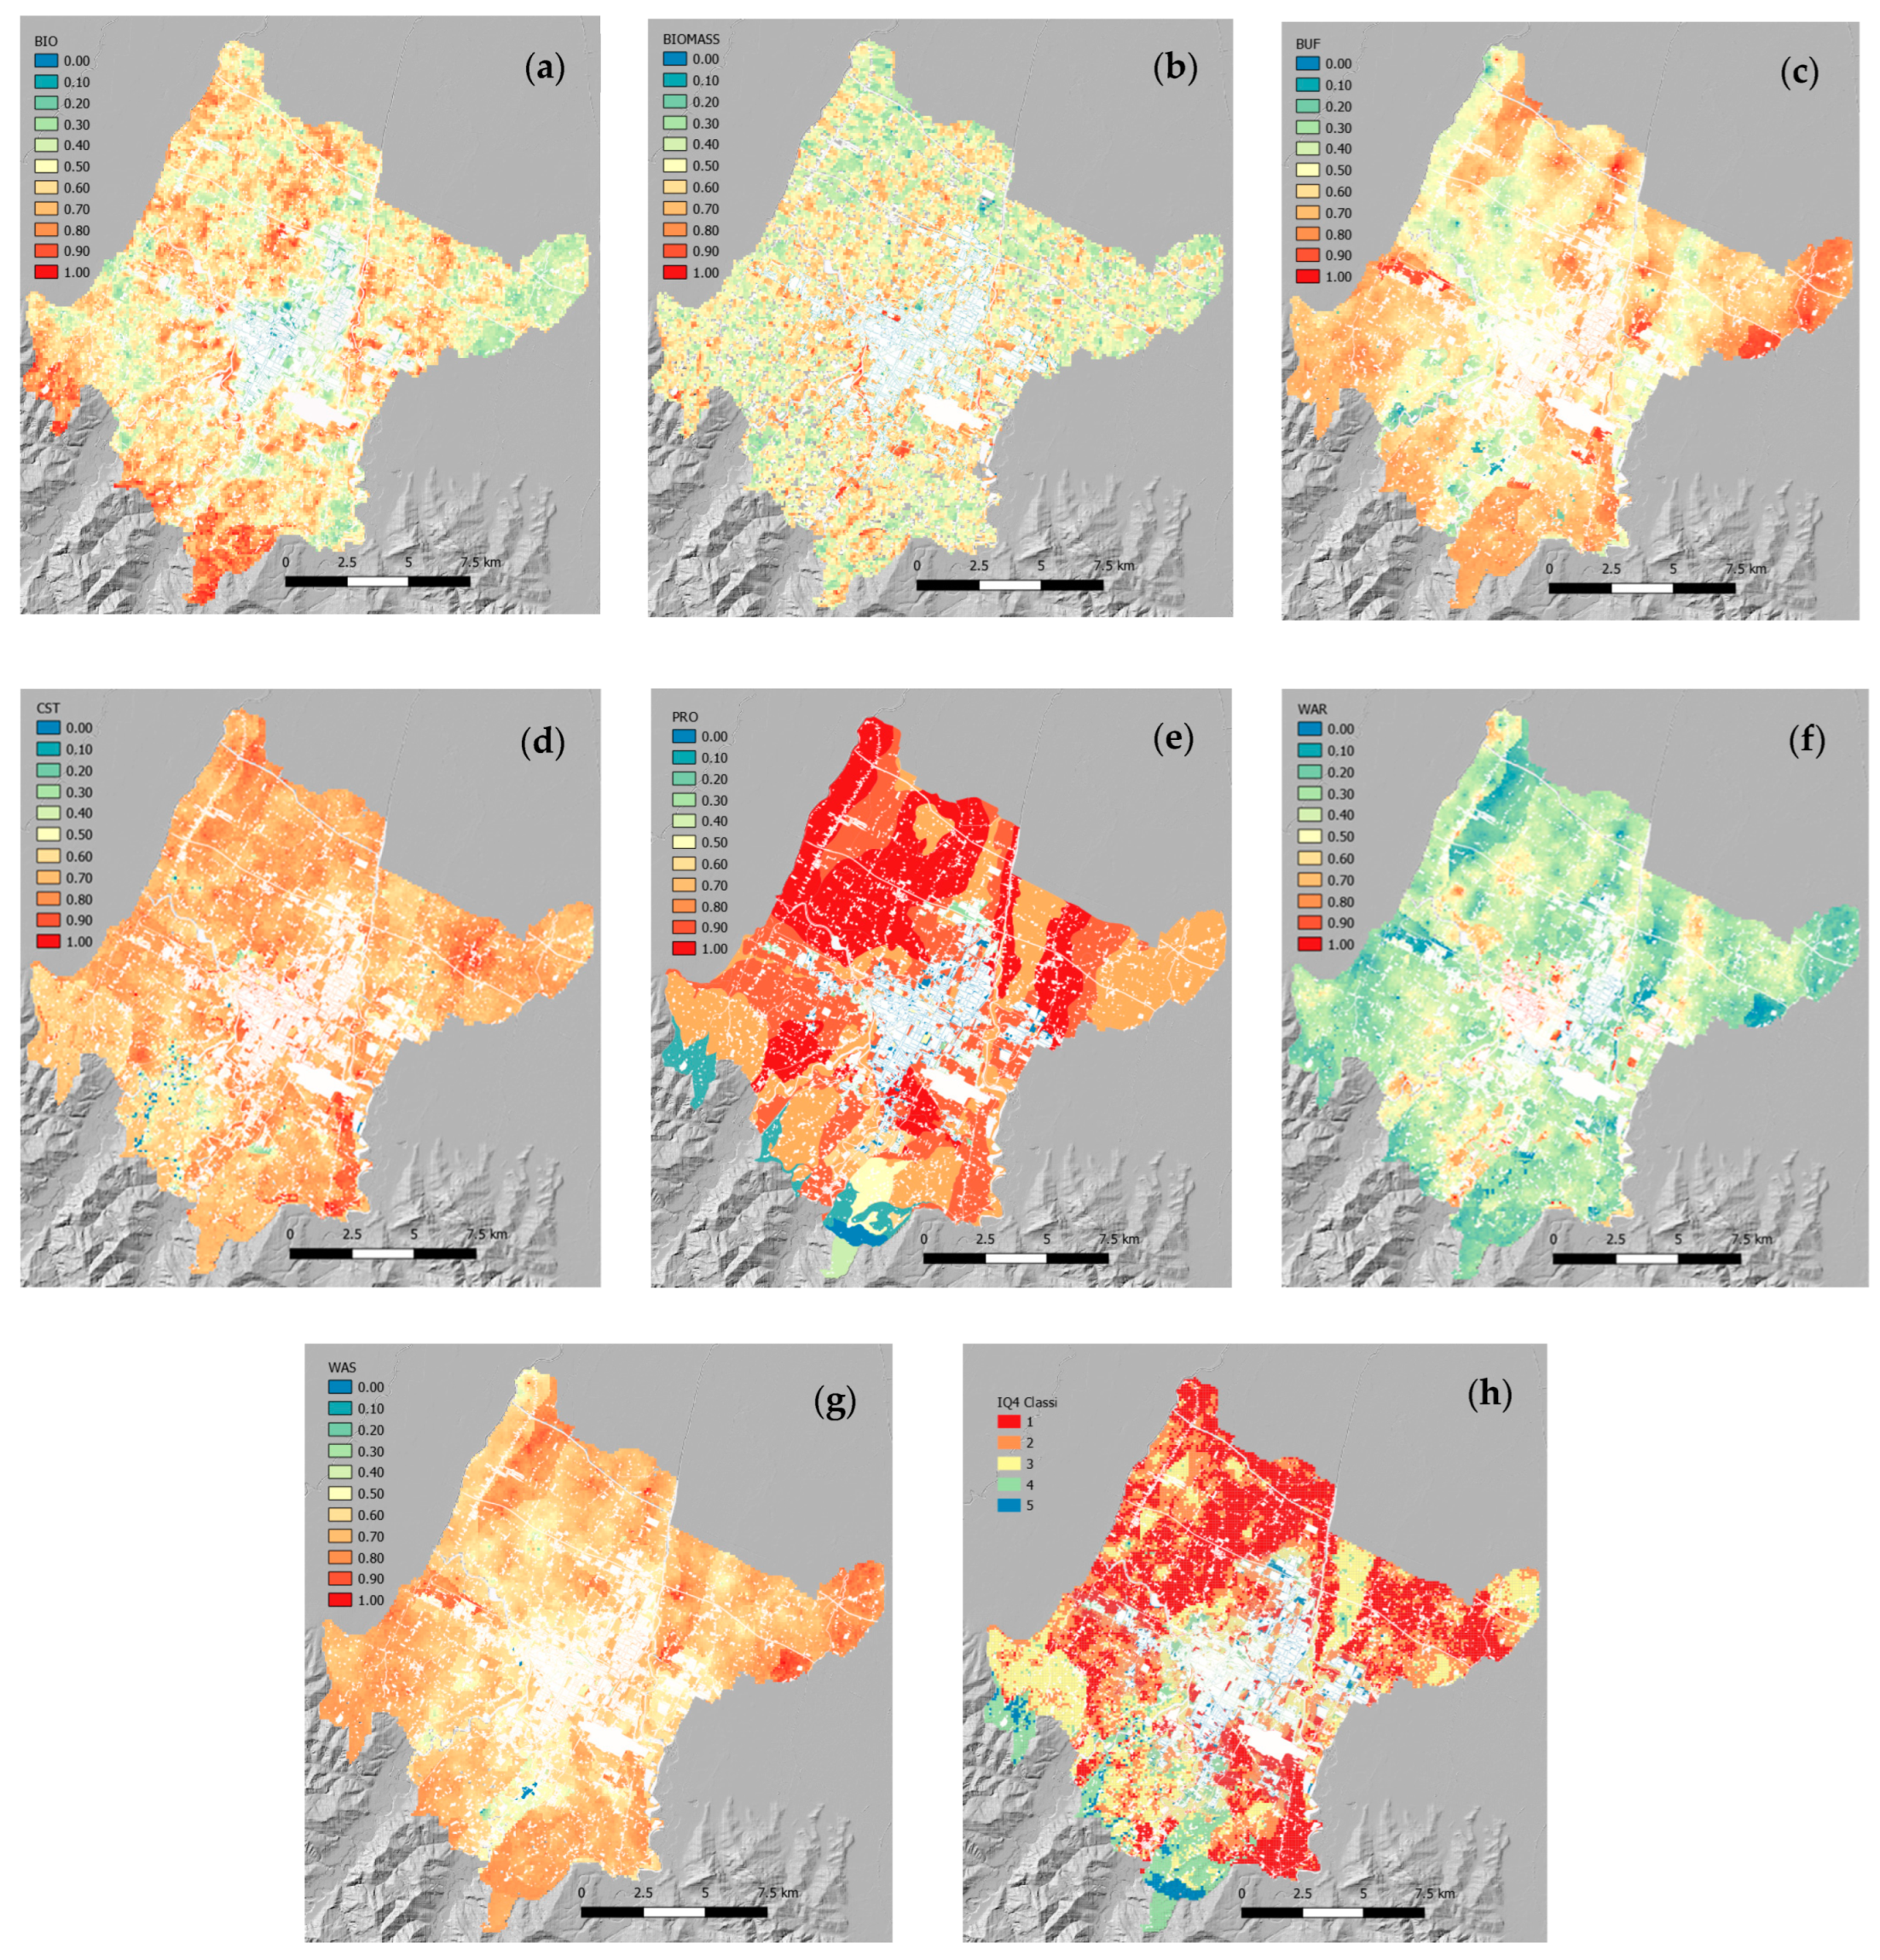
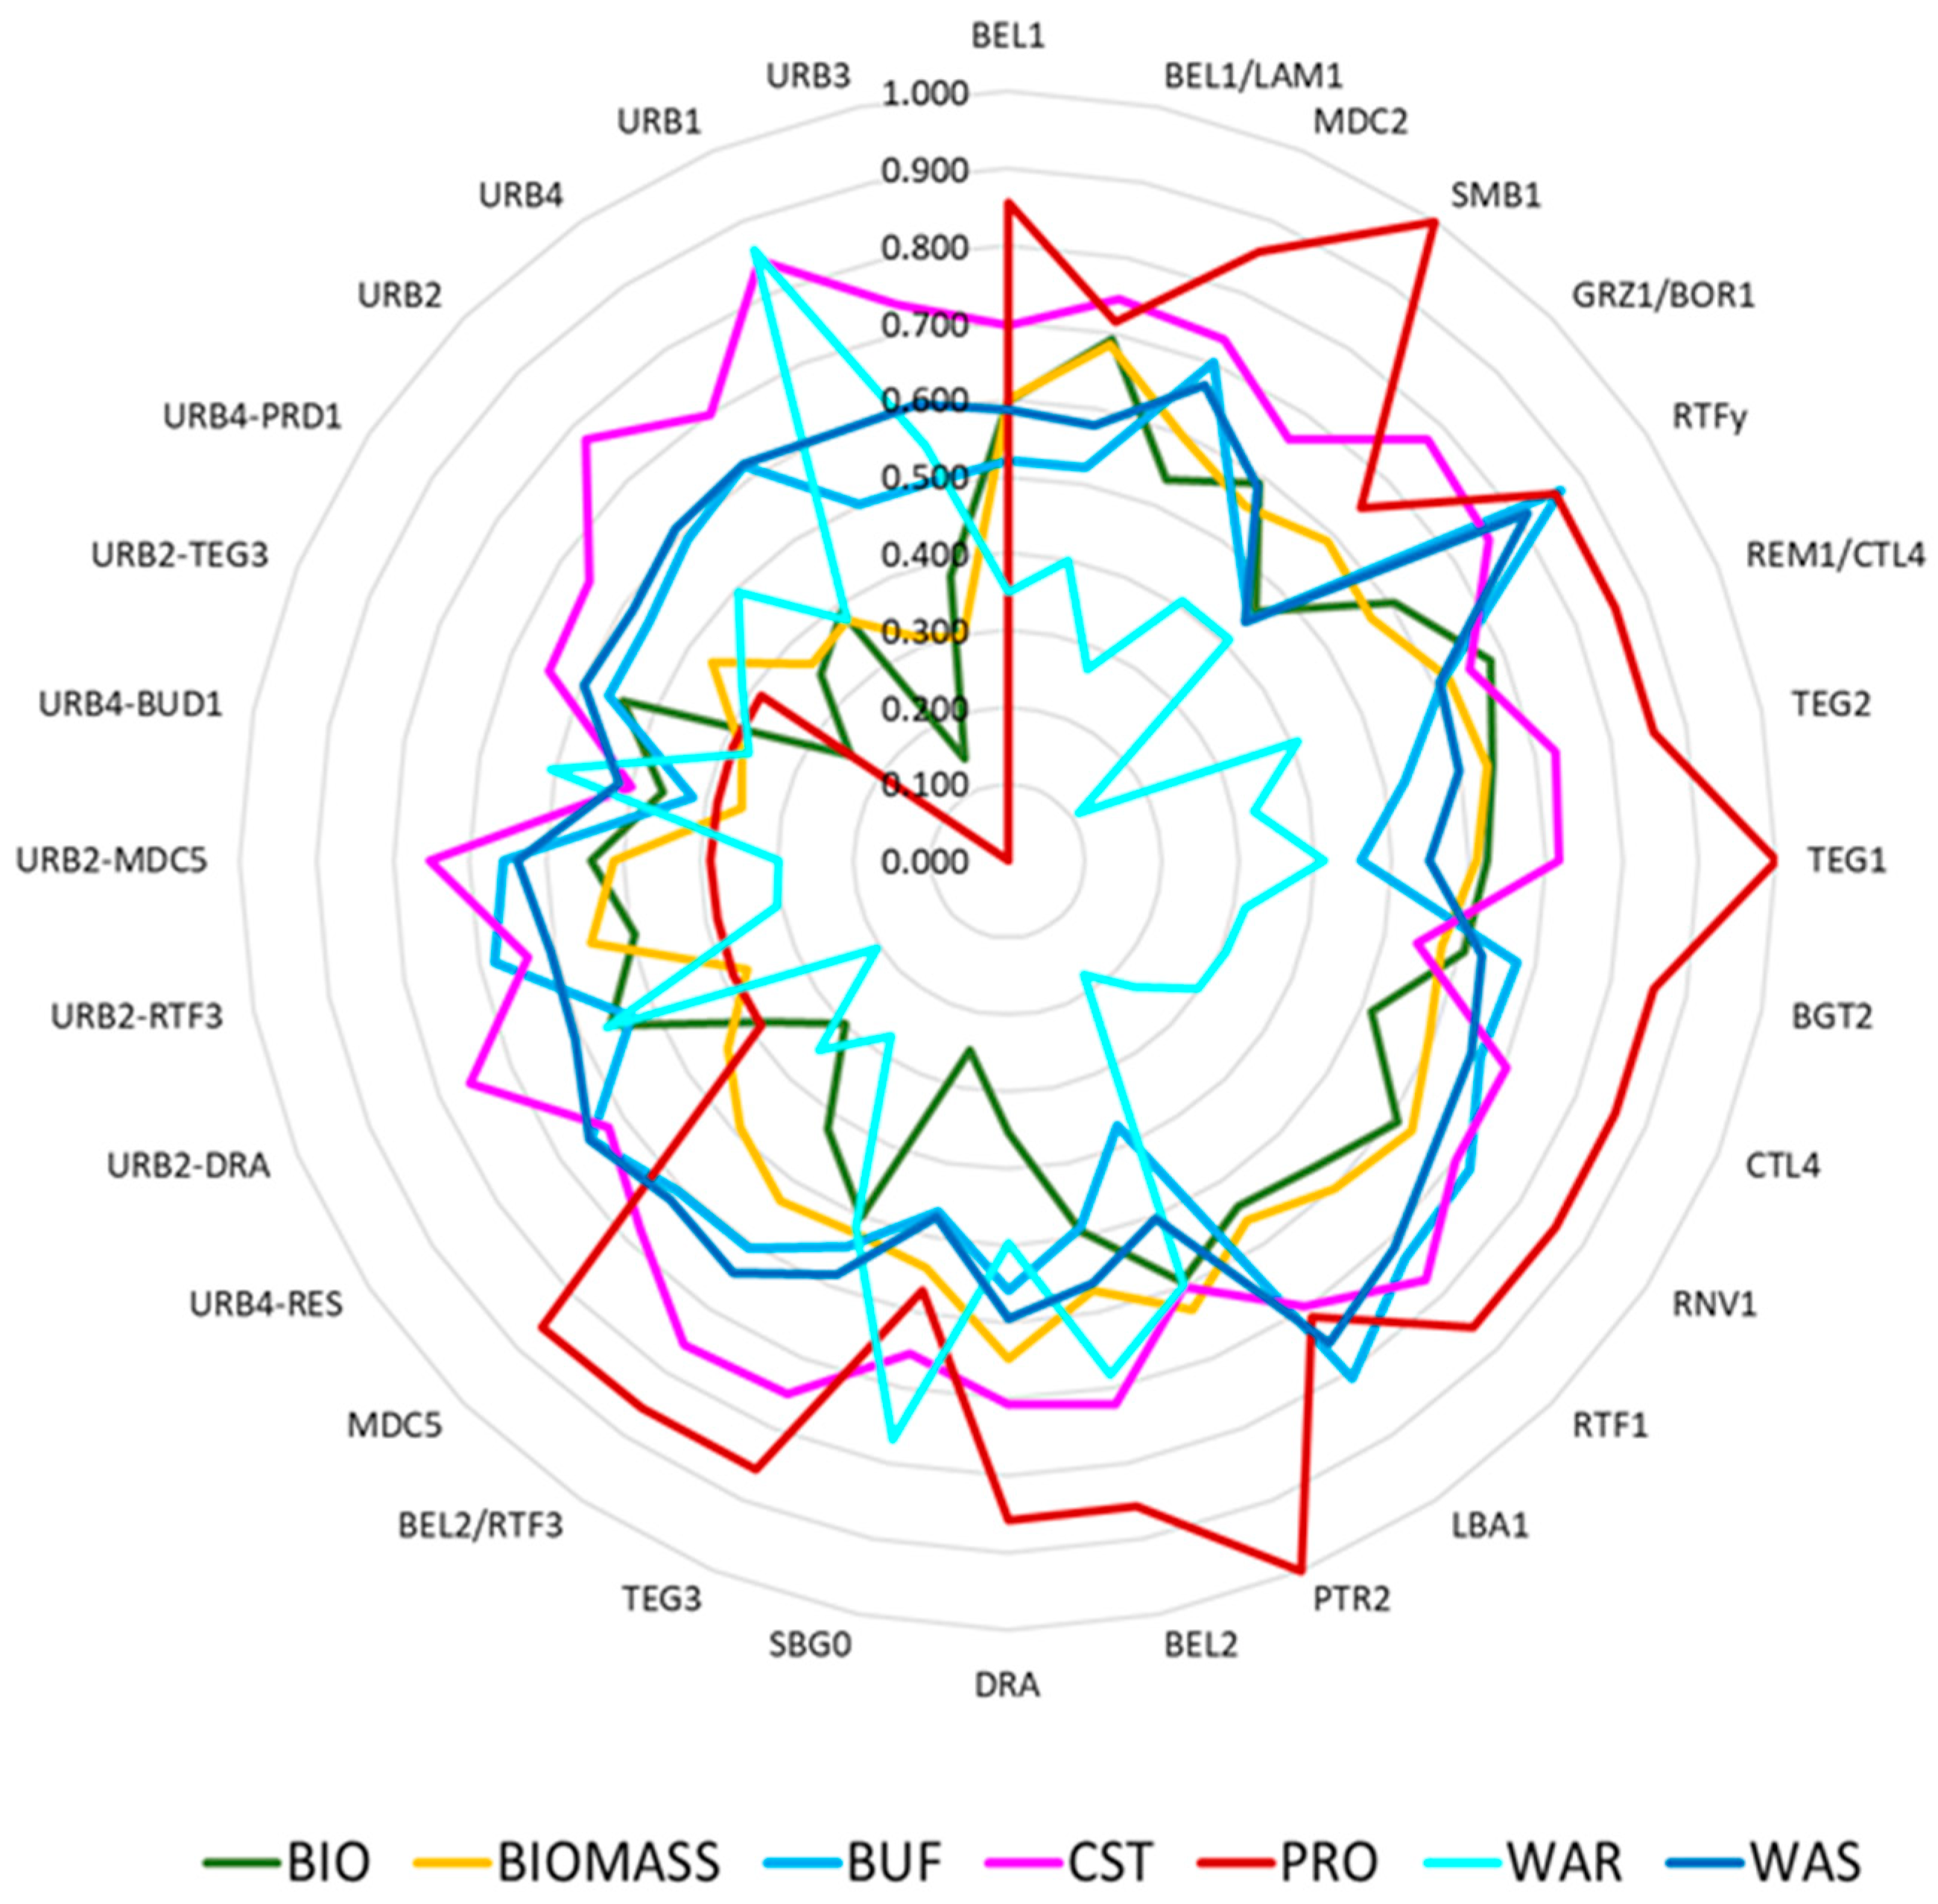
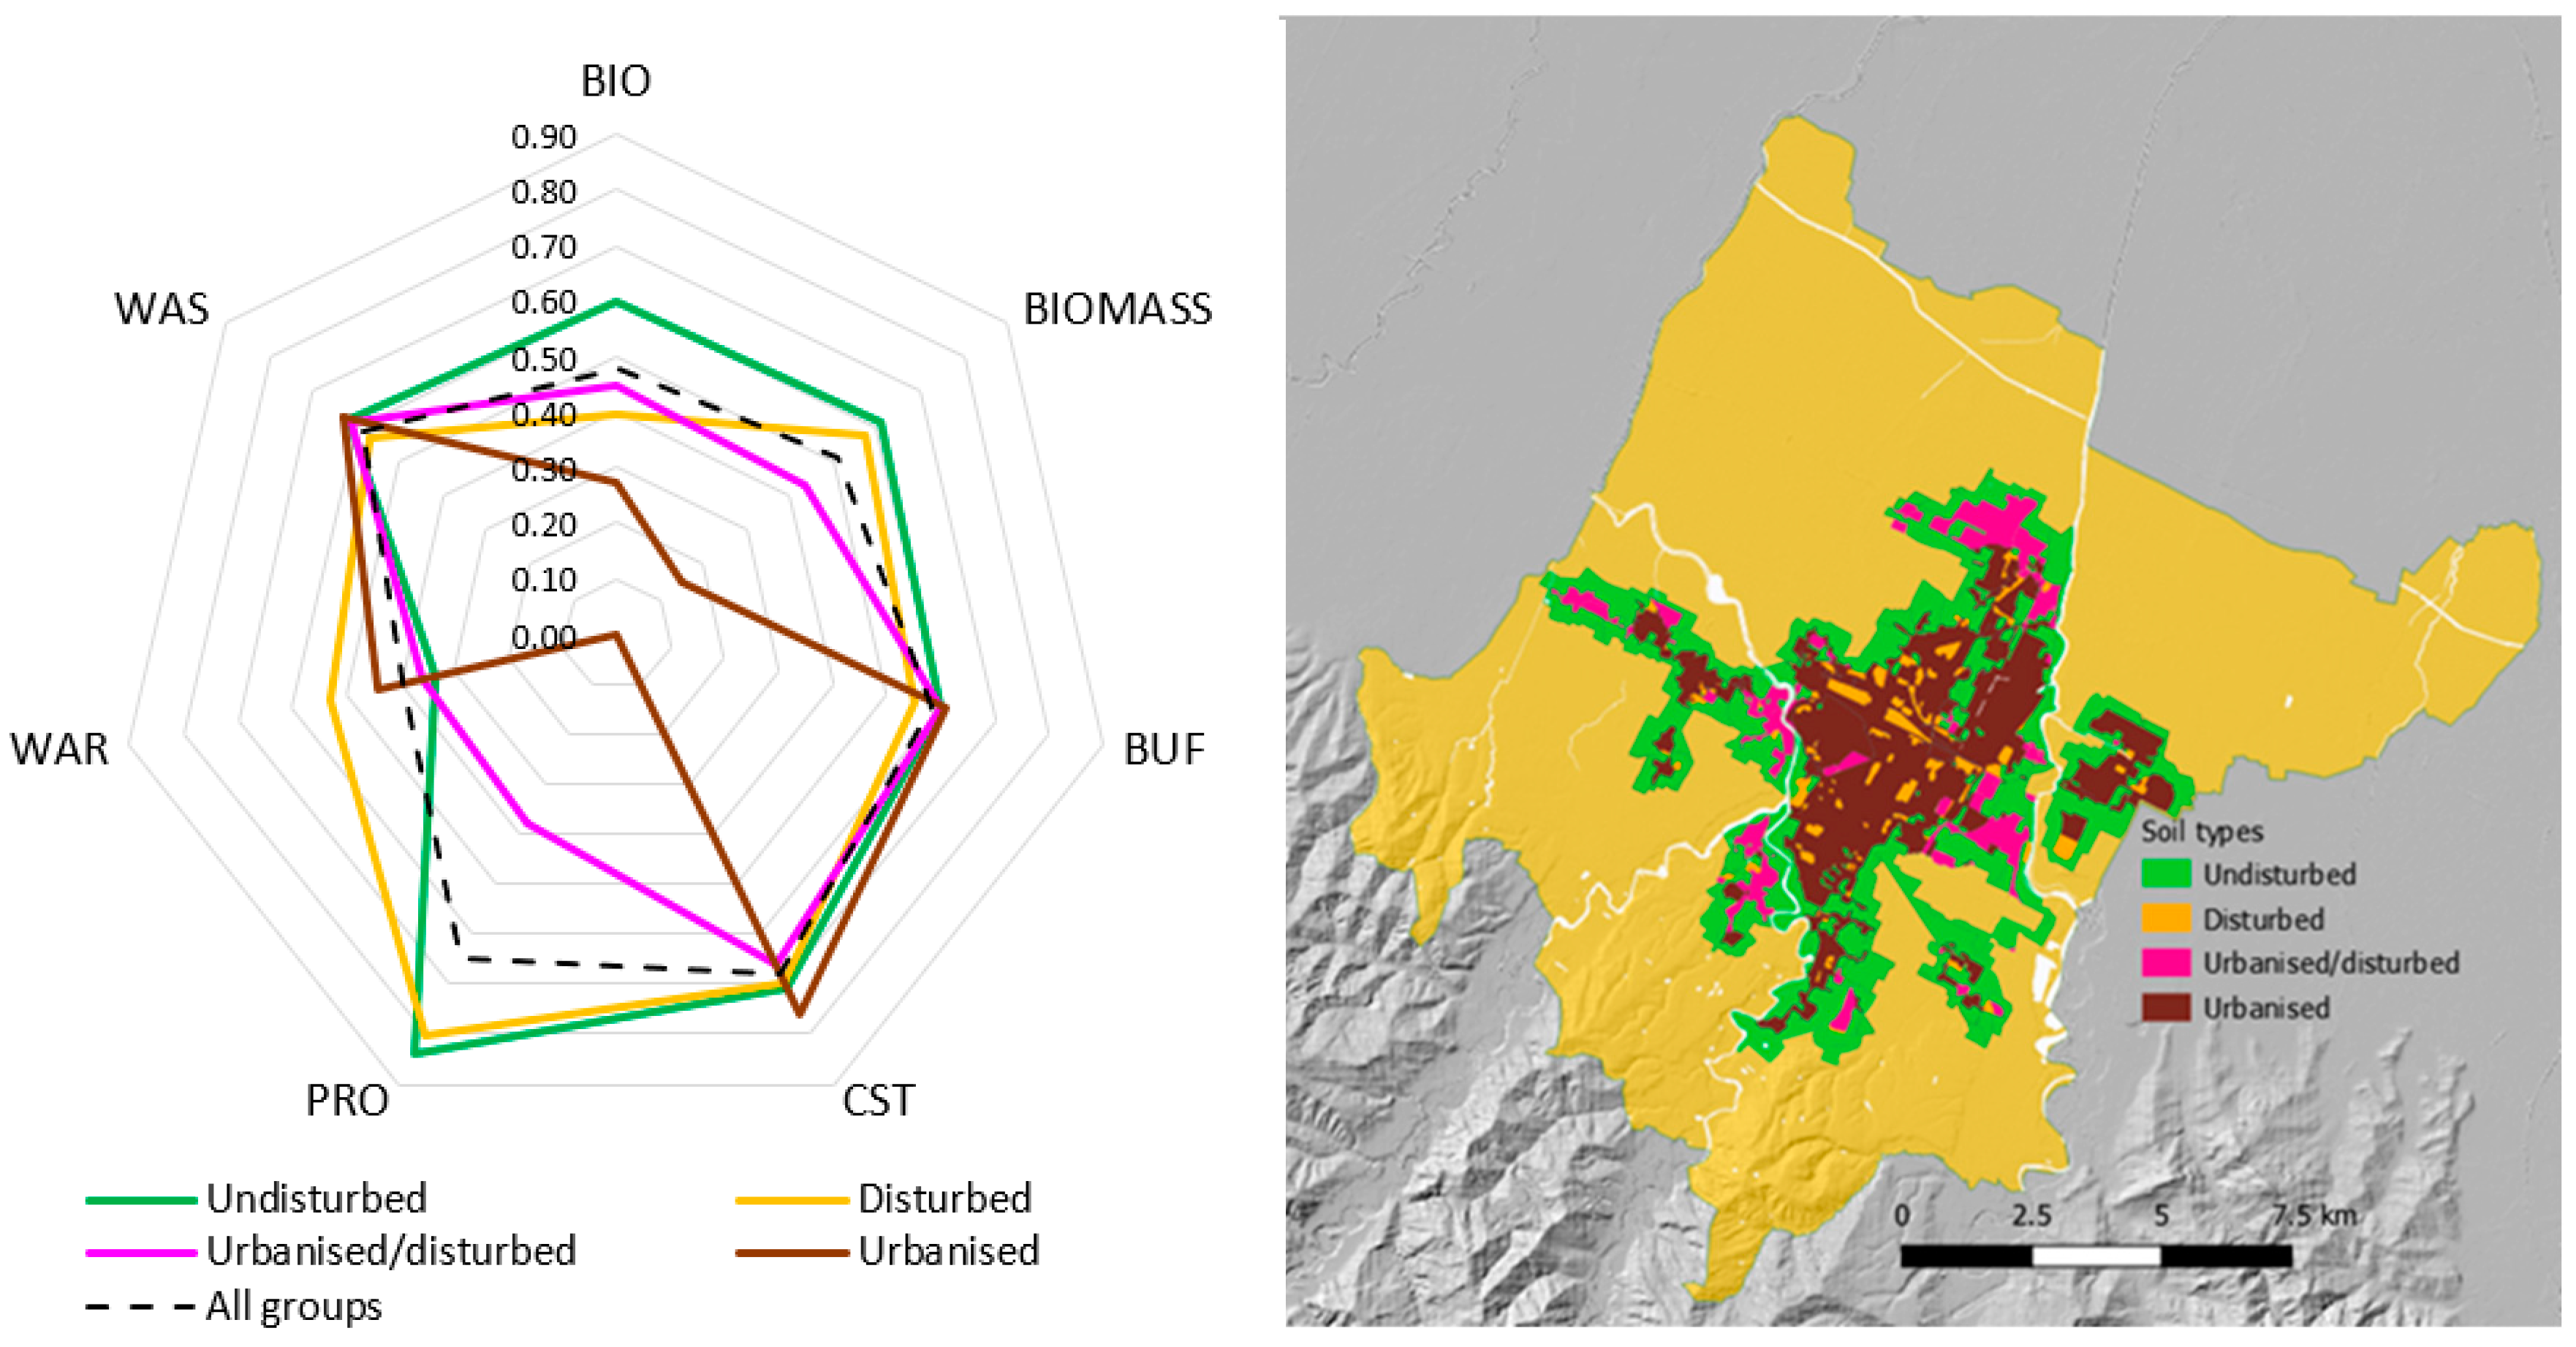
3.3. Urban Soils Ecosystem Services: Assessment and Mapping
4. Discussion
5. Conclusions
Supplementary Materials
Author Contributions
Funding
Data Availability Statement
Acknowledgments
Conflicts of Interest
Abbreviations
| BIO | habitat for biodiversity |
| BIOMASS | biomass production |
| BUF | buffering capacity |
| CLC | CORINE Land Cover |
| CST | carbon sequestration |
| DSM | digital soil mapping |
| IQ4 | soil quality index |
| LCC | Land Capability Class |
| NDVI | Normalized Difference Vegetation Index |
| PRO | food production |
| PTF | pedotransfer function |
| PUG | General Urban Plan |
| QBSar | soil biological quality |
| SES | soil-based ecosystem service |
| SGS | sequential Gaussian simulation |
| SOM | soil organic matter |
| WAR | water regulation |
| WAS | water storage |
References
- O’Riordan, R.; Davies, J.; Stevens, C.; Quinton, J.N.; Boyko, C. The ecosystem services of urban soils: A review. Geoderma 2021, 395, 115076. [Google Scholar] [CrossRef]
- Nielsen, R.W. Mathematical Analysis of Anthropogenic Signatures: The Great Deceleration. Open-Access E-Print Archive. 2018, pp. 1–41. Available online: https://arxiv.org/pdf/1803.06935 (accessed on 14 January 2025).
- Head, M.J.; Steffen, W.; Fagerlind, D.; Waters, C.N.; Poirier, C.; Syvitski, J.; Zalasiewicz, J.A.; Barnosky, A.D.; Cearreta, A.; Jeandel, C.; et al. The Great Acceleration is real and provides a quantitative basis for the proposed Anthropocene Series/Epoch. Episodes 2022, 45, 359–376. [Google Scholar] [CrossRef]
- Yigitcanlar, T.; Kamruzzaman, M. Planning, Development and Management of Sustainable Cities: A Commentary from the Guest Editors. Sustainability 2015, 7, 14677–14688. [Google Scholar] [CrossRef]
- Haque, M.N.; Sharifi, A. Justice in access to urban ecosystem services: A critical review of the literature. Ecosyst. Serv. 2024, 67, 101617. [Google Scholar] [CrossRef]
- Salata, S.; Uzelli, T. Are Soil and Geology Characteristics Considered in Urban Planning? An Empirical Study in Izmir (Türkiye). Urban Sci. 2023, 7, 5. [Google Scholar] [CrossRef]
- da Silva, T.; Fleskens, L.; van Delden, H.; van der Ploeg, M. Incorporating soil ecosystem services into urban planning: Status, challenges and opportunities. Landsc. Ecol. 2018, 33, 1087–1102. [Google Scholar] [CrossRef]
- Petrova, S.; Nikolov, B. Soil related ecosystem services in urban areas—A literature review. Ecol. Balk. 2023, 15, 203–231. Available online: https://eb.bio.uni-plovdiv.bg/wp-content/uploads/2023/10/203-231_eb23304.pdf (accessed on 26 March 2025).
- Rattan Lal, R.; Negassa, W.; Lorenz, K. Carbon sequestration in soil. Curr. Opin. Environ. Sustain. 2015, 15, 79–86. [Google Scholar] [CrossRef]
- Singh, B.K. (Ed.) Soil Carbon Storage. Modulators, Mechanisms and Modeling, 1st ed.; Academic Press: Cambridge, MA, USA, 2018; p. 340. [Google Scholar]
- Blanchart, A.; Consalès, J.N.; Séré, G.; Schwartz, C. Consideration of soil in urban planning documents—A French case study. J. Soils Sediments 2019, 19, 3235–3244. [Google Scholar] [CrossRef]
- Pereira, P.; Inácio, M.; Pinto, L.; Kalinauskas, M.; Bogdzevic, K.; Zhao, W. Mapping ecosystem services in urban and peri-urban areas. A systematic review. Geogr. Sustain. 2024, 3, 491–509. [Google Scholar] [CrossRef]
- Yang, J.L.; Zhang, G.L. Formation, characteristics and eco-environmental implications of urban soils—A review. Soil Sci. Plant Nutr. 2015, 61 (Suppl. S1), 30–46. [Google Scholar] [CrossRef]
- Ossola, A.; Livesley, S.J. Drivers of soil heterogeneity in the urban landscape. In Urban Landscape Ecology, 1st ed.; Francis, R.A., Millington, J.D.A., Chadwick., M.A., Eds.; Taylor & Francis: London, UK, 2016; pp. 19–42. [Google Scholar]
- Katikas, L.; Krzywoszynska, A.; Naciph Mora, K.; Roca Vallejo, R. Preliminary assessment of the knowledge gaps related to soil literacy. Soils Eur. 2024, 1, e118883. [Google Scholar] [CrossRef]
- Peake, L. Critical Soil Governance Lessons from Around the World: The Good, The Bad and the Ugly. In Proceedings of the Soil Policy Legacy Report, 22nd World Congress of Soil Science, Glasgow, UK, 24 December 2022; Available online: https://soils.org.uk/wp-content/uploads/2023/02/BSSS_WCSS-Soil-Policy-Legacy-Report_Jan-2023_Final_no-crops-compressed.pdf (accessed on 14 January 2025).
- Orlova, K.S.; Savin, I.Y. Ecosystem Services Provided by Urban Soils and Their Assessment: A Review. Eurasian Soil Sci. 2024, 57, 1072–1083. [Google Scholar] [CrossRef]
- Ungaro, F.; Maienza, A.; Ugolini, F.; Lanini, G.M.; Baronti, S.; Calzolari, C. Assessment of joint soil ecosystem services supply in urban green spaces: A case study in Northern Italy. Urban For. Urban Green. 2022, 67, 127455. [Google Scholar] [CrossRef]
- Hyun, J.; Kim, Y.J.; Yoo, G. A method for soil quality assessment in the metropolitam greenery: A comprehensive view of ecosystem services and soil functions. MethodsX 2023, 10, 102102. [Google Scholar] [CrossRef] [PubMed]
- Hyun, J.; Kim, Y.J.; Kim, A.; Plante, A.F.; Yoo, G. Ecosystem services-based soil quality index tailored to the metropolitan environment for soil assessment and management. Sci. Total Environ. 2022, 820, 153301. [Google Scholar] [CrossRef]
- Séré, G.; Lothode, M.; Blanchart, A.; Chirol, C.; Tribotte, A.; Schwartz, C. Destisol: A decision-support tool to assess the ecosystem services provided by urban soils for better urban planning. Eur. J. Soil Sci. 2024, 75, 13557. [Google Scholar] [CrossRef]
- Calzolari, C.; Tarocco, P.; Lombardo, N.; Marchi, N.; Ungaro, F. Assessing soil ecosystem services in urban and peri-urban areas: From urban soils survey to providing support tool for urban planning. Land Use Policy 2020, 99, 105037. [Google Scholar] [CrossRef]
- Calzolari, C.; Ungaro, F.; Filippi, N.; Guermandi, M.; Malucelli, F.; Marchi, N.; Staffilani, F.; Tarocco, P. A methodological framework to assess the multiplicity of ecosystem services of soils at regional scale. Geoderma 2016, 261, 190–203. [Google Scholar] [CrossRef]
- Science for Environment Policy. No Net Land Take by 2050? Future Brief 14, 2016. Produced for the European Commission DG Environment by the Science Communication Unit, UWE, Bristol. Available online: https://op.europa.eu/en/publication-detail/-/publication/f1ca6673-23cd-11e6-86d0-01aa75ed71a1/language-en (accessed on 26 March 2025).
- ARPAE. Climatological Tables. Available online: https://www.arpae.it/it/temi-ambientali/clima/dati-e-indicatori/tabelle-climatiche (accessed on 26 March 2025).
- Cremonini, L.; Randi, P.; Fazzini, M.; Nardino, M.; Rossi, F.; Georgiadis, T. Causes and Impacts of Flood Events in Emilia-Romagna (Italy) in May 2023. Land 2024, 13, 1800. [Google Scholar] [CrossRef]
- WMO. Manual for estimation of probable maximum precipitation, Operational Hydrology Report 1, World Meteorological Organization Paper n. 332. 1986. [Google Scholar]
- SNPA. Consumo di Suolo, Dinamiche Territoriali e Servizi Ecosistemici. Edizione 2024, Report Ambientali SNPA, 43/2024. Available online: https://www.snpambiente.it/temi/suolo/consumo-di-suolo-dinamiche-territoriali-e-servizi-ecosistemici-edizione-2024/ (accessed on 14 January 2025).
- Regione Emilia-Romagna. Coperture Vettoriali Uso del Suolo di Dettaglio—Edizione 2018. Servizio Statistica, Comunicazione, Sistemi inf. Geografici, Educ. Alla Sostenibilità, Partecipazione, Regione Emilia-Romagna. 2018. Available online: https://geoportale.regione.emilia-romagna.it/download/dati-e-prodotti-cartografici-preconfezionati/pianificazione-e-catasto/uso-del-suolo/2014-coperture-vettoriali-uso-del-suolo-di-dettaglio-edizione-2018 (accessed on 15 January 2025).
- Tarocco, P. Carta dei Suoli Della Regione Emilia-Romagna, scala 1:50.000. Edizione 2021. Regione Emilia-Romagna, Servizio Geologico Sismico e dei Suoli. Available online: http://mappegis.regione.emilia-romagna.it/gstatico/documenti/dati_pedol/carta_suoli_50k.pdf (accessed on 15 January 2025).
- USDA. Soil Survey Manual. In USDA Handbook; Government Printer: Washington, DC, USA, 1993; Volume 18, pp. 136–140. [Google Scholar]
- Decreto Ministeriale del 13/09/1999. Approvazione dei “Metodi Ufficiali di Analisi Chimica del Suolo”. Emanato da: Ministro per le Politiche Agricole e Pubblicato su: Gazz. Uff. Suppl. Ordin. n° 248 del 21/10/1999. Available online: https://www.gazzettaufficiale.it/eli/id/2016/04/18/16A02762/sg (accessed on 16 January 2025).
- MEA. Millennium Ecosystem Assessment: Ecosystems and Human Well-Being 5; Island Press: Washington, DC, USA, 2005; Available online: https://www.millenniumassessment.org/documents/document.356.aspx.pdf (accessed on 15 January 2025).
- Haines-Young, R.; Potschin, M.B. Common International Classification of Ecosystem Services (CICES), V5.1 and Guidance on the Application of the Revised Structure. 2018. Available online: https://cices.eu/content/uploads/sites/8/2018/01/Guidance-V51-01012018.pdf (accessed on 15 January 2025).
- Dominati, E.; Patterson, M.; Mackay, A. A framework for classifying and quantifying the natural capital and ecosystem services of soils. Ecol. Econ. 2010, 69, 1858–1868. [Google Scholar] [CrossRef]
- Ungaro, F.; Calzolari, C. Carta dei Servizi Ecosistemici dei Suoli Della Regione Emilia-Romagna Scala 1:50.000, Note Illustrative (Second Ed.) 2023. Regione Emilia-Romagna, Direzione Generale Cura del Territorio e deLL’AMbiente, Area Geologia, Suoli e Sismica. Available online: https://doi.org/10.13140/RG.2.2.33676.08328 (accessed on 26 March 2025).
- Menta, C.; Conti, F.D.; Pinto, S.; Bodini, A. Soil Biological Quality index (QBS-ar): 15 years of application at global scale. Ecol. Indic. 2018, 85, 773–780. [Google Scholar] [CrossRef]
- Xue, J.; Su, B. Significant remote sensing vegetation indices: A review of developments and applications. J. Sens. 2017, 2017, 1353691. [Google Scholar] [CrossRef]
- Gorelick, N.; Hancher, M.; Dixon, M.; Ilyushchenko, S.; Thau, D.; Moore, R. Google Earth Engine: Planetary-scale geospatial analysis for everyone. Remote Sens. Environ. 2017, 202, 18–27. [Google Scholar] [CrossRef]
- Klingelbiel, A.A.; Montgomery, P.H. Land capability classification. In USDA Agricultural Handbook 210; US Governement Printing Office: Washington, DC, USA, 1961. [Google Scholar]
- Regione Emilia-Romagna. Carta Della Capacità d’uso dei Suoli ai Fini Agricoli e Forestali Della Pianura Emiliano-Romagnola in Scala 1:50,000. Servizio Geologico Sismico e dei Suoli, Regione Emilia-Romagna. 2021. Available online: http://geo.regione.emilia-romagna.it/gstatico/documenti/dati_pedol/CAPACITA_USO.pdf (accessed on 16 January 2025).
- Ungaro, F.; Calzolari, C.; Busoni, E. Development of pedotransfer functions using a group method of data handling for the soil of the Pianura Padano-Veneta region of North Italy: Water retention properties. Geoderma 2005, 124, 293–317. [Google Scholar] [CrossRef]
- Ungaro, F.; Calzolari, C.; Pistocchi, A.; Malucelli, F. Modelling the impact of increasing soil sealing on runoff coefficients at regional scale: A hydropedological approach. J. Hydrol. Hydromech. 2014, 62, 33–42. [Google Scholar] [CrossRef]
- Calzolari, C.; Ungaro, F. Predicting shallow water table depth at regional scale from rainfall and soil data. J. Hydrol. 2012, 414–415, 374–387. [Google Scholar] [CrossRef]
- Wu, J.; Feng, Z.; Gao, Y.; Peng, J. Hotspot and relationship identification in multiple landscape services: A case study on an area with intensive human activities. Ecol. Indic. 2013, 29, 529–537. [Google Scholar] [CrossRef]
- Goovaerts, P. Geostatistics for Natural Resources Evaluation; Oxford University Press: New York, NY, USA, 1997; pp. 266–271. [Google Scholar]
- Statios. WinGslib, Version 1.3; Statios Software and Services: San Francisco, CA, USA, 2000. Available online: http://www.statios.com/Quick/gslib.html (accessed on 26 March 2025).
- Deutsch, C.V.; Journel, A.G. GSLIB, Geostatistical Software Library and User’s Guide, 2nd ed.; Oxford University Press: New York, NY, USA, 1998; 369p. [Google Scholar]
- QGIS Development Team. QGIS Geographic Information System. Open-Source Geospatial Foundation Project. 2023. Available online: http://qgis.osgeo.org (accessed on 26 March 2025).
- Regione Emilia-Romagna, Uso del Suolo di Dettaglio: Consultazione On-Line Delle Edizioni di Dettaglio 1976-78, 1994, 2003, 2008, 2014, 2017 e 2020, Integrate Con la Cartografia di Base Della Regione Emilia-Romagna. Available online: https://geoportale.regione.emilia-romagna.it/applicazioni-gis/regione-emilia-romagna/pianificazione-e-catasto/uso-del-suolo/uso-del-suolo-standard (accessed on 24 January 2025).
- Calzolari, C.; Ungaro, F.; Calogiuri, T.; Marchi, N.; Tarocco, P.; Bazzocchi, S.; Barlotti, M.; Magnani, A.; Marzolo, S.; Lombardo, F. Valutazione dei Servizi Ecosistemici e Stima Degli Impatti Economici e Ambientali Conseguenti al Consumo E all’impermeabilizzazione dei Suoli nei Comuni di Forlì, Carpi e S. Lazzaro di Savena. Deliverable SOS4Life 19 B1.2. 2018. Available online: https://www.sos4life.it/wp-content/uploads/SOS4Life_Stima-degli-impatti-conseguenti-al-consumo-di-suolo-nei-comuni-partner_B.1.2-1.pdf (accessed on 26 January 2025).
- Kamalova, A.; Gordeev, A.; Galitskaya, P.; Selivanovskaya, S. Assessment of Soil Quality in Urban Green Areas of Two Russian Cities by Means of Chemical and Biological Methods. In Smart and Sustainable Urban Ecosystems: Challenges and Solutions; Korneykova, M., Vasenev, V., Dovletyarova, E., Valentini, R., Gorbov, S., Vinnikov, D., Dushkova, D., Eds.; SSC 2022. Springer Geography; Springer: Cham, Germany, 2022. [Google Scholar] [CrossRef]
- Tresch, S.; Moretti, M.; Le Bayon, R.C.; Mäder, P.; Zanetta, A.; Frey, D.; Stehle, B.; Kuhn, A.; Munyangabe, A.; Fliessbach, A. Urban Soil Quality Assessment—A Comprehensive Case Study Dataset of Urban Garden Soils. Front. Environ. Sci. 2018, 6, 00136. [Google Scholar] [CrossRef]
- Yingming, M.; Shuxun, S.; Shiqi, L.; Jinlong, J. Spatial distribution of pH and organic matter in urban soils and its implications on site-specific land uses in Xuzhou, China. Comptes Rendus Biol. 2014, 337, 332–337. [Google Scholar] [CrossRef]
- Canedoli, C.; Ferrè, C.; El Khair, D.A.; Padoa-Schioppa, E.; Comolli, R. Soil organic carbon stock in different urban land uses: High stock evidence in urban parks. Urban Ecosyst. 2020, 23, 159–171. [Google Scholar] [CrossRef]
- Díaz-Sanz, J.; Robert, S.; Keller, C. Parameters influencing run-off on vegetated urban soils: A case study in Marseilles, France. Geoderma 2020, 376, 114455. [Google Scholar] [CrossRef]
- Montgomery, J.A.; Klimas, C.A.; Arcus, J.; DeKnock, C.; Rico, K.; Rodriguez, Y.; Vollrath, K.; Webb, E.; Williams, A. Soil Quality Assessment Is a Necessary First Step for Designing Urban Green Infrastructure. J. Environ. Qual. 2015, 45, 18–25. [Google Scholar] [CrossRef] [PubMed]
- Schindelbeck, R.R.; van Es, H.M.; Abawi, G.S.; Wolfe, D.W.; Whitlow, T.L.; Gugino, B.K. Comprehensive assessment of soil quality for landscape and urban management. Landsc. Urban Plan. 2008, 88, 73–80. [Google Scholar] [CrossRef]
- Vrščaj, B.; Poggio, L.; Ajmone Marsan, F. A method for soil environmental quality evaluation for management and planning in urban areas. Landsc. Urban Plan. 2008, 88, 81–94. [Google Scholar]
- Lehmann, A.; Stahr, K. The potential of soil functions and planner-oriented soil evaluation to achieve sustainable land use. J. Soils Sediments 2010, 10, 1092–1102. [Google Scholar] [CrossRef]
- Lehmann, A.; David, S.; Stahr, K. TUSEC—Handbuch zur Bewertung von natürlichen Böden und anthropogenenStadtböden/TUSEC—A manual for the evaluation of Natural Soils and Anthropogenic Urban Soils. Hohenh. Bodenkd. Hefte 2008, 86, 224. [Google Scholar]
- Tresch, S.; Moretti, M.; Le Bayon, R.C.; Mäder, P.; Zanetta, A.; Frey, D.; Fliessbach, A. A Gardener’s Influence on Urban Soil Quality. Front. Environ. Sci. 2018, 6, 25. [Google Scholar] [CrossRef]
- Mamehpour, N.; Rezapour, S.; Ghaemian, N. Quantitative assessment of soil quality indices for urban croplands in a calcareous semi-arid ecosystem. Geoderma 2021, 382, 114781. [Google Scholar] [CrossRef]
- Séré, G.; Le Guern, C.; Bispo, A.; Layet, C.; Ducommun, C.; Clesse, M.; Schwartz, C.; Vidal-Beaudet, L. Selection of soil health indicators for modelling soil functions to promote smart urban planning. Sci. Total Environ. 2024, 924, 171347. [Google Scholar] [CrossRef]
- Medina-Roldán, E.; Lorenzetti, R.; Calzolari, C.; Ungaro, F. Disentangling soil-based ecosystem services synergies, trade-offs, multifunctionality, and bundles: A case study at regional scale (NE Italy) to support environmental planning. Geoderma 2024, 448, 116962. [Google Scholar] [CrossRef]
- Suleymanov, A.; Abakumov, E.; Polyakov, V.; Kozlov, A.; Saby, N.P.A.; Kuzmenko, P.; Telyagissov, S.; Coblinski, J.A. Estimation and mapping of soil pH in urban landscapes. Geoderma Reg. 2025, 40, e00919. [Google Scholar] [CrossRef]


| Ecosystem Service a | CICES Code 5.1 b | Soil Contribution to ES c | Soil Function | Indicator | Input Data for Calculation | Code |
|---|---|---|---|---|---|---|
| Regulating | 2.2.1.1 2.3.3.2 | Buffering capacity for nutrients and pollutants: natural attenuation (potential) | Storing filtering and transforming nutrients, substances and water | Cation exchange capacity (CEC) Soil reaction Rooting depth | C org. % Clay % pH Coarse fraction % | BUF |
| Regulating | 2.1.1.2 2.3.3.2 | Carbon sequestration (potential) | Carbon pool | Carbon sequestration actual | C org % Bulk density | CST |
| Provisioning | 1.1.1.1 | Food provision (potential) | Biomass production | Land capability (LC) map | LCC and integrades | PRO |
| Provisioning | 1.1.1.x 1.1.5.x | Biomass supply (potential) | Biomass production | NDVI average 2015–2020 | NDVI (LANDSAT8) | BIOMASS |
| Regulating | 2.2.1.3 | Water regulation: Runoff-flood control (potential) | Storing filtering and transforming nutrients, substances and water | Infiltration capacity | Ksat (mm/h) Psie (cm) | WAR |
| Regulating (Provisioning) | 2.2.1.3 (4.2.2.2) | Water regulation: Water storage (potential) | Storing filtering and transforming nutrients, substances and water | Water content at field capacity Presence of water table | Field capacity (−33 kPa) | WAS |
| Supporting | 2.2.2.3 | Habitat for soil organisms | Biodiversity pool | Potential habitat for soil organisms | Index QBS-ar Covariates DSM | BIO |
| SES Code | Input Data | Calculation |
|---|---|---|
| BUF | CEC (cmolc/kg) depending on OC (%) and clay (%) CEC = 6.332 + 0.404 clay + 1.690 OC (R2 = 0.75) pH Coarse fragments content, sk (%) Average depth of shallow water table, WT (cm) | BUF0-1 = Log CEC (pH; sk)0-1 with pH < 6.5 reduction by 0.25 or 0.5 depending on CEC and by 0.25 for sk > 30% Water Table (WT) depth < 30 cm BUF0-1 = Log CSC (pH; sk)0-1 × WT/30 |
| CST | Organic carbon, OC (%) Bulk density, BD (Mg m−3) | CST0-1 = log [OC × BD × (1-sk)]0-1 |
| PRO | Land capability (LC) classes and intergrades [39] | LCC reclassification (0-1) |
| BIOMASS | NDVI (Normalized Difference Vegetation Index) | Standardization (0-1) NDVI (average median values 2015–2020) |
| WAR | Saturated hydraulic conductivity, Ksat (mmh−1) Air entry potential, PSIe (cm) | WAR0-1 = logKsat0-1 − PSIe0-1 |
| WAS | Water content at field capacity (−33 kPa), WCFC (vol/vol) Average depth of water table, WT (cm) sk, coarse fragments (Ø > 2 mm, vol/vol) | WAS0-1 = (WCFC × 1-sk)0-1 if WT > 100 cm, and WAS0-1 = (WCFC × 1-sk) × WT/100 if WT < 100 cm |
| BIO | Soil Biological Quality index, QBSar [40] Covariate per digital soil mapping | Spatialization of QBSar point data values via DSM (Quantile Random Forest) |
| Variable | Agricultural Soils | Undisturbed Soils | Disturbed Soils | Urbanized Soils | Urbanized/ Disturbed Soils | Urban Core Area | Forlì Whole Area | |
|---|---|---|---|---|---|---|---|---|
| Num. Obs. | 792 | 195 | 71 | 37 | 26 | 355 | 1121 | |
| Sand % | Mean | 20.64 | 19.64 | 20.11 | 19.16 | 19.45 | 19.62 | 20.35 |
| Dev. Std. | 7.09 | 9.16 | 7.47 | 8.29 | 10.41 | 8.66 | 7.64 | |
| Min | 3.87 | 3.38 | 6.22 | 6.22 | 3.87 | 3.38 | 3.38 | |
| Max | 46.97 | 43.38 | 27.20 | 35.43 | 43.38 | 43.38 | 46.97 | |
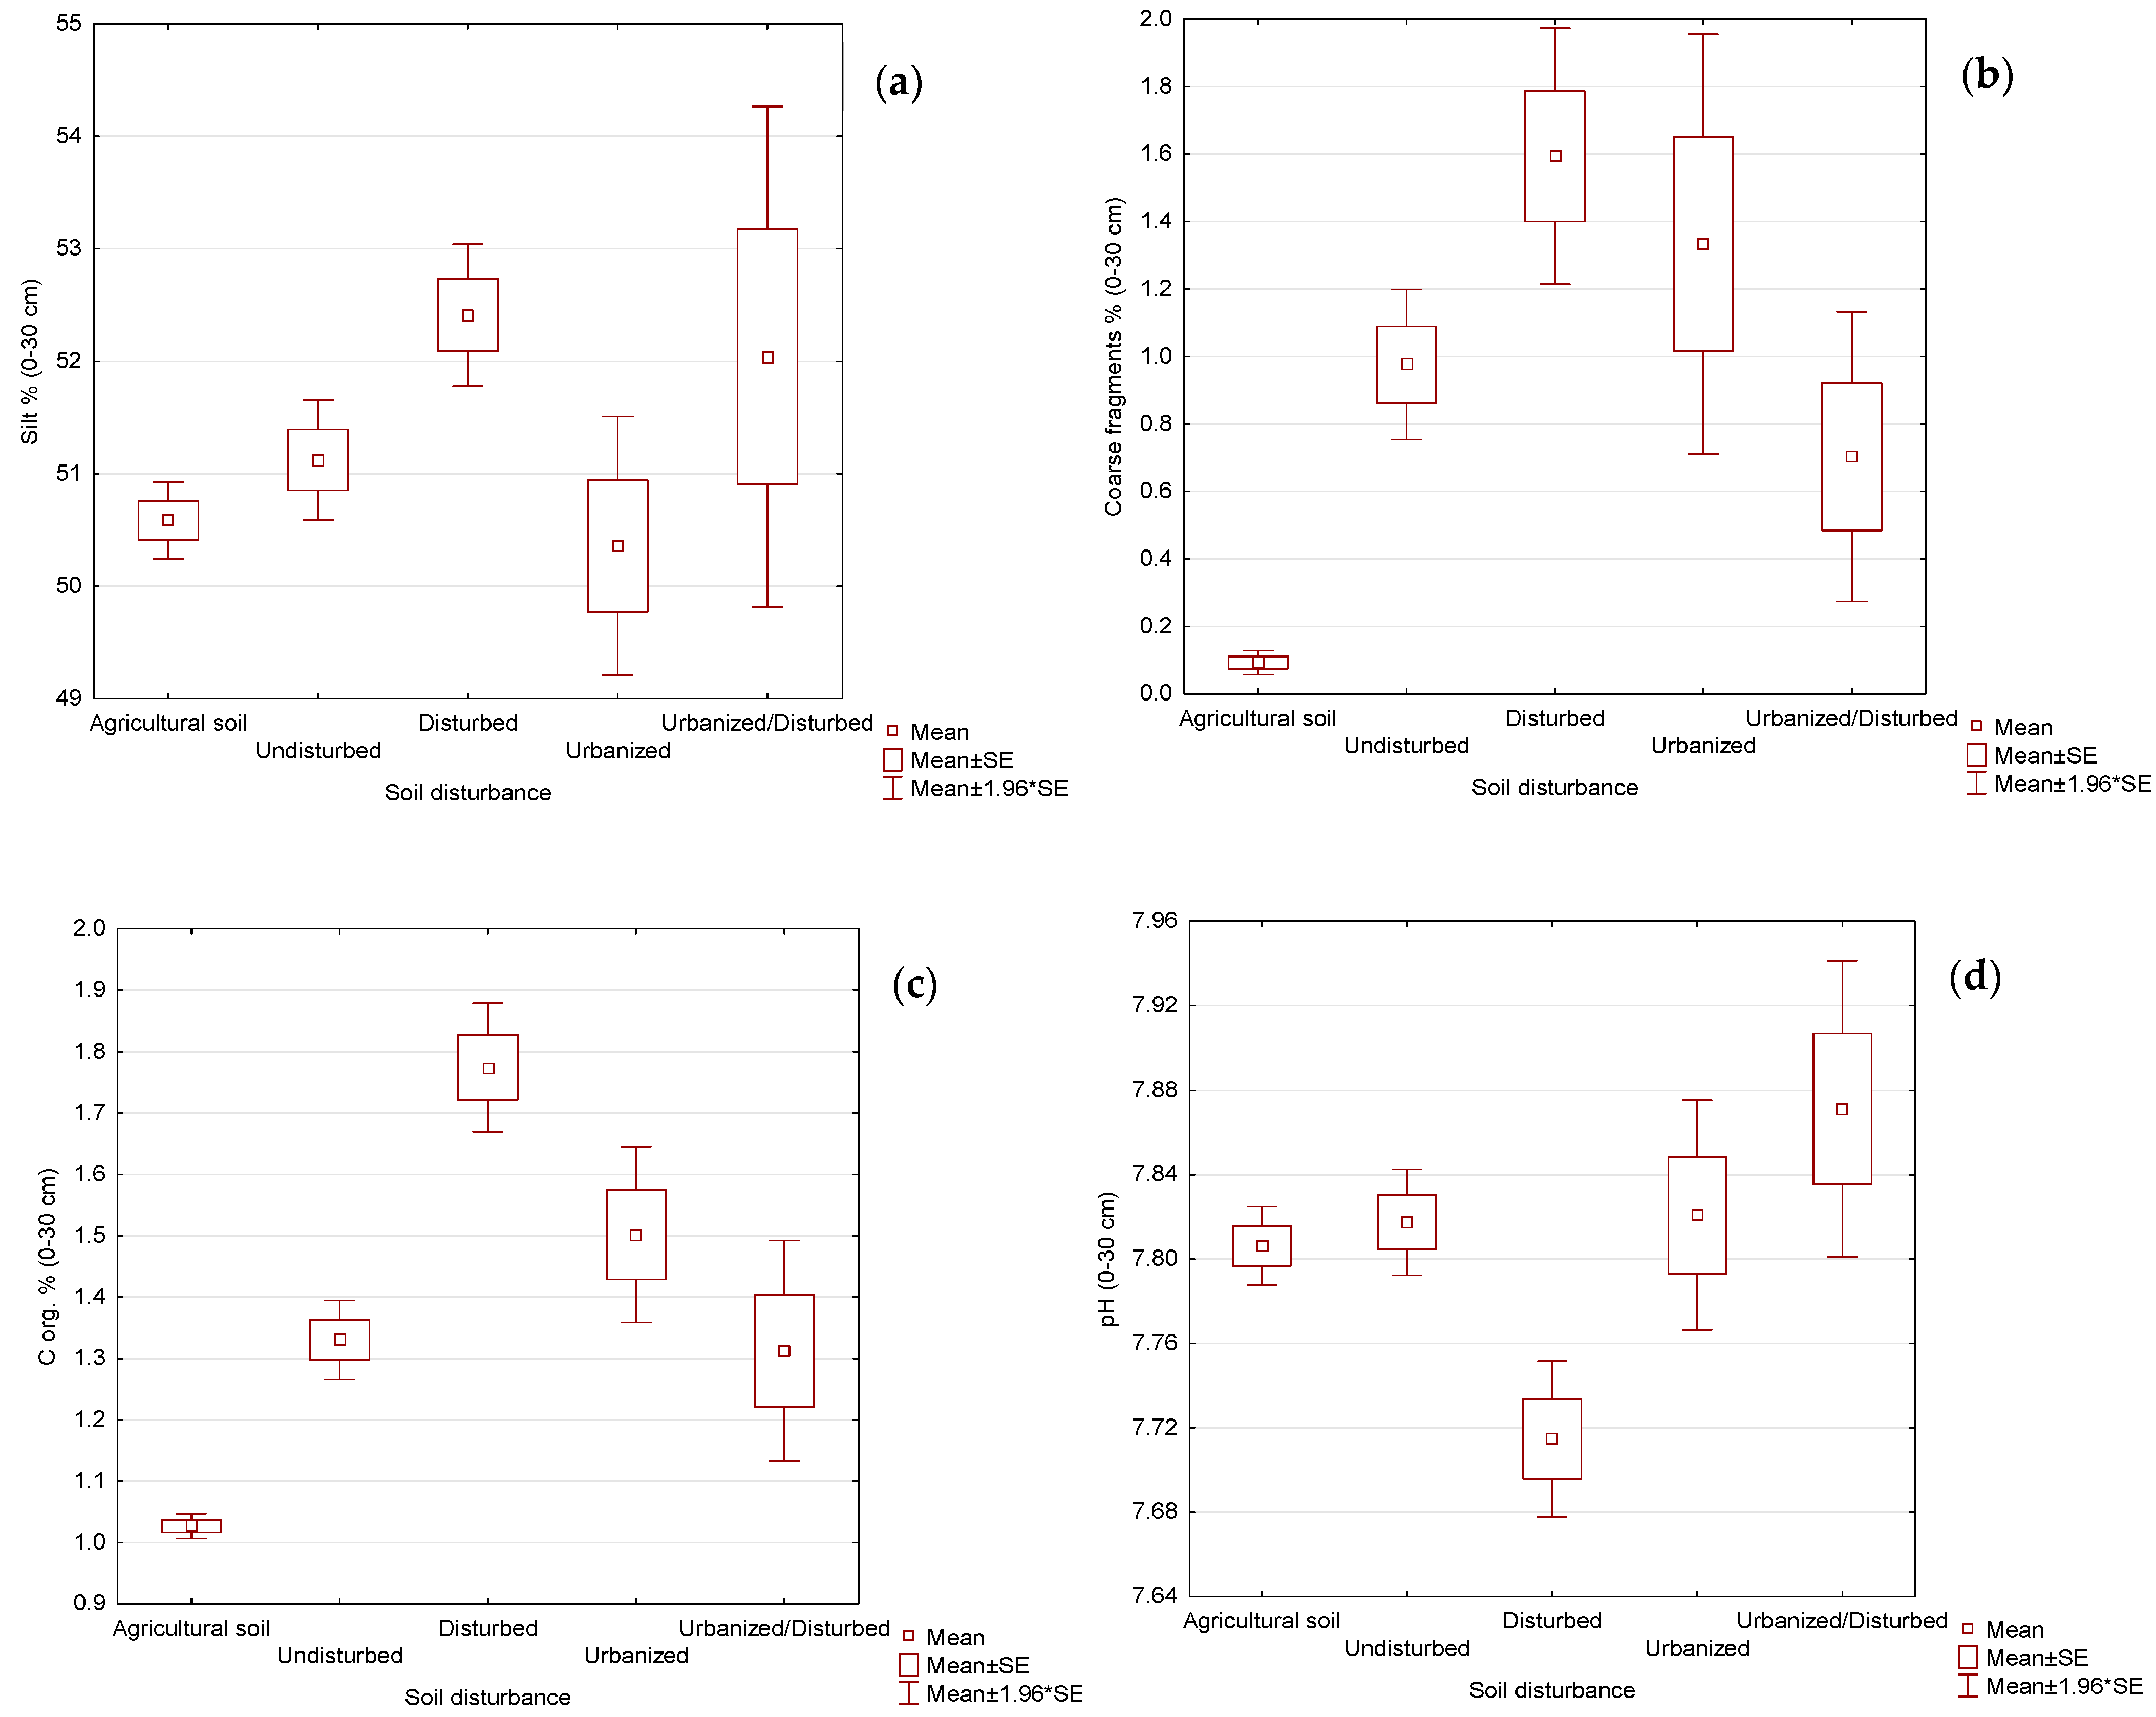
| Silt % | Mean | 50.58 | 51.12 | 52.41 | 50.36 | 52.04 | 51.33 | 50.82 |
| Dev. Std. | 4.88 | 3.78 | 2.71 | 3.57 | 5.79 | 3.81 | 4.60 | |
| Min | 33.65 | 36.05 | 47.19 | 43.76 | 36.05 | 36.05 | 33.65 | |
| Max | 62.94 | 60.36 | 56.74 | 56.74 | 60.36 | 60.36 | 62.94 | |
| Clay % | Mean | 28.78 | 29.24 | 27.48 | 30.48 | 28.51 | 29.04 | 28.83 |
| Dev. Std. | 6.36 | 8.35 | 7.64 | 7.51 | 8.12 | 7.97 | 6.91 | |
| Min | 16.41 | 16.41 | 21.42 | 20.24 | 16.41 | 16.41 | 16.41 | |
| Max | 43.96 | 42.78 | 42.78 | 42.78 | 42.78 | 42.78 | 43.96 | |
| C org. % | Mean | 1.03 | 1.33 | 1.77 | 1.50 | 1.31 | 1.43 | 1.15 |
| Dev. Std. | 0.29 | 0.46 | 0.45 | 0.44 | 0.47 | 0.48 | 0.41 | |
| Min | 0.46 | 0.76 | 1.08 | 0.81 | 0.76 | 0.76 | 0.46 | |
| Max | 2.34 | 2.21 | 2.68 | 2.21 | 2.21 | 2.68 | 2.68 | |
| pH | Mean | 7.81 | 7.82 | 7.71 | 7.82 | 7.87 | 7.80 | 7.80 |
| Dev. Std. | 0.27 | 0.18 | 0.16 | 0.17 | 0.18 | 0.19 | 0.24 | |
| Min | 6.56 | 7.44 | 7.48 | 7.57 | 7.56 | 6.99 | 6.56 | |
| Max | 8.29 | 8.13 | 8.05 | 8.05 | 8.13 | 8.13 | 8.29 | |
| Skel % | Mean | 0.09 | 0.98 | 1.59 | 1.33 | 0.70 | 1.08 | 0.40 |
| Dev. Std. | 0.51 | 1.58 | 1.63 | 1.93 | 1.12 | 1.62 | 1.09 | |
| Min | 0.00 | 0.00 | 0.00 | 0.00 | 0.00 | 0.00 | 0.00 | |
| Max | 6.97 | 6.97 | 6.97 | 6.97 | 3.25 | 6.97 | 6.97 |
| Site | Site Description | Soil | Classification WRB 2014 | ||||
|---|---|---|---|---|---|---|---|
| Public park | Permanent meadows, not irrigated Natural soil with surface fill | BEL2 | Hypereutric Cambisols (Transportic) | ||||
| Public park | Permanent meadows, not irrigated Surface fill down to 120 cm | DRA | Calcaric Regosols (Prototechnic, Transportic) | ||||
| Public park | Permanent meadows, not irrigated Surface fill 0–60 cm over in situ alluvial deposits | RTFy | Hypereutric Cambisols (Transportic) | ||||
| Public park | Permanent meadows, not irrigated Surface fill down to 120 cm | RES | Calcaric Regosols (Prototechnic, Transportic) | ||||
| Public park | Meadows, old trees, irrigated Surface fill 0–55 cm over in situ alluvial deposits | TEG3 | Hypereutric Cambisols (Transportic) | ||||
| Public park | Sealed with trees is small allotments Planned de-sealing area | TEG3 | Hypereutric Cambisols (Transportic) | ||||
| Public park | Permanent meadows, not irrigated Surface fill down to 150 cm | DRA | Calcaric Regosols (Prototechnic, Transportic) | ||||
| Public park | Permanent meadows, not irrigated Surface fill down to 190 cm | SBG1 | Urbic Ekranic Technosols (Calcaric Epitechnoskeletic) | ||||
 |  | 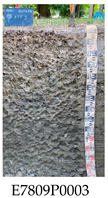 | 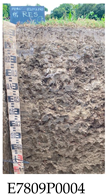 |  | 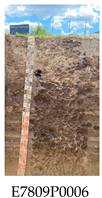 | 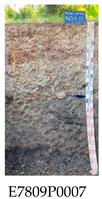 |  |
| Variable | Nugget C0 | Model | Sill C1 | Range a1 (m) | Sill C2 | Range a2 (m) |
|---|---|---|---|---|---|---|
| Sand % | 0.30 | Sph. + Sph. | 0.60 | 600 | 0.10 | 10,000 |
| Silt % | 0.25 | Sph. + Sph. | 0.63 | 700 | 0.14 | 12,000 |
| Clay % | 0.24 | Sph. + Sph. | 0.57 | 450 | 0.18 | 6700 |
| Organic C % | 0.42 | Sph. + Sph. | 0.46 | 1058 | 0.19 | 5353 |
| pH | 0.37 | Sph. + Sph. | 0.40 | 996 | 0.37 | 2872 |
| Mapping Units | Soil Disturbance | Area, ha | Area Share | BIO | BIOMASS | BUF | CST | PRO | WAR | WAS | IQ4 |
|---|---|---|---|---|---|---|---|---|---|---|---|
| BEL1 | undisturbed | 468.8 | 0.17 | 0.60 | 0.60 | 0.52 | 0.70 | 0.86 | 0.35 | 0.59 | 2.424 |
| BEL1/LAM1 | undisturbed | 274.9 | 0.10 | 0.69 | 0.68 | 0.52 | 0.75 | 0.71 | 0.40 | 0.58 | 2.381 |
| MDC2 | undisturbed | 156.1 | 0.06 | 0.54 | 0.60 | 0.70 | 0.73 | 0.86 | 0.27 | 0.67 | 2.561 |
| URB2 | urbanized/sealed | 130.1 | 0.05 | 0.34 | 0.36 | 0.59 | 0.78 | 0.00 | 0.50 | 0.61 | 1.862 |
| SMB1 | undisturbed | 128.6 | 0.05 | 0.59 | 0.56 | 0.53 | 0.66 | 1.00 | 0.41 | 0.58 | 2.598 |
| GRZ1/BOR1 | undisturbed | 116.6 | 0.04 | 0.46 | 0.59 | 0.44 | 0.77 | 0.65 | 0.41 | 0.44 | 2.273 |
| RTFy | undisturbed | 116.2 | 0.04 | 0.61 | 0.57 | 0.87 | 0.75 | 0.86 | 0.11 | 0.81 | 2.588 |
| REM1/CTL4 | undisturbed | 94.6 | 0.03 | 0.68 | 0.62 | 0.61 | 0.65 | 0.86 | 0.41 | 0.61 | 2.532 |
| TEG2 | undisturbed | 93.3 | 0.03 | 0.64 | 0.64 | 0.53 | 0.73 | 0.86 | 0.33 | 0.60 | 2.438 |
| TEG1 | undisturbed | 86.3 | 0.03 | 0.62 | 0.61 | 0.46 | 0.72 | 1.00 | 0.41 | 0.55 | 2.587 |
| BGT2 | undisturbed | 84.8 | 0.03 | 0.61 | 0.58 | 0.68 | 0.54 | 0.86 | 0.31 | 0.63 | 2.391 |
| CTL4 | undisturbed | 81.9 | 0.03 | 0.51 | 0.59 | 0.67 | 0.70 | 0.86 | 0.31 | 0.65 | 2.532 |
| RNV1 | undisturbed | 79.1 | 0.03 | 0.61 | 0.63 | 0.72 | 0.70 | 0.86 | 0.30 | 0.67 | 2.579 |
| RTF1 | undisturbed | 71.4 | 0.03 | 0.56 | 0.60 | 0.73 | 0.77 | 0.86 | 0.23 | 0.71 | 2.591 |
| URB4 | urbanized/sealed | 70.5 | 0.03 | 0.39 | 0.38 | 0.62 | 0.70 | 0.00 | 0.38 | 0.62 | 1.689 |
| LBA1 | undisturbed | 68.7 | 0.02 | 0.54 | 0.56 | 0.81 | 0.70 | 0.71 | 0.18 | 0.75 | 2.395 |
| PTR2 | undisturbed | 59.9 | 0.02 | 0.59 | 0.63 | 0.37 | 0.60 | 1.00 | 0.60 | 0.50 | 2.569 |
| TEG2/SGR2 | undisturbed | 40.3 | 0.01 | 0.73 | 0.78 | 0.60 | 0.79 | 0.92 | 0.31 | 0.62 | 2.622 |
| PRD1 | undisturbed | 32.2 | 0.01 | 0.51 | 0.52 | 0.58 | 0.69 | 0.86 | 0.34 | 0.62 | 2.471 |
| BEL2 | disturbed | 31.6 | 0.01 | 0.49 | 0.57 | 0.49 | 0.72 | 0.86 | 0.68 | 0.56 | 2.746 |
| URB4-RES | urb./disturbed | 31.5 | 0.01 | 0.38 | 0.44 | 0.65 | 0.62 | 0.39 | 0.20 | 0.65 | 1.865 |
| RNV0 | undisturbed | 30.8 | 0.01 | 0.49 | 0.61 | 0.88 | 0.76 | 0.79 | 0.17 | 0.77 | 2.604 |
| DRA | disturbed | 28.8 | 0.01 | 0.35 | 0.65 | 0.56 | 0.71 | 0.86 | 0.50 | 0.60 | 2.621 |
| MDC1 | undisturbed | 26.9 | 0.01 | 0.70 | 0.68 | 0.89 | 0.90 | 0.71 | 0.32 | 0.76 | 2.816 |
| PRD1/LBA1 | undisturbed | 25.3 | 0.01 | 0.55 | 0.61 | 0.71 | 0.66 | 0.79 | 0.31 | 0.66 | 2.477 |
| RTF1/MAN1 | undisturbed | 25.1 | 0.01 | 0.39 | 0.62 | 0.72 | 0.74 | 0.79 | 0.25 | 0.69 | 2.501 |
| SAD1 | undisturbed | 24.1 | 0.01 | 0.58 | 0.63 | 0.61 | 0.45 | 0.71 | 0.29 | 0.63 | 2.059 |
| CTL4/MDC2 | undisturbed | 23.8 | 0.01 | 0.50 | 0.56 | 0.64 | 0.77 | 0.86 | 0.32 | 0.61 | 2.582 |
| SBG0 | disturbed | 22.2 | 0.01 | 0.25 | 0.54 | 0.47 | 0.65 | 0.57 | 0.77 | 0.47 | 2.458 |
| PRD1/PRD3 | undisturbed | 21.6 | 0.01 | 0.81 | 0.63 | 0.62 | 0.74 | 0.86 | 0.27 | 0.65 | 2.487 |
| Indicator | Mean | Std. Dev. | BIO | BIOMASS | BUF | CST | PRO | WAR | WAS |
|---|---|---|---|---|---|---|---|---|---|
| BIO | 0.484 | 0.180 | 1.000 | 0.506 | 0.427 | 0.373 | 0.437 | −0.102 | 0.421 |
| BIOMASS | 0.519 | 0.156 | 0.506 | 1.000 | 0.328 | 0.351 | 0.762 | 0.218 | 0.330 |
| BUF | 0.580 | 0.152 | 0.427 | 0.328 | 1.000 | 0.711 | 0.277 | −0.342 | 0.890 |
| CST | 0.680 | 0.156 | 0.373 | 0.351 | 0.711 | 1.000 | 0.258 | 0.089 | 0.838 |
| PRO | 0.649 | 0.281 | 0.437 | 0.762 | 0.277 | 0.258 | 1.000 | −0.001 | 0.305 |
| WAR | 0.395 | 0.183 | −0.102 | 0.218 | −0.342 | 0.089 | −0.001 | 1.000 | −0.217 |
| WAS | 0.587 | 0.137 | 0.421 | 0.330 | 0.890 | 0.838 | 0.305 | −0.217 | 1.000 |
Disclaimer/Publisher’s Note: The statements, opinions and data contained in all publications are solely those of the individual author(s) and contributor(s) and not of MDPI and/or the editor(s). MDPI and/or the editor(s) disclaim responsibility for any injury to people or property resulting from any ideas, methods, instructions or products referred to in the content. |
© 2025 by the authors. Licensee MDPI, Basel, Switzerland. This article is an open access article distributed under the terms and conditions of the Creative Commons Attribution (CC BY) license (https://creativecommons.org/licenses/by/4.0/).
Share and Cite
Ungaro, F.; Tarocco, P.; Aprea, A.; Bazzocchi, S.; Calzolari, C. From Fertile Grounds to Sealed Fields: Assessing and Mapping Soil Ecosystem Services in Forlì’s Urban Landscape (NE Italy). Land 2025, 14, 719. https://doi.org/10.3390/land14040719
Ungaro F, Tarocco P, Aprea A, Bazzocchi S, Calzolari C. From Fertile Grounds to Sealed Fields: Assessing and Mapping Soil Ecosystem Services in Forlì’s Urban Landscape (NE Italy). Land. 2025; 14(4):719. https://doi.org/10.3390/land14040719
Chicago/Turabian StyleUngaro, Fabrizio, Paola Tarocco, Alessandra Aprea, Stefano Bazzocchi, and Costanza Calzolari. 2025. "From Fertile Grounds to Sealed Fields: Assessing and Mapping Soil Ecosystem Services in Forlì’s Urban Landscape (NE Italy)" Land 14, no. 4: 719. https://doi.org/10.3390/land14040719
APA StyleUngaro, F., Tarocco, P., Aprea, A., Bazzocchi, S., & Calzolari, C. (2025). From Fertile Grounds to Sealed Fields: Assessing and Mapping Soil Ecosystem Services in Forlì’s Urban Landscape (NE Italy). Land, 14(4), 719. https://doi.org/10.3390/land14040719