Article

The Influence of Non-Landslide Sample Selection Methods on Landslide Susceptibility Prediction

1
Henan Provincial Key Laboratory of Hydrosphere and Watershed Water Security, North China University of Water Resources and Electric Power, Zhengzhou 450011, China
2
The Institute of Hydrogeology and Environmental Geology, CAGS, Shijiazhuang 050061, China
3
Key Laboratory of Groundwater Contamination and Remediation, Hebei Province & China Geological Survey, Shijiazhuang 050061, China
*
Authors to whom correspondence should be addressed.
Land 2025, 14(4), 722; https://doi.org/10.3390/land14040722
Submission received: 15 February 2025 / Revised: 23 March 2025 / Accepted: 24 March 2025 / Published: 27 March 2025

Abstract

:
Non-landslide sample selection is critical in landslide susceptibility modeling due to its direct impact on model accuracy and reliability. This study compares three sample selection strategies: whole-region random selection, landslide buffer zone selection, and the enhanced information value (EIV) method. By integrating these methods with the random forest (RF) algorithm, three models—random-RF, buffer zone-RF, and EIV-RF—were developed and evaluated. Using Henan Province as a case study, 20 environmental factors and 1021 landslide records were analyzed. The EIV method leverages machine learning to assign adaptive weights to influencing factors, prioritizing sample selection in low-susceptibility regions and avoiding high-susceptibility areas, thereby enhancing sample quality. Among the models, EIV-RF achieved the highest performance, with an AUC of 0.93, an accuracy of 85.31%, and a Kappa coefficient of 0.74. Additionally, the EIV method identified smaller, more concentrated high-susceptibility zones, covering 87.37% of historical landslide points, compared to the larger, less precise zones predicted by other methods. This study highlights the effectiveness of the EIV method in refining non-landslide sample selection and improving landslide susceptibility prediction, providing valuable insights for disaster risk reduction and land use planning.

1. Introduction

Geological disasters, including landslides, mudflows, and earthquakes, pose a persistent threat to human societies worldwide [1]. Over the past two decades, more than 58 countries have experienced severe geological disasters, with developing regions disproportionately affected due to inadequate infrastructure, limited early warning systems, and socioeconomic vulnerabilities (EM-DAT, 2022). China, with its vast territory, intricate geological structures, and vulnerable geological environment, is among the most severely affected countries [2]. The National Geological Disaster Situation and Trend Forecast for 2023 by the Ministry of Natural Resources reported a total of 3668 geological disasters nationwide, including 925 landslides, 2176 collapses, 374 debris flows, and 193 ground subsidences [3]. Throughout the year, 427 geological disasters were successfully predicted, preventing direct economic losses amounting to 500 million yuan and reducing casualties. The number of deaths and missing persons due to geological disasters has decreased annually, maintaining a consistently low level. The prediction and forecasting of geological disasters are crucial for disaster prevention and mitigation. Landslides cause severe damage to life and property with widespread impact [4]. For example, landslides are a major geological disaster that threatens agricultural production in the hilly and mountainous areas of China [5]. Landslides can also lead to the abandonment of farmlands and settlements [6].
Landslide susceptibility assessment (LSA) involves determining the capability for landslides in a specific region by analyzing the correlation between historical landslide occurrences and various environmental variables [7]. Landslide susceptibility prediction, a fundamental aspect of landslide risk assessment, holds significant importance. With the rapid advancements in technologies such as GIS and machine learning, employing an interdisciplinary approach to conduct landslide susceptibility modeling has emerged as an effective tool for landslide hazard assessment [8]. The primary steps of LSA include sampling landslide and non-landslide samples, determining influencing factors, modeling and mapping landslide susceptibility, and analyzing the accuracy of the results [9]. Among these steps, the selection of non-landslide samples plays a critical role in the accuracy and reliability of LSA models. Non-landslide samples represent areas where landslides have not occurred, and their proper selection is essential to ensure a balanced and representative dataset for model training and validation. Inappropriate selection of non-landslide samples, such as choosing areas that are inherently unsuitable for landslides, can lead to biased results and overestimation of landslide susceptibility [10]. Therefore, careful consideration must be given to the spatial distribution, environmental conditions, and statistical representativeness of non-landslide samples to enhance the robustness of LSA models.
In the current literature, the selection strategies for non-landslide samples primarily include random sampling, buffer zone sampling, similarity-based methods, and condition-specific sampling. However, each of these strategies has inherent drawbacks that may introduce uncertainties in certain critical aspects of LSA [11,12]. For instance, both random sampling and buffer zone sampling can result in non-landslide samples being situated in areas susceptible to debris flow. Similarly, similarity-based methods may fail to ensure the representativeness of non-landslide samples. Condition-specific sampling might be too restrictive and may not accurately represent the landslide risk across the entire study area. Therefore, it is imperative to undertake a comparative analysis of the efficacy of diverse methodologies for selecting non-landslide samples in the context of LSA. The information value (IV) method, known for its simplicity and high accuracy, is commonly employed in the field of geological disasters [13]. The premise is that the probability of landslides is low in regions characterized by very low to low susceptibility, making it common practice to select non-landslide samples from these regions [14].
To address the limitations of the traditional information value (IV) model, which assumes all impact variables contribute equally to landslide initiation [15], thereby oversimplifying complex landslide mechanisms, this study introduces an enhanced information value (EIV) method. This method integrates machine learning techniques (recursive feature elimination, RFE) with the IV framework. The EIV method assigns weights to factors based on their importance scores derived from RFE, thereby improving the precision of susceptibility assessments. The IV model’s inability to consider the relative importance among different factors reduces its precision in predicting landslide susceptibility and limits its ability to identify dominant factors effectively. By incorporating machine learning algorithms to evaluate the significance of each impact factor, the EIV method assigns weights to the IV model based on these significance ratings. This approach enhances the precision and rationality of weight distribution, providing a more accurate assessment of the varying contributions of different factors to landslide occurrence. Consequently, the EIV method improves the precision of landslide risk forecasts derived from machine learning models.
Common approaches in landslide susceptibility assessment (LSA) include expert systems, physically based models, and data-driven methods [16]. Among these, data-driven methods, particularly those leveraging machine learning, are adept at capturing the complex nonlinear relationships between landslides and their influencing variables [17]. Techniques such as logistic regression, decision trees, and artificial neural networks are widely used for LSA, with the random forest (RF) algorithm being especially prominent due to its high accuracy and robustness [18,19].
The study compares the EIV method with two commonly used non-landslide sample selection techniques: random sampling and buffer zone sampling. Random sampling, while simple and straightforward, may result in the inclusion of areas with potential landslide susceptibility, leading to biased results. Buffer zone sampling, on the other hand, excludes areas significantly impacted by landslides but lacks a standardized approach for determining the buffer zone radius, which can affect the quality and accuracy of the samples. By comparing these three methods, the study aims to assess their respective strengths and limitations and identify the most effective approach for selecting non-landslide samples in landslide susceptibility prediction models. Using Henan Province as a case study, this research compares three non-landslide sample selection strategies: the whole-region random selection method, the landslide buffer zone method, and the enhanced information value (EIV) method. These non-landslide samples are integrated into the RF algorithm to construct three models: random-RF, buffer zone-RF, and EIV-RF. By evaluating and comparing the outcomes of these models, this study analyzes how different non-landslide sample selection techniques influence model variability and performance, thereby determining the most suitable model for studying landslide disasters in the research area. This model will be used to create a landslide susceptibility assessment map, which aims to provide scientific and technological support for the disaster early warning and forecasting system, as well as resource protection in Henan Province.

2. Study Area

This study investigates Henan Province, located in the central-eastern region of China. The province lies ranging from 110°21′ to 116°39′ in east longitude and from 31°23′ to 36°22′ in north latitude, encompassing a region of 167 thousand km2. The study area is shown in Figure 1. Henan Province is positioned in the middle and lower reaches of the Yellow River, within the mid-latitude zone. It borders Shandong Province to the east, overlooks Anhui and Jiangsu Provinces, is adjacent to Shaanxi Province to the west, is bordered by Hubei and Hunan Provinces to the south, and shares borders with Hebei and Shanxi Provinces to the north. Henan Province boasts a strategic geographical location with excellent transportation networks, functioning as a vital transportation hub that connects North China, East China, and Southwest China. It also serves as a crucial junction linking North and South China, as well as the eastern and western regions of the country [20].
Henan Province exhibits a complex topography and geomorphology, characterized by a progressive decline in elevation from the west towards the east. The western region is predominantly mountainous and hilly, whereas the eastern region consists mainly of plains. The distribution proportions of basins, mountains, and hills are 55.7%, 26.6%, and 27.7%, respectively. The western and southern regions of the province are predominantly mountainous, featuring major mountain ranges such as the Funiu Mountains, Dabie Mountains, and Taihang Mountains [21]. These mountain ranges in Henan Province are characterized by undulating terrain, varying elevations, and rugged landscapes, which collectively define their distinct topographical features. The geological framework of the province is intricate, primarily consisting of the North China Plain, the Loess Plateau, and the Funiu Mountain region. Situated at the junction of the North China Earthquake Belt and the South China Earthquake Belt, Henan Province experiences frequent seismic activities [22]. The geological structure not only influences seismic activity but also contributes to the emergence of geological disasters, including landslides [23]. Particularly in the southern region, geotectonic activity is prominent, with the terrain primarily characterized by hills and mountains. The stratigraphy in this area is relatively young, which correlates with a high frequency of geological hazards.
Henan Province has a warm-temperate monsoon climate, characterized by marked seasonal variations. Summers are hot and humid, while winters are cold and dry [24]. Annual precipitation ranges from 150 to 1000 mm, decreasing from the northeast to the southwest. The northern region of Henan Province experiences relatively dry conditions, whereas the southern region is characterized by greater humidity [25]. The province is intersected by numerous rivers, with the Yellow River, Huai River, and their tributaries constituting the primary river systems. The terrain slopes from east to west, resulting in an uneven distribution of water resources, which are relatively scarce in the north and more abundant in the south.
Human activities are significant triggers for geological disasters in Henan Province. The exploitation of mineral resources, the implementation of water conservancy and hydropower projects, transportation engineering, and urban construction are all engineering activities that have the potential to induce earth hazards [26].

3. Material and Methods
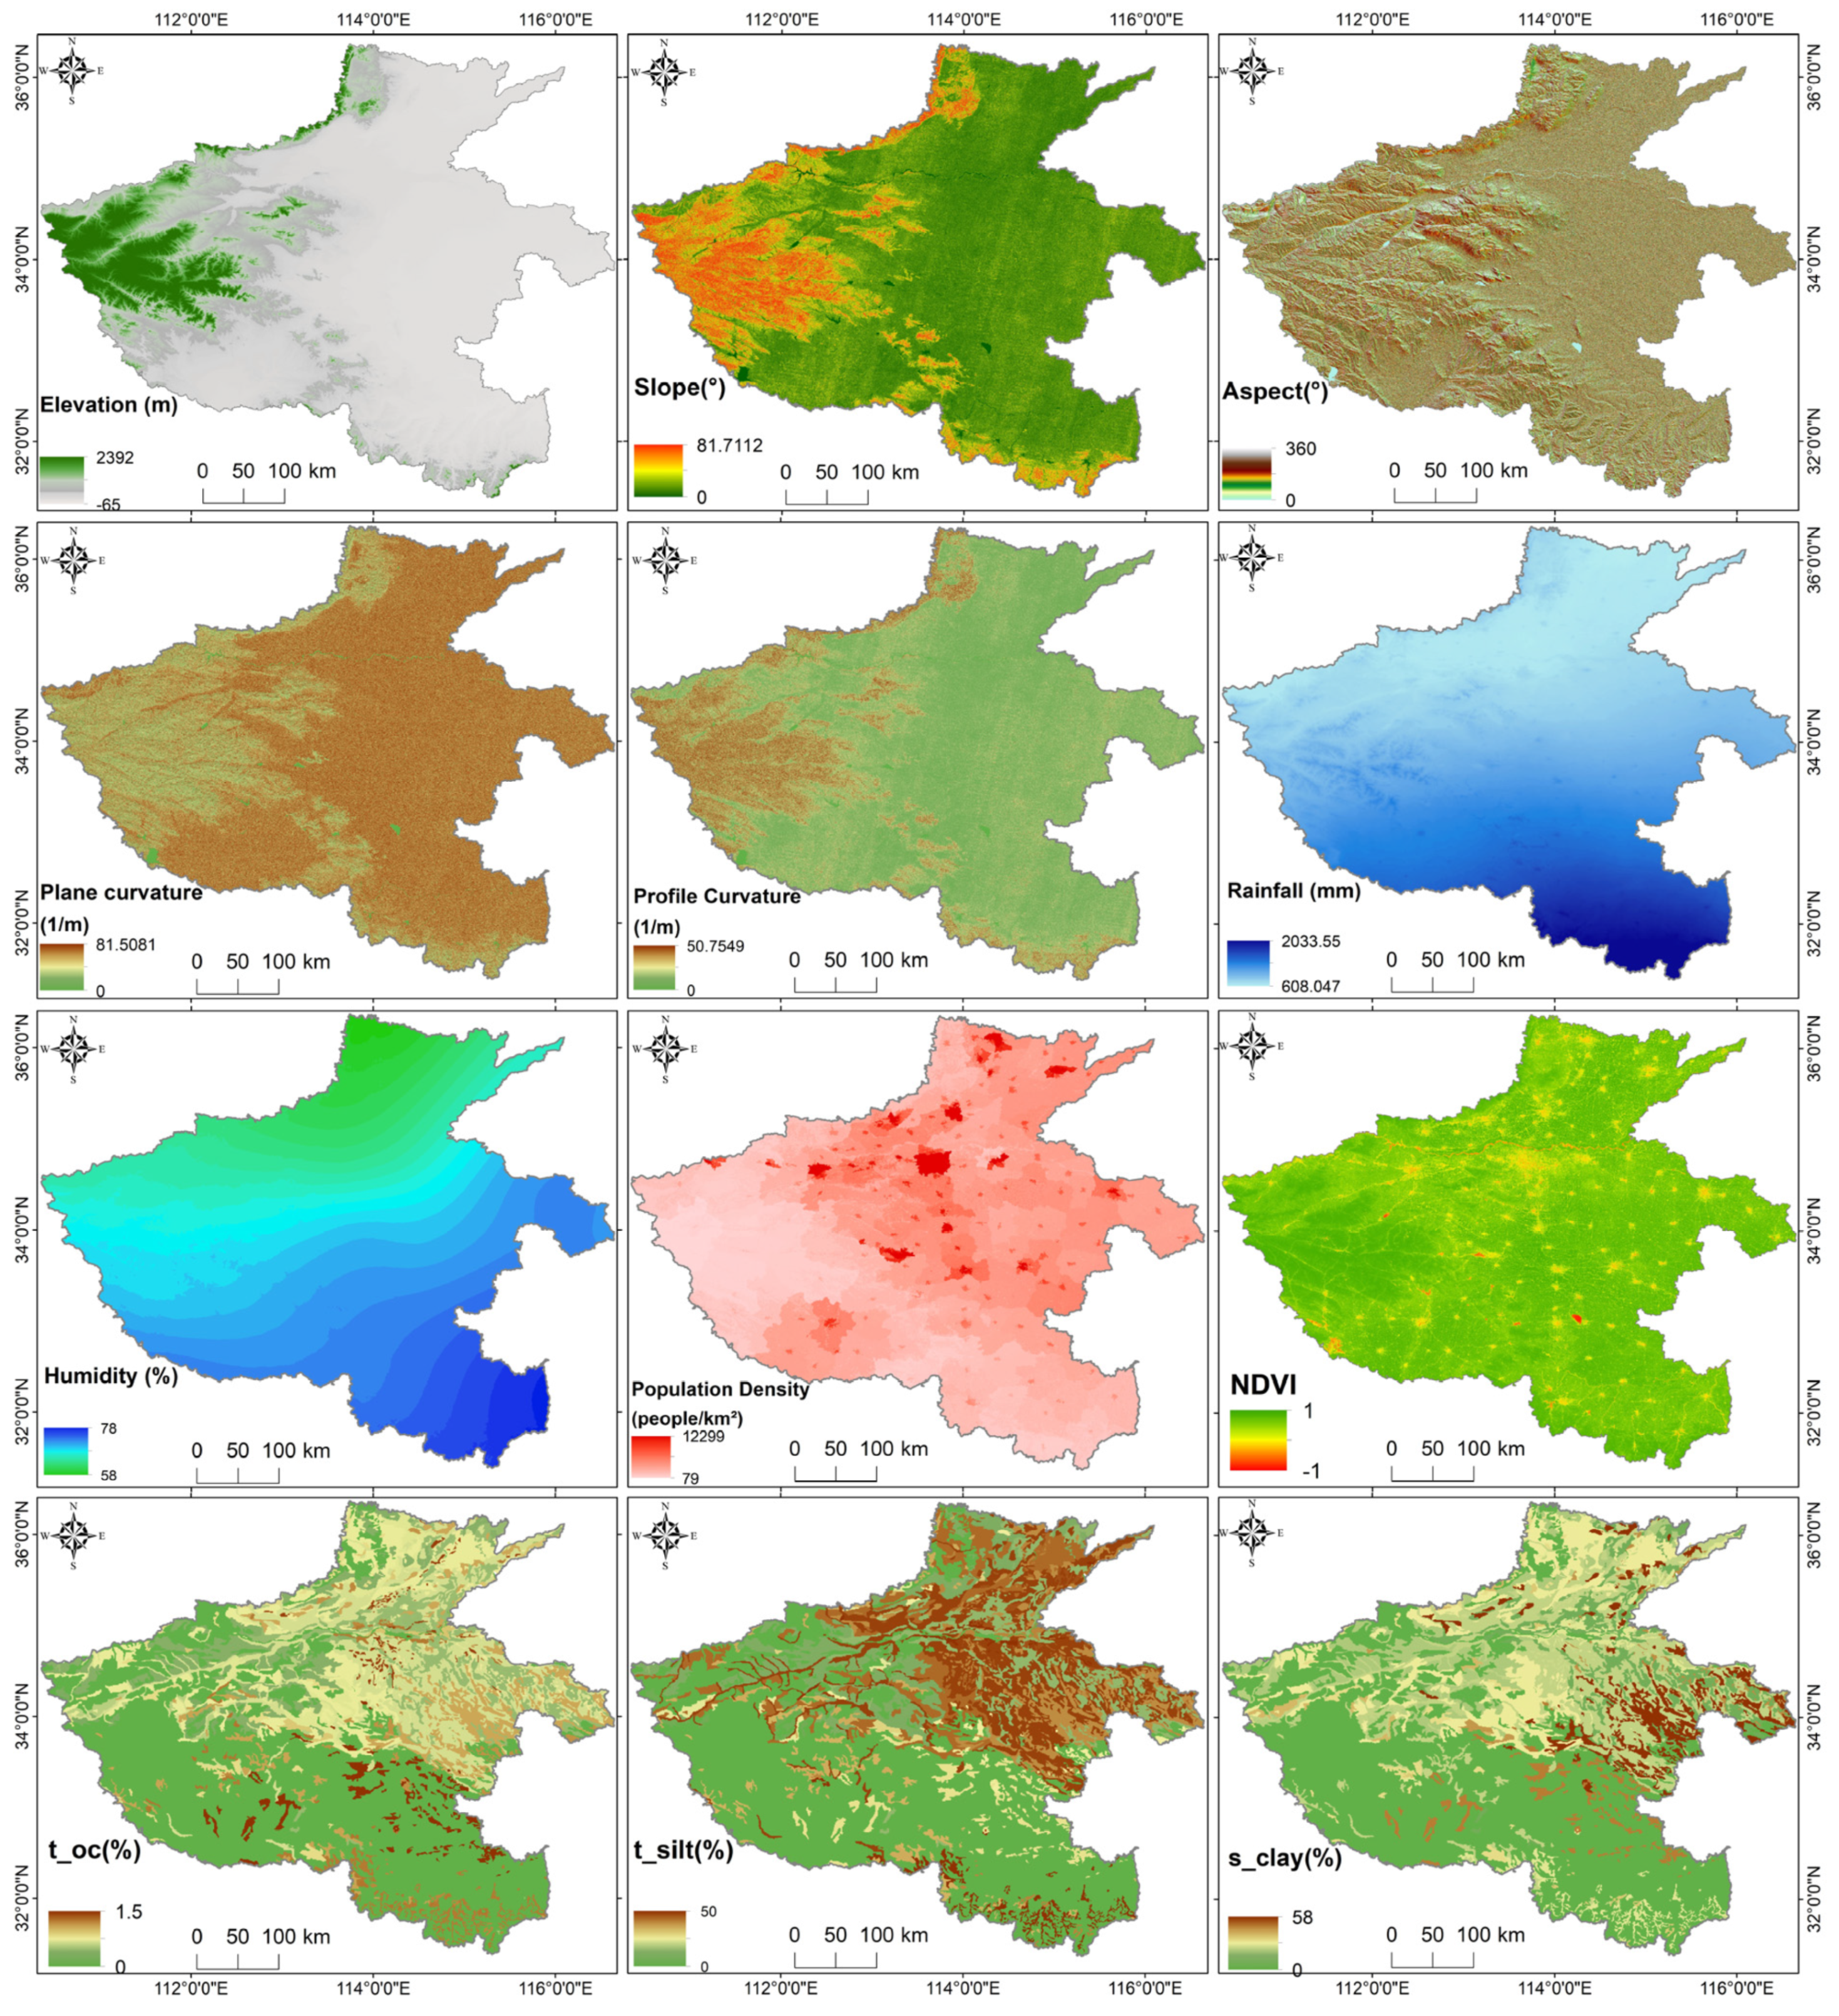
3.1. Data Source

This study obtained spatial distribution data for geological disaster locations in Henan Province from the Geographic Remote Sensing Ecological Network and extracted landslide points. The landslide data were further refined using the ArcGIS World Imagery Wayback tool in version 10.5, in conjunction with historical map imagery and landslide inventory data, to ensure the accuracy of the landslide location data. A total of 1021 landslide points, each with a pixel size of 30 m × 30 m, were selected. These data were subsequently employed for landslide modeling and analysis.
The progression and underlying processes of extensive landslides are intricate and diverse, predominantly influenced by five key groups of determinants: terrain characteristics, geological conditions, water dynamics, soil properties, and additional factors encompassing human engineering activities [27].
Topographic factors encompass elevation, slope angle, aspect, plan curvature, and profile curvature. Among these factors, slope angle is regarded as the pivotal factor directly influencing slope stability [28]. Aspect indirectly influences the progression of landslides indirectly by affecting vegetation distribution and sunlight exposure on slopes [29]. Plan curvature and profile curvature are characteristics of terrain undulation which subsequently control the flow of water across slopes. All topographical data are derived from a digital elevation model (DEM) having a 30 m grid spacing.
Hydrological factors, including rainfall and humidity, significantly influence groundwater levels, slope drainage capacity, and bank erosion. Increased rainfall can raise groundwater levels and enhance soil moisture content, thereby impacting slope stability. Additionally, elevated humidity affects the soil’s drainage capacity; in high-humidity environments, soil permeability decreases, hindering water percolation and resulting in prolonged high soil moisture content, which increases the risk of bank instability [30].
Soil factors are represented by soil datasets that provide detailed information on soil type, structure, permeability, and erosion resistance. These datasets can be categorized into various types, including sandy soil, loam, clay, organic soil, and permafrost. These factors are also crucial to slope stability. The type and characteristics of soil significantly affect its water retention capacity, resistance to shear stress, and overall stability, which subsequently influence the potential for slope failure [31]. Furthermore, the Normalized Difference Vegetation Index (NDVI) is deemed, as it reflects the development of vegetation [32,33]. The root systems of plants can enhance soil stability, thereby reducing the rate of soil erosion. Slopes that are bare and devoid of vegetation are generally more vulnerable to landslides compared to areas with dense vegetation coverage [34]. This study primarily utilizes environmental factor data, including elevation (DEM), slope, aspect, curvature, rainfall, and soil characteristics. Table 1 presents the detailed information and sources of the data used.

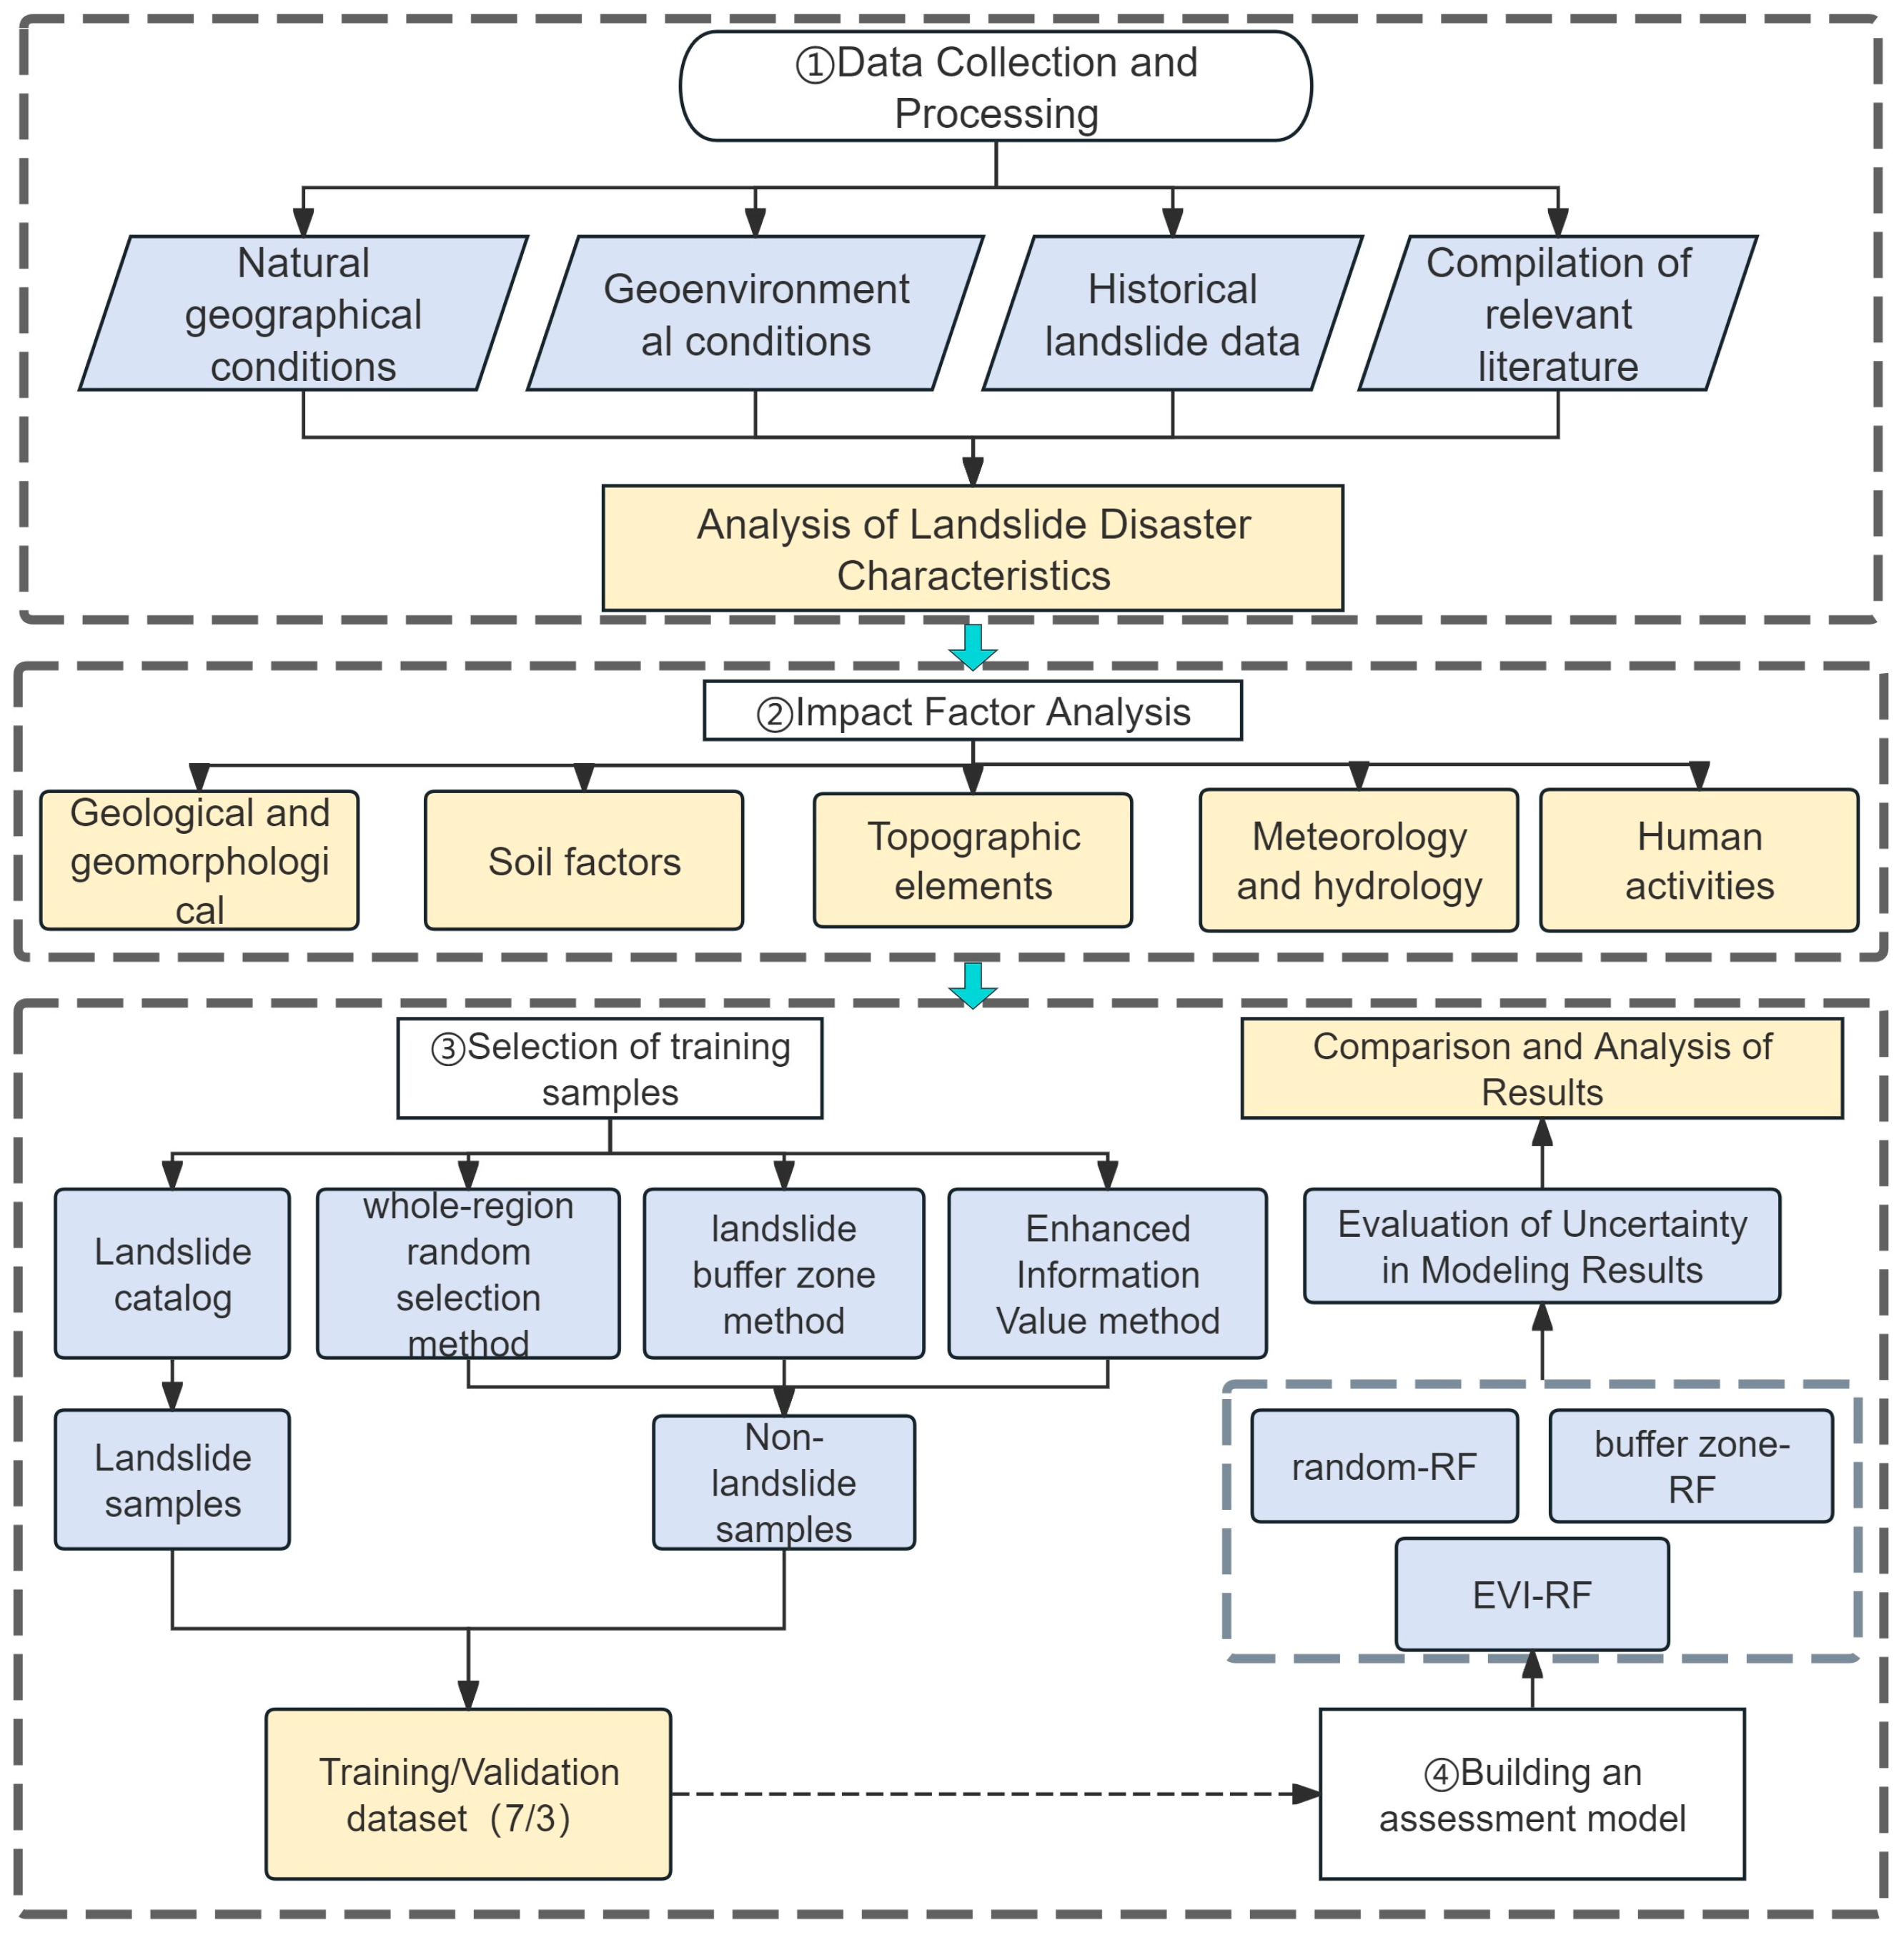
3.2. Modelling Procedure

This study, using Henan Province as a case study, consists of five main steps: (1) Landslide Data Preparation: Initially, distribution data of 1021 landslide points in Henan Province were obtained from the Geographic Remote Sensing Ecological Network. (2) Impact Factor Data Preparation and Selection: A total of twenty fundamental environmental factor datasets were collected, including elevation, slope, aspect, curvature, rainfall, humidity, population density, vegetation index, and additional factors. These datasets encompass a broad spectrum of information regarding topography, geological structure, soil, vegetation, and precipitation, thereby providing a comprehensive representation of the geological environment and potential risks within study area. Elevation, slope, and aspect are widely recognized as critical topographic factors influencing landslide susceptibility [35]. Rainfall and humidity were included due to their significant role in triggering landslides [36]. Additionally, vegetation index and population density were considered to account for environmental and anthropogenic influences [27].
To further refine the selection, a recursive feature elimination (RFE) algorithm was employed to identify the most significant impact factors. This approach ensures that the final set of factors is both scientifically robust and computationally efficient [37]. A recursive feature elimination algorithm was employed to identify the most significant impact factors. (3) Non-landslide Sampling Strategies: Three distinct methods were utilized to select non-landslide samples: whole-region random selection, the landslide buffer zone method, and the enhanced information value (EIV) method. The landslide and non-landslide samples were subsequently combined to construct the dataset for model development. The sampled data, along with their attributes, were segmented into training and validation datasets. The training dataset was used for constructing the landslide prediction model, and the testing dataset was applied to evaluate the model’s efficacy. Concretely, 70% of the data were assigned to the training dataset, with the leftover 30% were allocated for the testing dataset. This split provides sufficient data for model training while retaining an independent subset for validation, thereby balancing the trade-off between model performance assessment and computational efficiency. The 7:3 ratio is widely used in landslide susceptibility modeling and has been shown to yield reliable results [38]. (4) Model Construction: Using three different methods to select non-landslide samples, we integrated these with the random forest (RF) model to develop random-RF, buffer zone-RF, and EIV-RF models for predicting landslide susceptibility. The trained models were subsequently utilized to produce maps delineating landslide susceptibility zones. (5) Validation and Comparison: The predictive accuracy and model uncertainty were assessed using various techniques, including Receiver Operating Characteristic (ROC) curves, confusion matrices, and relative density evaluations. The technical route is depicted in Figure 2.

3.3. Recursive Feature Elimination

The recursive feature elimination (RFE) method is a feature selection technique that iteratively constructs a model and eliminates the least important features based on their importance scores [39]. This process continues until the optimal subset of features is identified. In this study, the RFE method was applied to select the most significant landslide influencing factors by training a random forest model. The RFE algorithm operates as follows: Initialization: (1) Start with the full set of features. (2) Model Training: Train a random forest model using the current set of features and rank the features based on their importance scores. (3) Feature Elimination: Remove the least important feature(s) from the current set. (4) Iteration: Repeat steps 2 and 3 until a predefined number of features is reached or until no further improvement in model performance is observed.
The importance scores are derived from the random forest model, which measures the contribution of each feature to the model’s predictive accuracy. Features with higher importance scores have a greater influence on landslide susceptibility. The final subset of features is selected based on their importance scores, ensuring that only the most relevant factors are included in the model. The RFE method enhances the robustness of the model by eliminating irrelevant or redundant features, thereby improving computational efficiency and reducing the risk of overfitting. This approach ensures that the selected factors are both statistically significant and scientifically meaningful, providing a more accurate representation of the underlying mechanisms driving landslide occurrences.

3.4. Non-Landslide Sampling Methods

3.4.1. Whole-Region Random Sampling Method

The whole-region random sampling method is a commonly used approach for selecting non-landslide samples. This method involves randomly selecting a specified number of sample points within the research region, irrespective of the occurrence pattern of documented landslides [40]. Initially, the extent of the study region is defined, followed by its division into regular grid cells. The quantity of samples to be collected is then determined. Random points are then generated within the grid cells to sample non-landslide sample points. These points are subsequently validated to confirm their location in non-landslide areas. Finally, these data are combined with landslide sample data to establish a landslide prediction model [41]. However, random sampling may not guarantee that all selected samples are valid non-landslide samples.

3.4.2. Landslide Buffer Zone Method

The landslide buffer zone method posits that landslide events exhibit spatial continuity, with their influence potentially extending to area surrounding the landslide body [42]. Consequently, a buffer zone is delineated around the landslide body. Areas within this buffer zone are deemed more susceptible to landslide impact, whereas regions outside are considered relatively safe and suitable for selecting non-landslide samples. After determining the buffer distance based on the geographical environment and historical landslide data of the research region, a landslide buffer zone is delineated. The region outside this buffer zone is selected for non-landslide sample collection. A buffer zone that is too small may not exclude all landslide-affected areas, whereas one that is too large may exclude numerous potential non-landslide samples. The study area includes steep slopes and fragmented geological structures, where landslides often affect broader surrounding areas [43]. Preliminary tests with buffer radii ranging from 3000 to 7000 m showed that 5000 m optimally balanced the exclusion of landslide-affected areas while retaining sufficient non-landslide samples for model training.

3.4.3. Enhanced Information Value (EIV) Method

This study integrates machine learning techniques with the IV method based on the information value model [44]. The proposed enhanced information value (EIV) method improves upon the IV model by incorporating machine learning techniques, specifically the recursive feature elimination (RFE) algorithm, to optimize the selection and weighting of landslide influencing factors.
The EIV method begins by utilizing the RFE algorithm to identify the most significant factors influencing landslides. The RFE algorithm operates iteratively by training a random forest model and ranking features based on their importance scores. In each iteration, the least important features are eliminated, and the process is repeated until the optimal subset of features is identified [45]. This approach ensures that the selected factors are both statistically significant and computationally efficient, thereby enhancing the robustness of the model. Once the key factors are identified, the information content is calculated for each factor, and then information value weights are assigned to these factors based on their importance scores derived from the RFE algorithm. For instance, factors such as elevation, slope, rainfall, curvature, and population density are weighted according to their relative contributions to landslide susceptibility. The weight assignment process is represented by Equation (1) as follows:
Weight ( F i ) = I m p o r t a n c e S c o r e ( F i ) i = 1 n I m p o r t a n c e S c o r e ( F i )
where Fi represents the i-th factor, and n is the total number of selected factors. This quantitative weighting approach allows the EIV model to distinguish the significance of various factors, making it more representative of real-world conditions.
The EIV model further refines the selection of non-landslide samples by focusing on zones of very low and low susceptibility, as determined through natural breakpoint analysis. The EIV values are classified into five susceptibility zones (extremely low, low, moderate, high, extremely high) using natural breakpoint analysis. Non-landslide samples are randomly selected only from zones classified as extremely low and low susceptibility (EIV < 0). This ensures that the non-landslide samples are selected from areas least likely to experience landslides, thereby improving the balance and representativeness of the dataset.
By incorporating machine learning techniques, the EIV model accounts for the differing contributions of each factor to landslide occurrence, enabling a more precise evaluation of their comparative significance [46]. This enhances the accuracy of the model’s predictions and provides a more reliable basis for landslide susceptibility mapping.

3.5. Random Forest (RF) Model

The random forest (RF) model, a type of ensemble machine learning technique, was first introduced by L. Breiman and A. Cutler. It operates based on the Bootstrap Aggregating (Bagging) algorithm, which randomly selects samples with replacement from the original dataset. This process generates k different subsets of the data, where k represents the number of decision trees in the forest. A decision tree is constructed for each subset, and these k decision trees collectively form the forest model [47]. The term “Random” in random forest refers to two aspects: the random construction of the landslide and non-landslide dataset and the “bootstrap” sampling method used to construct and train each decision tree. This sampling method randomly selects a subset of features and a subset of the dataset. Consequently, each decision tree in the forest is independent and unique, yet they all produce the same type of output. For regression models, the final output is obtained by averaging the results of each decision tree, whereas for classification models, a voting method is used to derive the final result.
In this study, the RF model is employed to predict landslide disasters. The optimal parameters for the RF model are identified through cross-validation and grid search. These settings help prevent overfitting and enhance the model’s generalization ability. Unlike traditional random forest models, our model does not employ bootstrap sampling (bootstrap = false), ensuring that each tree is constructed using the complete dataset, thereby improving the model’s stability.

3.6. Model Uncertainty Assessment

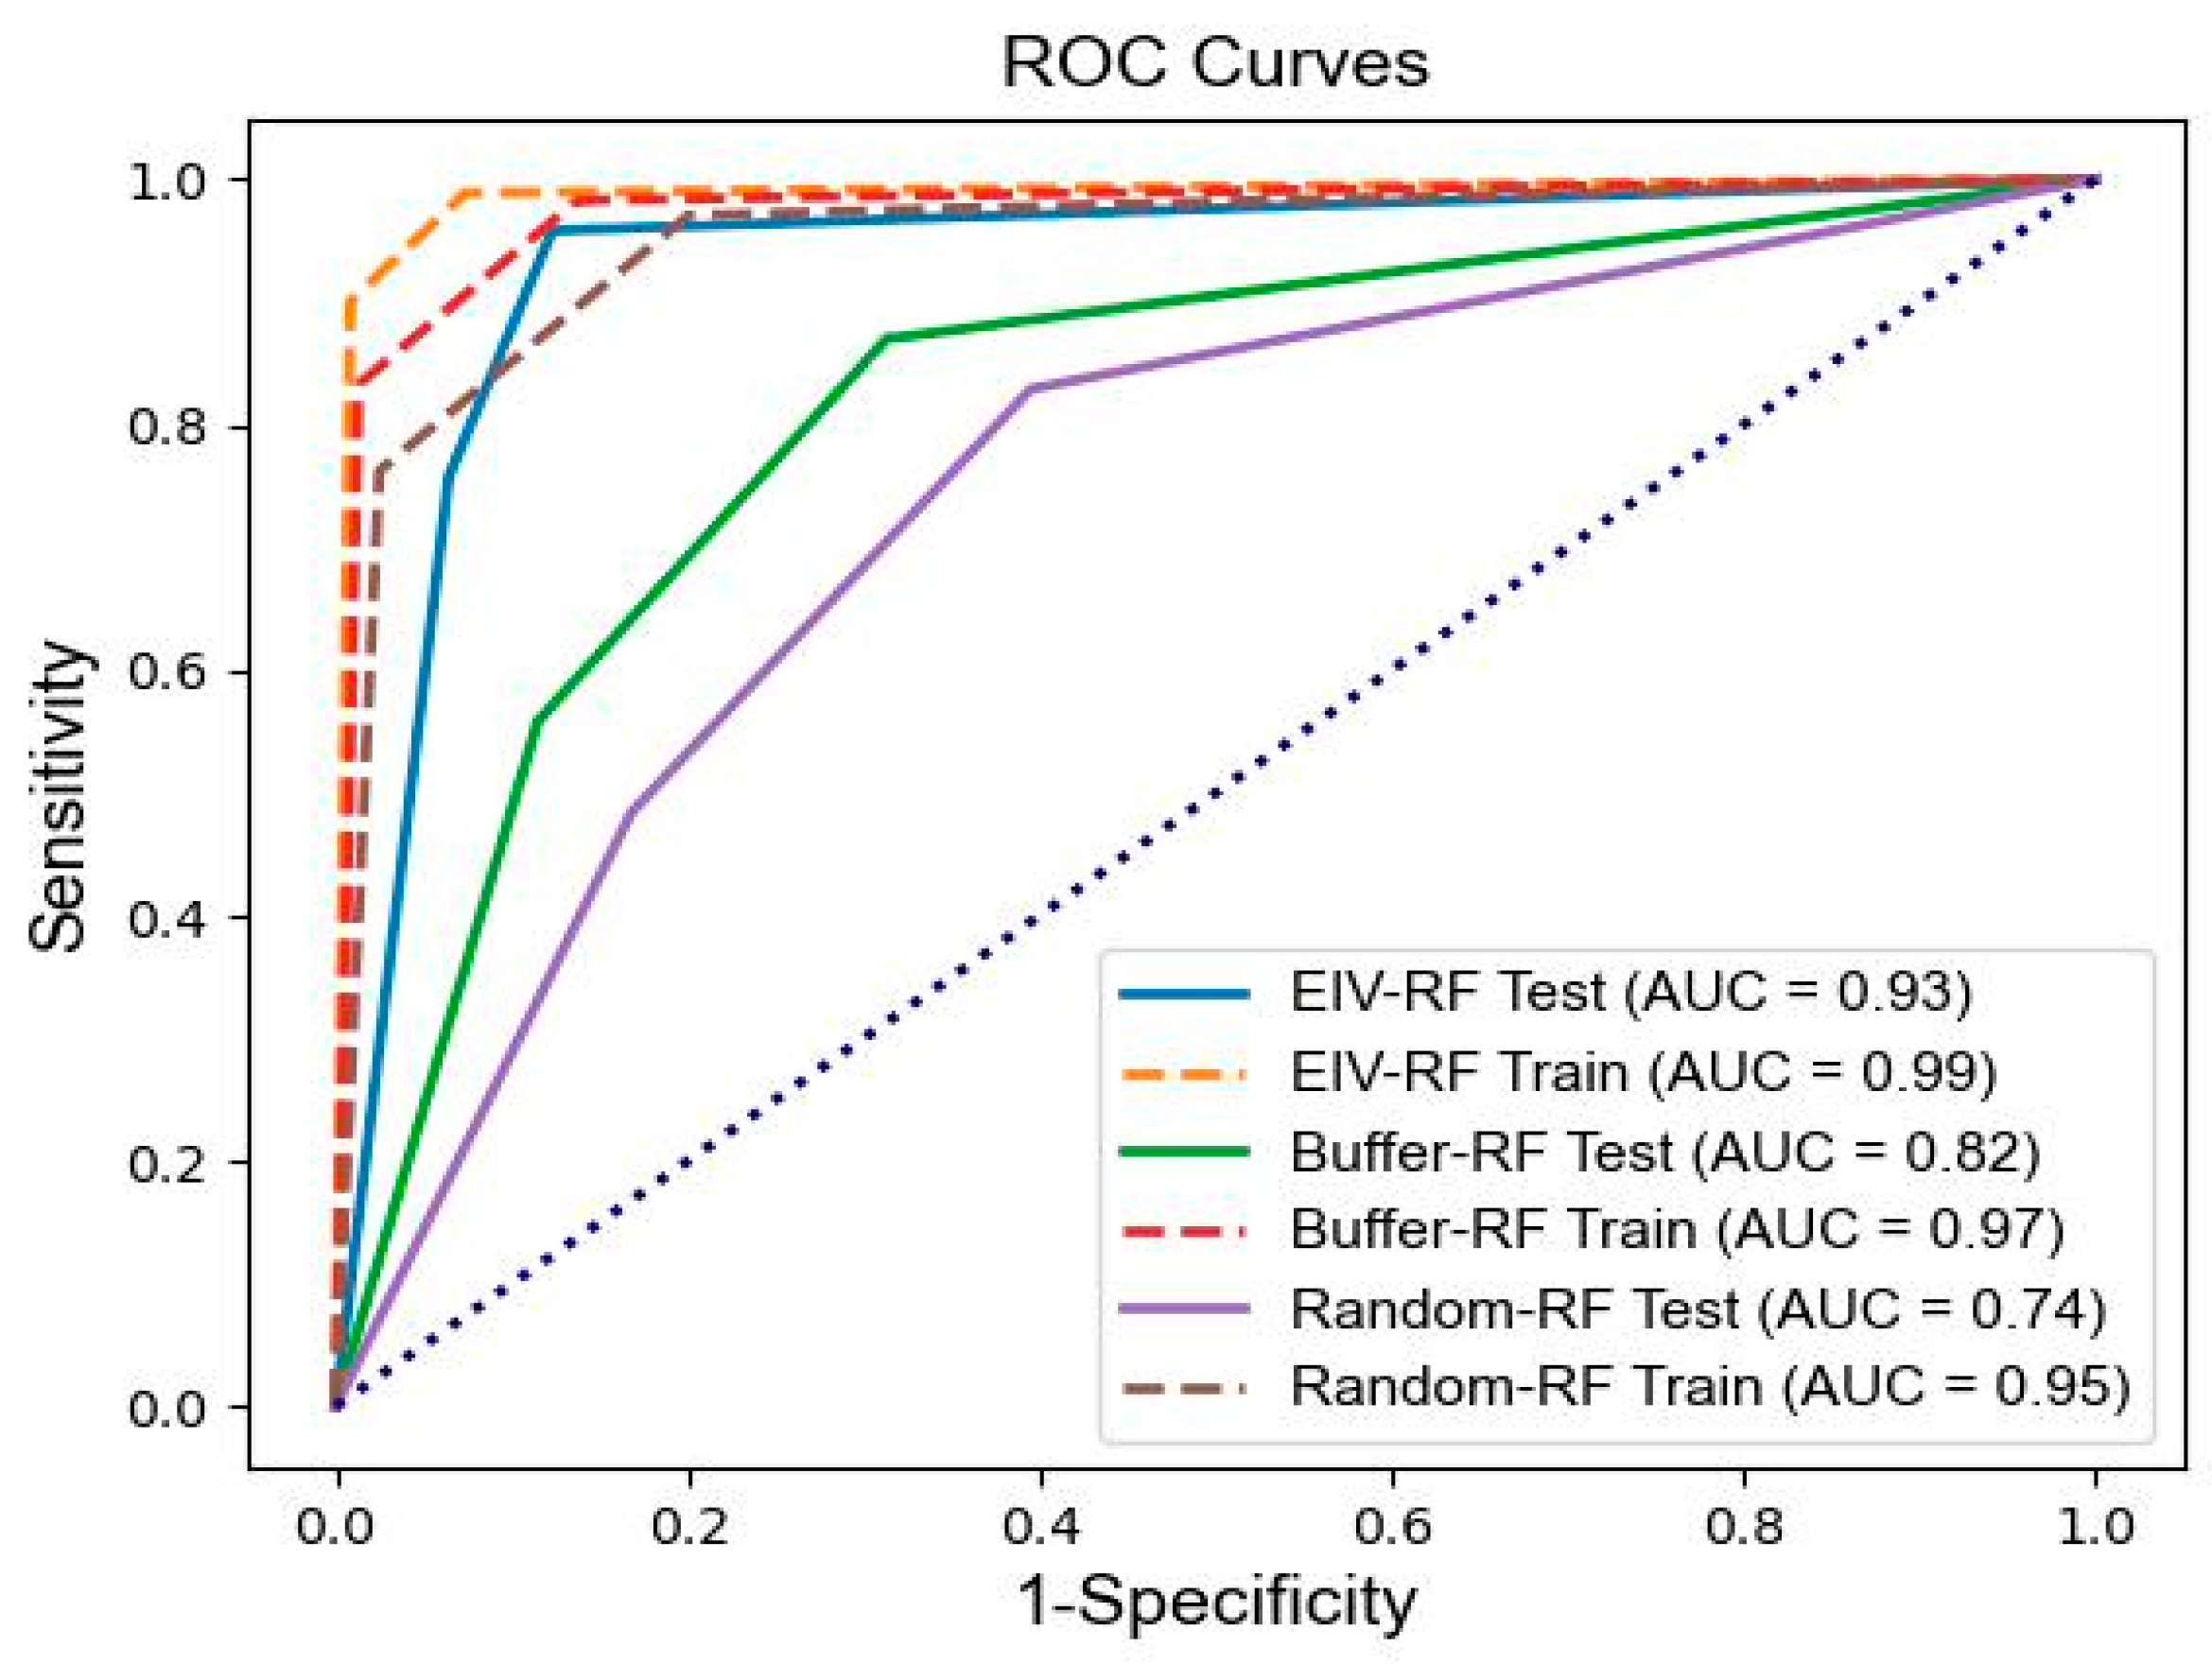
3.6.1. Accuracy Analysis Based on ROC Curves

The accuracy analysis based on ROC curves is a crucial method for assessing the efficacy of binary classification algorithms. The visualization illustrates the model’s efficacy through a graphical representation that delineates the correlation between the true-positive rate (TPR) and the false-positive rate (FPR) over a range of threshold values [48]. The procedure for building an ROC curve involves data preparation, threshold determination, calculation of TPR and FPR, and plotting the points with FPR on the horizontal axis and TPR along the ordinate. The efficacy of the model is evaluated by the Area Under the ROC Curve (AUC). A higher Area Under the Curve (AUC) denotes enhanced classification efficacy, where an optimal model asymptotically reaches an AUC value of unity. Through the comparison of ROC curves across various models, we can intuitively evaluate their efficacy. In practical applications, we can select an appropriate threshold from the ROC curve to balance TPR and FPR, optimizing precision, recall, and other relevant metrics.

3.6.2. Accuracy Evaluation Based on Confusion Matrix

The metrics of precision and recall derived from the error matrix are essential for assessing the effectiveness of classification algorithms. In the confusion matrix, TP (true positive) represents the number of correctly predicted landslide occurrences, TN (true negative) represents the number of correctly predicted non-landslide areas, FP (false positive) represents the number of non-landslide areas incorrectly predicted as landslides, and FN (false negative) represents the number of landslide occurrences incorrectly predicted as non-landslide areas. The Kappa coefficient is employed to assess the consistency of the model [49]. Based on Equations (2)–(5), the following calculations are conducted:
A c c u r a c y = T P + T N T P + T N + F P + F N
P r e c i s i o n = T P T P + F P
Recall = T P T P + F N
K a p p a = P P O 1 P O
In Equation (5), a higher Kappa coefficient indicates better model consistency. Generally, a Kappa coefficient above 0.8 signifies high consistency, ranging from 0.61 to 0.8 suggests significant consistency, from 0.41 to 0.6 implies moderate agreement, from 0.21 to 0.4 conveys fair agreement, and values below 0.2 imply low agreement. P represents the sum of correctly classified samples for each category divided by the total number of samples, which is also known as the overall classification accuracy. PO represents the expected agreement rate, which is the consistency due to chance between two measurements. Based on Equations (6)–(7), the following calculations are conducted:
P = T P + T N T P + T N + F P + F N
P O = ( T P + F P ) × ( T P + F N ) + ( T N + F P ) × ( T N + F N ) ( T P + T N + F P + F N ) 2

4. Results

4.1. Selection of Landslide Impact Factors

In this study, 20 environmental factors were initially selected as potential landslide impact factors. Recursive feature elimination (RFE) was employed for the analysis [50], which iteratively identifies the most significant factors based on their importance scores. This study utilized both landslide and non-landslide samples as the modeling dataset. Starting with the initial set of 20 impact factors, a feature selection was conducted, and the random forest model was trained using this selected feature set to evaluate the significance of each factor. The algorithm subsequently removed the least significant feature and updated the feature set. This process continued until a predetermined termination criterion was fulfilled, such as attaining a certain number of features or witnessing no additional enhancement in model efficacy. By iteratively training the model, the initial set of 20 impact factors underwent feature set recursion, enabling the identification of key factors that significantly enhanced model performance while eliminating those with minimal impact or irrelevance. This led to the identification of the optimal feature subset for classification. In this study, twelve significant impact factors with high importance scores were ultimately selected for landslide susceptibility modeling: elevation, slope, aspect, plan curvature, profile curvature, precipitation, humidity, population density, vegetation index, t_oc (0–30 cm soil organic carbon content), t_silt (0–30 cm silt content), and s_clay (30–100 cm clay content) (Figure 3). These factors encompass topographical, geological, soil, vegetation, and precipitation information, providing a comprehensive representation of the geological setting and potential risks in this study area. Through importance analysis, the relative significance of each impact factor was assessed (Figure 4), with higher values indicating a greater influence on the landslide model. Among these factors, elevation, slope, and precipitation had importance scores of 0.227, 0.120, and 0.119, respectively, making them the three most influential factors affecting the landslide model.

4.2. Selection of Non−Landslide Samples

Drawing on the geographic characteristics of past landslides in Henan Province and the relevant literature, a sum of 1021 non-landslide samples were arbitrarily chosen from the Henan Province region using the whole-region random sampling method, matching the quantity of the landslide samples (Figure 5a).
To select non-landslide samples beyond the buffer zone, a landslide buffer zone measuring 5000 m was established based on 1021 historical landslide sites. Subsequently, 1021 non-landslide samples were randomly selected from within this buffer zone (Figure 5b).
Based on the enhanced information value (EIV) method, the total information values were found to range from −4.225 to 3.526. Following the partitioning process,1021 grid cells were randomly chosen from areas of extremely low susceptibility to act as non-landslide samples (Figure 5c).

4.3. Model Comparison and Evaluation

The ROC curves of the three models are illustrated in Figure 6. As depicted in the illustration, the ROC curve of the random-RF model demonstrates a lower degree of convexity, with an AUC value of 0.74. This indicates that the performance of the random-RF model is relatively poor across all false-positive rates, reflecting a reduced capacity to differentiate between positive and negative instances. By comparison, the buffer zone-RF model achieves an AUC value of 0.82. The buffer zone-RF model performs well at low false-positive rates, but its performance degrades as the false-positive rate increases. This indicates that selecting non-landslide samples from outside the buffer zone of landslide points enhances the accuracy of the random forest model. The ROC curve of the EIV-RF model surpasses that of the random-RF and buffer zone-RF models, with an AUC value of 0.93. As the false-positive rate rises, the true-positive rate concurrently increases, signifying a strong capability to discriminate between positive and negative samples. This underscores that selecting non-landslide samples based on the EIV model in initially partitioned very-low- and low-susceptibility zones significantly improves model accuracy.
Analysis of the ROC curves for the three models reveals that the EIV-RF model demonstrates the superior predictive accuracy, followed by the buffer zone-RF model in terms of performance. The random-RF model, in comparison, shows relatively poorer predictive performance than the two coupled models.
The accuracy evaluation metrics for the coupled models are shown in Table 2. As indicated in Table 2, the rankings for accuracy, precision, and the Kappa coefficient are as follows: random-RF < buffer zone-RF < EIV-RF. The results indicate that the buffer zone-RF and EIV-RF coupled models exhibit higher predictive accuracy compared to the random-RF model. Specifically, the performance accuracy of the buffer zone-RF model is 73.31%, while the EIV-RF model reaches a significantly higher accuracy of 85.31%. These findings further confirm the superior reliability of the EIV-RF model. The Kappa coefficient of the EIV-RF model is 0.7014, which points to outstanding agreement in the predictive outcomes. In contrast, the Kappa coefficient for the buffer zone-RF model is 0.4524, indicating good consistency. The Kappa coefficient of the random-RF model is 0.3227, suggesting a level of moderate agreement in the prediction results. Similarly, the recall values follow the same ranking pattern: the EIV-RF model achieves the highest recall (0.7581), demonstrating its strong ability to correctly identify positive instances. The buffer zone-RF model shows moderate recall (0.5581), and the random-RF model has the lowest recall (0.4839), reflecting its relatively weaker performance in capturing true-positive cases. Based on these evaluation metrics, it can be concluded that effectiveness of the three models in predicting susceptibility is ranked as follows: EIV-RF > buffer zone-RF > random-RF.
Using the non-landslide samples sourced from three selection methods, a random forest model was utilized to forecast the vulnerability of grid units across Henan Province. To facilitate comparison of the prediction results from different selection methods, utilization of natural breakpoint methodology enabled the classification of the estimated susceptibility index into five separate categories: extremely low, low, moderate, high, and extremely high. The outcomes of the modeling and statistical analyses, derived from various methodologies for selecting non-landslide samples, are presented in Figure 7 and detailed in Table 3.
In the context of landslide susceptibility forecasting, the spatial distribution of landslide occurrences is not uniform and exhibits variability across different intervals of influencing factors. The relative density [51] can describe the influence of each factor on landslide occurrences within these ranges. Relative density is defined as the landslide occurrence ratio differs by different grades in a specific area to the total area occupied by those landslides of that grade. This concept is commonly employed in geological hazard research to evaluate the occurrence rate and effects of landslides of different grades. The formula is as follows:
D = N i / N S i / S
In this equation, D represents the relative frequency of landslide occurrences. Here, Ni quantifies the number of landslides that have occurred within the i-th level of the respective influencing factor. N is the cumulative tally of landslide occurrences throughout the entire research area. Si characterizes the spatial coverage of the i-th classification of the factor, and S denotes the total area encompassed by the study region.
Analysis of Figure 7 and Table 3 reveals that as the landslide susceptibility level increases, the corresponding D value also rises. Most of the landslide grid cells fall within the zones of extremely high susceptibility, as forecasted by the trio of methodologies. This indicates that while the overall susceptibility maps produced using the three distinct selection techniques are similar, notable differences are present in the finer details. Under the condition of using an equal-proportion sample set (landslide: non-landslide = 1:1), the historical landslide proportion within the zones classified as extremely high susceptibility predicted by the random-RF, buffer zone-RF, and EIV-RF models are 72.18%, 74.83%, and 87.37%, respectively. Among these models, the EIV-RF predicts the highest count of past landslides within the extremely-high-susceptibility zones, indicating that the EIV-RF model’s susceptibility predictions correspond more closely with the spatial patterns of documented landslides and demonstrate superior modeling performance.

4.4. Impact of Non-Landslide Sampling Strategies

4.4.1. Difference in Non-Landslide Sample Distribution

By analyzing the arrangement of non-landslide samples in Figure 5, differences in the selection of non-landslide samples by various methodologies can be observed: (1) Whole-region random sampling method: This method is simple and straightforward but highly random, making it difficult to guarantee the integrity and dependability of non-landslide samples. The selected samples may include some potentially high-susceptibility areas, reducing the accuracy of model predictions. (2) Landslide buffer zone method: This method excludes areas significantly impacted by landslides by establishing a buffer zone. The selected samples are relatively reliable. However, there is no unified standard for determining the radius of the buffer zone, and both excessively small and overly large buffer zones can compromise the quality and accuracy of samples and modeling. (3) Enhanced information value (EIV) method: This method comprehensively considers factors such as topography, geology, and climate. By integrating machine learning with information value methods, it employs a recursive feature elimination algorithm to identify factors with a significant impact on landslides. Weights are then assigned to the information value (IV) model based on the importance scores of these factors. The non-landslide samples chosen from regions characterized by very low and low susceptibility within the refined information value model are more precise and purposeful, effectively avoiding potential high-susceptibility areas. This refinement elevates the sample quality and enhances the precision of the model.

4.4.2. Difference in Model Accuracy

This paper investigates the impact of three non-landslide sample selection methods (whole-region random selection, landslide buffer zone selection, and enhanced information value method) on the precision of landslide susceptibility forecasting models. By constructing three coupled models (random-RF, buffer zone-RF, and EIV-RF) and comparing their prediction accuracies, the following observations were made: (1) The random-RF model exhibited the lowest accuracy, primarily due to the inherent randomness in the non-landslide sample selection process, which compromises the quality and reliability of the samples. Consequently, this impacts the model’s performance accuracy. The AUC value is 0.74, and the Kappa coefficient is 0.32, indicating moderate consistency in predicting landslide susceptibility, though with considerable uncertainty. (2) The buffer zone-RF model has intermediate accuracy. This model excludes areas significantly affected by landslides by setting a buffer zone, resulting in more reliable samples. Its AUC value is 0.82, and the Kappa coefficient is 0.45, indicating improved capability to differentiate between landslide (positive) and non-landslide (negative) samples, with prediction results superior to random guessing. However, further improvements are necessary to enhance the consistency and accuracy of the prediction outcomes. (3) The EIV-RF model demonstrates the highest accuracy in our study. By incorporating multiple factors such as topography, geology, and climate and utilizing machine learning algorithms for information value weight allocation, this model effectively mitigates potential high-susceptibility areas. Consequently, it enhances sample quality and modeling accuracy. The model achieves an AUC value of 0.93, an accuracy rate of 85.31% and a Kappa coefficient of 0.7014, indicating excellent consistency in the prediction results, the strongest capability to distinguish between positive and negative samples, and minimal uncertainty.

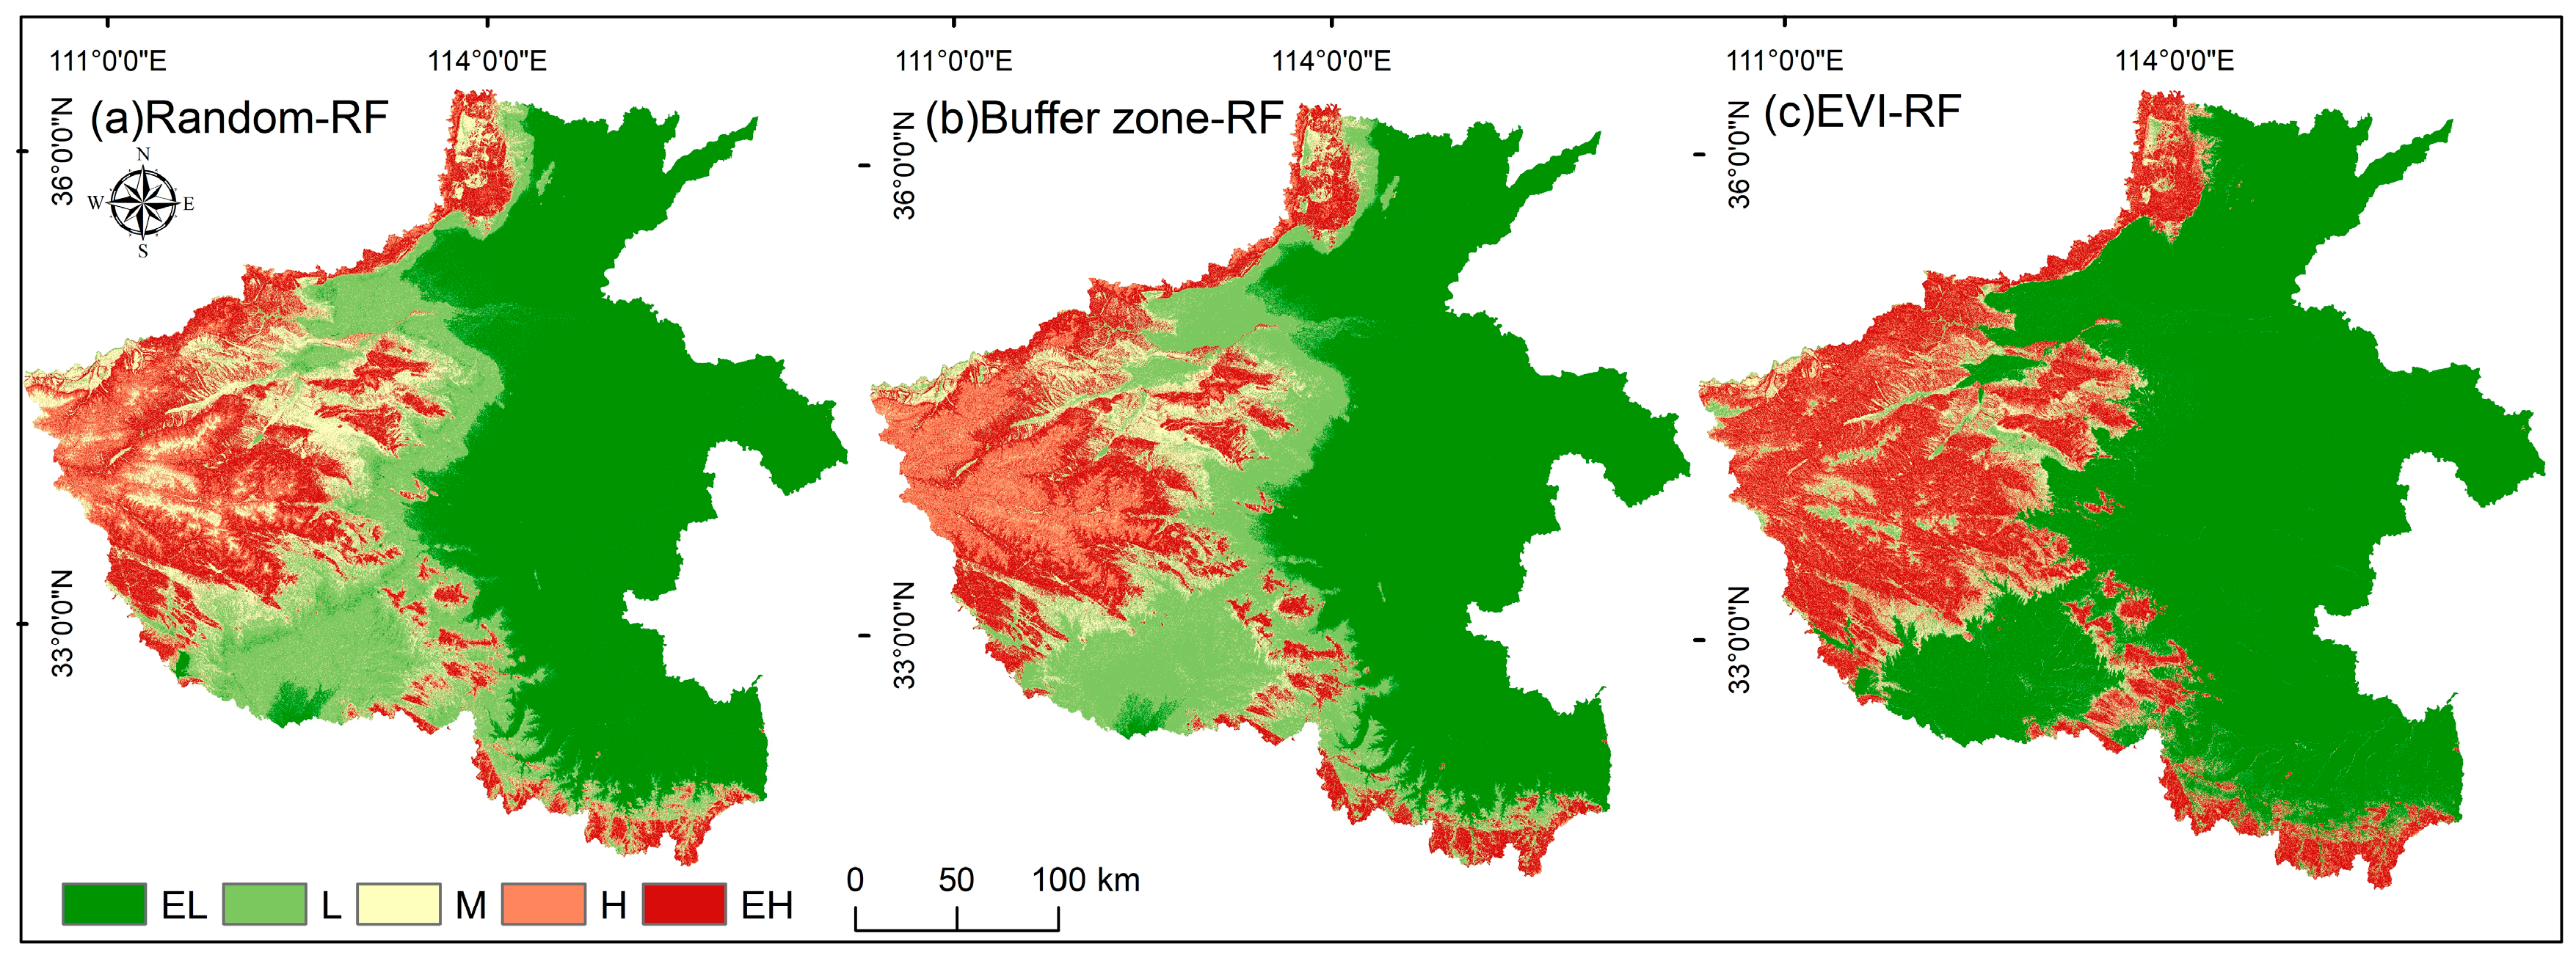
4.4.3. Difference in Landslide Susceptibility Distribution

This paper compares the landslide susceptibility prediction generated by three models: random-RF, buffer zone-RF, and EIV-RF. These models were constructed using three different non-landslide sample selection methods: whole-region random selection, landslide buffer zone selection, and the enhanced information value method. The overall distribution of susceptibility predicted by all three models is similar, displaying a gradual increase from low to high susceptibility areas. However, notable differences exist in the details, particularly regarding the distribution range of extremely high areas and the proportion of landslide points: (1) The EIV-RF model’s prediction outcomes are more aligned with actual environmental conditions, exhibiting the greatest concentration of landslide occurrences in regions classified as having an extremely high susceptibility. The EIV-RF model forecasts that these areas contain the majority of historical landslide points, accounting for 87.37%. This demonstrates the model’s robust capability to identify potential high-susceptibility zones and effectively pinpoint high-risk areas for landslides. The susceptible areas are more concentrated, with the EIV-RF model indicating that extremely high zones are primarily located in geologically complex and steep terrains such as the Taihang Mountains, the Sanmenxia-Luoyang Loess Hilly Mountain Area, the Xiaohe Mountains-Xiong’er Mountains-Funiu Mountain Area, and the Tongbai-Dabie Mountain Area. (2) The prediction outcomes of the buffer zone-random forest (RF) model are ranked second, featuring a notably substantial proportion of landslide events within the zones designated as extremely high risk. This model predicts that 74.83% of the historical landslide points fall within these areas, which is higher than that for the random-RF model but lower than the EIV-RF model. The buffer zone-RF model also forecasts a slightly broader distribution range for susceptible areas, including some potential high-susceptibility zones. (3) The random-RF model yields the poorest prediction results, exhibiting the smallest percentage of landslide occurrences in the extremely high zones. It predicts that only 72.18% of the historical landslide points are located within these areas, which is lower than both the buffer zone-RF model and the EIV-RF model.

5. Discussion

This study evaluates the impact of three non-landslide sample selection methods—whole-region random selection, landslide buffer zone selection, and the enhanced information value method—on landslide susceptibility prediction. The findings indicate that the enhanced information value method significantly improves model accuracy and reduces uncertainty. This section examines the non-landslide sample selection process and the efficacy of the integrated models derived from two perspectives.
The method for identifying non-landslide specimens is essential to the accuracy of landslide proneness prediction models [52]. The whole-region random selection method may compromise sample quality and reliability; high randomness may lead to the inclusion of potential high-susceptibility areas in non-landslide samples, leading to reduced model prediction accuracy. Although the landslide buffer zone method can effectively exclude areas heavily impacted by landslides, with the lack of a unified standard for determining the buffer zone radius, overly small or large buffers compromise sample quality which ultimately affects model accuracy. The enhanced information value (EIV) method, by incorporating the weights of impact factors and circumventing areas with high susceptibility, selects more reliable non-landslide samples. This enhances model accuracy and reduces uncertainty. Additionally, the EVI method integrates the weights of impact factors with the likelihood of landslides happening, resulting in a more precise selection of non-landslide samples. By integrating machine learning with information value methods, the EVI method can identify significant factors influencing landslide occurrence and assign weights based on their importance. This procedure facilitates the identification of more exemplary non-landslide samples within regions characterized by extreme susceptibility levels. Consequently, this approach effectively avoids potential high-susceptibility areas, enhances sample quality, improves modeling accuracy, and reduces uncertainty.
The EIV-RF model, developed using the enhanced information value method, surpasses both the random-RF model and the buffer zone-RF model in prediction accuracy and uncertainty. The EIV-RF model attains an AUC value of 0.93, an accuracy rate of 85.31%, and a Kappa coefficient of 0.7014. The EIV method outperforms the other two methods in both prediction accuracy and spatial alignment with historical landslides. These metrics demonstrate its superior capability in identifying potential high-susceptibility areas and effectively identify high-risk areas for landslides. This performance reflects the EIV method’s strength in weighting impact factors and avoiding potential high-susceptibility regions. The landslide susceptibility mapping produced by the EIV-RF model indicates that regions classified as extremely high encompass the bulk of the historical landslide locations, constituting 87.37% of the total. This indicates the model’s strong capability in identifying potential high-susceptibility zones and suggests a more concentrated distribution of these areas. The regions of high and extremely high susceptibility identified by the EIV-RF model are predominantly situated in geologically complex and steep terrains, including the Taihang Mountains, the Sanmenxia-Luoyang Loess Hilly Mountain Area, the Xiaohe Mountains-Xiong’er Mountains-Funiu Mountain Area, and the Tongbai-Dabie Mountain Area, which aligns with actual observations [22].

6. Conclusions

This study evaluates three non-landslide sample selection methods—whole-region random selection, landslide buffer zone selection, and the enhanced information value (EVI) method—utilizing the RF (random forest) model. The following conclusions have been drawn:
Compared to the whole-region random selection and the landslide buffer zone methods, the EVI-RF model demonstrates superior prediction accuracy and reduced uncertainty. With an AUC value of 0.93, an accuracy rate of 85.31%, and a Kappa coefficient of 0.7014, the EVI-RF model excels at identifying areas with high susceptibility and precisely pinpointing high-risk landslide zones. The EVI method selects non-landslide samples from regions characterized by extremely low susceptibility, thereby minimizing the risk of including potential high-susceptibility areas. This method intensifies the representativeness and reliability of the samples, significantly reducing model uncertainty.
By integrating machine learning with information value methods, the EVI method assigns weights to various factors, thereby discerning their respective contributions to landslide occurrences. This comprehensive consideration of factor weights and landslide probability allows for a more precise selection of non-landslide samples, ultimately improving model accuracy. The EVI method delineates extremely high zones that are smaller in size but more concentrated, capturing the majority of historical landslide points with a landslide point proportion of 87.37%. In contrast, the high-susceptibility areas identified by the other two methods are larger in scope but exhibit lower landslide coverage. The EVI-RF model’s ability to identify concentrated high-risk zones makes it particularly valuable for targeted landslide mitigation efforts in regions with complex geological conditions. Future studies could explore the integration of additional environmental or anthropogenic factors to further enhance the model’s predictive capabilities. However, the method has limitations, including its reliance on high-quality and high-resolution input data and its sensitivity to the geomorphological and climatic characteristics of the study area.
Future studies could enhance the model by incorporating dynamic factors such as real-time rainfall variability and seismic activity, integrating high-resolution remote sensing data like LiDAR and InSAR, and expanding the model to include dynamic anthropogenic factors such as land-use changes and infrastructure development. The EIV method shows promise for broader application but requires region-specific adjustments, such as recalibrating factor weights for distinct geological regimes and prioritizing climate-specific factors. Cross-regional validation using standardized benchmarks would further strengthen the method’s generalizability. In summary, the EIV-RF model provides a robust tool for landslide susceptibility assessment, particularly in regions with complex topography and sufficient data infrastructure, and its adaptability to diverse environments positions it as a valuable asset for global disaster risk reduction.

Author Contributions

Y.F. contributed to the conceptualization, methodology, investigation, formal analysis, and data curation. Z.F. contributed to software development, validation, and was the lead for writing—original draft. X.L. and P.W. were involved in data curation and visualization. X.S. and Y.R. contributed to resources and writing—review and editing. W.C. was responsible for the funding acquisition, and supervision of the study. All authors have read and agreed to the published version of the manuscript.

Funding

This research was financially supported by the Open Research Fund of Henan Provincial Key Laboratory of Hydrosphere and Watershed Water Security (grant no. HWWSF202302); National Natural Science Foundation of China (grant no. 42307075, 42301336, 42307519); Hebei Central Government-Guided Local Science and Technology Development Fund Project (grant no. 246Z3601G); Hebei Natural Science Fund for Distinguished Young Scholars (grant no. D2023504030).

Data Availability Statement

The original contributions presented in the study are included in the article, further inquiries can be directed to the corresponding author.

Acknowledgments

We would like to express our gratitude to Wengeng Cao for his guidance in the funding acquisition and supervision of the study. Special thanks to Yu Fu for her significant contributions to the conceptualization, methodology, investigation, formal analysis, and data curation, and to Zhihao Fan for leading the software development, validation, and manuscript drafting. We also appreciate Xiangzhi Li and Pengyu Wang for their assistance with data curation and visualization. Our thanks go to Xiaoyue Sun and Yu Ren for their valuable input on resources and manuscript revision.

Conflicts of Interest

The authors declare no conflicts of interest.

References

  1. Chaudhary, M.T.; Piracha, A. Natural disasters—Origins, impacts, management. Encyclopedia 2021, 1, 1101–1131. [Google Scholar] [CrossRef]
  2. Cao, W.; Pan, D.; Xu, Z.; Zhang, W.; Ren, Y.; Nan, T. Landslide Disaster Vulnerability Mapping Study in Henan Province: Comparison of Different Machine Learning Models. Bull. Geol. Sci. Technol. 2025, 44, 101–111. [Google Scholar]
  3. China Natural Resources News Agency. Excerpts from the China Natural Resources Bulletin 2023. Resour. Hum. Settl. Environ. 2024, 2024, 6–10. [Google Scholar] [CrossRef]
  4. Nath, S.K.; Sengupta, A.; Srivastava, A. Remote sensing GIS-based landslide susceptibility & risk modeling in Darjeeling–Sikkim Himalaya together with FEM-based slope stability analysis of the terrain. Nat. Hazards 2021, 108, 3271–3304. [Google Scholar]
  5. Deng, X.; Zeng, M.; Xu, D.; Qi, Y. Why do landslides impact farmland abandonment? Evidence from hilly and mountainous areas of rural China. Nat. Hazards 2022, 113, 699–718. [Google Scholar] [CrossRef]
  6. Gizzi, F.T.; Antunes, I.M.H.R.; Reis, A.P.M.; Giano, S.I.; Masini, N.; Muceku, Y.; Pescatore, E.; Potenza, M.R.; Corbalán Andreu, C.; Sannazzaro, A.; et al. From Settlement Abandonment to Valorisation and Enjoyment Strategies: Insights through EU (Portuguese, Italian) and Non-EU (Albanian) ‘Ghost Towns’. Heritage 2024, 7, 3867–3901. [Google Scholar] [CrossRef]
  7. Pradhan, B. Landslide susceptibility mapping of a catchment area using frequency ratio, fuzzy logic and multivariate logistic regression approaches. J. Indian Soc. Remote Sens. 2010, 38, 301–320. [Google Scholar] [CrossRef]
  8. Huang, F.; Zeng, S.; Yao, C.; Xiong, H.; Fan, X.; Huang, J. Uncertainties of landslide susceptibility prediction modeling: Influence of different selection methods of “non-landslide samples”. Adv. Eng. Sci. 2024, 56, 169–182. [Google Scholar]
  9. Barik, M.G.; Adam, J.C.; Barber, M.E.; Muhunthan, B. Improved landslide susceptibility prediction for sustainable forest management in an altered climate. Eng. Geol. 2017, 230, 104–117. [Google Scholar] [CrossRef]
  10. Chao, Z.; Yin, K.; Cao, Y.; Ahmed, B.; Li, Y.; Catani, F.; Pourghasemi, H.R. Landslide susceptibility modeling applying machine learning methods: A case study from Longju in the Three Gorges Reservoir area, China. Comput. Geosci. 2018, 112, 23–37. [Google Scholar]
  11. Azarafza, M.; Ghazifard, A.; Akgun, H.; Asghari-Kaljahi, E. Landslide susceptibility assessment of South Pars Special Zone, southwest Iran. Environ. Earth Sci. 2018, 77, 805. [Google Scholar] [CrossRef]
  12. Shahabi, H.; Hashim, M. Landslide susceptibility mapping using GIS-based statistical models and Remote sensing data in tropical environment. Sci. Rep. 2015, 5, 9899. [Google Scholar] [CrossRef] [PubMed]
  13. Du, G.L.; Zhang, Y.S.; Iqbal, J.; Yang, Z.H.; Yao, X. Landslide susceptibility mapping using an integrated model of information value method and logistic regression in the Bailongjiang watershed, Gansu Province, China. J. Mt. Sci. 2017, 14, 249–268. [Google Scholar]
  14. Zhang, P.; Deng, H.; Zhang, W.; Xve, D.; Wu, X.; Zhuo, W. Landslide susceptibility evaluation based on Information Value model and Machine Learning method: A case study of Lixian County, Sichuan Province. Sci. Geogr. Sin. 2022, 42, 1665–1675. [Google Scholar] [CrossRef]
  15. Nsengiyumva, J.B.; Luo, G.; Amanambu, A.C.; Mind, R.; Habiyaremye, G.; Karamage, F.; Ochege, F.U.; Mupenzi, C. Comparing probabilistic and statistical methods in landslide susceptibility modeling in Rwanda/Centre-Eastern Africa. Sci. Total Environ. 2019, 659, 1457–1472. [Google Scholar] [CrossRef]
  16. Eker, A.M.; Dikmen, M.; Cambazoğlu, S.; Düzgün, Ş.H.B.; Akgün, H. Evaluation and comparison of landslide susceptibility mapping methods: A case study for the Ulus district, Bartın, northern Turkey. Int. J. Geogr. Inf. Sci. 2015, 29, 132–158. [Google Scholar] [CrossRef]
  17. Bueechi, E.; Klime, J.; Frey, H.; Huggel, C.; Strozzi, T.; Cochachin, A. Regional-scale landslide susceptibility modelling in the Cordillera Blanca, Peru—A comparison of different approaches. Landslides 2019, 16, 395–407. [Google Scholar] [CrossRef]
  18. Bui, D.T.; Pradhan, B.; Lofman, O.; Revhaug, I. Landslide Susceptibility Assessment in Vietnam Using Support Vector Machines, Decision Tree, and Naive Bayes Models. Math. Probl. Eng. 2012, 2012, 1–26. [Google Scholar] [CrossRef]
  19. Merghadi, A.; Yunus, A.P.; Dou, J.; Whiteley, J.; ThaiPham, B.; Bui, D.T.; Avtar, R.; Abderrahmane, B. Machine learning methods for landslide susceptibility studies: A comparative overview of algorithm performance. Earth-Sci. Rev. 2020, 207, 103225. [Google Scholar]
  20. Guo, R. Henan. In Regional China: A Business and Economic Handbook; Palgrave Macmillan: London, UK, 2013; pp. 130–141. [Google Scholar]
  21. Wang, N.; Cheng, W.; Wang, B.; Liu, Q.; Zhou, C. Geomorphological regionalization theory system and division methodology of China. J. Geogr. Sci. 2020, 30, 212–232. [Google Scholar] [CrossRef]
  22. Wang, J.A.; Liang, S.; Shi, P. Topography and landforms. In The Geography of Contemporary China; Springer International Publishing: Cham, Switzerland, 2022; pp. 63–84. [Google Scholar]
  23. Wu, W.; Wang, C.; Guan, H.; Huang, M.; Qiao, W. Geological hazard vulnerability assessment in southern part of Tangkou fault based on GIS and weighted information value model. Sci. Technol. Eng. 2024, 24, 11121–11130. [Google Scholar]
  24. Li, J.; Liu, Y.; Cao, M.; Xue, B. Space-time characteristics of vegetation cover and distribution: Case of the Henan Province in China. Sustainability 2015, 7, 11967–11979. [Google Scholar] [CrossRef]
  25. Zhang, Z.; Wang, W.; Zhang, X.; Zhang, H.; Yang, L.; Lv, X.; Xi, X. A Harmony-Based Approach for the Evaluation and Regulation of Water Security in the Yellow River Water-Receiving Area of Henan Province. Water 2024, 16, 2497. [Google Scholar] [CrossRef]
  26. Zhang, F.; Peng, J.; Huang, X.; Lan, H. Hazard assessment and mitigation of non-seismically fatal landslides in China. Nat. Hazards 2021, 106, 785–804. [Google Scholar]
  27. Reichenbach, P.; Rossi, M.; Malamud, B.D.; Mihir, M.; Guzzetti, F. A review of statistically-based landslide susceptibility models. Earth-Sci. Rev. 2018, 180, 60–91. [Google Scholar] [CrossRef]
  28. Zhou, J.W.; Cui, P.; Hao, M.H. Comprehensive analyses of the initiation and entrainment processes of the 2000 Yigong catastrophic landslide in Tibet, China. Landslides 2016, 13, 39–54. [Google Scholar] [CrossRef]
  29. He, Q.; Shahabi, H.; Shirzadi, A.; Li, S.; Chen, W.; Wang, N.; Chai, H.; Bian, H.; Ma, J.; Chen, Y.; et al. Landslide spatial modelling using novel bivariate statistical based Naïve Bayes, RBF Classifier, and RBF Network machine learning algorithms. Sci. Total Environ. 2019, 663, 1–15. [Google Scholar]
  30. Shahri, F.L.S.; Spross, J.; Johansson, F.; Larsson, S. Landslide susceptibility hazard map in southwest Sweden using artificial neural network. CATENA 2019, 183, 104225. [Google Scholar]
  31. Dao, D.V.; Jaafari, A.; Bayat, M.; Mafi-Gholami, D.; Qi, C.; Moayedi, H.; Van Phong, T.; Ly, H.-B.; Le, T.-T.; Trinh, P.T.; et al. A spatially explicit deep learning neural network model for the prediction of landslide susceptibility. CATENA 2020, 188, 104451. [Google Scholar] [CrossRef]
  32. Gizzi, F.T.; Bentivenga, M.; Lasaponara, R.; Danese, M.; Potenza, M.R.; Sileo, M. Natural Hazards, Human Factors, and “Ghost Towns”: A Multi-Level Approach. Geoheritage 2019, 11, 1533–1565. [Google Scholar] [CrossRef]
  33. Fiorucci, F.; Ardizzone, F.; Mondini, A.C.; Viero, A.; Guzzetti, F. Visual interpretation of stereoscopic NDVI satellite images to map rainfall-induced landslides. Landslides 2019, 16, 165–174. [Google Scholar] [CrossRef]
  34. Hürlimann, M.; Guo, Z.; Puig-Polo, C.; Medina, V. Impacts of future climate and land cover changes on landslide susceptibility: Regional scale modelling in the Val d’Aran region (Pyrenees, Spain). Landslides 2022, 19, 99–118. [Google Scholar] [CrossRef]
  35. Guzzetti, F.; Mondini, A.C.; Cardinali, M.; Fiorucci, F.; Santangelo, M.; Chang, K.-T. Landslide inventory maps: New tools for an old problem. Earth-Sci. Rev. 2012, 112, 42–66. [Google Scholar]
  36. Dai, F.C.; Lee, C.F.; Ngai, Y.Y. Landslide risk assessment and management: An overview. Eng. Geol. 2002, 64, 65–87. [Google Scholar]
  37. Chen, W.; Li, Y.; Xue, W.; Shahabi, H.; Li, S.; Hong, H.; Wang, X.; Bian, H.; Zhang, S.; Pradhan, B.; et al. Modeling flood susceptibility using data-driven approaches of naïve bayes tree, alternating decision tree, and random forest methods. Sci. Total Environ. 2020, 701, 134979. [Google Scholar]
  38. Xu, K.; Zhao, Z.; Chen, W.; Ma, J.; Liu, F.; Zhang, Y.; Ren, Z. Comparative study on landslide susceptibility mapping based on different ratios of training samples and testing samples by using RF and FR-RF models. Nat. Hazards Res. 2024, 4, 62–74. [Google Scholar]
  39. Awad, M.; Fraihat, S. Recursive feature elimination with cross-validation with decision tree: Feature selection method for machine learning-based intrusion detection systems. J. Sens. Actuator Netw. 2023, 12, 67. [Google Scholar] [CrossRef]
  40. Imtiaz, I.; Umar, M.; Latif, M.; Ahmed, R.; Azam, M. Landslide susceptibility mapping: Improvements in variable weights estimation through machine learning algorithms—A case study of upper Indus REIVer Basin, Pakistan. Environ. Earth Sci. 2022, 81, 112. [Google Scholar] [CrossRef]
  41. Kavzoglu, T.; Sahin, E.K.; Colkesen, I. Landslide susceptibility mapping using GIS-based multi-criteria decision analysis, support vector machines, and logistic regression. Landslides 2014, 11, 425–439. [Google Scholar] [CrossRef]
  42. Miao, Y.; Zhu, A.; Yang, L.; Bai, S.; Liu, J.; Deng, Y. Sensitivity of BCS for Sampling Landslide Absence Data in Landslide Susceptibility Assessment. Mt. Res. 2016, 34, 432–441. [Google Scholar] [CrossRef]
  43. Turner, A.K. Social and environmental impacts of landslides. Innov. Infrastruct. Solut. 2018, 3, 70. [Google Scholar] [CrossRef]
  44. Kainthura, P.; Sharma, N. Machine learning drEIVen landslide susceptibility prediction for the Uttarkashi region of Uttarakhand in India. Georisk Assess. Manag. Risk Eng. Syst. Geohazards 2021, 16, 570–583. [Google Scholar] [CrossRef]
  45. Guyon, I.; Weston, J.; Barnhill, S.; Vapnik, V. Gene selection for cancer classification using support vector machines. Mach. Learn. 2002, 46, 389–422. [Google Scholar]
  46. Zhang, S.; Tan, S.; Liu, L.; Ding, D.; Sun, Y.; Li, J. Slope Rock and Soil Mass Movement Geological Hazards Susceptibility Evaluation Using Information Quantity, Deterministic Coefficient, and Logistic Regression Models and Their Comparison at Xuanwei, China. Sustainability 2023, 15, 10466. [Google Scholar] [CrossRef]
  47. Kavzoglu, T.; Teke, A. Predictive Performances of Ensemble Machine Learning Algorithms in Landslide Susceptibility Mapping Using Random Forest, Extreme Gradient Boosting (XGBoost) and Natural Gradient Boosting (NGBoost). Arab. J. Sci. Eng. 2022, 47, 7367–7385. [Google Scholar]
  48. Zali, M.; Shahedi, K. Landslide sensitivity assessment using fuzzy logic approach and GIS in Neka Watershed. Water Soil Manag. Model. 2021, 1, 67–80. [Google Scholar] [CrossRef]
  49. Zhang, L.; Li, H.; Ma, L.; Yu, B. Pronunciation quality evaluation based on the phoneme confusion matrix. Qinghua Daxue Xuebao/J. Tsinghua Univ. 2012, 52, 5–10. [Google Scholar]
  50. Turpeinen, O.M.; Garand, L.; Benoit, R.; Roch, M. Diabatic initialization of the Canadian Regional Finite-Element (RFE) Model Using Satellite Data. Part I: Methodology and Application to a Winter Storm. Mon. Weather. Rev. 1990, 118, 1381–1395. [Google Scholar] [CrossRef]
  51. Williamson, L.D.; Brookes, K.L.; Scott, B.E.; Graham, I.M.; Bradbury, G.; Hammond, P.S.; Thompson, P.M. Echolocation detections and digital video surveys provide reliable estimates of the relative density of harbour porpoises. Methods Ecol. Evol. 2016, 7, 762–769. [Google Scholar] [CrossRef]
  52. Gu, T.; Duan, P.; Wang, M.; Li, J.; Zhang, Y. Effects of non-landslide sampling strategies on machine learning models in landslide susceptibility mapping. Sci. Rep. 2024, 14, 7201. [Google Scholar]
Figure 1. The study area and the location of landslide.
Land 14 00722 g001
Figure 2. Flow chart of LSP modeling under different non–landslide sample selection methods.
Land 14 00722 g002
Figure 3. Landslide impact factors.
Land 14 00722 g003
Figure 4. Importance ranking of landslide impact factors based on RFE.
Land 14 00722 g004
Figure 5. Locations of non-landslide points selected based on three methods: (a) random, (b) buffer zone, (c) EIV.
Land 14 00722 g005
Figure 6. ROC curves for the test set and training set of different non-landslide sample selection models.
Land 14 00722 g006
Figure 7. (a) Landslide susceptibility based on random-RF, (b) Landslide susceptibility based on buffer zone-RF, (c) Landslide susceptibility based on EIV-RF.
Land 14 00722 g007
Table 1. Data sources of landslide points and impact factors.
Landslide Impact FactorsData DescriptionData SourceData Type
Landslide_siteDistribution data of geological disaster points in Henan ProvinceGeographic Remote Sensing Ecology Network (http://www.gisrs.cn, accessed on 3 January 2024)Polygon
Elevation (m)Henan Province 30 m precision DEM digital elevation dataGeospatial Data Cloud (http://www.gscloud.cn, accessed on 3 January 2024)Grid
Slope (°)Grid
Slope aspect (°)Grid
Plane curvature (1/m)Grid
Profile curvature (1/m)Grid
Soil dataset (%)Henan Province soil datasetGlobal Soil Database (HWSD)Grid
Rainfall (mm)Henan Province 30 m precision rainfall, humidity, population density data.Resource and Environmental Science Data Platform (http://www.resdc.cn, accessed on 3 January 2024)Grid
Humidity (%)Grid
Population density (people/km2)Grid
NDVINormalized Difference Vegetation IndexMOD13A3 dataset
(https://ladsweb.modaps.eosdis.nasa.gov, accessed on 3 January 2024)
Grid
Table 2. Evaluation metrics for the accuracy of different non-landslide sample selection models.
ModelAccuracyPrecisionKappaRecall
Random-RF67.02%71.43%0.32270.4839
Buffer zone-RF73.31%80.84%0.45240.5581
EIV-RF85.31%91.09%0.70140.7581
Table 3. Statistical results of susceptibility zoning based on different non-landslide sample selection models.
ModelSusceptibility LevelRandom-RFBuffer Zone-RFEIV-RF
Total number of grid cellsExtremely Low9,313,8729,084,13312,498,894
Low4,185,0974,583,694938,480
Medium2,367,2771,921,6301,294,850
High2,133,7361,927,9532,039,278
Extremely High2,472,1522,954,7243,700,615
Percentage of total grid cells (%)Extremely Low45.50%44.37%61.05%
Low20.44%22.39%4.58%
Medium11.56%9.39%6.32%
High10.42%9.42%9.96%
Extremely High12.08%14.43%18.08%
Landslide count in the study areaExtremely Low1.67%0.98%2.06%
Low8.91%7.93%3.43%
Medium17.24%16.26%7.15%
High36.04%31.15%30.66%
Extremely High36.14%43.68%56.71%
Proportion of landslides (%)Extremely Low1.67%0.98%2.06%
Low8.91%7.93%3.43%
Medium17.24%16.26%7.15%
High36.04%31.15%30.66%
Extremely High36.14%43.68%56.71%
Relative density D valueExtremely Low0.040.020.03
Low0.440.350.75
Medium1.491.731.13
High3.463.313.08
Extremely High2.993.033.14
Disclaimer/Publisher’s Note: The statements, opinions and data contained in all publications are solely those of the individual author(s) and contributor(s) and not of MDPI and/or the editor(s). MDPI and/or the editor(s) disclaim responsibility for any injury to people or property resulting from any ideas, methods, instructions or products referred to in the content.

