Article

Spatiotemporal Impacts and Mechanisms of Multi-Dimensional Urban Morphological Characteristics on Regional Heat Effects in the Guangdong–Hong Kong–Macao Greater Bay Area

by
Jiayu Wang
1,
Yixuan Wang
2,* and
Tian Chen
2
1
School of Architecture and Urban Planning, Beijing University of Civil Engineering and Architecture, Beijing 100044, China
2
School of Architecture, Tianjin University, Tianjin 300072, China
*
Author to whom correspondence should be addressed.
Land 2025, 14(4), 729; https://doi.org/10.3390/land14040729
Submission received: 5 March 2025 / Revised: 22 March 2025 / Accepted: 24 March 2025 / Published: 28 March 2025

Abstract

:
The impact of urban morphology characteristics on regional thermal environments is a crucial topic in urban planning and climate adaptation research. However, existing studies are often limited to a single dimension and fail to fully reveal the spatiotemporal impact mechanisms of multi-dimensional urban morphology on thermal environments and their connection to regional planning policies. This study focuses on the Guangdong–Hong Kong–Macao Greater Bay Area (GBA), combining quantitative data from landscape pattern indices, land use expansion patterns, and local climate zones (LCZs) derived from 2000 to 2020. By using geographically weighted regression and spatial autocorrelation analysis, we systematically explore the spatiotemporal effects and mechanisms of multi-dimensional urban morphology characteristics on regional thermal effects. We found the following points. (1) Built-up land patch density is significantly positively correlated with LST, with the urban heat island (UHI) effect spreading from core areas to the periphery; this corroborates the thermal environment differentiation features under the “multi-center, networked” spatial planning pattern of the GBA. (2) Outlying expansion mitigates local LST rise through an ecological isolation effect, and infill expansion significantly exacerbates the UHI effect due to high-intensity development, reflecting the differentiated impacts of various expansion patterns on the thermal environment. (3) LCZ spatial distribution aligns closely with regional planning, with the solar radiation shading effect of high-rise buildings significantly cooling daytime LSTs, whereas the thermal storage properties of traditional building materials and human heat sources cause nighttime LST increases; this reveals the deep influence of urban morphology mechanisms, building materials, and human activities on thermal environments. The findings provide scientific support for achieving a win–win goal of high-quality development and ecological security in the GBA while also offering a theoretical basis and practical insights for thermal environment regulation in high-density urban clusters worldwide.

1. Introduction

Global urbanization levels are steadily increasing, with the expansion of urban land use exerting a growing influence on ecological systems and regional climates. Notably, the pattern of urban expansion significantly shapes the spatiotemporal dynamics of land surface temperature (LST), emerging as a critical research focus in urban planning, land management, and environmental studies [1]. LST is a key metric for evaluating urban thermal impacts, and its variability—driven by urban expansion patterns—has cascading effects on regional ecological stability, energy consumption, and residents’ quality of life and well-being [2,3]. In the context of global warming, extreme heat events are becoming more frequent, amplifying the urban heat island (UHI) effect due to the accumulation and release of heat in urban areas. As the primary arena of human activity, cities are poised to play an increasingly vital role in climate adaptation and mitigation. Consequently, the study of sustainable, low-energy urban forms has emerged as a focal point in the disciplines of ecology, urban planning, architecture, and environmental science.
Urban morphology is widely regarded as a primary determinant of LST [4,5]. It can be categorized into two-dimensional (2D) and three-dimensional (3D) variations [6,7,8]. On the one hand, rapid urbanization drives the encroachment of urban construction land into ecological spaces such as forests and grasslands, continuously reshaping the planar spatial patterns of various land uses [9,10]. Urban land use’s landscape configuration and structure are closely tied to urban heat transfer and ventilation effects, and optimizing their layout can mitigate the surface urban heat island (SUHI). Most related studies describe urban morphology through metrics such as landscape pattern indices, building forms, and surface parameters, exploring its influence on the UHI effect from 2D or 3D perspectives. For instance, some studies utilize landscape pattern indices to examine the relationship between land use changes and LST [11,12], revealing a significant correlation between LPI and LST. However, variations in urban geographic location, climatic conditions, and spatial morphology may yield differing outcomes [13]. Certain studies suggest that the impact of urban spatial morphology on LST is not always linear, being modulated by geographic context and seasonal factors [14,15]. Other research focuses on the evolutionary patterns of urban expansion, examining how growth morphologies—such as edge expansion or enclave types—affect regional thermal dynamics [16,17]. The findings generally indicate that more compact urban growth tends to elevate LST, though such effects often exhibit spatial heterogeneity across different scales [18].
On the other hand, constraints on land resources have led to a persistent increase in high-density, high-intensity building forms within cities. These changes in 3D morphological characteristics directly influence local climate, ventilation efficiency, and pollutant dispersion while being closely linked to human thermal comfort [19]. With advancements in remote sensing technology and 3D urban modeling tools, researchers have increasingly focused on the mechanisms by which 3D morphological features—such as building density, floor area ratio (FAR), and sky view factor (SVF)—affect LST. In 2012, Stewart and Oke introduced the concept of local climate zones (LCZs), which integrates various 3D features to classify urban spatial morphology, establishing a standardized framework that connects 3D urban unit types with LST [20]. After that, numerous studies have evaluated the relationship between LCZ and LST in major cities, primarily exploring seasonal variations, geographic differences, and spatial correlations [21,22]. Overall, LCZ has become a widely adopted tool for representing 3D urban morphology and elucidating its relationship with the thermal environment [23].
Although numerous studies have thoroughly explored the relationship between urban morphology and LST, a single-dimension urban morphology index often struggles to comprehensively depict the intricate interplay between urban form and the thermal environment. This limitation arises because LST variations are typically influenced by a composite of multiple urban morphological features [24]. Compared to 2D urban morphology characteristics, 3D features appear to exert a more pronounced impact on the urban thermal environment [25]. However, existing research on the relationship between urban morphology and thermal conditions reveals clear scalar limitations. Regarding 2D morphological indicators, most studies rely on remote sensing satellite imagery for urban surface classification, which struggles to accurately capture vertical urban morphological information, leading to an incomplete quantification of urban spatial form. Regarding 3D morphology indicators, existing research predominantly focuses on microscopic-scale architectural characteristics, such as building height, density, and floor area ratio, while often neglecting macro-scale urban spatial structure, including land use types, spatial texture, and spatial organization patterns. This fragmentation between micro- and macro-scale analyses makes it challenging to systematically and comprehensively reveal the intrinsic relationship between urban expansion patterns and the thermal environment. Therefore, establishing a multi-dimensional morphological index system that integrates macro-scale spatial structure and micro-scale architectural form is of great practical significance for optimizing urban spatial structures and formulating effective strategies for urban thermal environment regulation. Furthermore, previous studies have rarely incorporated spatial modes of land development—such as infilling, edge, and outlying expansion—into morphological–thermal research, despite their direct implications for surface energy balance and thermal heterogeneity. Additionally, the majority of studies emphasize daytime LST responses while largely neglecting nighttime conditions, which are critical for evaluating public health risks due to reduced nocturnal cooling. These gaps are particularly pronounced in coastal urban agglomerations, where rapid urbanization, morphological complexity, and ecological sensitivity converge.
To address these limitations and advance the understanding of morphology–temperature interactions, this study takes the Guangdong–Hong Kong–Macao Greater Bay Area (GBA) as the focal case. As one of the most economically dynamic urban agglomerations globally, the Guangdong–Hong Kong–Macao Greater Bay Area (GBA) is characterized by intense and dense spatial expansion. This dynamic growth significantly impacts the spatiotemporal differentiation of the regional thermal environment, positioning the GBA as an exemplary case for exploring the interaction mechanisms between urban morphology and LST. In addition, as a strategically significant region in China’s recent development agenda, the GBA’s spatial planning framework places strong emphasis on ecological conservation and sustainable development. Examining the impact of GBA’s urban morphology on the thermal environment provides a scientific foundation and decision-making support for optimizing regional ecological security patterns and promoting high-quality development. The research findings on the GBA can also offer theoretical frameworks and practical insights for other rapidly urbanizing regions [26,27]. Based on this, our study innovatively constructs a multi-dimensional urban morphology analysis framework (Figure 1). At the 2D level, the study employs landscape pattern indices and urban expansion typologies to analyze the spatial morphology of the GBA urban cluster and its correlation with LST. At the 3D level, a local climate zone (LCZ) spatial map was generated through crowdsourced data training, allowing for an in-depth exploration of the impact of 3D urban spatial morphology on the urban thermal environment. Based on this, our study innovatively constructs a multi-dimensional urban morphology analysis framework (Figure 1). At the 2D level, the study employs landscape pattern indices and urban expansion typologies to analyze the spatial morphology of the GBA urban cluster and its correlation with LST. At the 3D level, a local climate zone (LCZ) spatial map was generated through crowdsourced data training, allowing for an in-depth exploration of the impact of 3D urban spatial morphology on the urban thermal environment. Therefore, this study distinguishes itself by integrating both 2D and 3D urban morphological indicators within a unified analytical framework, while simultaneously incorporating urban expansion typologies and diurnal thermal dynamics. In doing so, it addresses the limitations of previous studies that often-examined morphology–LST relationships from a single-dimensional or static perspective.
This study aims to comprehensively integrate 2D and 3D urban morphology to systematically examine how urban morphology characteristics influence LST variations across the GBA urban cluster. The specific research objectives are as follows:
  • To quantify and analyze the landscape pattern characteristics and urban expansion typologies of the GBA from 2000 to 2020, identifying the spatial distribution patterns of 2D urban morphology;
  • To construct a 3D urban morphology database for the GBA based on the LCZ classification system, providing a detailed characterization of 3D urban morphology in the region;
  • To explore the differential impacts of 2D and 3D urban morphology on LST, uncovering the multi-dimensional relationship between urban morphology and the thermal environment.

2. Materials and Methods

2.1. Study Area

The Guangdong–Hong Kong–Macao Greater Bay Area (GBA) (21°34′–24°24′ N; 111°21′–115°24′ E) consists of the Hong Kong Special Administrative Region, the Macao Special Administrative Region, and nine cities in Guangdong Province, namely Guangzhou, Shenzhen, Zhuhai, Foshan, Huizhou, Dongguan, Zhongshan, Jiangmen, and Zhaoqing. The region is characterized by a subtropical monsoon climate, with an annual average LST of 23.3 °C and an annual precipitation ranging from 1600 to 2000 mm. As a world-class bay area that integrates land and sea while harmonizing natural and urban landscapes, the GBA covers a total land area of approximately 57,000 km2 and had a total population exceeding 86.17 million in 2020 (Figure 2). As one of China’s three major urban clusters, the GBA has undergone significant urban expansion over the past two decades. This expansion is not only reflected in the large-scale growth of built-up land but also in intensified population agglomeration and increased anthropogenic heat emissions, exerting profound impacts on both the regional climate and ecological environment [28,29]. Under global climate change, the GBA is expected to face dual pressures of rapid urbanization and climate change in the coming decades, posing significant challenges to the sustainable development of the urban cluster [29,30]. Between 2006 and 2015, the risk of death in Hong Kong significantly increased during extreme weather events, such as “very hot days” (maximum LST ≥ 33 °C) and “hot nights” (minimum LST ≥ 28 °C) [31]. Therefore, investigating the multi-dimensional urban morphology characteristics of the GBA and their interactions with regional thermal effects is essential for formulating scientific strategies for urban thermal environment regulation and planning.

2.2. Data Source and Preprocessing

The land cover data used in this study are derived from the Global 30 m Land Cover Dataset (http://www.globallandcover.com (accessed on 15 December 2024)), from which land use/land cover (LULC) information within the GBA was extracted. Using a Geographic Information System (GIS) platform, the study area was spatially clipped and preprocessed to generate a land cover distribution map of the GBA, providing essential baseline data for subsequent analyses of urban morphology and the thermal environment. The LST data were obtained from the MOD11A2 V6 product provided by Google Earth Engine (GEE). This dataset includes daytime and nighttime LST and emissivity data at 1 km resolution for the summer season (July) in the GBA. The MOD11A2 product is derived from MOD11A1 and stores 8-day composite LST values, which represent the average LST under clear-sky conditions within this period. In this study, GEE was utilized for data preprocessing, including reprojection, spatial clipping, quality control, and unit conversion, ensuring consistency and accuracy for subsequent analyses.

2.3. Two-Dimensional and Three-Dimensional Urban Morphology Characteristics Analysis Methods

2.3.1. Analysis of 2D Urban Morphological Features

This section is based on daytime LST data and focuses on the relationship between urban morphology and the thermal environment. Compared to nighttime LST, daytime LST is more responsive to land surface thermal effects and urban form, providing a more direct representation of the impact of 2D urban morphological features on land surface temperature.
  • Land Use Landscape Pattern Indices
Considering the raster resolution of LST imagery and computational accuracy, a 500 m adaptive square moving window was ultimately selected after referencing relevant studies and conducting empirical tests. The Fragstats 4.2 software was used to perform a moving window analysis on the landscape types within the study area. Landscape pattern indices were extracted within each window for different land use types, including cropland, forest, grassland, water bodies, and built-up land. The selected indices (Table 1) include patch density (PD), aggregation index (AI), largest patch index (LPI), edge density (ED), and proportion of landscape (PLAND), which characterize spatial composition and configuration patterns [32,33] (Table 1). By using ArcGIS 10.8 software, the average LST for each moving window unit was calculated. A bivariate spatial autocorrelation analysis and a spatial autoregression model were applied to further examine the spatial relationship between landscape pattern indices and LST. These analyses quantitatively explore the influence of land use composition, aggregation degree, shape complexity, and fragmentation on the urban thermal environment, providing insights into the mechanisms by which different land cover types contribute to urban heat dynamics.
In the table, n i represents the number of patches of landscape type i, and A is the total area of the landscape; g i j refers to the number of similar adjacent pixels (grids) in landscape type i, and m a x ( g i j ) is the maximum number of similar adjacent pixels (grids) in landscape type i; e i k is the perimeter of the edge of patch k within patch i.
  • Quantitative analysis of land expansion Patterns
This study characterizes urban expansion patterns by examining the spatial relationship between newly added built-up land and existing built-up land using the landscape expansion index (LEI) [34]. The LEI was employed to quantify the spatial relationship between the two, categorizing new urban construction land into three expansion types: infilling expansion, edge expansion, and outlying expansion [35]. Infilling expansion occurs when newly developed land fills the gaps within existing built-up patches; in contrast, edge expansion refers to new urban land extending outward along the periphery of existing built-up land. Outlying expansion describes newly developed land that appears at a considerable distance from existing built-up land. To classify these expansion types, an 800 m buffer zone was established around the existing built-up land using ArcGIS based on the spatial characteristics of the study area. The LEI value was calculated by measuring the intersection area between the buffer zone and the built-up land from the previous period, yielding a final value range of 0 to 1. When LEI = 0, the expansion is classified as outlying expansion, indicating no overlap with the buffer zone. When 0 < LEI < 0.5, the expansion is categorized as edge expansion, representing partial overlap with the buffer zone. When 0.5 < LEI < 1, the expansion is identified as infilling expansion, indicating significant overlap with the buffer zone. This classification provides a systematic approach to analyzing the spatial dynamics of urban expansion and its implications for urban morphology and environmental impacts. The calculation formula is as follows:
L E I = A i n t A i .
In the formula, A i n t represents the area of overlap between the newly added built-up land and the built-up land from the starting year, and A i is the area of the buffer zone established around the built-up land from the starting year.
  • Bivariate spatial autocorrelation analysis
In this study, we used bivariate spatial autocorrelation analysis to quantify the spatial relationship between landscape pattern indices and LST, aiming to investigate the impact of different urban land use types and expansion patterns on regional LST. To achieve this, Moran’s I was utilized to assess the spatial dependence between landscape pattern indices and LST. The bivariate Moran’s I was calculated using the following formula:
Moran s   I = N W i = 1 N j = 1 N w i j ( X i X ¯ ) ( Y j Y ¯ ) i = 1 N ( X i X ¯ ) 2 j = 1 N ( Y j Y ¯ ) 2 .
In this equation, N is the number of spatial units, W is the sum of the spatial weight matrix values, w i j is the weight between spatial units i and j, X i and Y j are the values of landscape pattern indices or LEI and LST for spatial units i and j, respectively, and X ¯ and Y ¯ are their means.
By calculating Moran’s I, the spatial clustering of LST in the study area and its significance level can be quantitatively assessed. We used the local indicators of spatial association (LISA) method to identify the spatial heterogeneity of the thermal environment and to classify spatial units into four types of spatial associations: high–high (HH), low–low (LL), high–low (HL), and low–high (LH). This approach allows us to identify the spatial distribution patterns of high-LST and low-LST clusters and to analyze the spatial relationship between key landscape pattern features, land use expansion patterns, and the local urban heat island effect.

2.3.2. Analysis of 3D Urban Morphological Features

Local climate zone (LCZ) is a classic classification method for describing 3D urban morphological features. It divides the land surface into 17 categories based on different land cover conditions: 1 (compact high-rise), 2 (compact mid-rise), 3 (compact low-rise), 4 (open high-rise), 5 (open mid-rise), 6 (open low-rise), 7 (lightweight low-rise), 8 (large low-rise), 9 (sparsely built), 10 (heavy industry), A (dense trees), B (scattered trees), C (bush, scrub), D (low plants), E (bare rock or paved), F (bare soil or sand), and G (water). These categories effectively represent the three-dimensional characteristics of urban morphology. For specific definitions and descriptions of each category, please refer to the research by Demuzere et al. [36]. Each LCZ type exhibits similar roughness, albedo, and vegetation cover characteristics in remote sensing imagery. Therefore, by combining manual interpretation training and machine learning recognition, supervised classification can be performed on remote sensing images of the entire urban agglomeration to obtain the spatial distribution of urban LCZs. Currently, the LCZ Generator tool in the World Urban Database and Access Portal Tools (WUDAPTs) is a comprehensive method that integrates expert interpretation and crowdsourced training data. The tool accesses designated remote sensing data through the computing environment of Google Earth Engine and further maps the distribution of LCZs.
  • Delineation of Training Areas
First, using the basic training template file released by WUDAPTs, digitized training samples are delineated in Google Earth Pro. Through manual interpretation, the surface of the delineated polygonal areas is defined as categories 1, 2, 3, E, and G, and it is necessary to select as many samples as possible to ensure coverage of all categories. In this study, 3047 training samples were delineated, which could ensure more accurate identification of the spectral characteristics of various LCZ categories during supervised classification (Figure 3).
  • Supervised Classification
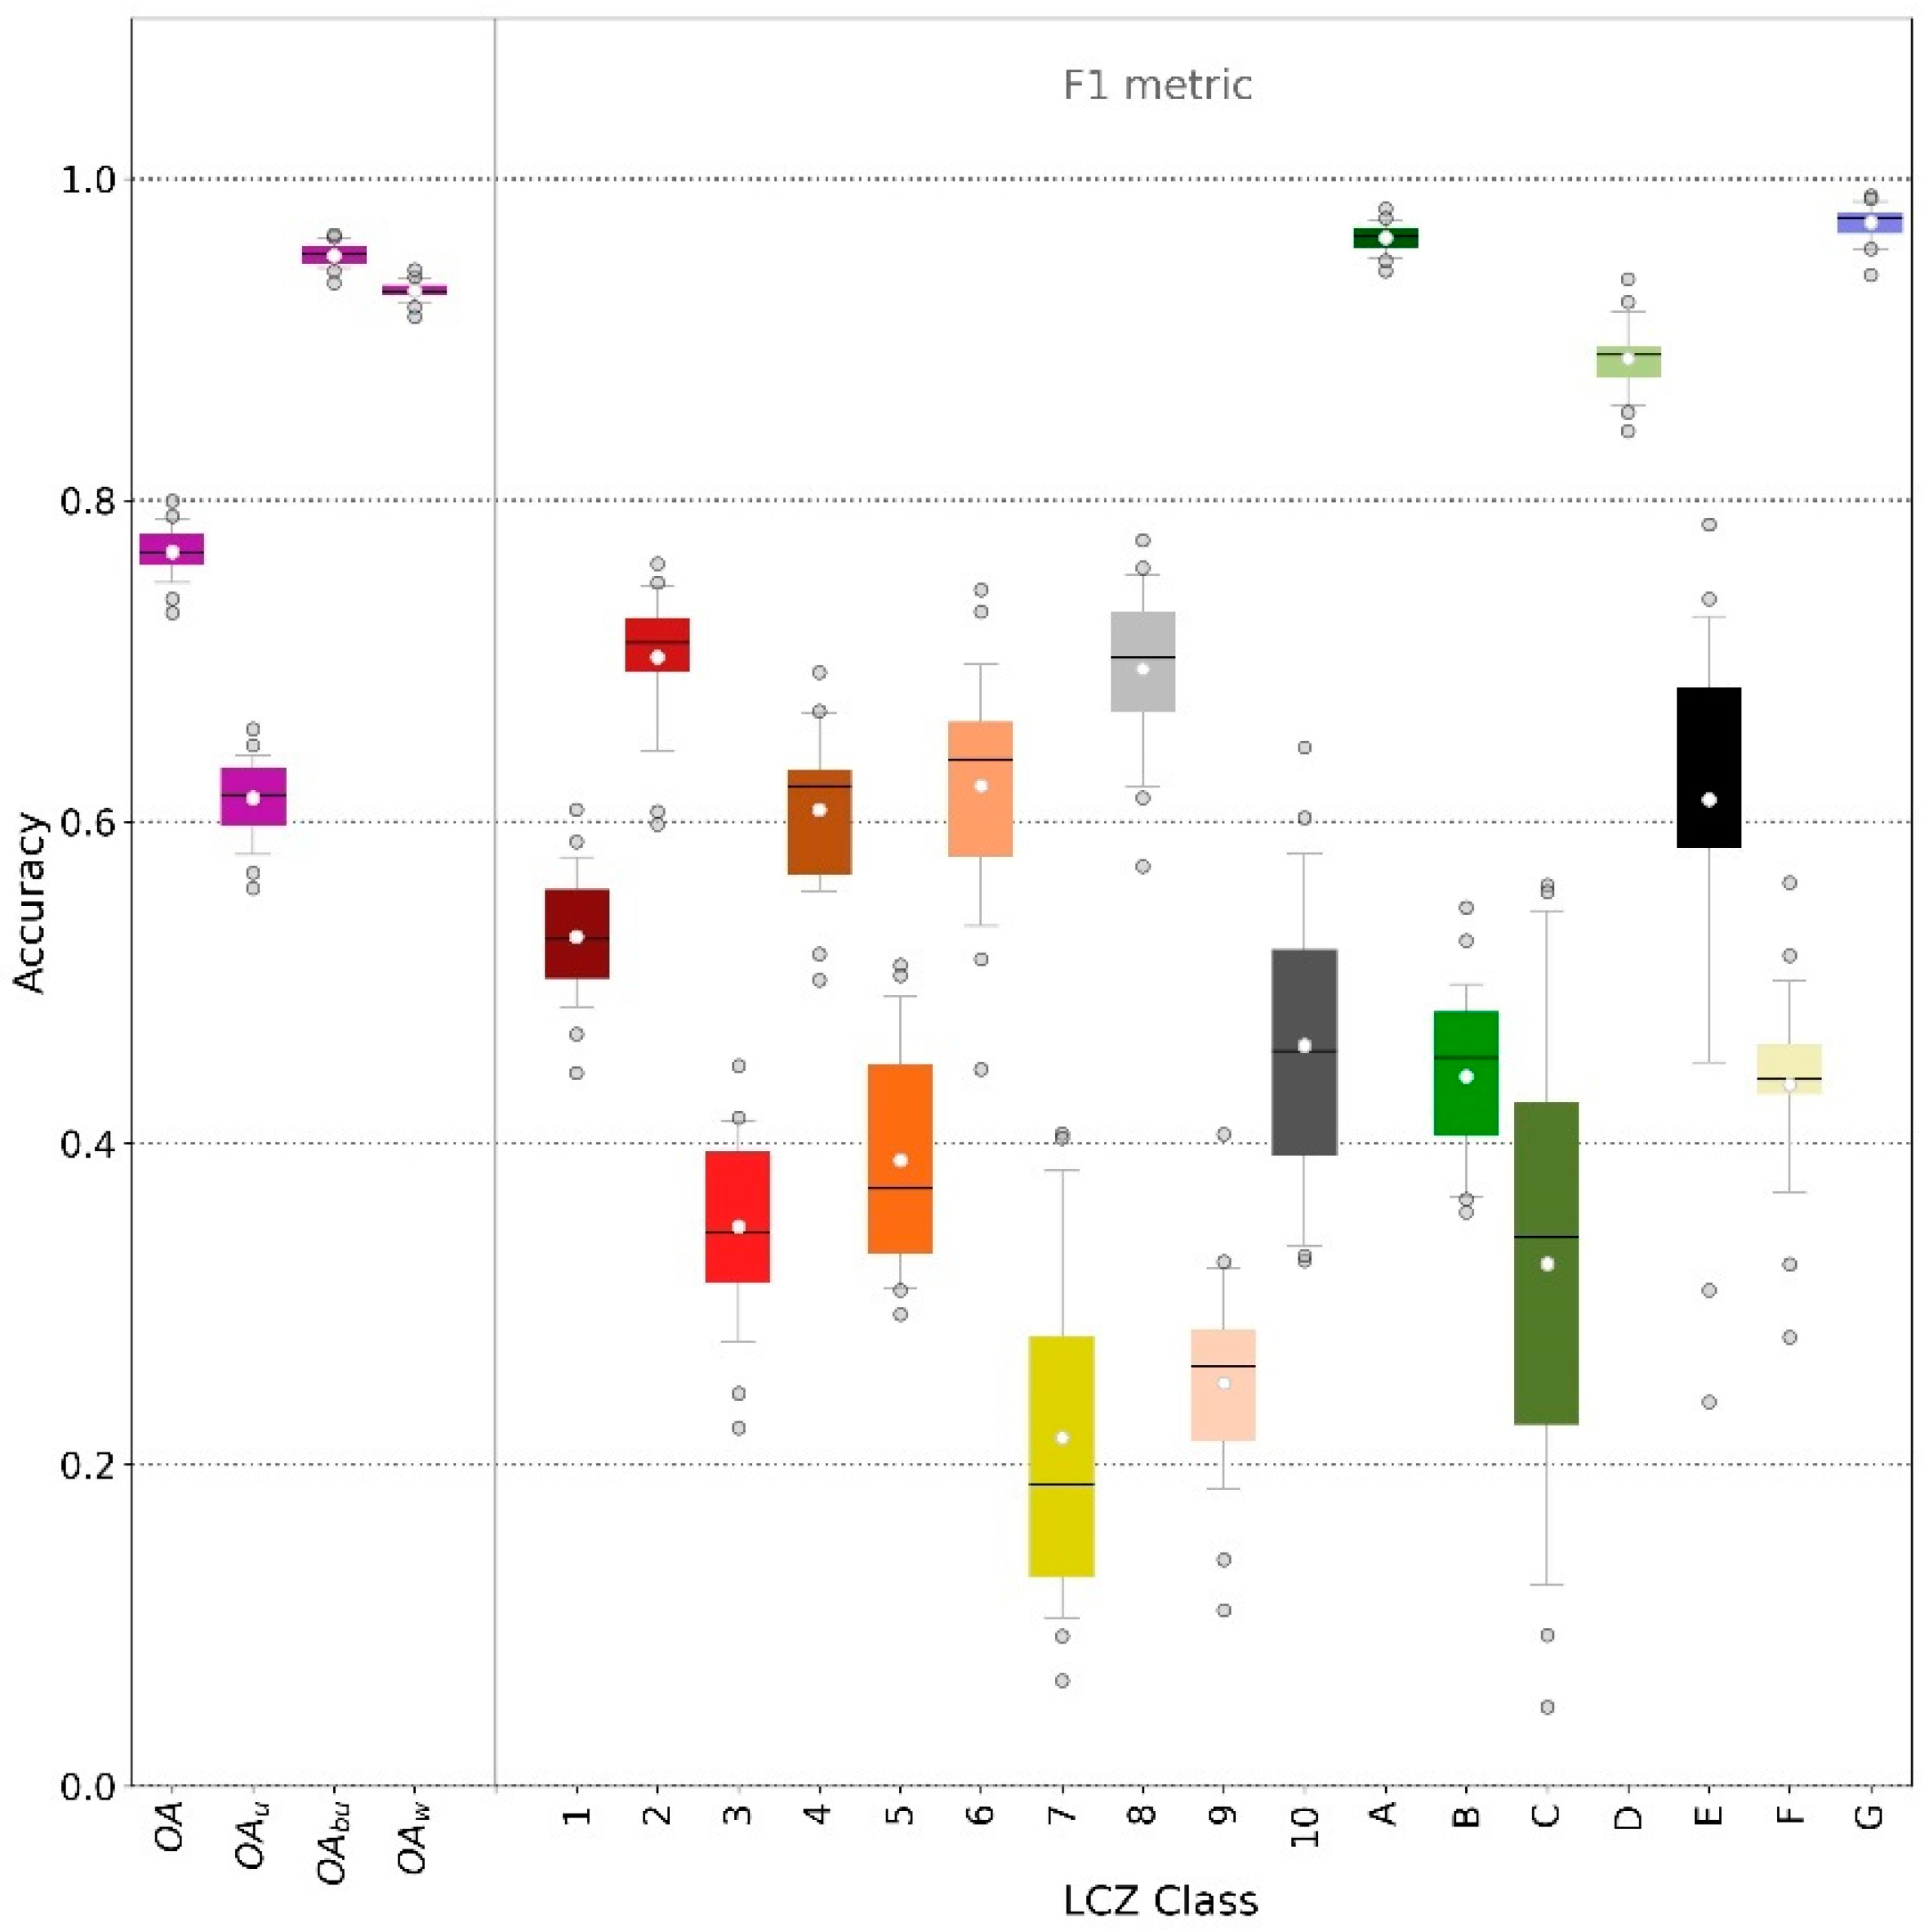
After completing the delineation of the training samples, the data were uploaded to the WUDAPTs official database. Based on multiple Landsat 8 remote sensing image tiles, a Random Forest classifier was employed to identify 41 input features. By comparing these with Earth observation data, the Random Forest algorithm can obtain LCZ classification raster maps [37].
  • Accuracy Assessment
The accuracy assessment of the study employs a confusion matrix calculation method, which can statistically analyze the matching relationship between the model’s predicted values and the true labels in the classification. First, random sampling is conducted using the default automatic WUDAPTs cross-validation procedure outlined by Bechtel et al. [38], where 10 pixels are randomly sampled from each TA (totaling 132,160 pixels). From the generated TA pixel pool, stratified (by LCZ type) random sampling is performed, selecting 50% as the training set and the remaining 50% as the test set, with the process repeated 25 times. The accuracy metrics include the following four types: overall accuracy (OA), overall accuracy of urban LCZ classes only (OAu), overall accuracy of built and natural LCZ classes only (OAbu), weighted accuracy (OAw), and class-level metric F1.
Overall accuracy (OA) measures the proportion of correctly classified samples across all samples, calculated by the formula
O A = i = 1 n T P i N ,
where TPi represents the true positives of the i-th class (the number of correctly classified samples), and N represents the total number of samples.
The overall accuracy for urban LCZ classes (OAu) metric considers only the LCZ classes related to urban construction (e.g., buildings, roads, etc.), excluding natural land surfaces. The overall accuracy for built and natural LCZ classes (OAbu) is used to evaluate the classification performance of built elements (e.g., buildings) and natural elements (e.g., forests and water bodies), typically analyzing a subset of all categories. The formulas for these two metrics are as follows:
O A u = i U T P i i U N i ;
O A b u = i B N T P i i B N N i ,
where U represents the set of urban LCZ classes, and Ni represents the total number of samples for the i-th class (urban class). B∪N represents the union of built and natural classes.
The weighted accuracy (OAw) metric takes into account the differences in sample sizes across categories and balances the impact of class imbalance through a weighted average. Its calculation formula is as follows:
O A w = i = 1 n w i T P i N i ,
where wi is the weight of the i-th class, typically related to sample proportion or importance (e.g., w i = N i /N).
The class-wise F1 score is the harmonic mean of precision and recall and is used to evaluate the classification performance of each category. In this study, producer accuracy (PAi) represents precision, indicating the percentage of correctly classified pixels for category i; user accuracy (UAi) represents recall, indicating the percentage of pixels classified as category i that actually belong to category i. The calculation formula is as follows:
F 1 i = 2 × U A i × P A i U A i + P A i ;
P A i = T P i T P i + F P i ;
U A i = T P i T P i + F N i ,
where TPi represents the true positives of the i-th class, FPi represents the false positives (the number of samples incorrectly predicted as the i-th class), and FNi represents the false negatives (the number of samples of the i-th class incorrectly predicted as other classes). When UA and PA are equal, the F1 score reaches its maximum value of 1; if either is 0, the F1 score becomes 0.

2.4. Correlation and Spatial Clustering Analysis

This study combines Pearson’s correlation coefficient with LISA to quantitatively analyze the spatial association between 2D urban expansion morphology indicators and LST. Due to the stronger daytime expression of surface structural characteristics, only daytime LST was analyzed in relation to certain 2D morphological indicators. However, both daytime and nighttime LST were considered in the analysis of land expansion patterns to account for potential diurnal variations in thermal behavior.
First, we calculate the Pearson correlation coefficient at the scale of spatial units to evaluate the direct impact of different landscape pattern indices and urban morphology characteristics on LST, thereby identifying key morphology types that either exacerbate or mitigate the urban heat island effect. Second, by using the GEODA 1.14 software platform, we apply bivariate LISA clustering analysis to compute the local Moran’s I to reveal the spatial dependence between 2D urban expansion morphology and LST, as well as their local clustering characteristics. The calculation formula is as follows:
I x y = i j w i j ( X i X ¯ ) ( Y j Y ¯ ) i ( X i X ¯ ) 2 .
In this equation, X i is the value of the landscape pattern index or land use expansion type at the location of cell i, and Y j is the value of LST at the location of cell j. X   ¯ and Y ¯ are the means of the landscape pattern index and LSTs across all cells, respectively. w i j is the spatial weight matrix, indicating the adjacency relationship between cell i and cell j.

2.5. Intergroup Difference Analysis

Due to the influence of factors such as the specific heat capacity and color of surface materials, the temperature of different land surface types (e.g., building roofs, vegetation, water bodies, soil, etc.) tends to exhibit a skewed distribution. The Kruskal–Wallis test, a non-parametric statistical method, is employed to compare differences in medians among a large number of independent samples. Its core principle involves pooling and ranking all data in ascending order, assigning ranks (with tied values receiving average ranks), and assessing whether significant differences exist between groups by comparing the sum of ranks for each group. This method is suitable for the continuous variables obtained in this study and provides a robust approach to detecting LST differences between LCZ groups.
First, random raster sampling is performed on the LST data of different LCZs. Then, the data from all groups are combined and sorted in ascending order, with ranks assigned (average ranks are used for tied values). Subsequently, the sum of ranks (Rj) for each group is calculated. Finally, the core statistic of the test, the H value (H statistic), is computed using the following formula:
H = 12 N ( N + 1 ) j = 1 k R j 2 n j 3 ( N + 1 ) ,
where N represents the total sample size, k represents the number of groups, and nj represents the sample size of the j-th group.
The H value is compared with the chi-square distribution (χ2 distribution) (with k−1 degrees of freedom). If p < 0.05, it indicates that the intergroup differences are statistically significant. If the test result is significant, post hoc multiple comparisons are required. Dunn’s test can effectively assist in identifying the specific sources of differences. The calculation formula is as follows:
z i j = R i R j N ( N + 1 ) 12 ( 1 n i + 1 n j )
where ni and nj represent the sample sizes of the i-th and j-th groups, respectively. The sources of significance in multiple group comparisons can be identified by calculating the Z-statistic for each pair of groups and comparing it with the standard normal distribution.

3. Results

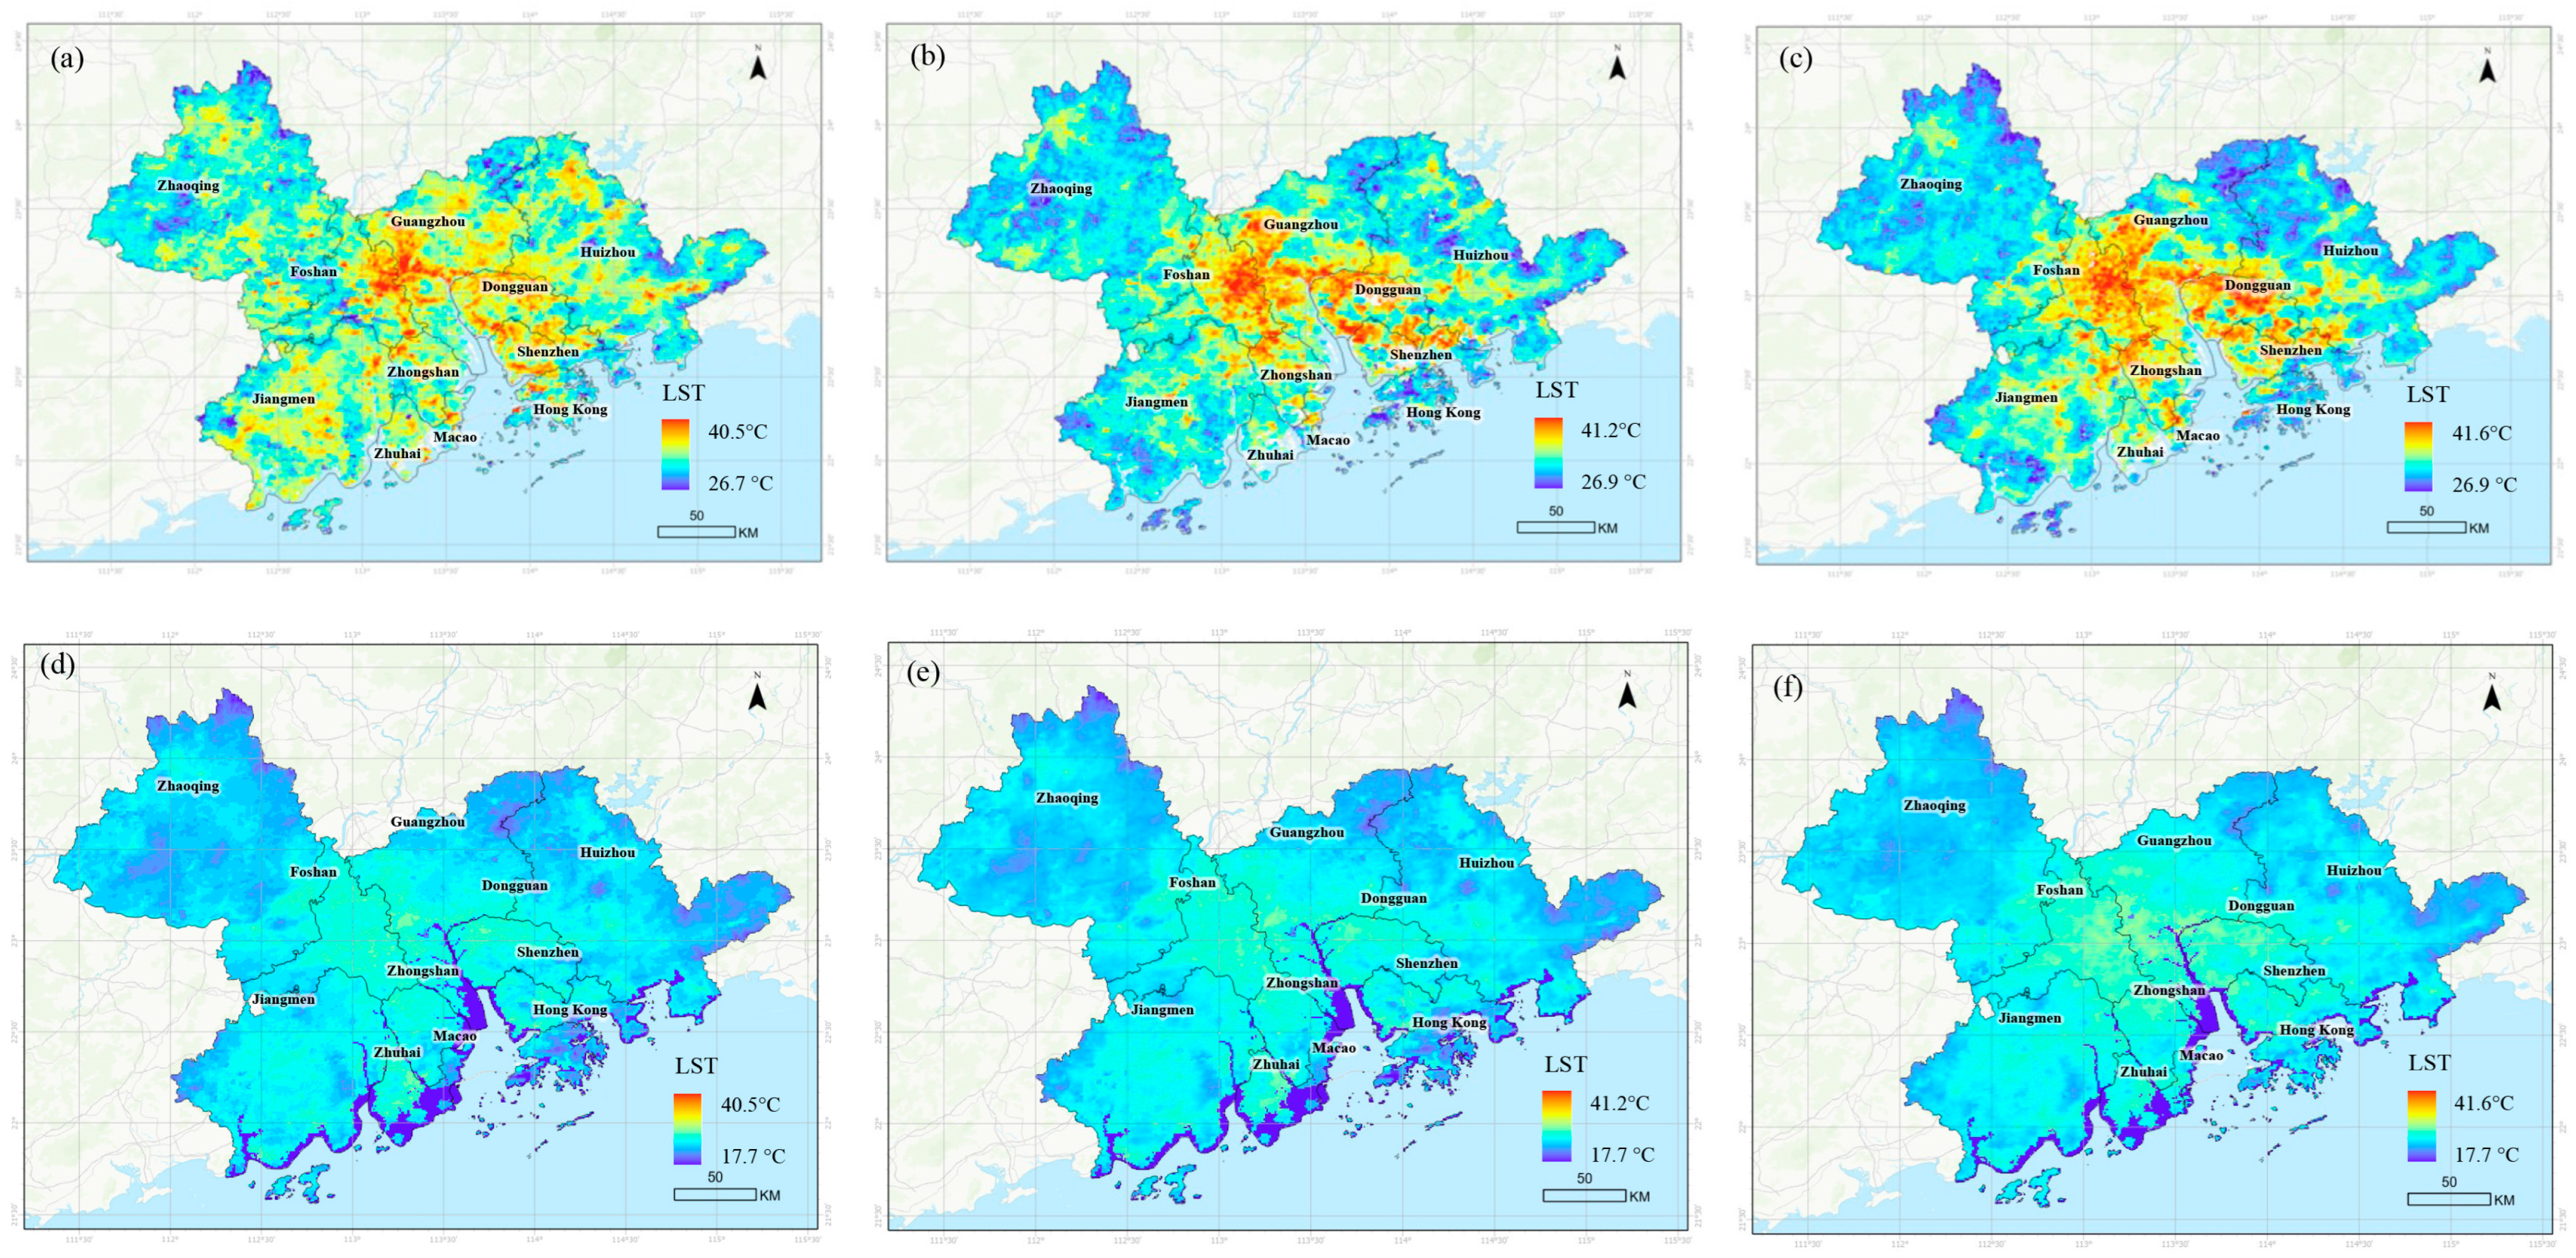
3.1. Spatiotemporal Evolution Characteristics of LST

According to the LST inversion results (Figure 4), the GBA exhibits a significant central-peripheral LST differentiation. The core areas have notably higher LST than the peripheral regions, forming a typical SHUI pattern. The high-LST clusters are primarily located in the central areas of cities such as Guangzhou, Shenzhen, and Zhuhai, which are characterized by high-intensity urban development, including high-density built environments, compact spatial forms, and complex transportation networks. In contrast, the low-LST areas are mainly concentrated in regions with superior ecological foundations, such as Zhaoqing, Huizhou, and Jiangmen, where extensive forest cover and proximity to the coastline exert a significant cooling effect on the local climate.
From a temporal perspective, between 2000 and 2020, the high-LST zones in the GBA have shown a trend of spatial expansion. This expansion is most pronounced in the core cities of Guangzhou, Foshan, Dongguan, and Shenzhen, with the spread following major transportation corridors in a radial pattern. This high-LST expansion process has been accompanied by significant land use changes, particularly the continuous encroachment of built-up land into natural ecological spaces. Taking Foshan as an example, its typical water network base has undergone substantial changes, with many ponds, tidal flats, and other water bodies being converted into urban land. Notably, large, contiguous agricultural water bodies, such as fish ponds and crab pools, have been replaced by urban development land. The scattered layout of urban land further contributed to the spatial spread of the heat island effect. During the study period, the daytime LST peak in the GBA continued to rise, reaching a maximum of 41.6 °C in 2020, particularly in highly built-up areas such as Guangzhou and Foshan. A more indicative metric is the spatial extent of high LST areas. Based on the 90th percentile of nighttime LST, we found that the proportion of the GBA exceeding this threshold increased from 18.2% in 2000 to 36.7% in 2020. This near doubling of high-LST coverage indicates a substantial intensification of nocturnal heat exposure, which is more closely associated with public health risks due to reduced nighttime cooling. This LST increase shows a significant spatial coupling with the region’s rapid urbanization process, reflecting the substantial impact of urban expansion on the regional thermal environment.

3.2. Spatial Correlation Between 2D Urban Morphology and LST

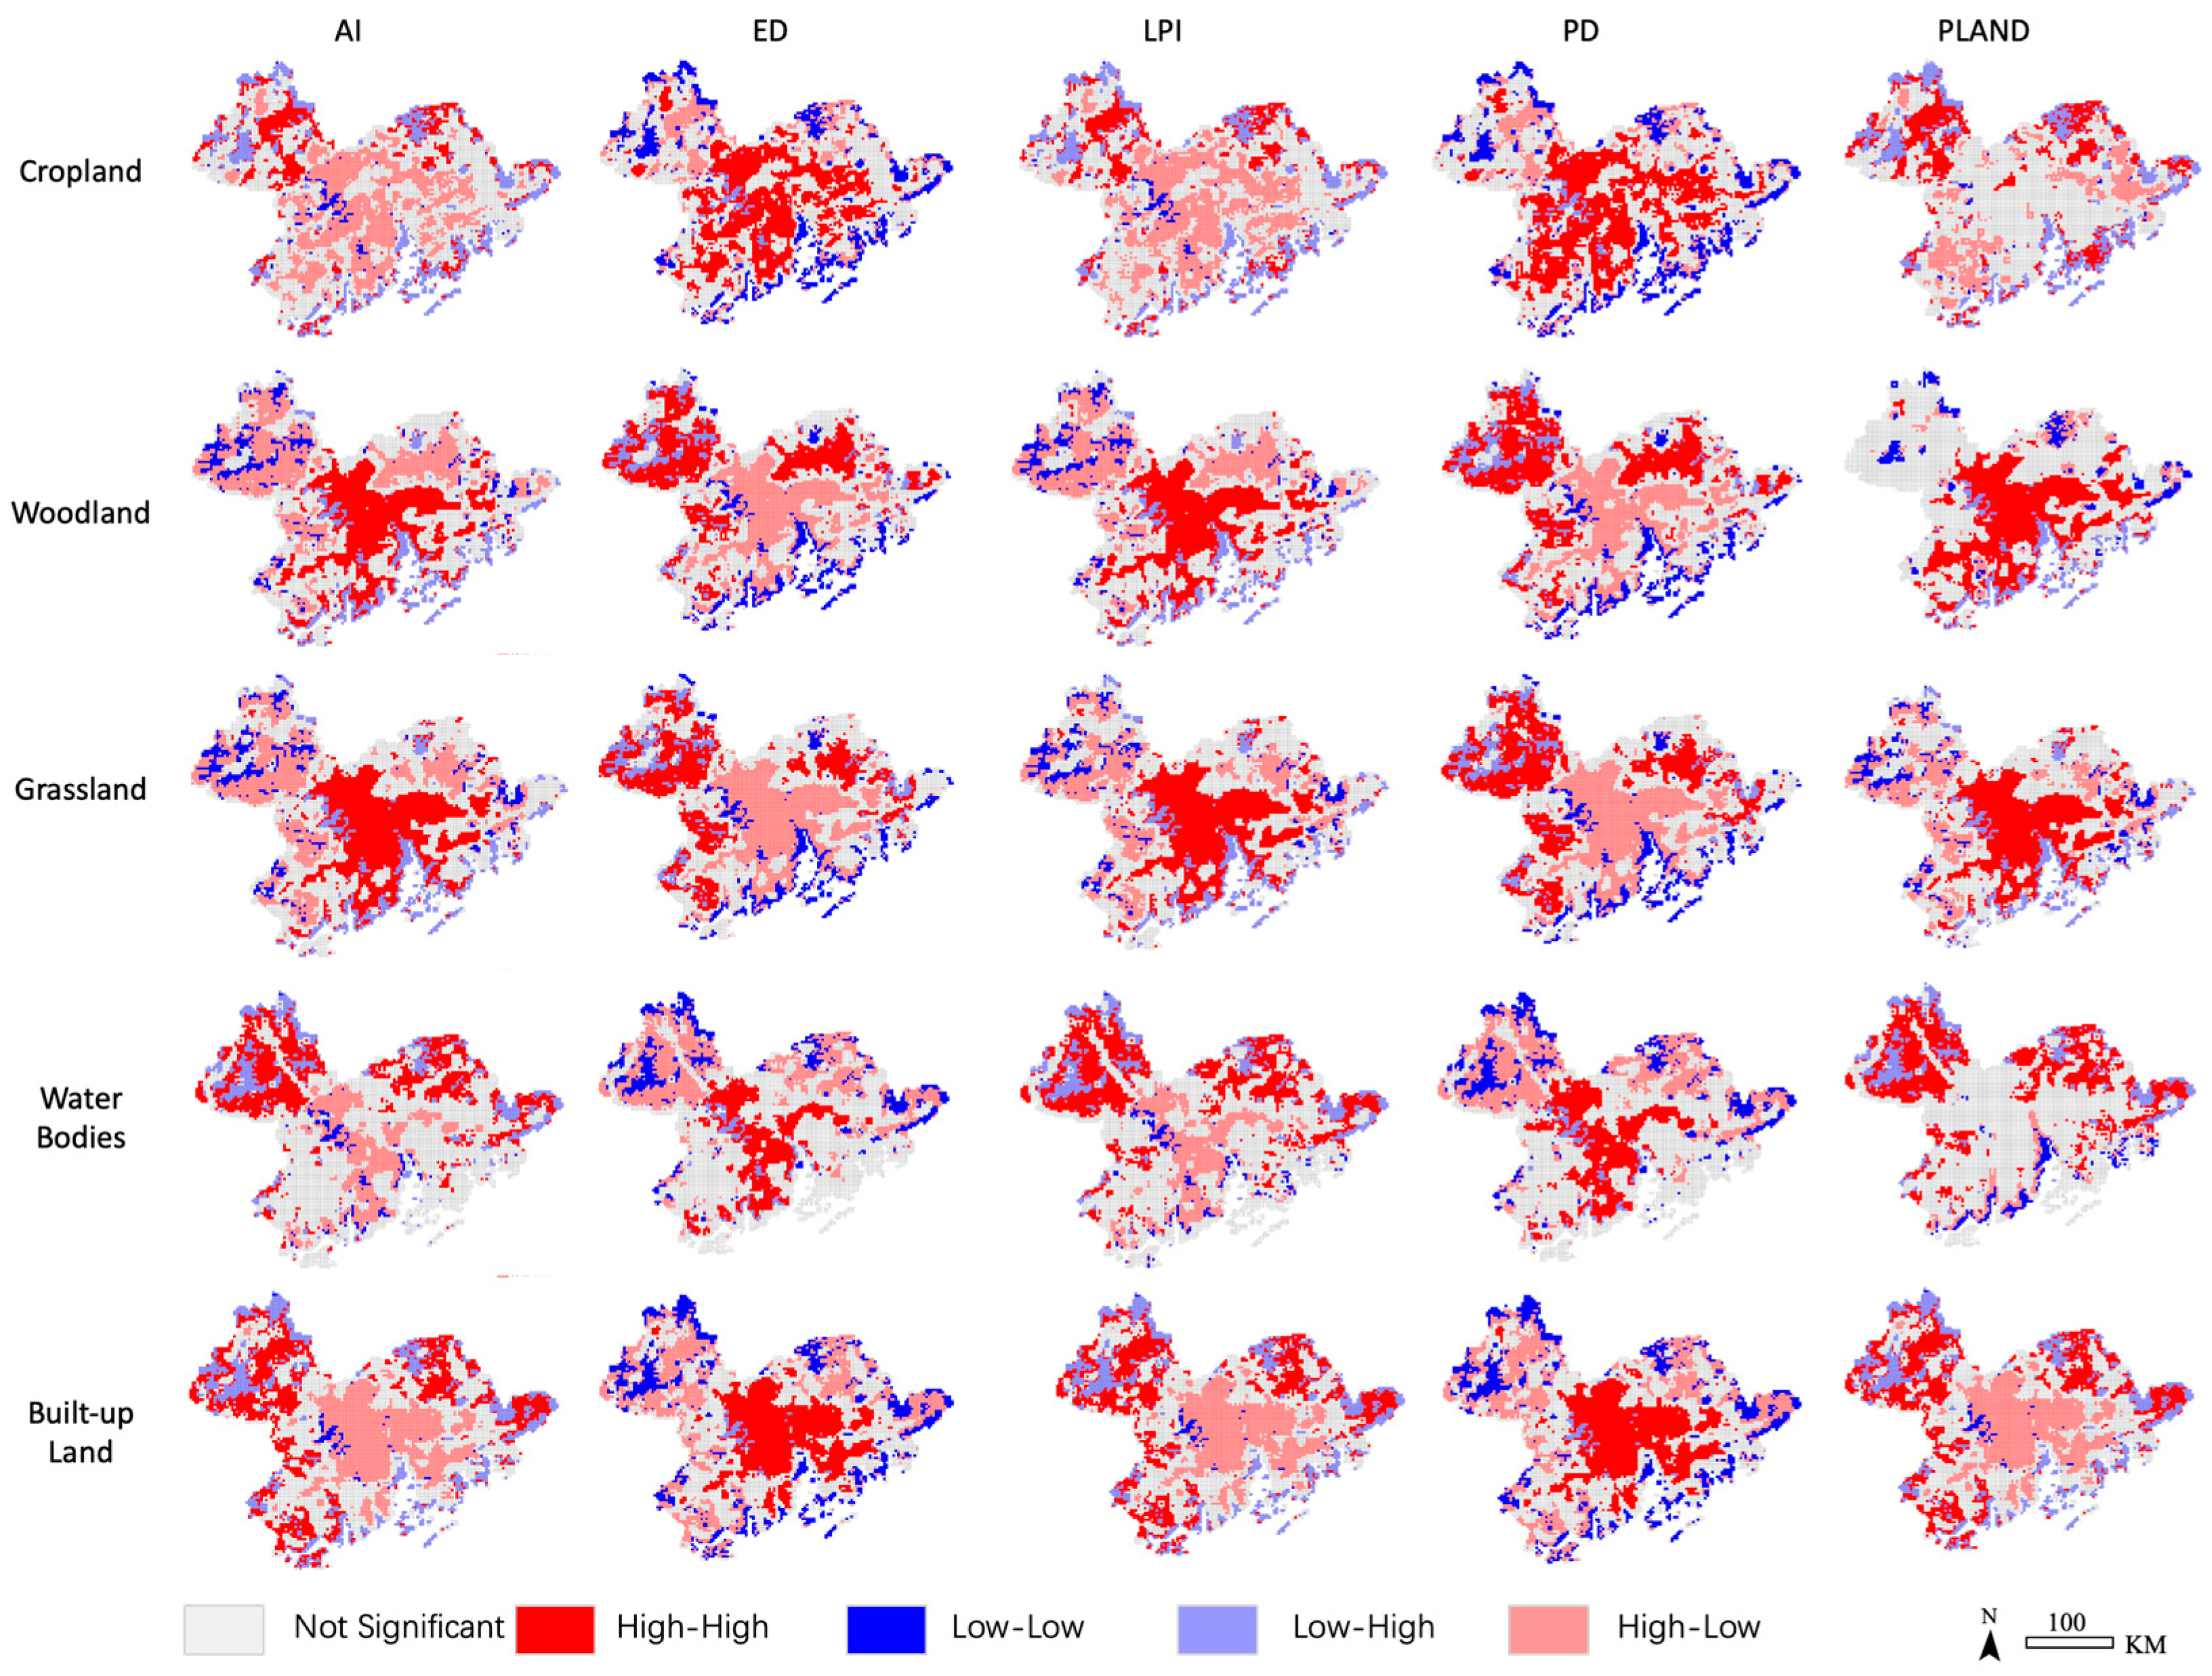
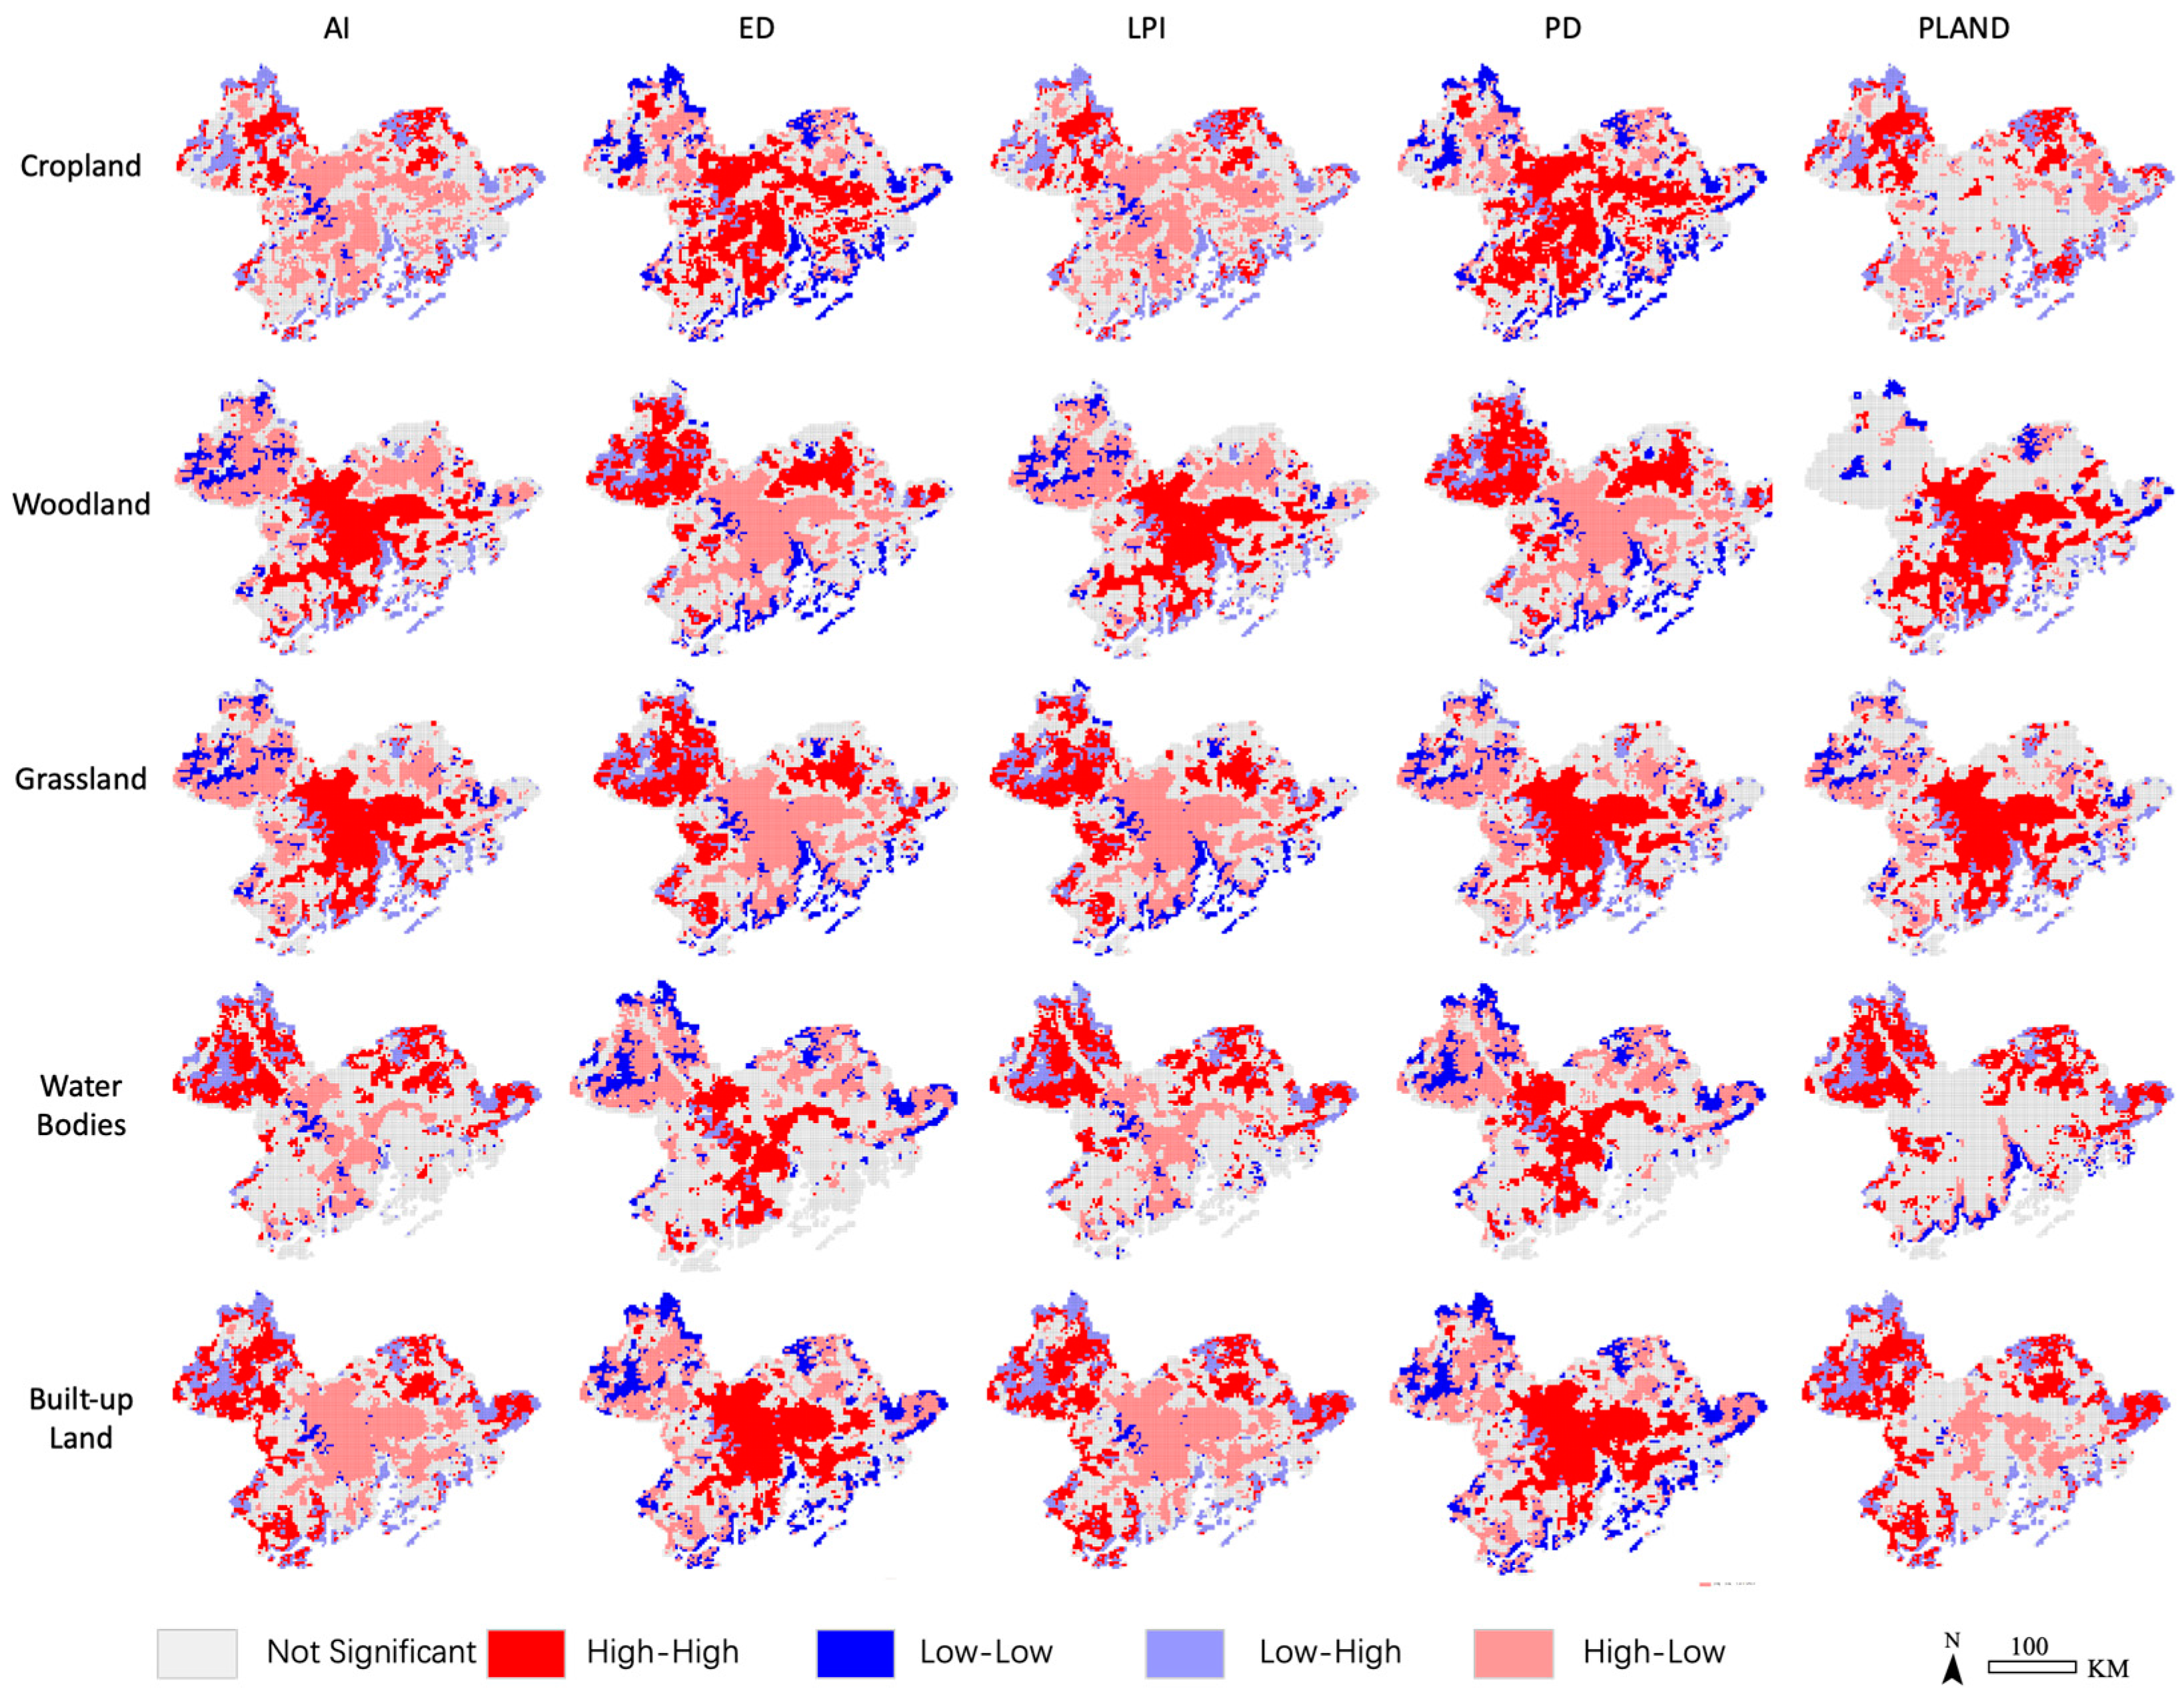
3.2.1. Cluster Analysis of Land Use Landscape Pattern and Its Correlation with LST

The correlation analysis results between the landscape pattern indices in 2000 and LST are shown in Figure 5. In 2000, Urbanized area_PD (1.001), Water bodies_PD (0.967), Cropland_PD (0.770), Grassland_PD (0.767), and Woodland_PD (0.359) all showed a significant positive correlation with LST; this indicates a strong positive relationship between the fragmentation of urban land and LST, suggesting that the fragmentation of urban expansion could exacerbate the UHI effect. Further analysis using Moran’s I confirmed that the PD of all land types exhibited high spatial autocorrelation, indicating that high-density patches are spatially clustered (Table 2). The LPI for all land types positively correlated with LST, suggesting that large land patches failed to produce the expected cooling effect. Based on Moran’s I, it can be inferred that in 2000, large land patches exhibited a dispersed distribution pattern and could not form an effective LST regulation function. Notably, Cropland_AI (1.621) exhibited a significant positive correlation with LST, possibly due to the high aggregation of farmland, where exposed soil has a strong heat absorption capacity, leading to localized LST increases. In contrast, Water bodies_AI (−0.221) showed a negative correlation with LST, indicating that a high aggregation of water bodies patches has a notable cooling effect. However, the dispersed spatial distribution of large contiguous water bodies limits the overall cooling effect.
The correlation analysis results between the landscape pattern indices in 2010 and LST are shown in Figure 6. Similarly to the situation in 2000, the patch density (PD) for all land use types showed a significant positive correlation with LST, indicating that an increase in patch density intensifies the regional thermal environment. High-density land patches, again, exhibited a high-LST clustering characteristic (Table 3). Notably, Water bodies_PD exhibited the highest correlation, suggesting that the fragmentation of water bodies may significantly reduce their cooling capacity. The LPI of woodland (0.323), water bodies (0.175), and urbanized area (0.338) showed a positive correlation with LST, though the correlations were relatively weak, indicating that large land patches have limited cooling effects. The ED of woodland (−0.147), water bodies (−0.097), and urbanized area (−0.119) exhibited a negative correlation with LST, suggesting that complex land patch boundaries contribute to cooling. In contrast, the ED of cropland (0.143) showed a positive correlation, indicating that fragmented cropland is more prone to heat accumulation. The AI of cropland (0.395), woodland (1.621), and urbanized area (2.026) showed a significant positive correlation with LST, indicating that contiguous land patches may contribute to a warming effect. On the other hand, Water bodies_AI was negatively correlated with LST, suggesting that a high aggregation of water bodies patches enhances cooling effects. PLAND showed a high positive correlation with LST only in built-up areas (2.739), indicating that urban land expansion is the primary driver of regional LST increases. In summary, the relationship between urbanized areas and LST is the most significant, with PLAND, AI, and LPI all showing a significant positive correlation with LST; in contrast, ED negatively correlates with LST, indicating that the increased boundary complexity of built-up areas helps mitigate the heat effect. The cooling effect of water bodies is significant, and their spatial layout and scale play a crucial role in LST regulation: a high aggregation of water bodies patches significantly mitigates the urban heat. In contrast, fragmented water bodies patches weaken local climate regulation functions. However, the cooling efficacy of water bodies may be influenced by water temperature, particularly in small, shallow water bodies. Existing studies suggest that these water bodies can experience significant warming in summer, potentially reducing their ability to cool the surrounding environment [39]. Additionally, fragmented cropland also exhibits a notable warming effect. Additionally, fragmented cropland also exhibits a notable warming effect, though this may be partially offset in reality by irrigation-driven cooling, which could not be captured in this study due to data limitations. Contrary to intuitive expectations, we found that the LPI of woodland is positively correlated with LST, meaning that highly aggregated woodlands fail to significantly reduce LST. This phenomenon can likely be attributed to complex factors such as species composition, tree age structure, and canopy coverage, which influence the cooling capacity of woodlands [40,41].
The correlation analysis results between the landscape pattern indices in 2020 and LST are shown in Figure 7. Cropland_PD (0.929), Woodland_PD (0.770), Grassland_PD (0.614), Water bodies_PD (0.966), and Urbanized area_PD (0.657) all show a significant positive correlation with LST, indicating that land use fragmentation enhances the regional thermal environment. The PD of all land types still maintains a high level of spatial clustering (Table 4). Only Water bodies_LPI shows a significant negative correlation with LST, suggesting that large water bodies patches still have a significant local cooling effect. Cropland_ED (0.180) and Grassland_ED (0.500) show a significant positive correlation with LST, suggesting that an increase in the complexity of the boundaries of these land types may lead to a LST rise. This may be due to the exposed edges of these patches being subjected to stronger solar radiation, and the frequent human activities along the boundaries may also contribute to increased regional heat accumulation. In contrast, Water bodies_ED (−0.083) shows a negative correlation with LST, indicating that increasing the boundary complexity of water bodies helps enhance cooling effects. This can be attributed to the dense river networks and complex coastline forms in the GBA, where this unique land–sea interface significantly enhances the evaporative cooling. While evaporation primarily cools the near-surface air by removing heat through latent heat flux, its influence on land surface temperature (LST) reduction may be more indirect, potentially mediated by cooler air masses interacting with the surface or increased moisture moderating heat retention [42]. This process positions the GBA’s water-rich infrastructure as a vital natural mechanism for mitigating the regional urban heat island effect.
Overall, the urban heat island effect of built-up areas continues to intensify, and the fragmentation of land patches has an increasingly significant impact on LST. This phenomenon is closely related to the unique urban expansion patterns of the GBA: dispersed expansion models, such as land reclamation and the construction of new industrial parks, have led to fragmented newly built-up areas, further exacerbating regional heat absorption effects. Although large water bodies patches still maintain significant cooling functions, the expansion of built-up land in regions such as the Pearl River Estuary and Shenzhen Bay has led to the fragmentation of water landscapes, significantly weakening their cooling effectiveness. At the same time, the increase in the edge complexity of grasslands reflects the lack of large-scale ecological green cores in the GBA. In core cities such as Shenzhen and Guangzhou, the restoration of green spaces during urban renewal has become fragmented and small in scale, with weakened landscape connectivity, which has become a key factor limiting the enhancement of cooling effects from green spaces.

3.2.2. Cluster Analysis Results of Land Use Expansion Patterns and LST

Between 2000 and 2020, the urban expansion pattern of the GBA shifted from a homogeneous outward development model to a primarily infill-based development model dominated by stock updates (Figure 8). This transition is closely tied to the implementation of regional urban renewal policies. From the perspective of spatial differentiation in expansion patterns, outlying expansion is characterized by the scattered or isolated distribution of built-up land, primarily located in suburban areas or policy-supported zones; this is often represented by emerging industrial parks and development zones. Zhaoqing and Zhuhai saw large-scale outlying expansion, with the former benefiting from abundant forest resources and ecological protection zones, whereas the latter is constrained by coastal geography. On the other hand, edge expansion is most evident in second- and third-tier cities such as Dongguan, Foshan, and Zhaoqing (Figure 8b), which have shown significant spatial outward growth during their recent urbanization processes. In contrast, infill expansion has become the dominant growth pattern in the core cities of the GBA, such as Guangzhou, Shenzhen, and Zhuhai, reflecting the inevitable trend of maximizing the efficiency of limited land resources through high-density development in existing urban spaces. The spatiotemporal differentiation characteristics of each expansion pattern collectively outline the multi-center, networked urban spatial structure of the GBA.
Further examination of the clustering analysis results between land use expansion patterns and LST (Figure 9) shows that outlying expansion is characterized by a dispersed distribution (Moran’s I = −0.028) and is negatively correlated with LST. This phenomenon may be related to the separation effect produced by outlying expansion, where ecological buffers or isolation zones help in alleviating local LST increases to some extent. In contrast, the edge expansion pattern does not show a significant spatial clustering effect (Figure 9), and its correlation with LST is weak. It can be speculated that edge expansion often relies on the extension of transportation infrastructure, and under the combined influence of low building density and high green space retention, LST fluctuations are not significantly apparent. Infilling expansion, however, shows a significant positive correlation with LST (Moran’s I = 0.416). This expansion model, which fills gaps between existing built-up land, increases the density of buildings and the proportion of impervious surfaces. Particularly in the core cities of the GBA, such as Shenzhen and Macau, infilling expansion often coincides with a reduction in urban green space, significantly intensifying the UHI effect. By contrast, the coupling relationship between nighttime land surface temperature (LST) and land use expansion patterns is generally weak, with no pronounced spatial clustering observed. Outlying expansion continues to exhibit a degree of spatial dispersion at night (Moran’s I = −0.044) and maintains a significant negative correlation with LST, suggesting that its isolation effect remains effective in forming a cold island during nighttime hours. However, the High-High clusters are primarily located in peripheral cities with relatively sound ecological foundations, such as Zhaoqing, Zhongshan, and Jiangmen. This indicates that favorable regional ecological conditions do not automatically confer nighttime cooling advantages to areas of outlying expansion. Without effective planning of ecological corridors during the expansion process, significant nighttime heat accumulation may still occur. Edge expansion displays an even weaker spatial clustering tendency (Moran’s I = −0.006), with no notable correlation to LST. Infilling expansion shows minimal clustering characteristics at night (Moran’s I = 0.011) and an extremely weak correlation with LST, implying that its daytime urban heat island effect is markedly reduced at night, likely moderated by thermal inertia and surface heat balance. Overall, the response of LST to land expansion patterns reveals distinct diurnal differences, highlighting the need for differentiated considerations in urban thermal environment management.

3.3. Spatial Correlation Between 3D Urban Morphology and LST

3.3.1. LCZ Classification Results

The LCZ spatial distribution map of the GBA (Figure 10) was obtained by extracting the training data from the GEOTIFF files, which were divided using the LCZ Generator in WUDAPTs. The map was generated after noise was removed and a unique value color mapping in ArcGIS Pro was reapplied. Following accuracy verification and calculation, the overall accuracy of the LCZ classification reached 76.4%, with OAu and OAbu—the core focus elements of this study—exceeding 85%. This level of accuracy can be considered satisfactory at the urban cluster scale (Figure 11).
From the perspective of the entire GBA, 14.89% of the land surface is built-up area, while 84.11% consists of non-built natural surfaces. Among these, LCZ A (dense trees) and LCZ D (low plants) are the dominant types, covering 69.24% of the area, while LCZ 7 (lightweight low-rise) and LCZ 9 (sparsely built) occupy very small proportions (0.08% and 0.06%, respectively). Within the built-up land, LCZ 6 (open low-rise) and LCZ 8 (large low-rise) have the highest proportions (4.83% and 3.16%, respectively). By comparing satellite imagery with the LCZ classification results, it can be observed that high-density, high-rise buildings are primarily concentrated along the coast and inland areas of the Pearl River Estuary, forming several central nodes, such as Zhuhai-Macao, southern Hong Kong, southern Shenzhen, and the Pearl River banks in Guangzhou. Other regions mostly display scattered distributions. LCZ 3 (compact low-rise) and LCZ 5 (open mid-rise) areas form continuous strips on the eastern side of the bay, with spreading patterns in the built-up land of Shenzhen–Dongguan; however, on the western side of the bay, along the Zhuhai–Zhongshan–Foshan axis, there is no clear concentration of high-density, mid-low-rise areas. Instead, multiple clusters of mid-low-rise buildings appear in scattered blocks. Low-rise built areas, classified from LCZ 4 (open high-rise) to LCZ 6 (open low-rise), are located on the outskirts of the high-rise concentration zones. They are more concentrated in the suburban areas of Guangzhou and Shenzhen, with additional clusters in the northeastern region of Huizhou and the northwestern region of Zhaoqing. Among the non-built surfaces, LCZ G (water bodies) accounts for 6.12%, primarily distributed along the Pearl River system, Pearl River Estuary, and coastal areas such as Huangmaohai. For vegetation types, LCZ A (dense trees) is the most prevalent (51.89%), followed by LCZ D (low plants) (17.36%). The distribution of vegetation in the entire bay area shows a clear “dense on the outside, sparse on the inside” pattern. In Zhaoqing and Huizhou, dense LCZ A (dense trees) covers the forested areas. Further inland, the land gradually transitions to LCZ D (low plants), dominated by low vegetation, before gradually transforming into built-up land. However, due to the presence of mountains in Hong Kong and Shenzhen, LCZ A (dense trees) occupies a larger proportion here than in other major cities along the bay.

3.3.2. Analysis Results of Inter-LCZ Group Differences in LST

The comparison between LST in the GBA and LCZ classification allows for a generalized understanding of the LST differences across various building height types. As shown in Figure 12, it is evident that areas with higher building density exhibit higher LSTs. This is because more compact building arrangements have narrower spaces for ventilation and heat dissipation, and there is also a lack of the regulating effects of natural ecosystems. Next, we analyze the differential characteristics of various LCZs to further explore the influence of 3D urban morphology on LST. First, the LCZ classification data were sampled using a grid, and the LST differences for both daytime and nighttime were analyzed. After conducting a rank-based comparison of intergroup differences, the chi-square values for the daytime LST distributions were 71,864.063 (p < 0.05); for the nighttime LST distributions, the chi-square value was 333,048.07 (p < 0.05). These results indicate that the intergroup rank distributions are highly uneven, meaning significant LST differences exist across the different LCZ types (Table 5).
During the daytime, the high-density LCZ (1–3) categories exhibit the highest average LSTs. Among these, LCZ 2 (compact mid-rise) has the highest LST (34.5 °C), while LCZ 1 (compact high-rise) shows the lowest LST (33.1 °C). This may be due to the fact that high-rise, dense buildings provide more extensive shading, which reduces the solar radiation absorption by building materials, thereby lowering their temperature increase [43]. In the mid-density LCZ 4–6 categories, LCZ 5 (open mid-rise) exhibits the highest LST (33.6 °C), with LCZ 4 (open high-rise) and LCZ 6 (open low-rise) showing similar LSTs; this suggests that the cooling effect of shading from high-rise buildings is significantly reduced in mid-density building groups. At this density, the importance of open ventilation spaces for LST regulation becomes more significant. In the remaining LCZs (7–10), which are primarily low-rise built-up land, the differences between the types lie in the materials used for buildings and their coverage areas. It can be observed that LCZ 8 (large low-rise) has the highest LST (34 °C), while LCZ 7 (lightweight low-rise), with nearly the same height, only reaches 32.8 °C. This indicates that for the 1–3 story height range, solar radiation absorbed by building rooftops and ground paving materials is a primary factor influencing LST. The heat distribution difference map (Figure 12) reveals that during the daytime, the LST differences between LCZ 4 (open high-rise) and LCZ 9 (sparsely built), compared to other categories, are the most significant, marking them as the two most representative categories capable of effectively controlling daytime high LSTs.
Solar radiation is no longer the dominant factor at nighttime, so the LST differences between high-density mid- to low-rise buildings are not as pronounced. However, the mid-density LCZ 6 (open low-rise) exhibits higher LSTs, likely due to the high thermal storage efficiency of materials such as concrete and brick, compared to the glass curtain walls commonly found in mid- to high-rise buildings. Additionally, local heat sources from human activities, such as automobile exhaust and pollutants, tend to form localized LST inversions, slowing down the heat dissipation process. It is also noteworthy that due to the beneficial blending of buildings and natural cover, LCZ 9 (sparsely built) has a smaller LST fluctuation between day and night compared to other categories (excluding water bodies). The nighttime heat distribution difference map (Figure 13) shows that LCZ 4 (open high-rise), LCZ 5 (open mid-rise), and LCZ 7 (lightweight low-rise) have the most significant LST differences compared to other categories. LCZ 6 maintains relative LST consistency with high-density built-up land. Notably, vegetation height within LCZs A-D exerts significant influence on surface temperature dynamics. Specifically, low-growing vegetation (LCZ D) exhibits elevated mean temperatures during both diurnal cycles (30.4 °C daytime, 23.5 °C nighttime), whereas dense forests (LCZ A) demonstrate minimal diurnal temperature variation (27.1–25.2 °C). This disparity arises from two primary mechanisms: (1) enhanced solar radiation absorption efficiency coupled with proximity to anthropogenic heat sources (e.g., buildings/infrastructure) amplifies daytime warming in LCZ D; (2) canopy-mediated shading during daylight hours and thermal insulation at night in LCZ A stabilizes surface temperatures, while rapid nocturnal heat dissipation in short vegetation lowers nocturnal temperatures.

4. Discussion

4.1. Spatial Correlation Between Land Use Landscape Patterns and LST

Based on the longitudinal comparison analysis of landscape pattern indices for the years 2000, 2010, and 2020 (Table 6), the impact of urban expansion on LST in the GBA shows significant spatiotemporal differentiation. The PD of built-up land first decreases and then increases, indicating that the GBA underwent a concentrated development phase before 2010 and has since shifted towards a fragmented expansion model up to 2020, which is significantly positively correlated with LST. This phenomenon corroborates the general development pattern of China’s large cities, which follows the “incremental expansion-stock update” model, where after large-scale development and construction, major cities begin transitioning into the stock update phase. This involves gradually slowing down the rate of land expansion and solving urban land resource scarcity issues through urban renewal [44]. The core cities in the GBA, such as Guangzhou, Shenzhen, and Hong Kong, have formed high-density built-up land through high-intensity development, significantly exacerbating the urban heat island effect. However, by 2020, Dongguan, Foshan, Zhuhai, and other surrounding cities experienced rapid development, pushing the urban cluster’s spatial structure from a unipolar concentration to a multi-center network. This shift has led to the heat island effect spreading from the core areas to the surrounding regions. The temporal variation in Grassland_ED further supports the above conclusions. From 2010 to 2020, urbanization in the GBA reached its peak, and green space patches became further fragmented, increasing their contact with built-up land. As a result, these green spaces became more susceptible to heat radiation from surrounding high-LST zones, significantly weakening their cooling capacity. Simultaneously, the cooling effect of water bodies gradually weakened. When combining this with other landscape pattern indices, it can be inferred that urban expansion has led to the fragmentation and transformation of natural water bodies, diminishing their overall effectiveness as ecological cooling sources. The trend in Woodland_LPI first rises and then decreases, indicating that continuous expansion in cities such as Guangzhou, Shenzhen, and Dongguan has led to the fragmentation of large woodland patches by roads and buildings. This has reduced the microclimate stability within these patches, significantly weakening the region’s capacity for thermal environment regulation. The changing trends in landscape pattern indices suggest that urban expansion in the GBA has significant spatial heterogeneity in its impact on LST. The urban expansion model has shifted from concentrated development to fragmented expansion, with the LST regulation functions of ecological land types such as water bodies and woodland continuously weakening. This has resulted in the UHI effect spreading from the core areas to the surrounding regions, thus increasing the thermal environmental pressure on the urban cluster.

4.2. Spatial Correlation Between Land Use Expansion Patterns and LST

Between 2000 and 2020, the GBA experienced rapid urbanization, with increasing intercity transportation, logistics, and industrial connections. Economic agglomeration also drove the continuous expansion of built-up land. Taking Xiangzhou District in Zhuhai as an example, significant outlying expansion characteristics emerged in the Tangjiawan reclamation area, which became one of the seven land reclamation zones. This expansion was facilitated by administrative restructuring (with Tangjiawan Town being incorporated into the High-tech Zone and administered directly by the city) in 2006 and the 2008 “Guangdong Provincial Marine Functional Zoning” policy. This expansion model reflects the profound impact of policy guidance on urban spatial restructuring [45]. Due to its relatively high ecological connectivity, this outlying expansion did not significantly alter local environmental daytime LSTs. In fact, the construction of ecological corridors helped mitigate the rise in daytime LST to some extent. In contrast, edge expansion, which typically takes place in areas with more lenient land resource policies, generally exhibits lower construction intensity and higher green space retention, leading to more dispersed heating effects. However, infilling expansion has a more noticeable impact on daytime LST than other expansion types. Infilling expansion often significantly alters the thermal environment of urban clusters, with increased building density, reduced ecological space, and the development of transportation infrastructure, resulting in a marked daytime LST rise and becoming a major driver of the UHI effect. This phenomenon is particularly pronounced in core cities such as Shenzhen and Macau, where infill expansion is frequently accompanied by a reduction in green space, further exacerbating the pressure on the urban thermal environment. The differentiated thermal effects of various urban expansion types are consistent with foundational urban morphology theory [46,47]. Infilling expansion, representing a compact urban form, intensifies thermal accumulation due to higher structural density and reduced surface permeability. In contrast, outlying expansion, associated with dispersed spatial configurations and greater ecological integration, exhibits a mitigated nighttime heat effect. These findings underscore the importance of reconciling morphological compactness with climatic adaptability in urban spatial planning.
However, the nighttime LST analysis shows a significant weakening in the coupling between land expansion patterns and LST, indicating a pronounced diurnal asymmetry. Spatial clustering of nighttime LST is generally reduced, and the thermal response across expansion types becomes notably weaker. Among them, outlying expansion remains significantly negatively correlated with nighttime LST, suggesting that its ecological buffering capacity continues to contribute to nocturnal cooling. In contrast, both edge and infilling expansions show insignificant correlations, particularly the latter, whose daytime-induced UHI effect tends to dissipate at night—likely due to surface thermal inertia and heat redistribution mechanisms. This diurnal variation highlights the temporal sensitivity of urban thermal environments to spatial expansion patterns. Different expansion types perform distinct thermal regulatory functions between day and night, underscoring the need to integrate spatial and temporal dimensions in urban heat governance. For instance, infilling expansion in core cities should be strictly controlled in scale, with a preference for vertical over horizontal development; outlying expansion areas should prioritize the continuity of ecological corridors; edge expansion areas can serve as thermal buffers, where low-density and ecological land uses are coordinated. Future spatial planning should incorporate the differentiated diurnal thermal responses of expansion types to support climate-adaptive urban form optimization.

4.3. LCZ Spatial Distribution Patterns

The distribution of LCZs aligns closely with the “multi-center, networked” spatial planning structure of the GBA. High-density building types (LCZ 1 and LCZ 2) are concentrated in key nodes, such as the Zhuhai–Macau, southern Shenzhen, and Pearl River banks in Guangzhou, which are consistent with the “polar point-driven” strategy outlined in the Outline Development Plan for the Guangdong–Hong Kong–Macao Greater Bay Area. These areas serve as the core engines for economic development in the GBA, and their high-density construction reflects the highly intensive use of land resources. However, this concentrated construction model also exacerbates the UHI effect and ecological environmental pressures, requiring mitigation through measures such as optimizing building layouts and increasing green space. The distribution pattern of low-rise construction areas (LCZ 4 to LCZ 6) reflects the core-periphery gradient expansion characteristic of the GBA. It highlights the important role of suburban areas in absorbing the functions relocated from the core cities. However, the sprawling expansion of low-rise construction areas could lead to land use inefficiencies and ecological space fragmentation, necessitating management through measures such as defining growth boundaries and optimizing land supply structures. Among the non-built land types, the distribution of water bodies (LCZ G) is particularly noteworthy, as it is closely tied to the “one river, two shores” natural geographical features of the GBA. The Pearl River system is not only a critical support for regional ecological security but also serves as the core carrier for the water resources and shipping functions of the GBA. In the future, it is essential to strengthen the protection of water ecosystems and mitigate the negative impacts of urbanization on the water environment.

4.4. The Impact Mechanisms of LCZ Spatial Morphology on the Thermal Environment

The impact of 3D urban morphology on LST is more complex. The daytime distribution of LST is significantly influenced by urban form and building density. High-rise building clusters (LCZs 1–3) have a notable cooling effect during the daytime due to their shading of solar radiation, whereas mid- to high-rise buildings, with limited shading areas, absorb more solar radiation through their materials, leading to an increase in LST. Therefore, while ensuring building density, an appropriate increase in the proportion of high-rise buildings can reduce LST through enhanced shading effects, thereby mitigating the urban heat island (UHI) effect. However, this vertically oriented development model requires synchronized adjustments to the morphology and configuration of green infrastructure. Firstly, compensatory measures such as rooftop greening and vertical greening technologies should be implemented to offset ecological function losses (e.g., reduced air purification, carbon sequestration) caused by intensive development. Secondly, vegetation-height zonation strategies must be adopted across multi-story building zones: low-growing vegetation like grasses and groundcovers should be prioritized at high-rise pedestrian levels to enhance nocturnal heat dissipation, while dense tree canopies are recommended for lower building clusters (1–3 stories) to create shaded, thermally comfortable public spaces. For large-scale multi-story structures, rooftop greening with dwarf shrubs—not herbaceous plants—is optimal for daytime cooling, provided structural load-bearing capacities and architectural designs are scientifically evaluated to ensure compatibility.
In mid-density building clusters (LCZs 4–6), the shading effect is reduced, and the ventilation space between buildings becomes a key factor in LST regulation. Therefore, in planning mid-density areas, attention should be paid to the design of building layouts with a focus on ventilation, optimizing building spacing and orientation, and enhancing natural ventilation capabilities to lower LSTs. For other low-rise building types (LCZs 8–10), the distance between building rooftops and the ground is relatively small, meaning that the solar radiation absorption determined by the area of the first floor significantly impacts LST. To reduce LST, the shape of the individual buildings can be altered. For example, converting large, flat-floor buildings into enclosed or clustered building forms can help mitigate the rise in LST. Modifications can be made to buildings with fixed forms, such as industrial and large public buildings, by adjusting the roof materials and structures. Optimization strategies include applying reflective coatings, adding insulation layers to block heat, installing ventilated ridges, and incorporating wet curtain systems for active thermal regulation. These measures can significantly improve LST control and help mitigate the SUHI effect. In contrast, the nighttime LST distribution is mainly influenced by the thermal storage capacity of building materials and human activities. Mid-density LCZ 6 (open low-rise) has higher nighttime surface temperatures, possibly due to the higher thermal storage capacity of traditional building materials, such as concrete and brick, compared to the glass curtain walls commonly found in mid- to high-rise buildings.
In summary, the deep-rooted impact mechanisms of LCZ spatial morphology on the urban heat environment can be summarized as follows: building height, density, and layout directly influence the solar radiation shading effect and ventilation efficiency, which, in turn, determine the distribution pattern of LSTs. Different materials’ thermal absorption and storage characteristics significantly affect diurnal LST changes; lightweight materials and light-colored surfaces help reduce daytime LSTs, while traditional high thermal storage materials may cause an increase in nighttime LSTs. Human heat sources, such as traffic emissions and industrial activities, exacerbate the local LST inversion effect and delay heat dissipation during the night.

5. Conclusions

This study systematically explores the spatiotemporal impact and mechanisms of multi-dimensional urban morphology characteristics on regional thermal effects in the GBA. By constructing a multi-dimensional urban morphology analysis framework and integrating landscape pattern indices, land use expansion patterns, and the LCZ classification method, we reveal the following complex interactions between urban morphology characteristics and LST during the period from 2000 to 2020.
(1)
The impact of 2D urban morphology on LST was significant, especially as the fragmentation of built-up land had intensified the UHI effect. Between 2000 and 2020, the patch density of built-up land showed a significant positive correlation with LST, and the fragmentation trend of urban expansion exacerbated the UHI effect. The urban expansion model in the GBA shifted from outward expansion to infill expansion, significantly increasing building density and reducing ecological land area; this led to the spread of the UHI effect from the core cities to the surrounding areas. Core cities such as Guangzhou and Shenzhen saw significant increases in LSTs. This expansion pattern aligns with the “incremental expansion-stock update” development pattern of the GBA and reflects the far-reaching impact of high-intensity development on the regional thermal environment.
(2)
The impact of 3D urban morphology on LST was more complex. During the daytime, high-rise building clusters (LCZs 1–3) significantly reduced LSTs due to their solar-radiation-shading effects. In mid-density building clusters (LCZs 4–6), the ventilation spaces between buildings became crucial for LST regulation. At night, LCZ 6 (open low-rise) in mid-density areas exhibited higher LST s due to the thermal storage capacity of traditional materials such as concrete and brick and the formation of LST inversion layers from human activities.
(3)
For the high-density development characteristics of the GBA, we recommend optimizing the urban spatial structure by enhancing the connectivity of green infrastructure, particularly promoting vertical greening and green roofs in core urban areas. In addition, strict control over land reclamation and infill expansion should be enforced, protecting large, contiguous natural water bodies and woodlands to enhance their cooling effects. At the same time, improving urban ventilation corridors and promoting low-thermal capacity building materials can help mitigate the urban heat island effect.
In conclusion, this study provides a quantitative analysis of the impact mechanisms of 2D and 3D urban morphology on LST, offering a scientific basis for sustainable urban development and climate adaptation planning in the GBA. However, this study has certain limitations and shortcomings. Firstly, due to constraints in crowdsourcing technology service conditions, the spatial classification accuracy of LCZ models remains improvable. If machine learning algorithms could be optimized to enhance urban agglomeration-level feature recognition accuracy above 90%, more refined conclusions could be drawn. Secondly, while this research focused on average LST as the dependent variable to explore daytime and nighttime mechanisms between urban form and local climatic conditions, urban agglomerations face more complex, real-world scenarios. Future studies should expand this framework to incorporate seasonal variations, extreme weather events, and multi-scale urban morphological analyses. Although the current study is limited to summer-season data due to data availability and the focus on peak heat exposure, we acknowledge the importance of winter-season thermal dynamics. Incorporating winter-season LST could help reveal seasonal contrasts in urban morphology–temperature interactions, and this remains a valuable direction for future research.

Author Contributions

Conceptualization, J.W. and Y.W.; methodology, J.W.; software, J.W. and Y.W.; validation, Y.W. and J.W.; formal analysis, J.W. and Y.W.; investigation, J.W. and Y.W.; resources, T.C.; data curation, J.W. and Y.W.; writing—original draft preparation, J.W. and Y.W.; writing—review and editing, J.W. and Y.W.; visualization, J.W. and Y.W.; supervision, J.W., Y.W. and T.C.; project administration, J.W., Y.W. and T.C.; funding acquisition, J.W. All authors have read and agreed to the published version of the manuscript.

Funding

This research was funded by the National Natural Science Foundation of China grant number 52408047, the National Natural Science Foundation of China grant number 52378066, the National Natural Science Foundation of China grant number 52208040, the Beijing University of Civil Engineering and Architecture Cultivation Project Special Fund grand number X24009, and the Beijing University of Civil Engineering and Architecture Postgraduate Innovation Project grand number PG2025024.

Data Availability Statement

The raw data supporting the conclusions of this article will be made available by the authors on request.

Conflicts of Interest

The authors declare no conflicts of interest.

References

  1. Maimaitiyiming, M.; Ghulam, A.; Tiyip, T.; Pla, F.; Latorre-Carmona, P.; Halik, Ü.; Sawut, M.; Caetano, M. Effects of green space spatial pattern on land surface temperature: Implications for sustainable urban planning and climate change adaptation. ISPRS J. Photogramm. Remote Sens. 2014, 89, 59–66. [Google Scholar]
  2. Afrakhteh, R.; Asgarian, A.; Sakieh, Y.; Soffianian, A. Evaluating the strategy of integrated urban-rural planning system and analyzing its effects on land surface temperature in a rapidly developing region. Habitat Int. 2016, 56, 147–156. [Google Scholar]
  3. Ranagalage, M.; Estoque, R.C.; Handayani, H.H.; Zhang, X.; Morimoto, T.; Tadono, T.; Murayama, Y. Relation between urban volume and land surface temperature: A comparative study of planned and traditional cities in Japan. Sustainability 2018, 10, 2366. [Google Scholar] [CrossRef]
  4. Lu, Y.; Yue, W.; He, T.; Shan, Z. Urban form centrality and thermal environment: An empirical study of Chinese megacities. Sustain. Cities Soc. 2022, 83, 103955. [Google Scholar]
  5. Lai, D.; Liu, W.; Gan, T.; Liu, K.; Chen, Q. A review of mitigating strategies to improve the thermal environment and thermal comfort in urban outdoor spaces. Sci. Total Environ. 2019, 661, 337–353. [Google Scholar] [PubMed]
  6. Du, S.; Wu, Y.; Guo, L.; Fan, D.; Sun, W. How does the 2D/3D urban morphology affect the urban heat island across urban functional zones? A case study of Beijing, China. ISPRS Int. J. Geo-Inf. 2024, 13, 120. [Google Scholar] [CrossRef]
  7. Yu, Z.; Chen, S.; Wong, N.H.; Ignatius, M.; Deng, J.; He, Y.; Hii, D.J.C. Empirical model of campus air temperature and urban morphology parameters based on field measurement and machine learning in Singapore. arXiv 2019, arXiv:1911.08822. [Google Scholar]
  8. Azhdari, A.; Soltani, A.; Alidadi, M. Urban morphology and landscape structure effect on land surface temperature: Evidence from Shiraz, a semi-arid city. Sustain. Cities Soc. 2018, 41, 853–864. [Google Scholar]
  9. Tran, D.X.; Pla, F.; Latorre-Carmona, P.; Myint, S.W.; Caetano, M.; Kieu, H.V. Characterizing the relationship between land use land cover change and land surface temperature. ISPRS J. Photogramm. Remote Sens. 2017, 124, 119–132. [Google Scholar]
  10. Bartesaghi-Koc, C.; Osmond, P.; Peters, A. Quantifying the seasonal cooling capacity of ‘green infrastructure types’(GITs): An approach to assess and mitigate surface urban heat island in Sydney, Australia. Landsc. Urban Plan. 2020, 203, 103893. [Google Scholar]
  11. Zhuang, Q.; Wu, S.; Yan, Y.; Niu, Y.; Yang, F.; Xie, C. Monitoring land surface thermal environments under the background of landscape patterns in arid regions: A case study in Aksu river basin. Sci. Total Environ. 2020, 710, 136336. [Google Scholar] [CrossRef] [PubMed]
  12. Song, Y.; Song, X.; Shao, G. Effects of green space patterns on urban thermal environment at multiple spatial–temporal scales. Sustainability 2020, 12, 6850. [Google Scholar] [CrossRef]
  13. Chapman, S.; Watson, J.E.; Salazar, A.; Thatcher, M.; McAlpine, C.A. The impact of urbanization and climate change on urban temperatures: A systematic review. Landsc. Ecol. 2017, 32, 1921–1935. [Google Scholar] [CrossRef]
  14. Logan, T.M.; Zaitchik, B.; Guikema, S.; Nisbet, A. Night and day: The influence and relative importance of urban characteristics on remotely sensed land surface temperature. Remote Sens. Environ. 2020, 247, 111861. [Google Scholar] [CrossRef]
  15. Chen, J.; Zhan, W.; Du, P.; Li, L.; Li, J.; Liu, Z.; Xia, J. Seasonally disparate responses of surface thermal environment to 2D/3D urban morphology. Build. Environ. 2022, 214, 108928. [Google Scholar] [CrossRef]
  16. Rifat, S.A.A.; Liu, W. Quantifying spatiotemporal patterns and major explanatory factors of urban expansion in Miami metropolitan area during 1992–2016. Remote Sens. 2019, 11, 2493. [Google Scholar] [CrossRef]
  17. Tian, P.; Li, J.; Cao, L.; Pu, R.; Wang, Z.; Zhang, H.; Gong, H. Assessing spatiotemporal characteristics of urban heat islands from the perspective of an urban expansion and green infrastructure. Sustain. Cities Soc. 2021, 74, 103208. [Google Scholar] [CrossRef]
  18. Rao, Y.; Dai, J.; Dai, D.; He, Q. Effect of urban growth pattern on land surface temperature in China: A multi-scale landscape analysis of 338 cities. Land Use Policy 2021, 103, 105314. [Google Scholar] [CrossRef]
  19. Yin, C.; Yuan, M.; Lu, Y.; Huang, Y.; Liu, Y. Effects of urban form on the urban heat island effect based on spatial regression model. Sci. Total Environ. 2018, 634, 696–704. [Google Scholar] [CrossRef]
  20. Stewart, I.D.; Oke, T.R. Local climate zones for urban temperature studies. Bull. Am. Meteorol. Soc. 2012, 93, 1879–1900. [Google Scholar] [CrossRef]
  21. Liu, J.; Wang, J.; Chen, T.; Wang, L. Heat stress resilience assessment of urban form from physical space dimension: A case study of Guangdong-Hong Kong-Macao Greater Bay Area. Urban Clim. 2024, 55, 101905. [Google Scholar] [CrossRef]
  22. Zhang, L.; Nikolopoulou, M.; Guo, S.; Song, D. Impact of LCZs spatial pattern on urban heat island: A case study in Wuhan, China. Build. Environ. 2022, 226, 109785. [Google Scholar]
  23. Perera, N.G.; Emmanuel, R. A “Local Climate Zone” based approach to urban planning in Colombo, Sri Lanka. Urban Clim. 2018, 23, 188–203. [Google Scholar]
  24. Huang, X.; Wang, Y. Investigating the effects of 3D urban morphology on the surface urban heat island effect in urban functional zones by using high-resolution remote sensing data: A case study of Wuhan, Central China. ISPRS J. Photogramm. Remote Sens. 2019, 152, 119–131. [Google Scholar]
  25. Alavipanah, S.; Schreyer, J.; Haase, D.; Lakes, T.; Qureshi, S. The effect of multi-dimensional indicators on urban thermal conditions. J. Clean. Prod. 2018, 177, 115–123. [Google Scholar] [CrossRef]
  26. Wang, R.; Wang, M. Multi-scale analysis of surface thermal environment in relation to urban form: A case study of the Guangdong-Hong Kong-Macao Greater Bay Area. Sustain. Cities Soc. 2023, 99, 104953. [Google Scholar]
  27. Li, L.; Chan, P.W.; Deng, T.; Yang, H.L.; Luo, H.Y.; Xia, D.; He, Y.Q. Review of advances in urban climate study in the Guangdong-Hong Kong-Macau Greater Bay Area, China. Atmos. Res. 2021, 261, 105759. [Google Scholar] [CrossRef]
  28. Ma, Y.; Zhang, S.; Yang, K.; Li, M. Influence of spatiotemporal pattern changes of impervious surface of urban megaregion on thermal environment: A case study of the Guangdong–Hong Kong–Macao Greater Bay Area of China. Ecol. Indic. 2021, 121, 107106. [Google Scholar]
  29. Wang, Y.; Yao, Y.; Chen, S.; Ni, Z.; Xia, B. Spatiotemporal evolution of urban development and surface urban heat island in Guangdong-Hong Kong-Macau greater bay area of China from 2013 to 2019. Resour. Conserv. Recycl. 2022, 179, 106063. [Google Scholar]
  30. Deng, X.; Gao, F.; Liao, S.; Liu, Y.; Chen, W. Spatiotemporal evolution patterns of urban heat island and its relationship with urbanization in Guangdong-Hong Kong-Macao greater bay area of China from 2000 to 2020. Ecol. Indic. 2023, 146, 109817. [Google Scholar]
  31. Wang, D.; Lau, K.K.L.; Ren, C.; Goggins, W.B.I.; Shi, Y.; Ho, H.C.; Ng, E. The impact of extremely hot weather events on all-cause mortality in a highly urbanized and densely populated subtropical city: A 10-year time-series study (2006–2015). Sci. Total Environ. 2019, 690, 923–931. [Google Scholar] [PubMed]
  32. McGarigal, K. FRAGSTATS: Spatial Pattern Analysis Program for Quantifying Landscape Structure; U.S. Department of Agriculture, Forest Service, Pacific Northwest Research Station: Portland, OR, USA, 1995; Volume 351. [Google Scholar]
  33. Kupfer, J.A. Landscape ecology and biogeography: Rethinking landscape metrics in a post-FRAGSTATS landscape. Prog. Phys. Geogr. 2012, 36, 400–420. [Google Scholar]
  34. Liu, X.; Ma, L.; Li, X.; Ai, B.; Li, S.; He, Z. Simulating urban growth by integrating landscape expansion index (LEI) and cellular automata. Int. J. Geogr. Inf. Sci. 2014, 28, 148–163. [Google Scholar]
  35. Liu, X.; Li, X.; Chen, Y.; Tan, Z.; Li, S.; Ai, B. A new landscape index for quantifying urban expansion using multi-temporal remotely sensed data. Landsc. Ecol. 2010, 25, 671–682. [Google Scholar]
  36. Demuzere, M.; Hankey, S.; Mills, G.; Zhang, W.; Lu, T.; Bechtel, B. Combining expert and crowd-sourced training data to map urban form and functions for the continental US. Sci. Data 2020, 7, 264. [Google Scholar]
  37. Demuzere, M.; Bechtel, B.; Middel, A.; Mills, G. Mapping Europe into local climate zones. PLoS ONE 2019, 14, e0214474. [Google Scholar] [CrossRef] [PubMed]
  38. Bechtel, B.; Alexander, P.J.; Beck, C.; Böhner, J.; Brousse, O.; Ching, J.; Xu, Y. Generating WUDAPT Level 0 data–Current status of production and evaluation. Urban Clim. 2019, 27, 24–45. [Google Scholar]
  39. Verma, A.; Agrawal, S. Evaluating the natural cooling potential of waterbodies in dense urban landscape: A case study of Bengaluru, India. Urban Clim. 2024, 58, 102200. [Google Scholar]
  40. Massey, R.; Rogers, B.M.; Berner, L.T.; Cooperdock, S.; Mack, M.C.; Walker, X.J.; Goetz, S.J. Forest composition change and biophysical climate feedbacks across boreal North America. Nat. Clim. Chang. 2023, 13, 1368–1375. [Google Scholar]
  41. Yin, Y.; Li, S.; Xing, X.; Zhou, X.; Kang, Y.; Hu, Q.; Li, Y. Cooling benefits of urban tree canopy: A systematic review. Sustainability 2024, 16, 4955. [Google Scholar] [CrossRef]
  42. Rasul, A.; Balzter, H.; Smith, C.; Remedios, J.; Adamu, B.; Sobrino, J.A.; Weng, Q. A review on remote sensing of urban heat and cool islands. Land 2017, 6, 38. [Google Scholar] [CrossRef]
  43. Nugroho, N.Y.; Triyadi, S.; Wonorahardjo, S. Effect of high-rise buildings on the surrounding thermal environment. Build. Environ. 2022, 207, 108393. [Google Scholar] [CrossRef]
  44. Zhu, H.; Gao, X.; Tian, W.; Wei, M.; Zhang, X.; Chen, Y. Investigating the mechanisms of sustainable urban land renewal: A perspective of spatial development rights. Sustain. Cities Soc. 2024, 109, 105536. [Google Scholar] [CrossRef]
  45. Hu, Y.; Luo, Y.; Tan, X.; Wang, B.; Zhou, C.; Xiang, Y. Rational zoning and optimization of agricultural distribution in Guangdong Province based on resource carrying capacity. Acta Ecol. Sin. 2023, 43, 820–834. [Google Scholar] [CrossRef]
  46. Zhou, W.; Huang, G.; Cadenasso, M.L. Does spatial configuration matter? Understanding the effects of land cover pattern on land surface temperature in urban landscapes. Landsc. Urban Plan. 2011, 102, 54–63. [Google Scholar] [CrossRef]
  47. Zhang, Q.; Wu, Z.; Singh, V.P.; Wang, R. Impacts of spatial configuration of land surface features on land surface temperature across urban agglomerations, China. Remote Sens. 2021, 13, 4008. [Google Scholar] [CrossRef]
Figure 1. Research framework.
Land 14 00729 g001
Figure 2. Study of the geographical location of research areas and global 30 m land use in 2020.
Land 14 00729 g002
Figure 3. The number of LCZ training samples delineated in this study.
Land 14 00729 g003
Figure 4. GBA LST inversion results for July 2000, 2010, and 2020 (daytime average LST: (ac); nighttime average LST: (df)).
Land 14 00729 g004
Figure 5. Bivariate LISA cluster map of land use types and landscape pattern indices in 2000.
Land 14 00729 g005
Figure 6. Bivariate LISA cluster map of land use types and landscape pattern indices in 2010.
Land 14 00729 g006
Figure 7. Bivariate LISA cluster map of land use types and landscape pattern indices in 2020.
Land 14 00729 g007
Figure 8. GBA land use expansion pattern distribution map (a) and the proportion of outlying, edge, and infilling expansion patterns in each city (b) for 2000–2020.
Land 14 00729 g008
Figure 9. Bivariate spatial autocorrelation analysis results between land use expansion patterns and LST (daytime and nighttime). ** represents p < 0.001, * represents p < 0.01.
Land 14 00729 g009
Figure 10. LCZ spatial distribution map of GBA.
Land 14 00729 g010
Figure 11. Accuracy verification results.
Land 14 00729 g011
Figure 12. Boxplots of LST for local climate zones during daytime (a) and nighttime (b).
Land 14 00729 g012
Figure 13. Heatmap of LST differences between LCZs during daytime (a) and nighttime (b).
Land 14 00729 g013
Table 1. Meaning and calculation method for landscape pattern indices.
Landscape Pattern IndicesMeaningFormulaUnit
PDThe number of landscape patches per unit area, reflecting the degree of landscape fragmentation. P D = n i A unit,
/km2
AIReflecting how clustered or connected the patches are. A I = [ g i j m a x ( g i j ) ] × 100 % %
LPIThe proportion of the largest patch to the total landscape area for a specific type of landscape, reflecting the dominance of that landscape type. L P I = m a x ( a i j ) A × 100 % %
EDThe ratio of the total perimeter of landscape patches to the landscape area, reflecting the shape of the landscape patches and edge effects. E D = k = 1 m e i k / A m/hm2
PLANDThe percentage of the total landscape area occupied by a specific type of landscape, reflecting the proportional abundance of that landscape type. P L A N D = j = 1 n a i j / A %
Table 2. Correlation coefficients and Moran’s I of land use types and landscape pattern indices in 2000.
Landscape Pattern IndicesCroplandWoodlandGrasslandWater BodiesBuilt-Up Land
p ValueMoran’s Ip ValueMoran’s Ip ValueMoran’s Ip ValueMoran’s Ip ValueMoran’s I
PD0.770 **0.336 (76.726) **0.359 **0.237 (58.534)0.767 **0.144 (35.099)0.967 **0.073 (18.619)1.001 **0.248 (56.016)
LPI0.323 **−0.281 (−65.842) **0.117 **−0.157 (−39.015)0.127 *−0.082 (−20.298)0.181 **0.032 (8.183)0.105 *−0.218 (−50.094)
ED−0.147 **0.339 (77.517) **−0.0220.195 (47.946)−0.030.113 (27.663)−0.107 *0.039 (9.865)0.148 **0.237 (53.673)
AI1.621 **−0.329 (−75.849) **0.028−0.189 (−46.528)−0.023−0.112 (−27.559)−0.221 **−0.055 (13.981)0.292 **−0.223 (−50.376)
PLAND0.004 **−0.195 (46.311)0.011 **0.300 (70.938)0.014−0.069 (−16.956)0.026 **0.325 (73.842)0.009 *0.146 (−36.333)
** represents p < 0.001, * represents p < 0.01, and the values in parentheses are the Z-test values.
Table 3. Correlation coefficients and Moran’s I of land use types and landscape pattern indices in 2010.
Landscape Pattern IndicesCroplandWoodlandGrasslandWater BodiesBuilt-Up Land
p ValueMoran’s Ip ValueMoran’s Ip ValueMoran’s Ip ValueMoran’s Ip ValueMoran’s I
PD0.929 **0.353 (79.274)0.770 **0.191 (47.217)0.614 **0.140 (34.047)0.966 **0.062 (15.963)0.657 **0.256 (59.149)
LPI−0.021−0.304 (−67.685)0.323 **−0.132 (−32.615)0.098−0.092 (−22.548)0.175 **0.032 (8.336)0.338 **−0.227 (−53.377)
ED0.143 **0.321 (70.994)−0.147 **0.159 (39.266)0.0130.117 (28.709)−0.097 *0.032 (8.361)−0.119 *0.244 (56.389)
AI0.395 **−0.311 (−69.273)1.621 **−0.157 (−38.891)0.019−0.116 (−28.430)−0.204 *−0.048 (−12.359)2.026 **−0.235 (−24.733)
PLAND−0.008 **−0.193 (−46.456)0.004 **0.018 (4.329)0.032−0.076 (−18.683)0.0259 **0.322 (73.414)2.739 **0.132 (−37.926)
** represents p < 0.001, * represents p < 0.01, and the values in parentheses are the Z-test values.
Table 4. Correlation coefficients and Moran’s I of land use types and landscape pattern indices in 2020.
Landscape Pattern IndicesCroplandWoodlandGrasslandWater BodiesBuilt-Up Land
p ValueMoran’s Ip ValueMoran’s Ip ValueMoran’s Ip ValueMoran’s Ip ValueMoran’s I
PD0.797 **0.337 (74.574)0.511 **0.133 (32.766)0.039−0.099
(−24.082)
0.997 **0.079 (20.569)0.934 **0.264 (60.561)
LPI−0.008−0.302 (−67.797)0.042−0.108 (−26.861)0.0590.117 (28.592)−0.181 **0.018 (4.954)0.054−0.233 (−54.014)
ED0.180 **0.318 (70.160)0.0570.121 (30.071)0.500 **0.130 (31.781)−0.083 *0.051 (13.245)0.0550.250 (56.963)
AI0.433 **−0.307 (−68.200)0.175 *−0.119 (−29.566)0.151−0.115 (−28.083)−0.194 *−0.068 (−17.521)0.183 *−0.242 (−55.420)
PLAND−0.005−0.191 (−46.838)0.003 **0.025
(5.986)
0.028 *−0.076 (−18.627)0.023 **0.328 (74.304)0.011 **−0.165 (−39.259)
** represents p < 0.001, * represents p < 0.01, and the values in parentheses are the Z-test values.
Table 5. Kruskal–Wallis test results.
Chi-SquarepZ
Day LST71,864.046<0.000139.26
Night LST333,048.07<0.00016.13
Table 6. Analysis of the changing trends in the correlation between key landscape pattern indices and LST.
Landscape Pattern IndicesCorrelation Coefficient for 2000Correlation Coefficient for 2010Correlation Coefficient for 2020Trend of Change
Built-up land_PD1.001 **0.657 **0.934 **↓↑
Water Bodies_PD0.967 **0.966 **0.997 **↑↑
Woodland_LPI0.117 **0.323 **0.042↑↓
Water Bodies _LPI0.181 **0.175 **0.181 **——
Grassland_ED0.030.0130.500 **↑↑
Water Bodies _ED−0.107 *−0.097 *−0.083 *↓↓
Built-up land _AI0.292 **2.026 **0.183 *↑↓
Water Bodies _AI−0.221 **−0.204 *−0.194 *↓↓
Built-up land _PLAND0.009 *2.739 **0.011 **↑↓
** represents p < 0.001, * represents p < 0.01. “↓” indicates a downward trend in the indicator, “↑” indicates an upward trend, and “—" indicates little or no change.
Disclaimer/Publisher’s Note: The statements, opinions and data contained in all publications are solely those of the individual author(s) and contributor(s) and not of MDPI and/or the editor(s). MDPI and/or the editor(s) disclaim responsibility for any injury to people or property resulting from any ideas, methods, instructions or products referred to in the content.

