
Optimizing Green Spaces Significantly Improves Wind Environment and Accessibility in County Towns


Abstract
:1. Introduction
2. Methodology
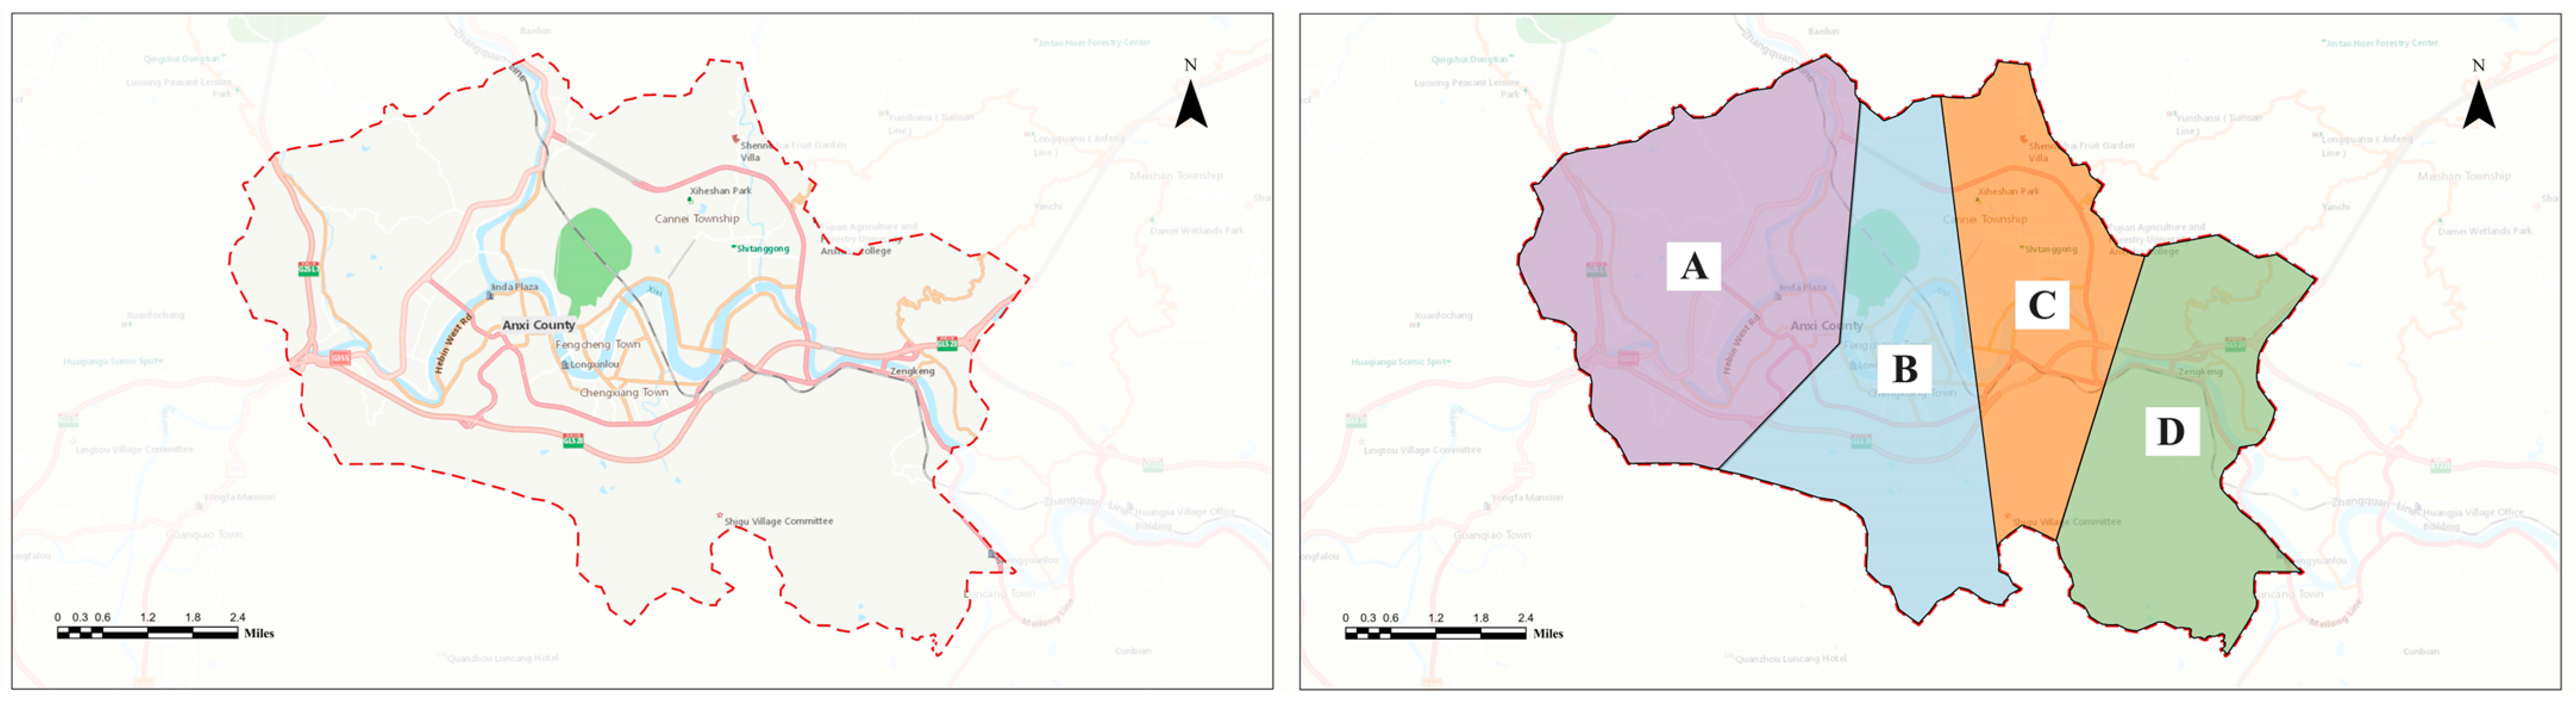
2.1. Research Area
2.2. Data Sources
2.2.1. Planning Area Model Data
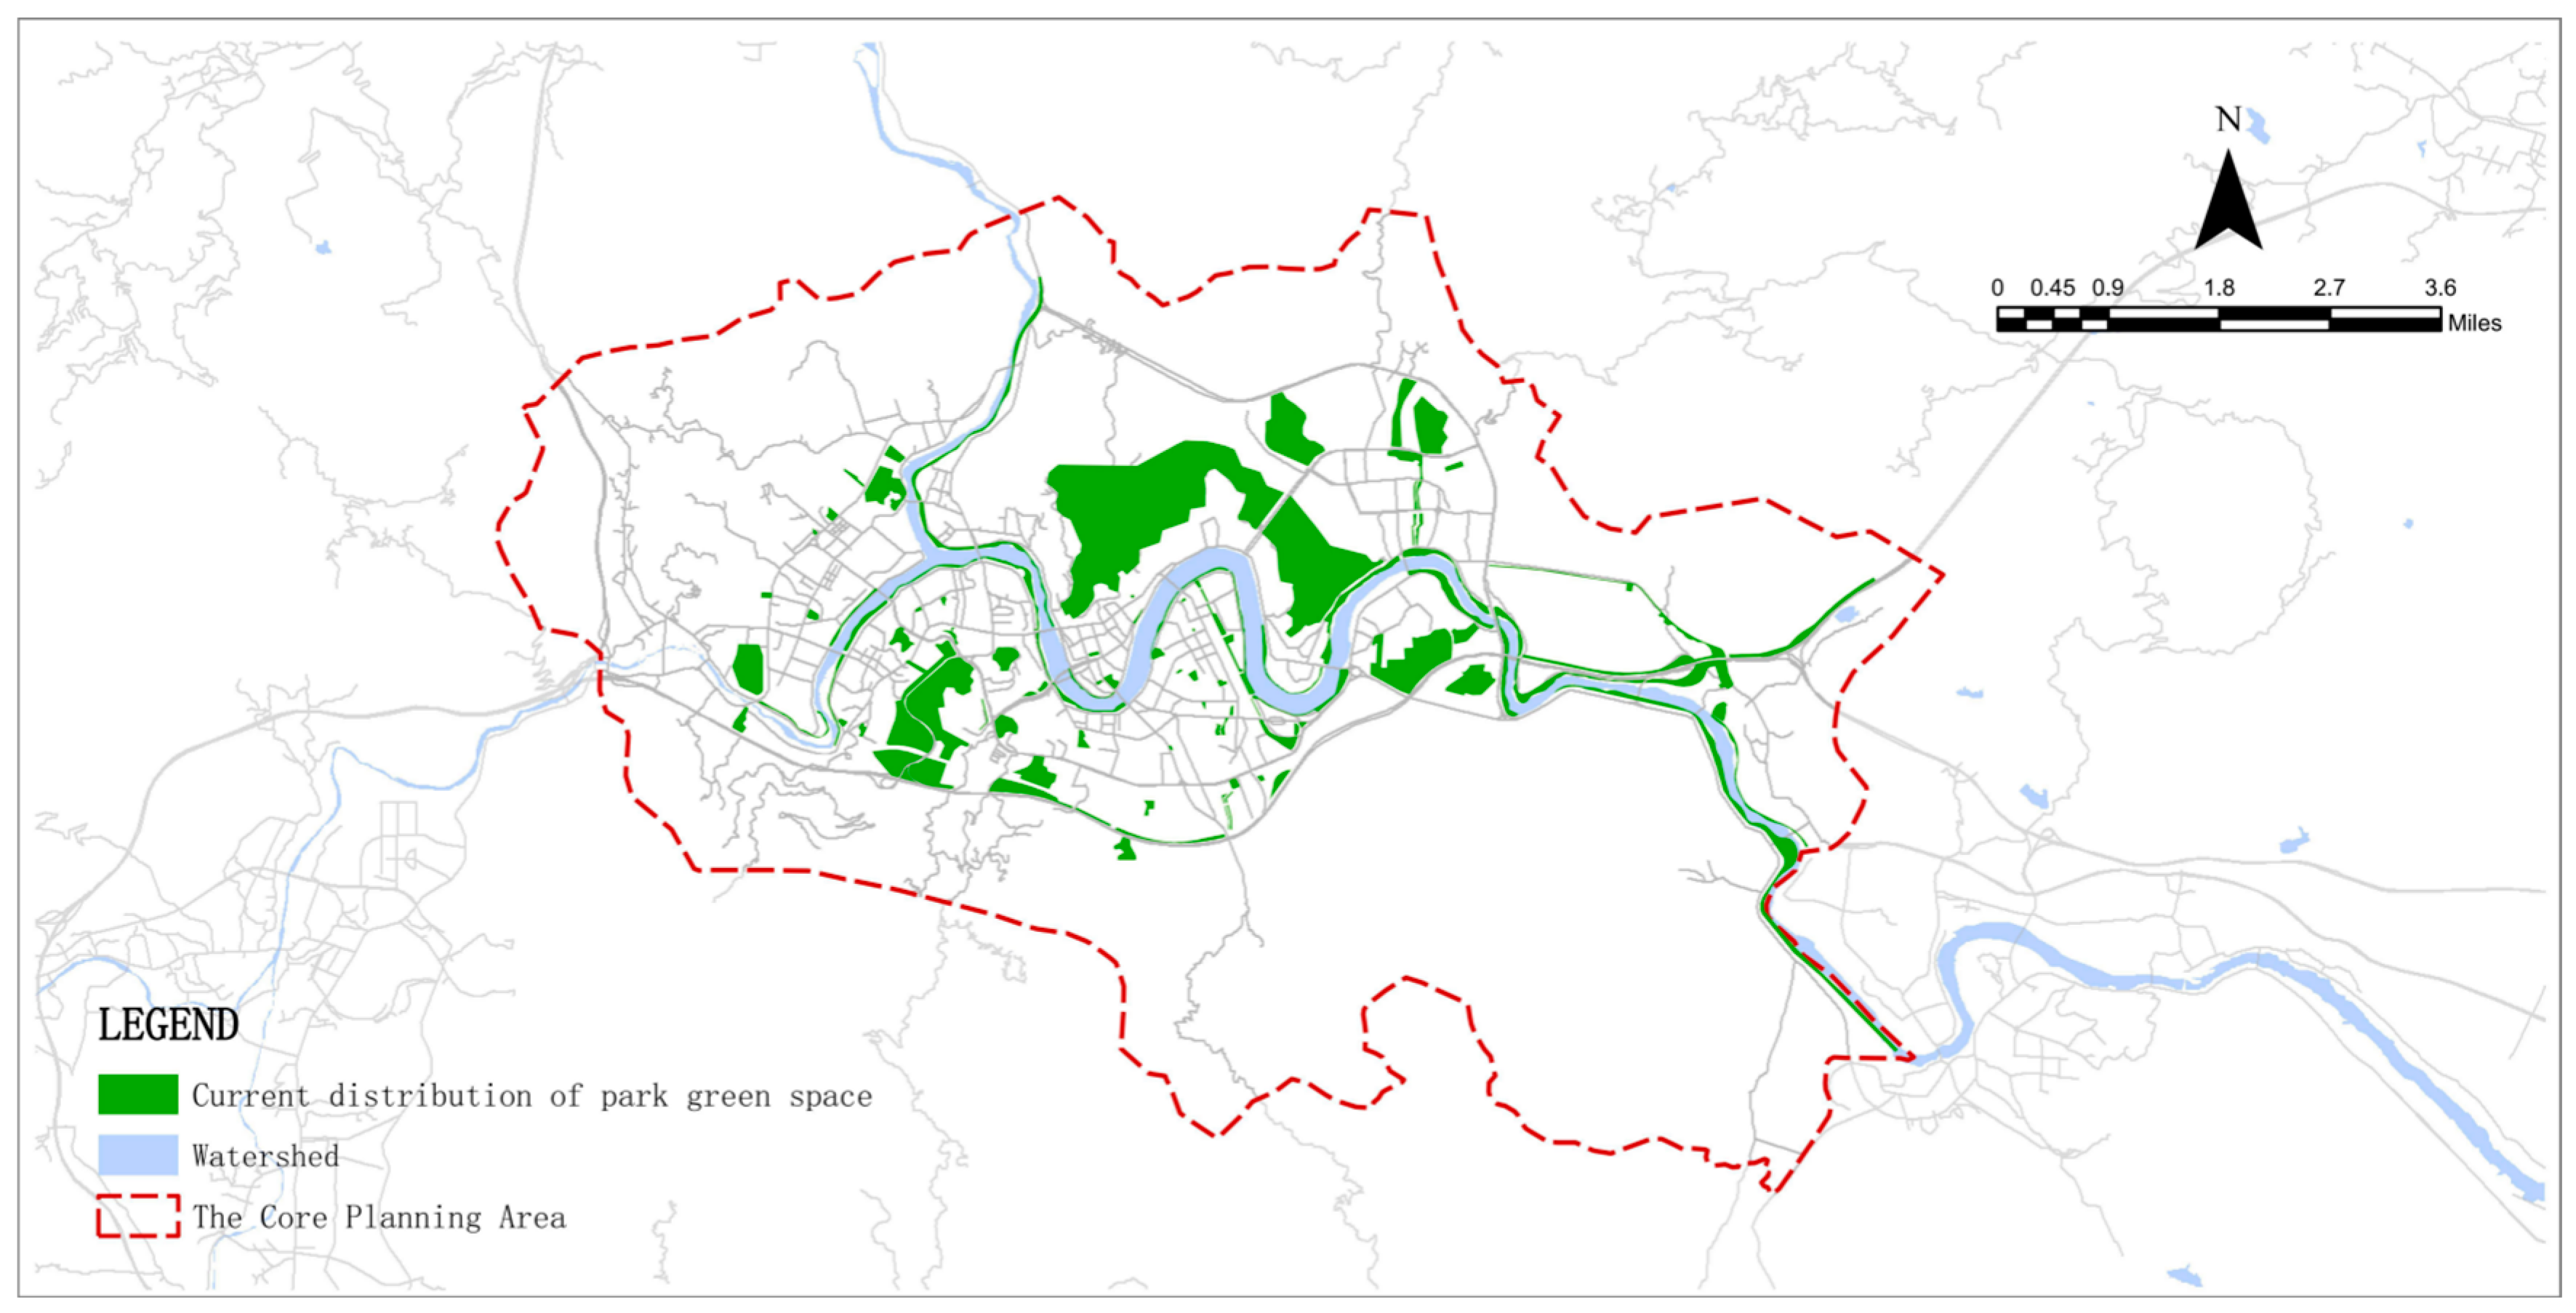
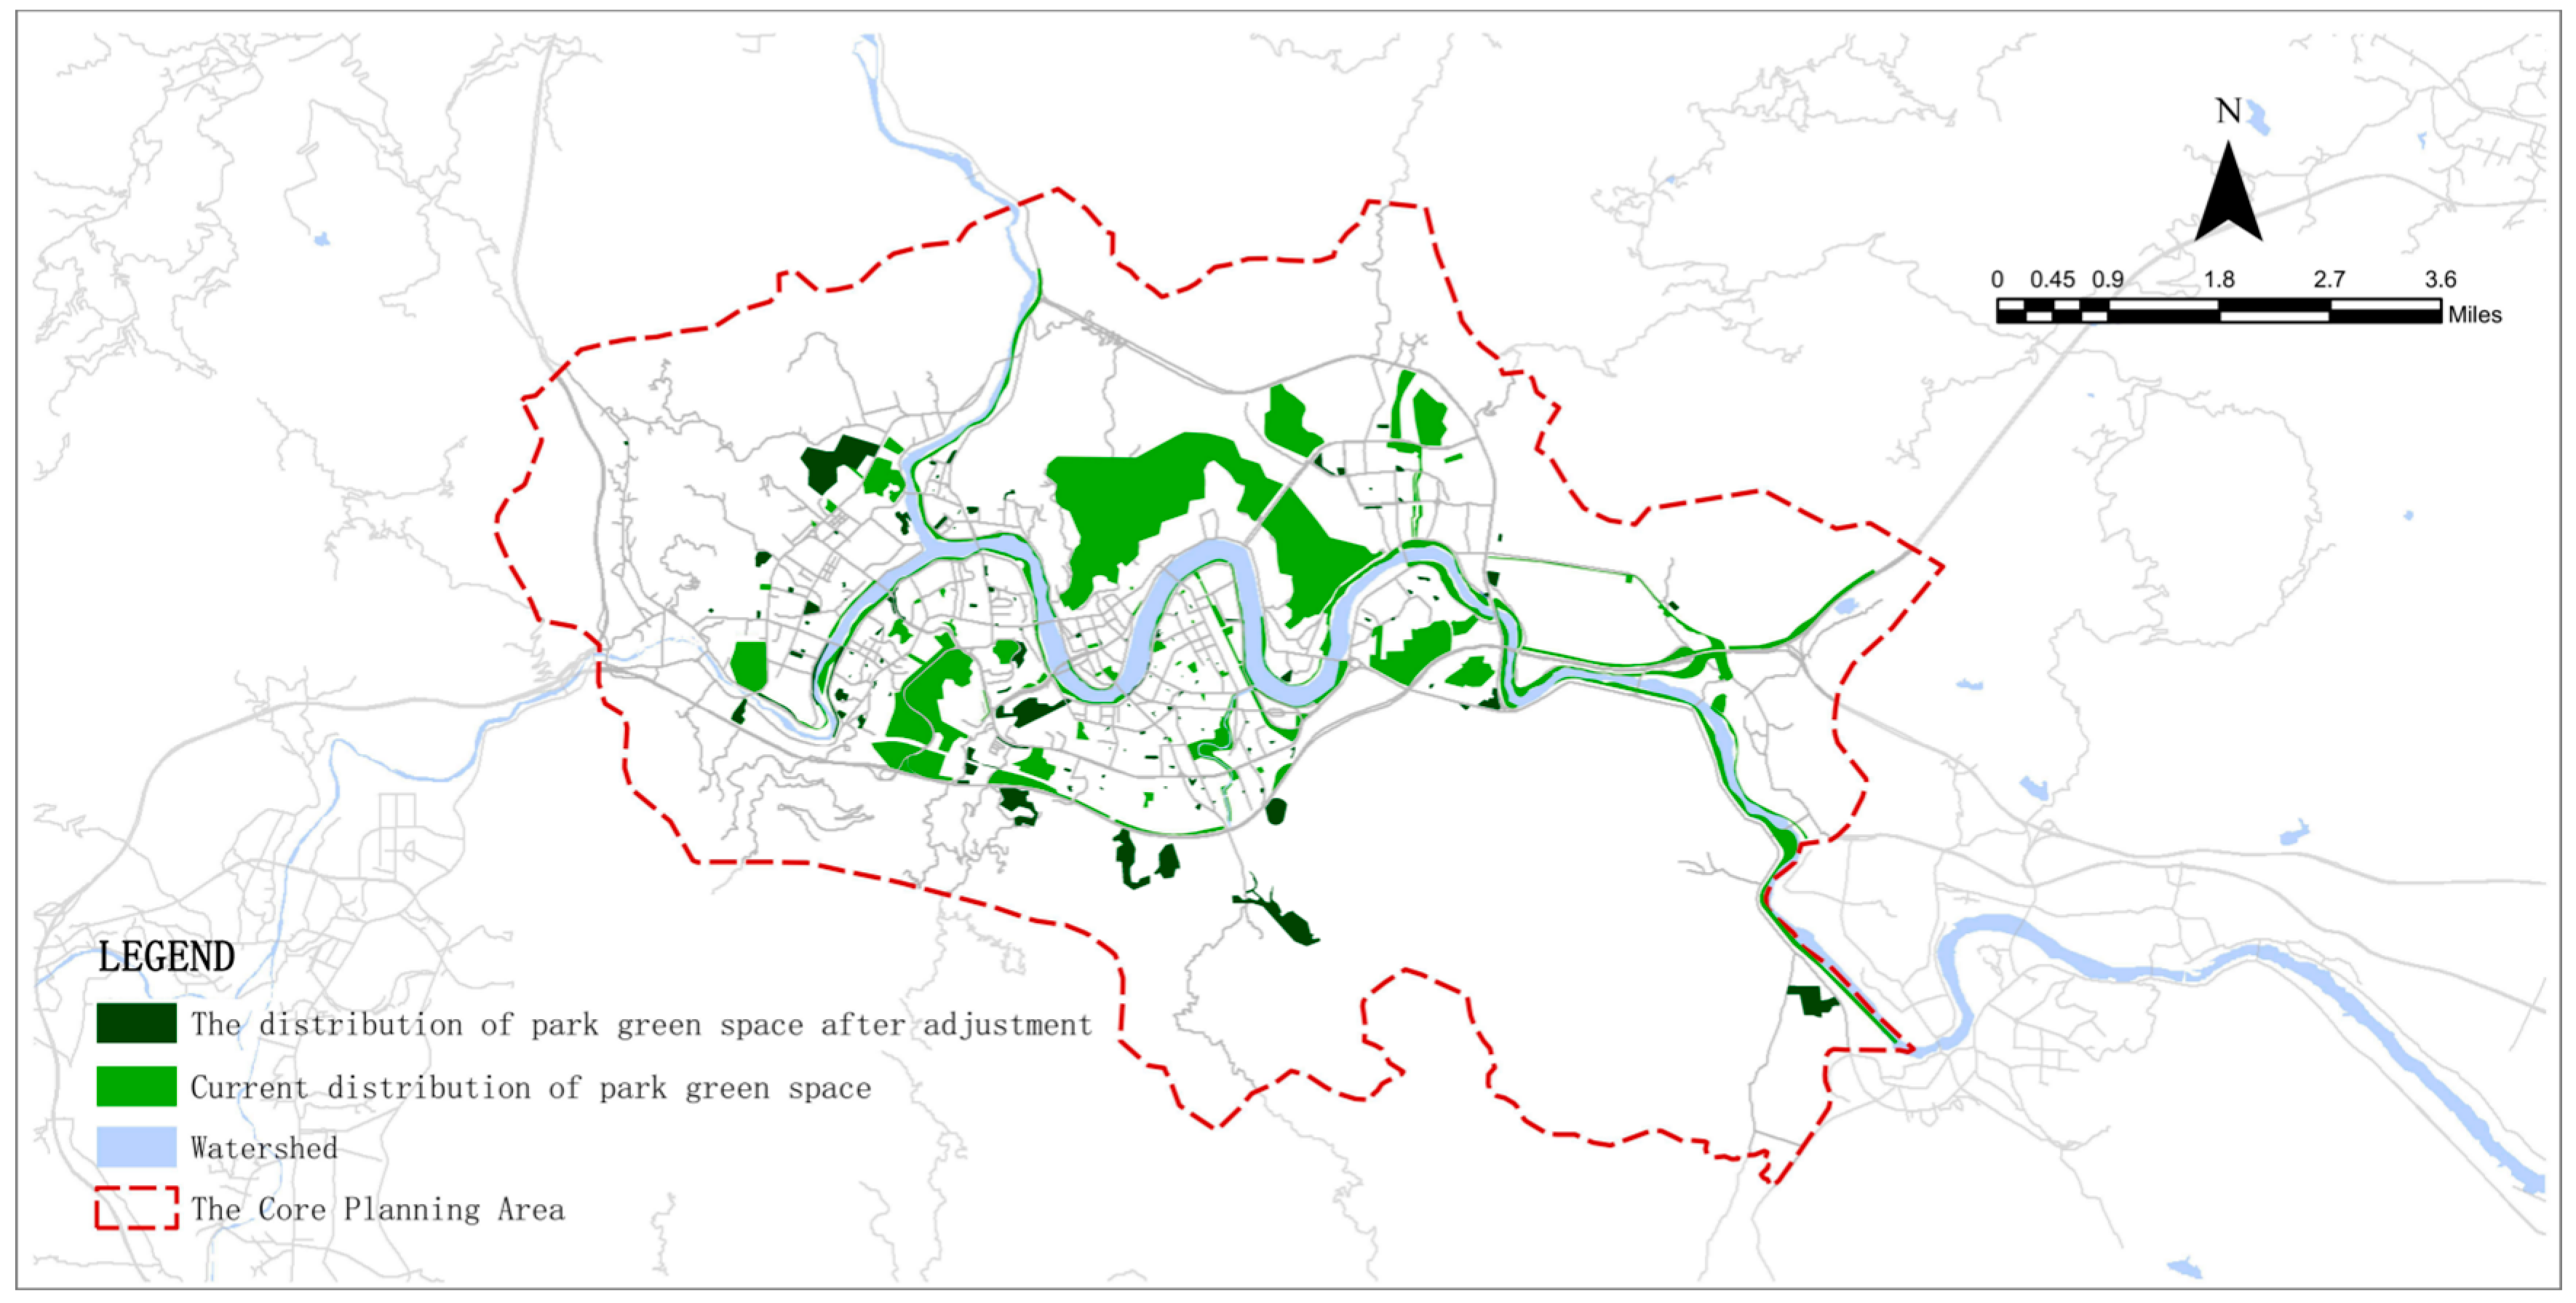
2.2.2. Data on Park Green Spaces Before and After Adjustments and Additions
2.2.3. POIs Categorized as Parks
2.2.4. Wind Speed Data
2.2.5. Road Data
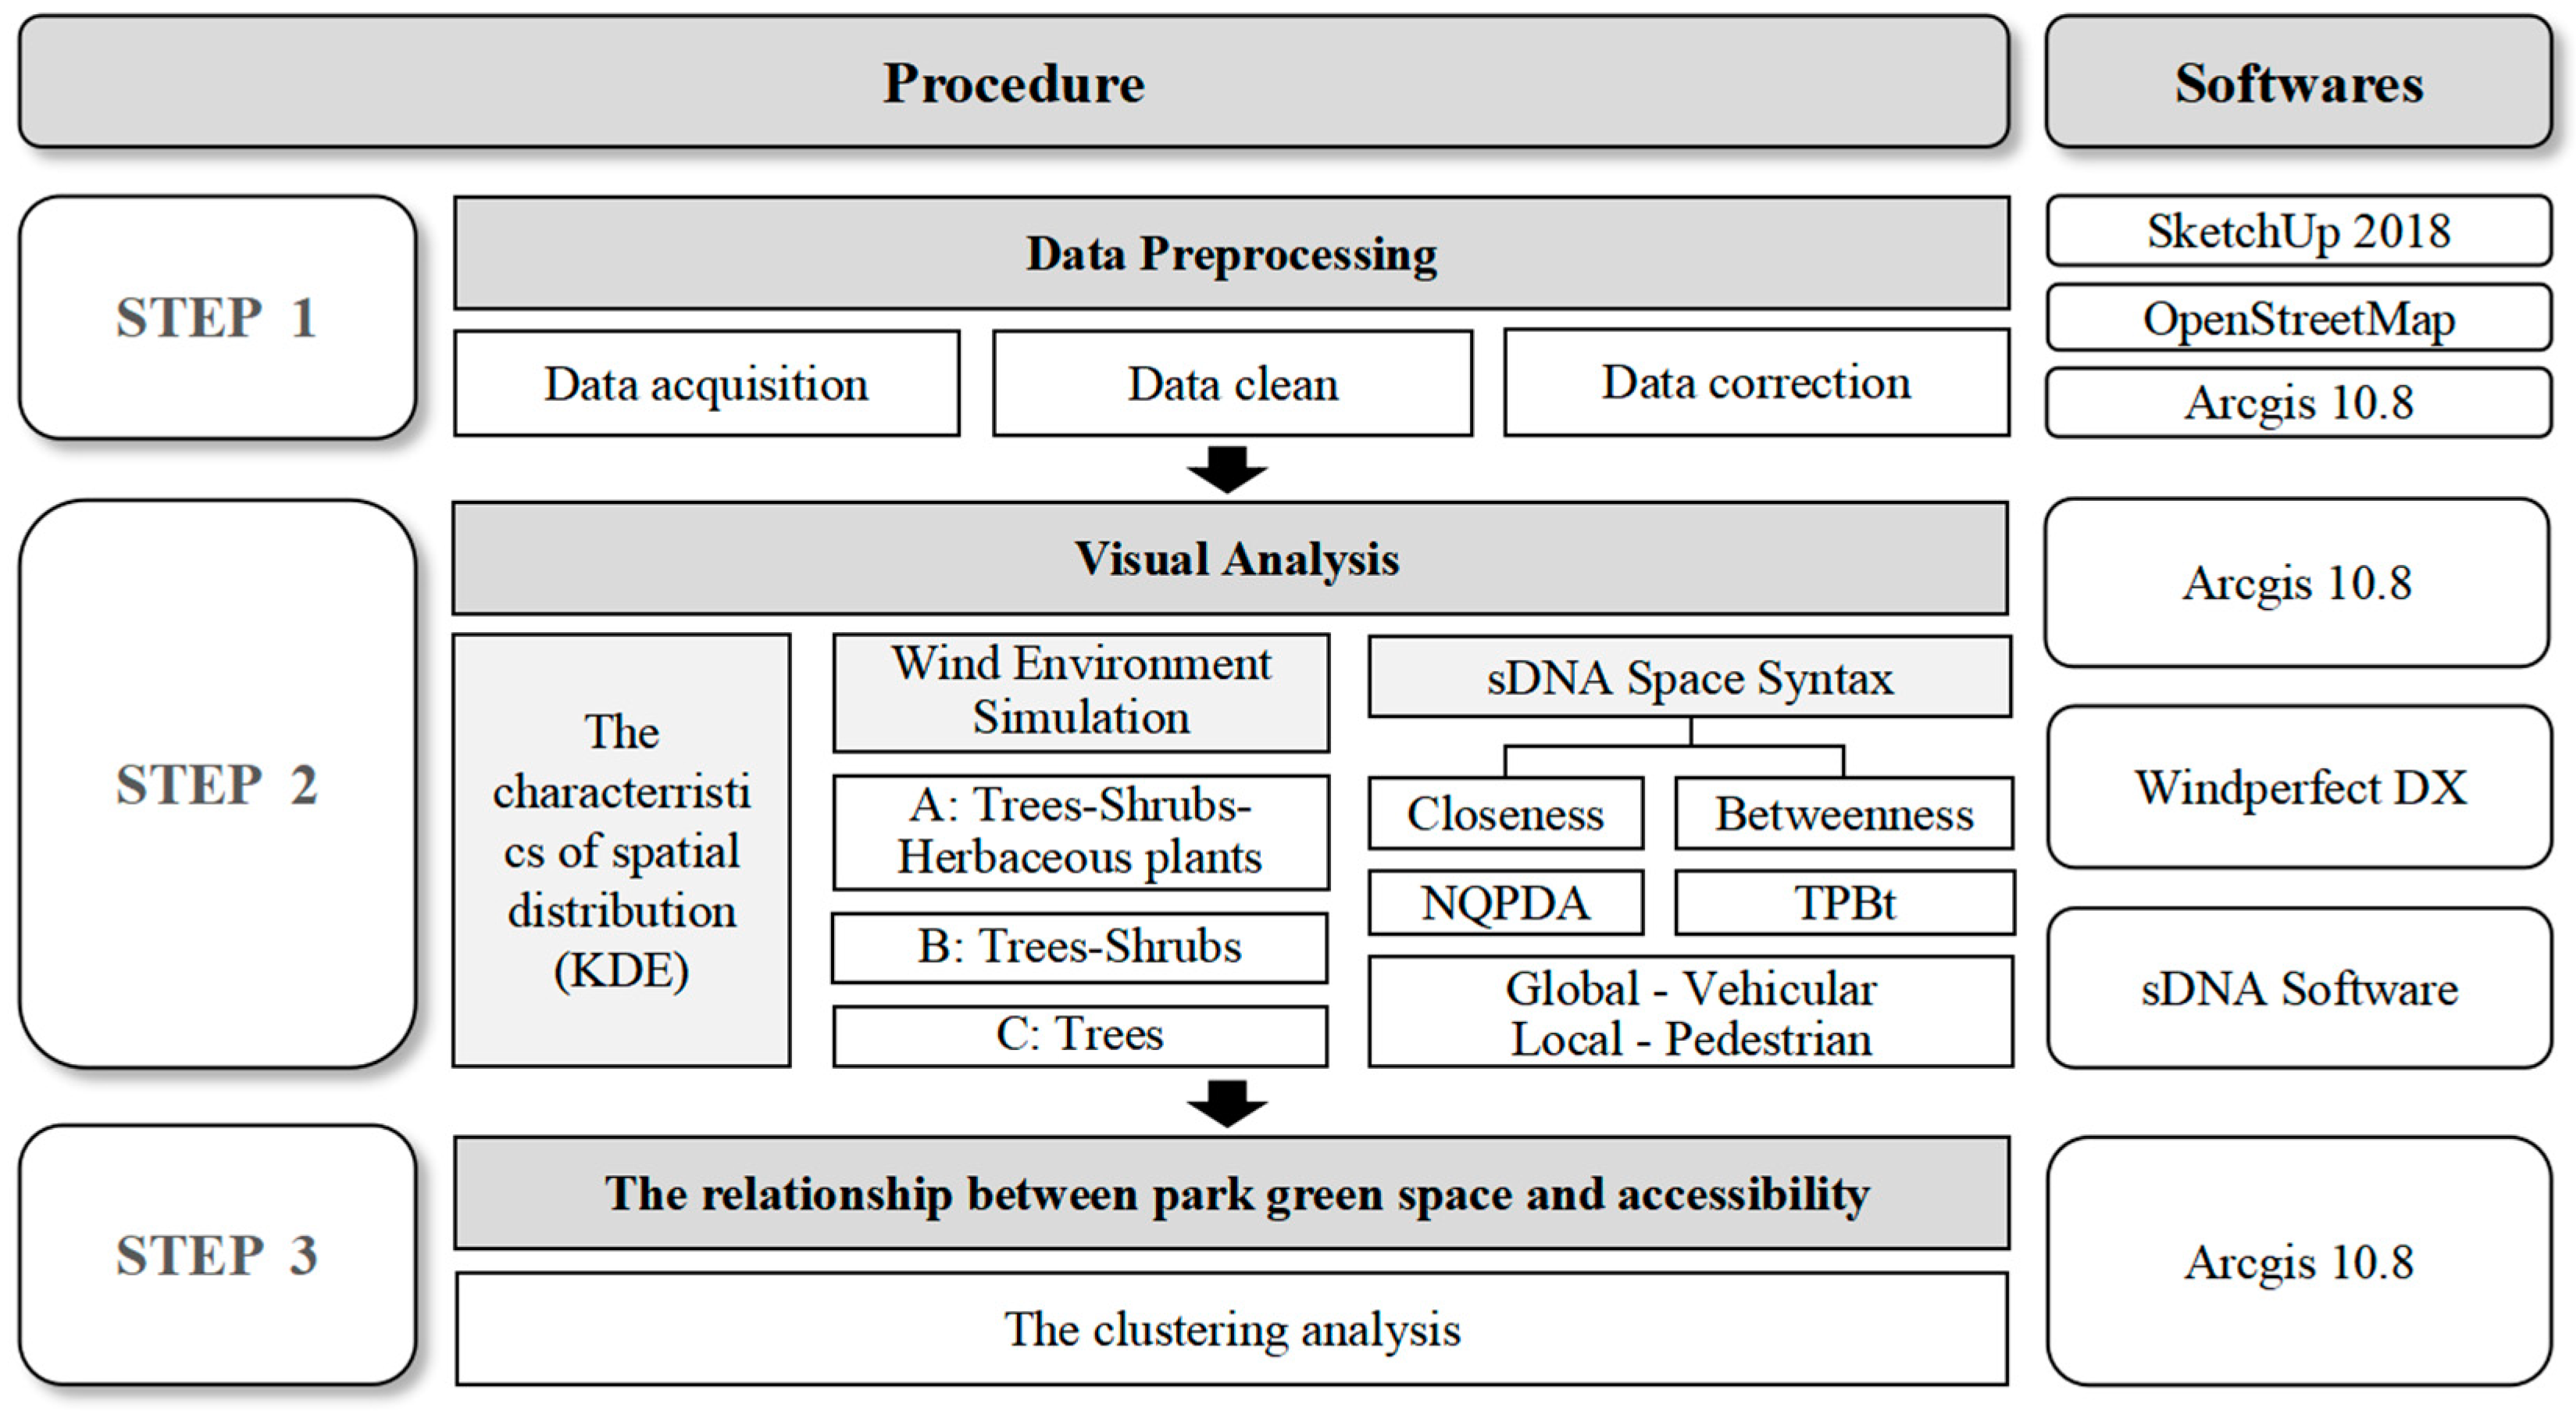
2.3. Procedure
2.3.1. Partition
2.3.2. Kernel Density Analysis of Park Green Space
2.3.3. Wind Environment Simulation
2.3.4. Quantification of Wind Environment Simulation Results
2.3.5. Accessibility Analysis of Park Green Space Based on sDNA Space Syntax
2.3.6. Moran’s I Index Analysis
2.3.7. Coupled Analysis of LISA Map and Park Green Space Kernel Density Map
2.3.8. Software
3. Results and Analysis
3.1. Kernel Density Distribution Characteristics of Park Green Space
3.2. Spatial Simulation Characteristics of Wind Environment
3.3. Accessibility Evaluation of Park Green Spaces
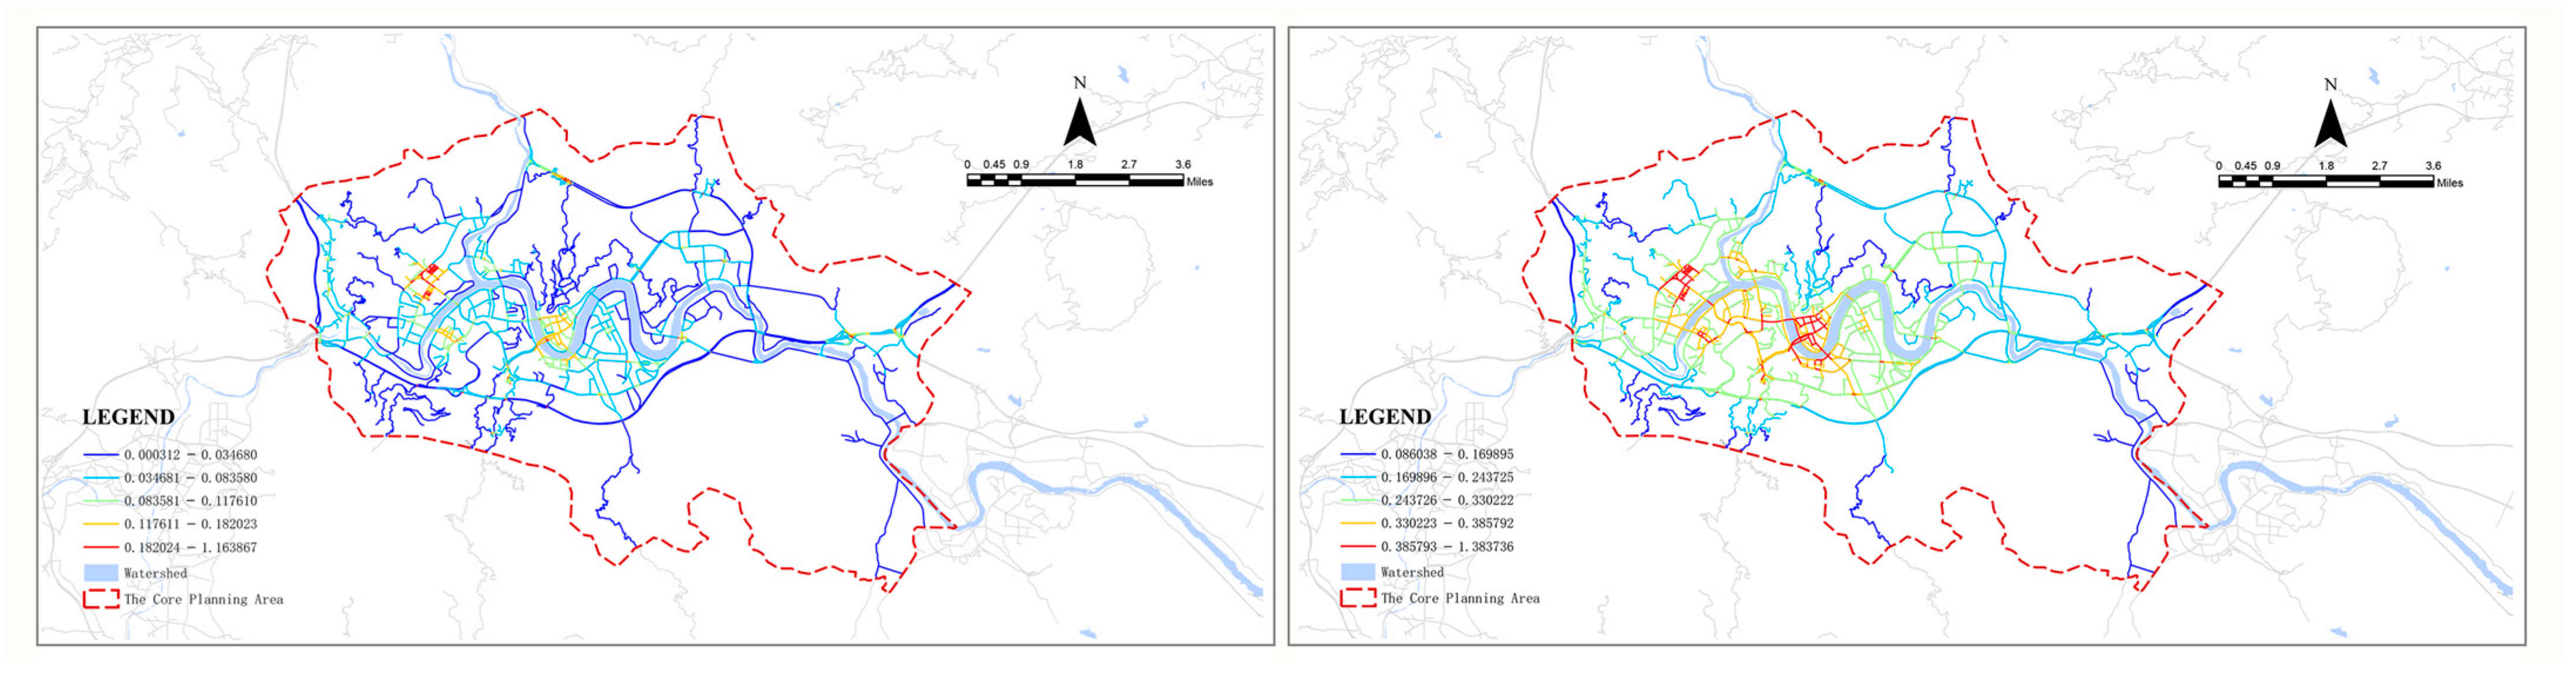
3.3.1. Closeness Evaluation
3.3.2. Betweenness Evaluation
3.4. Moran’s I Index Results Analysis
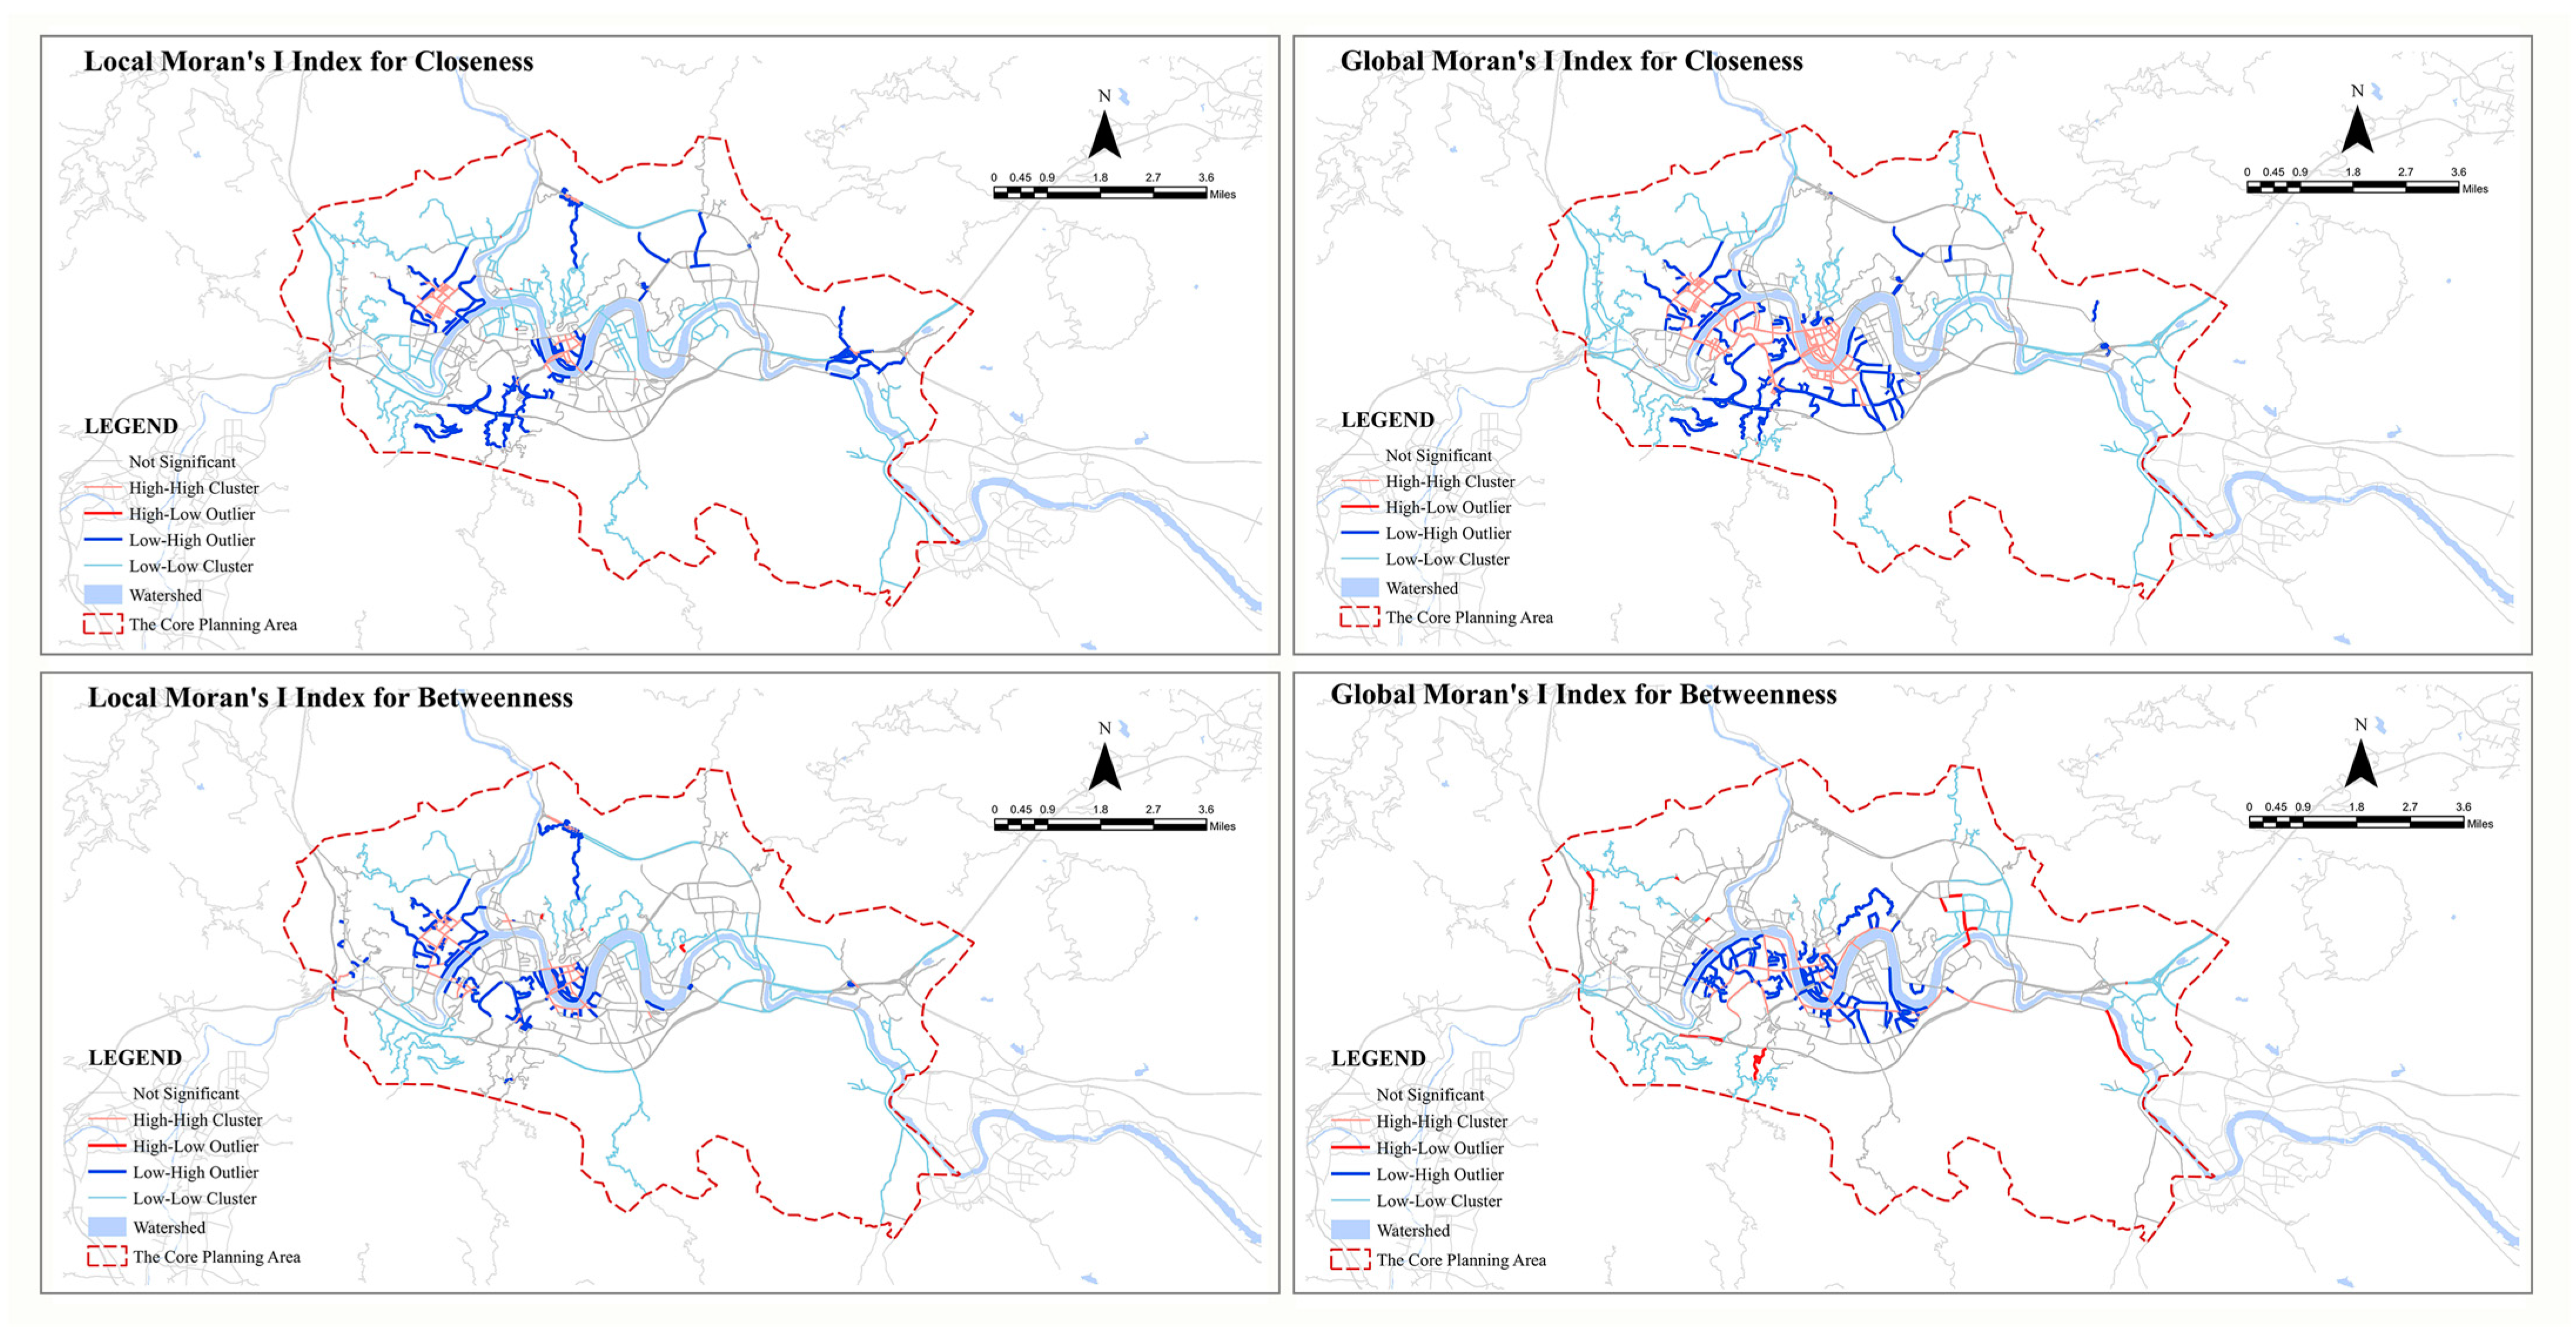
3.4.1. Global Moran’s I
3.4.2. Local Moran’s I
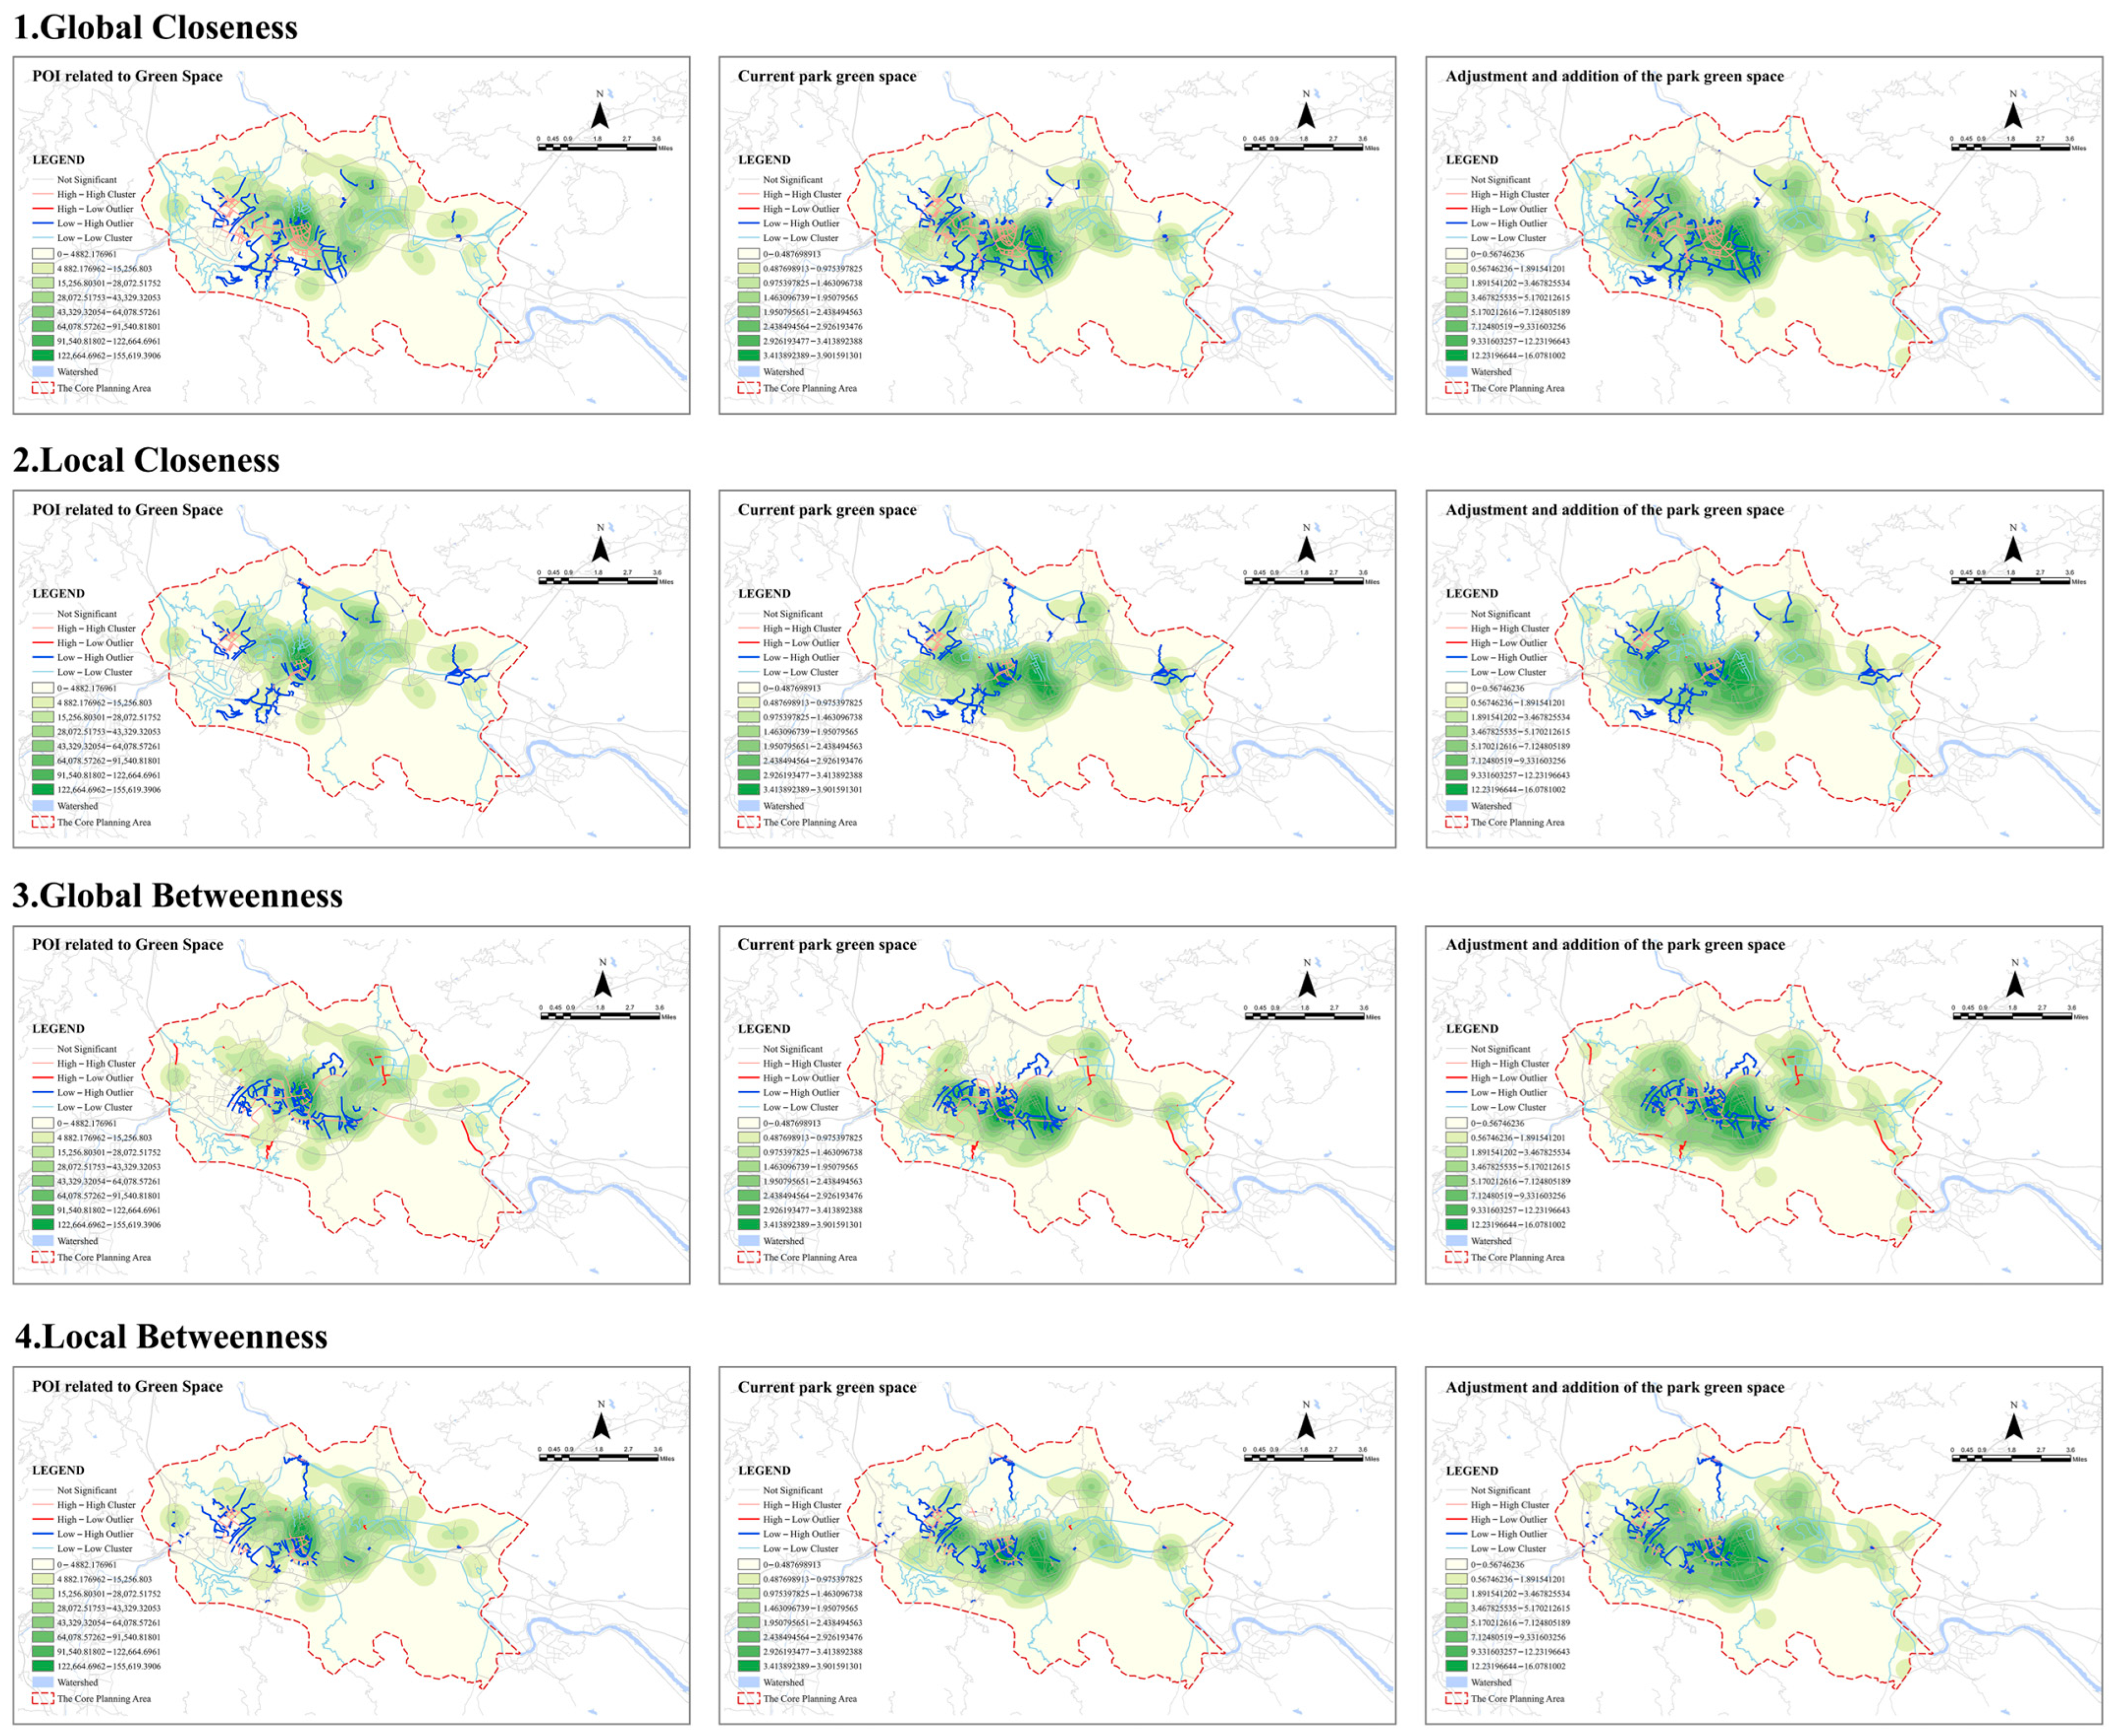
3.5. Coupling Analysis of Park Green Space Kernel Density Map with LISA Map
4. Discussion
4.1. The Impact of Urban Park Green Spaces with Different Vegetation Compositions and Structures on Urban Wind Environment
4.2. Analyzing the Accessibility of Park Green Spaces from the Perspective of Space Syntax
4.3. Optimizing the Layout of Park Green Spaces Has a Comprehensive Impact on the Urban Wind Environment and the Accessibility of Green Spaces
5. Conclusions
Author Contributions
Funding
Data Availability Statement
Conflicts of Interest
References
- Wolch, J.R.; Byrne, J.; Newell, J.P. Urban green space, public health, and environmental justice: The challenge of making cities ‘just green enough’. Landsc. Urban Plan. 2014, 125, 234–244. [Google Scholar]
- World Health Organization, Regional Office for Europe. Urban Green Spaces and Health; World Health Organization, Regional Office for Europe: Copenhagen, Denmark, 2016. [Google Scholar]
- Xiao, Y.; Wang, Z.; Li, Z.; Tang, Z. An assessment of urban park access in Shanghai—Implications for the social equity in urban China. Landsc. Urban Plan. 2017, 157, 383–393. [Google Scholar]
- Chiesura, A. The role of urban parks for the sustainable city. Landsc. Urban Plan. 2004, 68, 129–138. [Google Scholar]
- Wei, Y.-M.; Fan, Y.; Lu, C.; Tsai, H.-T. The assessment of vulnerability to natural disasters in China by using the DEA method. Environ. Impact Assess. Rev. 2004, 24, 427–439. [Google Scholar]
- Fei, W.; Lu, D.; Li, Z. Research on the layout of urban disaster-prevention and risk-avoidance green space under the improvement of supply and demand match: The case study of the main urban area of Nanjing, China. Ecol. Indic. 2023, 154, 110657. [Google Scholar]
- Liu, W.; Xu, H.; Wu, J.; Li, W.; Hu, H. Measuring spatial accessibility to refuge green space after earthquakes: A case study of Nanjing, China. PLoS ONE 2022, 17, e0270035. [Google Scholar]
- Zhai, C.; Geng, R.; Ren, Z.; Wang, C.; Zhang, P.; Guo, Y.; Hong, S.; Hong, W.; Meng, F.; Fang, N. Spatiotemporal Dynamics of Urban Green Space Coverage and Its Exposed Population under Rapid Urbanization in China. Remote Sens. 2024, 16, 2836. [Google Scholar] [CrossRef]
- Wei, Y.; Jin, L.; Xu, M.; Pan, S.; Xu, Y.; Zhang, Y. Instructions for planning emergency shelters and open spaces in China: Lessons from global experiences and expertise. Int. J. Disaster Risk Reduct. 2020, 51, 101813. [Google Scholar]
- Pandey, R.S.; Liou, Y.-A. Typhoon strength rising in the past four decades. Weather Clim. Extrem. 2022, 36, 100446. [Google Scholar] [CrossRef]
- Hu, K.; Wang, R.; Xu, J.; Constantinescu, C.; Chen, Y.; Ling, C. Extreme analysis of typhoons disaster in mainland China with insurance management. Int. J. Disaster Risk Reduct. 2024, 106, 104411. [Google Scholar]
- Wu, Z.; Man, W.; Ren, Y. Influence of tree coverage and micro-topography on the thermal environment within and beyond a green space. Agric. For. Meteorol. 2022, 316, 108846. [Google Scholar] [CrossRef]
- Wong, M.S.; Nichol, J.E.; To, P.H.; Wang, J. A simple method for designation of urban ventilation corridors and its application to urban heat island analysis. Build. Environ. 2010, 45, 1880–1889. [Google Scholar] [CrossRef]
- Hsieh, C.-M.; Huang, H.-C. Mitigating urban heat islands: A method to identify potential wind corridor for cooling and ventilation. Comput. Environ. Urban Syst. 2016, 57, 130–143. [Google Scholar] [CrossRef]
- Hsieh, C.-M.; Jan, F.-C.; Zhang, L. A simplified assessment of how tree allocation, wind environment, and shading affect human comfort. Urban For. Urban Green. 2016, 18, 126–137. [Google Scholar] [CrossRef]
- Zheng, S.; Zhao, L.; Li, Q. Numerical simulation of the impact of different vegetation species on the outdoor thermal environment. Urban For. Urban Green. 2016, 18, 138–150. [Google Scholar] [CrossRef]
- Lin, H.; Hong, X.-C.; Wen, C.; Hu, F. The historical sensing of urban forest based on the indicators of CES and landscape categories: A case of Kushan scenic area in CHINA. Ecol. Indic. 2024, 166, 112440. [Google Scholar] [CrossRef]
- Cao, X.; Akio, O.; Jin, C.; Hidefumi, I. Quantifying the cool island intensity of urban parks using ASTER and IKONOS data. Landsc. Urban Plan. 2010, 96, 224–231. [Google Scholar] [CrossRef]
- Luo, W.; Wang, F. Measures of Spatial Accessibility to Healthcare in a GIS Environment: Synthesis and a Case Study in Chicago Region. Environ. Plann B Plann Des 2003, 30, 865–884. [Google Scholar] [CrossRef]
- Oh, K.; Jeong, S. Assessing the spatial distribution of urban parks using GIS. Landsc. Urban Plan. 2007, 82, 25–32. [Google Scholar]
- Hansen, W.G. How Accessibility Shapes Land Use. J. Am. Inst. Plan. 1959, 25, 73–76. [Google Scholar] [CrossRef]
- Páez, A.; Scott, D.M.; Morency, C. Measuring accessibility: Positive and normative implementations of various accessibility indicators. J. Transp. Geogr. 2012, 25, 141–153. [Google Scholar]
- Coombes, E.; Andrew, P.J.; Melvyn, H. The relationship of physical activity and overweight to objectively measured green space accessibility and use. Soc. Sci. Med. 2010, 70, 816–822. [Google Scholar] [PubMed]
- Kabisch, N.; Qureshi, S.; Haase, D. Human–environment interactions in urban green spaces—A systematic review of contemporary issues and prospects for future research. Environ. Impact Assess. Rev. 2015, 50, 25–34. [Google Scholar]
- Li, X.; Xiu, C.; Wei, Y.; He, H.S. Evaluating Methodology for the Service Extent of Refugee Parks in Changchun, China. Sustainability 2020, 12, 5715. [Google Scholar] [CrossRef]
- Liu, W.; Xu, H.; Wu, J.; Li, W.; Hu, H. Evaluation of green space accessibility of Shenyang using Gaussian based 2-step floating catchment area method. Prog. Geogr. 2014, 33, 479–487. [Google Scholar]
- Ren, J.; Wang, Y. Spatial accessibility of park green space in Huangpu District of Shanghai based on modified two-step floating catchment area method. Prog. Geogr. 2021, 40, 774–783. [Google Scholar]
- Kmail, A.B.; Onyango, V. A GIS-based assessment of green space accessibility: Case study of Dundee. Appl. Geomat. 2020, 12, 491–499. [Google Scholar]
- Kabisch, N.; Strohbach, M.; Haase, D.; Kronenberg, J. Urban green space availability in European cities. Ecol. Indic. 2016, 70, 586–596. [Google Scholar]
- Li, X.; Lyu, Z.; Zheng, Z.; Zhong, C.; Hijazi, I.H.; Cheng, S. Assessment of lively street network based on geographic information system and space syntax. Multimed. Tools Appl. 2017, 76, 17801–17819. [Google Scholar]
- Zhang, Q.; Xie, S.; Wang, X.; Jiang, L.; Gu, H.; Liu, D. Evaluation on the Accessibility of the Scenic Spots in Wuhan Based on the Spatial Syntax. Econ. Geogr. 2015, 35, 200–208. [Google Scholar]
- Ma, F. Spatial equity analysis of urban green space based on spatial design network analysis (sDNA): A case study of central Jinan, China. Sustain. Cities Soc. 2020, 60, 102256. [Google Scholar]
- Zhao, Y.; Qin, M.; Shi, Q. The Accessibility Analysis of Urban Park Green Space Based on Spatial Syntax: Taking the Central City of Guangzhou as an Example. Geomat. World 2022, 29, 40–45. [Google Scholar]
- Hao, W.; Lin, A.; Xing, X.; Song, D.; Li, Y. Identifying core driving factors of urban land use change from global land cover products and POI data using the random forest method. Int. J. Appl. Earth Obs. Geoinf. 2021, 103, 102475. [Google Scholar]
- Guo, L.-H.; Cheng, S.; Liu, J.; Wang, Y.; Cai, Y.; Hong, X.-C. Does social perception data express the spatio-temporal pattern of perceived urban noise? A case study based on 3,137 noise complaints in Fuzhou, China. Appl. Acoust. 2022, 201, 109129. [Google Scholar]
- Liu, P.; Zhu, B. Temporal-spatial evolution of green total factor productivity in China’s coastal cities under carbon emission constraints. Sustain. Cities Soc. 2022, 87, 104231. [Google Scholar]
- Zhao, Z.; Zhang, S.; Peng, Y. The Role of Ecological Wisdom in Architectural Heritage: A Case Study based on Wind Environment of Architectural Complex in BaiLuDong Academy. South Archit. 2023, 49–57. Available online: https://nfjz.arch.scut.edu.cn/EN/10.3969/j.issn.1000-0232.2023.12.006 (accessed on 8 February 2025).
- Cooper, C. Spatial Design Network Analysis (sDNA) Version 4.1 Manual. Cardiff University. 2024. Available online: https://sdna-plus.readthedocs.io/en/latest/ (accessed on 8 February 2025).
- Ministry of Housing and Urban–Rural Development of the People’s Republic of China. Urban Residential Area Planning and Design Standard (GB 50180–2018); China Architecture & Building Press: Beijing, China, 2018. [Google Scholar]
- Feng, F.; Yang, X.; Jia, B.; Li, X.; Li, X.; Xu, C.; Wang, K. Variability of urban fractional vegetation cover and its driving factors in 328 cities in China. Sci. China Earth Sci. 2024, 67, 466–482. [Google Scholar]
- Wu, S.; Yao, X.; Qu, Y.; Chen, Y. Ecological Benefits and Plant Landscape Creation in Urban Parks: A Study of Nanhu Park, Hefei, China. Sustainability 2023, 15, 16553. [Google Scholar] [CrossRef]
- Wang, Y. Simulation and Design Strategy Analysis of Spatial Climate Adaptability of Zijingshan Park in Zhengzhou City; Henan Agricultural University: Zhengzhou, China, 2023. [Google Scholar]
- Hsieh, C.-M.; Aramaki, T.; Hanaki, K. Managing heat rejected from air conditioning systems to save energy and improve the microclimates of residential buildings. Computers Environ. Urban Syst. 2011, 35, 358–367. [Google Scholar]
- Scheffer, M.; Remi, V.; Cornelissen, J.H.C.; Hantson, S.; Holmgren, M.; Nes, E.H.; Xu, C. Why trees and shrubs but rarely trubs? Trends Ecol. Evol. 2014, 29, 433–434. [Google Scholar]
- Zhao, J.; Ouyang, Z.; Zheng, H.; Zhou, W.; Wang, X.; Xu, W.; Ni, Y. Plant species composition in green spaces within the built-up areas of Beijing, China. Plant Ecol. 2010, 209, 189–204. [Google Scholar]
- Lee, D.-H.; Kil, S.-H.; Lee, S.-B. A Study on Obtaining Tree Data from Green Spaces in Parks Using Unmanned Aerial Vehicle Images: Focusing on Mureung Park in Chuncheon. J. People Plants Environ. 2021, 24, 441–450. [Google Scholar]
- Mochida, A.; Lun, I.Y.F. Prediction of wind environment and thermal comfort at pedestrian level in urban area. J. Wind Eng. Ind. Aerodyn. 2008, 96, 1498–1527. [Google Scholar]
- Hsieh, C.-M.; Chen, H.; Ooka, R.; Yoon, J.; Kato, S.; Miisho, K. Simulation analysis of site design and layout planning to mitigate thermal environment of riverside residential development. Build. Simul. 2010, 3, 51–61. [Google Scholar]
- Xing, S.; Zhu, Y.; Duan, J.; Shao, R.; Wang, J. Assessment of pedestrian wind environment in urban planning design. Landsc. Urban Plan. 2015, 140, 17–28. [Google Scholar]
- Chu, S.; Xu, W.; Zhang, D.; Lin, J.; Liu, J.; Liu, S.; Hong, X.-C. Urban Blue-Green Spaces and tranquility: A comprehensive review of noise reduction and sensory perception integration. J. Asian Archit. Build. Eng. 2025, 1–22. [Google Scholar]
- Nicholls, S. Measuring the accessibility and equity of public parks: A case study using GIS. Manag. Leis. 2001, 6, 201–219. [Google Scholar]
- Karen, S.; Hewko, J.; Hodgson, M. Spatial accessibility and equity of playgrounds in Edmonton, Canada. Can. Geogr./Le Géographe Can. 2004, 48, 287–302. [Google Scholar]
- Çetin, M. Using GIS analysis to assess urban green space in terms of accessibility: Case study in Kutahya. Int. J. Sustain. Dev. World Ecol. 2015, 22, 1–5. [Google Scholar]
- Jennings, V.; Gaither, C. Promoting Environmental Justice Through Urban Green Space Access: A Synopsis. Environ. Justice 2012, 5, 1–7. [Google Scholar]
- Feng, L.; Wang, J.; Liu, B.; Hu, F.; Hong, X.; Wang, W. Does Urban Green Space Pattern Affect Green Space Noise Reduction? Forests 2024, 15, 1719. [Google Scholar] [CrossRef]
- Ye, C.; Hu, L.; Li, M. Urban green space accessibility changes in a high-density city: A case study of Macau from 2010 to 2015. J. Transp. Geogr. 2018, 66, 106–115. [Google Scholar] [CrossRef]
- Wu, H.; Liu, L.; Yu, Y.; Peng, Z. Evaluation and Planning of Urban Green Space Distribution Based on Mobile Phone Data and Two-Step Floating Catchment Area Method. Sustainability 2018, 10, 214. [Google Scholar] [CrossRef]
- Nutsford, D.; Pearson, A.L.; Kingham, S. An ecological study investigating the association between access to urban green space and mental health. Public Health 2013, 127, 1005–1011. [Google Scholar] [CrossRef]
- Ren, W.; Lu, P.; Hong, X. Understanding the association between urban noise and nighttime light in China. Sci. Rep. 2024, 14, 31472. [Google Scholar] [CrossRef]
- Richardson, E.; Pearce, J.; Mitchell, R.; Kingham, S. Role of physical activity in the relationship between urban green space and health. Public Health 2013, 127, 318–324. [Google Scholar] [CrossRef]
- Güngör, S.; Arısoy, N. The use of city parks as assembly areas after natural disasters: The case of karatay city park. In Proceedings of the II. International Conference on Sustainable Cities and Urban Landscapes: Re-Thinking The Future of The Cities and Urban Landscapes, Konya, Turkiye, 26–27 October 2023; pp. 306–315. [Google Scholar]
- Ricci, A.; Guasco, M.; Caboni, F.; Orlanno, M.; Giachetta, A.; Repetto, M. Impact of surrounding environments and vegetation on wind comfort assessment of a new tower with vertical green park. Build. Environ. 2021, 207, 108409. [Google Scholar] [CrossRef]
- Blocken, B.; Stathopoulos, T. CFD simulation of pedestrian-level wind conditions around buildings: Past achievements and prospects. J. Wind Eng. Ind. Aerodyn. 2013, 121, 138–145. [Google Scholar] [CrossRef]
- Murakami, S.; Ooka, R.; Mochida, A.; Yoshida, S.; Kim, S. CFD analysis of wind climate from human scale to urban scale. J. Wind Eng. Ind. Aerodyn. 1999, 81, 57–81. [Google Scholar] [CrossRef]
- Blocken, B. 50 years of Computational Wind Engineering: Past, present and future. J. Wind Eng. Ind. Aerodyn. 2014, 129, 69–102. [Google Scholar] [CrossRef]
- Zhuang, Z.; Hsieh, C.-M.; Wang, B. Evaluation of exhaust performance of cooling towers in a super high-rise building: A case study. Build. Simul. 2015, 8, 179–188. [Google Scholar]
- Hsieh, C.-M.; Ni, M.C.; Tan, H. Optimum wind environment design for pedestrians in transit-oriented development planning. J. Environ. Prot. Ecol. 2014, 15, 1385–1392. [Google Scholar]
- Lin, H.; Wang, J.B.; Zhang, X.; Hu, F.B.; Liu, J.; Hong, X.C. Historical sensing: The spatial pattern of soundscape occurrences recorded in poems between the Tang and the Qing Dynasties amid urbanization. Humanit. Soc. Sci. Commun. 2024, 11, 730. [Google Scholar]
- Jan, F.-C.; Hsieh, C.-M.; Ishikawa, M.; Sun, Y.-H. The Influence of Tree Allocation and Tree Transpiration on the Urban Microclimate: An Analysis of a Subtropical Urban Park. Environ. Urban. Asia 2013, 4, 135–150. [Google Scholar]


| Global Moran’s I Analysis | Moran’s I | z-Values | |
|---|---|---|---|
| Overall | Closeness | 1.041429 | 67.595648 |
| Betweenness | 0.218508 | 14.197220 | |
| Locality | Closeness | 1.216339 | 79.083934 |
| Betweenness | 0.110657 | 7.237766 | |
Disclaimer/Publisher’s Note: The statements, opinions and data contained in all publications are solely those of the individual author(s) and contributor(s) and not of MDPI and/or the editor(s). MDPI and/or the editor(s) disclaim responsibility for any injury to people or property resulting from any ideas, methods, instructions or products referred to in the content. |
© 2025 by the authors. Licensee MDPI, Basel, Switzerland. This article is an open access article distributed under the terms and conditions of the Creative Commons Attribution (CC BY) license (https://creativecommons.org/licenses/by/4.0/).
Share and Cite
Zhang, D.-Y.; Yang, L.; Feng, L.-Y.; Liu, J.; Hong, X.-C. Optimizing Green Spaces Significantly Improves Wind Environment and Accessibility in County Towns. Land 2025, 14, 730. https://doi.org/10.3390/land14040730
Zhang D-Y, Yang L, Feng L-Y, Liu J, Hong X-C. Optimizing Green Spaces Significantly Improves Wind Environment and Accessibility in County Towns. Land. 2025; 14(4):730. https://doi.org/10.3390/land14040730
Chicago/Turabian StyleZhang, Dan-Yin, Ling Yang, Li-Yi Feng, Jiang Liu, and Xin-Chen Hong. 2025. "Optimizing Green Spaces Significantly Improves Wind Environment and Accessibility in County Towns" Land 14, no. 4: 730. https://doi.org/10.3390/land14040730
APA StyleZhang, D.-Y., Yang, L., Feng, L.-Y., Liu, J., & Hong, X.-C. (2025). Optimizing Green Spaces Significantly Improves Wind Environment and Accessibility in County Towns. Land, 14(4), 730. https://doi.org/10.3390/land14040730