Abstract
With the global increase in disaster risks, enhancing urban resilience has become a critical strategy for risk mitigation and sustainable development. This study develops a two-dimensional indicator framework based on urban systems and resilience capacity from the perspective of the disaster management cycle and applies an improved CRITIC-TOPSIS method to evaluate the resilience levels of the Chengdu–Chongqing urban agglomeration, China. The spatiotemporal evolution of urban resilience from 2010 to 2022 is systematically examined. Furthermore, the dynamics of urban resilience transitions are investigated using a spatial Markov chain model, and the driving factors behind the spatial distribution of resilience are explored through the Geo-detector method. The results indicate the following: (1) Comprehensive resilience demonstrated a steady upward trend during the study period, with Chengdu and Chongqing, as core cities, driving regional resilience improvement and reducing disparities within the urban agglomeration. (2) Significant spatial heterogeneity was observed in the distribution of the comprehensive resilience index and the indices of individual resilience dimensions. (3) The Markov chain analysis revealed a distinct “club convergence” pattern in the dynamic transitions of resilience levels, with development trends closely tied to spatial factors. (4) The Geo-detector model analysis highlighted that infrastructure development and technological innovation exert long-term and substantial impacts on resilience improvement. These findings provide valuable insights for enhancing resilience and promoting sustainable development in the Chengdu–Chongqing region and other similar urban systems.
1. Introduction
Systemic risks caused by disasters have become a significant threat to global economic and social development. In the 21st century, the frequency and intensity of reported natural disasters worldwide have been steadily increasing [1]. In particular, recent years have witnessed climate change-induced shifts in temperature and precipitation patterns, which have escalated the frequency and severity of extreme weather events such as hurricanes, floods, and heatwaves [2]. These escalating disaster scenarios have imposed substantial losses on global socioeconomic systems. Over the past decade, the economic impact of natural disasters has shown a marked upward trend [3]. For instance, in 2021 alone, natural disasters resulted in an estimated $280 billion in global economic losses and posed severe threats to the safety and livelihoods of millions. Simultaneously, rapid urbanization has further amplified urban vulnerability [4,5]. Although urbanization is often perceived as a driver of economic growth [6], it has also exacerbated issues such as resource scarcity and environmental degradation, thereby contributing to elevated disaster risks [7,8,9]. Additionally, the heightened concentration of economic activities and population in cities, coupled with the growing complexity of urban systems, has significantly increased disaster exposure and potential losses. Recognizing that urbanization and climate change are interlinked processes underscores the need for integrated solutions and proactive management. These intertwined challenges span multiple scales, calling for coordinated strategies to enhance resilience and promote sustainable development.
In this context, traditional reactive strategies focused on disaster relief and recovery are increasingly regarded as costly and inefficient [10,11,12]. Strengthening urban resilience has gradually emerged as a critical approach to tackling these risks and challenges. The Sendai Framework for Disaster Risk Reduction identifies “Investing in disaster risk reduction for resilience” as one of its four priority actions [13]. At the same time, there is an alignment between disaster risk reduction and sustainable development [14], with resilience-building playing a vital role in achieving the Sustainable Development Goals (SDGs) [15]. At its core, resilience-building aims to enhance the capacity of cities and their populations to cope with systemic shocks and long-term stresses [12], emphasizing sustainable development through transformative post-disaster changes. In contrast to traditional reactive approaches centered on post-disaster relief and reconstruction, resilience-oriented approaches prioritize proactive prevention, adaptive management during disasters, and the upgrading of systems in the aftermath [16,17].
It is explicitly mandated by Sustainable Development Goal 11 that inclusive, safe, resilient, and sustainable cities and human settlements be developed. It is recognized that urban resilience constitutes the critical foundation for achieving this goal, since only resilient cities are capable of reducing casualties, economic losses, and infrastructure damage during disasters, thus ensuring sustainable long-term growth [18]. In light of escalating challenges posed by climate change and increasingly frequent extreme weather events, it is essential that urban resilience be enhanced so that cities may adapt to and mitigate these risks [19], thereby facilitating rapid recovery from disasters—such as floods and earthquakes—and safeguarding both residents’ well-being and urban economies [20]. In recent years, urban resilience has emerged as a prominent research focus. Assessing urban resilience against disasters has become a critical tool for researchers, policymakers, and urban planners in developing disaster risk management strategies [21,22,23,24]. Although current studies explore the concept and measurement of urban resilience from various perspectives, no universally accepted framework has been established. One common approach involves constructing frameworks from the perspective of urban systems. For instance, urban system-based frameworks integrate various subsystems, such as economic, social, and transportation networks, to ensure a comprehensive assessment of resilience [25,26]. Moreover, the scalability of these frameworks allows application across cities of different sizes and contexts.
From the perspective of resilience itself, it is defined as a system’s ability to resist, absorb, adapt to, and recover from hazards both efficiently and effectively [27,28]. Frameworks based on this definition often incorporate dimensions such as the resilience cycle, ecological and social diversity, redundancy, and adaptability [29,30], capturing the dynamic process of achieving resilience. Evaluation systems based on this process adopt a temporal axis to quantify a city’s capacity to respond to disturbances at different stages of an event [31,32]. Nevertheless, several issues require further exploration. First, recent studies on resilience have shifted the focus from “bouncing back” to “bouncing forward”, emphasizing the capacity to learn from past events and adapt to future uncertainties [33]. Despite these advancements, most existing frameworks remain confined to the “bouncing back” perspective, focusing primarily on dimensions such as resistance, absorption, and recovery [29], while insufficiently addressing elements of “bouncing forward”, such as anticipation and transformation [30]. Second, resilience assessments should address essential questions concerning a system’s preparedness, disturbance absorption, response effectiveness, and adaptability to new conditions [34]. Evaluating resilience solely from the perspective of urban systems fails to capture capabilities throughout the disaster management cycle. Moreover, temporal and spatial dimensions play a crucial role in discussions of resilience [27,35]. Although many studies highlight static evaluations of resilience levels and spatial-temporal variations, they often lack in-depth investigation into dynamic transitions and driving factors. This gap limits the development of comprehensive strategies for long-term disaster risk management and resilience enhancement.
Based on the above context, this study focuses on the Chengdu–Chongqing urban agglomeration, China, and develops a resilience evaluation index system grounded in urban systems and resilience capacities. It systematically measures and analyzes the evolution of resilience in this region from 2010 to 2022, exploring the dynamic transitions of resilience and their driving factors. This study makes the following marginal contributions:
- It defines resilience from the “bouncing forward” perspective and identifies corresponding resilience capacities at each stage of the disaster management.
- Unlike predominantly one-dimensional frameworks for urban resilience, this study integrates urban systems (economic, social, infrastructure, and environmental subsystems) with multiple resilience capacities (preparedness, absorptive, recovery, and transformative) to construct a two-dimensional evaluation framework. This approach enhances both the scientific rigor and effectiveness of resilience assessments and our understanding of urban resilience.
- Based on an analysis of spatial and temporal differentiation in resilience, the study employs the spatial Markov chain method to reveal the dynamic evolution of resilience patterns.
- It applies the geographic detector technique to identify key factors of resilience and proposes driving mechanisms, offering policy recommendations to enhance urban resilience.
The structure of this article is organized as follows: Section 2 establishes the theoretical framework for resilience measurement. Section 3 provides an overview of the case study area, data sources, and methodologies. Section 4 presents the research findings, analyzing the spatiotemporal evolution and driving factors of urban resilience in the Chengdu–Chongqing urban agglomeration. Section 5 summarizes the results and delves into the underlying mechanisms. Section 6 concludes the study and discusses its limitations.
2. Theoretical Framework
From the viewpoints of engineering and ecological resilience, resilience primarily involves resisting and responding to shocks, with a rapid return to the pre-disturbance state [36]. This perspective, however, risks rendering systems passive and unprepared for future disasters. Consequently, current studies emphasize “bounce forward” [37,38] and “bounce back better” [13], underscoring a proactive stance that anticipates, innovates, and adapts to future uncertainties [39]. This evolving understanding integrates development, learning, and transformative capacities into the broader concept of resilience.
Many scholars refer to cities as “complex systems” [40,41,42], integrating economic, social, ecological, and other subsystems characterized by intricate mechanisms and unpredictable changes. As one of the most complex socio-ecological systems, cities have continually encountered diverse shocks and disturbances—both external and internal—since their inception [43]. Over time, the concept of resilience has been extended to urban contexts, giving rise to the notion of urban resilience. Urban resilience, in turn, is described as a highly coupled complex system comprising economic, social, institutional, and infrastructural components [44]. When a shock occurs, these subsystems function collectively to maintain the city’s structural and functional stability or to establish a new equilibrium. From a sociological perspective, urban resilience extends the concept of resilience from technical systems to social systems, emphasizing the capacity to recover from disasters while continuing to provide essential services and uphold the city’s core functions [45]. According to the Resilience Alliance, urban resilience denotes the ability of urban systems to rapidly absorb external disturbances while preserving their inherent characteristics, structure, and critical functions [46]. Mendizabald et al. add that urban resilience involves not only the capacity to absorb disturbances and maintain functionality but also the capacity to reorganize, adapt, and learn following disruptions [47]. In the Rockefeller Foundation’s global “100 Resilient Cities” initiative, urban resilience is defined as the capacity of diverse urban stakeholders to respond to, withstand, and recover from uncertainties such as natural disasters, economic crises, and social or political instability. Although the definition of urban resilience varies across studies depending on their objectives and disciplinary focus [35,48,49,50], a consensus emerges around the core principle of exploring how urban systems respond to external disturbances. Urban disaster resilience represents a more focused investigation of disaster-related issues within the broader framework of urban resilience. The United Nations Office for Disaster Risk Reduction defines disaster resilience as “the ability of individuals, communities, organizations, or countries to adapt to and recover from disaster shocks or stresses without compromising their long-term development prospects” [51].
The increasing uncertainties driven by climate change have amplified the complexity of disaster prediction and mitigation, necessitating urgent research through a comprehensive disaster management cycle approach. The assessment of urban resilience requires consideration of the diverse capacities exhibited by urban systems throughout the entire disaster cycle [52]. Disaster management constitutes a comprehensive process encompassing preparation, response, recovery, and mitigation [53]. Resilience can be strengthened by developing different capacities at each stage of disaster management [33]. Recent studies on disaster resilience emphasize the importance of self-reliance, contending that resilience should incorporate pre-disaster processes [54].
Drawing upon the classic theory of complex systems and previous research, this study partitions the urban system into four subsystems—economic, social, infrastructural, and ecological—from an urban systems perspective [55,56,57,58]. Based on the foregoing analysis, each urban subsystem is conceptualized as a disaster-bearing entity that mitigates hazards through its specific functional capacities; in other words, urban resilience is fundamentally achieved through the operational functions of the urban system. Moreover, when considering the entire process of disaster management, the urban system exhibits varying levels of resilience at different stages, which serve as indicators of overall urban resilience. Accordingly, the resilience capacity manifested by the urban system at each stage of disaster management has been defined as follows:
- Preparedness capacity: Prior to disaster onset, urban systems demonstrate the ability to plan in advance and prepare for anticipated or unforeseen disasters [59,60], such as enhancing information dissemination capability.
- Absorptive capacity: During the disaster response phase, urban systems exhibit the ability to withstand disturbances and respond without significant loss or reduction of functionality [61,62]. This capacity reflects key resilience attributes such as robustness, diversity, and redundancy.
- Recovery capacity: After the disaster, urban systems show the ability to recover either to their original state or a new equilibrium [29].
- Transformative capacity: Reflecting the concept of “bouncing forward”, this capacity targets long-term disaster mitigation by emphasizing learning, innovation, and reorganization [63]. It enables urban systems to move beyond simple adaptation, proactively preventing more severe disasters in the future.
Ultimately, a novel theoretical framework was developed based on two dimensions—urban system and resilience capacity (Figure 1)—thereby providing a comprehensive assessment of urban resilience and guiding the subsequent development of relevant indicators.
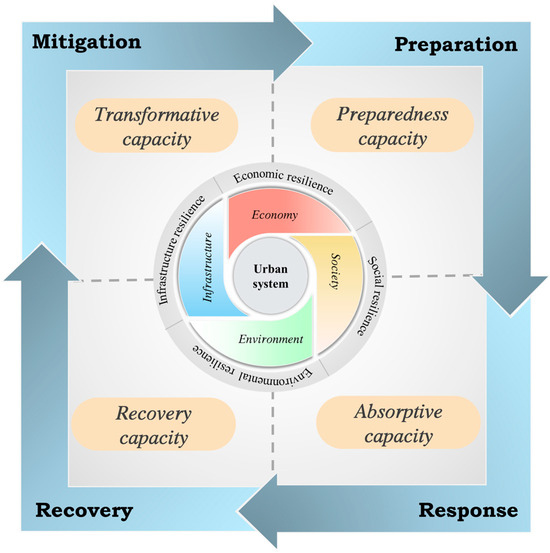
Figure 1.
The conceptual framework of urban resilience against disasters.
3. Materials and Methods
3.1. Study Area
Figure 2 shows the location map and distribution of cities in the Chengdu–Chongqing urban agglomeration. The Chengdu–Chongqing urban agglomeration, located in southwestern China, encompasses 15 cities in Sichuan Province—such as Chengdu, Zigong, Luzhou, Deyang, and Mianyang—as well as Chongqing Municipality. With a total population exceeding 100 million [64], it is recognized as the most densely populated super-large urban agglomeration in western China [65]. As a strategic nexus of the Belt and Road Initiative and the Yangtze River Economic Belt, the region has been structured around an industrial cluster dominated by automobile manufacturing, electronic information, and equipment manufacturing, with Chongqing and Chengdu serving as its two national central cities [66,67]. In recent decades, substantial investments in transportation, energy, and telecommunications have reinforced its infrastructure network [68]; for example, the area now features an extensive network of expressways, high-speed railways, and multiple airports. Nevertheless, the rugged terrain imposes constraints that elevate the construction and maintenance costs of transportation networks, utilities, and urban expansion [69].
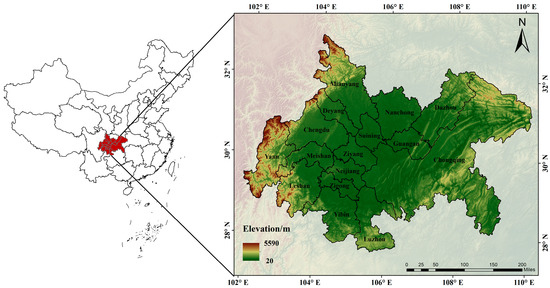
Figure 2.
The location of Chengdu–Chongqing Urban Agglomeration and a digital elevation model.
Characterized by a subtropical monsoon climate with uneven spatial and temporal distribution of precipitation, the area is further complicated by its geological features—including active fault zones, steep topography, and numerous rivers [65]—that render it particularly vulnerable to various natural disasters [70], such as flash floods, landslides triggered by heavy rainfall, and earthquakes. These environmental risks have continuously posed challenges to regional development and have necessitated the prioritization of disaster prevention, mitigation, and the construction of resilient infrastructure. Moreover, despite significant progress in economic and social development, regional imbalances persist, and the overall strength and competitiveness of the Chengdu–Chongqing urban agglomeration remain considerably lower than those of the more developed eastern regions of China [71].
Therefore, this study focuses on this region to analyze its urban resilience levels and the driving factors. On one hand, this research contributes to enhancing disaster prevention capacities and improving infrastructure adaptability. On the other hand, it provides insights into the current state and challenges of urban agglomeration development in western China. Furthermore, the findings offer specific policy recommendations for narrowing the gap with the developed regions in eastern China, boosting regional competitiveness, and achieving high-quality development.
3.2. Data Resource
Statistical and geographical data for 16 cities in the study region were collected annually from 2010 to 2022, and a panel data model was constructed. Statistical data were obtained from various sources, including the China City Statistical Yearbook (https://www.stats.gov.cn/ (accessed on 10 November 2024)), the China Urban Construction Statistical Yearbook (https://www.stats.gov.cn/ (accessed on 15 November 2024)), the Sichuan Statistical Yearbook (https://tjj.sc.gov.cn/ (10 November 2024)), the Chongqing Statistical Yearbook (https://tjj.cq.gov.cn/ (accessed on 10 November 2024)), as well as statistical yearbooks and statistical bulletins for individual cities. Topographic and geographical data were utilized for spatial analysis. The data were obtained from open-access platforms such as the Geospatial Data Cloud (http://www.gscloud.cn (accessed on 19 December 2024)). To ensure the completeness and usability of the statistical data, missing values were supplemented using interpolation methods.
3.3. Methodology
To investigate the spatiotemporal evolution mechanisms and driving factors of urban resilience in the Chengdu–Chongqing urban agglomeration, an ultimate urban resilience evaluation indicator system was first established. Subsequently, an urban resilience evaluation model was established. The improved CRITIC-TOPSIS method was developed by enhancing the fluctuation and conflict indicators in the CRITIC method through the use of the standard deviation system and absolute values, respectively, thereby enabling more accurate weight calculations. The TOPSIS method was employed to measure the resilience indices of various cities over different years. Sensitivity analysis was conducted to validate the stability of the evaluation model. GIS spatial analysis was then utilized to explore the specific changes in the spatiotemporal pattern of resilience, and a Markov chain was applied to conduct an in-depth analysis of dynamic transition trends. Furthermore, a geographic detector model was used to analyze the driving factors behind the evolution of the spatial pattern of urban resilience in the Chengdu–Chongqing region. The overall research framework is illustrated in Figure 3.

Figure 3.
The analytical framework of this research.
3.3.1. Establishment of Evaluation Indicator System of Urban Resilience
- (1)
- Initial evaluation indicator system
The first step in evaluating urban resilience is the establishment of an accurate indicator system. Therefore, building upon the theoretical framework presented in Section 2 (Figure 1), drawing on pertinent literature on urban resilience assessment, and taking into account the regional disaster context, local urban development conditions, and the feasibility of data acquisition, urban resilience in this study is categorized into four dimensions—economic, social, infrastructural, and ecological—with the following indicators selected to reflect the resilience capacities manifested at various stages of the disaster management cycle. Among these, the majority of indicators are positively associated with resilience (denoted by “+”), whereas those exerting a negative influence are indicated by “−” (Table 1).

Table 1.
The preliminary indicator set of evaluating urban resilience.
Economic resilience reflects a city’s ability to maintain stability of its economic system, absorb shocks, and continuously enhance its adaptability through adjustments in response to disasters and crises [97]. Economic tolerance indicates the preparedness of residents to mitigate the impacts of shocks [98]. A robust economic scale and self-sufficiency facilitate more effective absorption of disaster impacts. Recovery capacity is associated with factors such as economic structure and consumer willingness [99]. Increased investment in high-tech sectors fosters innovation and technological progress, thereby driving high-quality economic recovery and sustainable development [100]. Therefore, economic resilience can be measured using indicators such as economic tolerance (EC1), economic strength (EC2), food security (EC3), total retail sales of consumer goods (EC4), the proportion of the tertiary industry (EC5), fiscal revenue (EC6), and technological expenditures (EC7).
Social resilience reflects a city’s capacity to protect and maintain its social structure amid disasters or crises. It encompasses aspects related to social groups, insurance coverage, and education [96]. Broad healthcare insurance coverage mitigates health risks and associated economic burdens caused by disasters, demonstrating preparedness capacity. Disparate responses of various social groups to risk can lead to uneven resilience [79], with special attention needed for vulnerable populations. A higher number of public administration and social organization employees supports public order, emergency response, and resource allocation during disasters, thereby enhancing absorptive capacity [101]. Social security and employment expenditures provide essential financial support to affected populations, promoting recovery after disasters. Moreover, long-term indicators, such as educational levels and public safety investments, promote the transformation and upgrading of urban social systems [102,103]. Consequently, social resilience can be measured by indicators such as healthcare insurance coverage (SC1), the proportion of vulnerable populations (SC2), unemployment rate (SC3), the number of employees in public administration and social organizations (SC4), social security and employment support (SC5), educational and cultural levels (SC6), and long-term public safety expenditures (SC7).
Infrastructure resilience refers to a city’s ability to maintain normal operations or restore functionality rapidly in the face of disasters. Robust hydrological infrastructure, healthcare systems, and transportation networks significantly bolster disaster resistance [104]. The availability of emergency assets such as communication technology, urban road vehicles, and hospital beds reflects the capacity of critical infrastructure to operate effectively before, during, and after disasters [105]. Ongoing investment in the maintenance and upgrading of urban services further strengthens resilience [106]. Accordingly, infrastructure resilience can be measured using indicators such as communication capacity (IN2), the density of urban water supply or drainage pipelines (IN4/IN1), road area (IN3), the number of hospital beds (IN5), public transportation availability (IN6), and urban infrastructure investment (IN7).
Environmental resilience refers to a city’s ability to maintain stable ecological functions and recover quickly when facing natural disasters or environmental changes. As the spatial foundation for sustainable urban development, the environment encompasses both natural surroundings and urban ecological conditions [79]. Thus, it is essential to consider two key aspects: the city’s inherent natural capacity (e.g., precipitation and topographical features) and its ecological governance [107]. Effective ecological governance involves pollution control and prioritizing environmental protection alongside green economic transitions, which reinforce preparedness [108]. Adequate urban greening mitigates soil erosion, while rational crop planting improves regional food security and ecosystem stability. These factors collectively strengthen a city’s absorptive capacity against disasters and environmental changes [109,110,111]. Meanwhile, investments in environmental protection demonstrate governmental commitment to ecosystem preservation, pollution management, and risk reduction, indicating a resource allocation strategy that supports ecological balance [112]. Such investments enhance a city’s transformative capacity, laying a solid foundation for sustainable development [113]. Therefore, environmental resilience is reflected through indicators such as precipitation levels (EN1/EN2), urban green coverage ratio in built-up areas (EN3), industrial pollution (EN4), cultivated land area (EN5), terrain undulation (EN6), forest coverage (EN7), and environmental protection investment (EN8).
- (2)
- Screening of the indicator system
To minimize inaccuracies in assessment results caused by redundant information, indicators with identical or highly similar content were eliminated, retaining only those with the highest information value. This ensures that the indicator system remains accurate, clear, and free of duplication. The coefficient of variation (CV) and correlation analysis are frequently employed for indicator screening; the latter is used to eliminate indicators that reflect redundant information, as the Spearman correlation coefficient quantifies the interrelationships among indicators [114]. A greater number of redundant indicators within the system leads to more disordered evaluation outcomes. Moreover, the CV method is a statistical measure that quantifies the degree of variation in observed indicator values. A higher CV indicates greater variability in the distribution and higher information content of the indicator, thereby reflecting stronger discriminatory power of the indicator, which warrants its retention [115]. Therefore, in this study, indicators with correlation coefficients exceeding 0.8 were flagged, and in combination with the CV method, those with lower coefficients of variation were subsequently excluded. The specific steps and formulas are detailed in Supplementary Material S1.
3.3.2. Construction of Urban Resilience Evaluation Model Based on the Improved CRITIC-TOPSIS Method
- (1)
- Weight calculation based on the improved CRITIC method
The CRITIC method (Criteria Importance Through Intercriteria Correlation) is an objective weighting approach suitable for handling decision-making problems with high inter-attribute correlations. This method not only captures the variability of each attribute through the standard deviation but also incorporates the correlation factors among attributes. When the correlation between certain attributes is high, the method assigns lower weights to these attributes, thereby effectively eliminating biases caused by redundant information [116].
The CRITIC method accounts for both the variability (contrast intensity) and the conflict of indicators. Indicators with higher contrast intensity and lower correlation with other indicators (higher conflict) are assigned greater weights.
However, the traditional CRITIC method has two notable limitations: (1) differences in the dimensions and magnitudes among various indicators make it challenging for the standard deviation to accurately reflect data variability, and (2) the original conflict calculation formula treats only positive correlations as indicative of strong relationships, overlooking the effects of negative correlations [117]. To address these issues, improvements to the CRITIC method refine the calculations of variability and conflict, ensuring more accurate and comprehensive weighting. The standard deviation coefficient was employed instead of the standard deviation to improve the fluctuation indicator (see Equations (5)–(7) in Supplementary Material S2 for details). Compute the conflict by replacing the correlation coefficient with its absolute value (see Equation (8) in Supplementary Material S2 for details). Calculations for other specific steps are detailed in Supplementary Material S2.
- (2)
- Resilience index calculation based on the TOPSIS method
The TOPSIS method (Technique for Order Preference by Similarity to Ideal Solution) is a multi-criteria decision-making approach based on the ideal and negative ideal solutions [118,119]. The positive ideal solution and negative ideal solution represent the most optimal and least optimal conditions among all evaluated objects, respectively. The positive ideal solution corresponds to the maximum score of each indicator across all alternatives, while the negative ideal solution corresponds to the minimum score of each indicator (see Equation (12) in Supplementary Material S2 for details). By calculating the distance of each alternative from both the positive and negative ideal solutions (see Equation (13) in Supplementary Material S2 for details), the TOPSIS method effectively evaluates the relative merits of the alternatives. The specific implementation processes are detailed in Supplementary Material S2.
- (3)
- Sensitivity analysis
The CRITIC-TOPSIS model employed in this study is a multi-criteria decision-making model that involves significant uncertainty. Although improvements to the CRITIC method have enhanced the accuracy of indicator weight calculations to some extent, they may also introduce bias in certain indicators due to intrinsic data factors. Therefore, sensitivity analysis is required to validate and verify the urban resilience evaluation results. In this study, the One-at-a-Time (OAT) method [120] was employed for sensitivity analysis, wherein the absolute mean variation rate of urban resilience was calculated under weight changes to assess the stability and reliability of the evaluation model (see Supplementary Material S3 for details on the OAT method).
3.3.3. Spatiotemporal Evolution Analysis of Urban Resilience
- (1)
- Kernel density estimation
The kernel density estimation (KDE) method was used to analyze the distribution pattern of urban resilience in the Chengdu–Chongqing urban agglomeration from 2010 to 2022. The Gaussian kernel function, known for its high accuracy, was applied for the estimation [121,122]. (See Supplementary Material S4 for the detailed formula).
- (2)
- Global spatial autocorrelation
The spatial autocorrelation method is employed to analyze the similarity or association between observed values in geographic spatial data [123]. A purely descriptive analysis of the spatiotemporal distribution of resilience is insufficient to determine the extent of spatial correlation. To fill this gap, spatial autocorrelation was employed to further investigate the spatial clustering characteristics of resilience, which constitutes a necessary step for subsequent spatiotemporal dynamic evolution analysis. The global Moran’s I index, the most commonly used statistic in global correlation analysis, describes the average degree of association between all spatial units (in this study, cities) and their surrounding areas across the entire region [124]. For detailed methodological information and formulas, please refer to Supplementary Material S5.
- (3)
- Spatial Markov Chain model
The Spatial Markov Chain is a model that integrates spatial correlation with Markov Chain theory, enabling the analysis and modeling of dynamic processes influenced by spatial dependencies. A Markov Chain typically describes a stochastic process in which states evolve over time. Its core characteristic is the property of memorylessness, meaning that the probability distribution of the current state depends solely on the state at the immediately preceding time step. Compared to traditional Markov Chains, the Spatial Markov Chain incorporates the influence of geographical location or spatial proximity on state transition probabilities [125,126]. Therefore, this study employs spatial Markov chain analysis to examine resilience dynamics from an evolutionary perspective and further validates the influence of spatial factors on resilience. By calculating the probability values in the Markov state transition matrix, the transition trends among different resilience states can be obtained. The specific calculation formulas are provided in Supplementary Material S6.
3.3.4. Detection of Influencing Factors of Urban Resilience Based on Geo-Detector
Geo-detector is a statistical method for spatial analysis designed to assess the influence of multiple explanatory factors on the spatial distribution of a dependent variable. The core indicator is the q-statistic [127,128], and in this study, the factor detection was employed to analyze the influencing factors of urban resilience. Specifically, the natural breaks classification method was employed to spatially categorize the potential influencing factors, stratify independent variables, and compute the q-values for each detected factor, thereby identifying the key pathways for enhancing urban disaster resilience. For detailed methodology and formula of this approach, please refer to Supplementary Material S7.
4. Results and Analysis
4.1. Urban Resilience Evaluation Index Results and Sensitivity Analysis
Following the procedures in Section 3.3.1, an urban resilience evaluation indicator system was established. The final indicator system and its corresponding weights are presented in Table 2 (detailed screening process can be found in Supplementary Material S8). Subsequently, based on the evaluation model developed in Section 3.3.2, the resilience scores for each city were calculated for every year (see Supplementary Material S9 for details). Sensitivity analysis of the evaluation results (Figure 4) revealed that the absolute mean variation rate of each indicator is symmetrically distributed around a weight variation rate of 0 and exhibits an approximately linear increase with the absolute value of the weight variation rate, with different indicators displaying distinct variation rate values. When the weight variation rate reached 30%, the absolute mean variation rate of most indicators was less than 1.5%; even the highest absolute mean variation rate was considerably lower than the weight variation rate. These findings indicate that the resilience evaluation results derived from the model are relatively stable.
Table 2.
The final evaluation index system and weights of urban resilience.
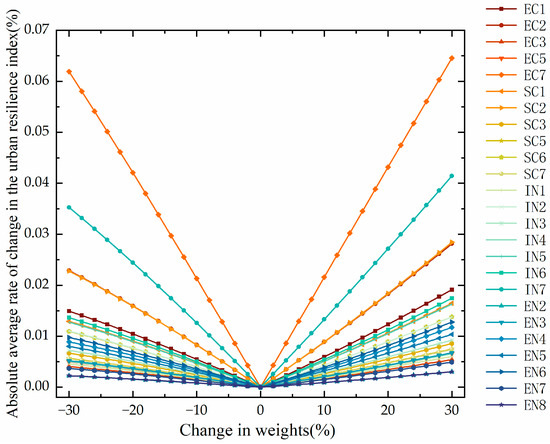
Figure 4.
Absolute average rate of change in the urban resilience index.
4.2. Spatiotemporal Evolution Results of Urban Resilience in the Chengdu–Chongqing Urban Agglomeration
4.2.1. Temporal Evolution Analysis of Resilience
- (1)
- Comprehensive resilience levels
A time-series plot of resilience levels for each city was generated (Figure 5). The findings reveal a general upward trend in the resilience indices over the study period. Chengdu and Chongqing consistently demonstrated significantly higher resilience indices than other cities, maintaining their leading positions. Cities such as Deyang and Mianyang showed mid-level resilience, with a noticeable increase, from approximately 0.34 in 2010 to around 0.5 in 2022. Most of the other cities displayed relatively low resilience levels and similar growth rates, remaining in the lower range of resilience indices.
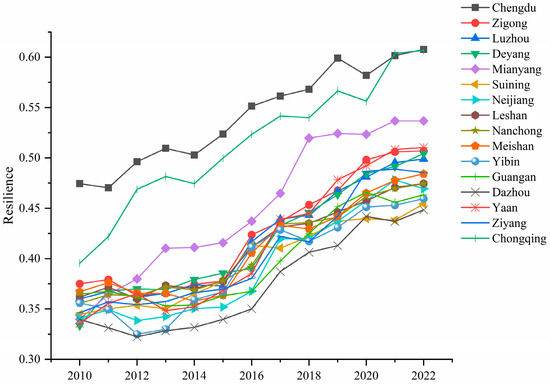
Figure 5.
Temporal evolutionary characteristics of urban resilience from 2010 to 2022.
- (2)
- Resilience levels across dimensions
The urban resilience was categorized into four subsystems from the perspective of urban systems, and resilience indices for these subsystems were calculated from 2010 to 2022. As shown in Figure 6, economic and infrastructure resilience exhibited steady growth. Social resilience experienced a significant increase after 2016, gradually diverging from the other dimensions. Environmental resilience remained relatively stable. Comprehensive resilience showed a consistent upward trend driven by concurrent improvement in all dimensions.
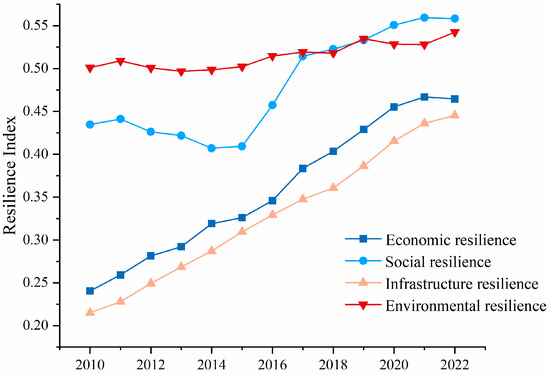
Figure 6.
Temporal evolutionary characteristics of urban subsystem dimensions.
From the perspective of resilience capacity, the urban resilience was divided into four dimensions, and the resilience indices for these dimensions were calculated for the years 2010 to 2022. Figure 7 illustrates the significant spatiotemporal evolution characteristics of the four dimensions of resilience capacity in the Chengdu–Chongqing urban agglomeration. These findings highlight the phased achievements of regional resilience-building efforts as well as existing development gaps.
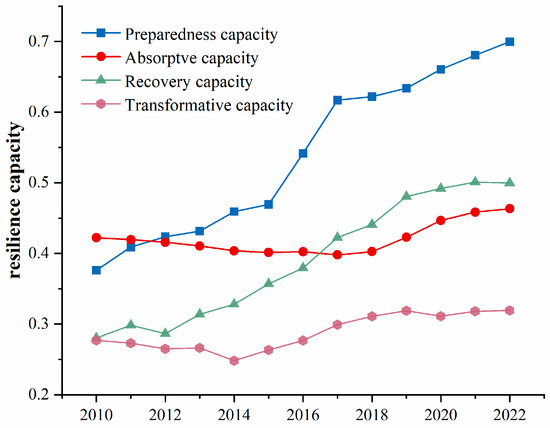
Figure 7.
Temporal evolutionary characteristics of resilience capacity dimensions.
Preparedness capacity exhibited the most rapid improvement, driven by advances in infrastructure, expanded healthcare coverage, and stronger economic tolerance. Although ranking second overall, absorptive capacity showed relatively modest growth, increasing slowly from approximately 0.4 in 2010 to around 0.5 in 2022. Recovery capacity demonstrated a consistent upward trajectory, with accelerated growth particularly evident after 2014. Among the four dimensions, transformative capacity remained the lowest and slowest to develop.
- (3)
- Kernel density estimation of comprehensive resilience
The kernel density curves of the comprehensive resilience were plotted (Figure 8). The curves exhibit a prominent peak and multiple side peaks, indicating a clear trend of polarization within the urban agglomeration. The comprehensive resilience levels of the core cities show a significant gap compared to other cities, consistent with the analysis of development trends discussed earlier.
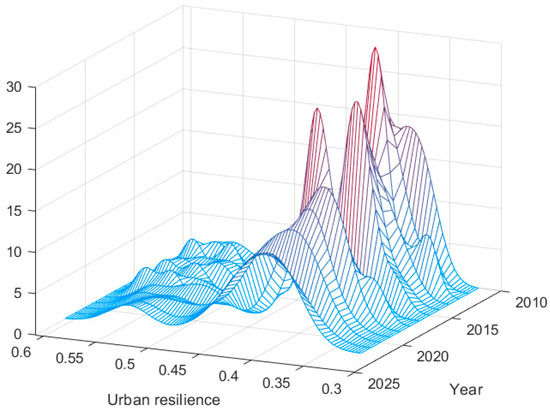
Figure 8.
Three-dimensional kernel density curves for comprehensive resilience.
The center of the kernel density curve consistently shifts to the right, indicating a continuous improvement in resilience levels. The main peak value generally exhibits a fluctuating downward trend, with the peak shape transitioning from multiple peaks to dual peaks. The resilience distribution range tends to expand over time, while the width of the main peak initially narrows and then widens. These findings suggests that, excluding core cities, the overall resilience gap among the remaining cities in the Chengdu–Chongqing urban agglomeration was diminishing, reflecting more balanced development.
4.2.2. Spatiotemporal Evolution Characteristics of Resilience Distribution
Based on the comprehensive resilience index and the resilience indices of each dimension for each city (Supplementary Material S9), spatial distribution maps of resilience were generated using ArcGIS 10.8 software (Figure 9, Figure 10, Figure 11 and Figure 12).
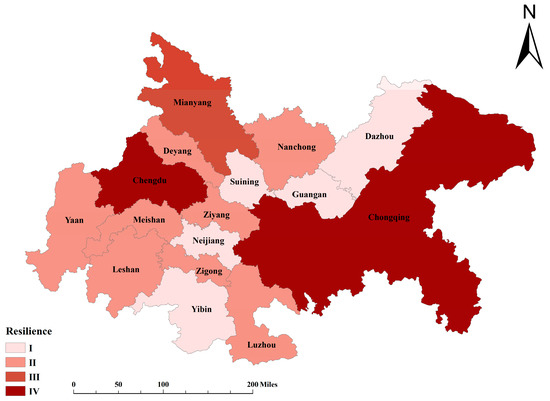
Figure 9.
Spatial distribution of urban resilience.

Figure 10.
Spatial evolutionary characteristics of comprehensive resilience.
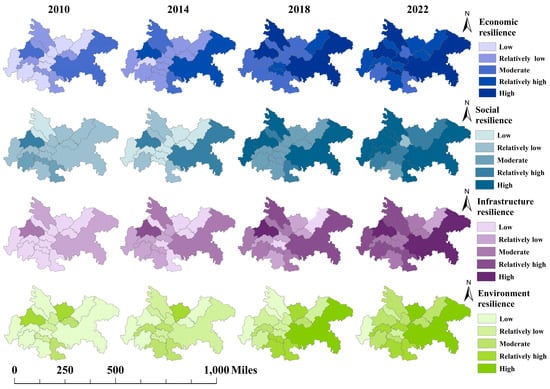
Figure 11.
Spatial evolutionary characteristics of urban subsystem dimensions.
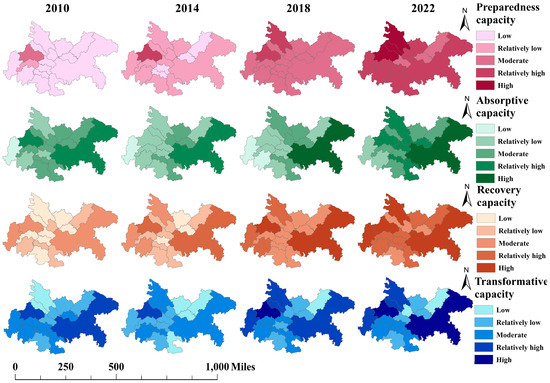
Figure 12.
Spatial evolutionary characteristics of resilience capacity dimensions.
- (1)
- Distribution of comprehensive resilience
Figure 9 illustrates the distribution of comprehensive resilience across the cities of the Chengdu–Chongqing urban agglomeration, classified into four levels (I, II, III, IV). Darker colors denote higher resilience levels.
As the core cities of the urban agglomeration, Chongqing and Chengdu exhibited the highest levels of comprehensive resilience. Cities such as Deyang and Mianyang were categorized as Level III. Although their comprehensive resilience lags behind Chongqing and Chengdu, it surpasses that of some smaller surrounding cities. These cities may possess certain advantages in economic strength and infrastructure, yet they still present opportunities for improvement relative to the core cities. In contrast, cities like Dazhou, Suining, and Guang’an exhibited lower resilience levels, suggesting a limited capacity to withstand risks during disasters. These cities represent key areas for targeted resilience-building efforts within the urban agglomeration.
An analysis of the comprehensive resilience distribution of the Chengdu–Chongqing urban agglomeration was conducted for the years 2010, 2014, 2018, and 2022 (Figure 10). The resilience levels of the core cities, Chengdu and Chongqing, were observed to increase consistently over time and to remain higher than those of the surrounding areas in all analyzed years. Temporally, a diffusion effect in regional resilience levels was observed. For example, in 2014, high-resilience areas were primarily concentrated in the vicinity of Chengdu and Chongqing. However, by 2018 and 2022, the high-resilience areas had gradually expanded to include more cities.
- (2)
- Distribution of urban subsystem resilience index
Representative years 2010, 2014, 2018, and 2022 were selected to visualize urban subsystem resilience (Figure 11). From the perspective of evolutionary patterns, the economic, social, and infrastructure dimensions were found to be centered around Chengdu and Chongqing as high-resilience cores, gradually forming a “one-axis, two-belts” pattern. The detailed analysis is provided below.
Economic Resilience. Overall, economic resilience exhibited a significant spatial disparities. Chengdu and Chongqing consistently exhibited high resilience levels. In 2010, most surrounding cities demonstrated relatively low resilience indices. By 2014, overall economic resilience had improved, and some surrounding cities, such as Mianyang and Deyang, began to register higher resilience values. From 2018 to 2022, the gap between cities narrowed further, with the emergence of “secondary central cities”.
Social resilience. This experienced a significant overall improvement from 2010 to 2022, with regional disparities steadily narrowing. It displayed a “high-low-high” distribution pattern along the east-west axis. Chengdu’s social resilience significantly surpassed that of other cities in the region in 2010. From 2014 to 2018, the majority of cities recorded substantial gains in social resilience, leading to a more pronounced “high-low-high” configuration, reflecting the leadership and diffusion effect of high-resilience centers.
Infrastructure resilience. From 2010 to 2018, Chengdu consistently maintained the leading position in infrastructure resilience, followed by Chongqing and Mianyang. During 2010–2014, western cities such as Yibin, Meishan, Leshan, and Ya’an experienced moderate improvements, forming mid-to-low resilience clusters. By 2018, the infrastructure resilience of secondary cities such as Mianyang, Yibin, and Luzhou had risen markedly, establishing emerging regional growth poles outside Chengdu and Chongqing. By 2022, the overall regional balance had improved. Nevertheless, Dazhou remained in the mid-to-low resilience category.
Environmental Resilience. The overall distribution of environmental resilience gradually shifted from a dispersed pattern to a southeast-high, northwest-low pattern. Notable improvements were observed in Chongqing, Luzhou, and Yibin, while other cities displayed more fluctuations. For instance, Chengdu and Guang’an showed an initial decline followed by an increase.
- (3)
- Distribution of resilience capacity index
A visualization of the four dimensions of resilience capacity (Figure 12) reveals that preparedness and recovery capacities showed steady growth across all cities, reaching above moderate levels by 2022. In contrast, improvements in absorptive and transformative capacities were relatively limited, with significant regional disparities persisting.
Preparedness capacity. This capacity exhibited a consistent upward trajectory. Chengdu, Deyang, and Mianyang in particular formed a high-preparedness capacity zone. Compared to other regions, Chengdu consistently maintained higher preparedness capacity, increasing from a moderate level in 2010 to a high level by 2022.
Absorptive capacity. The spatial pattern generally featured higher levels in the eastern cities and lower levels in the west. The development trend showed that Chongqing and its neighboring cities achieved early improvements, which gradually extended to other cities. Most cities demonstrated noticeable gains in absorptive capacity starting around 2018. Throughout the period, Chongqing remained the standout performer, while Leshan and Ya’an persistently recorded the lowest absorptive capacity in the region.
Recovery capacity. In 2010, only Chongqing, Chengdu, and Ya’an exhibited relatively strong recovery capacity, whereas most other areas displayed weaker levels. With the development of the tertiary sector and the gradual improvement of social security systems, recovery capacity in the Chengdu–Chongqing core area and its surrounding regions progressively increased. By 2022, recovery capacity had become relatively balanced across the region, with all areas achieving at least moderate levels or higher.
Transformative capacity. Marked regional disparities characterized transformative capacity. Cities surrounding Chongqing and Chengdu, such as Deyang, Mianyang, and Ya’an, experienced notable improvements, while other areas showed either stable or fluctuating trends. By 2022, Chengdu, Chongqing, and their neighboring regions had attained “high” or “relatively high” levels of transformative capacity. However, progress in peripheral areas, such as northeastern Sichuan and Yibin city, remained relatively slow.
4.2.3. Global Spatial Autocorrelation Analysis
The Global Moran’s I of the Chengdu–Chongqing urban agglomeration ranged from 0 to 1 over the period 2010–2022(Table 3), indicating a positive spatial correlation in resilience distribution. The values showed an initial increase followed by a decline over time. In 2010, the Moran’s I was close to 0, reflecting a near-random spatial distribution of resilience. This pattern likely resulted from two factors: the relatively small differences in resilience levels among cities and the absence of spatial interaction effects due to independent urban development. From 2010 to 2015, the Moran’s I increased steadily, signifying the emerging spatial clustering of resilience. This trend may have been driven by core cities such as Chengdu, which served as models and have generated spillover effects that enhanced resilience in neighboring cities. After 2016, however, the Moran’s I weakened and became more volatile. This attenuation may be attributed to the development of previously low-resilience cities, which disrupted the earlier spatial clustering and signaled a shift towards a more complex phase of overall resilience development.
Table 3.
Global Moran’s I.
4.2.4. Analysis of the Dynamic Transition Characteristics of Resilience in the Chengdu–Chongqing Urban Agglomeration
The results of the traditional Markov state transition matrix are presented in Table 4. From 2010 to 2022, the evolution of resilience in the Chengdu–Chongqing urban agglomeration exhibited a pronounced “club convergence” characteristic. The diagonal values in the transition matrix consistently exceeded those off-diagonal, indicating strong stability within each resilience level. Among these clubs, the stability of both the low-level and high-level convergence clubs was notably higher. The probabilities for Level I and Level V to remain in their original states were 83.91% and 90%, respectively, surpassing those for Levels II, III, and IV.
Table 4.
Markov state transition matrix for urban resilience from 2010 to 2022.
Resilience improvement is a dynamic process characterized by fluctuations and setbacks, with each level encountering unique developmental challenges. The one-level downward transition probabilities for high and relatively high resilience levels were 10% and 5.56%, respectively, indicating that higher resilience levels carry a certain risk of downgrading. Moreover, the likelihood of downward transitions tends to increase as resilience levels improve. Therefore, cities with higher resilience should remain vigilant about the risk of level downgrades, prioritize the consolidation of existing achievements, and strive to achieve upward transitions.
Furthermore, considering the influence of spatial factors, the spatial Markov state transition matrix was calculated. The results are presented in Table 5.
Table 5.
Spatial Markov matrix for urban resilience from 2010 to 2022.
As shown in Table 5, no cities with a spatial lag of Level V were identified, indicating that during the study period, the resilience state of a city was not observed to be influenced by neighboring cities in Level V. This is primarily due to the limited number of Level V samples, and thus state transitions with a spatial lag condition of Level V were excluded from this study.
The results demonstrate that spatial factors significantly affect resilience state transition probabilities. The transition probabilities considering neighborhood types differ from the corresponding elements in the traditional Markov transition matrix. When resilience levels differ among neighboring cities, the probability of a city’s resilience state transitioning varies accordingly. The impact of different neighborhood contexts on the same resilience level varies. For instance, under a relatively high-level neighborhood type, the probability of transitioning from a lower level to a moderate level was 60%, significantly higher than the probabilities under low-level, relatively low-level, and moderate-level neighborhood types. Additionally, the same neighborhood context exerts varying influences on different resilience levels. Under the condition of a relatively high-level spatial lag, the probabilities of transitioning up one level for lower, moderate, and relatively high resilience levels were 60%, 36%, and 0%, respectively, showing a decreasing trend. This indicates that transition probabilities are not only influenced by neighborhood types but also depend on the initial resilience level.
4.3. Detection of Influencing Factors of Urban Resilience
Table 6 presents the q-values of the influencing factors for the years 2010, 2014, 2018, and 2022.
Table 6.
Factor detection results.
The results reveal that the driving factors of urban resilience exhibited significant dynamic evolution from 2010 to 2022, reflecting shifting resilience priorities at different stages of development:
- In 2010, the primary driving factors included urban infrastructure investment (IN7), technological investment (EC7), medical insurance coverage (SC1), drainage pipeline density (IN1), and communication technology capacity (IN2). This indicates that resilience improvement primarily relied on the development of physical infrastructure, aligning with the fundamental requirement of disaster resistance during the early urbanization phase.
- By 2014, as economic and social development progressed, the driving factors gradually shifted towards economic structure optimization and the enhancement of public service capacity. The proportion of the tertiary industry (EC5) and public transportation availability (IN6) emerged as the primary driving factors, underscoring the importance of economic diversification and robust public service systems for strengthening urban resilience.
- By 2018, the driving factors became further diversified. The prominent role of food security (EC3) reflected the city’s foundational capacity to ensure basic living standards during disasters, while the significant influence of economic tolerance (EC1) underscored the growing importance of economic resilience and adaptive capacity in the face of disasters. Additionally, improvements in social security and employment support (SC5) also emerged as crucial for enhancing social resilience. Overall, resilience-building expanded beyond physical infrastructure to encompass resource security and social stability.
- In 2022, infrastructure and technological innovation continued to play a critical role, with soft power factors such as educational and cultural levels (SC6) ranking among the top driving factors. This marks a high-quality transformation in the mechanism’s driving resilience.
5. Discussion
5.1. In-Depth Understanding of the Spatiotemporal Patterns and Underlying Mechanisms of Urban Resilience
The findings of this study enhance the understanding of the spatiotemporal dynamics of resilience in urban agglomerations. From a temporal perspective, the comprehensive resilience levels of cities exhibited a pronounced upward trend, with disparities in resilience levels narrowing over time. This trend may be linked to the integrated development policies of the Chengdu–Chongqing urban agglomeration, which have facilitated increased resource allocation and resilience improvements in the surrounding cities. Notably, after 2014, the rate of regional resilience improvement accelerated, as evidenced by the increased migration speed of the peak value in the kernel density curve. This phenomenon may be associated with the government’s growing emphasis on emergency management and disaster prevention and mitigation [129]. From a spatial perspective, the resilience distribution in the Chengdu–Chongqing urban agglomeration exhibited a spatially decreasing pattern centered on Chengdu and Chongqing. The concentration of resources and infrastructure development in these core cities resulted in relatively higher resilience levels, whereas surrounding cities exhibited comparatively weaker resilience. This pattern reflects regional imbalances in economic development, infrastructure construction, and social resource allocation. In 2022, certain areas still exhibited relatively low resilience, indicating that resilience-building efforts in these cities remain lagging. These regions require enhanced policy attention and resource allocation to further balance resilience levels across the region.
From the dual perspective of urban system dimensions and resilience characteristics dimensions, urban resilience displays patterns of multidimensional interaction and phased evolution. Regarding the urban systems, the coordinated development of the economic, social, infrastructure, and environmental dimensions has fortified the region’s capacity to adapt to and recover from potential future risks and uncertainties. Urban development is inherently tied to economic growth and infrastructure expansion, both of which have demonstrated steady resilience improvements. According to the results of the geographic detector analysis, the infrastructure dimension serves as a critical pillar of urban resilience, providing a solid material foundation for its enhancement. Additionally, significant progress has been observed in social resilience over the past decade, driven by efforts to strengthen social security and improve public service systems. Notably, soft power factors have played an increasingly important role in the later stages of the study period. In contrast, environmental resilience has exhibited fluctuations and a relatively weaker influence. However, long-term ecological development holds potential contributions to urban resilience, underscoring the necessity of prioritizing environmental protection, preventing excessive resource depletion caused by urban expansion, and enhancing ecological redundancy to achieve sustainable improvements in urban system resilience.
Regarding resilience capacity, improvements in infrastructure, healthcare coverage, and economic tolerance have significantly strengthened regional disaster prevention and planning capabilities, making preparedness the fastest-improving dimension. Conversely, the relative lag in recovery capacity and, more notably, in transformative capacity represents a key bottleneck restricting the comprehensive enhancement of regional resilience. Transformative capacity represents the lowest-performing dimension among the four, limiting the enhancement of urban resilience. This observation highlights insufficient efforts in areas such as social learning, system innovation, ecological adaptation, and policy updates within the Chengdu–Chongqing urban agglomeration. Similarly, recovery capacity is relatively lagging, potentially leading to prolonged post-disaster reconstruction periods or resource inefficiencies, thereby constraining the urban system’s ability to quickly return to normalcy or achieve higher levels of development.
5.2. Spillover Effect of Urban Resilience
Both the spatiotemporal evolution of overall resilience and the individual dimensions of resilience reveal a spillover effect, gradually expanding from high-resilience areas to low-resilience areas.
The spatial distribution of resilience was centered around Chengdu and Chongqing, forming a distinct dual-core structure, consistent with the findings of Lu and Guo et al. on the Chengdu–Chongqing region [129,130]. The core cities of the Chengdu–Chongqing urban agglomeration exhibited higher resilience levels, and gradually stimulated improvements in surrounding cities, reflecting a “core–periphery” structural characteristic. This feature bears similarities to other major urban agglomerations in China, such as the Yangtze River Delta, the Pearl River Delta, and the Beijing–Tianjin–Hebei region [131,132]. This trend substantiates the presence of spatial spillover effects [133,134]. The spatial Markov chain analysis (Table 5) revealed that, under different spatial lag types, the diagonal elements of the transition probability matrix were not consistently greater than the off-diagonal elements. This indicates a reduction in the “rank locking” probability of resilience evolution under the influence of spatial spillover effects, a phenomenon particularly evident under Type IV neighborhood conditions. These findings further underscore the significant impact of spatial factors on the development of urban resilience levels.
Core cities typically serve as the primary pillars of resilience in urban agglomerations by virtue of their superior resource endowments, robust economic infrastructures, and efficient governance mechanisms. Through mechanisms including technological diffusion, industrial collaboration, and the extension of public services, these cities gradually transmit their resilience advantages to adjacent regions, enhancing the region’s capacity to respond to disasters in a coordinated manner. In the Chengdu–Chongqing urban agglomeration, this spatial spillover effect operates as an inherent driving mechanism, not only improving the disaster adaptation capacities of peripheral cities but also accelerating the optimization of regional resource allocation, thereby fostering a more balanced development of resilience across the entire region.
From the perspective of spatial clustering, although the resilience of the Chengdu–Chongqing urban agglomeration exhibited a positive correlation, the Moran’s I remained relatively low and demonstrated a fluctuating downward trend after 2015 (Table 3). This indicates that the spatial clustering effect is not significant and reflects the instability of positive spillover effects. Lu et al. reported a negative spatial correlation in their study on resilience within the Chengdu–Chongqing urban agglomeration [129], thereby highlighting the need to remain vigilant regarding potential siphoning effects during urban agglomeration development. The insufficient capacity of peripheral cities to absorb the resilience spillover from core cities may exacerbate regional development imbalances.
Therefore, in advancing the integrated development of the region, it is crucial to fully leverage the positive guiding role of spillover effects. By enhancing the resource absorption capacity and infrastructure development of peripheral cities, the coordinated and balanced development of resilience across the region can be promoted.
6. Conclusions
This study employed the CRITIC-TOPSIS model to establish an urban resilience evaluation index system from two perspectives: the four urban subsystems (economic, social, infrastructure, and ecological environment) and resilience capacities across the entire disaster management cycle. Utilizing this framework, the resilience indices of 16 cities in the Chengdu–Chongqing urban agglomeration were calculated for the period 2010–2022, followed by spatiotemporal evolution analysis and driving factor detection. The results indicate that the overall resilience of the Chengdu–Chongqing urban agglomeration showed a steady upward trend during the study period. Chengdu and Chongqing, as core cities, led regional resilience development, with regional disparities gradually narrowing. Both the comprehensive resilience and its dimensions exhibited significant spatial heterogeneity. Notable improvements were observed in the resilience levels of the economic, social, and infrastructure dimensions, while environmental resilience remained relatively stable. Cities consistently demonstrated stable growth and a trend toward equilibrium in preparedness and recovery capacities. However, improvements in absorptive and transformative capacities were comparatively limited, with marked regional disparities, highlighting these as relatively weak areas in resilience building. The spatial Markov chain analysis confirmed the spatial spillover effects of resilience. Furthermore, the Geo-detector analysis identified infrastructure development and technological innovation as key long-term drivers of resilience enhancement.
Valuable insights for sustainable development and resilient city construction are provided by this study. By incorporating the concept of “bounce forward” into the theoretical framework and adopting a dual perspective of urban systems and resilience capacities, it integrates various urban subsystems and addresses the core resilience needs at different stages. This approach fills gaps in resilience theory research and contributes to enhancing urban capacities across four stages: pre-disaster planning, disaster endurance, post-disaster recovery, and long-term transformation. Ultimately, it aims to build a more robust, sustainable, and highly adaptive urban resilience system.
However, several issues remain that warrant further investigation in future studies. First, urban systems are highly coupled and complex, but due to data limitations, this study’s evaluation indicators are confined to economic, social, infrastructure, and ecological dimensions, excluding factors such as community capital and policy governance, which require further exploration. Second, while the indicator system was theoretically constructed and applied to the Chengdu–Chongqing urban agglomeration, the derived conclusions require validation against practical circumstances. Finally, the spatiotemporal evolution of resilience was examined primarily from a macro perspective. Given the complexity of urban systems, multiple interactions likely exist among different factors. Future research should integrate multi-source data and employ dynamic scenario modeling to explore underlying mechanisms more comprehensively.
Supplementary Materials
The following supporting information can be downloaded at https://www.mdpi.com/article/10.3390/land14040741/s1, S1: Detailed explanation and calculation steps for coefficient of variation and correlation analysis; S2: Improved CRITIC-Topsis Method; S3: OAT method. S4: Kernel density estimation; S5: Global spatial autocorrelation; S6: Spatial Markov Chain model; S7: Geo-detector; S8: Determination of the final evaluation index system; S9: Urban resilience levels of 16 cities in the Chengdu-Chongqing urban agglomeration, 2010–2022.
Author Contributions
Conceptualization, R.Z.; methodology, R.Z.; software, R.Z. and H.X. (Hanyu Xu); validation, J.Z. and H.X. (Huige Xing); formal analysis, R.Z.; investigation, R.Z.; resources, R.Z.; data curation, R.Z. and F.S.; writing—original draft preparation, R.Z.; writing—review and editing, R.Z. and H.X. (Huige Xing); visualization, R.Z. and H.X. (Hanyu Xu); supervision, J.Z. and H.X. (Huige Xing); project administration, J.Z. and H.X. (Huige Xing); funding acquisition, H.X. (Huige Xing). All authors have read and agreed to the published version of the manuscript.
Funding
This research was funded by the National Natural Science Foundation of China (U20A20111) and the National key R&D Program (2022YFC3080100).
Data Availability Statement
Data are contained within the article. All data used in this article were collected by the authors through either site investigations or open data.
Conflicts of Interest
The authors declare no conflicts of interest.
References
- United Nations Office for Disarmament Affairs. Human Cost of Disasters: An Overview of the Last 20 Years 2000–2019; United Nations: New York, NY, USA, 2020; ISBN 978-92-1-005447-8. [Google Scholar]
- Thomas, V.; Albert, J.R.G.; Hepburn, C. Contributors to the Frequency of Intense Climate Disasters in Asia-Pacific Countries. Clim. Chang. 2014, 126, 381–398. [Google Scholar] [CrossRef]
- Coronese, M.; Lamperti, F.; Keller, K.; Chiaromonte, F.; Roventini, A. Evidence for Sharp Increase in the Economic Damages of Extreme Natural Disasters. Proc. Natl. Acad. Sci. USA 2019, 116, 21450–21455. [Google Scholar] [CrossRef] [PubMed]
- Li, X.; Wang, Y.; Song, Y. Unraveling Land System Vulnerability to Rapid Urbanization: An Indicator-Based Vulnerability Assessment for Wuhan, China. Environ. Res. 2022, 211, 112981. [Google Scholar] [CrossRef] [PubMed]
- Mortoja, M.G.; Yigitcanlar, T. How Does Peri-Urbanization Trigger Climate Change Vulnerabilities? An Investigation of the Dhaka Megacity in Bangladesh. Remote Sens. 2020, 12, 3938. [Google Scholar] [CrossRef]
- Liang, L.; Chen, M.; Lu, D. Revisiting the Relationship Between Urbanization and Economic Development in China Since the Reform and Opening-Up. Chin. Geogr. Sci. 2022, 32, 1–15. [Google Scholar] [CrossRef]
- Agarwal, P.; Sahoo, D.; Parida, Y.; Ranjan Paltasingh, K.; Roy Chowdhury, J. Land Use Changes and Natural Disaster Fatalities: Empirical Analysis for India. Ecol. Indic. 2023, 154, 110525. [Google Scholar] [CrossRef]
- Cui, Y.; Cheng, D.; Choi, C.E.; Jin, W.; Lei, Y.; Kargel, J.S. The Cost of Rapid and Haphazard Urbanization: Lessons Learned from the Freetown Landslide Disaster. Landslides 2019, 16, 1167–1176. [Google Scholar] [CrossRef]
- Poudel, D.P.; Blackburn, S.; Manandhar, R.; Adhikari, B.; Ensor, J.; Shrestha, A.; Timsina, N.P. The Urban Political Ecology of ‘Haphazard Urbanisation’ and Disaster Risk Creation in the Kathmandu Valley, Nepal. Int. J. Disaster Risk Reduct. 2023, 96, 103924. [Google Scholar] [CrossRef]
- Dormady, N.; Roa-Henriquez, A.; Rose, A. Economic Resilience of the Firm: A Production Theory Approach. Int. J. Prod. Econ. 2019, 208, 446–460. [Google Scholar]
- Duan, W.; Madasi, J.D.; Khurshid, A.; Ma, D. Industrial Structure Conditions Economic Resilience. Technol. Forecast. Soc. Chang. 2022, 183, 121944. [Google Scholar] [CrossRef]
- Mavhura, E.; Manyangadze, T.; Aryal, K.R. A Composite Inherent Resilience Index for Zimbabwe: An Adaptation of the Disaster Resilience of Place Model. Int. J. Disaster Risk Reduct. 2021, 57, 102152. [Google Scholar] [CrossRef]
- Clark-Ginsberg, A.; McCaul, B.; Bremaud, I.; Cáceres, G.; Mpanje, D.; Patel, S.; Patel, R. Practitioner Approaches to Measuring Community Resilience: The Analysis of the Resilience of Communities to Disasters Toolkit. Int. J. Disaster Risk Reduct. 2020, 50, 101714. [Google Scholar] [CrossRef]
- Yamazaki-Honda, R. Promoting Coherence Among Disaster Risk Reduction, Climate Change Adaptation, and Sustainable Development for Disaster Resilience. J. Disaster Res. 2022, 17, 1015–1021. [Google Scholar]
- Liu, Y.; Li, Q.; Li, W.; Jia, L.; Pei, X. Knowledge Map and Hotspot Analysis in Climate Resilience Infrastructure (CRI) from 1997 to 2022 through Scientometric Analysis. Environ. Res. 2023, 228, 115874. [Google Scholar] [PubMed]
- Cheng, T.; Zhao, Y.; Song, Y.; Ma, L.; Zhang, Z.; Luo, P.; Gao, P.; Zhang, M.; Zhao, C. Towards Resilience Effectiveness: Assessing Its Patterns and Determinants to Identify Optimal Geographic Zones. J. Clean. Prod. 2023, 429, 139596. [Google Scholar] [CrossRef]
- Shreve, C.M.; Kelman, I. Does Mitigation Save? Reviewing Cost-Benefit Analyses of Disaster Risk Reduction. Int. J. Disaster Risk Reduct. 2014, 10, 213–235. [Google Scholar] [CrossRef]
- Wang, H.; Gao, X.; Xu, T.; Xue, H.; He, W. Spatial-Temporal Evolution Mechanism and Efficiency Evaluation of Drought Resilience System in China. J. Clean. Prod. 2023, 428, 139298. [Google Scholar] [CrossRef]
- Hu, L.; Meng, J.; Xiong, C.; Fang, W.; Yang, J.; Liu, M.; Bi, J.; Ma, Z. City-Level Resilience to Extreme Weather Shocks Revealed by Satellite Nighttime Lights in China. Sustain. Cities Soc. 2024, 101, 105167. [Google Scholar] [CrossRef]
- Sebestyén, V.; Trájer, A.J.; Domokos, E.; Torma, A.; Abonyi, J. Objective Well-Being Level (OWL) Composite Indicator for Sustainable and Resilient Cities. Ecol. Indic. 2024, 158, 111460. [Google Scholar] [CrossRef]
- Aguilar-Barajas, I.; Sisto, N.P.; Ramirez, A.I.; Magaña-Rueda, V. Building Urban Resilience and Knowledge Co-Production in the Face of Weather Hazards: Flash Floods in the Monterrey Metropolitan Area (Mexico). Environ. Sci. Policy 2019, 99, 37–47. [Google Scholar] [CrossRef]
- Davidson, K.; Nguyen, T.M.P.; Beilin, R.; Briggs, J. The Emerging Addition of Resilience as a Component of Sustainability in Urban Policy. Cities 2019, 92, 1–9. [Google Scholar] [CrossRef]
- Fang, Y.; Zhu, F.; Qiu, X.; Zhao, S. Effects of Natural Disasters on Livelihood Resilience of Rural Residents in Sichuan. Habitat Int. 2018, 76, 19–28. [Google Scholar] [CrossRef]
- Feng, X.; Xiu, C.; Bai, L.; Zhong, Y.; Wei, Y. Comprehensive Evaluation of Urban Resilience Based on the Perspective of Landscape Pattern: A Case Study of Shenyang City. Cities 2020, 104, 102722. [Google Scholar] [CrossRef]
- Chen, X.; Guo, Z.; Zhou, H.; Qian, X.; Zhang, X. Urban Flood Resilience Assessment Based on VIKOR-GRA: A Case Study in Chongqing, China. KSCE J. Civ. Eng. 2022, 26, 4178–4194. [Google Scholar] [CrossRef]
- Shi, Y.; Zhai, G.; Xu, L.; Zhou, S.; Lu, Y.; Liu, H.; Huang, W. Assessment Methods of Urban System Resilience: From the Perspective of Complex Adaptive System Theory. Cities 2021, 112, 103141. [Google Scholar] [CrossRef]
- Harrison, C.G.; Williams, P.R. A Systems Approach to Natural Disaster Resilience. Simul. Model. Pract. Theory 2016, 65, 11–31. [Google Scholar] [CrossRef] [PubMed]
- Kusumastuti, R.D.; Viverita; Husodo, Z.A.; Suardi, L.; Danarsari, D.N. Developing a Resilience Index towards Natural Disasters in Indonesia. Int. J. Disaster Risk Reduct. 2014, 10, 327–340. [Google Scholar] [CrossRef]
- Chen, C.; Xu, L.; Zhao, D.; Xu, T.; Lei, P. A New Model for Describing the Urban Resilience Considering Adaptability, Resistance and Recovery. Saf. Sci. 2020, 128, 104756. [Google Scholar] [CrossRef]
- Datola, G. Implementing Urban Resilience in Urban Planning: A Comprehensive Framework for Urban Resilience Evaluation. Sustain. Cities Soc. 2023, 98, 104821. [Google Scholar] [CrossRef]
- Ouyang, M.; Dueñas-Osorio, L.; Min, X. A Three-Stage Resilience Analysis Framework for Urban Infrastructure Systems. Struct. Saf. 2012, 36–37, 23–31. [Google Scholar] [CrossRef]
- Zhang, X.; Song, J.; Peng, J.; Wu, J. Landslides-Oriented Urban Disaster Resilience Assessment—A Case Study in ShenZhen, China. Sci. Total Environ. 2019, 661, 95–106. [Google Scholar] [CrossRef] [PubMed]
- Graveline, M.-H.; Germain, D. Disaster Risk Resilience: Conceptual Evolution, Key Issues, and Opportunities. Int. J. Disaster Risk Sci. 2022, 13, 330–341. [Google Scholar] [CrossRef]
- Rus, K.; Kilar, V.; Koren, D. Resilience Assessment of Complex Urban Systems to Natural Disasters: A New Literature Review. Int. J. Disaster Risk Reduct. 2018, 31, 311–330. [Google Scholar] [CrossRef]
- Desouza, K.C.; Flanery, T.H. Designing, Planning, and Managing Resilient Cities: A Conceptual Framework. Cities 2013, 35, 89–99. [Google Scholar] [CrossRef]
- Alexander, D.E. Resilience and Disaster Risk Reduction: An Etymological Journey. Nat. Hazards Earth Syst. Sci. 2013, 13, 2707–2716. [Google Scholar] [CrossRef]
- Amarakoon, P.M.; Gundersen, R.B.; Muhire, A.; Utvik, V.A.; Braa, J. Exploring Health Information System Resilience during COVID-19 Pandemic: Case Studies from Norway, Sri Lanka & Rwanda. BMC Health Serv. Res. 2023, 23, 1433. [Google Scholar] [CrossRef]
- Chelleri, L.; Baravikova, A. Understandings of Urban Resilience Meanings and Principles across Europe. Cities 2021, 108, 102985. [Google Scholar] [CrossRef]
- Rubim, I.C.; Borges, M.R. The Resilience and Its Dimensions. In Proceedings of the ISCRAM, Albi, France, 21–24 May 2017. [Google Scholar]
- Zhao, R.; Fang, C.; Liu, J.; Zhang, L. The Evaluation and Obstacle Analysis of Urban Resilience from the Multidimensional Perspective in Chinese Cities. Sustain. Cities Soc. 2022, 86, 104160. [Google Scholar]
- Brugmann, J. Financing the Resilient City. Environ. Urban. 2012, 24, 215–232. [Google Scholar]
- Meerow, S.; Newell, J.P.; Stults, M. Defining Urban Resilience: A Review. Landsc. Urban Plan. 2016, 147, 38–49. [Google Scholar] [CrossRef]
- Grainger-Brown, J.; Malekpour, S.; Raven, R.; Taylor, E. Exploring Urban Transformation to Inform the Implementation of the Sustainable Development Goals. Cities 2022, 131, 103928. [Google Scholar] [CrossRef]
- Mou, Y.; Luo, Y.; Su, Z.; Wang, J.; Liu, T. Evaluating the Dynamic Sustainability and Resilience of a Hybrid Urban System: Case of Chengdu, China. J. Clean. Prod. 2021, 291, 125719. [Google Scholar] [CrossRef]
- Ribeiro, P.J.G.; Pena Jardim Gonçalves, L.A. Urban Resilience: A Conceptual Framework. Sustain. Cities Soc. 2019, 50, 101625. [Google Scholar] [CrossRef]
- Alliance, R. Urban Resilience Research Prospectus. In A Resilience Alliance Initiative for Transitioning Urban Systems Towards Sustainable Futures; Australian CSIRO Arizona State University: Canberra, Australia, 2007. [Google Scholar]
- Mendizabal, M.; Heidrich, O.; Feliu, E.; García-Blanco, G.; Mendizabal, A. Stimulating Urban Transition and Transformation to Achieve Sustainable and Resilient Cities. Renew. Sustain. Energy Rev. 2018, 94, 410–418. [Google Scholar] [CrossRef]
- Godschalk, D.R. Urban Hazard Mitigation: Creating Resilient Cities. Nat. Hazards Rev. 2003, 4, 136–143. [Google Scholar] [CrossRef]
- Almeida, M.D.; Telhado, M.J.; Morais, M.; Barreiro, J.; Lopes, R. Urban Resilience to Flooding: Triangulation of Methods for Hazard Identification in Urban Areas. Sustainability 2020, 12, 2227. [Google Scholar] [CrossRef]
- Balsas, C.J. Downtown Resilience: A Review of Recent (Re) Developments in Tempe, Arizona. Cities 2014, 36, 158–169. [Google Scholar] [CrossRef]
- Sendai Framework Terminology on Disaster Risk Reduction|UNDRR. Available online: https://www.undrr.org/drr-glossary/terminology (accessed on 7 January 2025).
- Cheng, Y.; Liu, J. Evaluation of Urban Resilience in the Post-COVID-19 Period: A Case Study of the Yangtze Delta City Group in China. Int. J. Disaster Risk Reduct. 2023, 97, 104028. [Google Scholar] [CrossRef]
- Sarker, M.N.I.; Peng, Y.; Yiran, C.; Shouse, R.C. Disaster Resilience through Big Data: Way to Environmental Sustainability. Int. J. Disaster Risk Reduct. 2020, 51, 101769. [Google Scholar] [CrossRef]
- Gaisie, E.; Han, S.S.; Kim, H.M. Complexity of Resilience Capacities: Household Capitals and Resilience Outcomes on Ements the Disaster Cycle in Informal Settl. Int. J. Disaster Risk Reduct. 2021, 60, 102292. [Google Scholar] [CrossRef]
- Li, G.; Kou, C.; Wang, Y.; Yang, H. System Dynamics Modelling for Improving Urban Resilience in Beijing, China. Resour. Conserv. Recycl. 2020, 161, 104954. [Google Scholar] [CrossRef]
- Kapucu, N.; Ge, Y.; Rott, E.; Isgandar, H. Urban Resilience: Multidimensional Perspectives, Challenges and Prospects for Future Research. Urban Gov. 2024, 4, 162–179. [Google Scholar] [CrossRef]
- Sajjad, M.; Chan, J.C.L.; Chopra, S.S. Rethinking Disaster Resilience in High-Density Cities: Towards an Urban Resilience Knowledge System. Sustain. Cities Soc. 2021, 69, 102850. [Google Scholar] [CrossRef]
- Datola, G.; Bottero, M.; De Angelis, E.; Romagnoli, F. Operationalising Resilience: A Methodological Framework for Assessing Urban Resilience through System Dynamics Model. Ecol. Model. 2022, 465, 109851. [Google Scholar]
- Zaman, F. The Role of Popular Discourse about Climate Change in Disaster Preparedness: A Critical Discourse Analysis. Int. J. Disaster Risk Reduct. 2021, 60, 102270. [Google Scholar] [CrossRef]
- Spialek, M.L.; Branton, S.E. From Recovery to Preparedness: An Examination of Resources, Individual Disaster Communication, and Anticipatory Resilience Capacity during the 2023 U.S. Tornado Season. J. Appl. Commun. Res. 2024, 52, 682–701. [Google Scholar] [CrossRef]
- Zeng, X.; Yu, Y.; Yang, S.; Lv, Y.; Sarker, M.N.I. Urban Resilience for Urban Sustainability: Concepts, Dimensions, and Perspectives. Sustainability 2022, 14, 2481. [Google Scholar] [CrossRef]
- Masik, G.; Gajewski, R. Working towards Urban Capacity and Resilience Strategy Implementation: Adaptation Plans and Strategies in Polish Cities. Cities 2021, 119, 103381. [Google Scholar]
- Maurischa, S.D.; Fahmi, F.Z.; Suroso, D.S.A. Transformative Resilience: Transformation, Resilience and Capacity of Coastal Communities in Facing Disasters in Two Indonesian Villages. Int. J. Disaster Risk Reduct. 2023, 88, 103615. [Google Scholar] [CrossRef]
- The National Development and Reform Commission and the Ministry of Housing and Construction Jointly Issued the Chengdu-Chongqing City Cluster Development Plan. Sichuan People’s Government Website. Available online: https://www.sc.gov.cn/10462/10464/10797/2016/5/5/10378968.shtml?cid=303 (accessed on 22 March 2025).
- Wan, J.; Li, Y.; Ma, C.; Jiang, T.; Su, Y.; Zhang, L.; Song, X.; Sun, H.; Wang, Z.; Zhao, Y. Measurement of Coupling Coordination Degree and Spatio-Temporal Characteristics of the Social Economy and Ecological Environment in the Chengdu–Chongqing Urban Agglomeration under High-Quality Development. Int. J. Environ. Res. Public. Health 2021, 18, 11629. [Google Scholar]
- Zhang, X.; Lu, W. Impact of County Industrial Agglomeration on High-Quality Economic Development in Shuangcheng Economic Circle in Chengdu-Chongqing Area: A Perspective of Spatial Spillover Effect. Resour. Environ. Yangtze Basin 2024, 33, 2127–2139. [Google Scholar]
- Xu, J.; Wang, J.; Liu, H. Study on the feasibility and implementation path of the coordinated development of foreign trade in Chengdu-Chongqing Double-city Economic Circle. J. Chongqing Univ. (Soc. Sci. Ed.), 2025; in press. [Google Scholar]
- Feng, X. Research on the Coupling and Coordinated Development of Transportation and Regional Economy in Chengdu–Chongqing Area. Railw. Transp. Ecomomy 2022, 44, 92–98. [Google Scholar] [CrossRef]
- Amarasinghe, U.; Samad, M.; Anputhas, M. Spatial Clustering of Rural Poverty and Food Insecurity in Sri Lanka. Food Policy 2005, 30, 493–509. [Google Scholar] [CrossRef]
- Dai, X.-G.; Liu, Y.; Wang, P. Warm–Dry Collocation of Recent Drought in Southwestern China Tied to Moisture Transport and Climate Warming. Chin. Phys. B 2015, 24, 049201. [Google Scholar]
- Fleisher, B.; Li, H.; Zhao, M.Q. Human Capital, Economic Growth, and Regional Inequality in China. J. Dev. Econ. 2010, 92, 215–231. [Google Scholar]
- Zhu, S.; Li, D.; Huang, G.; Chhipi-Shrestha, G.; Nahiduzzaman, K.M.; Hewage, K.; Sadiq, R. Enhancing Urban Flood Resilience: A Holistic Framework Incorporating Historic Worst Flood to Yangtze River Delta, China. Int. J. Disaster Risk Reduct. 2021, 61, 102355. [Google Scholar] [CrossRef]
- Lu, H.; Lu, X.; Jiao, L.; Zhang, Y. Evaluating Urban Agglomeration Resilience to Disaster in the Yangtze Delta City Group in China. Sustain. Cities Soc. 2022, 76, 103464. [Google Scholar] [CrossRef]
- Zhu, S.; Li, D.; Feng, H.; Zhang, N. The Influencing Factors and Mechanisms for Urban Flood Resilience in China: From the Perspective of Social-Economic-Natural Complex Ecosystem. Ecol. Indic. 2023, 147, 109959. [Google Scholar] [CrossRef]
- Yang, M.; Wang, J.; Jing, Z.; Liu, B.; Niu, H. Evaluation and Regulation of Resource-Based City Resilience: Evidence from Shanxi Province, China. Int. J. Disaster Risk Reduct. 2022, 81, 103256. [Google Scholar] [CrossRef]
- Ji, J.; Wang, D. Evaluation Analysis and Strategy Selection in Urban Flood Resilience Based on EWM-TOPSIS Method and Graph Model. J. Clean. Prod. 2023, 425, 138955. [Google Scholar] [CrossRef]
- Li, Y.; Li, Y.; Kappas, M.; Pavao-Zuckerman, M. Identifying the Key Catastrophic Variables of Urban Social-Environmental Resilience and Early Warning Signal. Environ. Int. 2018, 113, 184–190. [Google Scholar] [CrossRef] [PubMed]
- Liu, D.; Wang, C.; Ji, Y.; Fu, Q.; Li, M.; Ali, S.; Li, T.; Cui, S. Measurement and Analysis of Regional Flood Disaster Resilience Based on a Support Vector Regression Model Refined by the Selfish Herd Optimizer with Elite Opposition-Based Learning. J. Environ. Manag. 2021, 300, 113764. [Google Scholar] [CrossRef]
- Fu, H.; Hong, N.; Liao, C. Spatio-Temporal Patterns of Chinese Urban Recovery and System Resilience under the Pandemic New Normal. Cities 2023, 140, 104385. [Google Scholar] [CrossRef]
- McCartney, G.; Pinto, J.; Liu, M. City Resilience and Recovery from COVID-19: The Case of Macao. Cities 2021, 112, 103130. [Google Scholar] [PubMed]
- Sun, R.; Shi, S.; Reheman, Y.; Li, S. Measurement of Urban Flood Resilience Using a Quantitative Model Based on the Correlation of Vulnerability and Resilience. Int. J. Disaster Risk Reduct. 2022, 82, 103344. [Google Scholar] [CrossRef]
- Li, Z.; Fu, D.; Wang, J.; Min, K.; Zhang, J. Urban Resilience Assessment Model for Waterlogging Disasters and Its Application. J. Tsinghua Univ. Sci. Technol. 2022, 62, 266–276. [Google Scholar]
- Sajjad, M. Disaster Resilience in Pakistan: A Comprehensive Multi-Dimensional Spatial Profiling. Appl. Geogr. 2021, 126, 102367. [Google Scholar] [CrossRef]
- Kotzee, I.; Reyers, B. Piloting a Social-Ecological Index for Measuring Flood Resilience: A Composite Index Approach. Ecol. Indic. 2016, 60, 45–53. [Google Scholar]
- Ling, T.-Y.; Chiang, Y.-C. Strengthening the Resilience of Urban Retailers towards Flood Risks-A Case Study in the Riverbank Region of Kaohsiung City. Int. J. Disaster Risk Reduct. 2018, 27, 541–555. [Google Scholar] [CrossRef]
- Burbules, N.C.; Fan, G.; Repp, P. Five Trends of Education and Technology in a Sustainable Future. Geogr. Sustain. 2020, 1, 93–97. [Google Scholar]
- Cutter, S.L.; Barnes, L.; Berry, M.; Burton, C.; Evans, E.; Tate, E.; Webb, J. A Place-Based Model for Understanding Community Resilience to Natural Disasters. Glob. Environ. Chang. 2008, 18, 598–606. [Google Scholar] [CrossRef]
- Forrest, S.A.; Trell, E.-M.; Woltjer, J. Socio-Spatial Inequalities in Flood Resilience: Rainfall Flooding in the City of Arnhem. Cities 2020, 105, 102843. [Google Scholar] [CrossRef]
- Cao, F.; Xu, X.; Zhang, C.; Kong, W. Evaluation of Urban Flood Resilience and Its Space-Time Evolution: A Case Study of Zhejiang Province, China. Ecol. Indic. 2023, 154, 110643. [Google Scholar] [CrossRef]
- Zhang, H.; Yang, J.; Li, L.; Shen, D.; Wei, G.; Dong, S. Measuring the Resilience to Floods: A Comparative Analysis of Key Flood Control Cities in China. Int. J. Disaster Risk Reduct. 2021, 59, 102248. [Google Scholar] [CrossRef]
- Cutter, S.L.; Ash, K.D.; Emrich, C.T. The Geographies of Community Disaster Resilience. Glob. Environ. Chang. 2014, 29, 65–77. [Google Scholar] [CrossRef]
- Tian, C.; Fang, Y.; Yang, L.E.; Zhang, C. Spatial-Temporal Analysis of Community Resilience to Multi-Hazards in the Anning River Basin, Southwest China. Int. J. Disaster Risk Reduct. 2019, 39, 101144. [Google Scholar] [CrossRef]
- AbouKorin, S.A.A.; Han, H.; Mahran, M.G.N. Role of Urban Planning Characteristics in Forming Pandemic Resilient Cities–Case Study of COVID-19 Impacts on European Cities within England, Germany and Italy. Cities 2021, 118, 103324. [Google Scholar] [CrossRef]
- Yang, Y.; Guo, H.; Wang, D.; Ke, X.; Li, S.; Huang, S. Flood Vulnerability and Resilience Assessment in China Based on Super-Efficiency DEA and SBM-DEA Methods. J. Hydrol. 2021, 600, 126470. [Google Scholar] [CrossRef]
- Ruan, J.; Chen, Y.; Yang, Z. Assessment of Temporal and Spatial Progress of Urban Resilience in Guangzhou under Rainstorm Scenarios. Int. J. Disaster Risk Reduct. 2021, 66, 102578. [Google Scholar] [CrossRef]
- Ji, J.; Fang, L.; Chen, J.; Ding, T. A Novel Framework for Urban Flood Resilience Assessment at the Urban Agglomeration Scale. Int. J. Disaster Risk Reduct. 2024, 108, 104519. [Google Scholar] [CrossRef]
- Cheng, T.; Zhao, Y.; Zhao, C. Exploring the Spatio-Temporal Evolution of Economic Resilience in Chinese Cities during the COVID-19 Crisis. Sustain. Cities Soc. 2022, 84, 103997. [Google Scholar] [CrossRef]
- Dhar, T.; Bornstein, L.; Lizarralde, G.; Nazimuddin, S.M. Risk Perception—A Lens for Understanding Adaptive Behaviour in the Age of Climate Change? Narratives from the Global South. Int. J. Disaster Risk Reduct. 2023, 95, 103886. [Google Scholar] [CrossRef]
- Wang, C.; Wu, J.; Buren, J.; Guo, E.; Liang, H. Modeling the Inter-Regional Economic Consequences of Sequential Typhoon Disasters in China. J. Clean. Prod. 2021, 298, 126740. [Google Scholar] [CrossRef]
- Ye, X.; Du, J.; Han, Y.; Newman, G.; Retchless, D.; Zou, L.; Ham, Y.; Cai, Z. Developing Human-Centered Urban Digital Twins for Community Infrastructure Resilience: A Research Agenda. J. Plan. Lit. 2023, 38, 187–199. [Google Scholar] [CrossRef]
- Gim, J.; Shin, S. Disaster Vulnerability and Community Resilience Factors Affecting Post-Disaster Wellness: A Longitudinal Analysis of the Survey on the Change of Life of Disaster Victim. Int. J. Disaster Risk Reduct. 2022, 81, 103273. [Google Scholar] [CrossRef]
- Urbina L, O.J.; Fekete, A.; Matos, J.C.; Teixeira, E.R. Social Resilience Assessment for Urban Fires in Guimarães Historic Center. Int. J. Disaster Risk Reduct. 2025, 117, 105131. [Google Scholar] [CrossRef]
- Cui, Y.; Liang, D.; Ewing, B. Analysis of Employment Change in Response to Hurricane Landfalls. Nat. Hazards Earth Syst. Sci. 2020, 20, 413–424. [Google Scholar] [CrossRef]
- Suppasri, A.; Maly, E.; Kitamura, M.; Syamsidik; Pescaroli, G.; Alexander, D.; Imamura, F. Cascading Disasters Triggered by Tsunami Hazards: A Perspective for Critical Infrastructure Resilience and Disaster Risk Reduction. Int. J. Disaster Risk Reduct. 2021, 66, 102597. [Google Scholar] [CrossRef]
- Zhao, T.; Tang, Y.; Li, Q.; Wang, J. Enhancing Urban System Resilience to Earthquake Disasters: Impact of Interdependence and Resource Allocation. Int. J. Crit. Infrastruct. Prot. 2024, 45, 100673. [Google Scholar] [CrossRef]
- Kameshwar, S.; Cox, D.T.; Barbosa, A.R.; Farokhnia, K.; Park, H.; Alam, M.S.; van de Lindt, J.W. Probabilistic Decision-Support Framework for Community Resilience: Incorporating Multi-Hazards, Infrastructure Interdependencies, and Resilience Goals in a Bayesian Network. Reliab. Eng. Syst. Saf. 2019, 191, 106568. [Google Scholar] [CrossRef]
- Zhang, C.; Li, Y.; Zhu, X. A Social-Ecological Resilience Assessment and Governance Guide for Urbanization Processes in East China. Sustainability 2016, 8, 1101. [Google Scholar] [CrossRef]
- Carabine, E.; Wilkinson, E. How Can Local Governance Systems Strengthen Community Resilience? A Social-Ecological Systems Approach. Polit. Gov. 2016, 4, 62–73. [Google Scholar] [CrossRef]
- Türker, H.B.; Kalkan, M.; Ortaç, G. Reimagining Resilience: The Transformative Role of Urban Green Areas in Türkiye’s Disaster Preparedness. Int. J. Disaster Risk Reduct. 2024, 106, 104397. [Google Scholar] [CrossRef]
- Kim, S.Y.; Kim, B.H.S. The Effect of Urban Green Infrastructure on Disaster Mitigation in Korea. Sustainability 2017, 9, 1026. [Google Scholar] [CrossRef]
- Wang, Z.; Wang, L.; Lu, X.; Dai, X.; Zhai, F.; Du, H.; Xie, C.; Gao, X.; Yang, D.; Ji, D. The Function of Urban Green Space in Avoiding Disasters in Central Shanghai, China. J. Urban Plan. Dev. 2023, 149, 05023017. [Google Scholar] [CrossRef]
- Yang, Z.; Solangi, Y.A. Analyzing the Relationship between Natural Resource Management, Environmental Protection, and Agricultural Economics for Sustainable Development in China. J. Clean. Prod. 2024, 450, 141862. [Google Scholar] [CrossRef]
- Zhen, N.; Fu, B.; Lu, Y.; Wang, S. Poverty Reduction, Environmental Protection and Ecosystem Services: A Prospective Theory for Sustainable Development. Chin. Geogr. Sci. 2014, 24, 83–92. [Google Scholar] [CrossRef]
- De Winter, J.C.; Gosling, S.D.; Potter, J. Comparing the Pearson and Spearman Correlation Coefficients across Distributions and Sample Sizes: A Tutorial Using Simulations and Empirical Data. Psychol. Methods 2016, 21, 273. [Google Scholar]
- Wu, X.; Huang, X. Screening of Urban Environmental Vulnerability Indicators Based on Coefficient of Variation and Anti-Image Correlation Matrix Method. Ecol. Indic. 2023, 150, 110196. [Google Scholar] [CrossRef]
- Diakoulaki, D.; Mavrotas, G.; Papayannakis, L. Determining Objective Weights in Multiple Criteria Problems: The Critic Method. Comput. Oper. Res. 1995, 22, 763–770. [Google Scholar] [CrossRef]
- Wen, X.; Nie, Y.; Du, Z.; Huang, L. Operational Safety Assessment of Straddle-Type Monorail Vehicle System Based on Cloud Model and Improved CRITIC Method. Eng. Fail. Anal. 2022, 139, 106463. [Google Scholar] [CrossRef]
- Peng, C.; Feng, D.; Guo, S. Material Selection in Green Design: A Method Combining DEA and TOPSIS. Sustainability 2021, 13, 5497. [Google Scholar] [CrossRef]
- Wang, Y.-J.; Lee, H.-S. Generalizing TOPSIS for Fuzzy Multiple-Criteria Group Decision-Making. Comput. Math. Appl. 2007, 53, 1762–1772. [Google Scholar] [CrossRef]
- Groen, E.A.; Heijungs, R.; Bokkers, E.A.; De Boer, I.J. Sensitivity Analysis in Life Cycle Assessment. In Proceedings of the 9th International Conference on Life Cycle Assessment in the Agri-Food Sector, San Francisco, CA, USA, 8–10 October 2014; ACLCA: Vashon, WA, USA, 2014; pp. 8–10. [Google Scholar]
- Sun, Z.; Kang, D.; Jiao, H.; Yang, Y.; Xue, W.; Wu, H.; Liu, L.; Su, Y.; Peng, Z. Spatial and Temporal Evolution of the Characteristics of Spatially Aggregated Elements in an Urban Area: A Case Study of Wuhan, China. ISPRS Int. J. Geo-Inf. 2023, 12, 448. [Google Scholar] [CrossRef]
- Huang, J.; Ding, A.; Li, Y.; Lu, D. Increasing the Risk Management Effectiveness from Higher Accuracy: A Novel Non-Parametric Method. Pac.-Basin Finance J. 2020, 62, 101373. [Google Scholar] [CrossRef]
- Koenig, W.D. Global Patterns of Environmental Synchrony and the Moran Effect. Ecography 2002, 25, 283–288. [Google Scholar]
- Chen, Y. New Approaches for Calculating Moran’s Index of Spatial Autocorrelation. PLoS ONE 2013, 8, e68336. [Google Scholar]
- Shepero, M.; Munkhammar, J. Spatial Markov Chain Model for Electric Vehicle Charging in Cities Using Geographical Information System (GIS) Data. Appl. Energy 2018, 231, 1089–1099. [Google Scholar] [CrossRef]
- Rabiner, L.R.; Juang, B.-H.; Levinson, S.E.; Sondhi, M.M. Some Properties of Continuous Hidden Markov Model Representations. ATT Tech. J. 1985, 64, 1251–1270. [Google Scholar] [CrossRef]
- Polykretis, C.; Alexakis, D.D. Spatial Stratified Heterogeneity of Fertility and Its Association with Socio-Economic Determinants Using Geographical Detector: The Case Study of Crete Island, Greece. Appl. Geogr. 2021, 127, 102384. [Google Scholar] [CrossRef]
- Wang, j.; Xu, C. Geodetector: Principle and prospective. Acta Geogr. Sin. 2017, 72, 116–134. [Google Scholar]
- Lu, H.; Zhang, C.; Jiao, L.; Wei, Y.; Zhang, Y. Analysis on the Spatial-Temporal Evolution of Urban Agglomeration Resilience: A Case Study in Chengdu-Chongqing Urban Agglomeration, China. Int. J. Disaster Risk Reduct. 2022, 79, 103167. [Google Scholar] [CrossRef]
- Guo, Z.; Li, Z.; Lu, C.; She, J.; Zhou, Y. Spatio-Temporal Evolution of Resilience: The Case of the Chengdu-Chongqing Urban Agglomeration in China. Cities 2024, 153, 105226. [Google Scholar] [CrossRef]
- Wang, H.; Xue, H.; He, W.; Han, Q.; Xu, T.; Gao, X.; Liu, S.; Jiang, R.; Huang, M. Spatial-Temporal Evolution Mechanism and Dynamic Simulation of the Urban Resilience System of the Guangdong-Hong Kong-Macao Greater Bay Area in China. Environ. Impact Assess. Rev. 2024, 104, 107333. [Google Scholar] [CrossRef]
- Mu, X.; Fang, C.; Yang, Z. Spatio-Temporal Evolution and Dynamic Simulation of the Urban Resilience of Beijing-Tianjin-Hebei Urban Agglomeration. J. Geogr. Sci. 2022, 32, 1766–1790. [Google Scholar] [CrossRef]
- Ashraf, J.; Luo, L.; Khan, M.A. The Spillover Effects of Institutional Quality and Economic Openness on Economic Growth for the Belt and Road Initiative (BRI) Countries. Spat. Stat. 2022, 47, 100566. [Google Scholar] [CrossRef]
- Zhao, N.; Wang, K.; Yuan, Y. Toward the Carbon Neutrality: Forest Carbon Sinks and Its Spatial Spillover Effect in China. Ecol. Econ. 2023, 209, 107837. [Google Scholar]
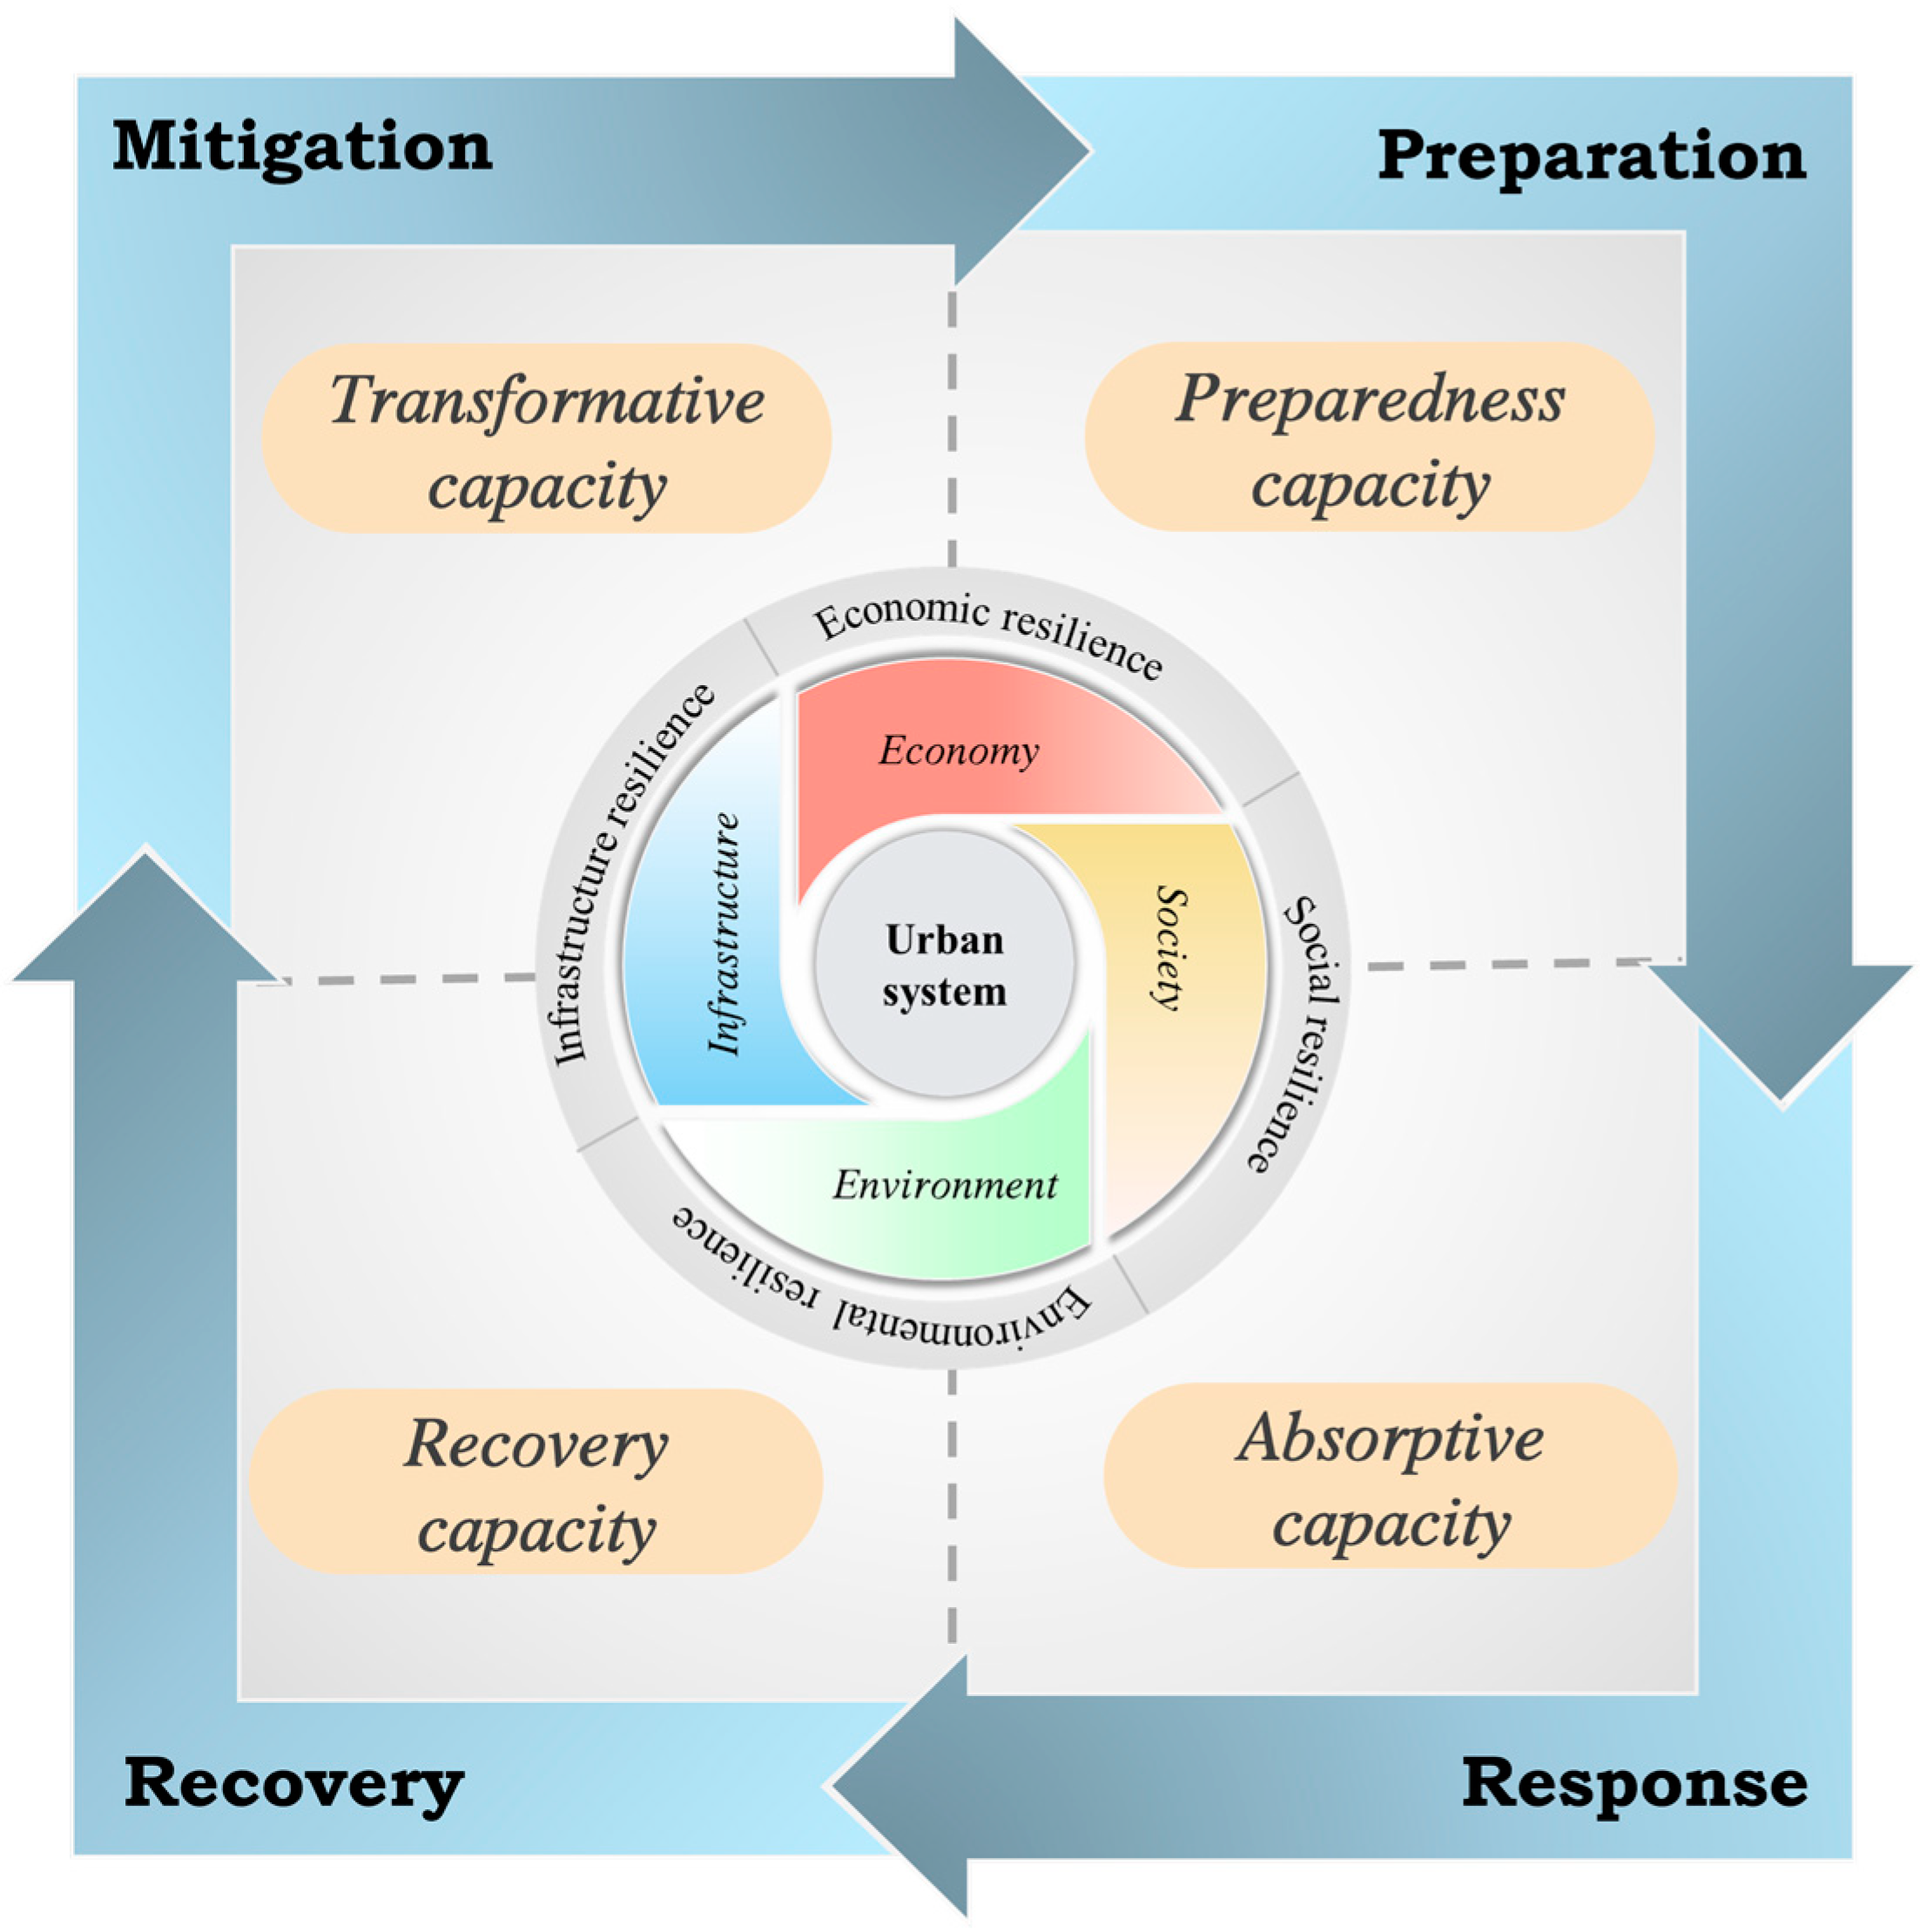
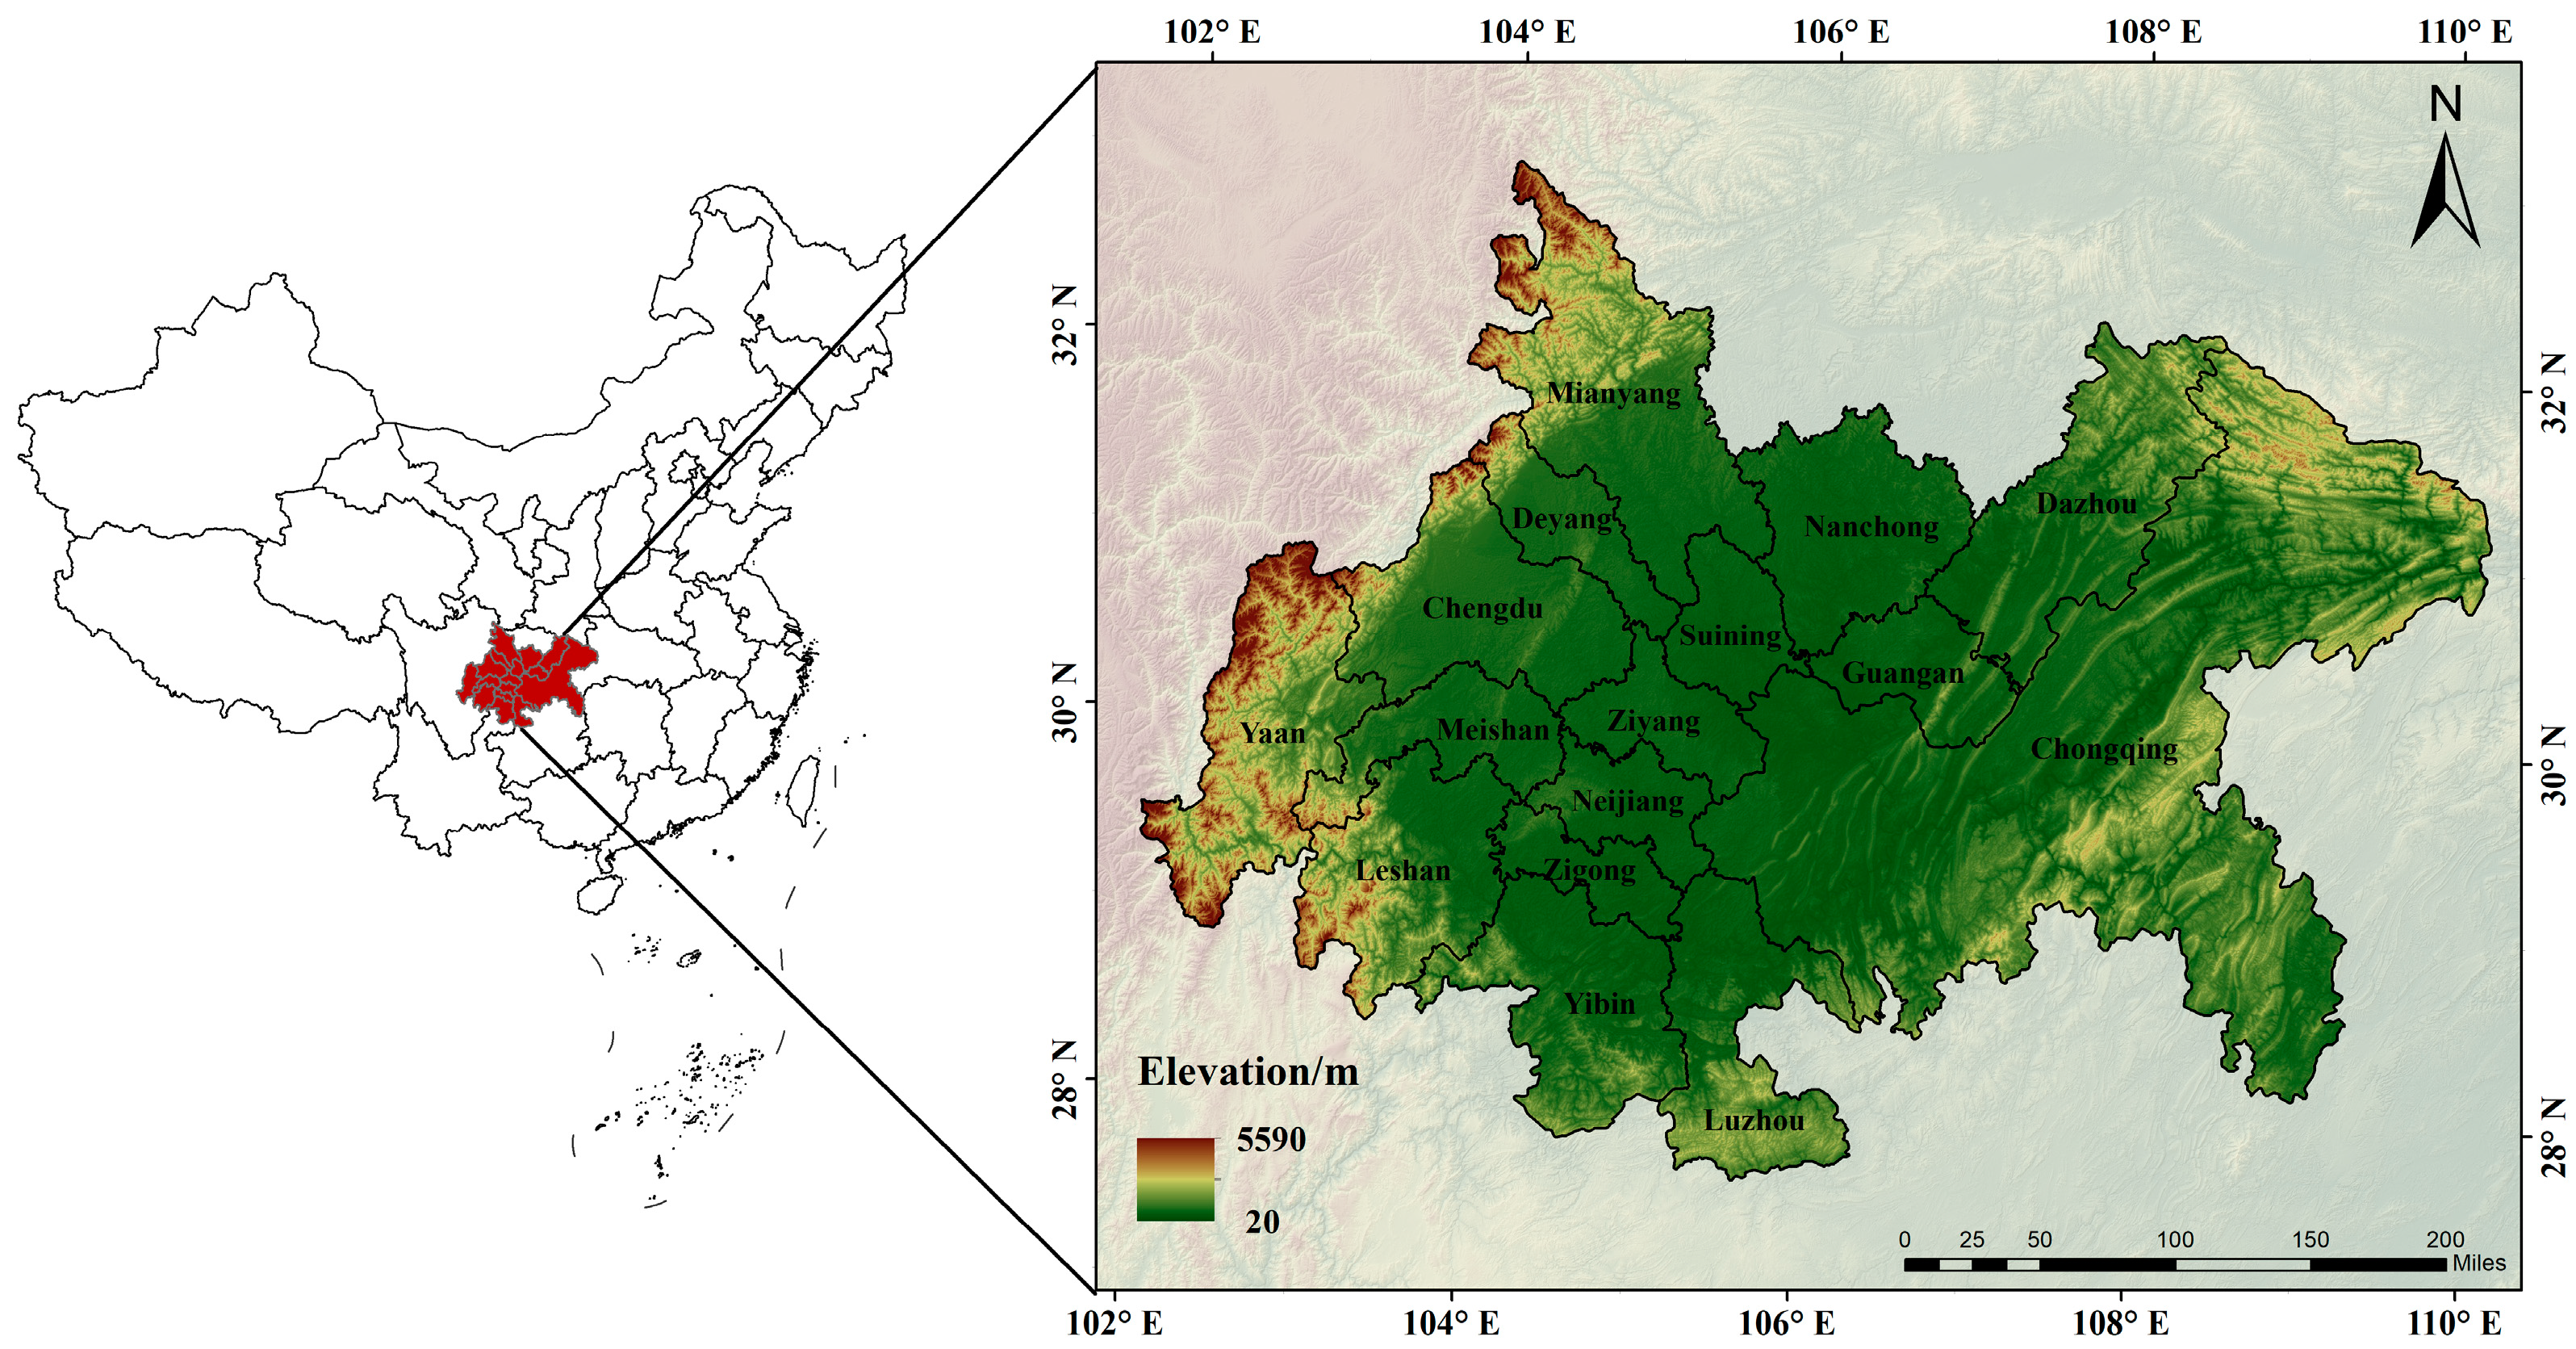
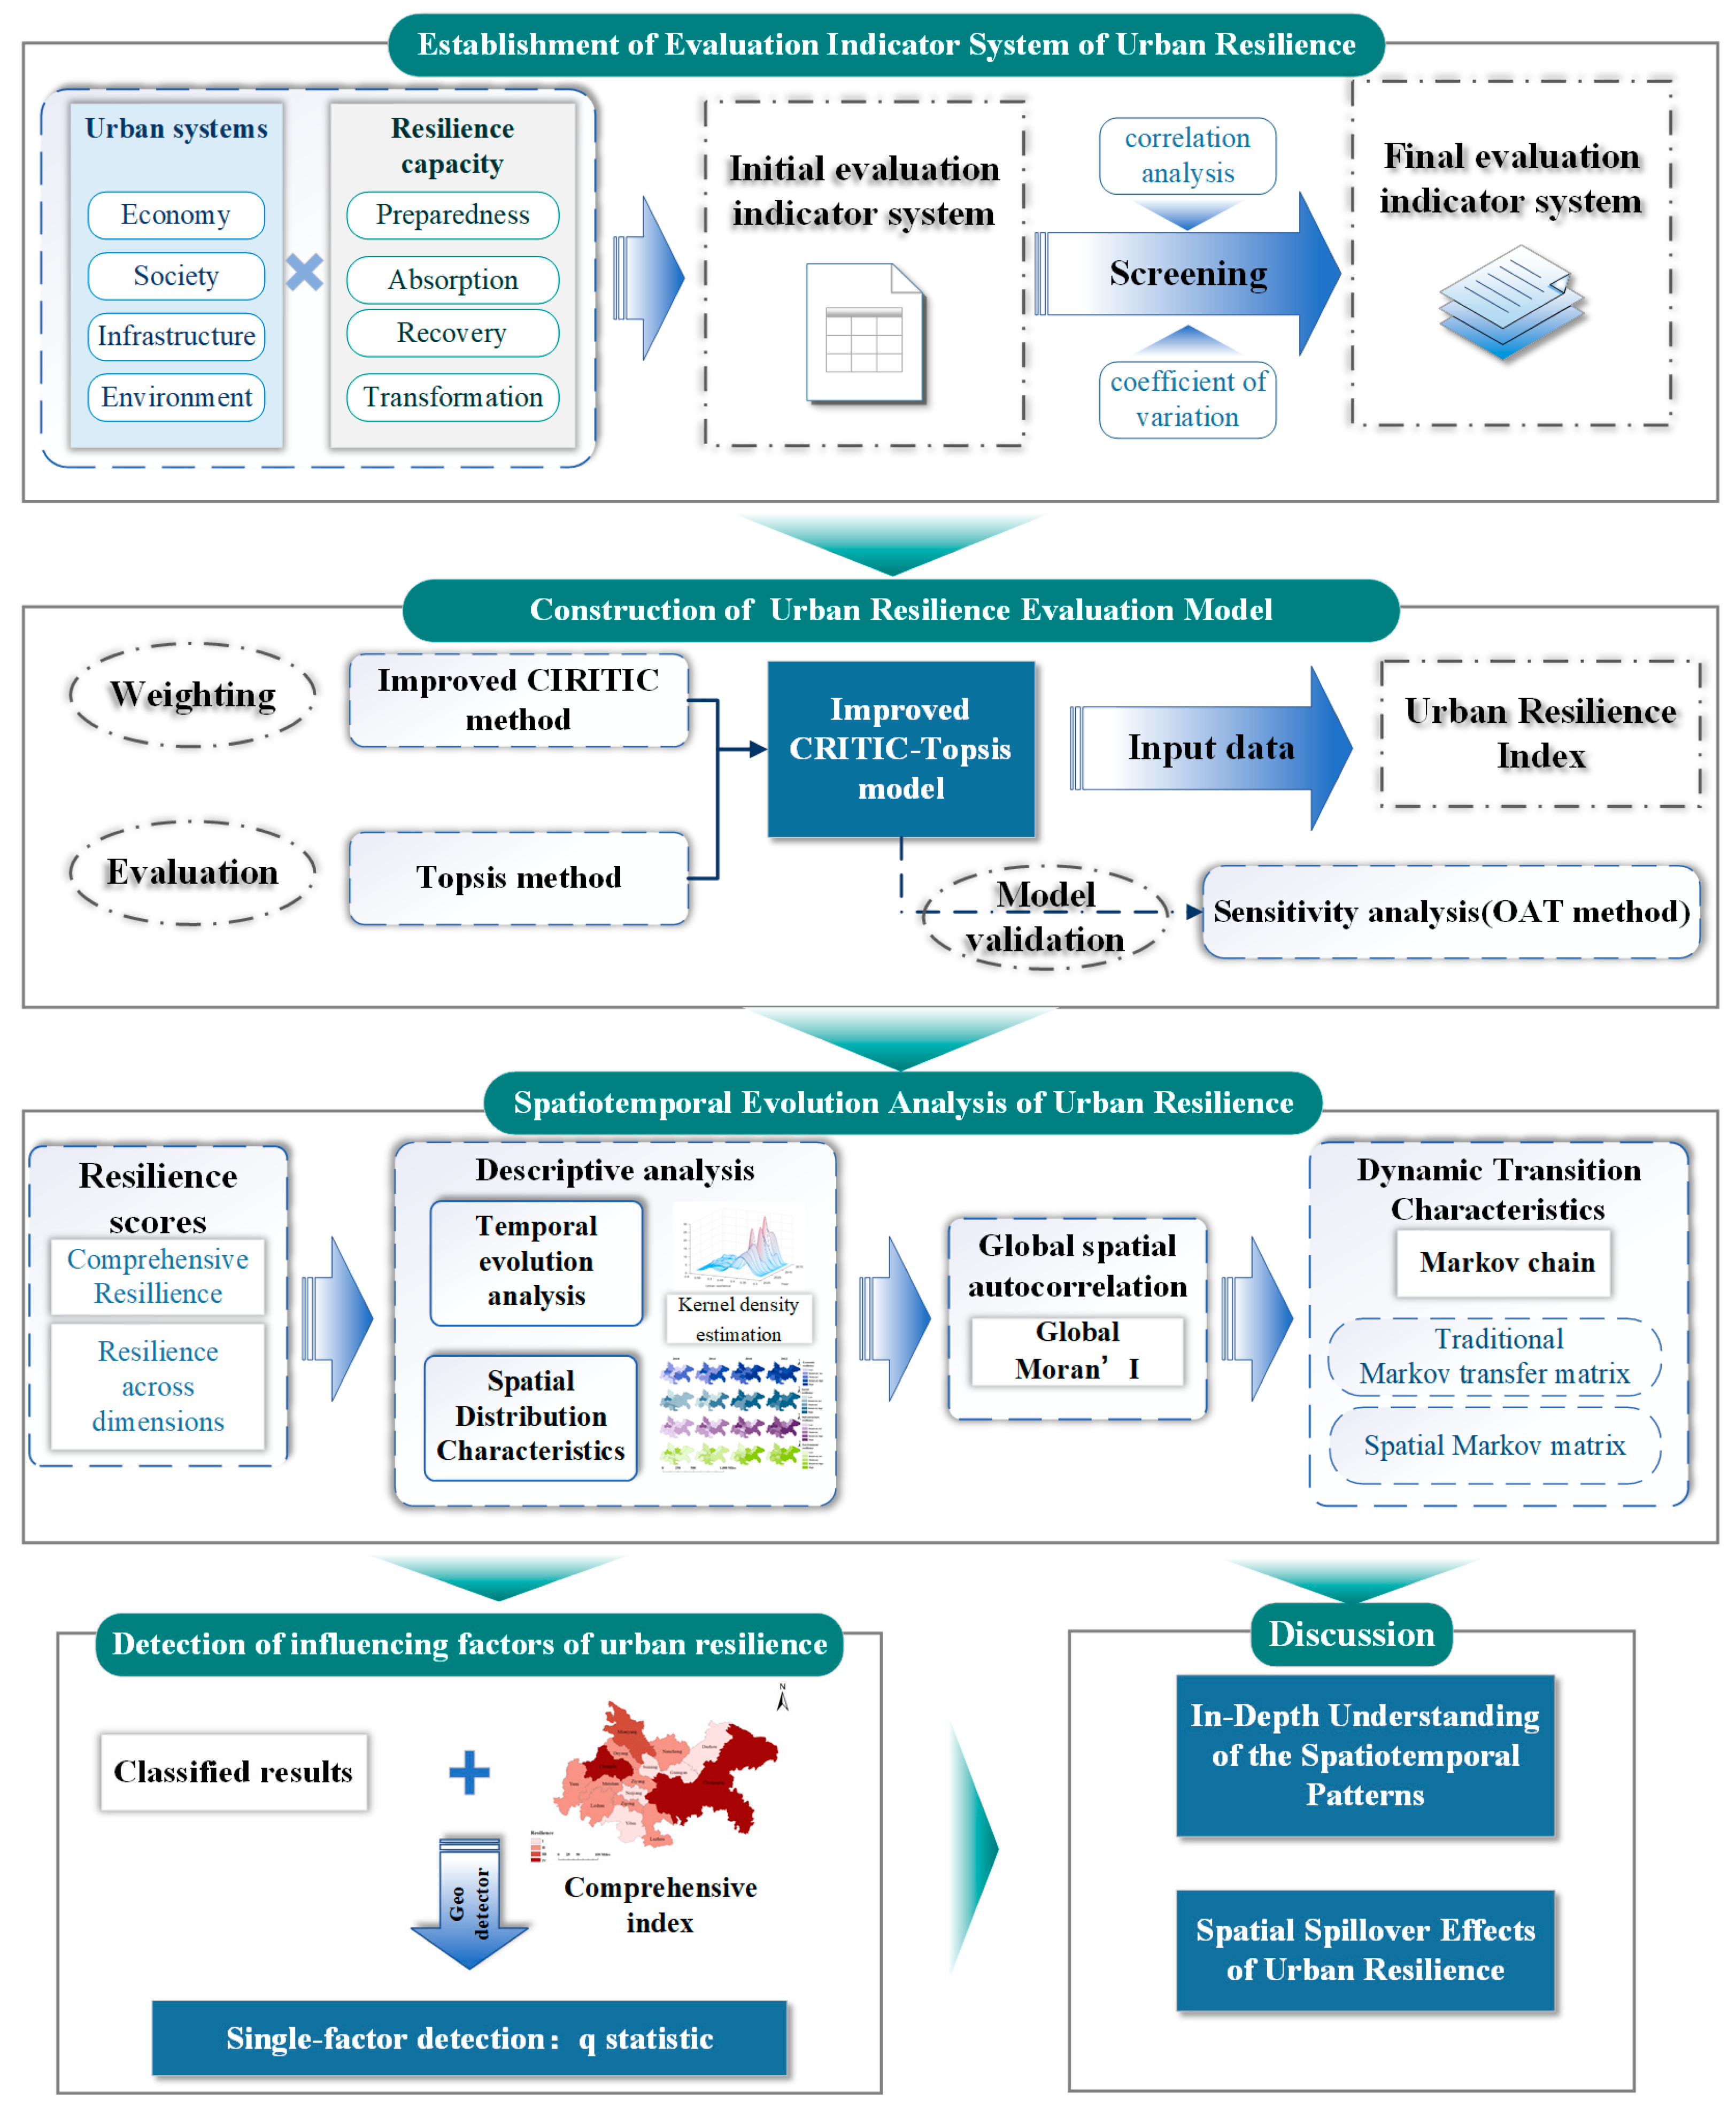
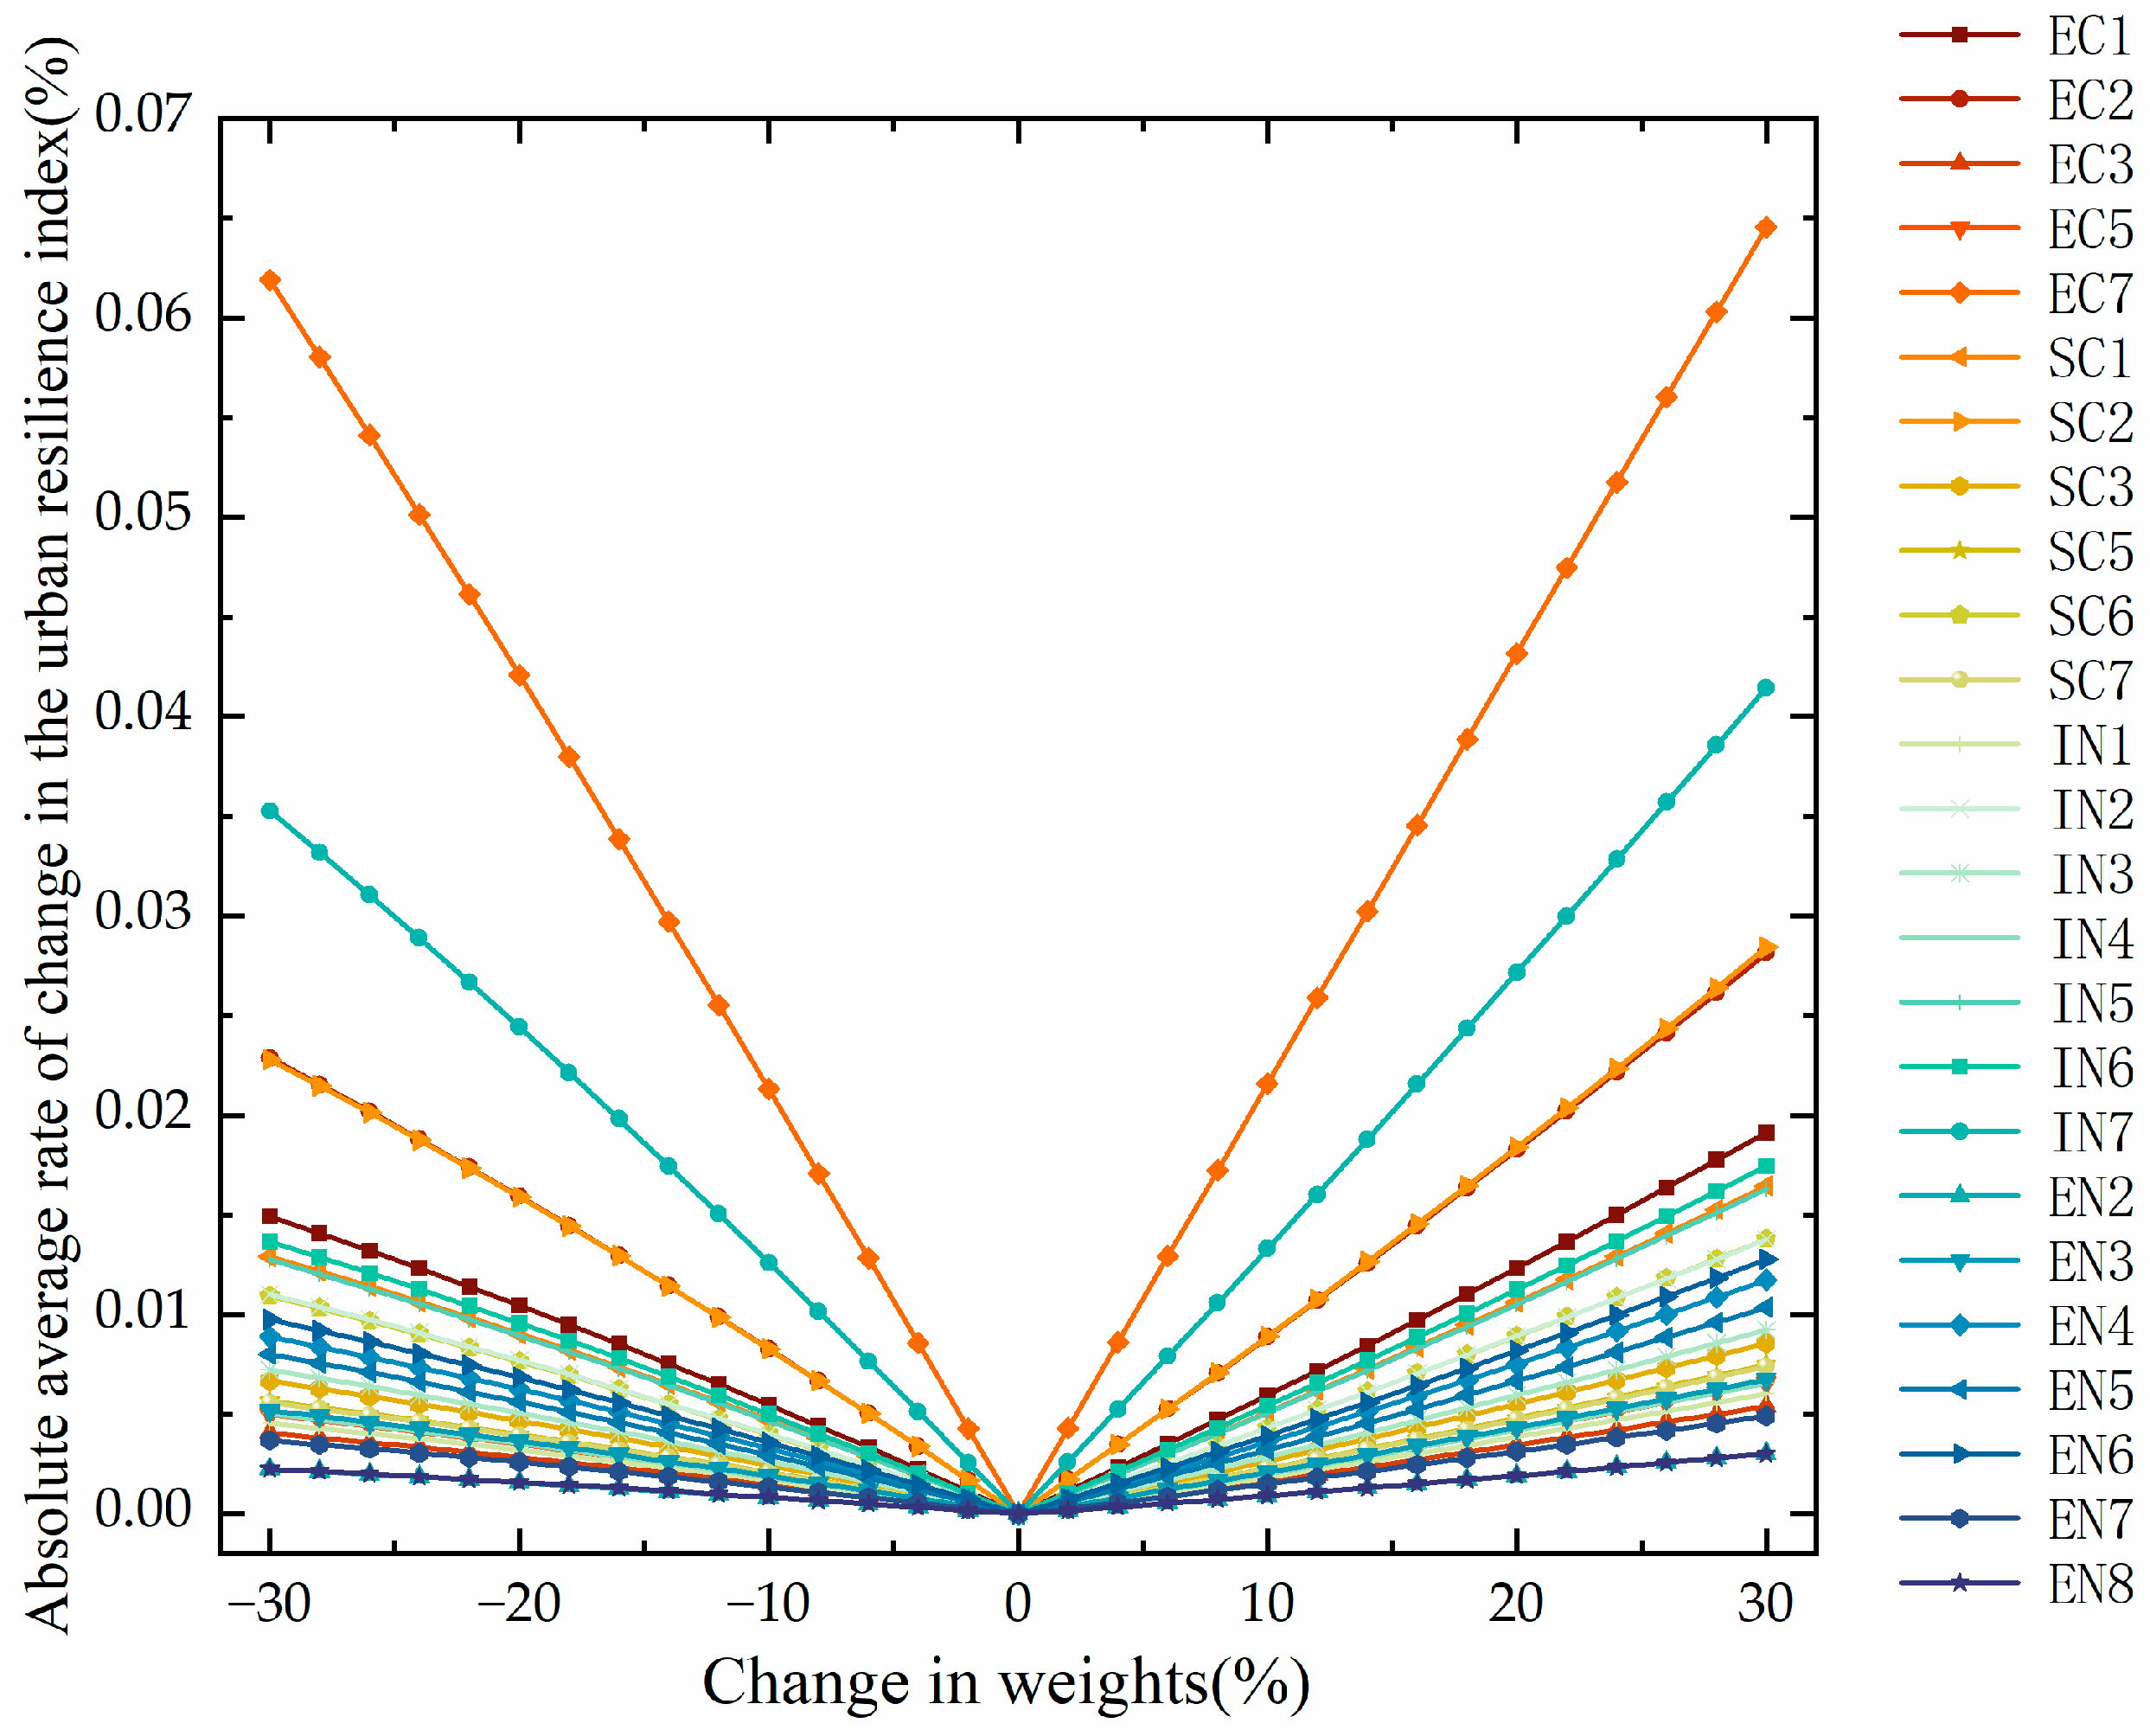

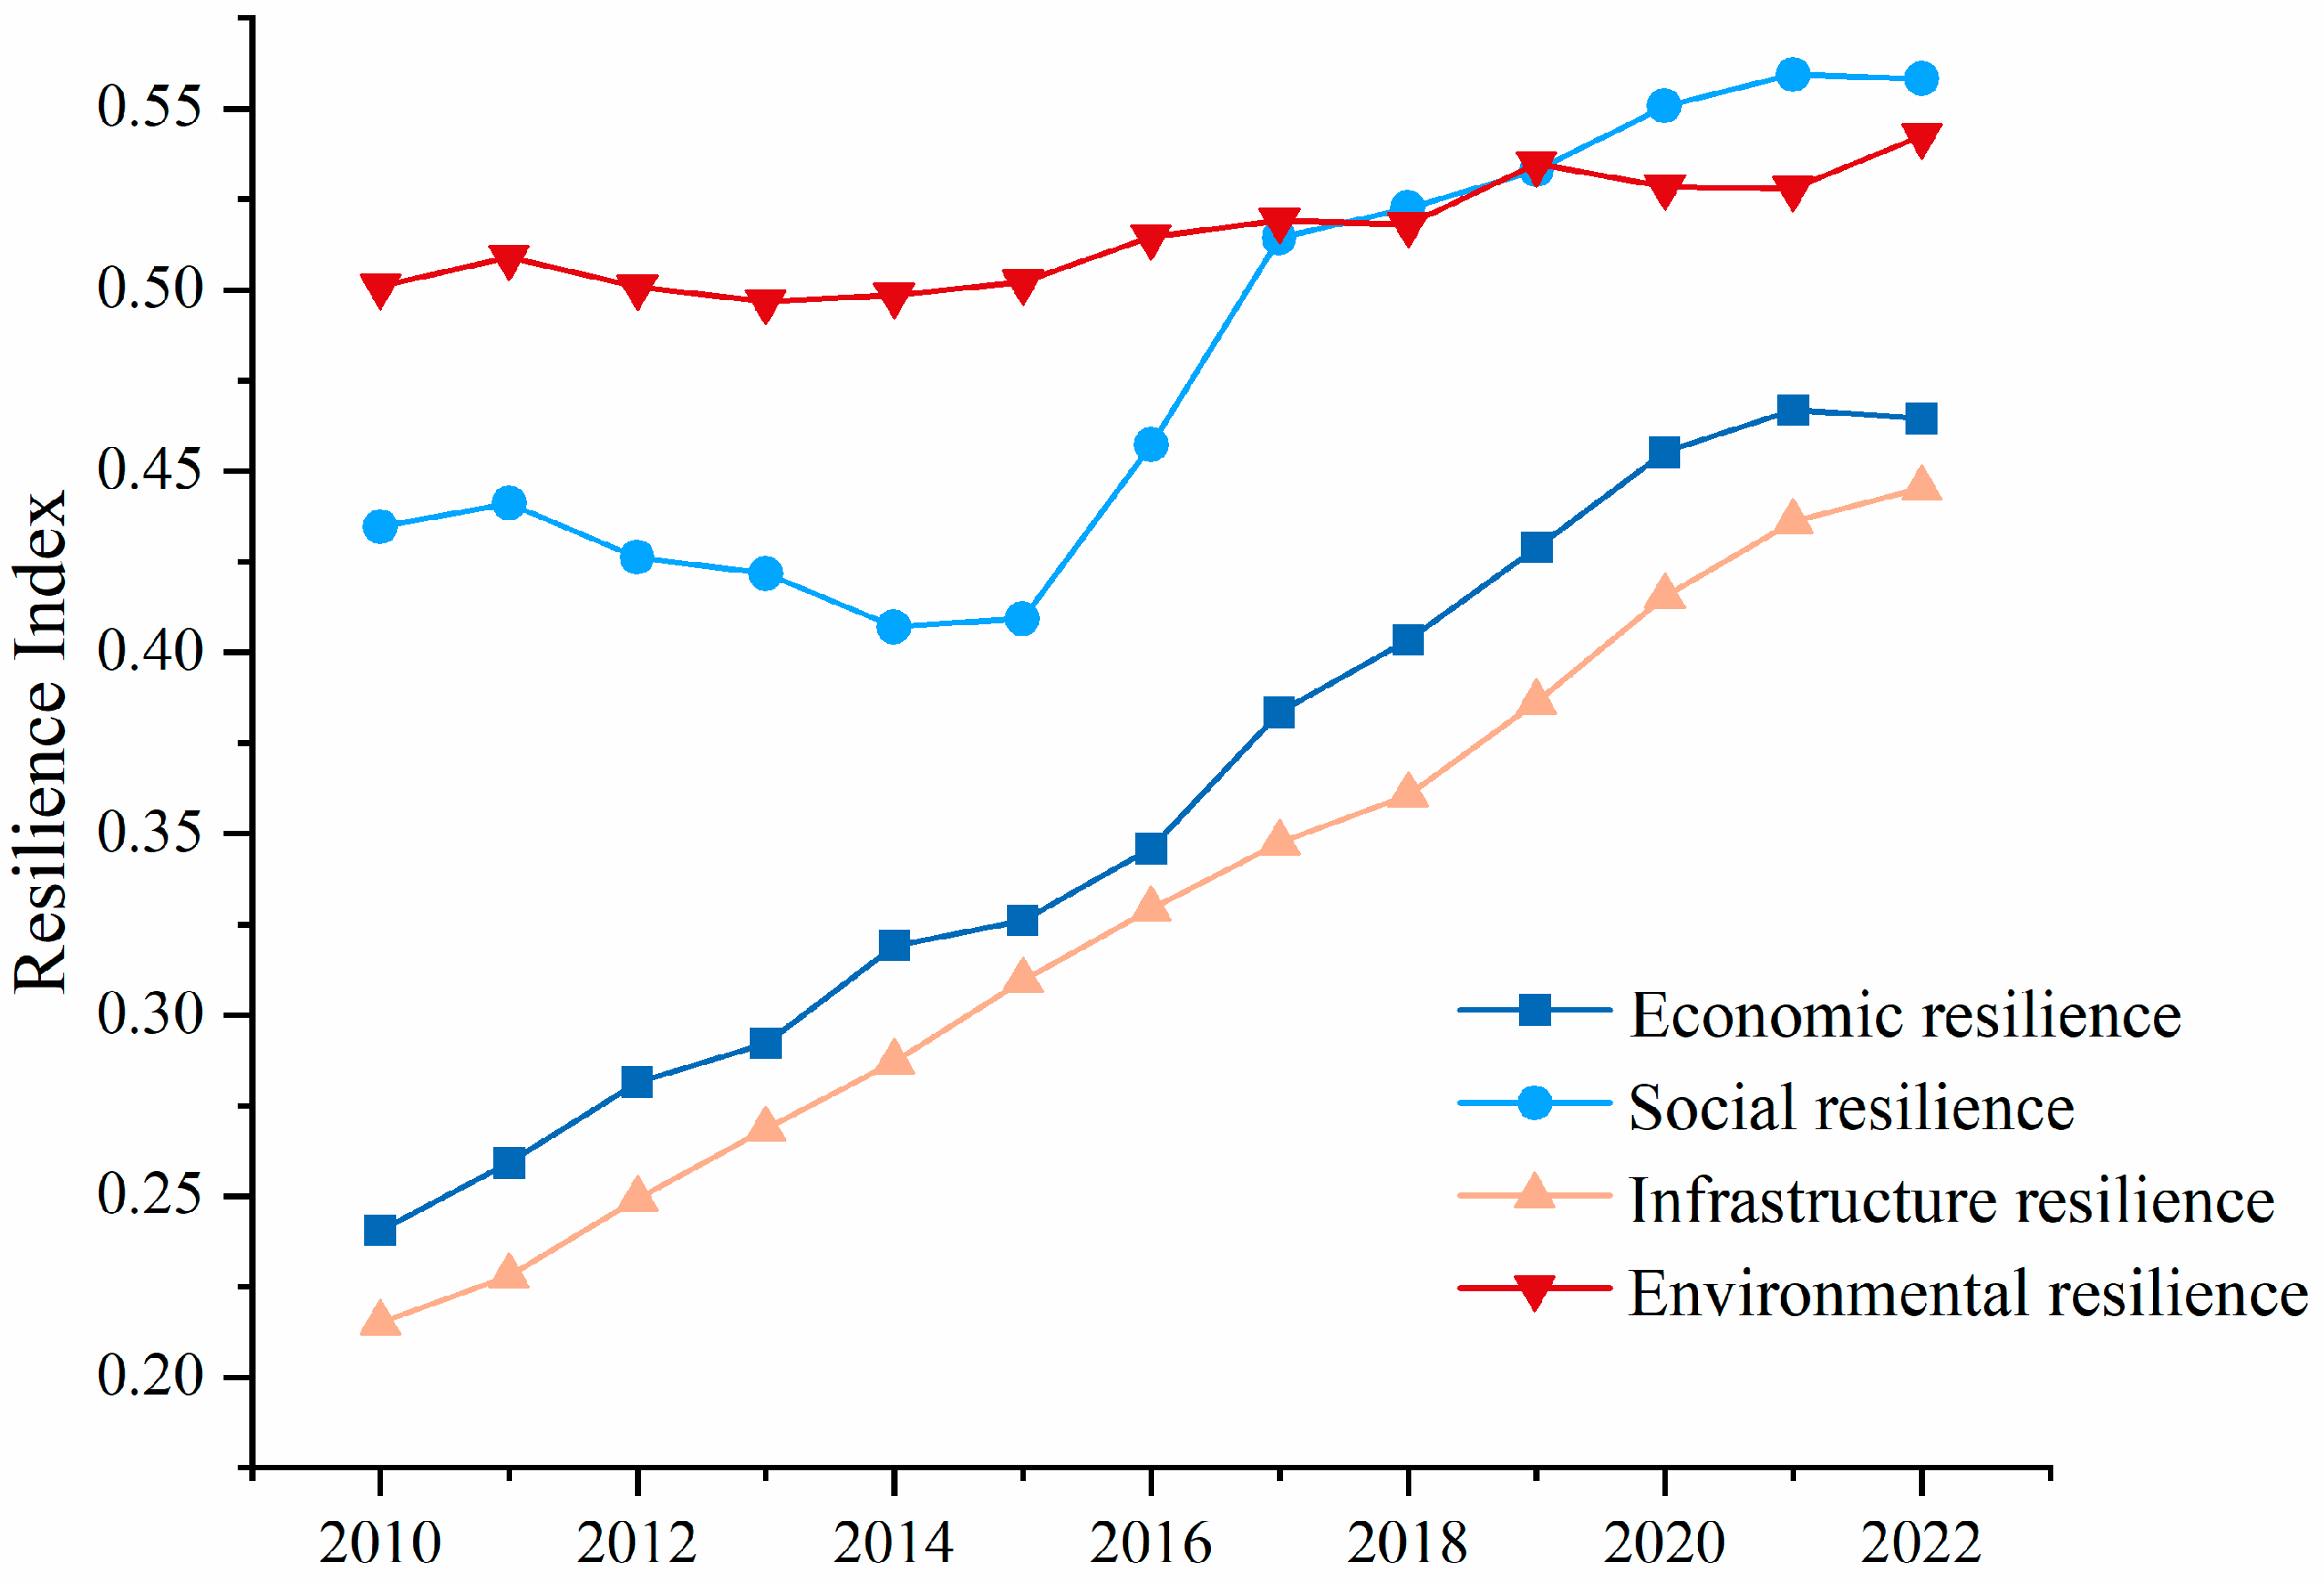

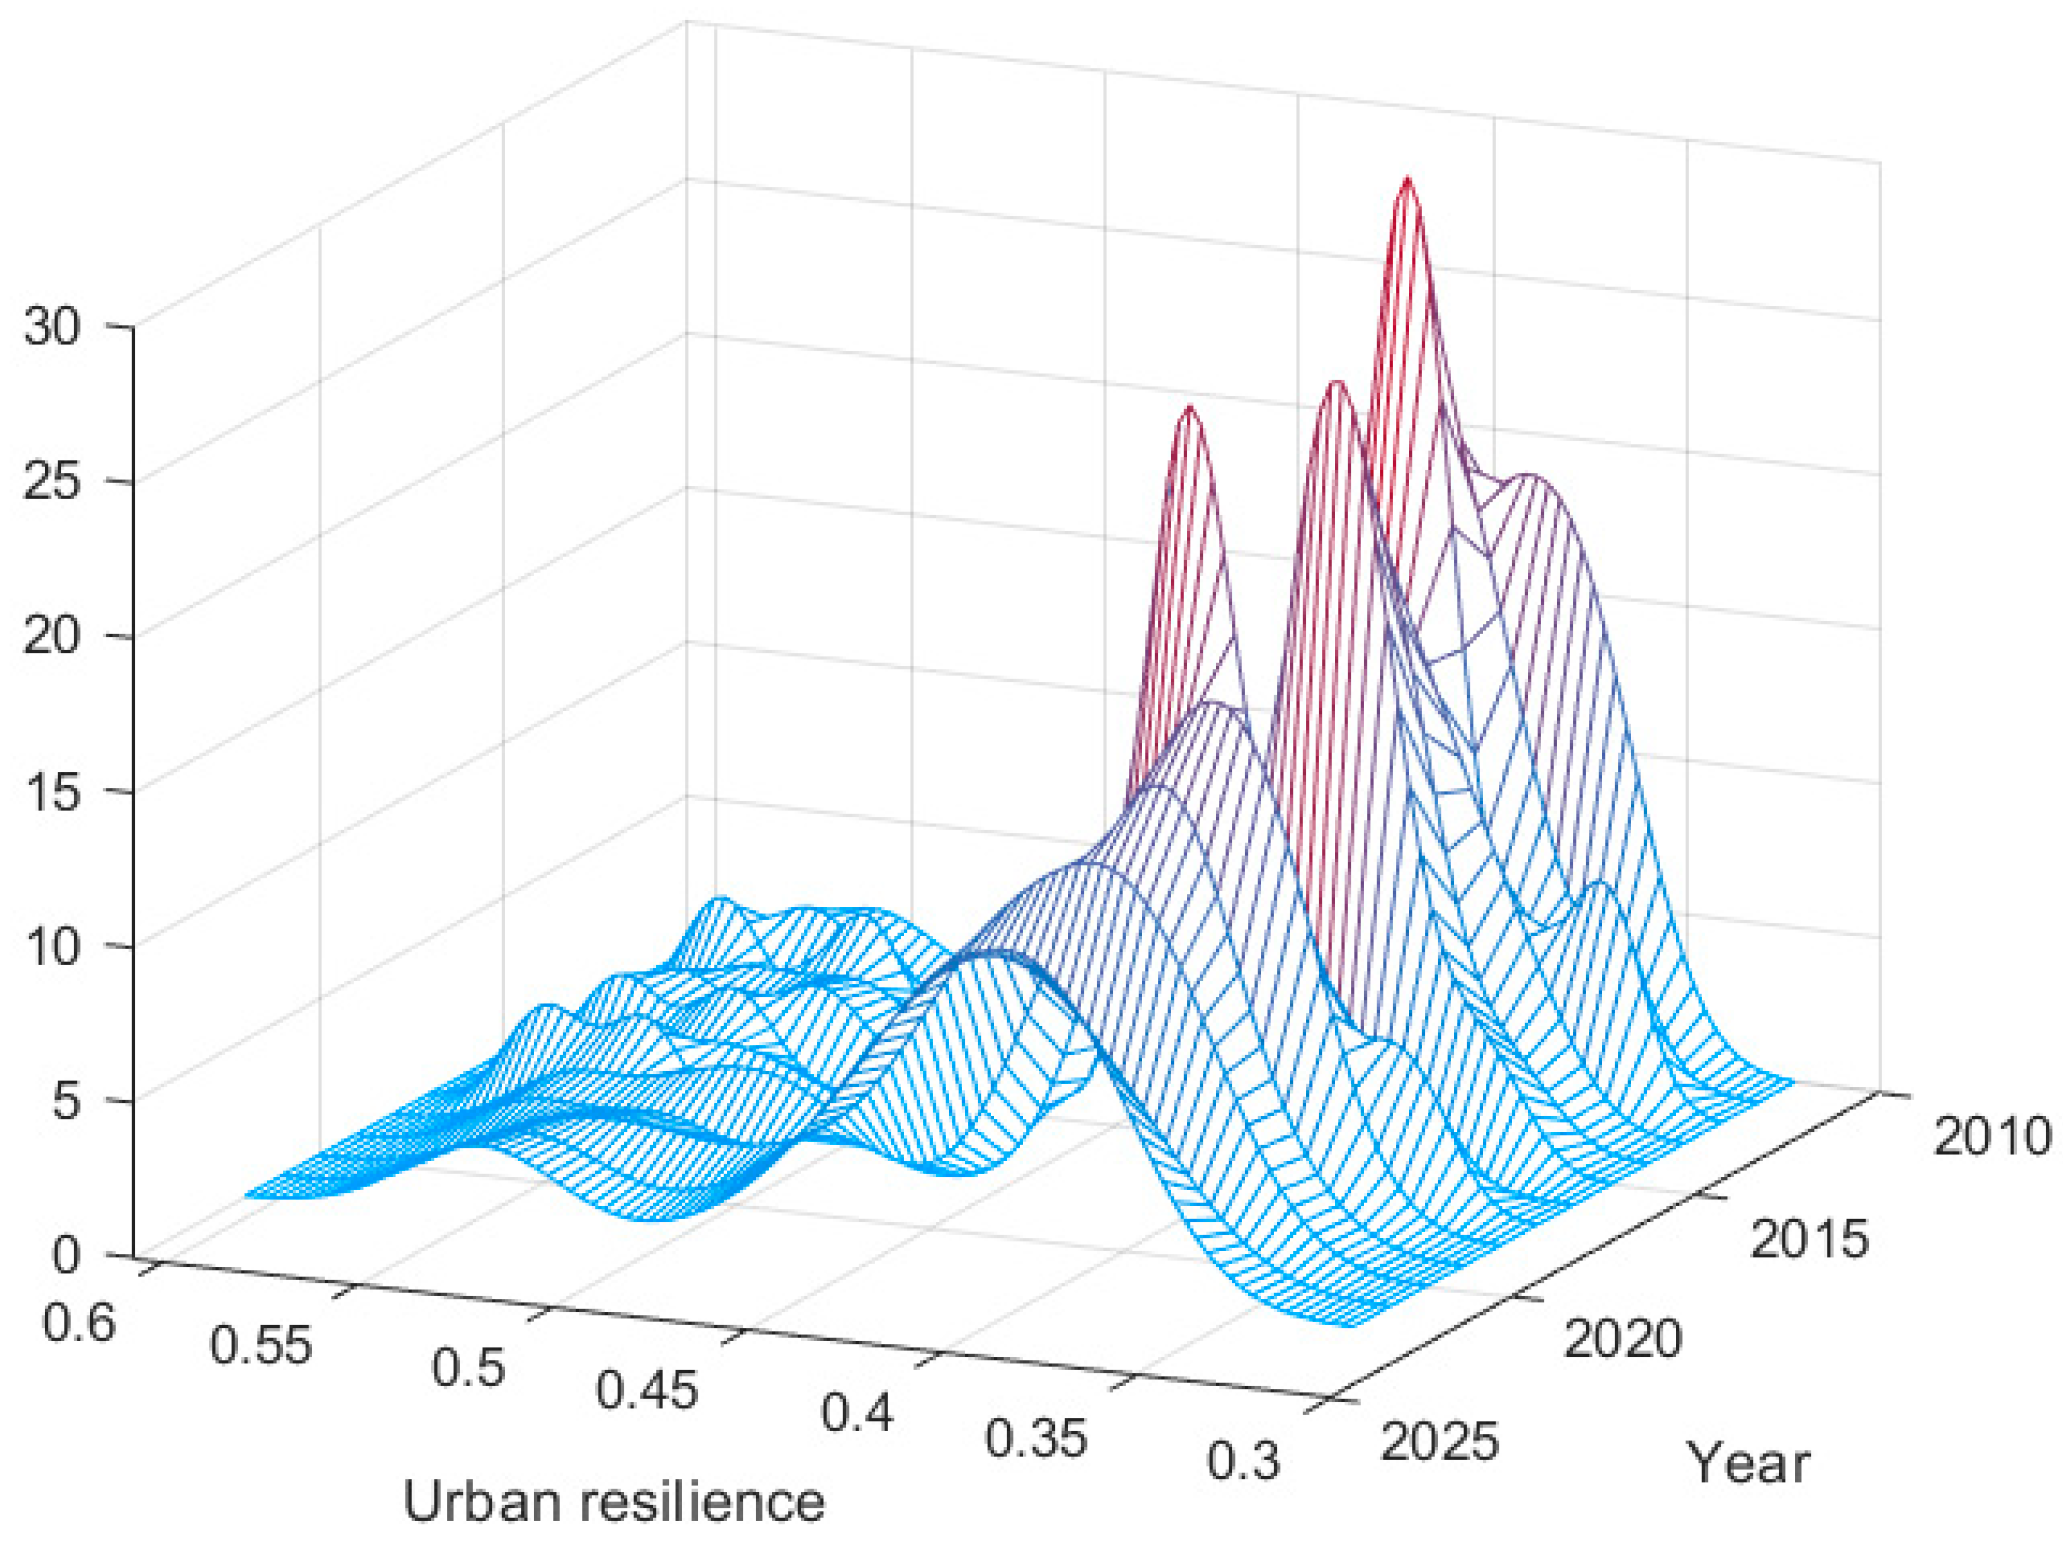

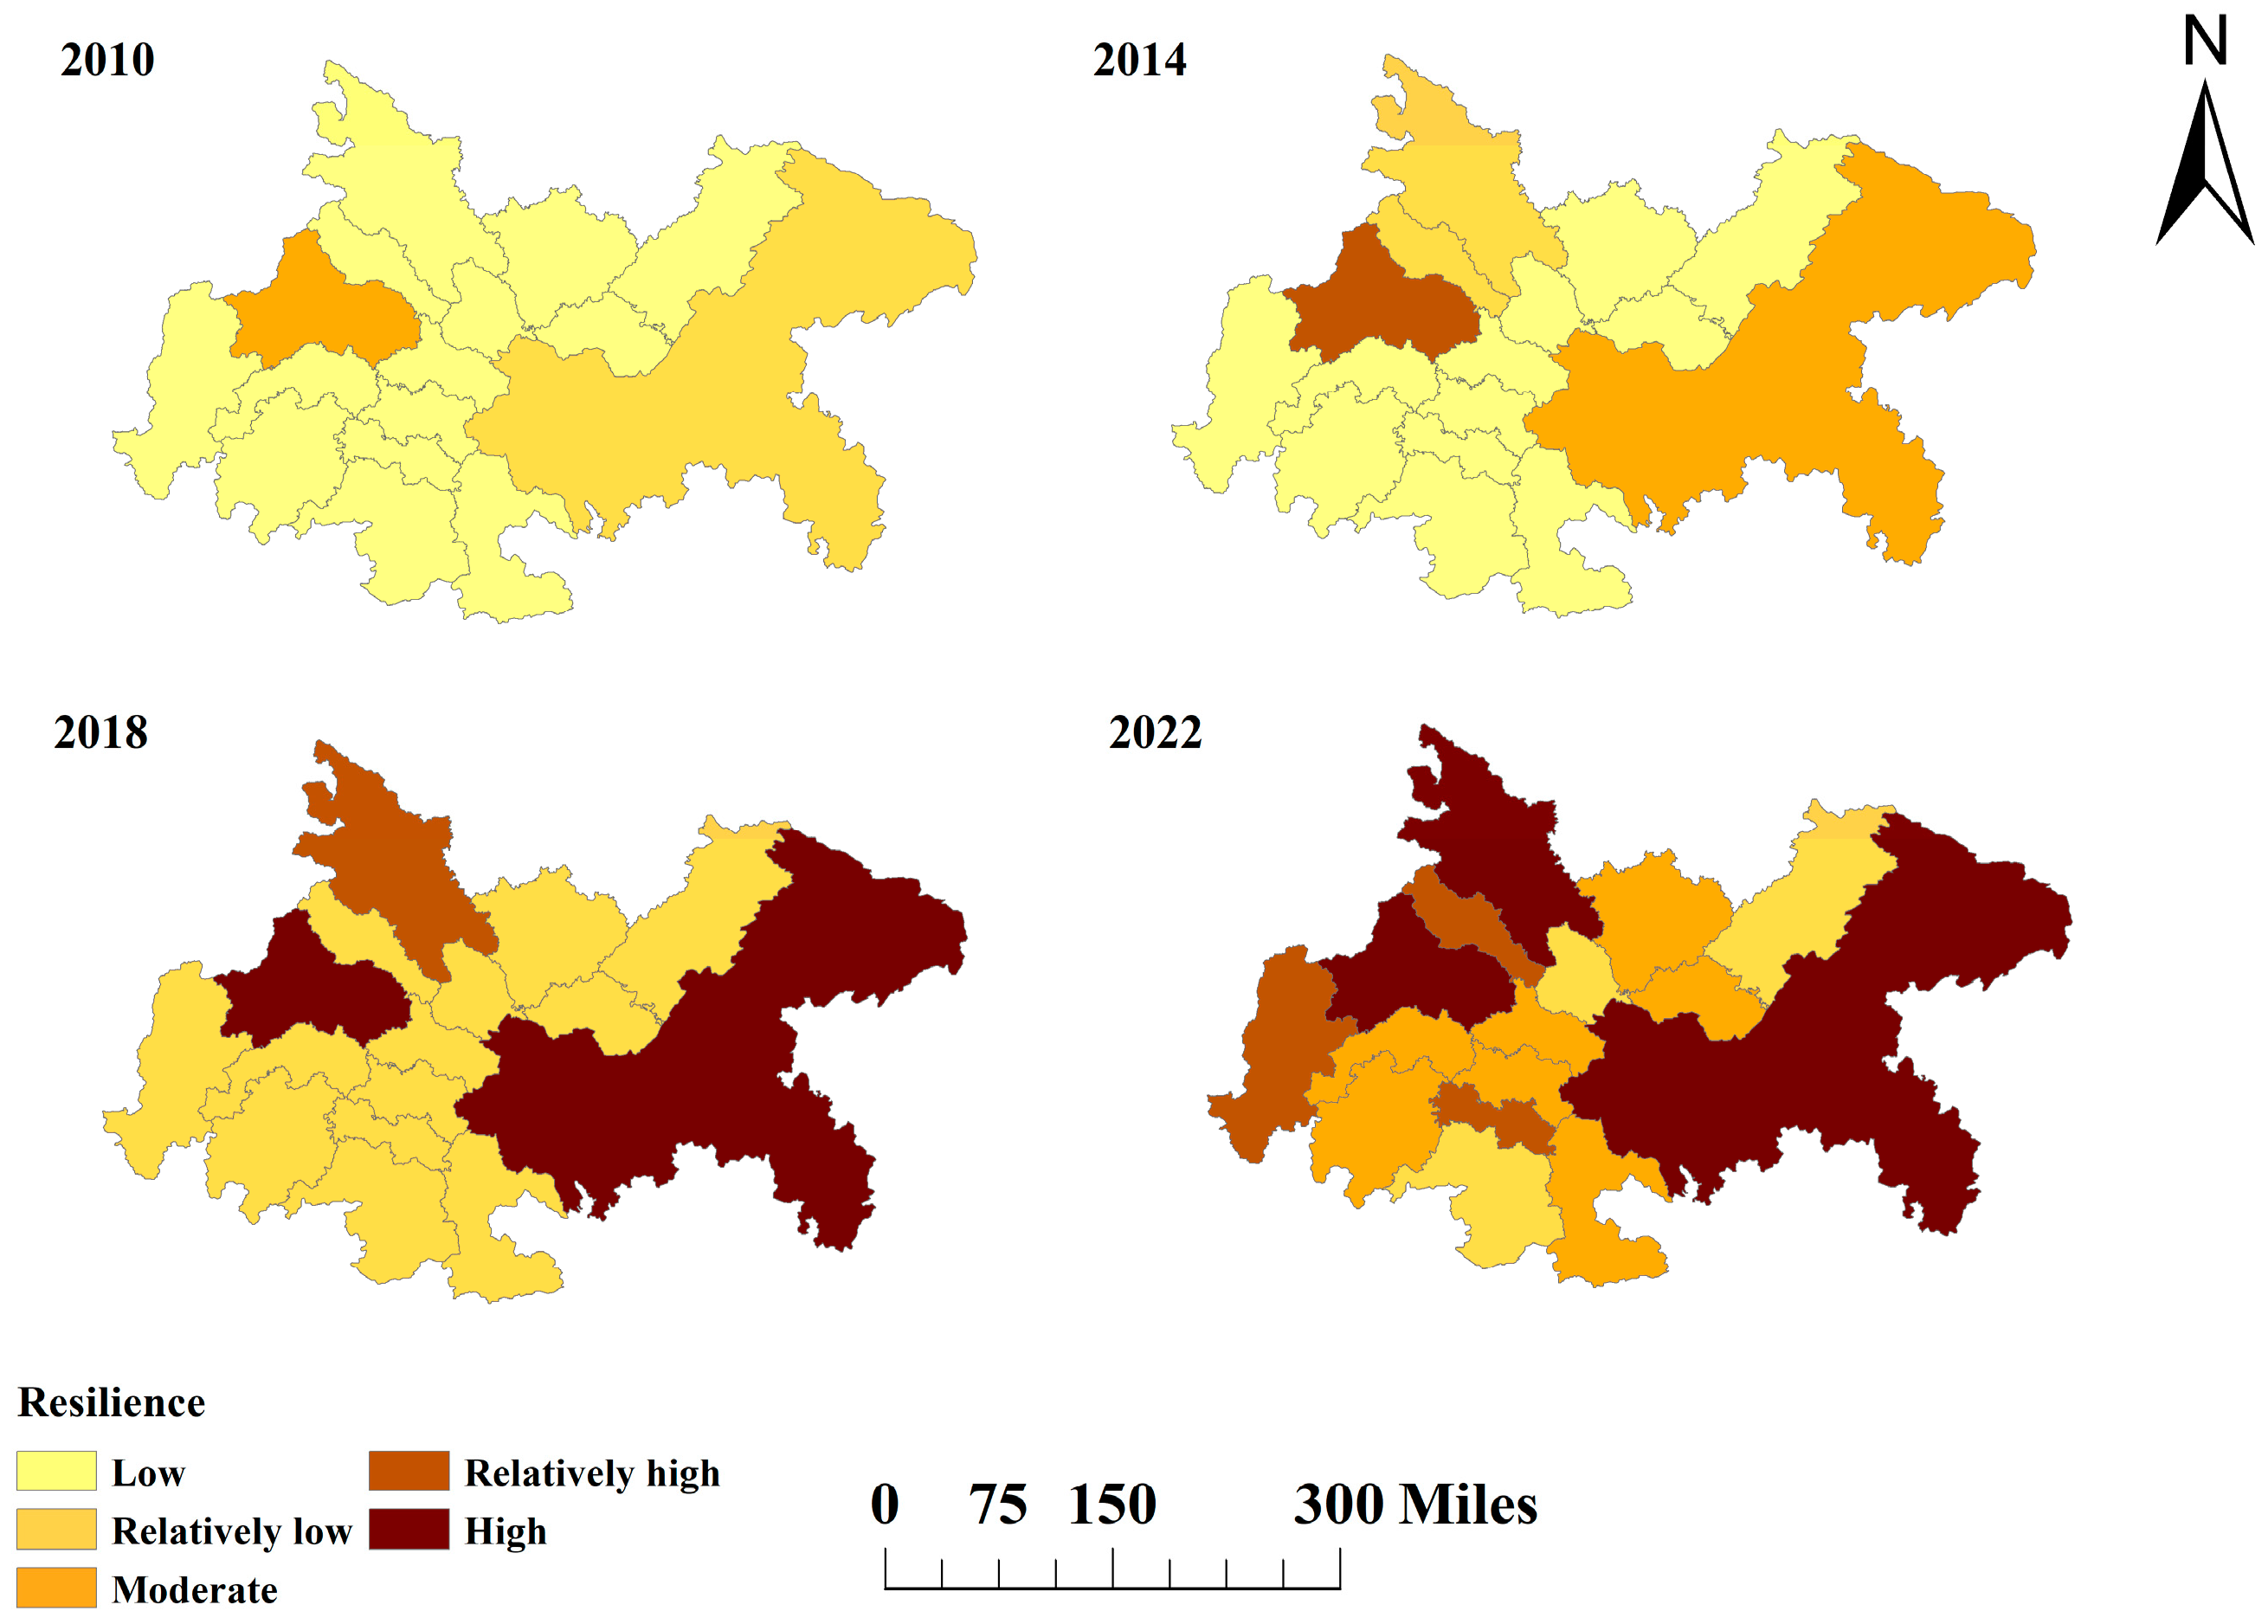
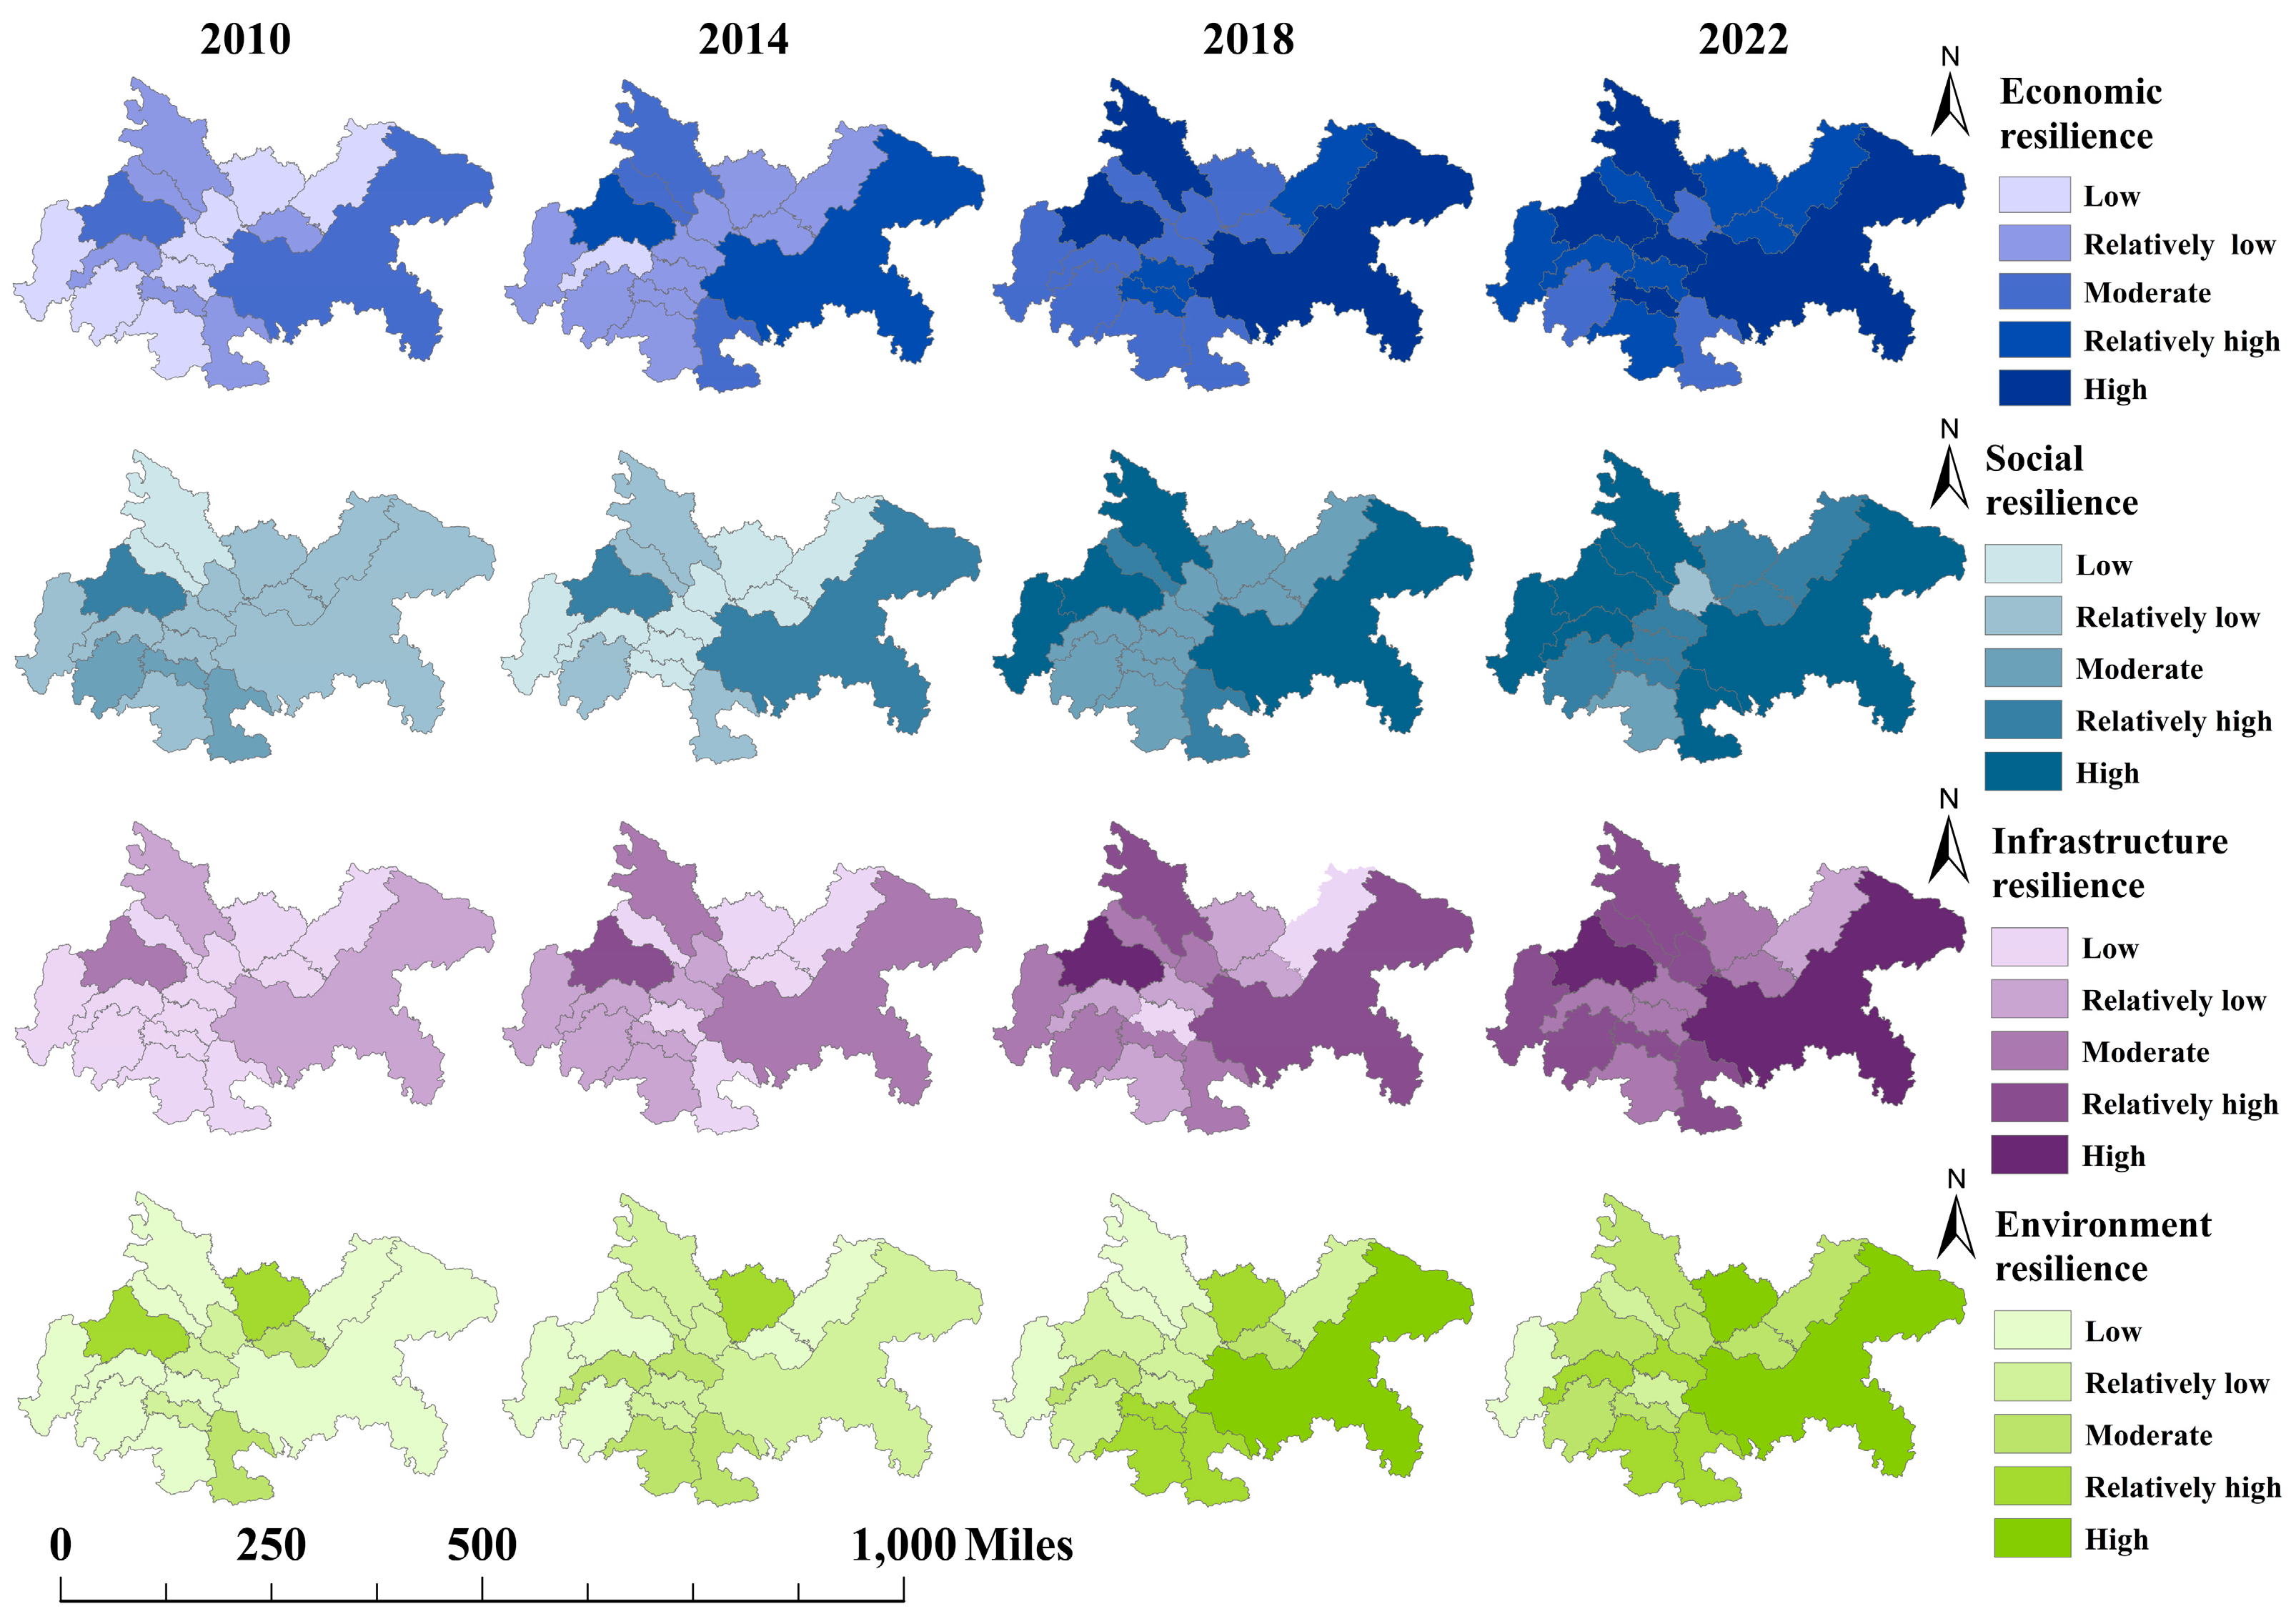

Disclaimer/Publisher’s Note: The statements, opinions and data contained in all publications are solely those of the individual author(s) and contributor(s) and not of MDPI and/or the editor(s). MDPI and/or the editor(s) disclaim responsibility for any injury to people or property resulting from any ideas, methods, instructions or products referred to in the content. |
© 2025 by the authors. Licensee MDPI, Basel, Switzerland. This article is an open access article distributed under the terms and conditions of the Creative Commons Attribution (CC BY) license (https://creativecommons.org/licenses/by/4.0/).