Abstract
Plantscape design combines both scientific and technical elements, with flower borders serving as a representative example. Generative Adversarial Networks (GANs), which can automatically generate images through training, offer new technological support for plantscape design, potentially enhancing the efficiency of designers. This study focuses on flower border plans as the research subject and creates a dataset of flower border designs. Subsequently, the research employed two algorithms, Pix2Pix and CycleGAN, for training and testing, enabling the automatic generation of flower border design images, with subsequent optimization of the results. The paper compares the generated results of both algorithms in terms of image quality and design patterns, providing both objective and subjective evaluations of CycleGAN, which performed better. Experimental results show that the algorithm can learn the latent patterns of flower border design to some extent and generate high-quality images with reasonable performance in terms of ornamental character and ecological character. Among the design types, bar-shaped layouts showed the best results. However, the algorithm still faces challenges in handling complex site processing, boundary clarity, and design innovation. Additionally, aspects such as vertical variation, texture harmony, low maintenance, and sustainability remain areas for future improvement. This study demonstrates the potential of GAN in small-scale plantscape design and offers innovative and feasible solutions for flower border design.
1. Introduction
Plantscape is an important part of the urban environment. The design of plantscape merges art and science to create visually appealing, functional, and sustainable spaces that harmonize with the natural surroundings. In this field, flower border design is particularly representative. A flower border is a dynamic planting scheme that combines perennials, annuals, bulbs, and shrubs to create a visually stunning and ecologically balanced garden feature [1]. Flower border not only occupies small areas and incorporates a variety of plant species, but it also demonstrates the spatial relationships between plants, making it a quintessential example in plantscape design. The flower border, with its diverse plantings, creates a natural and visually layered effect, making it a key form of urban plant landscaping [2].
However, there are several key challenges for designers in practical plantscape and flower border design. Firstly, it is difficult to generalize design rules. The vast diversity of plants and the need to consider multiple factors—such as color, texture, flowering periods, and ecological characteristics—often depend on the designer’s experience and intuition, adding complexity to the process. Secondly, it is difficult to begin with, as designers need an in-depth knowledge of a wide range of plants and a high level of aesthetics in color and texture coordination. Thirdly, modifications are inefficient, as plant arrangements interact with each other, requiring significant time for adjustments. Finally, the design process often involves repetitive tasks, such as drafting planting diagrams and plant quantity counting, which hold great potential for automation. In recent years, with the advancement of computer science and artificial intelligence, Generative Adversarial Networks (GANs) have received widespread attention as an advanced generative model [3]. This method has been used in many fields, such as architectural design and urban planning, to achieve significant results [4]. In plantscape design, such as flower border design, the selection and matching of plants follow certain laws and are influenced by the site and design requirements. Deep learning can help understand these laws and assist the design process, which is a sustainable design idea.
There have been a small number of research results on the application of deep learning techniques in the field of landscape architecture [5,6], but there is a lack of research on small-scale plantscape design [7].
This study presents the generation and comparison of small-scale plantscape designs using two algorithms, Pix2Pix and CycleGAN. The study begins by introducing the collection of flower border plans and the construction of a dataset based on scientific plant classification and labeling. It then describes the design process for generating plantscapes and compares the results generated by the two algorithms. Differences between the results of different algorithms and those of manually designed plans are discussed. The study aims to provide new tools and perspectives for landscape design through GAN technology, offering innovative approaches for plant configuration and design. The study reviews the literature related to GAN in architecture, urban planning, and landscape design and the application of related new technologies in the generative design of planted landscapes to clarify the direction of this research. The study will present both types of work.
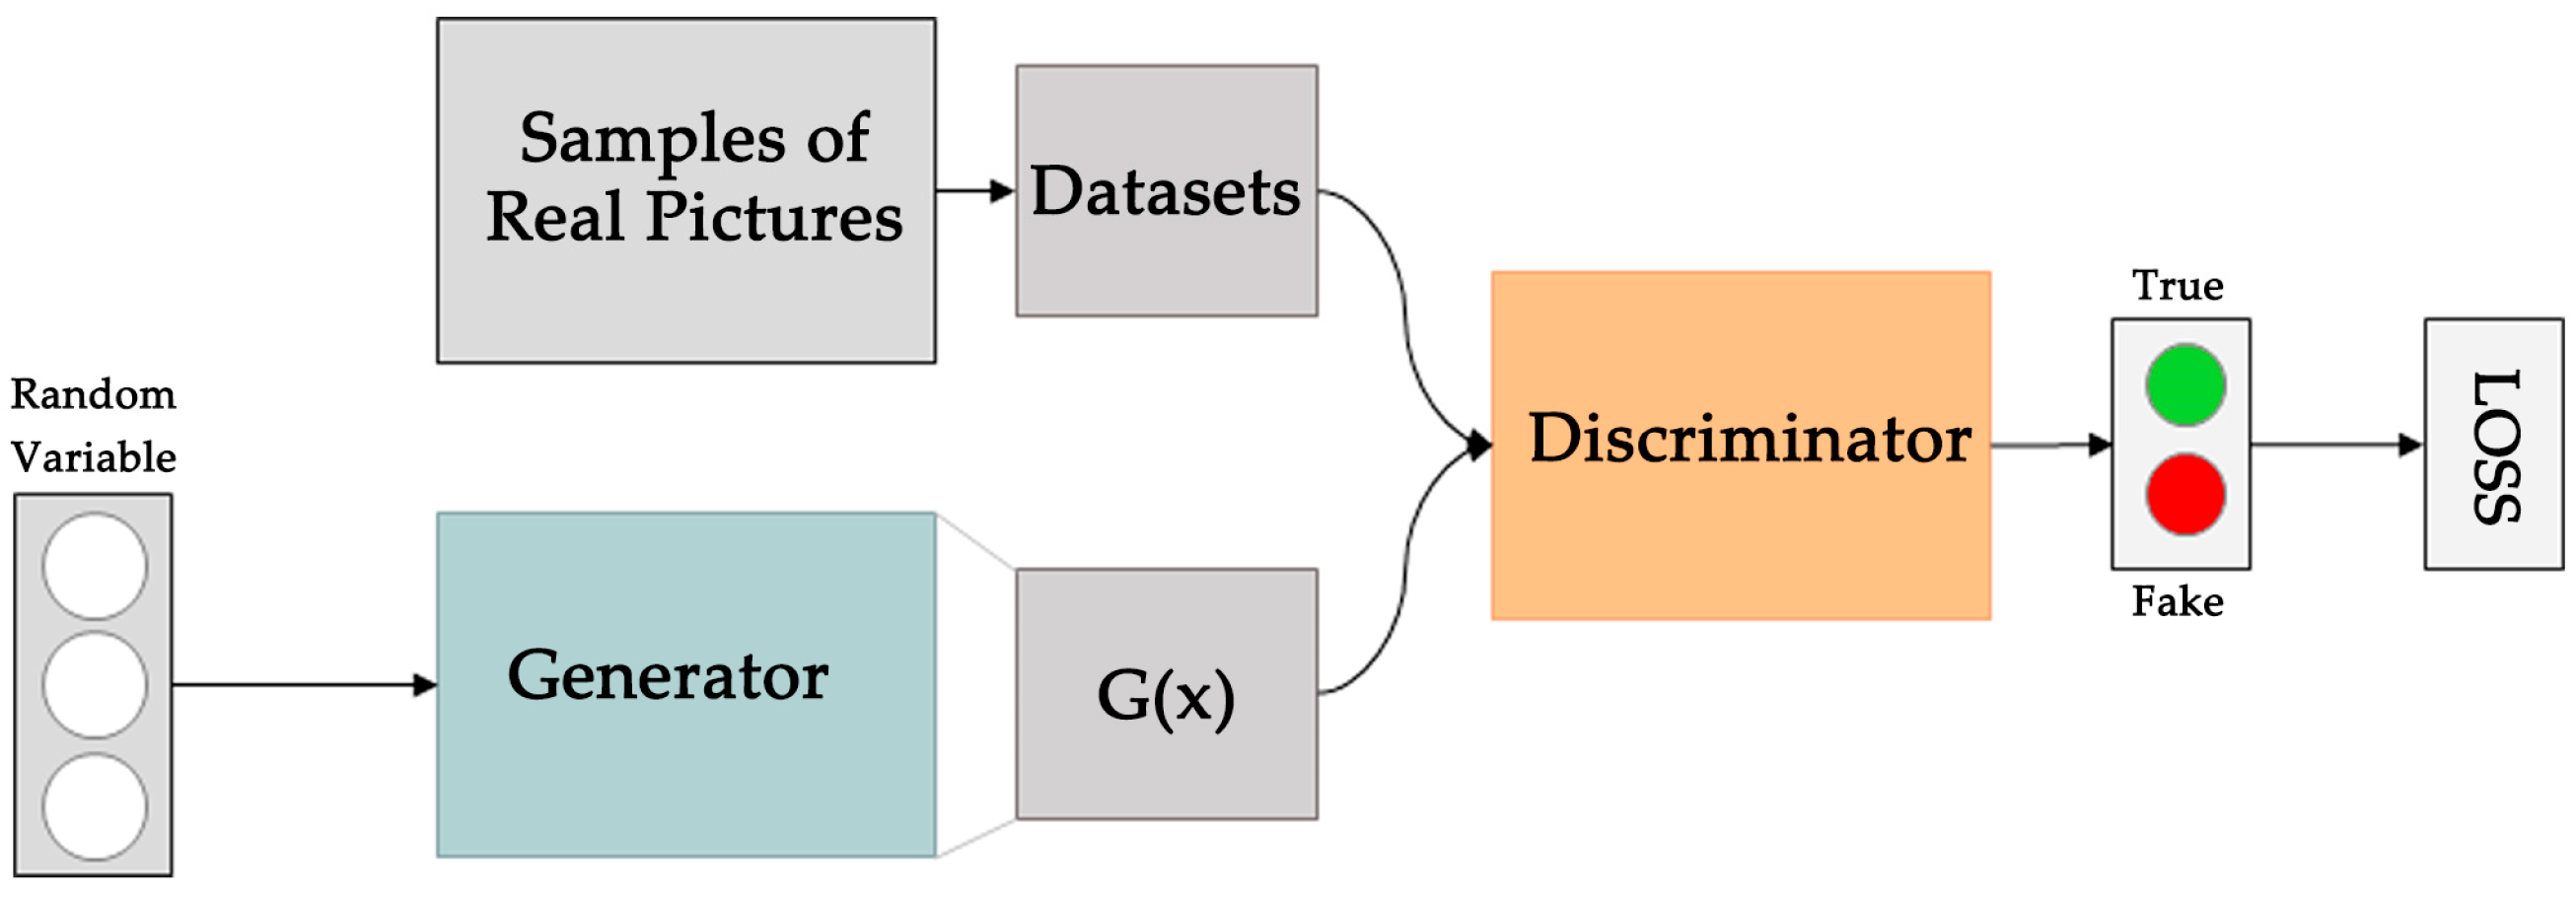
GAN is a machine learning technique based on game theory that is able to generate realistic samples by having two neural networks compete against each other [8]. Since GAN was first proposed by Goodfellow et al. [3], the method has achieved significant results in various fields. GAN consists of a generator network and a discriminator network, both of which are trained adversarially. Through a continuous iterative process, this adversarial training enables the generator to learn the layout features of the plans from real samples and generate samples similar to them (Figure 1) [8]. In recent years, GAN has attracted widespread attention in the fields of urban planning, architectural design, and landscape design.
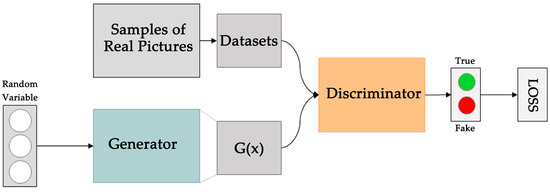
Figure 1.
Principles of image generation for GAN.
In the field of urban planning, diverse urban scenarios can be generated by training a GAN in which information such as geographic data, building planning requirements, and population distribution of a city are inputted. Shen et al. use Pix2PixHD to learn the general building layout of different cities in China based on 400 training samples to generate urban planning design scenarios under different geographical conditions [9]. These generated scenarios can provide decision support and enable planners to better predict the impact and outcome of different planning scenarios. In the field of architectural design, GAN can be used to generate initial sketches [10], floor plans [11,12], and elevations [13] for architectural design. Zhao et al. investigated plan image generation of hospital buildings using three GAN models and analyzed them [14,15,16]. Yenew introduces HouseGANDi, a design that combines the advantages of GAN and diffusion models to optimize diversity and time efficiency in layout generation [17]. Ali introduces a novel bottom-up digital design approach incorporating deep convolutional Generative Adversarial Networks, using the style, size, scale, and openings of adjacent buildings as references to generate intricate urban facade designs for urban infill [18].
With the maturity and wide application of GANs, the landscape field has also started to use them for idea generation, general plan rendering [19], etc. By training large-scale datasets, GAN can identify and understand different landscape elements, design styles, and people’s preferences for the environment so as to generate design solutions that meet specific needs. Qu et al. constructed a functional plan generative design method for residential landscapes based on CGAN [15], which not only improves the design efficiency and quality but also meets the functional and aesthetic needs and introduces diverse forms and styles on the original basis. Zhou used GAN for site type analysis and plan rendering of landscape plan cases to help designers improve their analysis and mapping efficiency [19].
Plantscape design is a key focus within the field of landscape design. Traditional design methods predominantly emphasize the overall plant layout, such as identifying major vegetation zones and large-scale landscape structures. In contrast, small-scale plantscape design involves a wide array of factors, including flowering periods, ecological habits, color coordination, etc. This often relies heavily on the experience and intuition of the designers, resulting in designs that lack efficiency and accuracy. So, the use of computer-assisted flower border design has unlimited potential and research value. With the development of digitalization, some studies have already begun to explore the generative design of plantscape [4]. New technologies such as remote sensing, big data, simulation, and parametric methods have been applied to programmed simulation and digital generation. Zhu et al. established a layout generation model coupled with the design site and crowd demand, combined the design logic of plantscape layout with Ecotect and Grasshopper software, and generated parametric layout pattern diagrams for urban park plantscape [20]. Jutta et al. focused on the parametric generation of plants by integrating facade greening systems into Building Information Modeling (BIM) and introducing an automated planning process to improve plant design [21]. Cui et al. trained an automated flower border design model through computer vision and machine learning algorithms to generate new flower border design schemes based on semantic segmentation maps and keywords [22]. Lin used deep learning techniques for the construction of a preliminary self-generating system for plant configurations, where deep learning is responsible for plant selection and spotting, and designers are responsible for data collection, training, and deriving constraints for goals [23]. Le et al. combined cellular automata (CA) with CycleGAN techniques to simulate the mycorrhizal networks of street trees in urban areas. By training the model with urban satellite images and utilizing the style transfer capabilities of CycleGAN, they generated an ecological network layout for street trees that emphasizes urban greening [24].
GANs have shown great potential in landscape generative design. However, while there have been some advancements in research on urban environments and landscapes, studies focusing on plantscape remain relatively limited. The bottlenecks of the current research are as follows: (1) The application of GANs has primarily focused on large-scale scene generation [25,26,27]. Most studies in the field of plantscape tend to emphasize the overall layout of plants in medium and large-scale spaces while ignoring the design of specific plant groupings at small scales [5,6]. (2) The lack of open-source plan datasets for plantscape limits the effectiveness of the results. (3) The randomness of the results in the design of small-scale sites is high [7], and there is a lack of comparison between different algorithms, practical applications, and empirical evidence.
To summarize, there are relatively few studies on whether GANs can be applied to plantscape design (including the planning and layout rules of plant groups). Therefore, based on the existing results, the commonly used plants are scientifically and carefully classified, and a plantscape plan dataset represented by flower borders is constructed to solve the data bottleneck problem. A GAN-based generative design process for plantscape is then constructed and the training algorithm is further optimized. Finally, a comparative analysis of the generation results is conducted to examine the differences between algorithm-driven generative design and human-designed outcomes.
The research questions in this paper are as follows: (1) How to build a dataset for plantscape design plans. (2) How to construct a GAN-based plantscape generative design process and select the best algorithm to generate optimal results. (3) How to design experiments to discuss the similarities and differences between algorithm-generated results and manual design. This study proposes an experimental procedure for a GAN-based plantscape plan generative design model. It focuses on comparing different GAN algorithms to create flower border plans that reflect spatial characteristics, aesthetic coherence, and ecological suitability. To ensure the validity and contextual relevance of the experiment, the dataset was constructed from high-quality plan drawings. These were collected from completed plant configuration projects in urban sites across East China, where similar climate and soil conditions provide a consistent ecological basis. The samples were selected for their representativeness and design diversity, enabling the model to identify and learn region-specific design features. The generative model is designed to integrate into existing workflows, aiding human–computer collaboration in early-stage plantscape design. By inputting site boundaries, designers can quickly obtain preliminary flower border layouts. This helps designers create initial concepts faster, reducing repetitive tasks and improving efficiency. The model supports, rather than replaces, the designer’s role, offering value in concept generation and early design decisions. In addition, the study is further combined with image processing techniques and modeling to provide a comprehensive assessment of the algorithm-generated design solutions in terms of normality and artistry through expert scoring feedback.
2. Materials and Methods
2.1. Analytical Framework
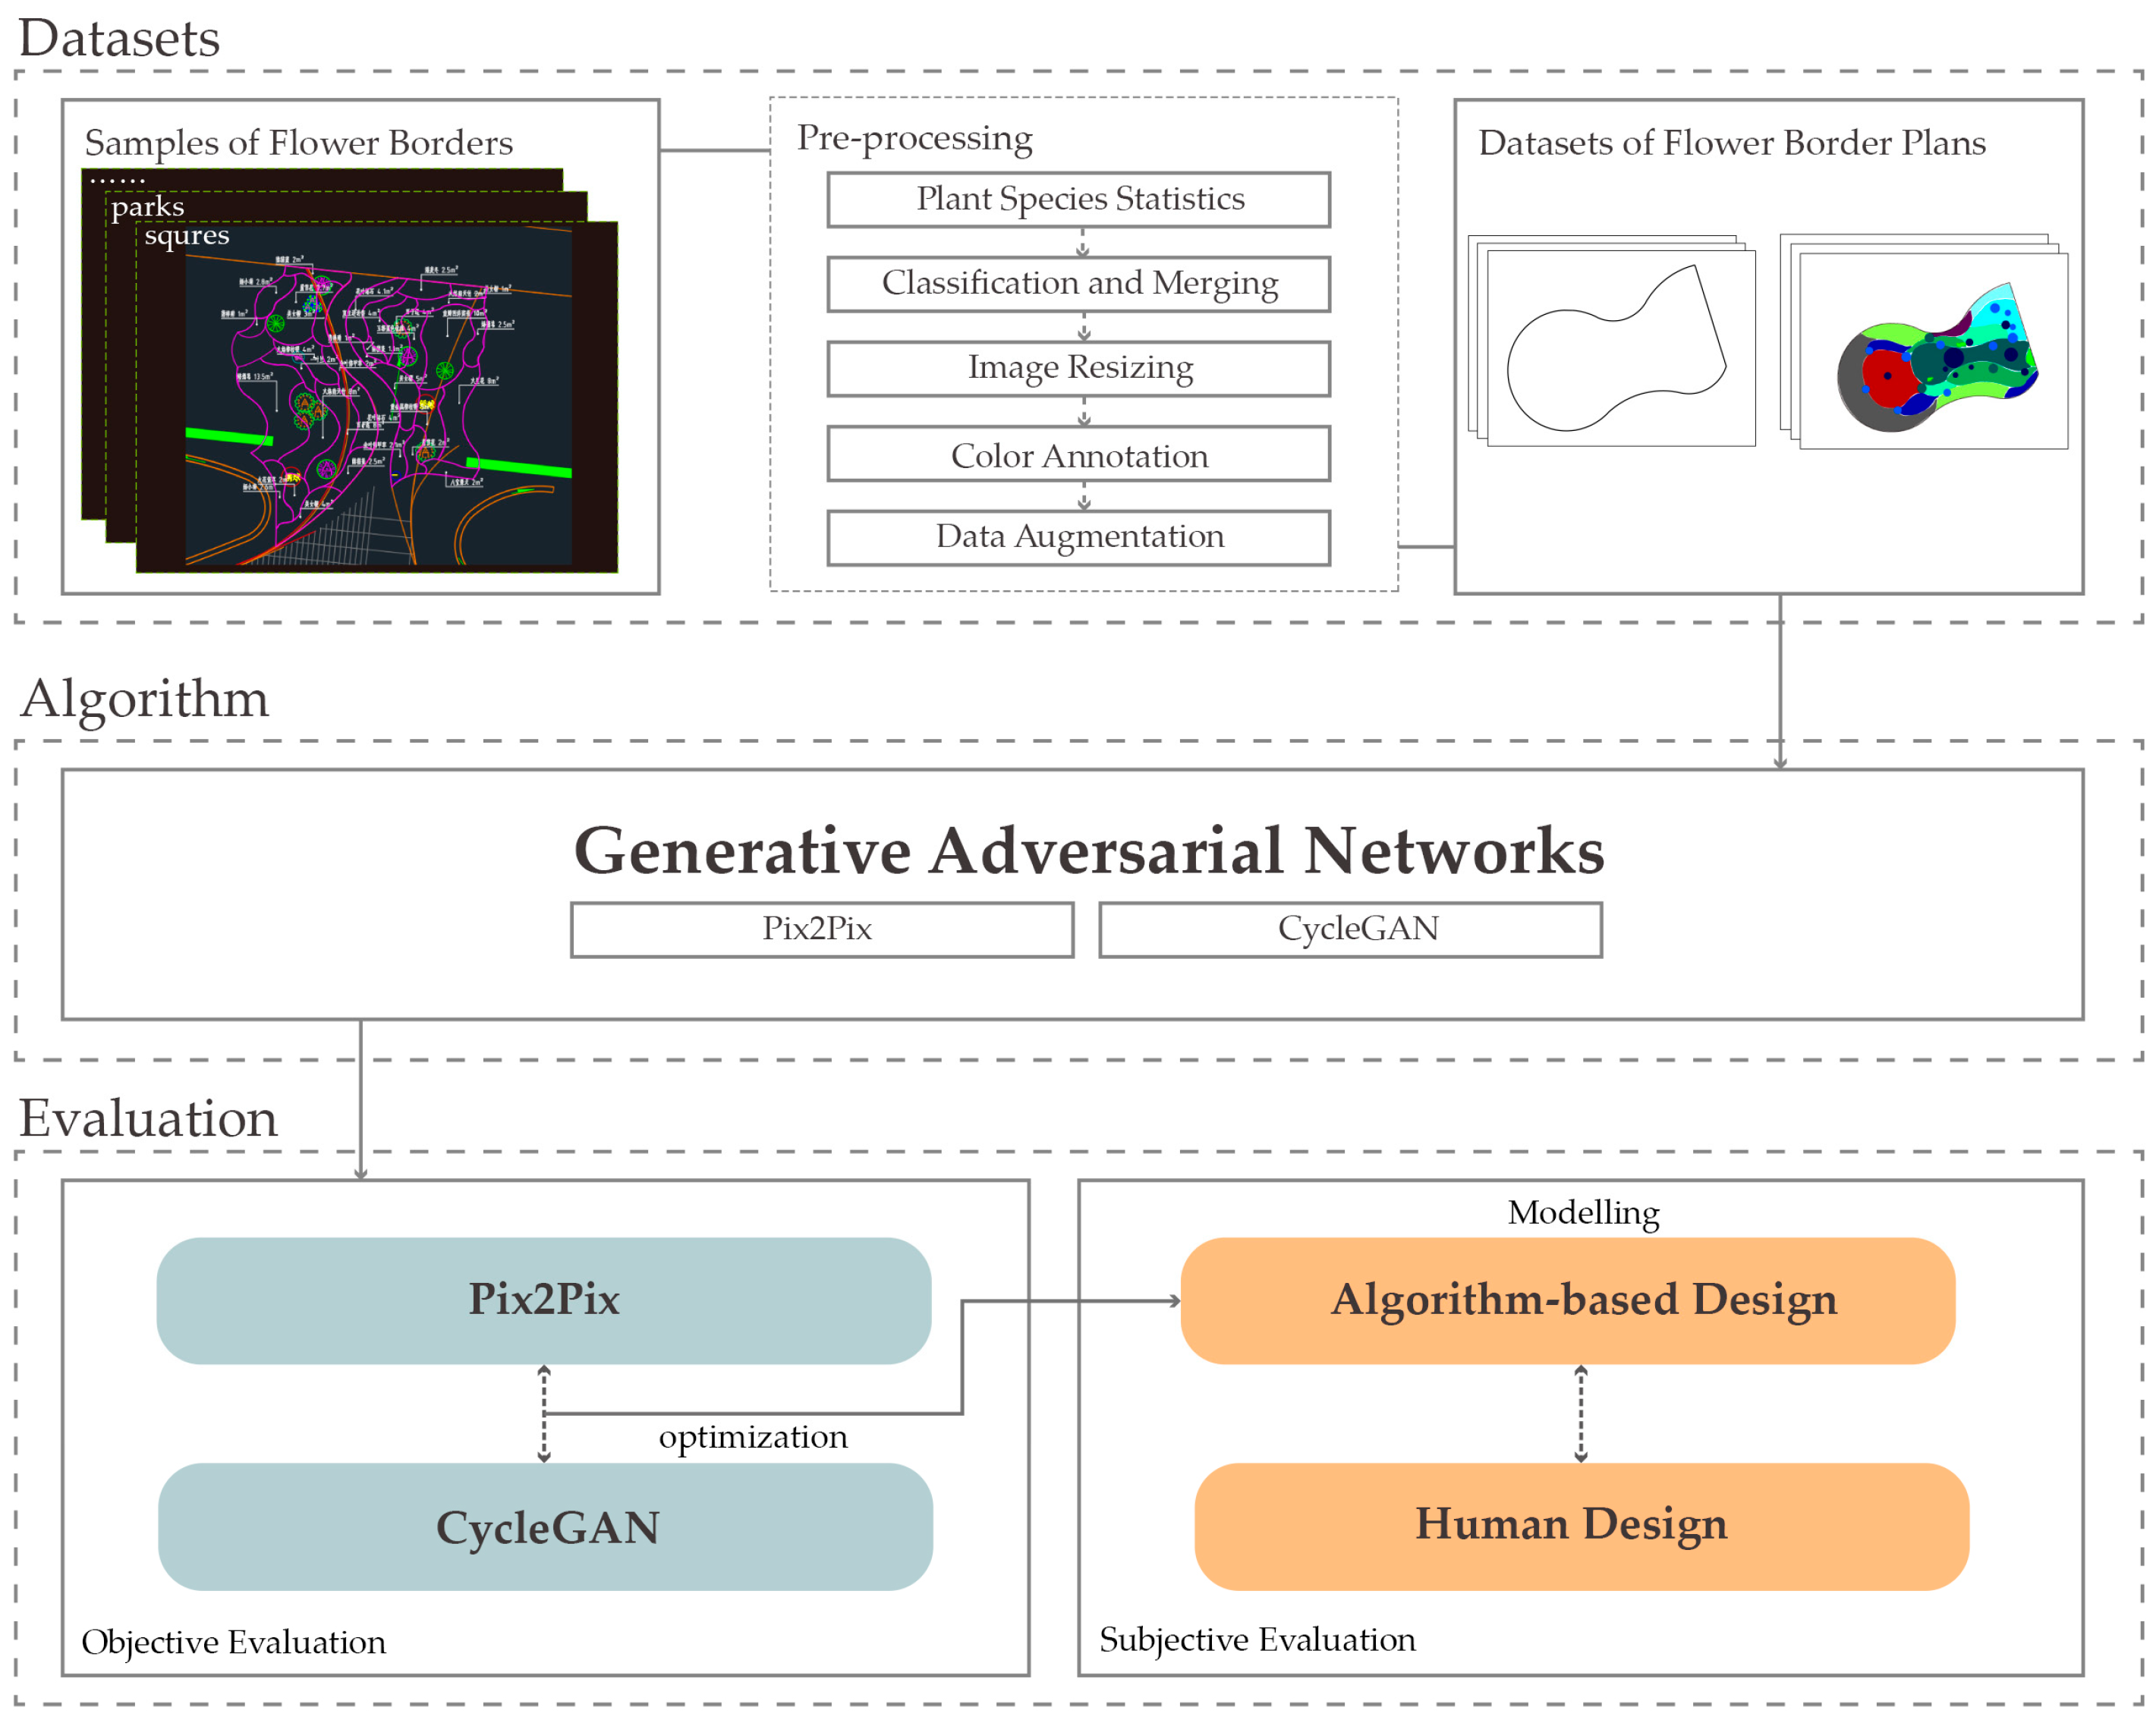
This chapter presents the framework for the experimental procedure of the GAN-based plantscape plan generative design model. The overall experimental steps are shown in Figure 2. The basis of this study is the construction of a comprehensive and representative dataset, which is key to ensuring the validity of the experimental results. Due to the lack of publicly available datasets on flower border design in existing studies, this study collected a series of plan drawing samples from several completed plant configuration projects. To ensure the scientific validity and consistency of the data, all samples were drawn from urban sites in the East China region, which shares similar climate and soil conditions. The sites were selected based on their high design quality, ensuring a broad representation of site types and design styles while maintaining rigorous scientific standards. Detailed information on plant species, layout, and other key design elements was included in the dataset. In order to improve the model’s ability to identify and learn plant plan design features, the study pre-processed the collected samples, including plant species statistics, classification and merging, image resizing, color annotation, data augmentation, and other operations. These steps aim to optimize the quality and consistency of the data. The study builds an automatic generation model based on an open-source programming platform and employs two Generative Adversarial Networks, Pix2Pix, and CycleGAN, for generating plan images of flower borders. In the evaluation stage, the generative ability of the two algorithms is first evaluated. The similarity and gap between the flower border plans generated by different algorithms and the real design plans are analyzed and compared objectively, and the algorithm with better results is selected to optimize the automatic generation model.

Figure 2.
Research Framework.
Then, the generated plantscape plans are subjectively evaluated and fed back from both ornamental and ecological perspectives to assess the potential of the algorithmic design results for practical application in human–computer collaborative design environments. Through this comprehensive analysis, this study will provide new perspectives and methodologies for future landscape design. The next sections will elaborate on the specific implementation and results of each of the above steps.
2.2. Data Collection and Preparation
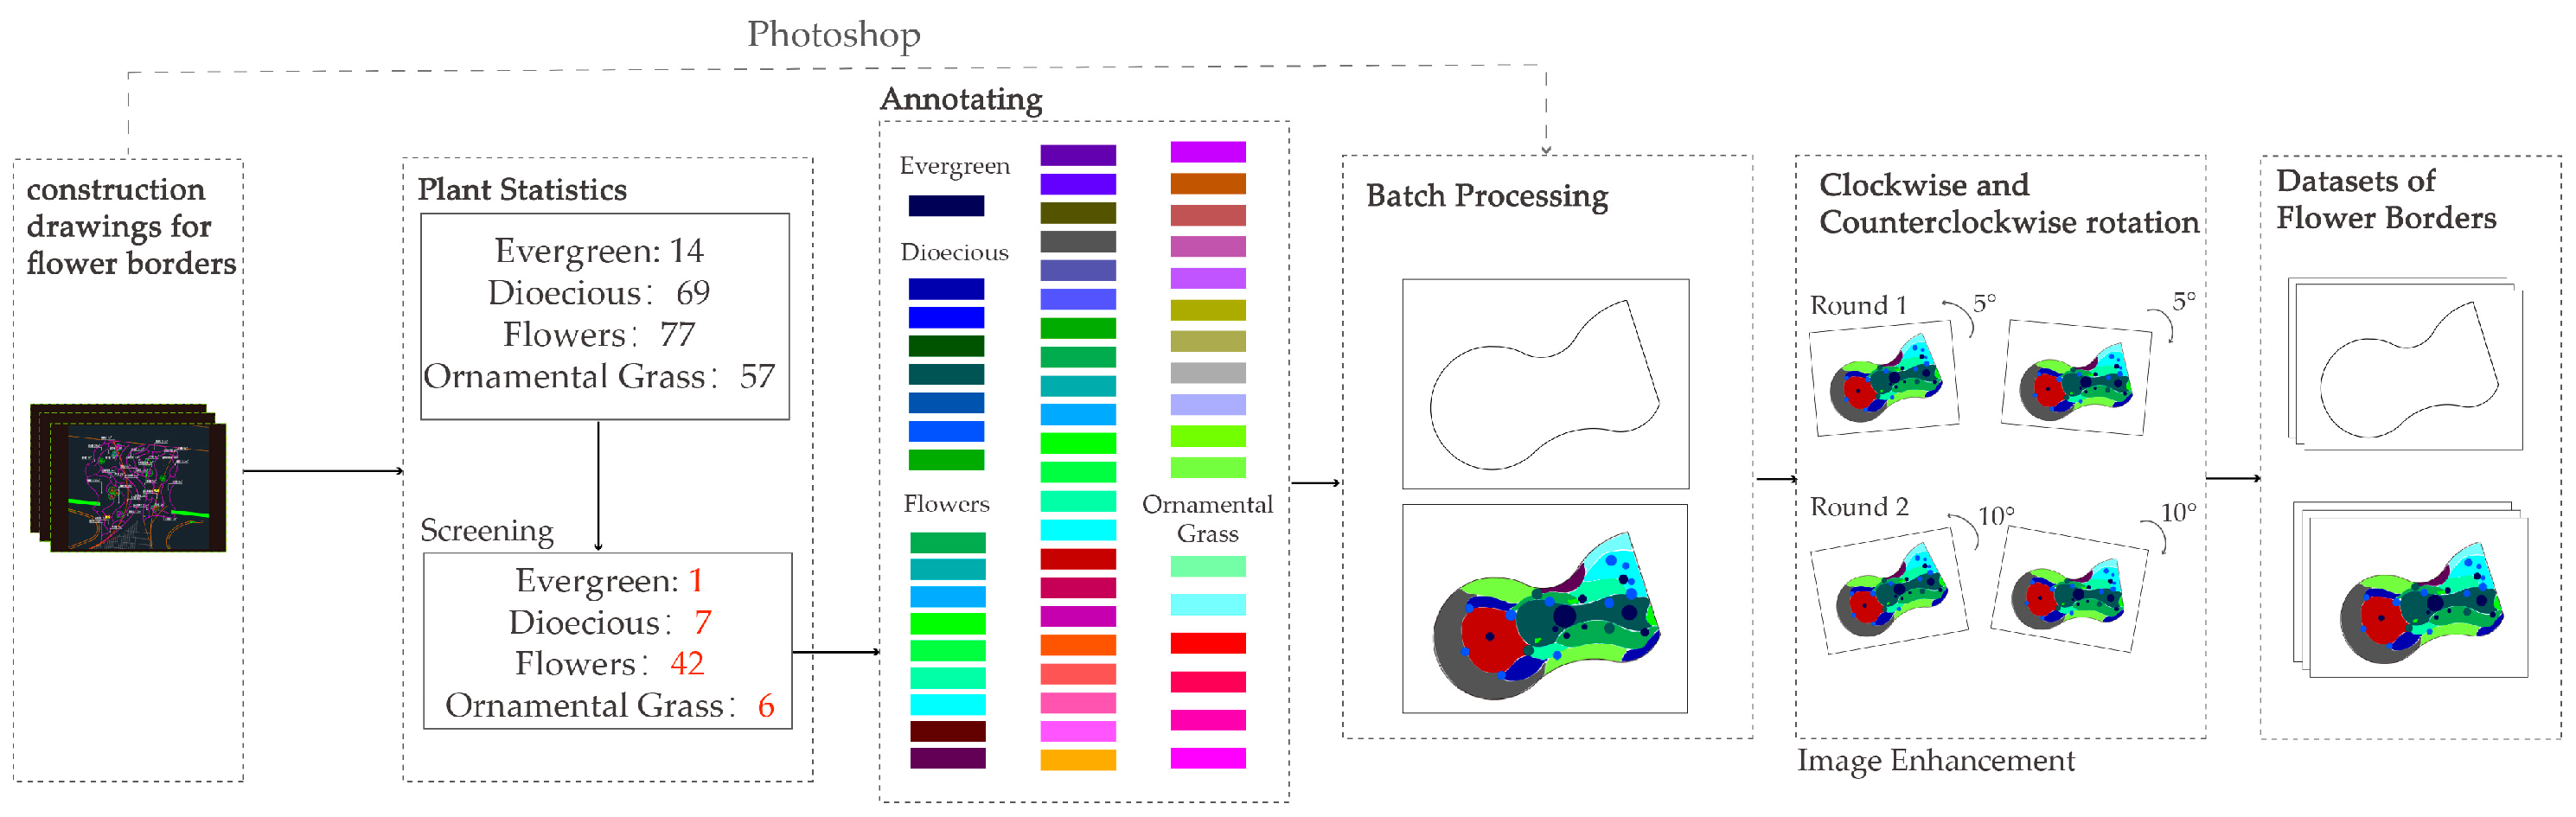
The object of this study is small-scale plantscape design. The plans of the flower borders reflect the plant selection, spatial distribution, and plant coordination, making them an ideal example for this study. To ensure consistency and relevance, the sites selected for the plans are all located in the East China region, sharing similar climate conditions, soil types, and plant species. Although the specific locations differ, all the sites are urban and feature relatively flat terrain. The complete data processing workflow used for building the dataset is illustrated in Figure 3. Given that deep learning, as a probabilistic model based on statistics, faces challenges in training algorithms for complex and varied disordered data samples in order to ensure the sample size of the dataset and the effect of machine learning and to improve the accuracy of the data annotation, the following principles are followed in the selection of the flower border plan cases. (1) Select small and medium-scale flower border plans less than 300 m2 as training samples to ensure that the model can clearly learn the pixel texture of the plans. (2) Select real flower border design cases from two design institutes with a similar design style to ensure that they have similar rules of plant species application, combination forms, and expression styles. (3) Elements such as trees, shrubs, and grasses can be clearly identified in the flower border plan. Common plant species are used as comprehensively as possible, and the expression of the plan is both normative and artistic. A total of 123 plans of different types of spaces (such as squares, roads, spaces under bridges, parks, etc.) were collected, which cover a variety of plan forms such as strips and arcs.
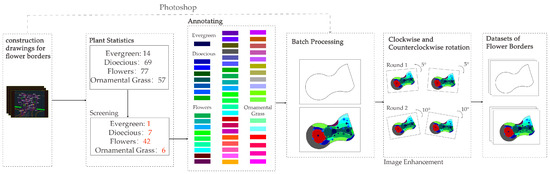
Figure 3.
The procedure for preparing the dataset.
After analyzing the plants in the collected plans, 217 distinct and commonly used plant species were identified, including 14 evergreens, 69 dioecious plants, 77 flowers, and 57 ornamental grasses. To enhance the efficiency of learning typical layout relationships in flower border plant design, these 217 plant species were categorized and merged. This process follows the established plant classification conventions of flower border design and aims to extract key information regarding plant combination patterns. In sample pre-processing, the study followed the following principles: (1) Plants in the dataset were classified and statistically analyzed, and the color, material, and combination of these plants were recorded. After generalization, these plants were classified into a number of categories, including trees, styled shrubs, bulk foliage shrubs, flowers, ornamental grasses, etc. This helps to provide an in-depth understanding of the characteristics and uses of different plants, which, in turn, will support subsequent research on plantscape design. In this study, “plant elements” refer to individual plant patches or groupings within a flower border plan. They are considered distinct components for generative design based on their type, size, shape, and spatial arrangement. (2) The study merged similar plants and selected the most representative plant elements. After careful counting and categorization, and based on authoritative insights from designers and scholars, important and widely used plants were retained. Considering that the study focuses on the application of flowering plants, the commonly used flowering plants, such as tulbaghia, torch lily, and agapanthus, were especially retained. Also, the work optimized the structure of the dataset by merging plants with similar species, materials, and colors, such as iris, canna, and agapanthus, and eliminating plants with low usage frequency or low impact on the design. Eventually, the plant elements were subdivided into 56 plant elements, including 1 evergreen, 7 dioecious, 42 flowers, and 6 ornamental grass. (3) The study focused on the accurate identification and representation of plant elements and, therefore, retained the shapes, sizes, relative positions, and proportional relationships of the different plant types in the plan. At the same time, details and distracting information that have little impact on the design layout, such as debris and structures, are removed for a clearer and more accurate representation of plant elements.
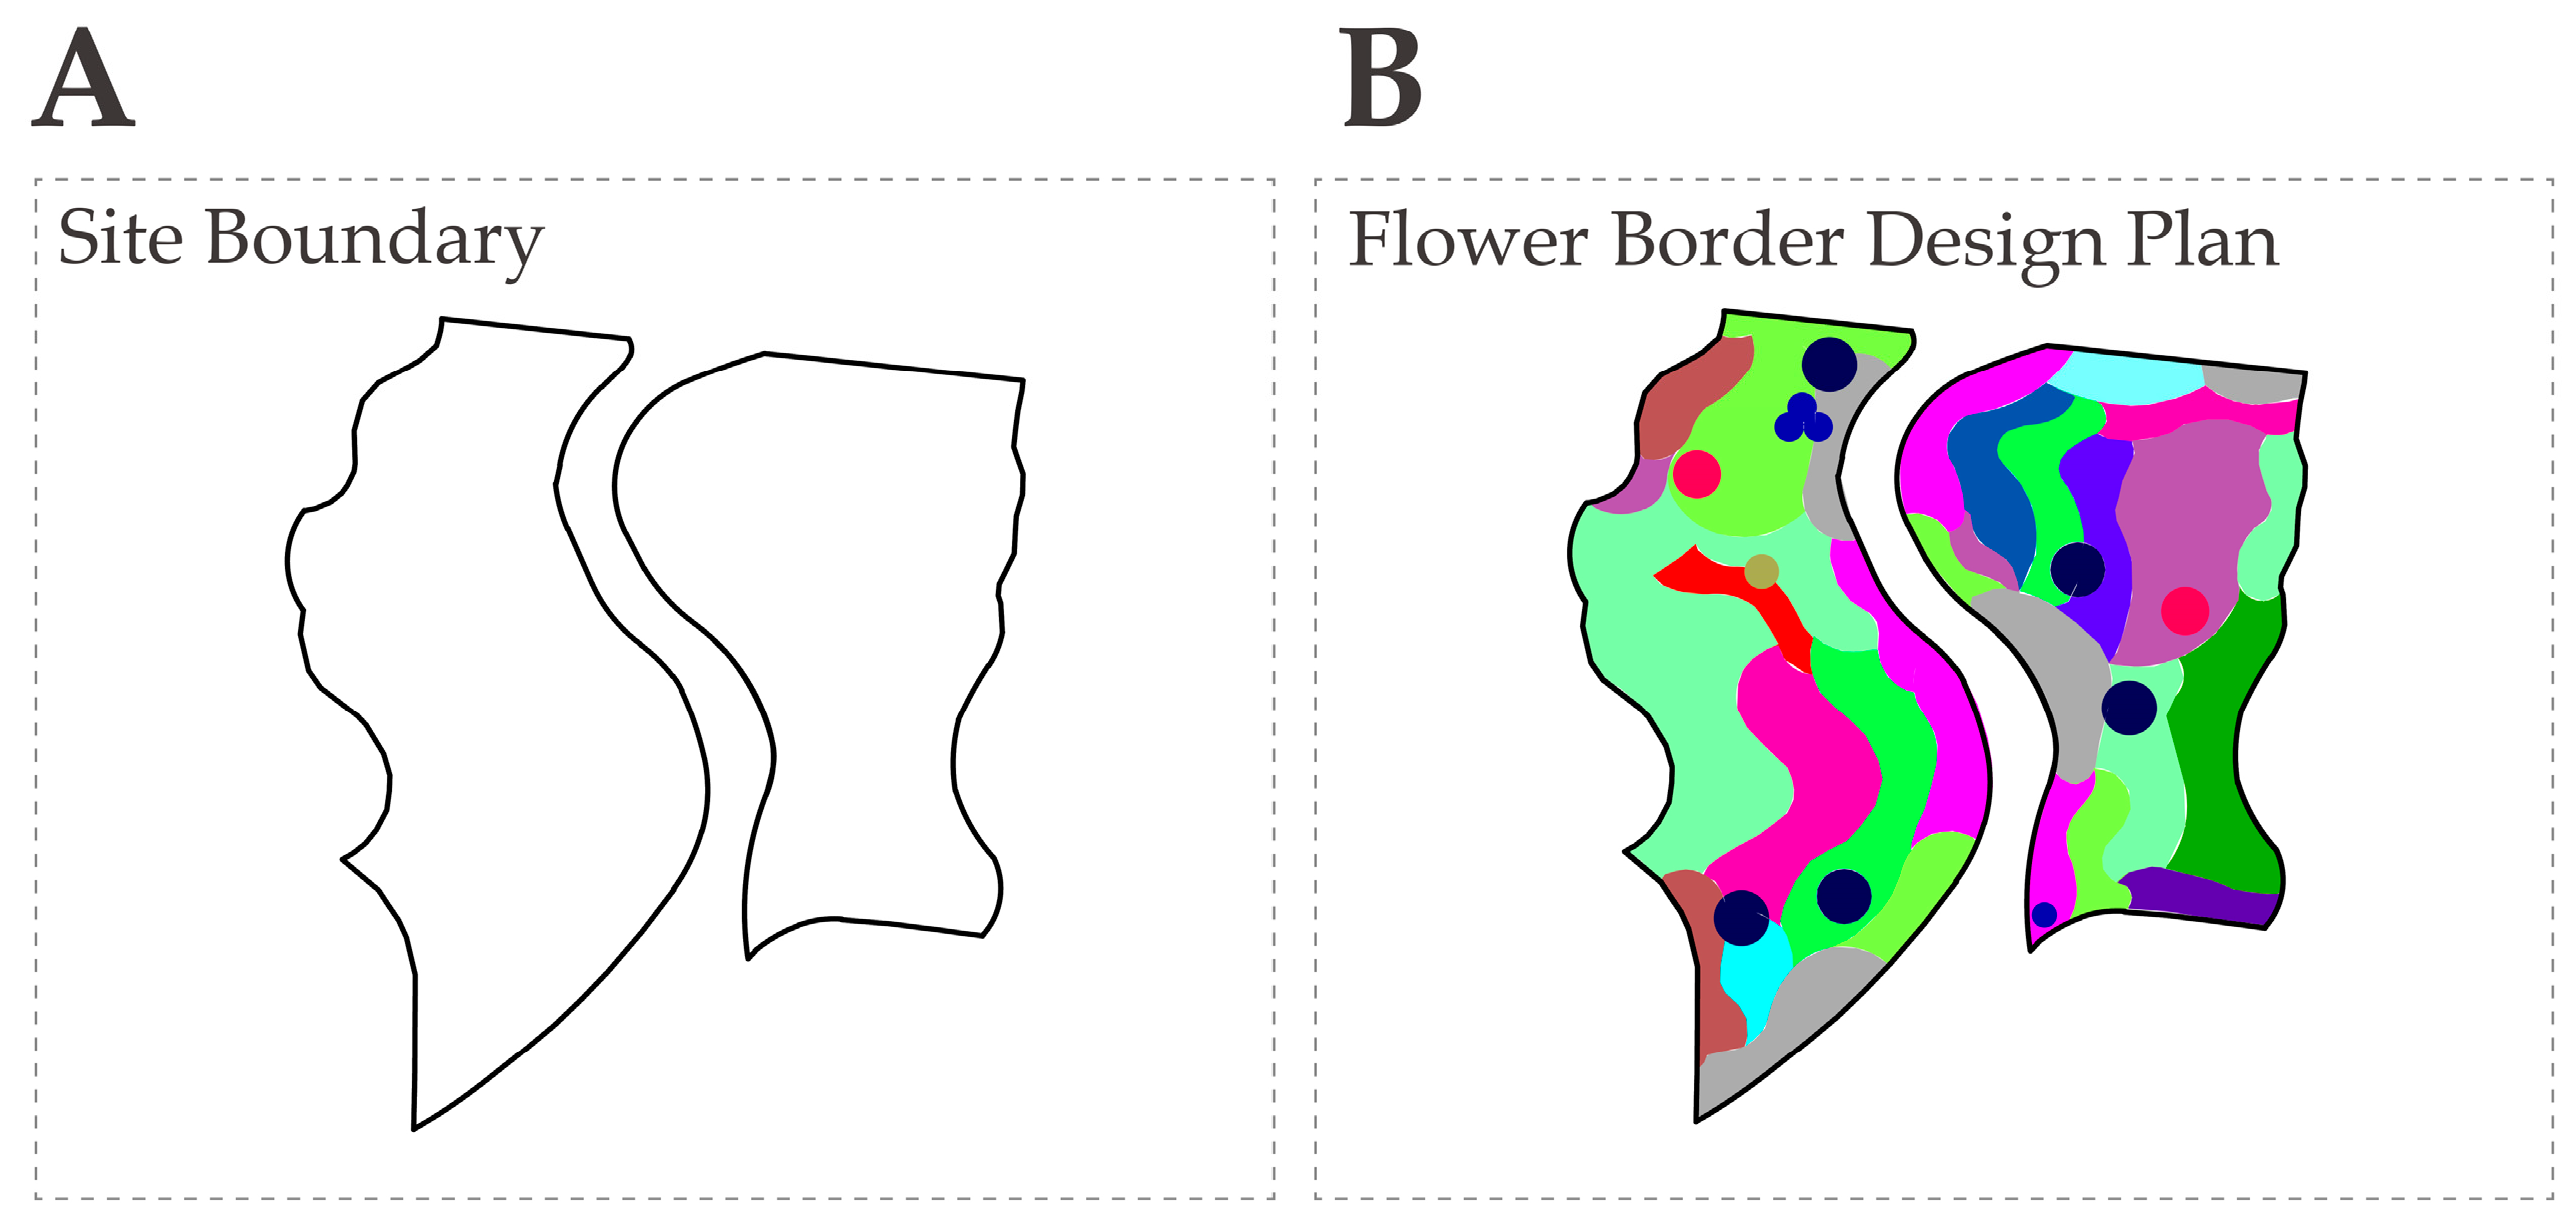
In this paper, different colors are used to label different plant elements, and the differentiation of the labeling colors should be as large as possible. Combined with the number of plant elements after merging, the red (R), green (G), and blue (B) channels are divided into three equal parts, with the four values of 0, 85, 170, and 255 selected. In this process, black (0,0,0) represents the site border, and white (255,255,255) represents the blank background, both of which are not included in the labeling color of the plant elements. Finally, 56 plant elements and their corresponding marker colors were selected for the dataset production. Please refer to Table S1 for detailed plant classification results and corresponding marker color. The dataset of this study consists of two parts of images, as shown in Figure 4. Figure 4A shows the site outline of the flower border plan, while Figure 4B provides basic information, including planting patches, plant selection, and so on.
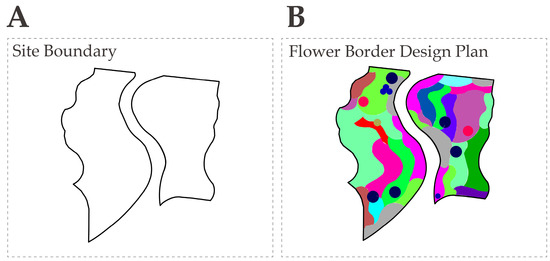
Figure 4.
Flower border plans dataset.
In order to improve the training efficiency, the samples of CycleGAN’s dataset are processed as two 400 × 300-pixel images, while the samples of Pix2Pix are processed as two 512 × 512-pixel images, with each 1 × 1 pixel representing an actual area of 5 cm × 5 cm, to balance the requirements of clarity of content and computational power.
In order to increase the sample size and improve the accuracy of the model, the dataset was expanded. Since planting patches are mostly irregular shapes, each image was processed with rotation, which proved to be effective in expanding the dataset and improving model accuracy [28,29]. After rotating each image by 5° and 10° in both clockwise and counterclockwise directions, the dataset samples were increased from 123 to 615 (Figure 3).
2.3. Training and Testing
2.3.1. Flower Border GAN Model
The study relies on Pix2Pix and CycleGAN to build an automatic generative design system.
- Pix2Pix
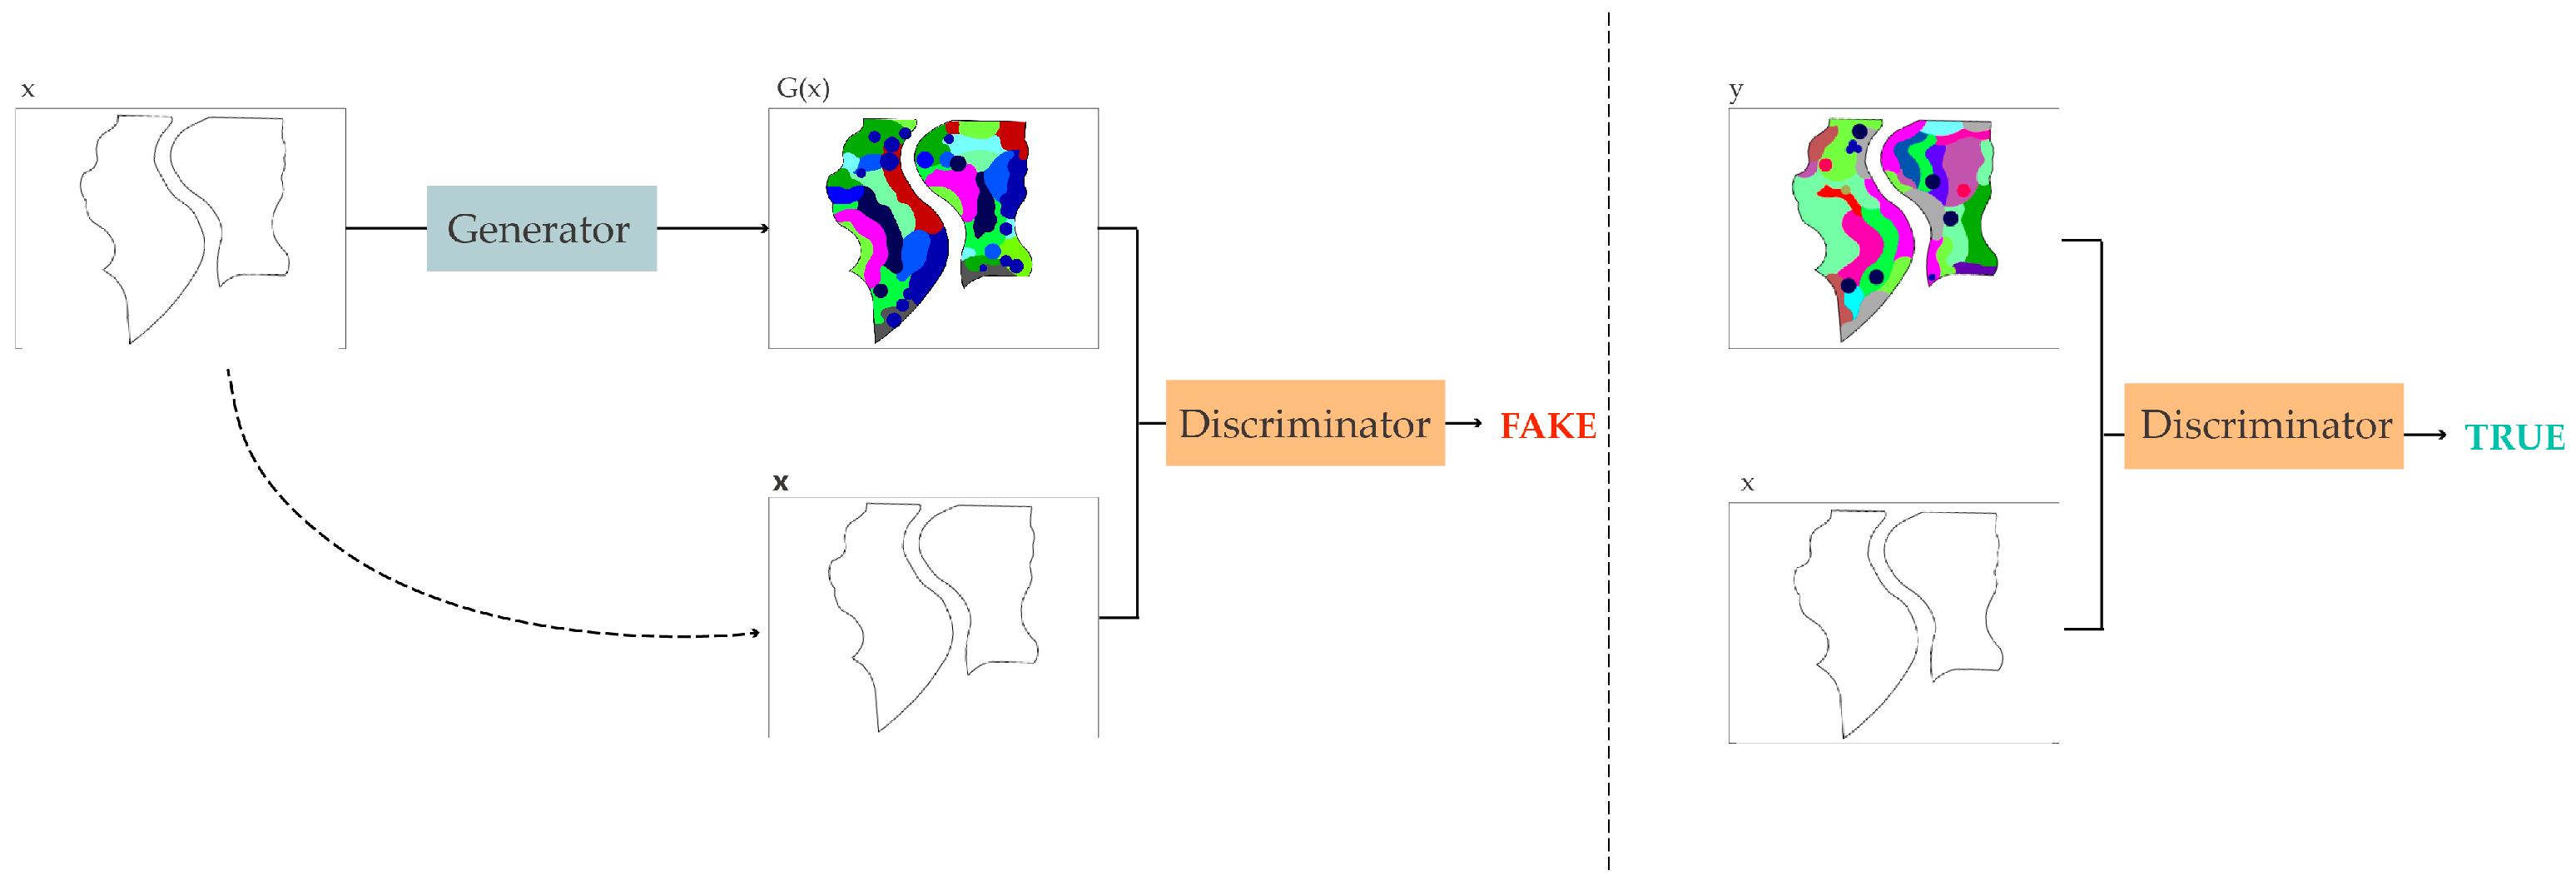
The Pix2Pix algorithm (Figure 5), formally known as Image-to-Image Translation with Conditional Adversarial Networks, is an important advancement in the field of image translation, which uses a framework of Conditional Generative Adversarial Networks (cGANs) [30]. This approach basically consists of two parts: a generator and a discriminator. The task of the generator is to produce real-looking images from the input images, and the function of the discriminator is to differentiate between the artificial images created by the generator and the actual image. The main goal of the discriminator is to ensure that the generated images are not only realistic but also align with the input conditions. In the framework of Pix2Pix, these two parts are intertwined under the condition setting, and the discriminator evaluates not only the realism of the images but also their correspondence with the given input conditions (Figure 5).
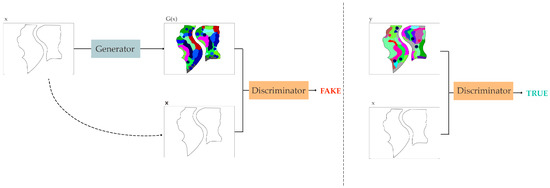
Figure 5.
The overall framework of Pix2Pix.
In the training phase, the generator receives input images x (site boundary of the flower border) and tries to generate real images G(x) (flower border design plan) corresponding to these inputs. Meanwhile, the discriminator receives a pair of images: one is the real image pair, and the other is the input image with the image generated by the generator, and the discriminator’s task is to discriminate these image pairs. In this process, the network adjusts the parameters of the generator and the discriminator according to the discriminator’s ability to distinguish between real and generated images. The ultimate goal of the generator is to create images that cannot be distinguished by the discriminator, while the goal of the discriminator is to accurately classify real and generated images. Once the training is complete, the generator is able to produce a target image (flower border design plan) based on the new input condition (site boundary of the flower border).
- 2.
- CycleGAN
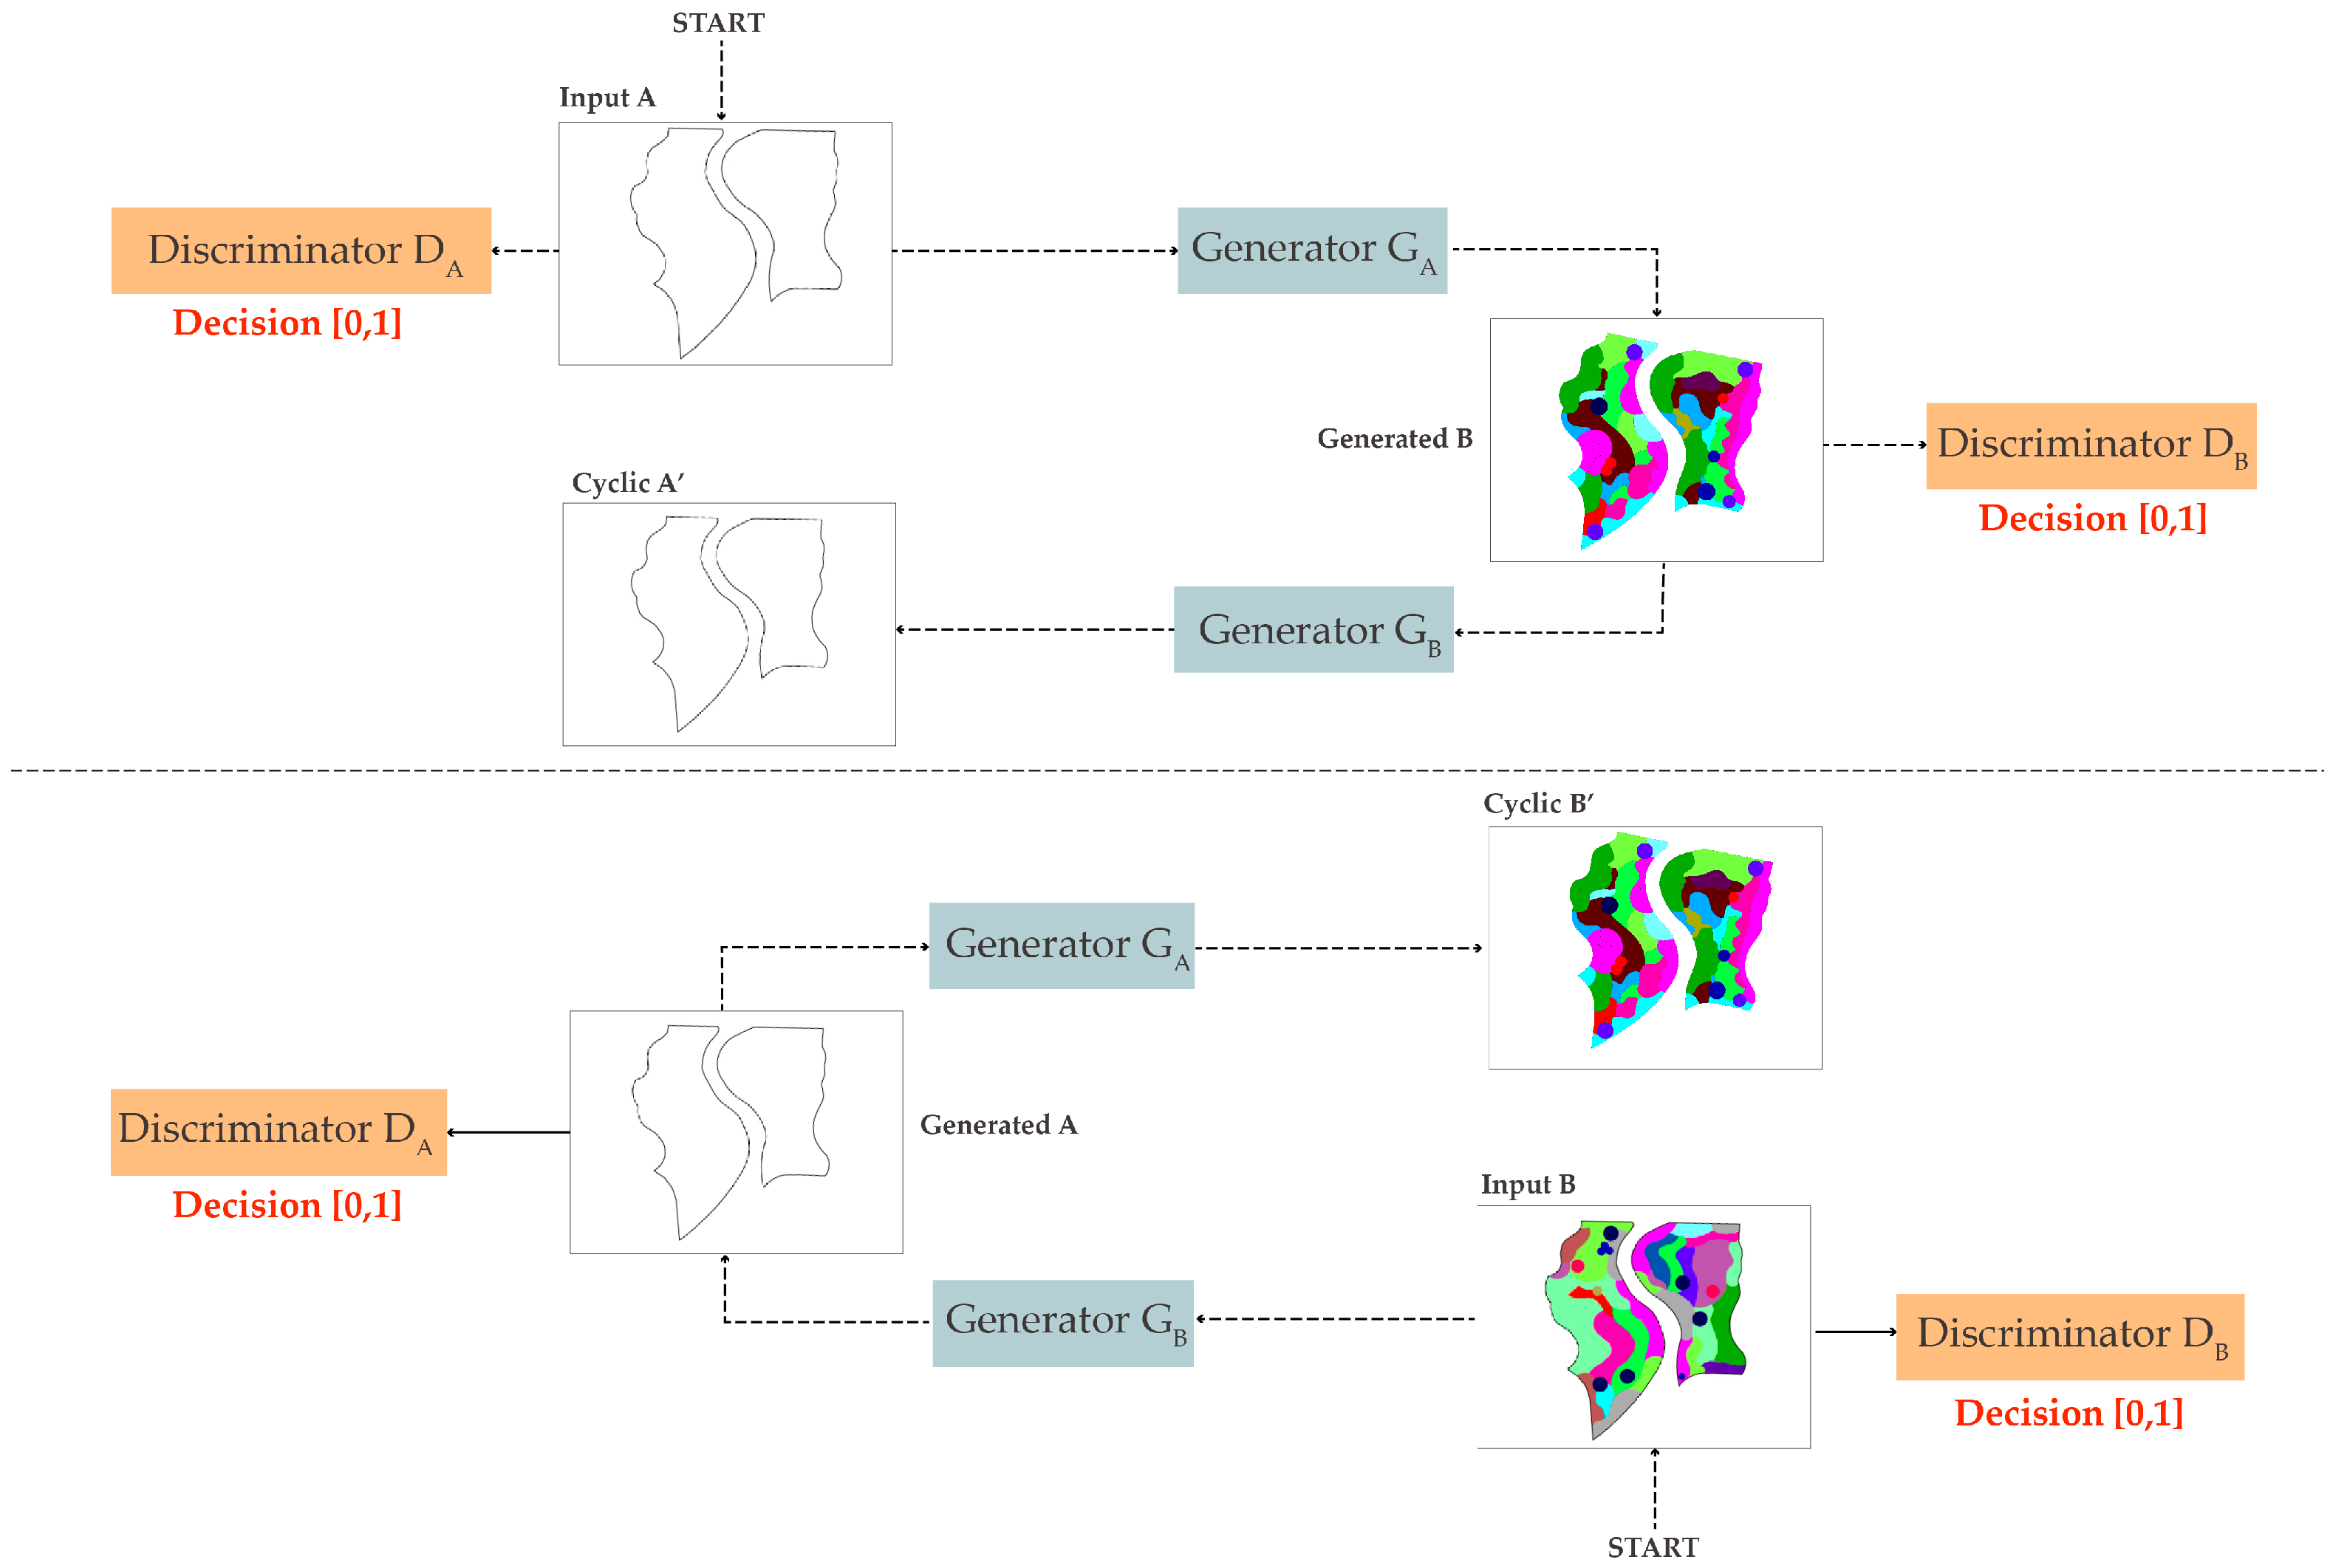
CycleGAN algorithm (Figure 6), proposed by Zhu et al. in 2017 [31], solves the problem of performing image style transformations in the absence of paired data. This algorithm is particularly suitable for tasks where it is difficult to obtain exact pairwise samples. It comprises two sets of generative adversarial networks. The generator handles image style transformation, while the model incorporates two discriminators to assess the authenticity of both real and generated images.
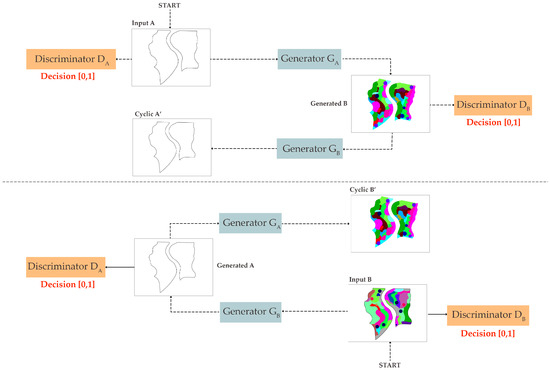
Figure 6.
The overall framework of CycleGAN.
Each generator of CycleGAN consists of three parts: encoder, converter, and decoder. Generator GA is responsible for converting the input image A (site boundary of the flower border) to the target image B (flower border design plan), and generator GB is responsible for converting the target image B back to the source image A. Discriminators DA and DB evaluate the similarity of the images generated by generators GA and GB to the real image, respectively. If the generated image is sufficiently similar to the real image, the discriminators are deceived to train the generators to perform the style transformation better. To ensure the effectiveness and reversibility of the style transformation, CycleGAN introduces cyclic consistency loss. This means that image A, which is converted by generator to image B and then converted back to image A by generator GB, should be as close as possible to the original image. CycleGAN uses two main loss functions to train the model: adversarial loss and cyclic consistency loss. The adversarial loss ensures that the generated image is similar to the real image, while the cyclic consistency loss ensures that the image transformation is reversible. During the training process, the model continuously improves its accuracy in style conversion and authenticity judgment by adjusting the parameters of the generator and the discriminator. This process usually requires a large number of iterations until the model reaches a satisfactory conversion.
2.3.2. Training
The study is based on the open-source programming platform Anaconda, applying the deep learning framework pyTorch, and performing model construction for Pix2Pix and CycleGAN on the interactive editing tool pycharm, respectively. Taking our self-established dataset as the source material, part A (site boundary set) and part B (flower border design plan set) were inputted into the models, and the models were trained to generate flower border plans from site boundaries, and a side-by-side comparison of the two models was made. The model parameters are shown in Table 1.

Table 1.
Parameter setting of the flower border generation model.
The study conducted two rounds of experiments for each of the two models with the number of training and test sets of 4:1. The first round of experiments was conducted using the datasets after the expansion of 5° clockwise rotation and 5° counterclockwise rotation for training, i.e., a total of 369 pairs of datasets (including 295 pairs of training and 74 pairs of test sets). The second round of experiments performs a second data augmentation based on the dataset of the first round of experiments by adding the dataset after rotating 10° clockwise and 10° counterclockwise, i.e., a total of 615 pairs of datasets (including 492 pairs of training sets and 123 pairs of test sets). After observing the training results, the study selects the number of experimental rounds with better results for each of the two models for further analysis.
2.3.3. Testing
Two generation models were constructed using Pix2Pix and CycleGAN, with the same training and test sets applied across both models for consistency. Both models were subjected to two rounds of experiments, as mentioned in Section 2.3.2. The goal of this experiment is to determine the optimal number of training iterations at which the model’s output achieves the best balance of clarity, realism, and consistency in the plant arrangement.
3. Results
3.1. Two Rounds of Test Results
The results of the two rounds of experiments are compared (Table 2). For Pix2Pix, the results of the first round of experiments are superior, and the model is able to simulate the generation of discriminative color blocks, whereas the generated color blocks of the output images of the second round of experiments are difficult to distinguish clearly. For CycleGAN, the results of the second round of experiments are superior. Both rounds of experiments are able to generate color blocks with differentiation, but the generated results of the first round of experiments have more blank areas, while the generated images of the second round of experiments have a higher degree of completion of the design within the site despite the presence of color block spillage. Therefore, the first round of experiments with Pix2Pix and the second round of experiments with CycleGAN were selected for the study for subsequent analysis and evaluation.
Table 2.
Comparison of the results of two rounds of experiments with Pix2Pix and CycleGAN.
Table 3 and Table 4 show the test results of the two models at 100, 300, and 500 rounds of training, respectively. “Rounds of training” refers to the number of times the model processes the dataset during training, with each round allowing the model to learn and adjust its parameters based on the data. It can be observed that the edges of the plaques generated by the model are gradually clearer with the increase in the number of iterations, and the image completeness is gradually improved. After 300 iterations, color patches gradually appear in the generated image and the results become relatively stable. As the training reaches 500 times, the output of the model is closer to the real image, the color block segmentation is gradually complete from dispersed, the division is clearer, and the scale and number of plant patches are reasonable, presenting a natural-style distribution. As shown in the figures (Table 3 and Table 4), with the increase in training rounds, the model’s training gradually improves.
Table 3.
Pix2Pix test results for different number of iterations.
Table 4.
CycleGAN test results with different numbers of iterations.
Considering these results, the study finally chose to set the number of training iterations to 500 for all of them. The samples in Table 4 represent different curved site shapes, including crescent, near-circular, and elongated forms. These variations are used to evaluate the model’s performance and adaptability in generating designs for different spatial layouts.
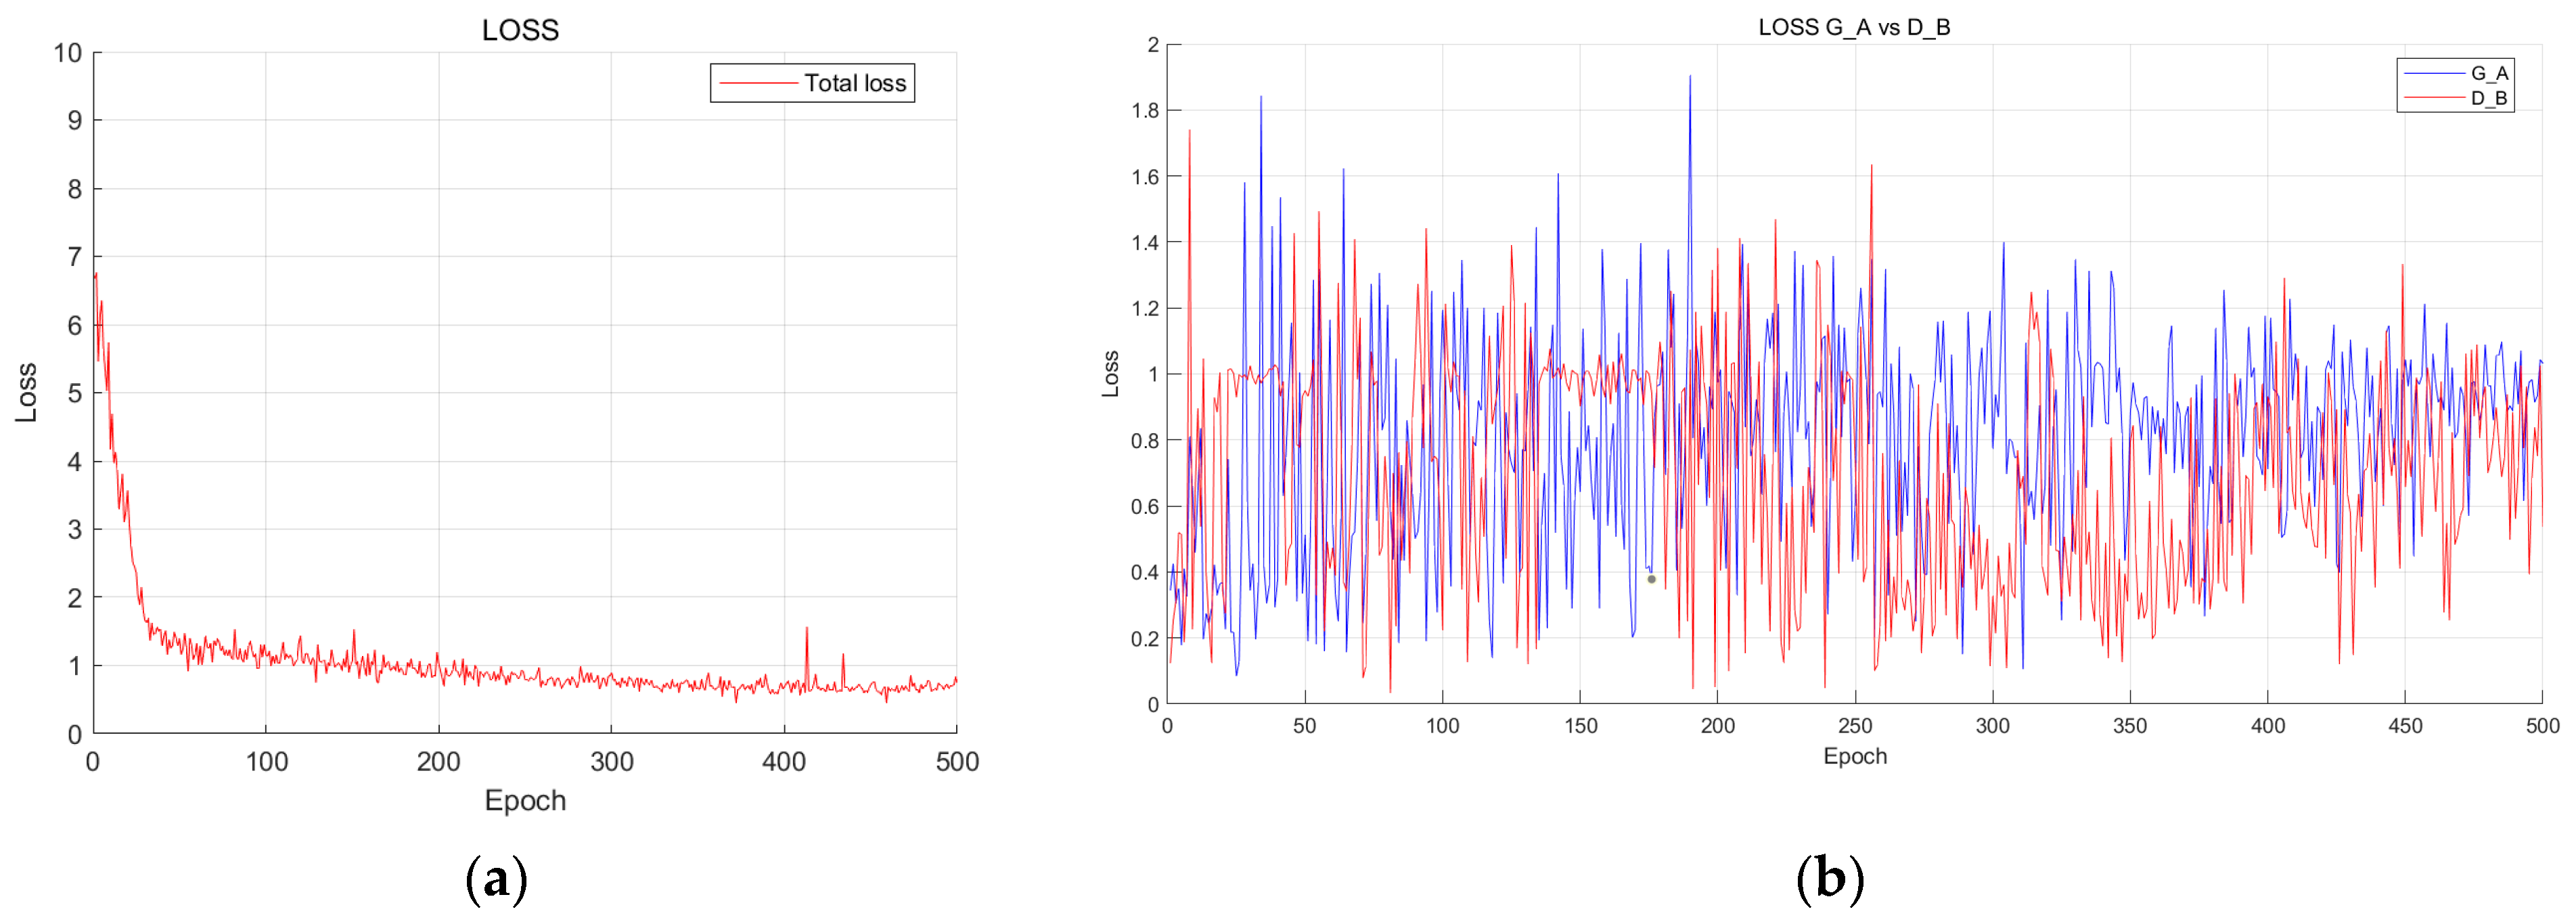
Meanwhile, Figure 7a shows the total loss function during the training of Pix2Pix, which gradually decreases and converges as the number of training iterations increases, indicating that the training has been perfected. Figure 7b shows the loss function of the generative and discriminative networks during the training of the CycleGAN model. As the training iterations accumulate, the loss functions of the respective generators and discriminators gradually converge and occlude together, indicating that the training of the neural network is close to being perfect.

Figure 7.
(a) Pix2Pix loss function. (b) CycleGAN loss function.
3.2. Comparison of Test Results
In the Pix2Pix test results (Table 5), the algorithm was able to distinguish the boundaries of the field and generate pixels of different colors. The generated colors were richer and largely within the 56 valid colors. However, the color patches generated by the algorithm are fuzzy, it is difficult to determine the boundary, and the color patches in some areas are small and broken, making it difficult to identify clear patches.
Table 5.
Pix2Pix and CycleGAN training results and the real designs.
In the CycleGAN test results (Table 5), the algorithm was able to generate more defined color blocks, and the block colors were largely within the 56 valid colors. There were errors in the algorithm’s recognition of site boundaries, but these were able to be dealt with by simple optimization of the results. However, there was pattern collapse in the test results, whereby the algorithm would generate similar repetitive patterns within long strips of field. Through additional experiments, it was found that this problem can be addressed by increasing the proportion of long-striped sites in the dataset to improve the generation results.
The study compared the test results of the two algorithms and found that CycleGAN’s generated results have the following advantages: (1) The images generated by this model have more defined color patches, which are closer to the distribution pattern of the plant patches, and therefore overall closer to the real design. (2) Compared to Pix2Pix, which is biased towards reproducing the dataset used for training, CycleGAN is able to generate creative images and is more likely to learn the underlying patterns of the design. (3) The model generates images that are easier to optimize and model. Therefore, this study chose the model constructed by CycleGAN for the next analysis.
3.3. Optimization of the Results
In order to facilitate the identification of plant species, subsequent evaluation, and practical use, manual processing is required to improve the recognizability and clarity of the images and to ensure that they meet the professional standards of the flower border design and construction drawings. The purpose of this section is to confront the imperfections present in the automatically generated results, which are not directly suitable for use in design. Therefore, manual optimization is needed to make the images clearer and more usable in practical design applications. In order to avoid increased errors due to personal judgment, uniform rules need to be followed for optimization. The study follows the following steps (Table 6) to generate results for optimization.
Table 6.
Procedure of results optimization.
- Boundary correction: retain the boundaries and internal color blocks of the flower border, eliminate redundant color blocks beyond the design boundary, remove unnecessary elements, reshape the boundary lines, and repair missing boundaries.
- Color Separation: Extract the plant elements in the image one by one against the predefined plant categories and their color-matching standards in preparation for the subsequent vectorization process. For cases where there is a slight deviation between the color values of some pixel points and the 56 valid colors, they are corrected using similar valid colors. If the generated image produces meaningless noise or the color value is too different from the selected 56 valid colors, the color of the pixel is unified as the color of the background area.
- Simulation of plant patches: Relatively regular and natural arcs and line segments are used to fit the plant patches on the median axis of the color block demarcation in order to make them more in line with the characteristics of the actual flower border plant. For example, standard-sized dots can be used to fit the tree-like plants and modeling shrubs.
- Vectorization processing: After the image pre-processing is completed, the image is converted into a vector format. Firstly, the boundary information is extracted using the stroke vectorization method. Then, different plant elements in the image are segmented into different regions according to the color, and each region is converted into the corresponding vector representation. Finally, the vectorization results are saved in different vector file formats suitable for different needs and application scenarios.
After the above steps, the resulting plan of the flower border is not only clear and recognizable but also can be converted into editable, practical, and scalable vector data for various applications such as landscape design, planning layout, and construction details.
3.4. Comparison of the Two Algorithms
3.4.1. Image Quality
The Pix2Pix algorithm, as a conditional-based generative adversarial network, relies on a large amount of high-quality pairwise data for learning the mapping between images. With sufficient training pairs and clear target images, Pix2Pix is able to reconstruct detail-rich images with high accuracy. However, this dependency also means that its scope of application is severely limited. This algorithm is suitable for generating object scenes where a large number of high-quality paired samples exist. In this study, however, the flower border design plans are untrained novel designs that face the problem of insufficient paired training samples, and the generative ability of the Pix2Pix algorithm is limited.
In contrast, CycleGAN enables the algorithm to perform transformation learning without the need for pairwise samples by introducing cyclic consistency loss. This feature greatly broadens the applicability of the algorithm, especially in research areas where sample acquisition is difficult or paired data is lacking. CycleGAN demonstrates its powerful image reconstruction and detail capture ability in the generation of flower border plans. For the diversity and complexity of flower border plant patches, its generated images show the ability to surpass Pix2Pix in terms of color block edge clarity, color accuracy, and clarity of details.
3.4.2. Design Mode
The diversity and innovation of the flower border plans is an important aspect of the design. From a design mode perspective, the Pix2Pix algorithm is usually able to reproduce the exact patterning of the training set within a given input due to the rigorous and strict mapping rules learned from the paired data, which is beneficial for maintaining consistency in flower border design and following established design specifications and is suitable for handling the task of prescriptive design. However, this rigorous learning mechanism also leads to its limitations in design innovation. Flower border plan generation is both scientific and artistic, and in addition to following design norms and laws, it has a high degree of design freedom and innovation. Pix2Pix sometimes replicates or fine-tunes existing designs due to its over-reliance on patterns in the training samples and is unable to innovate and personalize adjustments on this basis.
CycleGAN, on the other hand, has a more significant advantage in this regard, as its cyclic consistency learning mechanism is capable of generating new design images without the guidance of direct samples. It can not only simulate known designs but also stimulate new design patterns and generate more original flower border design images. The generated images not only reproduce the commonly used plant combinations in the training samples but also can introduce new elements and structures, which provides more inspiration and possibilities for flower border designers to produce novel and creative designs.
3.5. Generation Results Evaluation
Based on the flower border plans dataset, the study used Pix2Pix and CycleGAN algorithms as models to train the automatic generative design system sequentially. After that, the test set samples were input one by one in order to analyze and compare the results generated by the two algorithms. After analyzing and comparing, the study chose the generation program based on the CycleGAN algorithm as the final test sample to analyze the test results in detail (Figure 8).
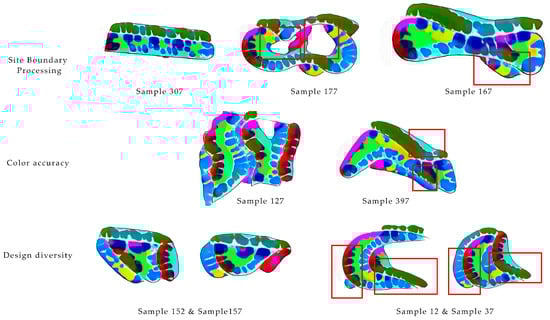
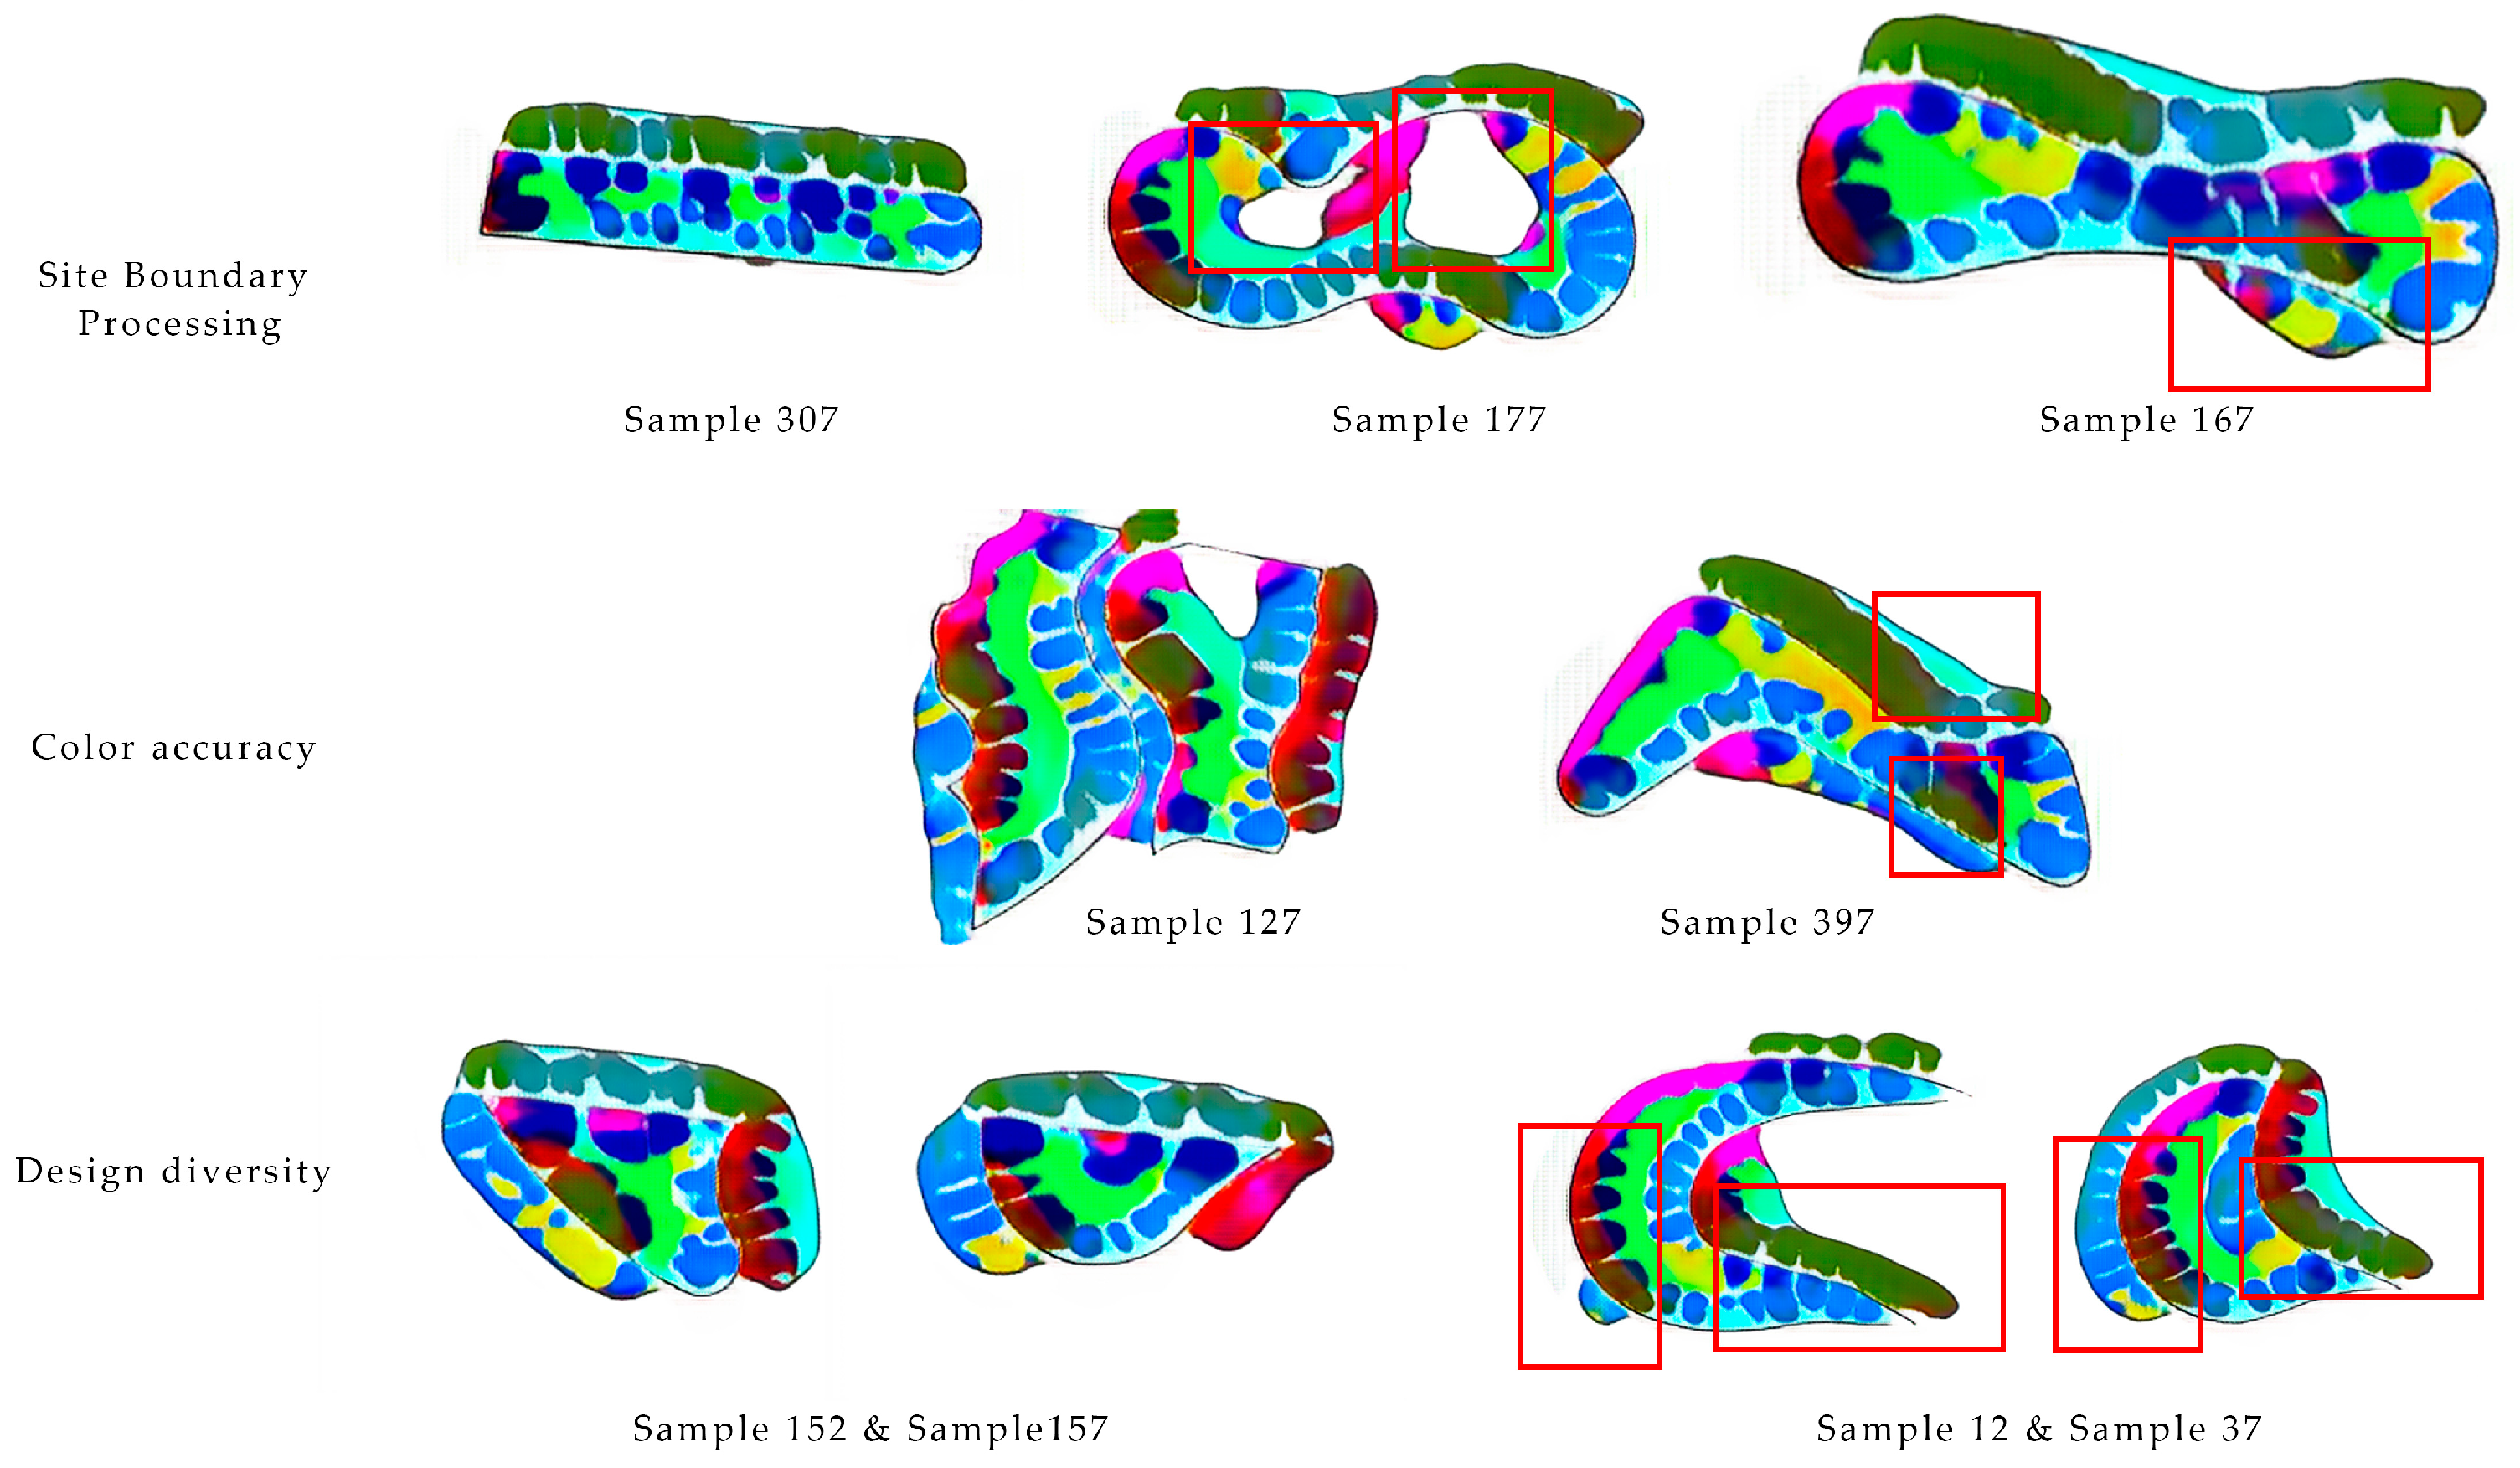
Figure 8.
Analysis of image quality.
3.5.1. Image Quality Assessment
- Site boundary processing: The evaluation criterion is centered on the completeness and accuracy of site boundaries, and representative cases of strip sites and curved sites are selected for analysis in this study. (a) For strip-shaped sites, CycleGAN shows relatively good boundary reproduction ability, with clear and continuous boundary lines in the output results and only slight overflow phenomena. For example, in Sample 307, the edges of the long strip site are complete, most of the color blocks are located within the boundary, and there are no gaps in the interior. (b) For curved sites, especially the complex contour structure of the “8” shape, the CycleGAN results, while maintaining the overall structural integrity, showed a certain degree of color overflow or blank areas locally, probably due to the limited adaptability of the model in dealing with curvature variations. For example, in Sample 177, blank areas were produced in the center of the site. In Sample 167, some of the color blocks extend beyond the boundaries. These areas create a significant visual discontinuity that affects the integrity of the design. These types of problems are usually corrected by subsequent manual optimization in terms of the refinement required for the construction drawings of the flower border design.
- Color accuracy: CycleGAN is able to ensure that the output color blocks are consistent or similar to the set RGB values in most cases, showing the high accuracy of the model in color reproduction. For example, the green plant block in Sample 397 has a high match with the preset RGB values. However, when encountering two color blocks that are close in color and exist side-by-side in the image, CycleGAN may generate transition blocks between the two, and in Sample 127, there is an extensive cyan transition zone between adjacent blue-green plant blocks, which leads to blurring of the boundaries. Nonetheless, in terms of the overall generated images, the model is only able to accurately learn and reproduce about half of the color norms in the dataset, leaving room for further improvement.
- Design diversity: CycleGAN has shown some consistency in capturing different site characteristics and design trends. Taking Samples 152 and 157 as an example, the model is able to output plant configurations that are not identical based on the differences in their profiles, despite the fact that these two samples have some similarity in volume and shape. This suggests that CycleGAN is able to capture differences in site characteristics and transform them into appropriate designs. However, in the face of structurally similar sites, the model still tends to generate overly similar solutions that lack sufficient innovation and individual expression, as shown in Samples 12 and 37, which almost present mirror-image design outputs.
In summary, CycleGAN demonstrated certain advantages in flower border plan generation but also exposed room for improvement in complex site processing, boundary clarity, and design innovation. These findings provide important guidance for future research, pointing out potential directions for further optimization and development of CycleGAN in the field of flower border design generation.
3.5.2. Design Assessment
- Sample Selection
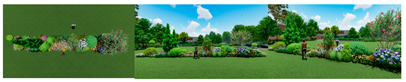
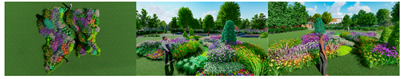
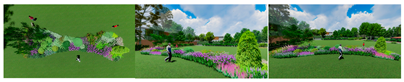
This analysis selected three representative samples from the CycleGAN model test results for optimization and modeling (Table 7). The generated images were first refined according to the steps described in Section 3.3 to produce the optimization results. These were then imported into Lumion for 3D modeling and rendering, resulting in the final modeling pictures. The work tried to present the generated results as intuitively as possible to facilitate the creation of questionnaires for evaluation and scoring.
Table 7.
Sample optimization and modeling results.
- 2.
- Evaluation Methods
At present, the evaluation of flower border plants predominantly focuses on characteristics such as landscape ornamentality, ecological adaptability, biosafety considerations, economic factors, and practical utility [32,33,34,35]. Importance-Performance Analysis (IPA) has been widely used in research in the field of landscape in recent years. IPA analysis is based on quantitative research and constructs a quadrant diagram, where the horizontal axis represents importance and the vertical axis represents satisfaction. By plotting the scatter, we can visualize the difference between the evaluator’s target expectation and the actual performance of the evaluated things [36,37].
The results generated by the study are the plan view of the flower border filled by different color blocks and the images do not contain information about the off-site surroundings. The study aims to evaluate the generation results and focuses on analyzing the directions for their further improvement. Therefore, this study adopts the IPA analysis method and invites experts to score in order to conclude the performance of the generated solutions in various aspects as well as the aspects that need to be strengthened more.
At present, the research for flower border evaluation has been relatively complete, mostly evaluating and analyzing from visual, seasonal, ecological, cost, cultural, and safety aspects [32,37,38,39]. This paper establishes an evaluation system including two first-level indicators and eight second-level indicators based on the indicators used in existing studies and the characteristics of plantscape generation design. Level 1 indicators are ornamental and ecological. Ornamental properties include vertical variation (VV), color collocation (CC), seasonal variation (SV), and textural harmony (TH). Ecology includes plant diversity (PD), low maintenance (LM), ecological niche harmony (ENH), and sustainability (S) (Table 8).
Table 8.
Evaluation system for flower landscape.
Seven professionals were invited to score the importance of the eight metrics and then to score the optimization results and modeling images of the three generated results. The scoring was based on a five-point Likert scale, in which the options for importance/satisfaction were “very important/very satisfied”, “more important/more satisfied”, “generally important/generally satisfied”, “less important/less satisfied”, and “very unimportant/very dissatisfied”, with five scores of 5, 4, 3, 2, and 1 assigned in that order. Quantify the evaluation of each indicator by each expert in order to quantitatively describe the expert’s perception of the importance and satisfaction of the indicator. Finally, the mean of the overall scores of the three results on each indicator was calculated and an IPA quadrant diagram was drawn, which was divided into four quadrants, respectively:
- Quadrant I: High Importance—High Performance—Area of Advantage. Indicator performance generally meets expectations and will continue to be maintained in future developments, sustaining the advantage.
- Quadrant II: Low Importance—High Performance—Maintenance. Indicator performance is excellent and can be sustained.
- Quadrant III: Low Importance—Low Performance—Opportunity Zone. Indicator performance is average and can be improved to some degree, but it should not be prioritized too high.
- Quadrant IV: High Importance—Low Performance—Improvement Zone. Indicators are performing poorly and need to be prioritized for improvement.
- 3.
- Questionnaire results
Regarding the importance evaluation (Table 9), the importance scores of the ornamental characters were all high, with an average importance score of 4.57, indicating that professionals recognized the indicators selected for this study. Among them, professionals attached the most importance to vertical variation, with an importance score of 4.71. CC (4.57) and TH (4.57) were next in importance, and SV (4.43) was relatively less important. Therefore, vertical variation, color collocation, and texture harmony can be prioritized in terms of the ornamental character of flower borders. The average importance score of the ecological characters was 4.43. Among them, professionals gave the highest priority to low maintenance with an importance score of 4.71, followed by sustainability (4.57) and ENH (4.43), and PD (4) had a lower importance score. Therefore, low maintenance, sustainability, and ecological niche harmony can be prioritized in terms of the ecological aspects of floral borders, while plant diversity should not be prioritized too high.
Table 9.
Importance evaluation form.
In the satisfaction evaluation (Table 10), the average satisfaction with the ornamental character of the three samples is 3.78, and the average satisfaction with the ecological character is 3.67. This indicates that professionals are relatively satisfied with the generated results.
Table 10.
Satisfaction evaluation form.
In terms of ornamental character, satisfaction with CC (4.10) is the highest, with consistently high scores across all three samples, indicating excellent and stable performance in this aspect of the generated results. The satisfaction score for SV (3.76) is also high, though Sample 3 shows a relatively low score of 3.43, suggesting that seasonal variation in the generated results may be inadequate in some cases. TH (3.66) received a comparatively lower satisfaction score, with minimal variation across the three samples, indicating a generally moderate performance in this aspect. The satisfaction score for VV (3.57) is lower, primarily due to the low score of 2.86 in Sample 3, reflecting that, in certain instances, the generated flower borders fail to sufficiently showcase height variation among plants.
Regarding ecological character, PD (3.91) achieved the highest satisfaction, with high scores across all three samples, demonstrating that the generated results effectively meet the requirements for plant diversity. The second is ENH (3.76), with little score variation among the samples, indicating good performance in this regard. Satisfaction scores for S (3.53) and LM (3.48) are relatively low, with notably low scores in Sample 2, likely due to a higher proportion of annual and biennial flowers in the generated results, suggesting only average performance in these aspects and potential for improvement in certain site types.
The Importance-Performance (I-P) gap shows that all indicators have values greater than zero, indicating that the current flower border design does not fully meet the expectations of professionals. Among these, PD (0.09) has the smallest gap, indicating that the generated results nearly meet professional expectations in this regard, while the gaps for LM (1.23), VV (1.14), and S (1.04) exceed 1, providing reference points for future improvement.
The three samples represent different site types. Sample 1, a strip site, has an average ornamental character satisfaction score of 3.86 and an average ecological character satisfaction score of 3.86, with high and relatively uniform scores across indicators. The highest satisfaction score is for VV (4.00), while the lowest is for TH (3.71), suggesting that the generated design for strip sites performs well in both ornamental and ecological character. Sample 2, a segregated site, shows an average ornamental satisfaction score of 3.93 and an ecological satisfaction score of 3.5, with marked differences among indicator satisfaction levels. High satisfaction is found in CC (4.29), SV (4.00), and PD (4.00), while LM (3.00) and S (3.29) are insufficient, indicating that the generated design for segregated sites performs well in ornamental character but requires improvement in ecological character, especially in terms of LM and S. Sample 3, a “figure-eight” shaped site, has an average ornamental satisfaction score of 3.54 and an ecological satisfaction score of 3.64, with high satisfaction in CC (4.14) and PD (3.86). However, SV (3.43) and S (3.43) show room for improvement, and VV (2.86) is notably insufficient. This may be due to the elongated middle section of the site, causing the model to fail in generating distinct plant patches with varied heights in that area, indicating improvement opportunities for both ornamental and ecological character in the “figure-eight” shaped site.
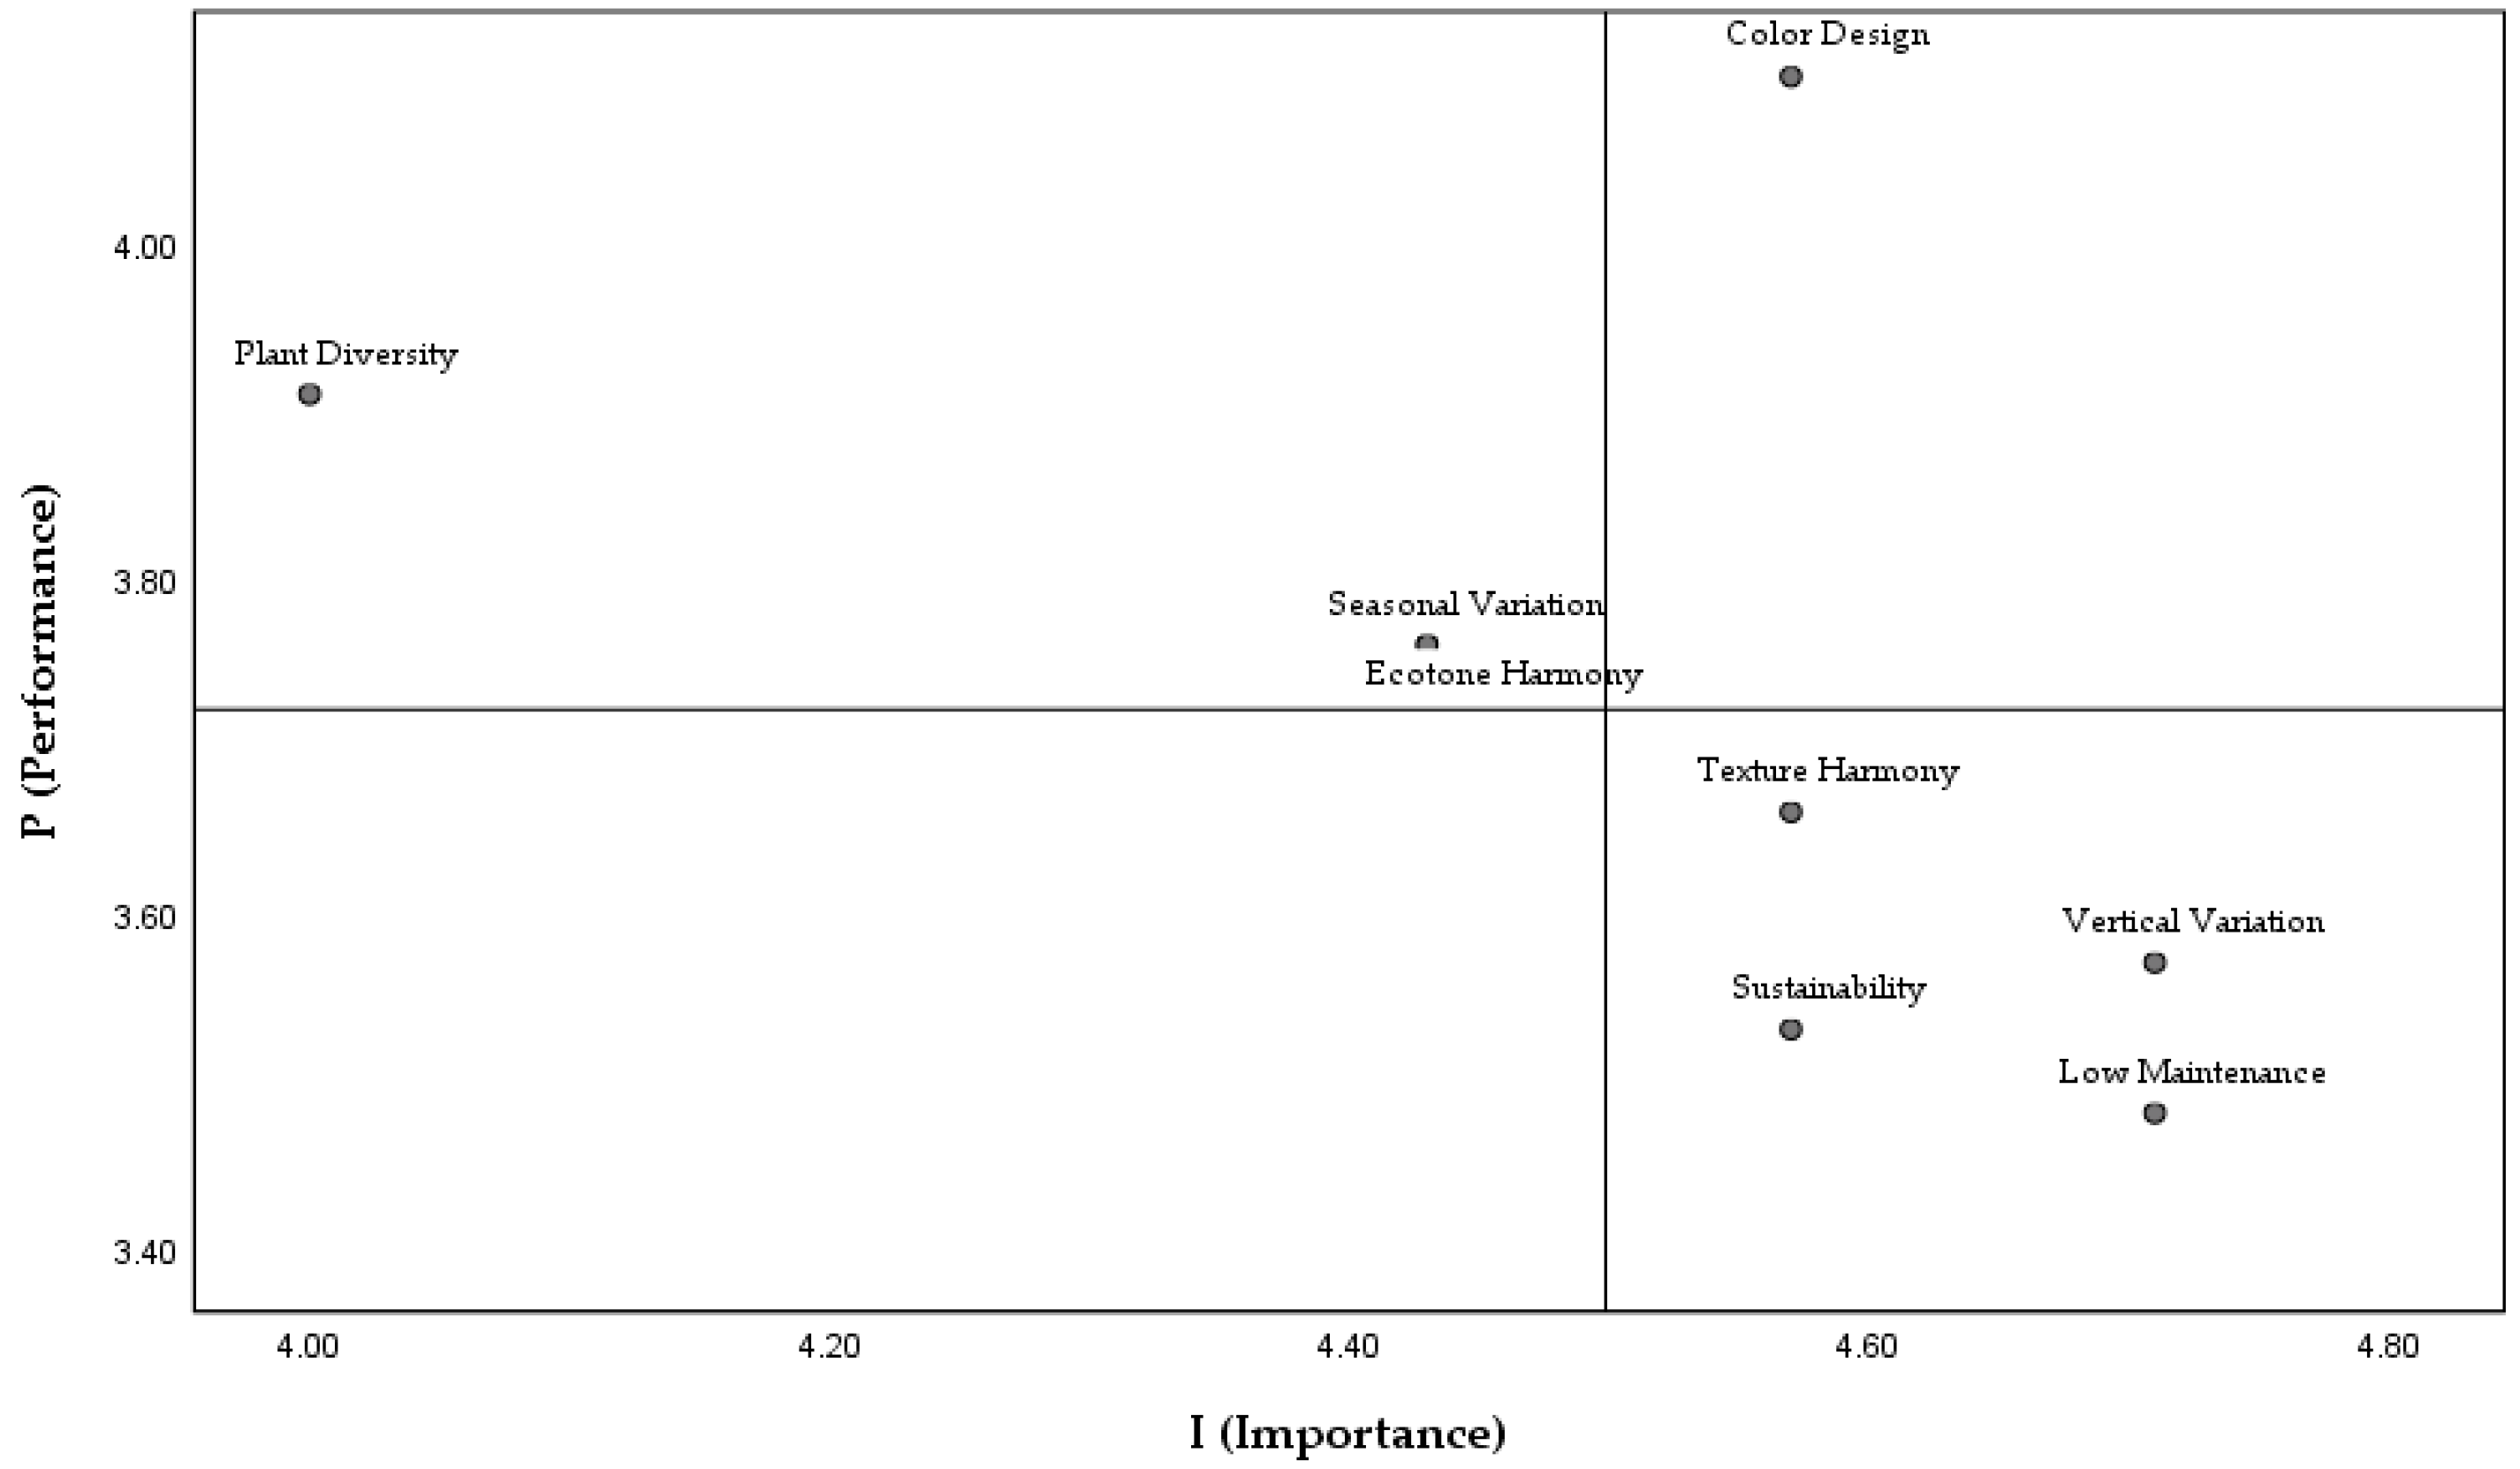
Using an average importance score of 4.50 as the horizontal axis boundary and an average satisfaction score of 3.72 as the vertical axis boundary, the calculated importance and satisfaction data points for each indicator are plotted on a quadrant diagram (Figure 9). Analysis reveals that CC lies in the superiority quadrant and should be further developed to maintain its advantage. SV, PD, and ENH fall within the maintenance quadrant; as these indicators are of relatively low importance, their advantages should be preserved. VV, TH, LM, and S are located in the improvement quadrant, indicating that these indicators are of high importance but relatively low performance, marking them as key areas for future enhancement.

Figure 9.
IPA results of flower border designs.
4. Discussion
This paper proposes a flower border plan generation system based on GAN algorithms. The system achieves the “generation, optimization, and validation” of complex small-scale plantscape designs. Built on Pix2Pix and CycleGAN, the system automatically generates flower border layout plans that meet spatial, aesthetic, and ecological requirements, providing landscape designers with an efficient tool and promoting the intelligent and scientific development of plantscape design.
In recent years, GAN has been widely applied in architecture and landscape design, particularly in the design and image generation of outdoor spaces such as parks and communities. These applications are typically focused on large-scale, functional areas with regular layouts. For example, Liu et al. employed generative design methods to study structured spaces like private gardens in Jiangnan [40], while Qu et al. developed a functional plan generative design method for residential landscapes based on CGAN [15]. However, the application of GAN in small-scale plantscape design, particularly flower border design, remains relatively underexplored.
Recently, some studies have explored the use of AI models to generate flower border designs. For instance, Cui et al. used diffusion models to generate visual effects for flower borders [22]. However, these studies largely focus on aesthetic outcomes, particularly for facades, and rarely address the spatial planning of plant layouts. In contrast, this research focuses on generating plant layout plans, not only considering spatial and aesthetic effects but also integrating scientific evaluation metrics. This approach ensures that the generated designs are visually satisfying while meeting spatial, ecological, and functional requirements, addressing the unique challenges of small-scale plantscape design.
By extending the application of GAN from large-scale urban planning to more detailed plantscape elements, this study introduces a new research methodology for plantscape design, contributing to a deeper understanding of how GAN can assist in designing small-scale landscapes.
The study demonstrates that GANs exhibit a certain level of rationality in flower border design. However, there are also some limitations. Firstly, GANs generate images by learning the features of the training samples, making them highly dependent on the training dataset. This dependency is especially apparent in Pix2Pix, where the generated results often replicate the training samples. Consequently, the quality of the dataset is crucial in this study. In addition to meeting quality standards, the training samples also need to be expanded as much as possible. However, obtaining high-quality samples poses challenges, and improving the dataset requires significant effort. Secondly, to meet the dataset quantity requirements, this study collected flower border samples from two design institutes. Although the regions and scales are similar, there are still stylistic differences between the datasets. The algorithm may learn the common features within the dataset more effectively while potentially failing to learn the unique plant distribution characteristics, resulting in a lack of depth and detail in personalization within the generated designs. It is worth noting that the data used in this study primarily comes from the East China region, which may limit the direct applicability of the results to other geographic locations. However, we believe that the methodology can be adapted to different regions with the right adjustments to the datasets, allowing for broader application and comparison in future research. Lastly, given the 56 plant elements selected for the study, the original dataset’s sample size (123 pairs) is relatively inadequate. Even with data augmentation, it remains challenging for the algorithm to learn the distribution patterns of all plant elements. Further research is needed to balance the quantity of plant elements with the dataset size to maximize the practicality of the generated results.
5. Conclusions
GANs have already achieved significant results in the field of image generation and have garnered widespread attention in large-scale designs, such as architecture and planning. This study applies GAN to flower border design, achieving its application at a smaller scale within the realm of plantscape design. Actual flower border designs were collected as samples, and plant elements were classified and simplified for extraction. Based on this, flower border plans were annotated to establish the dataset for this study. Subsequently, flower border automatic generation systems were constructed based on two different algorithms: Pix2Pix and CycleGAN. Experiments have shown that both Pix2Pix and CycleGAN are capable of generating garden layout designs. Pix2Pix demonstrates a stronger ability to recognize the site boundary, while CycleGAN generates clearer color blocks that closely resemble real plant patches in flower border designs.
However, the generated results also exhibit certain limitations. In the images generated by Pix2Pix, the color blocks are often fragmented, and their distribution tends to resemble that of the training dataset. CycleGAN, on the other hand, shows some shortcomings in accurately identifying site boundaries. For the CycleGAN model, which performed better in the experiment, professionals were also invited to provide an evaluation. The evaluation results indicated that the generated flower border design plans have certain ornamental and ecological value, but there is still room for improvement in aspects such as vertical variation, texture harmony, low maintenance, and sustainability. This study achieved the automatic generation of small-scale plantscapes on a limited sample size and produced results with practical application value. In the face of the study’s limitations, future research can optimize the process in the following three areas to achieve higher-quality generation results:
- Expand the dataset sample size. Due to the difficulty of obtaining samples and the limitations of the algorithm, this study ultimately used 123 samples in the experiment. To enhance model generation quality, the sample size should be expanded through various methods, such as online collection and field surveys.
- Incorporate the environment outside the flower border site. In this study, external environmental conditions were not retained in the dataset processing, so inputting sites with similar contours may result in similar flower border designs. Future research may include some external environmental information to improve the diversity and logical consistency of the generated results.
- Refine the dataset classification. Future research may consider establishing multiple datasets and adjusting the proportion of specific site types in the training set to develop generation models tailored to diverse application needs. Specifically, dataset classification could be based on site types and ecological types, enabling the development of generation models tailored to a variety of environments and requirements. Classification by site types could encompass different shapes and structures of sites to accommodate various planning and design goals. Classification by ecological types could involve creating datasets based on regional and environmental characteristics to meet specific ecological demands. Through such multidimensional classification, future studies could enhance the applicability and accuracy of generation models, catering to the practical needs of different scenarios and ecological contexts.
Supplementary Materials
The following supporting information can be downloaded at: https://www.mdpi.com/article/10.3390/land14040746/s1, Table S1: Detailed plant classification results and corresponding marker color.
Author Contributions
Conceptualization, Y.S. and C.Y.; methodology, Y.S., C.Y., R.C. and J.Z.; software, Y.S. and C.Y.; validation, Y.S. and C.Y.; formal analysis, Y.S. and C.Y.; investigation, Y.S. and C.Y.; resources, L.F.; data curation, Y.S. and C.Y.; writing—original draft preparation, Y.S. and C.Y.; writing—review and editing, Y.S. and C.Y.; visualization, Y.S. and C.Y.; supervision, L.F.; project administration, L.F.; funding acquisition, L.F. and J.Z. All authors have read and agreed to the published version of the manuscript.
Funding
This research was funded by the National Natural Science Foundation of China, grant number 52208041, and the Shanghai Philosophy and Social Science Planning Project, grant number 2021ECK002.
Data Availability Statement
The data are unavailable due to privacy restrictions.
Acknowledgments
We would like to express our gratitude to Shanghai Fanfan Horticulture Co., Ltd. and Shanghai Hengyi Landscape Greening Co., Ltd. for generously providing a substantial number of original materials for the flower border used in this study.
Conflicts of Interest
The authors declare no conflicts of interest.
References
- Lincoln, F. RHS Garden Design Handbook; Royal Horticultural Society: London, UK, 2019. [Google Scholar]
- Wan, Z.; Shen, X.; Cai, Y.; Su, Y.; Ren, Z.; Xia, Y. How to Make Flower Borders Benefit Public Emotional Health in Urban Green Space: A Perspective of Color Characteristics. Forests 2024, 15, 1688. [Google Scholar] [CrossRef]
- Goodfellow, I.J.; Pouget-Abadie, J.; Mirza, M.; Xu, B.; Warde-Farley, D.; Ozair, S.; Courville, A.; Bengio, Y. Generative Adversarial Nets. Adv. Neural Inf. Process. Syst. 27 (Nips 2014) 2014, 27, 2672–2680. [Google Scholar]
- Zhao, J.; Cao, Y. Review of Artificial Intelligence Methods in Landscape Architecture. Chin. Landsc. Archit. 2020, 36, 82–87. [Google Scholar] [CrossRef]
- Chen, R.; Zhao, J.; Yao, X.Q.; Jiang, S.J.; He, Y.T.; Bao, B.; Luo, X.M.; Xu, S.H.; Wang, C.X. Generative Design of Outdoor Green Spaces Based on Generative Adversarial Networks. Buildings 2023, 13, 1083. [Google Scholar] [CrossRef]
- Zhang, F. Research on the Application of Traditional Culture in Modern Landscape Architecture Design under the Background of Artificial Intelligence. Appl. Math. Nonlinear Sci. 2024, 9. [Google Scholar] [CrossRef]
- Zhao, J.; Chen, R.; Hao, H.C.; Shao, Z. Application progress and prospect of machine learning technology in landscape architecture. J. Beijing For. Univ. 2021, 43, 137–156. [Google Scholar]
- Xu, T.; Zhang, P.C.; Huang, Q.Y.; Zhang, H.; Gan, Z.; Huang, X.L.; He, X.D. AttnGAN: Fine-Grained Text to Image Generation with Attentional Generative Adversarial Networks. In Proceedings of the 2018 IEEE/Cvf Conference on Computer Vision and Pattern Recognition (Cvpr), Salt Lake City, UT, USA, 8–22 June 2018; pp. 1316–1324. [Google Scholar] [CrossRef]
- Shen, J.; Liu, C.; Ren, Y.; Zheng, H. Machine Learning Assisted Urban Filling. In Proceedings of the 25th International Conference on Computer-Aided Architectural Design Research in Asia (CAADRIA), Bangkok, Thailand, 6 August 2020. [Google Scholar]
- Chaillou, S. AI & Architecture an Experimental Perspective; Harvard University: Cambridge, MA, USA, 2020. [Google Scholar]
- Nauata, N.; Hosseini, S.; Chang, K.H.; Chu, H.; Cheng, C.Y.; Furukawa, Y. House-GAN plus plus: Generative Adversarial Layout Refinement Network towards Intelligent Computational Agent for Professional Architects. In Proceedings of the 2021 IEEE/Cvf Conference on Computer Vision and Pattern Recognition, Cvpr, Nashville, TN, USA, 19–25 June 2021; pp. 13627–13636. [Google Scholar] [CrossRef]
- Aalaei, M.; Saadi, M.; Rahbar, M.; Ekhlassi, A. Architectural layout generation using a graph-constrained conditional Generative Adversarial Network (GAN). Autom. Constr. 2023, 155, 105053. [Google Scholar] [CrossRef]
- Pohlmann, K.; Tawil, N.; Brick, T.R.; Kühn, S. When houses wear faces: Reverse correlation applied to architectural design. J. Environ. Psychol. 2024, 98, 102401. [Google Scholar] [CrossRef]
- Zhao, C.W.; Yang, J.; Li, J.T. Generation of hospital emergency department layouts based on generative adversarial networks. J. Build. Eng. 2021, 43, 102539. [Google Scholar] [CrossRef]
- Qu, G.B.; Xue, B.Y. Generative Design Method of Landscape Functional Layout in Residential Areas Based on Conditional Generative Adversarial Nets. Low Temp. Archit. Technol. 2022, 44, 5–9+14. [Google Scholar] [CrossRef]
- Chen, M.F.; Zheng, H.; Wu, J. Computational Design of Multi-functional System Based on Generative Adversarial Networks—Taking the Layout Generation of Vocational and Technical College as an Example. Archit. J. 2022, 1, 103–108. [Google Scholar]
- Yenew, A.B.; Assefa, B.G.; Belay, E.G. HouseGanDi: A Hybrid Approach to Strike a Balance of Sampling Time and Diversity in Floorplan Generation. IEEE Access 2024, 12, 125235–125252. [Google Scholar] [CrossRef]
- Ali, A.K.; Lee, O.J. Facade Style Mixing Using Artificial Intelligence for Urban Infill. Architecture 2023, 3, 258–269. [Google Scholar] [CrossRef]
- Zhou, H.Y.; Liu, H.L. Artificial Intelligence Aided Design: Landscape Plan Recognition and Rendering Based on Deep Learning. Chin. Landsc. Archit. 2021, 37, 56–61. [Google Scholar] [CrossRef]
- Zhu, W.Y.; Li, P.B. Plant Landscape Layout Design of Urban Park Based on the Parametric Design Method—A Case Study of Shuixizhuang Park in Tianjin. Chin. Landsc. Archit. 2022, 38, 110–115. [Google Scholar] [CrossRef]
- Hollands, J.; Korjenic, A. Evaluation and Planning Decision on Façade Greening Made Easy—Integration in BIM and Implementation of an Automated Design Process. Sustainability 2021, 13, 413–426. [Google Scholar]
- Cui, S.X.; Zhang, Y.W.; Jia, J.; Wang, X.D. Analysis of AI-Enabled Floral Design Applications. Landsc. Archit. Acad. J. 2023, 40, 106–112. [Google Scholar]
- Lin, W.J. Feasibility Study on Application of Artificial Neural Network in Plant Arrangement. Master’s Thesis, South China University of Technology, Guangzhou, China, 2017. [Google Scholar]
- Le, Y.; Huang, S.Y. Prediction of Urban Trees Planting Base on Guided Cellular Automata to Enhance the Connection of Green Infrastructure. Land 2023, 12, 413–426. [Google Scholar] [CrossRef]
- Wu, R.; Huang, M.; Yang, Z.; Zhang, L.; Wang, L.; Huang, W.; Zhu, Y. Pix2Pix-Assisted Beijing Hutong Renovation Optimization Method: An Application to the UTCI and Thermal and Ventilation Performance. Buildings 2024, 14, 1957. [Google Scholar] [CrossRef]
- Zhou, Z.; Fu, C.; Weibel, R. SpaGAN: A spatially-aware generative adversarial network for building generalization in image maps. Int. J. Appl. Earth Obs. Geoinf. 2024, 135, 104236. [Google Scholar]
- Liu, Y.; Luo, Y.; Deng, Q.; Zhou, X. Exploration of Campus Layout Based on Generative Adversarial Network. In Proceedings of the 2020 DigitalFUTURES, Singapore, 3–4 July 2021; pp. 169–178. [Google Scholar]
- Sun, C.; Zhou, Y.R.; Han, Y.S. Automatic generation of architecture facade for historical urban renovation using generative adversarial network. Build. Environ. 2022, 212, 108781. [Google Scholar] [CrossRef]
- Liu, D.L.; Wang, K.Q. Research on the Generative Design of Architectural Form and Combination Based on Pix2Pix Algorithm. Build. Sci. 2022, 38, 260–267+286. [Google Scholar] [CrossRef]
- Isola, P.; Zhu, J.Y.; Zhou, T.H.; Efros, A.A. Image-to-Image Translation with Conditional Adversarial Networks. In Proceedings of the 30th Ieee Conference on Computer Vision and Pattern Recognition (Cvpr 2017), Honolulu, HI, USA, 21–26 July 2017; pp. 5967–5976. [Google Scholar] [CrossRef]
- Zhu, J.Y.; Park, T.; Isola, P.; Efros, A.A. Unpaired Image-to-Image Translation using Cycle-Consistent Adversarial Networks. In Proceedings of the 2017 Ieee International Conference on Computer Vision (Iccv) 2017, Venice, Italy, 22–29 October 2017; pp. 2242–2251. [Google Scholar] [CrossRef]
- Wu, J.; Sun, Y.H.; Zhao, Z.Y.; Li, Y.N.; Li, J. Comprehensive Evaluation of Landscaoe Value of 50 Shrub Flower Border Applications Based on Analytic Hierarchy Process. J. Kashi Univ. 2023, 44, 41–46. [Google Scholar] [CrossRef]
- Peng, L.X.; Yang, Y.H.; Fang, Z.J.; Zeng, Z.Y.; Lu, Q.Y.; Tang, H.M.; Qin, Q.M. Evaluation and analysis of flower border plant resources in South China National Botanical Garden based on AHP. Contemp. Hortic. 2023, 46, 39–41. [Google Scholar] [CrossRef]
- Wang, Y.Y.; Zhang, Q.Y.; Li, J. The Review of Domestic Flower Border Research Based on CiteSpace. Landsc. Archit. Acad. J. 2023, 40, 109–115. [Google Scholar]
- Li, T. Research on the Comprehensive Benefit Evaluation System of Flower Landscape in Wuhu City Based on AHP Method. Contemp. Hortic. 2024, 47, 36–38. [Google Scholar] [CrossRef]
- Zhu, Q. Research on Image Perception of Traditional Landscape Areas Based on Network Text and IPA Analysis—Taking the Eighteen Stairs of Chongqing as an Example. In Proceedings of the 2022/2023 Annual National Planning Conference, Wuhan, China, 23–25 September 2023; p. 10. [Google Scholar]
- Wu, Y.Y.; Qin, S.Y.; Wu, J.; Zhang, Y.L.; Wang, M.X. Study on the Evaluation of Flower Border Landscape of Park Green Space in Shanghai Based on IPA Method. Landsc. Archit. Acad. J. 2023, 40, 113–121. [Google Scholar]
- Si, L.F.; Geng, X.M. Landscape Characteristics and Comprehensive Evaluation of Flower Borders in Beijing Based on AHP Method. J. Anhui Agric. Sci. 2023, 51, 103–107+111. [Google Scholar]
- Yang, Y.; Tang, X.L.; Liu, L.; Jia, Y.Y.; Luo, H. Plantscape Quality Evaluation Based on Principal Components Method and SBE Method—A Case Study of Six Universities Campuses in Nanjing. J. Northwest For. Univ. 2020, 35, 256–264. [Google Scholar]
- Liu, Y.B.; Fang, C.R.; Yang, Z.; Wang, X.X.; Zhou, Z.H.; Deng, Q.M.; Liang, L.Y. Exploration on Machine Learning Layout Generation of Chinese Private Garden in Southern Yangtze. In Proceedings of the 2021 Digitalfutures, Cdrf, Singapore, January 2021; pp. 35–44. [Google Scholar] [CrossRef]


Disclaimer/Publisher’s Note: The statements, opinions and data contained in all publications are solely those of the individual author(s) and contributor(s) and not of MDPI and/or the editor(s). MDPI and/or the editor(s) disclaim responsibility for any injury to people or property resulting from any ideas, methods, instructions or products referred to in the content. |
© 2025 by the authors. Licensee MDPI, Basel, Switzerland. This article is an open access article distributed under the terms and conditions of the Creative Commons Attribution (CC BY) license (https://creativecommons.org/licenses/by/4.0/).