Article

Estimation of Land Surface Evapotranspiration and Identification of Key Influencing Factors in the Zoige Forest–Grass Transition Zone

1
College of Geography and Planning, Chengdu University of Technology, Chengdu 610059, China
2
College of Ecological Environment, Chengdu University of Technology, Chengdu 610059, China
3
College of Earth and Planetary Sciences, Chengdu University of Technology, Chengdu 610059, China
4
Sichuan Tourism University, Chengdu 610199, China
*
Author to whom correspondence should be addressed.
Land 2025, 14(4), 805; https://doi.org/10.3390/land14040805
Submission received: 14 February 2025 / Revised: 24 March 2025 / Accepted: 2 April 2025 / Published: 9 April 2025

Abstract

:
Evapotranspiration (ET) is an important link between the water and energy cycles and directly determines the amount of available regional water resources. The Zoige forest–grass transition zone is a critical water conservation area in the upper reaches of the Yellow River, with high environmental heterogeneity, significant edge effects, and ecological and climatic gradient effects. The changing characteristics and influencing factors of evapotranspiration and its components in the region remain largely unknown. In this paper, the spatial and temporal evolution of evapotranspiration and its components in the Zoige forest–grass transition zone from 2003 to 2021 was investigated using the MOD16-STM ET algorithm, and the effects of environmental factors were analyzed. The results show that the MOD16-STM ET algorithm has good applicability in the Zoige forest–grass transition zone, and its coefficients of determination are 0.85 and 0.90 at the Zoige and Maqu stations, respectively. Vegetation transpiration accounts for 82% of the total evapotranspiration. ET is strongly influenced by the dynamics of the forest and grassland areas. The spatial distribution of evapotranspiration in the region varies considerably, with the forested areas in the east being larger than the grasslands and wetlands. Temperature and vegetation cover are the two most dominant contributors to ET changes among all the model drivers. Among the external environmental factors, altitude, maximum temperature, and minimum temperature are the dominant factors in the variation of ET in the region, and the interactions between the factors have a greater effect on ET than the individual factors. The findings provide a reference to investigate the spatial and temporal pattern of evapotranspiration and its components and the water cycle process in the Zoige forest–grass transition zone.

1. Introduction

Evapotranspiration (ET) serves as a crucial juncture in the water cycle, bridging surface water, energy, and carbon cycling processes while directly impacting the availability of regional water resources [1,2,3]. Approximately 60% to 70% of global terrestrial precipitation is recycled back into the atmosphere through ET [4,5]. ET comprises three primary components: vegetation transpiration, soil evaporation, and rainfall interception. These components are influenced by various environmental factors, including meteorology, topography, and soil properties, and exhibit significant spatial and temporal variability [6]. Studies have identified differing dominant factors for ET across different regions. Gong et al. revealed that relative humidity is the primary factor influencing ET in the Yangtze River Basin [7]. Liu et al. found water vapor pressure to be the dominant factor in the Haihe River Basin [8]. Zhang et al. found that global ET was mainly influenced by the vegetation leaf area index (LAI) [9]. Jovanovic et al. found that ET was spatially dependent on the water vapor pressure difference in their study of ET in South Africa [10]. Additionally, Sun et al. highlighted the substantial impact of land cover characteristics on ET [11]. Analyzing the spatial and temporal evolution of ET components and their correlations with environmental factors is of immense theoretical and practical significance, offering deeper insights into climate change and the water cycle [8,12].
Ground-based ET observational methods, such as eddy covariance, Bowen’s ratio, and evapotranspiration meters, are commonly employed to analyze ET components. However, these methods are constrained by factors such as site density, observation duration, and spatial representativeness, making it challenging to extrapolate their findings to larger scales [13]. With advancements in remote sensing technology, remote sensing techniques have increasingly been recommended for ET estimation due to their obvious advantages over traditional station-based measurements. These advantages include rapid, accurate, large-scale, continuous, and repeatable observations [14,15]. Currently, remote sensing ET models are classified into three categories [16]: data-driven models, energy balance models, and Penman–Monteith (PM) models. Data-driven models relate site-measured ET to meteorological and surface elements through mathematical algorithms and then perform spatial and temporal extrapolation of ET. However, they lack generalization ability and physical interpretability [17]. Energy balance models estimate ET by considering the latent heat consumed in ET as a residual term of the energy balance. They also estimate other energy balance terms, such as sensible heat and surface heat flux, through various empirical or physical parameterization schemes. However, these models are highly dependent on empirical parameters [18]. PM-type models, on the other hand, combine the principles of energy balance and water vapor transport to estimate ET. They integrate the radiative and aerodynamic terms affecting ET and are regarded as methods with a solid physical basis [1,19]. The MOD16 ET algorithm is an improved version of the PM model, which incorporates rainfall interception and nighttime ET calculations [20]. However, it globally underestimates the water balance closure of ET by 15% [10], and its performance varies across different climates and surfaces [21]. In contrast to the MOD16 ET algorithm, the MOD16-STM ET algorithm improves the calculation of soil surface aerodynamic resistance ( r a s ) and soil surface resistance ( r t o t ) based on the original algorithm while optimizing the surface conductivity ( G s ) of the vegetation cover [22]. These improvements significantly increase the accuracy compared to the original model, resulting in precise ET estimation and the ability to accurately estimate grass ET [22,23].
The Zoige forest–grass transition zone is a unique and highly sensitive Alpine grassland ecosystem located at high altitudes. It serves as an important water source and ecological function area in the upper reaches of the Yellow River, and its health is crucial for maintaining the water conservation and ecological balance of both the Yangtze and Yellow Rivers [24,25]. This transition zone is characterized by a complex interweaving of trees and herbaceous plants, leading to high ecological heterogeneity, significant edge effects, and a clear ecological and climatic gradient. These features make it particularly sensitive to climate change [26,27]. The formation of such ecological transition zones is influenced by various topographic, climatic, and hydrological conditions, which can fragment natural habitats [28]. These fragmentations can lead to changes in evapotranspiration (ET) and its components. In recent decades, the subsurface and climate of the Zoige forest–grass transition zone have undergone significant changes, profoundly altering the spatial and temporal distribution patterns of water resources by affecting ET processes [24,29]. The response of ET to climate and subsurface changes is a complex land–air interaction process. Different regions exhibit distinct characteristics of ET changes, and there are regional differences in the dominant factors affecting ET [30]. Therefore, an accurate estimation of ET and quantification of the effects of environmental factors on ET are essential for effective water resource management and ecological restoration in this region. Previous studies on ET and its drivers in the Zoige forest–grass transition zone have lacked sufficient understanding and quantitative analysis of ET changes and their dominant factors. Additionally, most studies have focused solely on the correlation between environmental factors and ET to explore the impact of climate change on ET, while neglecting the interactions between these environmental factors [31].
Here, the Zoige forest–grass transition zone is selected as the experimental area to investigate the spatial and temporal evolution patterns of ET and its components and the effects of key environmental factors on ET. It will accurately grasp the water cycle process in the area and make up for the insufficient understanding of ET changes and drivers in the area. The main objectives of this study include the following: (1) The MOD16-STM ET algorithm is used to estimate the ET and its components in the study area; (2) the spatial and temporal evolution of ET and its components is analyzed; (3) the contribution of model drivers, land cover change (LUCC), and external environmental factors to ET and the characteristics of ET on different land covers is quantified.

2. Materials and Methods

2.1. Overview of the Study Area

The Zoige forest–grass transition zone (32°56′~34°19′ N, 102°08′~103°39′ E) occupies a critical biogeographic position at the interface between the Sichuan Basin and the northeastern Qinghai-Tibetan Plateau (Figure 1a), with an altitude of 2400–4500 m (Figure 1b). Figure 1c–f show the slope, slope aspect (sunny, shady, semi-sunny, semi-shady slopes), and land use of the study area for the years 2003 and 2021, respectively. The eastern region has a continental mountainous mesothermal semi-humid monsoon climate, while the western region has a continental monsoon plateau climate. The average annual temperature is about 0.6–1.2 °C [32]. Distinct seasonal thermal regimes occur, featuring January minima (−9.6 ± 1.4 °C) and July maxima (10.3 ± 1.1 °C), yielding a substantial annual temperature range of 19.9 °C [33]. The annual sunshine duration is 2400 h [34], and there is no absolute frost-free period. The region experiences an annual precipitation range of 650 to 750 mm, with 86% of this precipitation occurring between late April and mid-October [35]. Additionally, the relative humidity within the region ranges from 65% to 70%. The annual average wind speed in the region is between 1.6 and 2.4 m/s, accompanied by an average of 23 to 33 days per year experiencing strong winds [33]. The cold and humid climate of the region results in abundant water resources; however, evaporation rates are low due to topographical constraints and inadequate drainage, which leads to a persistent state of over-wetting on the ground surface.

2.2. Data Source

The MOD16-STM ET algorithm relies on a combination of meteorological and surface elements as its driving factors, which are crucial for accurately estimating ET and its components (Table 1). Meteorological data were derived from National Oceanic and Atmospheric Administration (NOAA) weather station data, including dew point temperature, air temperature, and atmospheric pressure. In this study, 43 national standard meteorological stations near Zoige were selected, and the daily meteorological data observations were interpolated into raster data with a resolution of 1 km by the Kriging interpolation method [36]. Net radiation is an important input element, but it is not possible to obtain high-precision net radiation raster data directly [37]; in this paper, net radiation was obtained by calculating net shortwave radiation and albedo. Surface data, including soil moisture, leaf area index (LAI), vegetation fraction (Fc), and normalized vegetation index (NDVI), are also essential for the MOD16-STM ET algorithm. These data provide information on the surface conditions that influence ET, such as soil moisture availability, vegetation cover, and leaf area. Land use data were obtained from Yang et al.’s 30 m resolution land use dataset for China [38], which divides the study area into nine land types. This dataset has been used in a large number of studies, e.g., Jiang et al. used it to quantify the impacts of climate and land use change on ecosystem services [39], and Chen et al. used it to study the characteristics of evapotranspiration over different land use types in the Haihe River Basin [40]. This dataset is available in the public domain at https://doi.org/10.5281/zenodo.4417810 (accessed on 4 November 2024) (Yang and Huang, 2021) [38]. However, given that forests, grasslands, and wetlands account for the majority of the study area (more than 98%), the study area is simplified into four categories: forests, grasslands, wetlands, and other land-use types (farmland, shrubs, water bodies, snow and ice, bare ground, impervious surfaces). This simplification allows for a more focused analysis of ET dynamics on these dominant land cover types. Additionally, the annual mean raster data for maximum temperature, minimum temperature, precipitation, and wind speed in the Zoige forest–grass transition zone are obtained from a reliable source, the National Tibetan Plateau Data Centre. In this study, raster data with different spatial resolutions were bilinearly interpolated to keep them at the same spatial resolution (1 km).
In this study, the MOD16-STM ET algorithm was evaluated for its simulation of ET values at two flux stations: Zoige Station (located at 102°39′ E, 33°06′ N) and Maqu Station (located at 102°08′ E, 33°51′ N). Zoige Station exhibits a plateau cold-temperate monsoon climate, characterized by an average annual temperature of 1.4 °C and an average annual precipitation of 749.1 mm. Maqu Station possesses a plateau continental monsoon climate, with an average annual temperature of 2.9 °C and an average annual precipitation of 611.9 mm. The accuracy of the model was assessed by comparing the measured ET values, obtained from vortex correlation instruments at the stations, with the simulated values.

2.3. Research Methods

2.3.1. Model Accuracy Evaluation System

Measured ET from two flux stations, Zoige and Maqu stations, was used to assess the accuracy of the MOD16-STM ET algorithm for use in the Zoige forest and grass transition zone. Among the assessment parameters used are the percentage relative bias (Bias), coefficient of determination (R2), and Kling–Gupta coefficient (KGE) [41], where KGE is used as a composite metric to measure the effectiveness of the fit of the measured values to the simulated values, the optimal value of Bias is 0, and the optimal value of R2 and KGE is 1.
  • The Bias formula is as follows:
Bias = s m r m r m × 100 %
where sm is the measured data and rm is the predicted data.
  • The R2 formula is as follows:
R =   i = 1 n w i y i ^ y i ¯ 2   i = 1 n w i ( y i y i ¯ ) 2
where y i is the measured data and y i ^ is the predicted data.
  • The KGE formula is as follows:
KGE = 1 c c 1 2 + c d r d 1 2 + c m r m 1 2
where c c is the Pearson correlation coefficient, r m is the average of the measured data, c m is the average of the predicted data, r d is the standard deviation of the measured data and cd is the standard deviation of the predicted data.

2.3.2. MOD16-STM ET Algorithm

ET consists of three components: vegetation transpiration (ETc) soil evaporation (ETs) and rainfall interception (ETi). Yuan et al. [22] improved on the original MOD16 ET algorithm to obtain the MOD16-STM ET algorithm with higher ET simulation accuracy. In the MOD16-STM ET algorithm, ET is calculated by calculating ETc, ETs, and ETi. ET is calculated as follows:
E T = E T c + E T s + E T i
The MOD16-STM ET algorithm optimizes the algorithm for r a s based on the MOD16 ET algorithm by combining the Monin–Obukhov Similarity Theory (MOST) [42] with the bare soil roughness scheme, and the r a s calculation formula is as follows:
r a s = l n z h z 0 h ψ h l n z m z 0 m ψ m k 2 u
where k is the von Karman’s constant; u is the wind speed,   z h and z m   are the measurement heights (m) of the air temperature and u , respectively; z 0 m   and z 0 h   are the momentum transfer roughness length and heat transfer roughness length, respectively; and ψ h and ψ m are the stability correction functions for momentum and heat transfer, respectively [43].
The MOD16-STM ET algorithm re-establishes the regression equation defining r t o t in different soil textures on the basis of evaporation from bare soil. r t o t is calculated as follows:
r t o t = R H 100 V P D β × s × A s o i l + ρ × C p × V P D r a s × 1 F w e t λ E T s s × r a s γ r a s
where λ is the latent heat of evaporation;   s = d ( e s a t ) / d T , the slope of the curve relating saturated water vapor pressure ( e s a t ) to temperature;   ρ is air density; C p is the specific heat capacity of air; the psychrometric constant γ is given by γ = C p × P a × M a / ( λ × M w ) , where M a and M w   are the molecular masses of dry air and wet air and   P a is atmospheric pressure; A s o i l is the soil available energy; F C is the vegetation cover fraction; F w e t is the relative humidity; V P D is the difference between e s a t and e ; and β is a constant.

2.3.3. Assessing Model Drivers and LUCC Contributions

Trend changes in ET are assumed to be influenced only by model drivers (temperature, net radiation, NDVI, relative humidity, soil moisture) and land use and land cover change (LUCC) [44]:
Δ E T u n i t = Δ E T d r i v e r u n i t + Δ E T L U C C u n i t
where Δ E T u n i t is the change in ET per unit area, Δ E T d r i v e r u n i t is the change in ET per unit area due to the driving factor, and Δ E T L U C C u n i t is the change in ET per unit area due to LUCC.
If neither the driving factor nor the LUCC changes over time, the ET of an area remains constant over that period. If the climatic characteristics of an area are essentially the same, the impact of the drivers on the area will be the same regardless of the type of land use and land cover. First, assuming that the land cover type of an area remains constant, then all changes in ET in that area are caused by the driving factor with the following equation [45]:
d E T d r i v e r d t = E T d r i v e r T A d T A d t + E T d r i v e r R n d R n d t + E T d r i v e r N D V I d N D V I d t + E T d r i v e r R H d R H d t + E T d r i v e r S M d S M d t + ε
where ε denotes the systematic error; and T A , R n , N D V I , R H , and S M denote temperature, net radiation, NDVI, relative humidity, and soil moisture, respectively. The five terms on the right-hand side of the equation represent the contribution of each of the five drivers to the long-term ET trend, and by comparing the absolute value of each factor’s contribution, the main factors affecting ET can be identified.
Second, assuming a change in land cover type, the change in ET can be attributed to the combined effects of the drivers and LUCC. The impact of LUCC on ET in the region is quantified by removing the effect of changes in the model drivers on ET in the region.

2.3.4. Geographical Detectors Analysis of External Environmental Factors

The core idea of geographical detectors as a new statistical method [46] is that, if an independent variable has a significant effect on the dependent variable, the spatial distributions of the independent variable and the dependent variable should be similar [47]. In this study, we used factor detection, interaction detection, and ecological detection to analyze the spatial differentiation characteristics of ET in the Zoige forest–grass transition zone.
(1) Factor detection: used to detect the spatial heterogeneity of ET (Y) in the study area and the magnitude of the explanatory power of the detection factor (X) on the spatial heterogeneity of ET (Y), measured by the q-value:
q = 1 h = 1 L   N h δ h 2 N δ 2
where q denotes that the independent variable X explains 100 × q% of Y;   h = 1 ,   2 , ;   L is the stratification of variable Y or factor X;   N h and N are the number of cells in layer   h   and the whole region, respectively; and   δ h 2 and δ 2 are the variance of layer h and region-wide Y values, respectively.
(2) Interaction detection: used to identify the extent to which ET in the study area is affected when different physical geographical factors interact. The q-values of any two factors (A,B) are classified into 5 categories based on their relationship to the magnitude of the interaction q-value (C) of the two factors: nonlinear attenuation [C < min(A,B)], one-factor nonlinear attenuation [min(A,B) < C < max(A,B)], two-factor enhancement [C > min(A,B)], and independent (C = A + B) and nonlinear enhancement (C > A + B).
(3) Ecological detection: used to compare whether there is a significant difference between the effects of any two physical geographic factors on the spatial distribution of ET in the study area, as measured by the F-statistic:
F = N X 1 N X 2 1 S S S W , X 1 N X 2 N X 1 1 S S S W , X 2
S S S W , X 1 = h = 1 L 1   N h δ h 2 ,   S S S W , X 2 = h = 1 L 2   N h δ h 2
where N X 1 and N X 2 are the sample sizes of the two factors X 1 and X 2 , respectively;   S S S W , X 1   and S S S W , X 2   denote the sum of the intra-layer variances of the strata formed by   X 1 and X 2 , respectively; and L 1 and L 2 denote the number of strata for variables X 1 and X 2 , respectively. Where the null hypothesis H0 : S s s w , X 1 = S s s w , X 2 , if H0 is rejected at the significance level of a, this indicates that there is a significant difference between the effects of the two factors X 1 and X 2 on the spatial distribution of attribute   Y .
In this study, six environmental factors in two categories, namely, topographic factors (elevation (DEM), slope aspect (AS)) and climatic factors (maximum temperature (TA_MAX), minimum temperature (TA_MIN), wind speed (WD), and precipitation (PRE)) were selected to detect their effects on the variation of ET and its components.

3. Results

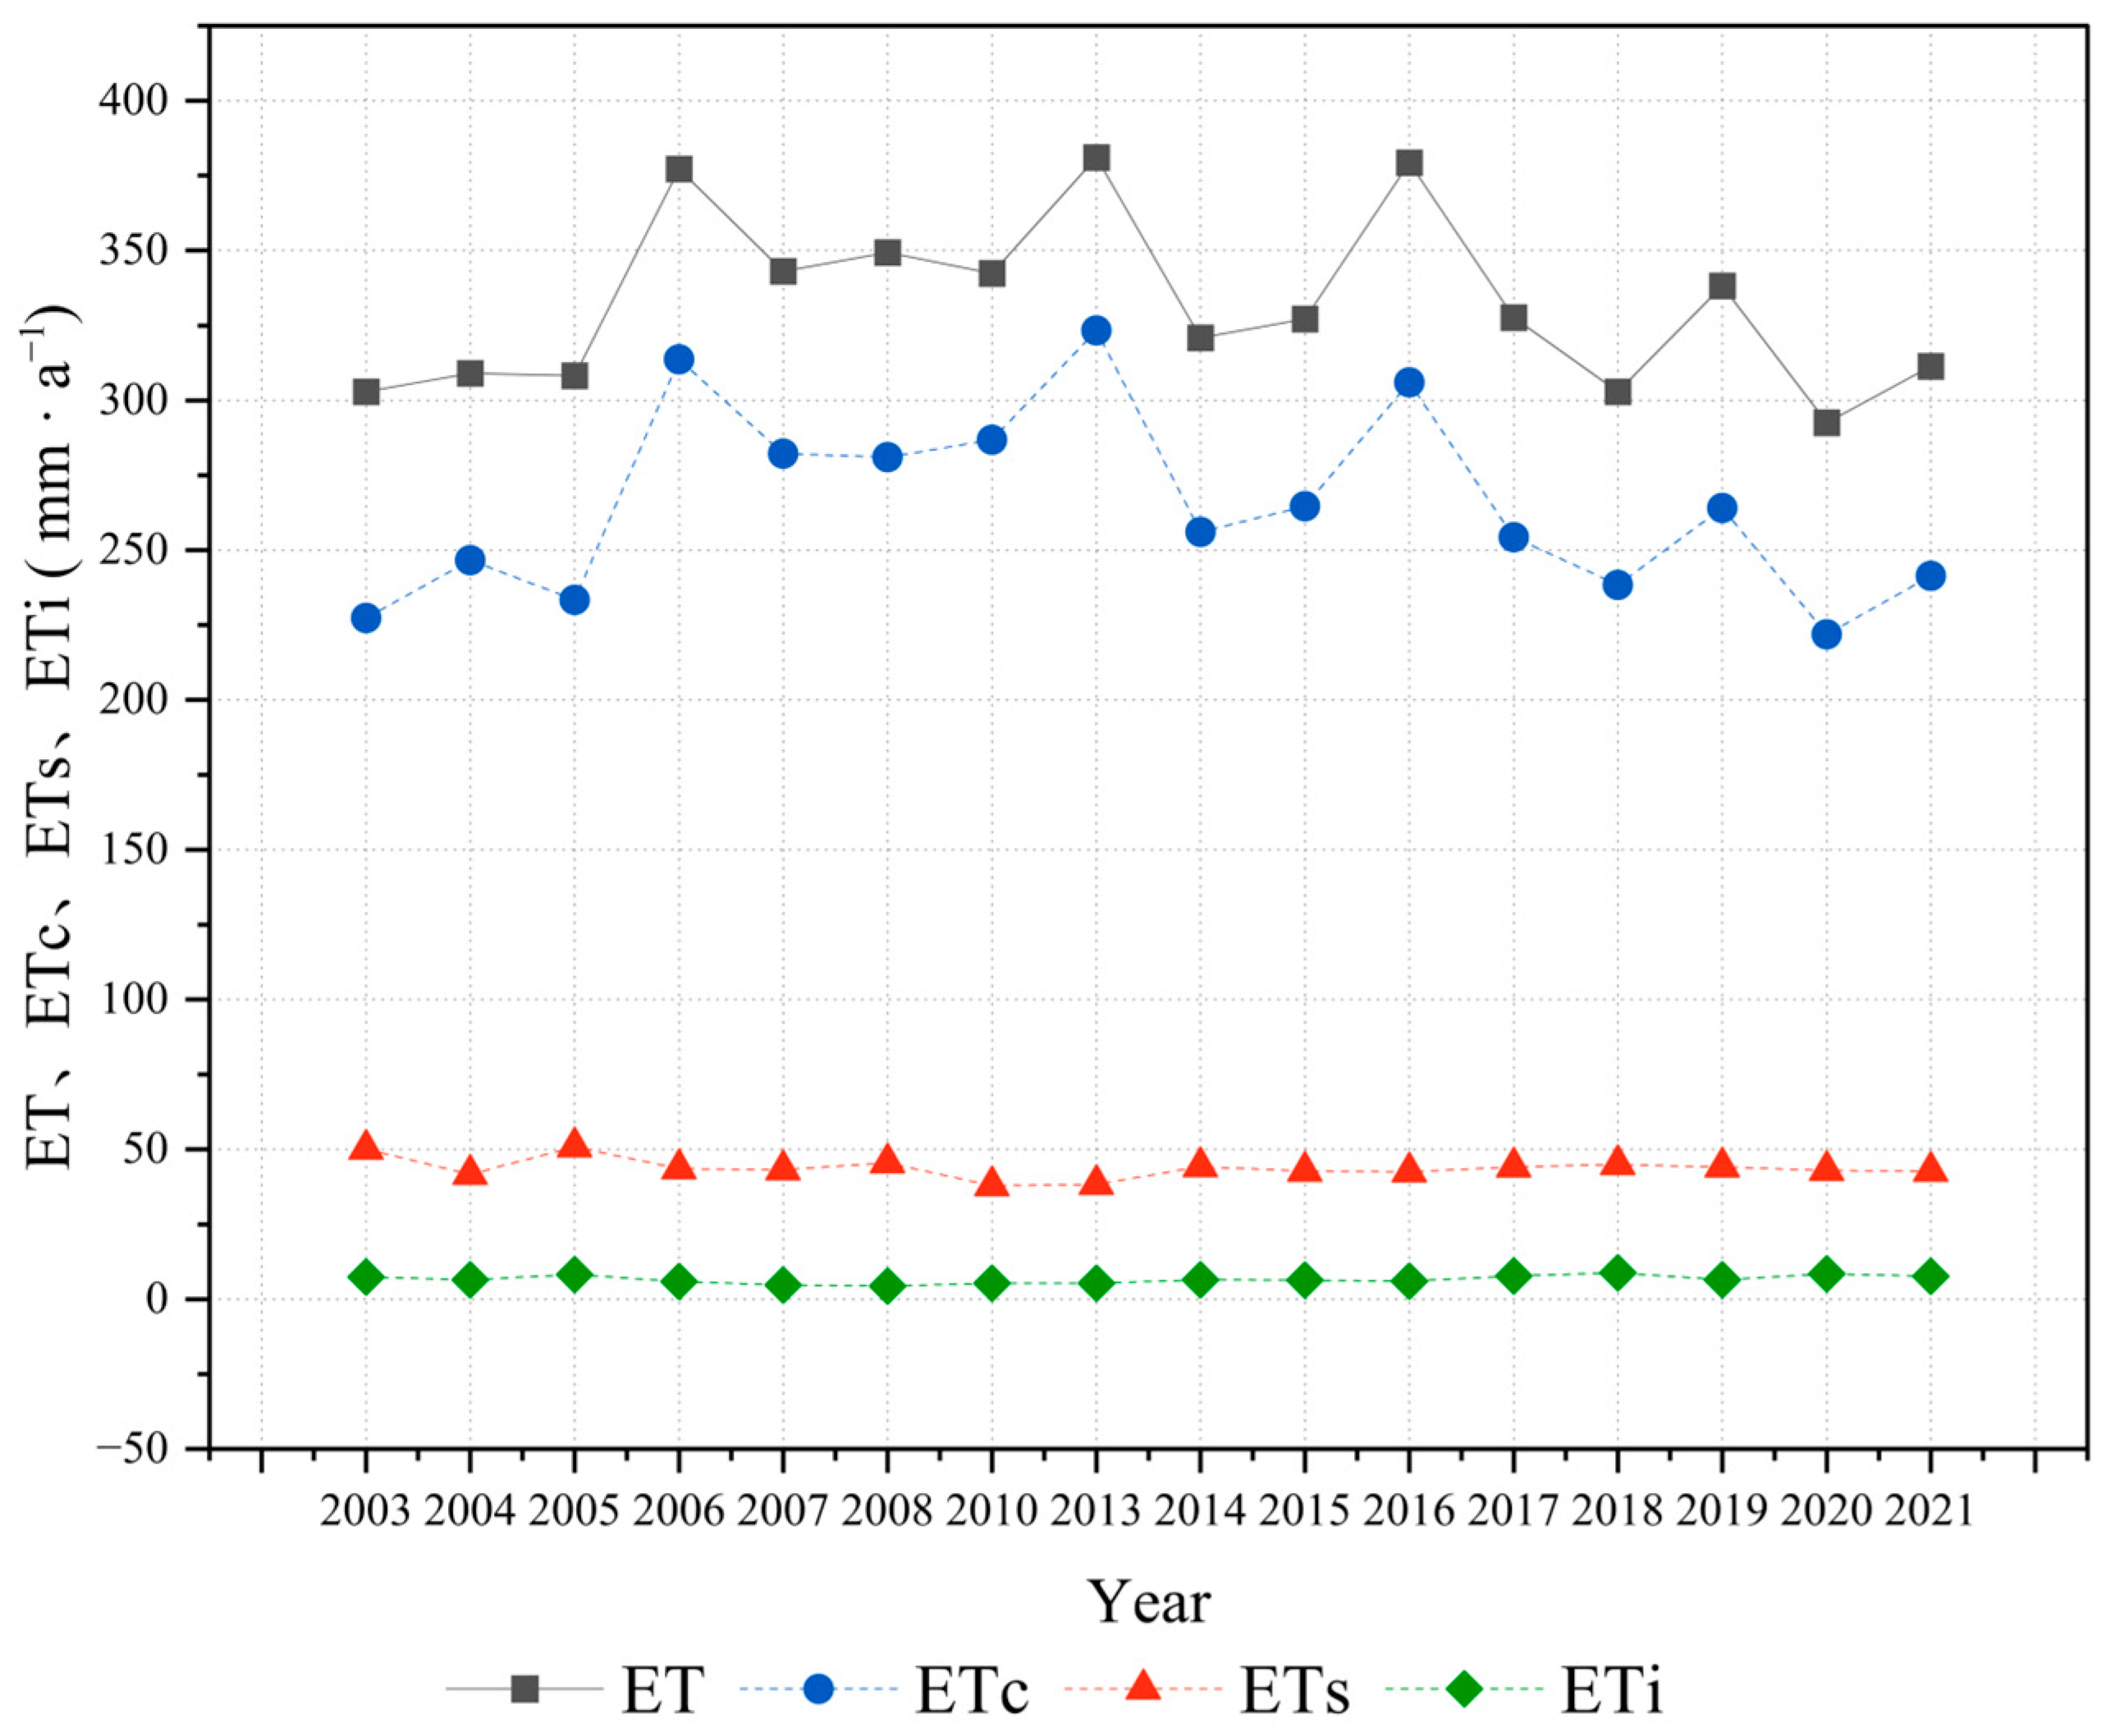
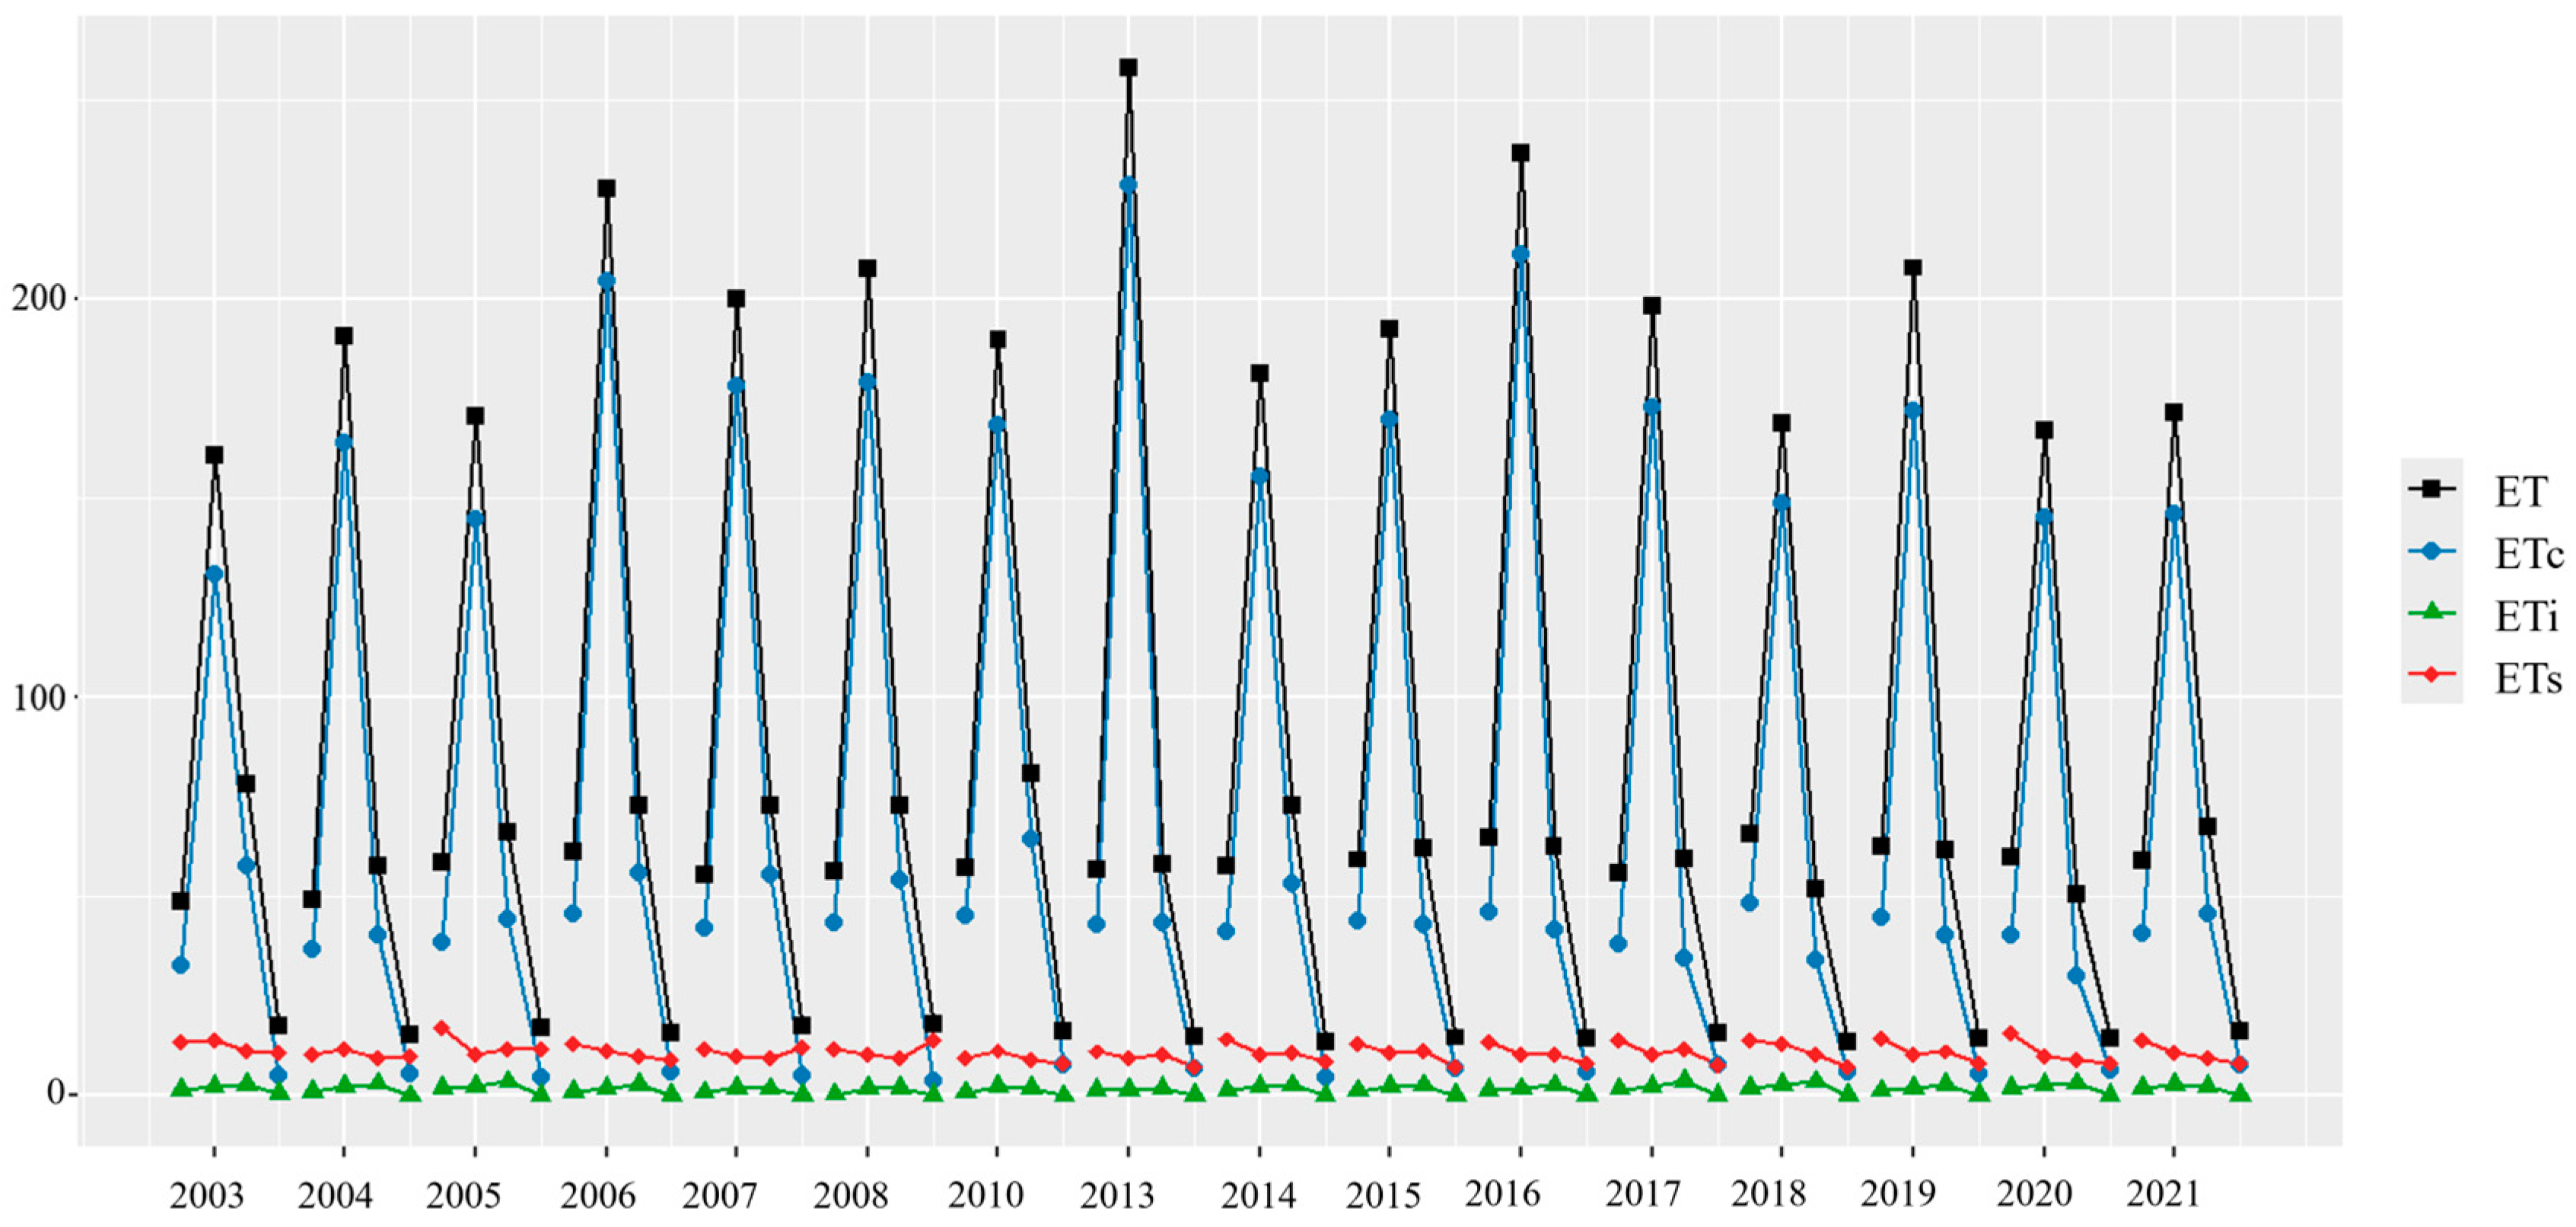
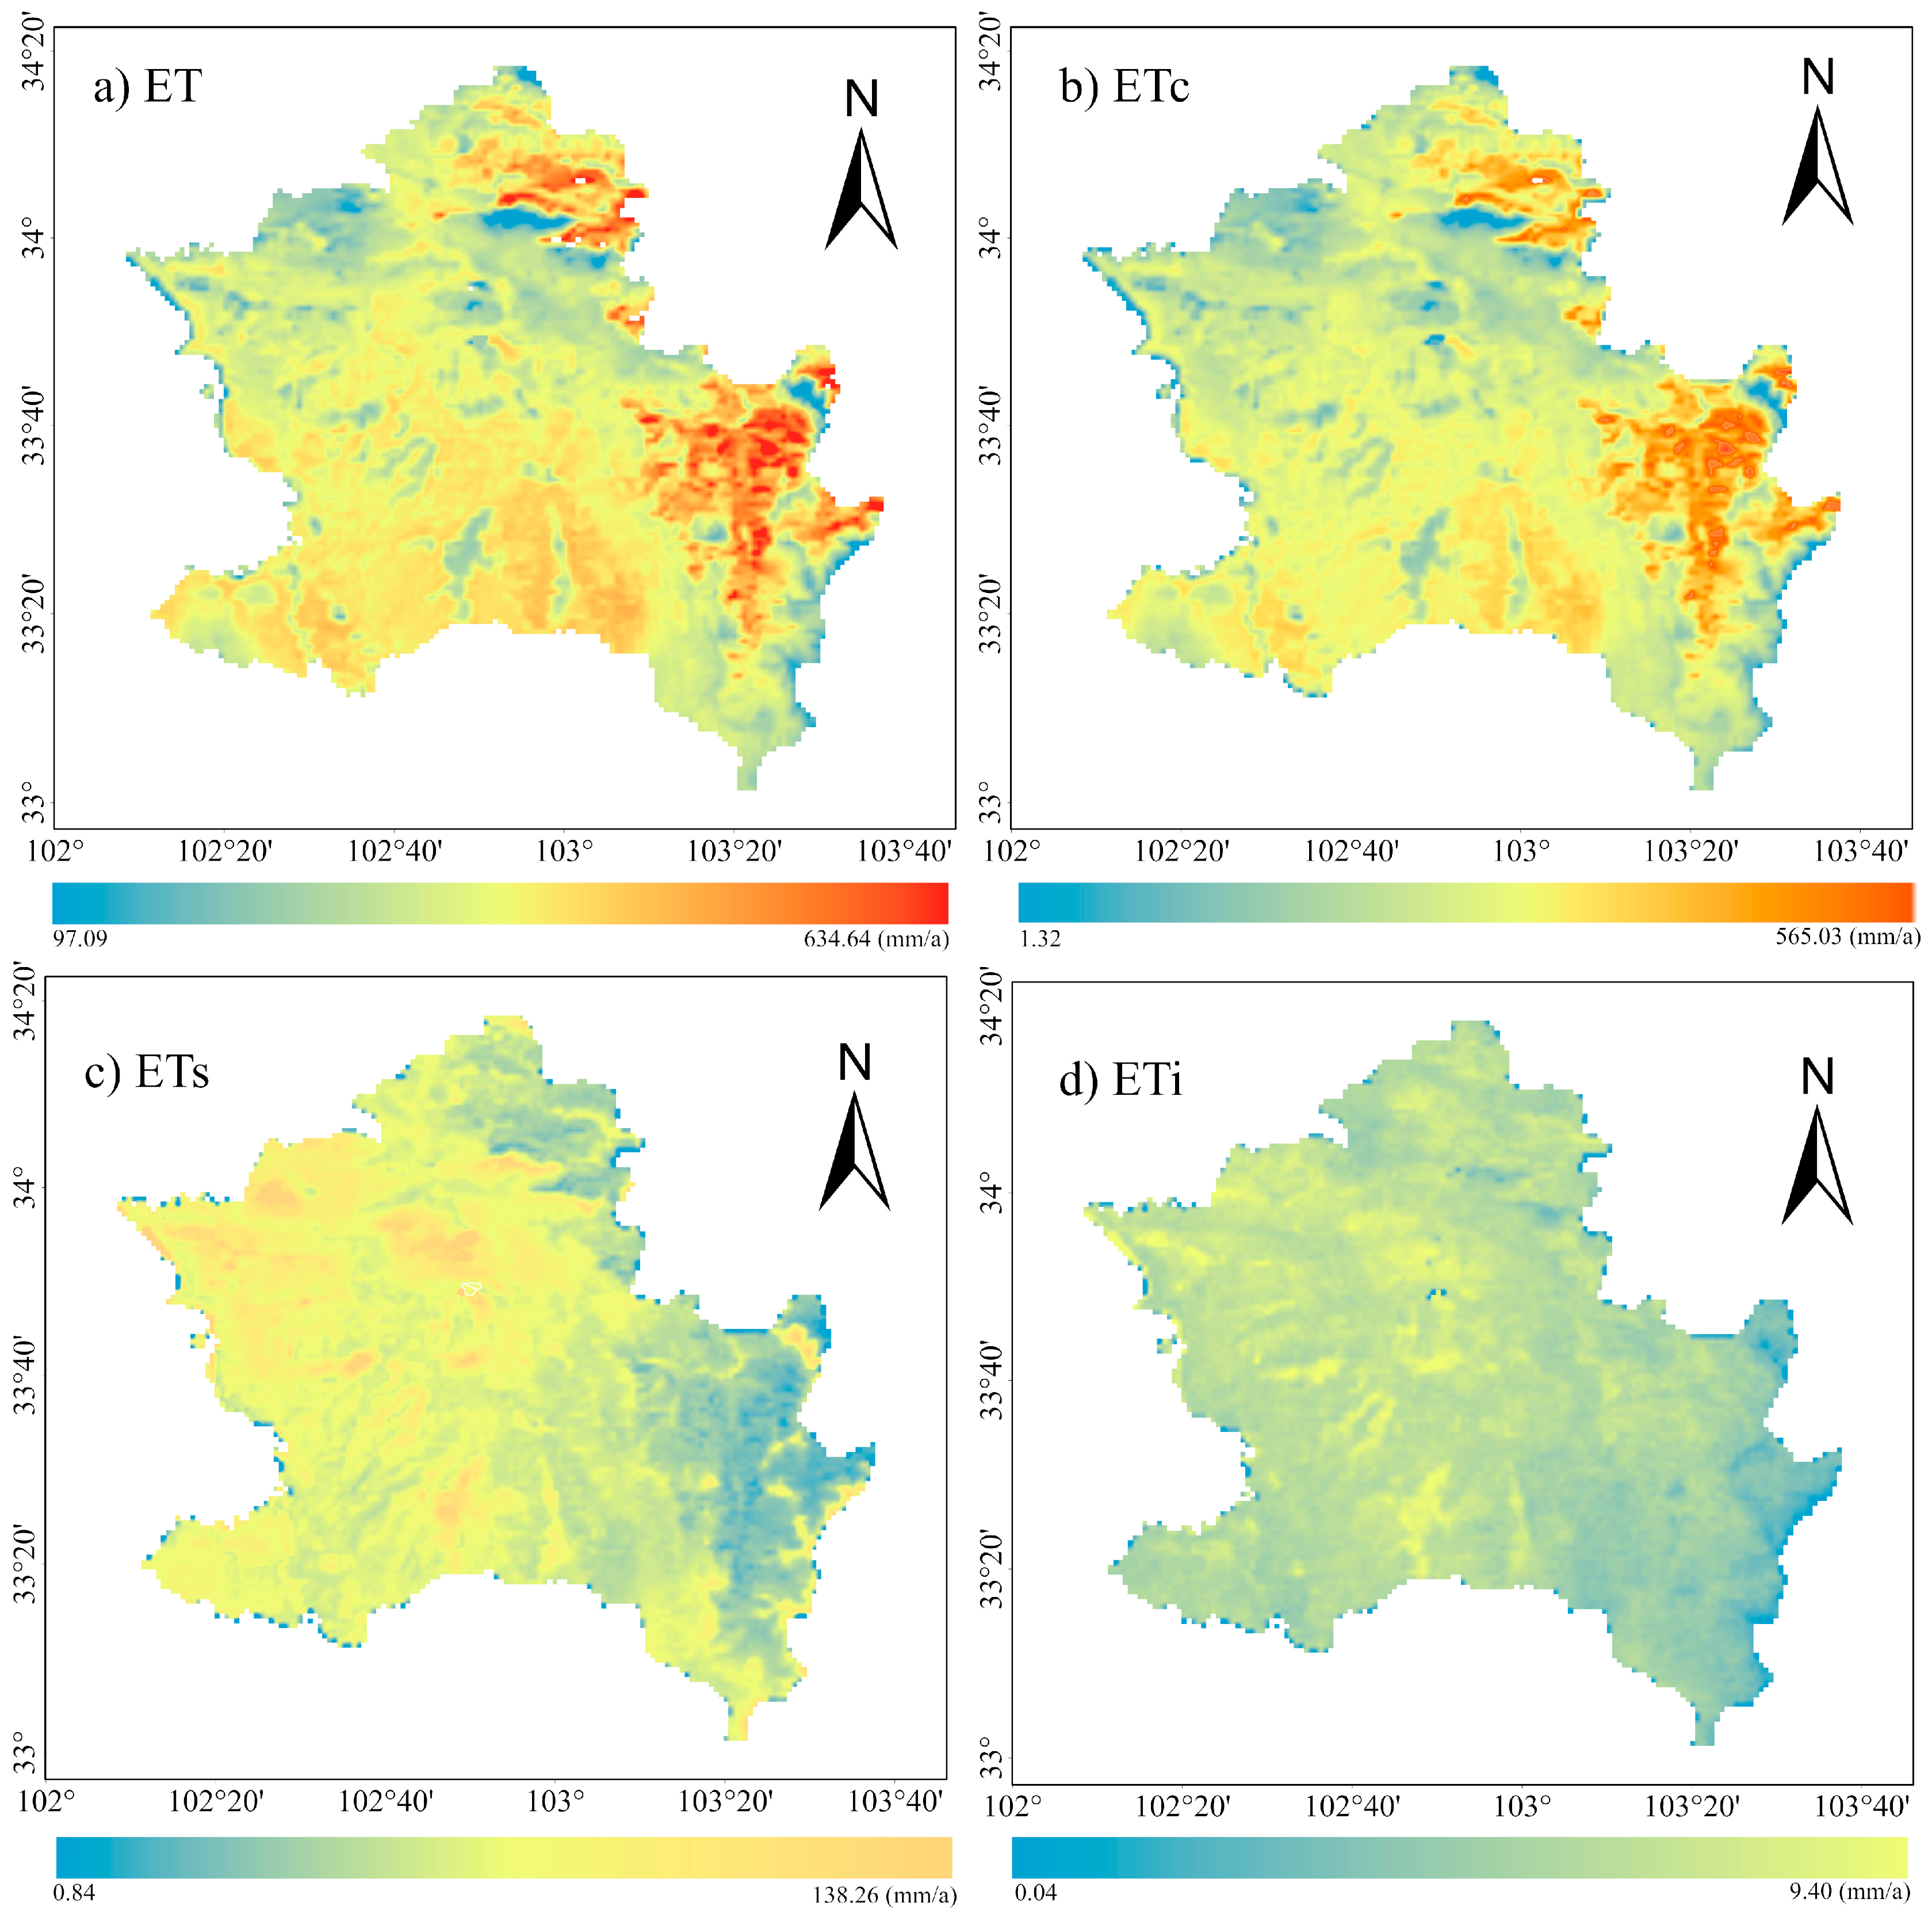
3.1. Assessment of ET Accuracy and Its Pattern of Temporal and Spatial Change

Figure 2 present comparative evaluations of ET simulations between the original MOD16 algorithm and the enhanced MOD16-STM algorithm against ground-based flux tower measurements at two monitoring stations. Quantitative validation demonstrates the MOD16-STM algorithm’s superior performance, with R² values increasing from 0.79 to 0.85 at Zoige station and 0.83 to 0.90 at Maqu station. The KGE improved by 0.03 (0.66 vs. 0.63) and 0.01 (0.75 vs. 0.74), respectively, while absolute bias decreased by 14% (70% vs. 84%) and 16% (69% vs. 85%) compared to the MOD16 algorithm. These significant improvements confirm the ability of the improved algorithm to better estimate ET in the Zoige forest–grass transition zone.
The MOD16-STM ET algorithm has been employed in this study to estimate ET and its components in the Zoige forest–grass transition zone over a period spanning from 2003 to 2021 (Figure 3). The multi-year average ET for the region is estimated to be 332 mm·a−1, ranging from 292 mm·a−1 to 381 mm·a−1. This study reveals that the largest component of ET in the region is ETc, which averages up to 82% of the total ET. ETs follows as the second largest component, contributing about 15% annually, while ETi accounts for only a minor fraction, constituting roughly 3% annually. Furthermore, this study notes that ET in the region remains relatively stable throughout the observed period, with the exception of localized peaks occurring in 2006, 2013, and 2016. Both ETi and ETs exhibit stability over multiple years, with ETi ranging from 9 mm·a−1 to 13 mm·a−1 and ETs ranging from 42 mm·a−1 to 55 mm·a−1. Figure 4 illustrates the seasonal distribution of ET and its components over the study period from 2003 to 2021. The results indicate a strong seasonal partitioning of ET, with the majority (59%) occurring during the summer months. In contrast, spring and autumn show relatively constrained inter-seasonal variability in ET partitioning, contributing 17% and 19%, respectively, to the annual totals. Winter contributes negligibly to the annual ET totals, accounting for only 5%. ETc maintains a similar seasonal pattern to the ET, suggesting a close relationship between the two. In contrast, ETs and ETi exhibit reduced seasonal variability compared to ETc and ET. Figure 5 delineates the 2003–2021 spatiotemporal patterns of ET and its components across the Zoige forest–grass transition zone. Among them, total ET and ETc exhibit strong spatial coherence, with large spatial differences, and ET from the eastern forest cover is greater than that from the grasslands and wetlands. ETs and ETi display lower spatial heterogeneity. ET was between 250 mm·a−1 and 450 mm·a−1, ETc was between 200 mm·a−1 and 400 mm·a−1, ETs was between 30 mm·a−1 and 70 mm·a−1, and ETi was only between 4 mm·a−1 and 8 mm·a−1.

3.2. Effects of Environmental Factors on ET

In this study, the environmental factors affecting ET are classified into three main categories: model input elements (temperature, NDVI, net radiation, relative humidity, soil moisture), land use and LUCC, and external environmental factors (elevation, maximal temperature, minimal temperature, wind speed, precipitation, and slope aspect). Separately, we explored the extent of their influence on ET.

3.2.1. Impact of Model Drivers on ET Trends

Figure 6a–e present a spatial analysis of the contributions of five key model drivers to ET across the study area between 2003 and 2021. Temperature is found to have a positive contribution to ET in over 90% of the study area, with a particularly strong impact observed in the northeast. NDVI exhibits a positive contribution to ET in over 98% of the study area. The contribution of NDVI to ET shows little spatial variation. The overall contribution of net radiation is small and is greater in the east than in the west. Relative humidity and soil moisture contribute relatively little to the area, with relative humidity showing a positive contribution in areas greater than 85%.
Overall, the average contributions of temperature, NDVI, net radiation, relative humidity, and soil moisture are 0.9 mm·a−1, 1.2 mm·a−1, 0.2 mm·a−1, 0.4 mm·a−1, and −0.3 mm·a−1. A comparison of the contributions of the individual drivers shows (Figure 6f) that the dominant factor in 91% of the areas is NDVI. Temperature and relative humidity are the dominant factors in 3% and 5% of the area, respectively, with the temperature-dominated area mainly in the east and the relative humidity-dominated area mainly in the west.

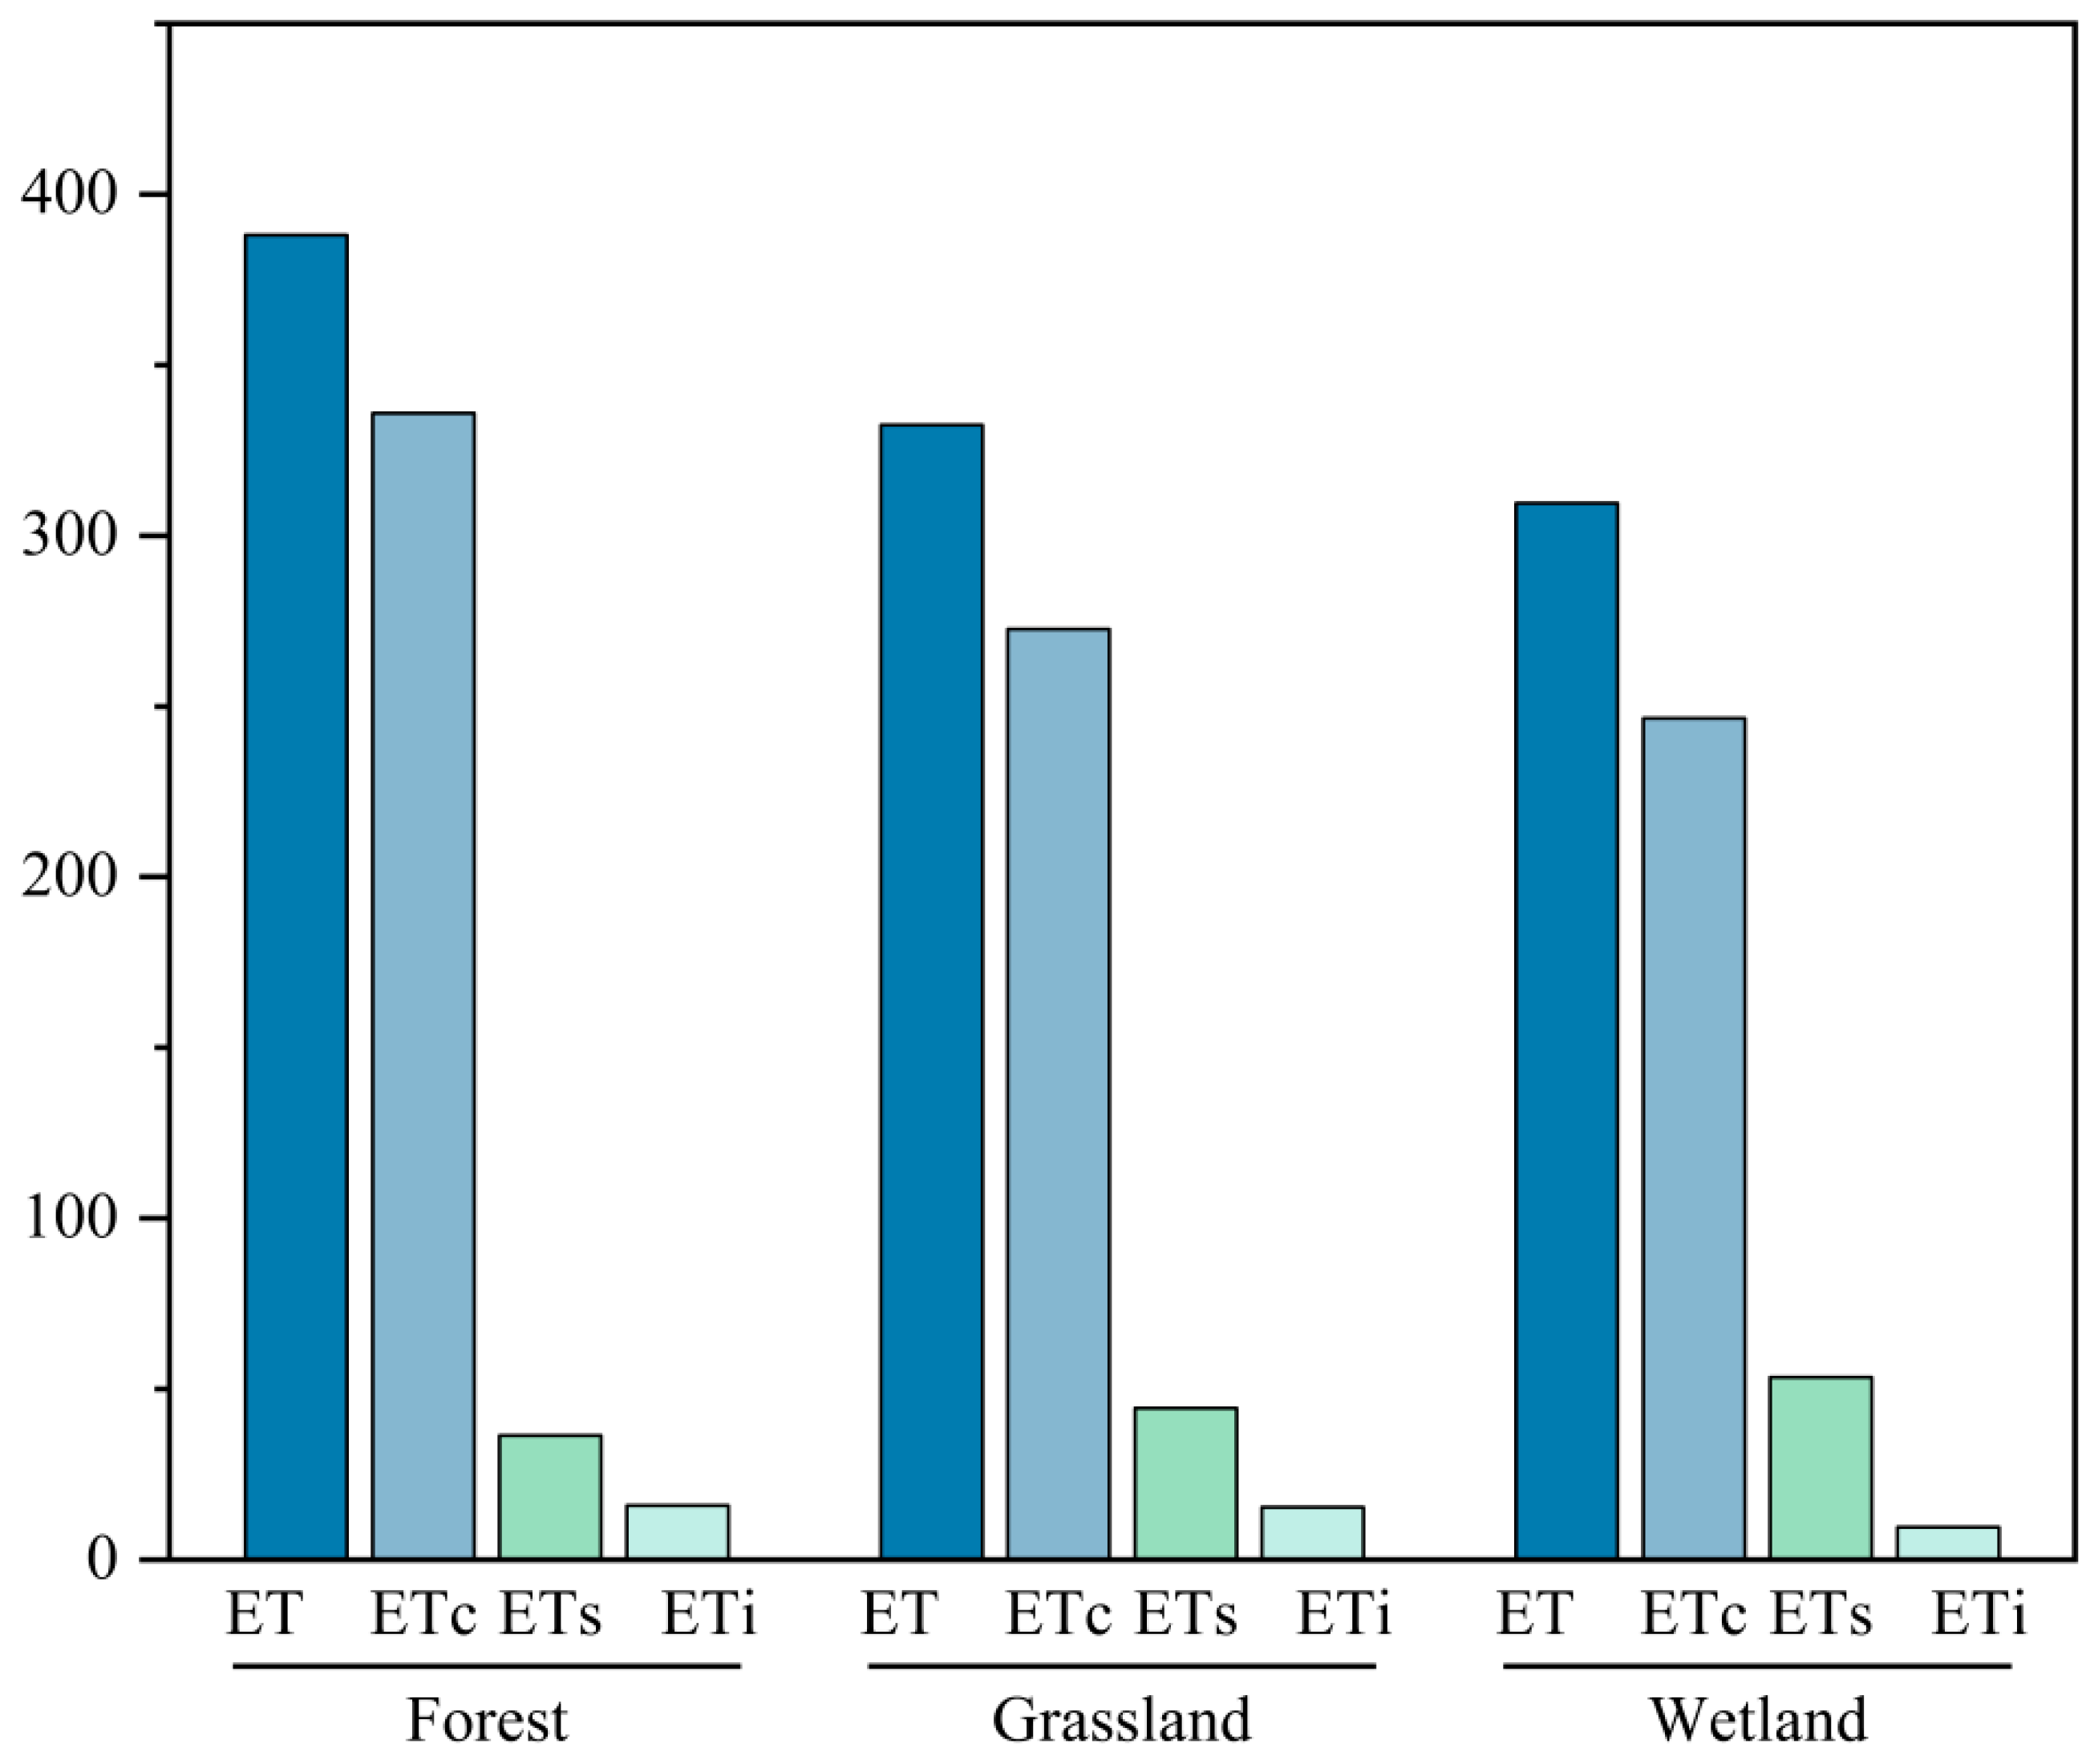
3.2.2. LUCC Impacts on ET

The Zoige forest–grass transitional zone consists mainly of grasslands, forests, and wetlands, which account for 76.97%, 17.08%, and 4.09% of the total area, respectively. This study counted ET and its components in forests, grasslands, and wetlands within the region (Figure 7). The results show that the mean annual ET in the Zoige forest–grass transition zone differs between forest, grassland, and wetland, with forest (388.08 mm·a−1) > grassland (332.44 mm·a−1) > wetland (309.49 mm·a−1) in descending order of mean annual ET. ETc is similar to ET and also shows forest (335.81 mm·a−1) > grassland (272.63 mm·a−1) > wetland (246.49 mm·a−1), while ETs shows forest (36.38 mm·a−1) < grassland (44.43 mm·a−1) < wetland (53.50 mm·a−1). ETi varies less on forests, grasslands, and wetlands. Although there are some differences in ET and their components among the three ecosystems, ETc is the major component of ET, exceeding 80% of the total ET, while neither ETs nor ETi exceeds 20% of the total.
The results presented in Table 2 demonstrate the significant impact of land use change on evapotranspiration (ET). Conversions between different land types, such as forests, grasslands, wetlands, and other land types, result in changes in ET that can be both positive and negative. The conversion of forests to grasslands and wetlands has led to a decrease in ET, as has the conversion of forests, wetlands, and grasslands to other land types. Conversion of other land types to forests, grasslands, and wetlands results in an increase in ET, while conversion of grasslands and wetlands to forests also results in an increase in ET. Forest to grassland and wetland conversion reduces ET by 1.8 mm·a−1 and 2.6 mm·a−1, respectively, and grassland and wetland to forest conversion results in an increase in ET of 0.8 mm·a−1 and 3.3 mm·a−1, respectively. Conversion of grassland to wetland and wetland to grassland reduces ET by 1.4 mm·a−1 and increases it by 2.2 mm·a−1, respectively. Forest–wetland conversion has a greater impact on ET than forest–grassland and grassland–wetland conversions. Overall, the conversion of forests to other land use types contributes the most to ET change.

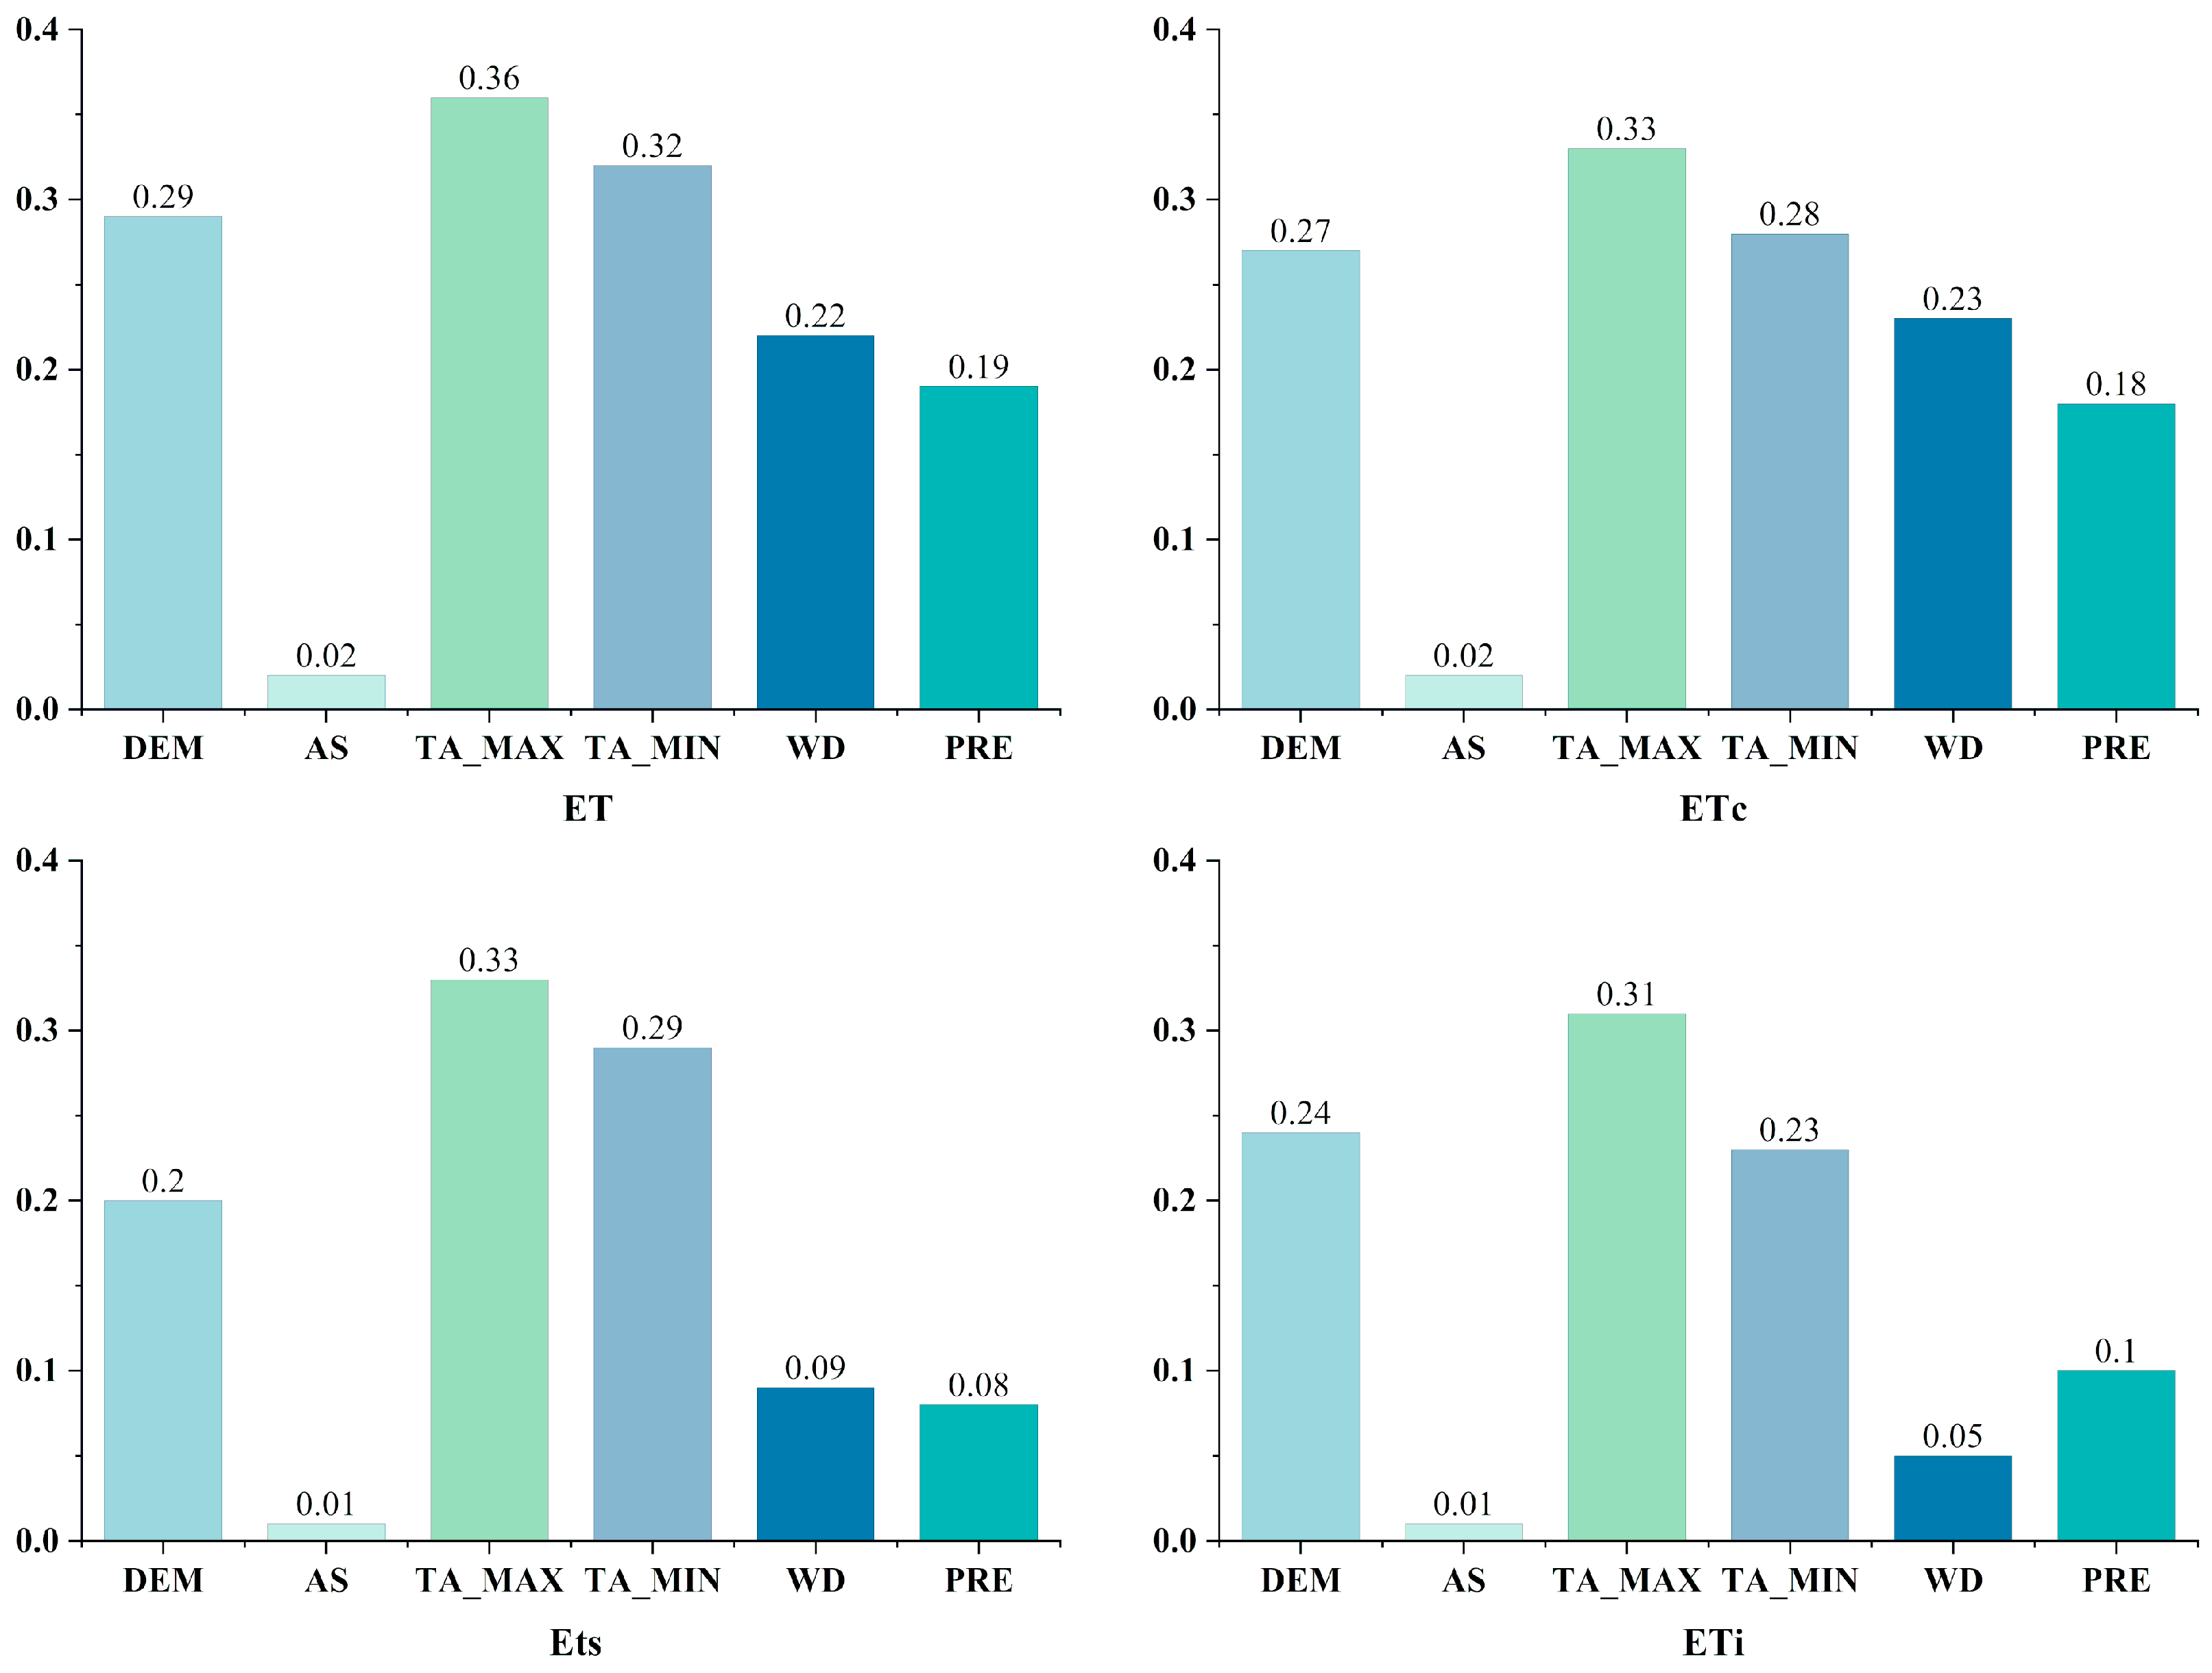
3.2.3. Impact of External Environmental Factors on ET

The magnitude of explanatory power for ET in the study area among the external environmental factors is maximum temperature > minimum temperature > altitude > wind speed > precipitation > slope aspect (Figure 8). The explanatory power of all factors except slope aspect is greater for ET, with elevation, maximum temperature, and minimum temperature being the dominant factors for ET. Similar to ET, the explanatory power of external environmental factors on vegetation transpiration is also shown as maximum temperature > minimum temperature > altitude > wind speed > precipitation > slope aspect, with altitude, maximum temperature, and minimum temperature being equally dominant factors. Elevation, maximum temperature, and minimum temperature are also dominant factors in soil evaporation and rainfall interception, and wind speed and precipitation have less explanatory power than ET and vegetation transpiration.
The interactions between all factors except slope aspect show a two-factor enhancement, while the interactions between slope aspect and other environmental factors show a nonlinear enhancement (Table 3). The superposition of any two factors leads to a stimulated effect on ET. The strongest interaction is between the combination of elevation and maximum temperature, and the interactions between maximum temperature and the remaining factors are all stronger. There are significant differences in the effects of all factors on ET changes (Table 4).

4. Discussion

4.1. Interpretation of the ET Distribution

ET is intimately associated with vegetation growth. In 2006, the NDVI attained a local maximum in the Zoige forest–grass transition zone and has continued to rise since 2013 [48]. The increase in vegetation cover has led to an increase in ETc, resulting in a significant increase in ET. Stronger El Niño phenomena were observed globally in 2006 and in 2016 [49]. Characterized by anomalous warming, El Niño events exhibit a correlation with the global climate [50], contributing to heightened global temperatures and enhanced ET. ET primarily occurs during the summer months, when precipitation is abundant and temperatures are elevated. Generally, the vegetation cover in the Zoige forest–grass transition zone exhibited a superior condition, spatially demonstrating a pattern of higher cover in the east and lower in the west [51]. Consequently, this spatial distribution induced greater ET in the eastern region compared to the western region.
ET from forests exceeds that from grasslands in the Zoige forest–grass transition zone. Forests are predominantly situated in the lower-elevation areas of the eastern Sichuan Basin, characterized by abundant precipitation and extensive vegetation cover. Conversely, grasslands are primarily located in the Tibetan Plateau region, featuring relatively higher elevations and a comparably smaller vegetation cover compared to forests. The primary constituent of ET in both forest and grassland ecosystems is evapotranspiration from ETc. The Zoige forest–grass transition zone distributes large areas of alpine grassland ecosystems with high vegetation cover, and evapotranspiration is much higher than that from bare soil [51]. These findings align with previous research. For example, Bai et al. found in their study of land evapotranspiration in China that vegetation transpiration was the primary component of ET, accounting for 54.9% of ET, followed by soil evapotranspiration and interception evapotranspiration [5]. Similarly, Mei et al. estimated evapotranspiration and its components in alpine grassland ecosystems and demonstrated that vegetation transpiration is a significant component of ET [52]. Furthermore, Lu et al. studied evapotranspiration in a typical forest ecosystem in eastern China and observed that the pattern of change in vegetation transpiration was largely consistent with that of ET [6].

4.2. Interpretation of the ET Impact Factor

The most influential of the model drivers on ET trends are temperature and NDVI, while LUCC also has a large influence on ET changes. These findings align with previous research, such as Guo et al.’s study in Zoige alpine meadows, which attributed ET trends to a combination of temperature and surface factors [53]. Changes in land cover type, particularly forests and grasslands, have a substantial influence on ET [44,54]. Li et al. found that, among changes in land cover types, changes in forests had a greater impact on ET [44]. Bronstert et al. identified deforestation and afforestation as the most influential LUCC category affecting ET on a global scale [55]. Increased vegetation cover results in more solar radiation and rainfall being captured by the vegetation canopy, leading to increased vegetation transpiration and rainfall interception and reduced soil evaporation, but the reduction in soil evaporation is much smaller than the increase in vegetation transpiration and rainfall interception [56]. Therefore, vegetation changes are closely correlated with ET. Meanwhile, changes in ET due to vegetation changes are considered to be an important cause of changes in river water quantity in some parts of China [5]. Regarding air temperature, studies consistently show that its increase is a primary factor driving up ET rates due to its stimulatory effect on water molecular movement [51]. Changes in relative humidity are closely tied to shifts in surface moisture conditions [44]. The main effect of net radiation on ET is due to the fact that the energy produced by solar radiation can be absorbed by plants or given off as heat, leading to an increase in the temperature of the vegetation as well as in the air temperature, which provides the energy for the water molecules to change from a liquid to gaseous state, which in turn leads to an increase in the ET [57]. In this study, the contribution of net radiation to ET is small, so net radiation is not a dominant factor affecting ET in the study area.
Among the external environmental factors, altitude, maximum temperature, minimum temperature, wind speed, and precipitation have a high correlation with ET. The difference in ET between low and high altitude is significant [58]. This is because temperature, solar radiation, and wind speed decrease with increasing altitude, while altitude affects vegetation metabolism, such as photosynthesis, respiration, and other metabolic processes, through the redistribution of temperature and humidity, which affects vegetation growth and, thus, has an impact on ET. Due to the overall higher elevation of the study area, the temperature decreased more rapidly with elevation, and the NDVI increased first and then decreased with elevation [48], resulting in an uneven distribution of vegetation and indirectly affecting the spatial distribution of ET. The contribution of temperature to ET changes was large, while the maximum and minimum temperatures also had a large effect on ET, and interactions with other factors enhanced the effect on ET. Changes in temperature affected changes in the wetness index and precipitation. Wind speed affects water vapor transport during evaporation. Precipitation is one of the most important components of the hydrological cycle that determines water supply conditions and, to some extent, controls ET [59]. Its variability affects the surface water balance and ultimately changes surface dry and wet conditions [60]. Atmospheric circulation model experiments show that evapotranspiration can consume up to 80% of total precipitation [61]. Annual ET is equal to the difference between annual precipitation and changes in annual runoff and regional storage. Precipitation and ET are closely related [62]. Among the external environmental factors studied, the effect of slope aspect on ET was minimal, but the interactions with other environmental factors all showed a nonlinear enhancement. This could be attributed to differences in net surface radiation, temperature, and precipitation between north-facing and south-facing slopes [63].

4.3. Sources of Uncertainty and Future Prospects

The enhanced MOD16-STM ET algorithm demonstrates significantly improved validation metrics at flux sites compared to the original MOD16 algorithm. Quantitative analysis revealed enhanced simulation accuracy with particular improvement in addressing systematic underestimation errors. This refined methodology provides more reliable ET estimates for the ecologically sensitive Zoige forest–grass transitional. Air resistance is an important input parameter to the MOD16 ET model. Surface roughness and wind speed are key variables in determining air resistance, so the scheme of using bare soil roughness to improve air resistance at the soil surface has good applicability. Soil surface resistance controls soil evaporation, so improving soil resistance can better improve ET simulation accuracy [64,65]. In conclusion, the MOD16-STM ET algorithm has a good theoretical basis as well as applicability for the improvement of the MOD16 ET algorithm.
The MOD16-STM ET algorithm, while useful, faces challenges in accurately simulating ET due to various factors. One significant issue is the uncertainty in the driving data, which can stem from the lack of high-precision meteorological data and the inconsistencies between pixel and site scales. The interpolation of site-based data to the pixel scale introduces potential uncertainty, and the interpolation effect can further affect the simulation accuracy of ET. Moreover, the ET estimation process involves numerous parameters, and the spatial resolution of data from different sources can vary. Harmonizing these data through resampling methods may also impact the accuracy of the driving data. Despite improvements in the MOD16-STM ET algorithm, such as the refinement of soil surface resistance, significant differences still exist in the parameterized formulations of soil surface resistance across different soil textures. To enhance the performance of the model, more observations of the physical processes of soil evaporation in the study area are needed [22]. Additionally, comparing multiple ET remote sensing estimation models can help identify a more suitable model for the study area, leading to more accurate ET estimations. Improving the accuracy of meteorological data through advanced interpolation algorithms is another potential area for improvement. Given the limited number of stations in the study area, extending the model to a larger area of alpine grassland and validating it with more measured data from additional stations can enhance the model’s feasibility and accuracy. In conclusion, while the MOD16-STM ET algorithm is a valuable tool, there is still room for improvement in its accuracy and performance. Addressing the issues related to driving data uncertainty, parameterization, and spatial resolution harmonization as well as exploring alternative ET estimation models and improving meteorological data accuracy are key areas for future research and development.

5. Conclusions

In this study, the MOD16-STM ET algorithm was used to estimate the ET and its components in the Zoige forest–grass transition zone between 2003 and 2021. Based on the good accuracy of the station simulation, the spatial and temporal evolution of ET and its components in the region was studied, and the contributions of the model driving factors as well as the LUCC to the changes in ET and the effects of external environmental factors on ET were analyzed. The main conclusions are as follows. The MOD16-STM ET algorithm had better applicability in the Zoige forest–grass transition zone, with higher model accuracy, and was able to better simulate the ET and its components in the Zoige forest–grass transition zone and alpine grassland ecosystem. Mean annual ET in the Zoige forest–grass transition zone ranged from 292 mm·a−1 to 381 mm·a−1, with 82% of the mean annual ETc, 15% of the ETs, and only 3% of the ETi. ETs and ETc were similar in spatial distribution with large spatial differences, while ETs and ETi were less spatially different compared to ETc. The Zoige forest-grass transition zone consisted mainly of grasslands, forests, and wetlands, and the annual mean ET and ETc ranged from large to small, with forests being larger than grasslands and larger than wetlands, while wetlands were larger than grasslands and larger than forests in ETs. In grasslands, forests, and wetlands, ETc was the major component of ET, with annual average percentages greater than 80%. Temperature and NDVI contributed the most to ET changes among the drivers of the model, with average contributions of 0.9 mm·a−1 and 1.2 mm·a−1, with NDVI being the main contributor in 91% of the area. There were also large effects of changes in LUCC on ET, with changes in forest and grassland having the most significant effects. Among the external environmental factors, elevation, maximum temperature, and minimum temperature had the highest correlation with ET, and precipitation and wind speed also had a large correlation with ET, and the interactions between the environmental factors all enhanced the effect on ET.

Author Contributions

Conceptualization, X.L., C.D., and L.D.; Data curation, Y.K. and H.X.; Formal analysis, S.L.; Funding acquisition, H.S. and Q.S.; Investigation, L.D.; Methodology, Y.K. and C.D.; Project administration, H.S. and Q.S.; Resources, Q.S. and H.X.; Supervision, H.S. and S.L.; Validation, X.L. and C.D.; Visualization, Y.K. and H.X.; Writing—original draft, X.L.; Writing—review and editing, S.L. and L.D. All authors have read and agreed to the published version of the manuscript.

Funding

This research was funded by the National Natural Science Foundation of China (grant number: No. 42271405), the Key Ecological Function Zone Protection Policy Research Center in the Upper Reaches of the Yangtze River (grant number: YREPC2023-YB007), Natural Science Foundation of Sichuan Province of China (grant number: 2023NSFSC0248), and Innovation and Entrepreneurship Projects for College Students (grant number: 202410616030) and was supported by Open Foundation of the Research Center for Human Geography of Tibetan Plateau and Its Eastern Slope (Chengdu University of Technology) (grant number: RWDL2023-ZD002).

Data Availability Statement

The meteorological data used in this article can be freely download at https://www.noaa.gov/ (accessed on 25 March 2024). The remote sensing data used in this article can be freely downloaded at https://data.tpdc.ac.cn/ (accessed on 11 April 2024), http://gis5g.com/home (accessed on 4 November 2024), https://ladsweb.modaps.eosdis.nasa.gov/search/ (accessed on 15 April 2024), https://www.gebco.net/ (accessed on 10 November 2024) and https://data.tpdc.ac.cn/ (accessed on 11 November 2024). The station data used in this article can be freely downloaded at https://data.tpdc.ac.cn/ (accessed on 5 March 2024).

Acknowledgments

We hereby thank the National Natural Science Foundation of China, the Key Ecological Function Zone Protection Policy Research Center in the Upper Reaches of the Yangtze River, Natural Science Foundation of Sichuan Province of China, Innovation and Entrepreneurship Projects for College Students and Open Foundation of the Research Center for Human Geography of Tibetan Plateau and Its Eastern Slope (Chengdu University of Technology) for financial support for this research.

Conflicts of Interest

The authors declare no conflicts of interest.

References

  1. Jung, M.; Reichstein, M.; Ciais, P.; Seneviratne, S.I.; Sheffield, J.; Goulden, M.L.; Bonan, G.; Cescatti, A.; Chen, J.; de Jeu, R.; et al. Recent decline in the global land evapotranspiration trend due to limited moisture supply. Nature 2010, 467, 951–954. [Google Scholar] [CrossRef] [PubMed]
  2. Fisher, J.B.; Melton, F.; Middleton, E.; Hain, C.; Anderson, M.; Allen, R.; McCabe, M.F.; Hook, S.; Baldocchi, D.; Townsend, P.A.; et al. The future of evapotranspiration: Global requirements for ecosystem functioning, carbon and climate feedbacks, agricultural management, and water resources. Water Resour. Res. 2017, 53, 2618–2626. [Google Scholar] [CrossRef]
  3. Tong, R.; Yang, X.; Ren, L.; Liu, Y.; Ma, M. Temporal and spatial characteristics of evapotranspiration in the Yellow River Basin during 1961–2012 and analysis of its influence factors. Water Resour. Prot. 2015, 31, 16–21. [Google Scholar]
  4. Oki, T.; Kanae, S. Global hydrological cycles and world water resources. Science 2006, 313, 1068–1072. [Google Scholar] [CrossRef]
  5. Bai, P.; Cai, C. Attribution analysis of changes in terrestrial evapotranspiration in China during 1982–2019. Acta Geogr. Sin. 2023, 78, 2750–2762. [Google Scholar]
  6. Lu, Q.; He, H.; Zhu, X.; Yu, G.; Wang, H.; Zhang, J.; Yan, J. Study on the Variations of Forest Evapotranspiration and Its Components in Eastern China. J. Nat. Resour. 2015, 30, 1436–1448. [Google Scholar]
  7. Gong, L.B.; Xu, C.Y.; Chen, D.L.; Halldin, S.; Chen, Y.Q.D. Sensitivity of the Penman-Monteith reference evapotranspiration to key climatic variables in the Changjiang (Yangtze River) basin. J. Hydrol. 2006, 329, 620–629. [Google Scholar] [CrossRef]
  8. Cao, Y.; Liu, C.; Liu, X.; Zheng, H. Sensitivity of the Potential Evapotranspiration to Key Climatic Variables in the Haihe River Basin. Resour. Sci. 2009, 31, 1470–1476. [Google Scholar]
  9. Zhang, Y.Q.; Pena-Arancibia, J.L.; McVicar, T.R.; Chiew, F.H.S.; Vaze, J.; Liu, C.M.; Lu, X.J.; Zheng, H.X.; Wang, Y.P.; Liu, Y.Y.; et al. Multi-decadal trends in global terrestrial evapotranspiration and its components. Sci. Rep. 2016, 6, 19124. [Google Scholar] [CrossRef]
  10. Jovanovic, N.; Mu, Q.Z.; Bugan, R.D.H.; Zhao, M.S. Dynamics of MODIS evapotranspiration in South Africa. Water SA 2015, 41, 79–90. [Google Scholar] [CrossRef]
  11. Sun, G.; Alstad, K.; Chen, J.Q.; Chen, S.P.; Ford, C.R.; Lin, G.H.; Liu, C.F.; Lu, N.; McNulty, S.G.; Miao, H.X.; et al. A general predictive model for estimating monthly ecosystem evapotranspiration. Ecohydrology 2011, 4, 245–255. [Google Scholar] [CrossRef]
  12. Wang, Z.; Zhang, R.; Zhang, Y. Temporal and Spatial Variation Characteristics and Impact Analysis of Evapotranspiration and Its Components in Poyang Lake Basin Based on SWH Dual-Source Model. China Rural Water Hydropower 2023, 11, 52–63. [Google Scholar]
  13. Bai, P. Comparison of remote sensing evapotranspiration models: Consistency, merits, and pitfalls. J. Hydrol. 2023, 617, 128856. [Google Scholar] [CrossRef]
  14. Feng, J.; Jing, Y.; Ran, C.; Sachini Kaushalya Dissanayake, S.D. Estimating High Spatial and Temporal Resolution MODIS Remote Sensing Evapotranspiration Data in Southern Red Soil Region Based on ESTARFM Model. Chin. J. Agrometeorol. 2024, 45, 953–967. [Google Scholar]
  15. Meng, Y.; Jiang, P.; Dong, W. Progress in the Evapotranspiration Estimation Using Remotely Sensed Data. Remote Sens. Technol. Appl. 2022, 37, 839–853. [Google Scholar]
  16. Zhang, K.; Kimball, J.S.; Running, S.W. A review of remote sensing based actual evapotranspiration estimation. Wiley Interdiscip. Rev.-Water 2016, 3, 834–853. [Google Scholar] [CrossRef]
  17. Ji, P.; Yuan, X. Modeling the evapotranspiration and its long-term trend over Northwest China using different machine learning models. Trans. Atmos. Sci. 2023, 46, 69–81. [Google Scholar]
  18. Jiang, F.X.; Xie, X.H.; Liang, S.L.; Wang, Y.B.; Zhu, B.W.; Zhang, X.T.; Chen, Y.C. Loess Plateau evapotranspiration intensified by land surface radiative forcing associated with ecological restoration. Agric. For. Meteorol. 2021, 311, 108669. [Google Scholar] [CrossRef]
  19. Tang, J.; Hu, B.; Yu, B.; Zou, Y.; Su, H. Spatio-temporal Variation of Guangxi Drought Based on the SPEI_PM and Its Correlation with ENSO. Chin. J. Agrometeorol. 2024, 45, 1067–1078. [Google Scholar]
  20. Mu, Q.Z.; Zhao, M.S.; Running, S.W. Improvements to a MODIS global terrestrial evapotranspiration algorithm. Remote Sens. Environ. 2011, 115, 1781–1800. [Google Scholar] [CrossRef]
  21. Feng, F.; Li, X.L.; Yao, Y.J.; Liang, S.L.; Chen, J.Q.; Zhao, X.; Jia, K.; Pintér, K.; McCaughey, J.H. An Empirical Orthogonal Function-Based Algorithm for Estimating Terrestrial Latent Heat Flux from Eddy Covariance, Meteorological and Satellite Observations. PLoS ONE 2016, 11, e0160150. [Google Scholar] [CrossRef] [PubMed]
  22. Yuan, L.; Ma, Y.; Chen, X.; Wang, Y.; Li, Z. An Enhanced MOD16 Evapotranspiration Model for the Tibetan Plateau During the Unfrozen Season. J. Geophys. Res.-Atmos. 2021, 126, e2020JD032787. [Google Scholar] [CrossRef]
  23. Chen, X.L.; Yuan, L.; Ma, Y.M.; Chen, D.L.; Su, Z.B.; Cao, D.B. A doubled increasing trend of evapotranspiration on the Tibetan Plateau. Sci. Bull. 2024, 69, 1980–1990. [Google Scholar] [CrossRef]
  24. Bai, J.; Ouyang, H.; Cui, B.; Wang, Q.; Chen, H. Changes in landscape pattern of alpine wetlands on the Zoige Plateau in the past four decades. Acta Ecol. Sin. 2008, 28, 2245–2252. [Google Scholar]
  25. Tian, Y.; Xiong, M.; Song, G. Restoration succession of wetland soils and their changes of water and nutrient in Ruoergai Plateau. Chin. J. Ecol. 2005, 24, 21–25. [Google Scholar]
  26. Wu, R.N.; Ma, S.; Lan, L.; Tian, J.P.; Ding, W.; Zhou, Z.J.; Wang, M.D.; Bi, L.C.; Wang, L. Effects of Grazing on Soil Nitrogen Content in the Forest-steppe Ecotoneon the Southern Edge of the Greater Khingan Mountains. Terr. Ecosyst. Conserv. 2023, 3, 48–55. [Google Scholar]
  27. Shi, S.; Li, W.; Qu, C.; Yang, Z.-Y. Spatiotemporal Evolution and Quantitative Attribution Analysis of Vegetation NDVI in Greater Khingan Mountains Forest-Steppe Ecotone. Huan Jing Ke Xue = Huanjing Kexue 2024, 45, 248–261. [Google Scholar] [CrossRef] [PubMed]
  28. Schmidt, M.; Jochheim, H.; Kersebaum, K.C.; Lischeid, G.; Nendel, C. Gradients of microclimate, carbon and nitrogen in transition zones of fragmented landscapes—A review. Agric. For. Meteorol. 2017, 232, 659–671. [Google Scholar] [CrossRef]
  29. Bai, P.; Liu, X.M.; Zhang, Y.Q.; Liu, C.M. Assessing the Impacts of Vegetation Greenness Change on Evapotranspiration and Water Yield in China. Water Resour. Res. 2020, 56, e2019WR027019. [Google Scholar] [CrossRef]
  30. Mo, X.; Liu, S.; Hu, S. Co-evolution of climate-vegetation-hydrology and its mechanisms in the source region of Yellow River. Acta Geogr. Sin. 2022, 77, 1730–1744. [Google Scholar]
  31. Li, X.; Yu, D. Progress on Evapotranspiration Estimation Methods and Driving Forces in Arid and Semiarid Regions. Arid Zone Res. 2020, 37, 26–36. [Google Scholar]
  32. Deng, X.; Liu, C.; Li, L.; Lu, H.; Li, N. Mechanism and Computational Modelling of the Erosion Process of Zoige Meadow-typeBending River. Adv. Eng. Sci. 2024, 1–15. [Google Scholar]
  33. Guo, J.; Li, G.P. Climate Change in Zoige Plateau Marsh Wetland and Its Impact on Wetland Degradation. Plateau Meteorol. 2007, 26, 422–428. [Google Scholar]
  34. Tian, Y. The Vegetation Type and Its Distribution Regularity under Different Habitats in Ruoergai Plateau. J. Yangtze Univ. Nat. Sci. Ed. 2005, 2, 1–5+103. [Google Scholar]
  35. Xiong, Y.; Wu, P.; Zhang, H.; Cui, L.; He, X. Dynamics of soil water conservation during the degradation process of the Zoige Alpine Wetland. Acta Ecol. Sin. 2011, 31, 5780–5788. [Google Scholar]
  36. Ma, X.L.; Li, C.E.; Chen, Q.G. Study on the method of GIS based spatial interpolation of climate factors in China. Pratacultural Sci. 2008, 25, 13–19. [Google Scholar]
  37. Ye, J.; Liu, H.; Li, W.; Cai, S.; Li, Y.; Cao, L. Estimation of the Net Radiation over Arid and Semiarid Areas Only Using MODIS Data for Clear Sky Days. Acta Sci. Nat. Univ. Pekin. 2010, 46, 942–950. [Google Scholar]
  38. Yang, J.; Huang, X. The 30 m annual land cover dataset and its dynamics in China from 1990 to 2019. Earth Syst. Sci. Data 2021, 13, 3907–3925. [Google Scholar] [CrossRef]
  39. Jiang, W.; Shu, Z.G.; Lv, Y.H.; Su, X.K.; Wu, X.; Wang, C.; Wang, K.; Sun, S.Q.; Liu, G.H. Quantifying impacts of climate and land use changes on ecosystem services from statistic perspective. Ecol. Indic. 2025, 172, 113285. [Google Scholar] [CrossRef]
  40. Chen, Y.; Chai, S.; Chen, W.J.; Xia, J.Z. The Effects of Climate Change and Greening of Vegetation on Spatiotemporal Variation of Evapotranspiration in the Haihe River Basin, China. Ecol. Evol. 2025, 15, e71092. [Google Scholar] [CrossRef]
  41. Gupta, H.V.; Kling, H.; Yilmaz, K.K.; Martinez, G.F. Decomposition of the mean squared error and NSE performance criteria: Implications for improving hydrological modelling. J. Hydrol. 2009, 377, 80–91. [Google Scholar] [CrossRef]
  42. McCandless, T.; Gagne, D.J.; Kosovic, B.; Haupt, S.E.; Yang, B.; Becker, C.; Schreck, J. Machine Learning for Improving Surface-Layer-Flux Estimates. Bound.-Layer Meteorol. 2022, 185, 199–228. [Google Scholar] [CrossRef]
  43. Koster, R.D.; Suarez, M.J. The influence of land surface moisture retention on precipitation statistics. J. Clim. 1996, 9, 2551–2567. [Google Scholar] [CrossRef]
  44. Li, G.; Zhang, F.M.; Jing, Y.S.; Liu, Y.B.; Sun, G. Response of evapotranspiration to changes in land use and land cover and climate in China during 2001–2013. Sci. Total Environ. 2017, 596, 256–265. [Google Scholar] [CrossRef]
  45. Zheng, H.X.; Liu, X.M.; Liu, C.M.; Dai, X.Q.; Zhu, R.R. Assessing contributions to panevaporation trends in Haihe River Basin, China. J. Geophys. Res.-Atmos. 2009, 114, D24105. [Google Scholar] [CrossRef]
  46. Wang, J.; Xu, C. Geodetector: Principle and prospective. Acta Geogr. Sin. 2017, 72, 116–134. [Google Scholar]
  47. Wang, J.F.; Hu, Y. Environmental health risk detection with GeogDetector. Environ. Model. Softw. 2012, 33, 114–115. [Google Scholar] [CrossRef]
  48. Huang, L.; Zhang, H.; Yang, Y.; You, J.; Feng, Q. Analysis of driving factors and variation characteristics of vegetation NDVI in Zoige region from 1998 to 2020. Nat. Prot. Areas 2024, 4, 74–85. [Google Scholar]
  49. Zhao, Z.; Luo, Y.; Huang, j. Global warming and El Nino events. Progress. Inquisitiones Mutat. Clim. 2023, 19, 663–666. [Google Scholar]
  50. Yeh, S.W.; Kug, J.S.; Dewitte, B.; Kwon, M.H.; Kirtman, B.P.; Jin, F.F. El Nino in a changing climate. Nature 2009, 461, U511–U570. [Google Scholar] [CrossRef]
  51. Peng, H.; Zhao, C.; Liang, J. Daily variation of evapotranspiration rate of alpine grassland and analysis of its environmental factors in upper reach of Heihe River. J. Water Resour. Water 2016, 27, 46–53. [Google Scholar]
  52. Mei, J.; Sun, M.; Li, L. Variations of evapotranspiration and its components in alpine meadow on the Tibetan Plateau based on SWH model. Arid Land Geogr. 2022, 45, 1740–1751. [Google Scholar]
  53. Guo, X.; Wang, K.; Li, L.; Zhang, H.; Ma, L.; Yao, Z.; Zhang, W.; Hu, Z.; Zheng, X. Surface Energy Exchanges and Evapotranspiration of an Alpine Meadow on the Zoige Plateau. Chin. J. Agrometeorol. 2021, 42, 642–656. [Google Scholar]
  54. Li, X.Y.; Zou, L.; Xia, J.; Dou, M.; Li, H.W.; Song, Z.H. Untangling the effects of climate change and land use/cover change on spatiotemporal variation of evapotranspiration over China. J. Hydrol. 2022, 612, 128189. [Google Scholar] [CrossRef]
  55. Bronstert, A.; Niehoff, D.; Bürger, G. Effects of climate and land-use change on storm runoff generation:: Present knowledge and modelling capabilities. Hydrol. Process. 2002, 16, 509–529. [Google Scholar] [CrossRef]
  56. Zhang, Y.; Kong, D.; Zhang, X.; Tian, J.; Li, C. Impacts of vegetation changes on global evapotranspiration in the period 2003–2017. Acta Geogr. Sin. 2021, 76, 584–594. [Google Scholar]
  57. Xie, H. The Evapotranspiration and Its Response to Climate Change on the Tibetan Plateau (1970–2010). Doctoral Dissertation, Lanzhou University, Lanzhou, China, 2012. [Google Scholar]
  58. Lee, B.Y.; Yang, S.K.; Kwon, K.H.; Kim, J.B. The Effect of Evapotranspiration by Altitude and Observation of Lysimeter. J. Environ. Sci. Int. 2012, 21, 749–755. [Google Scholar] [CrossRef]
  59. Walter, M.T.; Wilks, D.S.; Parlange, J.Y.; Schneider, R.L. Increasing evapotranspiration from the conterminous United States. J. Hydrometeorol. 2004, 5, 405–408. [Google Scholar] [CrossRef]
  60. Ma, Z.; Fu, C. Basic facts about aridification in northern China, 1951–2004. Chin. Sci. Bull. 2006, 51, 2429–2439. [Google Scholar]
  61. Liu, K.; Jiang, D. Analysis of Dryness/Wetness over China Using Standardized Precipitation Evapotranspiration Index Based on Two Evapotranspiration Algorithms. Chin. J. Atmos. Sci. 2015, 39, 23–36. [Google Scholar]
  62. Yang, X.; Wang, G.; Pan, X.; Zhang, Y. Spatio-temporal variability of terrestrial evapotranspiration in Chinafrom 1980 to 2011 based on GLEAM data. Trans. Chin. Soc. Agric. Eng. 2015, 31, 132–141. [Google Scholar]
  63. Chang, B.; Liu, X.; Wang, S.; Zhang, Y.; Zhang, X.; Sun, Y. Study on grassland evapotranspiration at different slope orientation and its impact factors in Qilian Mountains. J. Cent. South Univ. For. Technol. 2014, 34, 90–95. [Google Scholar]
  64. Swenson, S.C.; Lawrence, D.M. Assessing a dry surface layer-based soil resistance parameterization for the Community Land Model using GRACE and FLUXNET-MTE data. J. Geophys. Res.-Atmos. 2014, 119, 10299–10312. [Google Scholar] [CrossRef]
  65. Chang, Y.; Qin, D.; Ding, Y.; Zhao, Q.; Zhang, S. A modified MOD16 algorithm to estimate evapotranspiration over alpine meadow on the Tibetan Plateau, China. J. Hydrol. 2018, 561, 16–30. [Google Scholar] [CrossRef]
Figure 1. Study area.
Land 14 00805 g001
Figure 2. Comparison between simulated and measured ET values with linear fitting lines (red). (a) Zoige station (MOD16); (b) Maqu station (MOD16); (c) Zoige station (MOD16-STM); (d) Maqu station (MOD16-STM).
Land 14 00805 g002
Figure 3. Inter-annual variations in ET and its components.
Land 14 00805 g003
Figure 4. ET seasonal variations.
Land 14 00805 g004
Figure 5. Spatial distribution of inter-annual means of ET and its components.
Land 14 00805 g005
Figure 6. Contributions of the five drivers and the spatial distribution of the dominant factor in the Zoige forest–grass transition zone between 2003 and 2021.
Land 14 00805 g006
Figure 7. ET and its components in forests, grasslands, and wetlands (mm·a−1).
Land 14 00805 g007
Figure 8. q-values of ET and its components with external environmental factors.
Land 14 00805 g008
Table 1. Data source.
Data TypeVariableSpatial ResolutionData Source
Meteorological datadew point temperature, air temperature, atmospheric pressure-https://www.noaa.gov/ (accessed on 25 March 2024)
Remote sensing dataSoil moisture
Land use
1 km
30 m
https://data.tpdc.ac.cn/ (accessed on 11 April 2024)
http://gis5g.com/home (accessed on 4 November 2024)
NDVI, albedo, net shortwave radiation1 kmhttps://ladsweb.modaps.eosdis.nasa.gov/search/ (accessed on 15 April 2024)
DEM
maximum temperature, minimum temperature, precipitation, wind speed
500 m
1 km
https://www.gebco.net/ (accessed on 10 November 2024)
https://data.tpdc.ac.cn/ (accessed on 11 November 2024)
Station dataMeteorological elements, measured ET-https://data.tpdc.ac.cn/ (accessed on 5 March 2024)
Table 2. Average contribution of land cover change to ET from 2013 to 2021 (mm·a−1).
20032021
ForestGrasslandWetlandOther Land Types
Forest −1.8−2.6−3.6
Grassland0.8 −1.4−3.2
Wetland3.32.2 −1.6
Other land types3.73.52.3
Table 3. Results of the interaction of external environmental factors on the effects of ET.
InteractionSum of q-ValuesResultImpact
DEM ∩ AS = 0.320.31C > A + Bnonlinear enhancement
DEM ∩ TA_MAX = 0.560.65C < A + Btwo-factor enhancement
DEM ∩ TA_MIN = 0.380.61C < A + Btwo-factor enhancement
DEM ∩ WD = 0.380.51C < A + Btwo-factor enhancement
DEM ∩ PRE = 0.340.48C < A + Btwo-factor enhancement
AS ∩ TA_MAX = 0.410.38C > A + Bnonlinear enhancement
AS ∩ TA_MIN = 0.350.34C > A + Bnonlinear enhancement
AS ∩ WD = 0.250.24C > A + Bnonlinear enhancement
AS ∩ PRE = 0.240.21C > A + Bnonlinear enhancement
TA_MAX ∩ TA_MIN = 0.510.68C < A + Btwo-factor enhancement
TA_MAX ∩ WD = 0.550.58C < A + Btwo-factor enhancement
TA_MAX ∩ PRE = 0.520.55C < A + Btwo-factor enhancement
TA_MIN ∩ WD = 0.410.54C < A + Btwo-factor enhancement
TA_MIN ∩ PRE = 0.370.51C < A + Btwo-factor enhancement
WD ∩ PRE = 0.400.41C < A + Btwo-factor enhancement
Table 4. Significance of the difference in the effect of external environmental factors on ET. Y indicates significant differences.
DEMASTA_MAXTA_MINWDPRE
DEM
ASY
TA_MAXYY
TA_MINYYY
WDYYYY
PREYYYYY
Disclaimer/Publisher’s Note: The statements, opinions and data contained in all publications are solely those of the individual author(s) and contributor(s) and not of MDPI and/or the editor(s). MDPI and/or the editor(s) disclaim responsibility for any injury to people or property resulting from any ideas, methods, instructions or products referred to in the content.

