
Ecosystem Health Assessment of Coal Mining Subsidence Wetlands Using the DPSIR Model: A Case Study in Yingshang County, China

Abstract
:1. Introduction
2. Materials and Methods
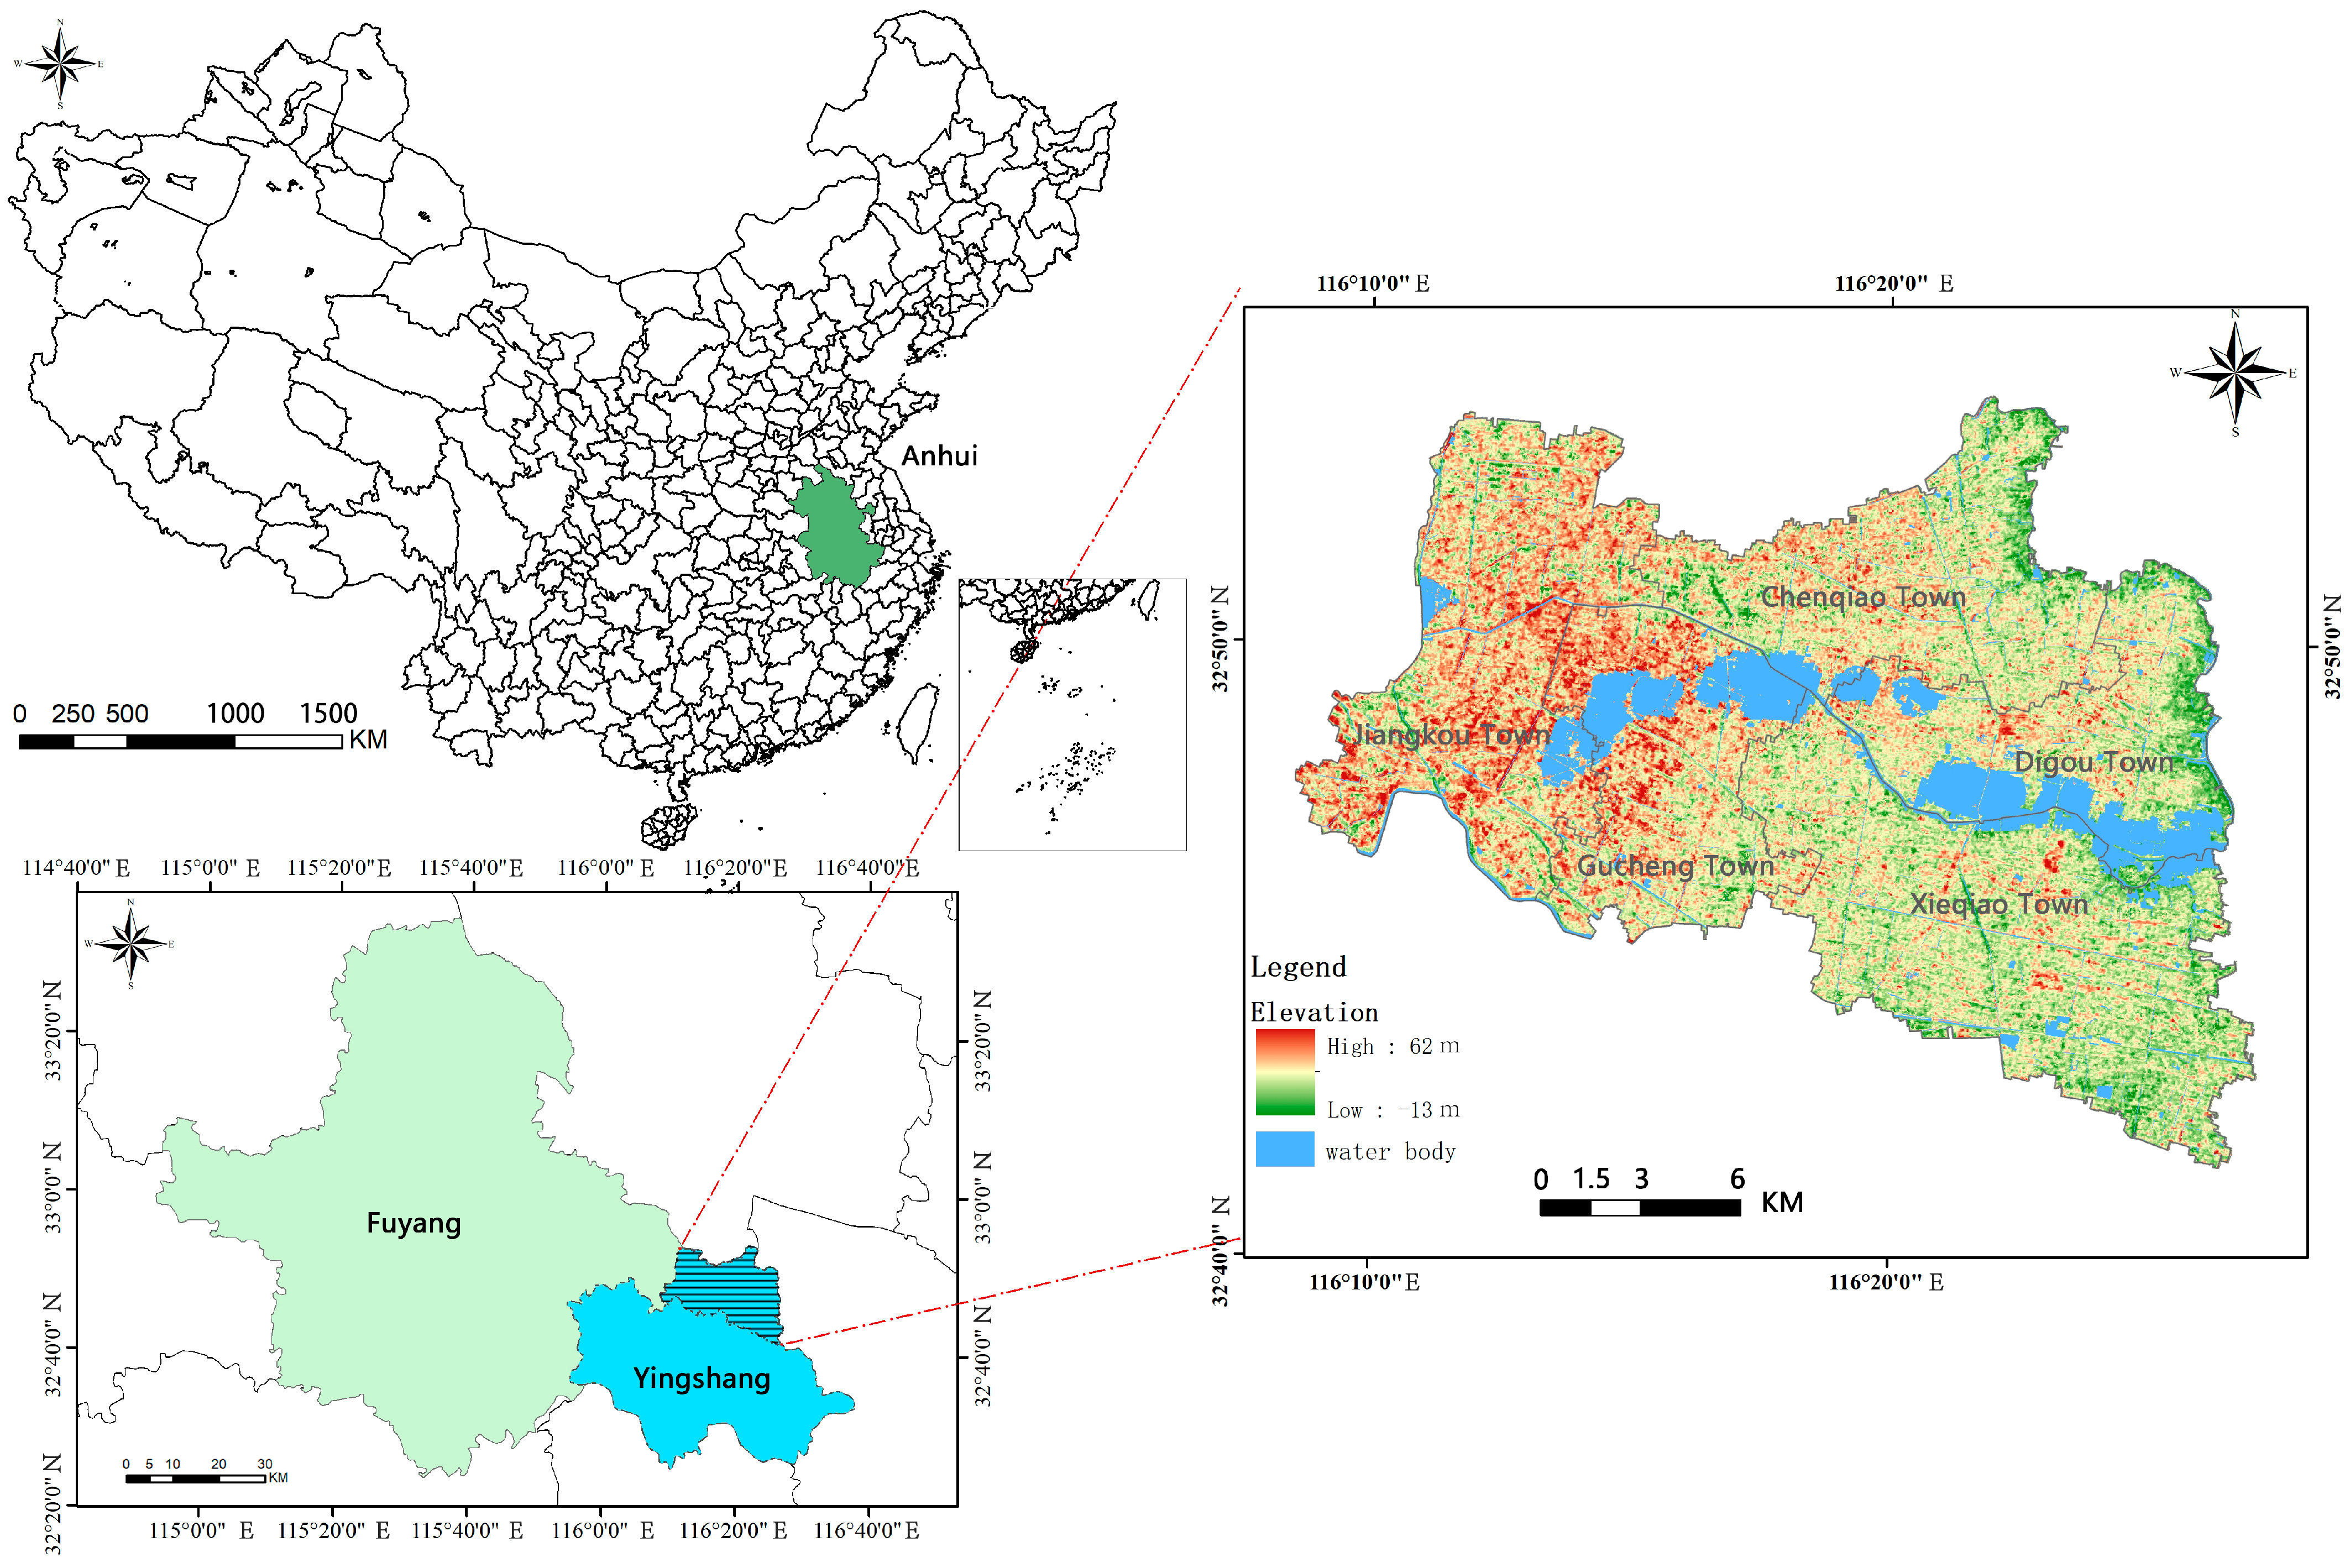
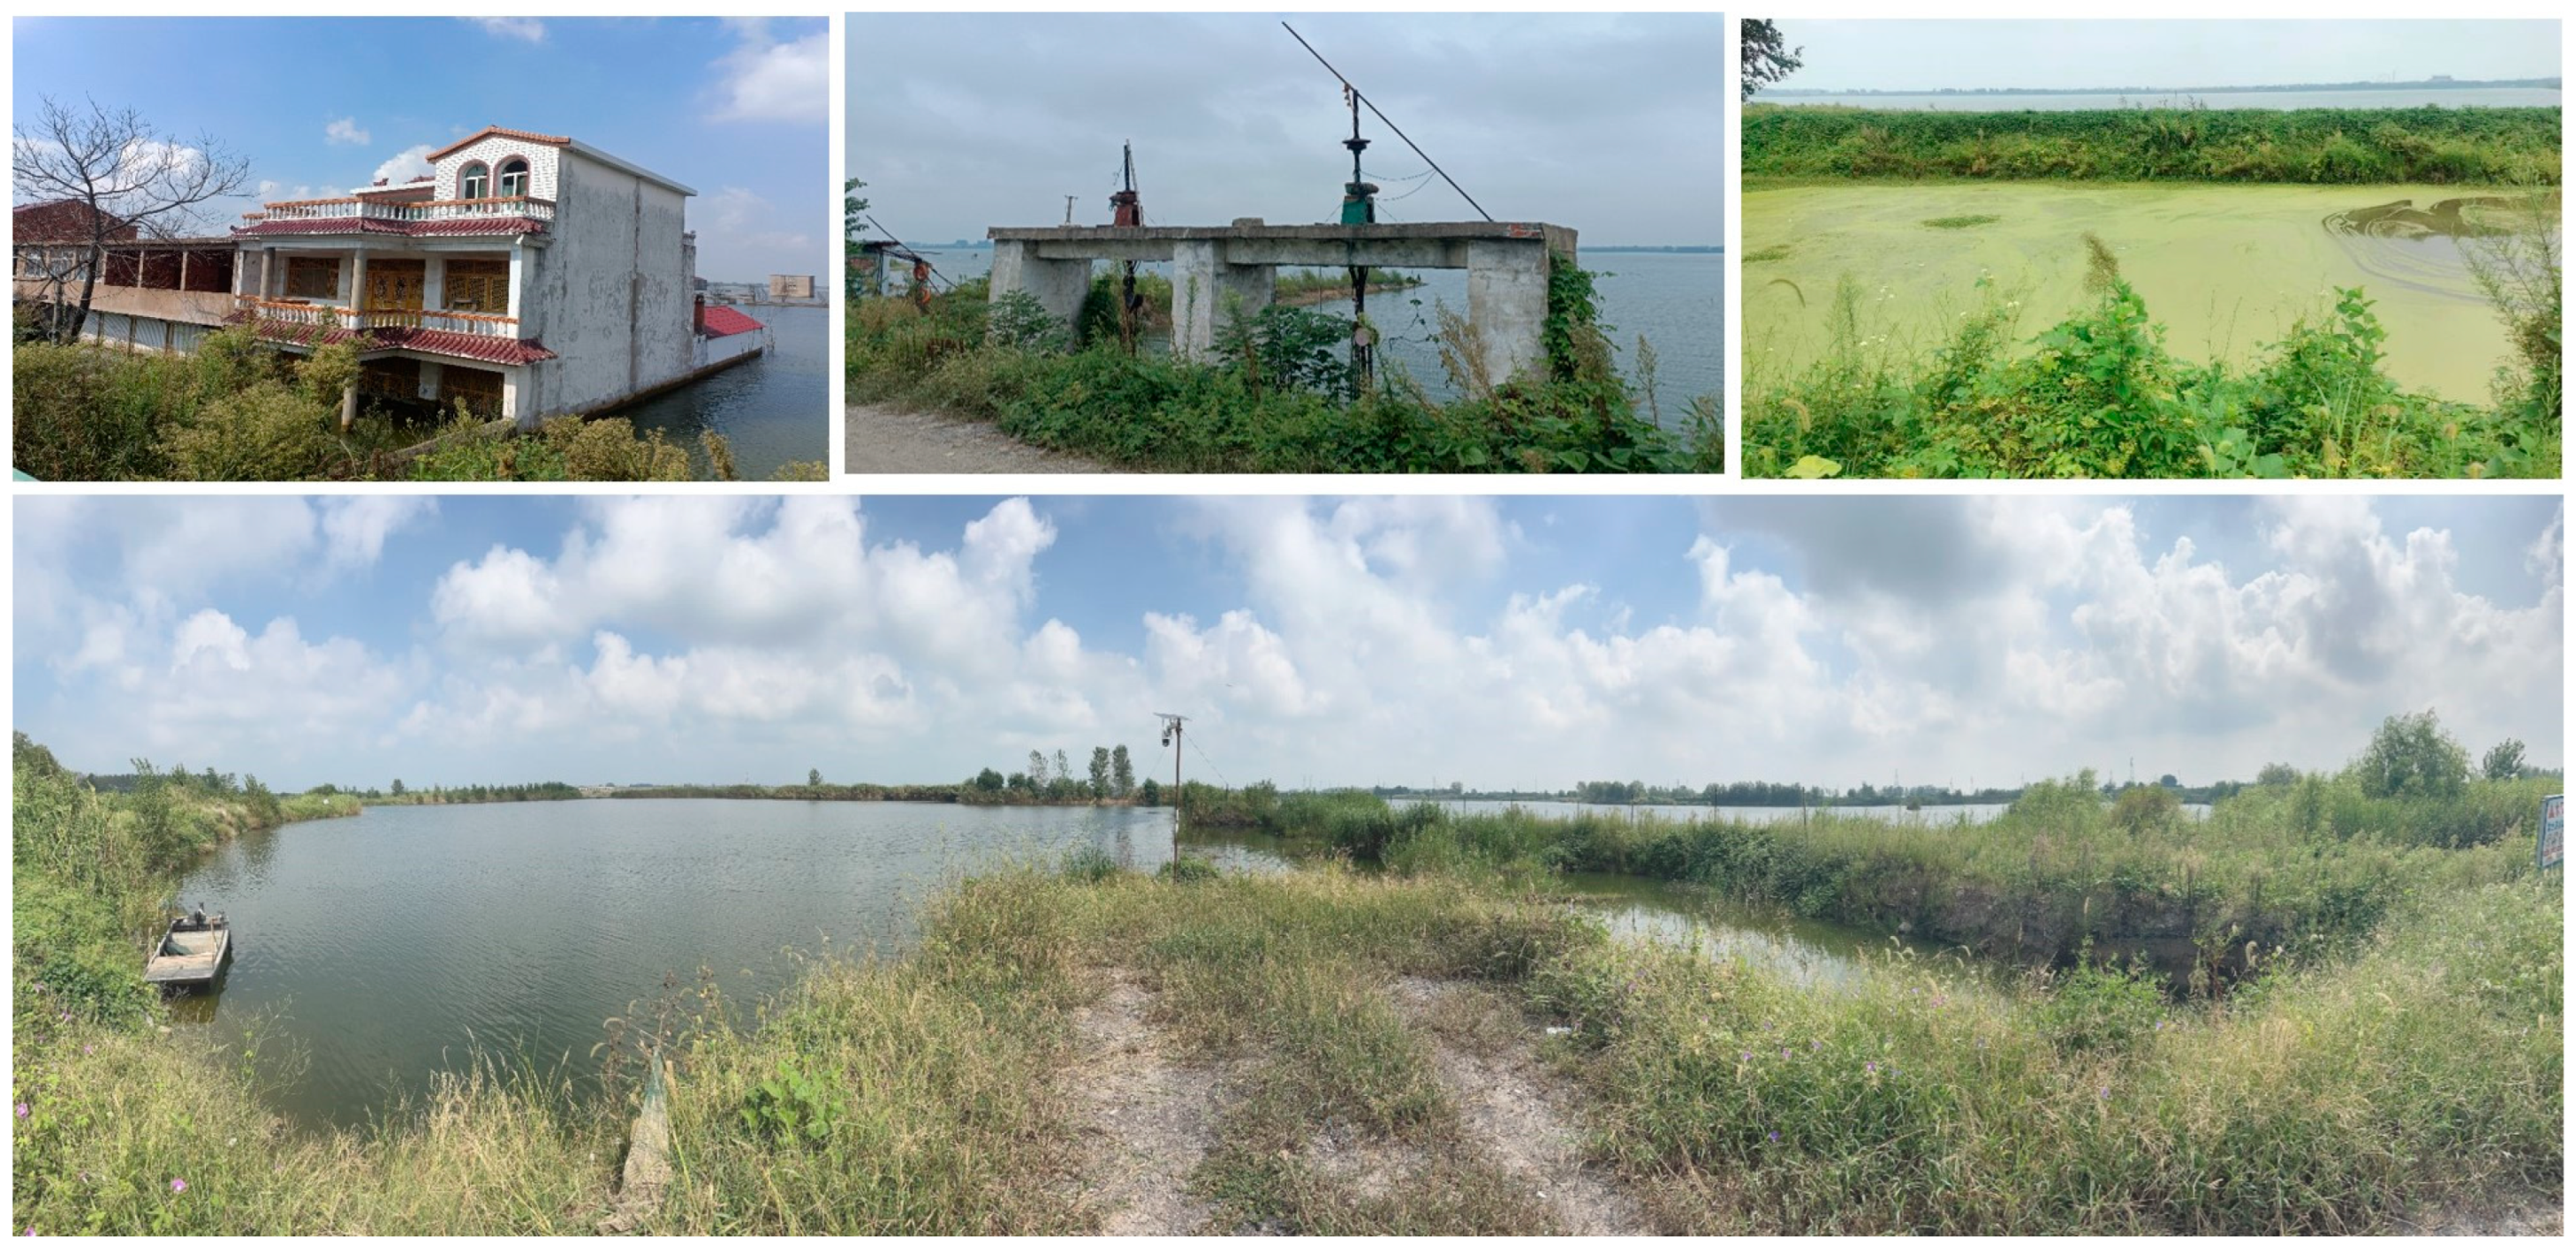
2.1. Study Area
2.2. Data Source
2.3. Methodology
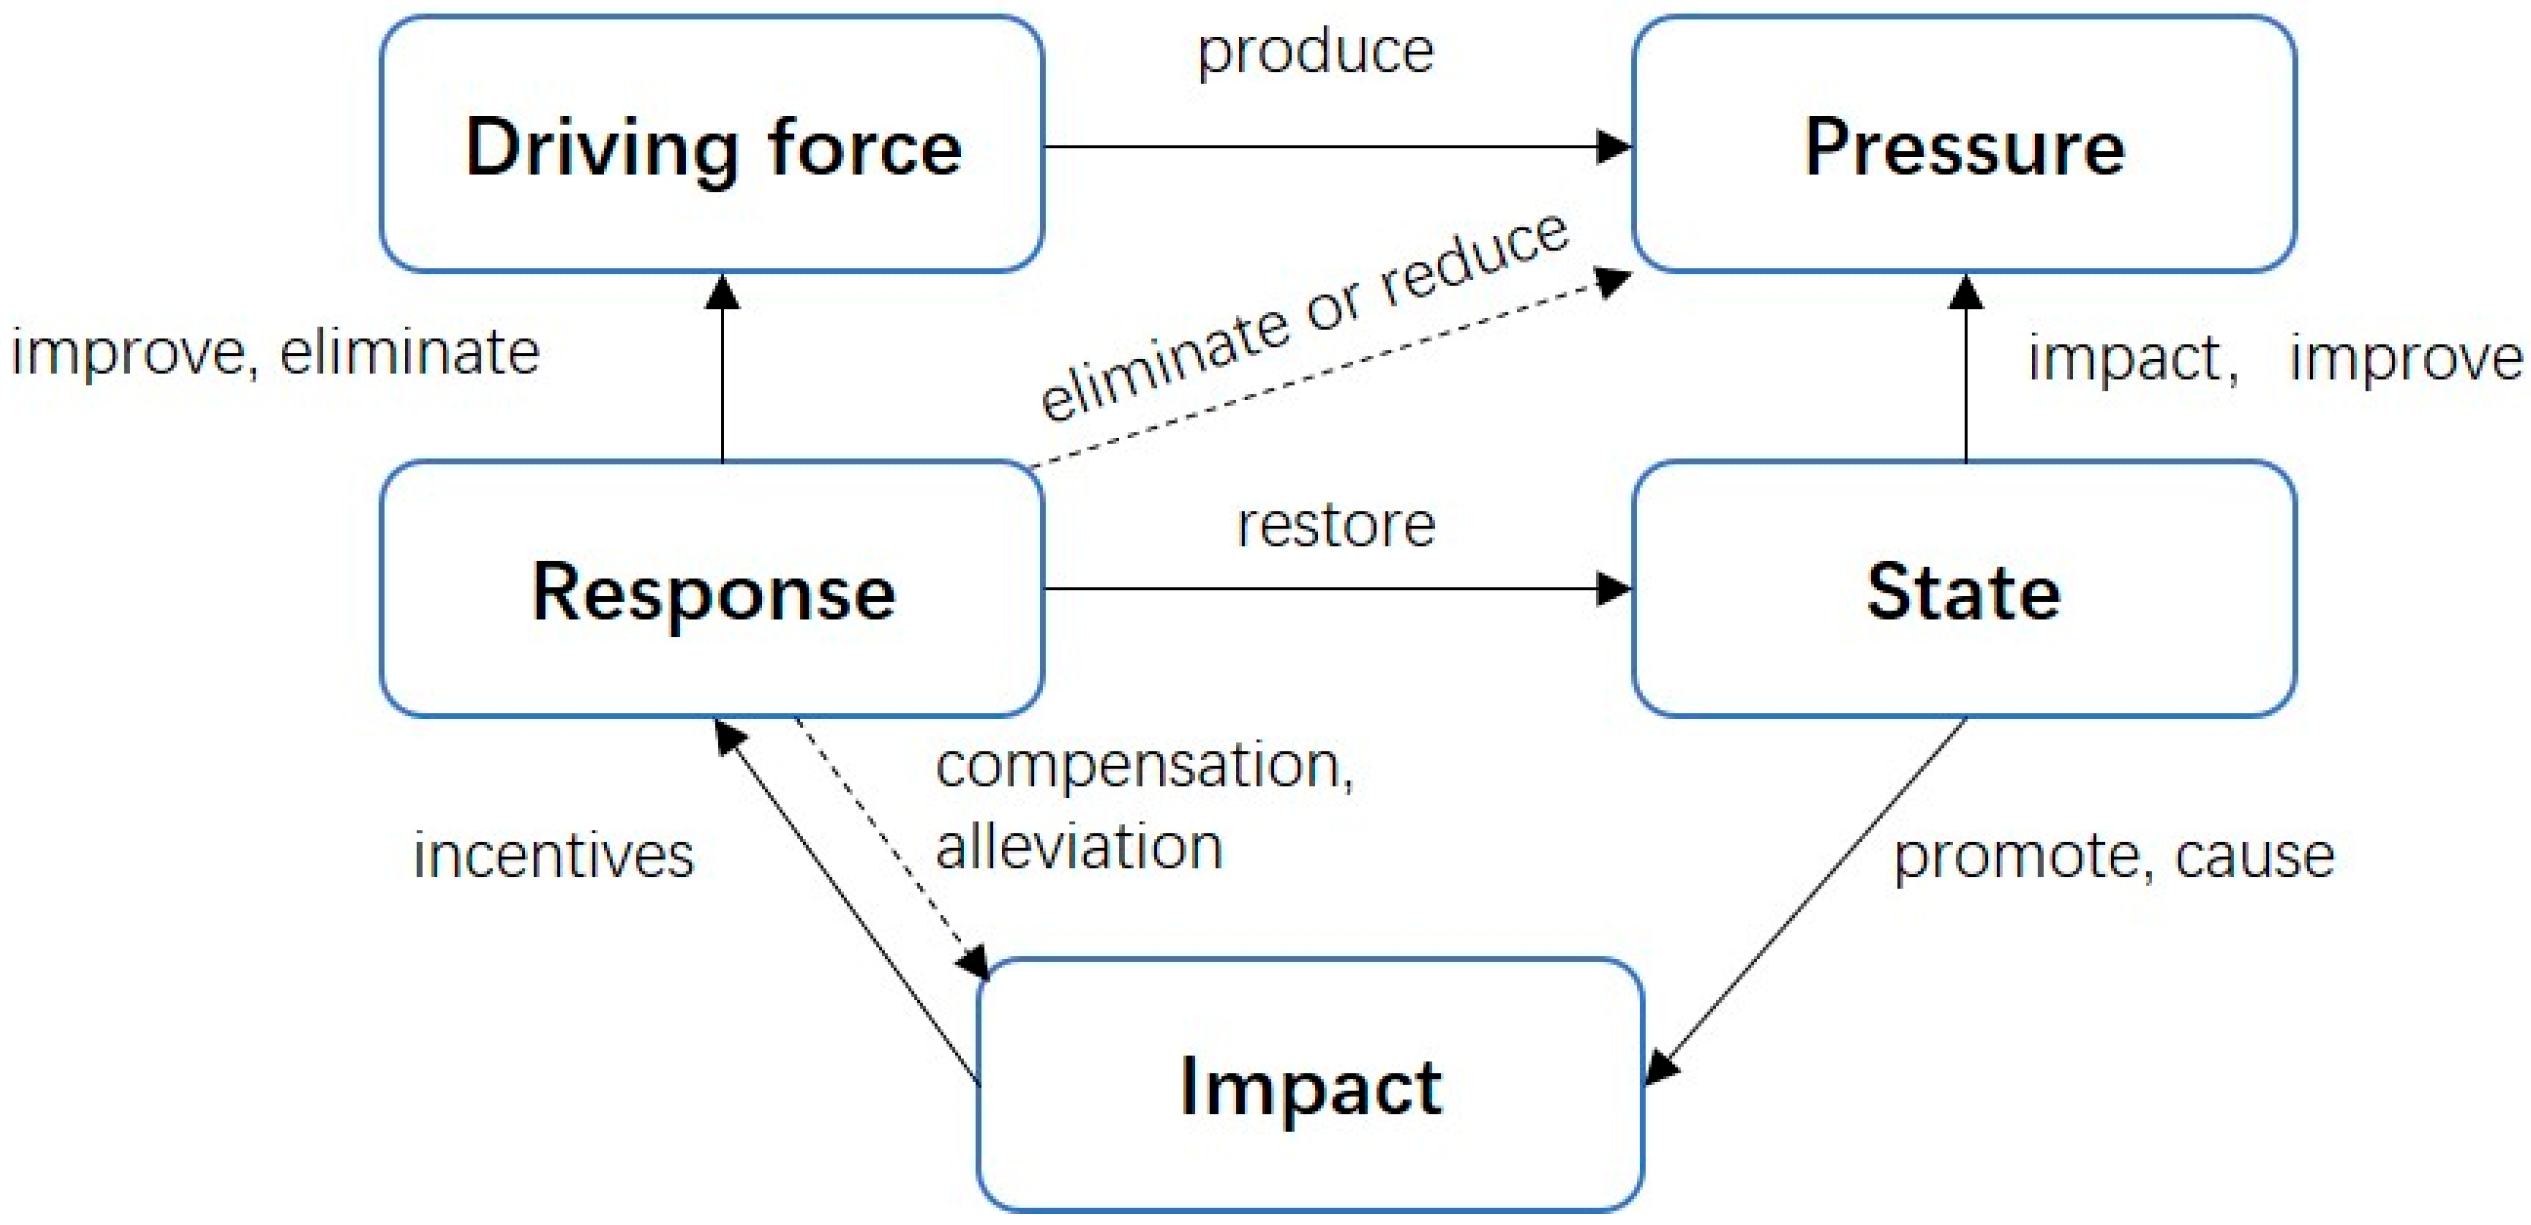
2.3.1. DPSIR Model
2.3.2. Determination of the Assessment Indicator System
- 1.
- Driving Forces subsystem
- 2.
- Pressure subsystem
- 3.
- State subsystem
- 4.
- Impact subsystem
- 5.
- Response subsystem
2.3.3. Determination of the Assessment Index System
- 1.
- Normalization of Indicator Initial Values
- 2.
- Measuring Subjective Weights Using the Analytic Hierarchy Process (AHP)
- Constructing the Judgment Matrix and Calculating the Weight
- Performing Consistency Checks
- Determining Subjective Weights
- 3.
- Measuring Objective Weights Using the CRITIC approach
- To calculate the variability (standard deviation ) of the indicators, we will first calculate the average value of each normalized indicator and then compute the standard deviation. The formulas provided are:
- Calculate the conflict between indicators.
- Calculate the information content of the indicators, ,
- Calculate the objective weights of the indicators, .
- 4.
- Calculate the combined weights .
2.3.4. Comprehensive Health Index (CHI) and Classification of Assessment Indicators
- 1.
- Calculation of Criterion Layer Scores, .
- 2.
- Calculation of the Comprehensive Health Index (CHI).
3. Results
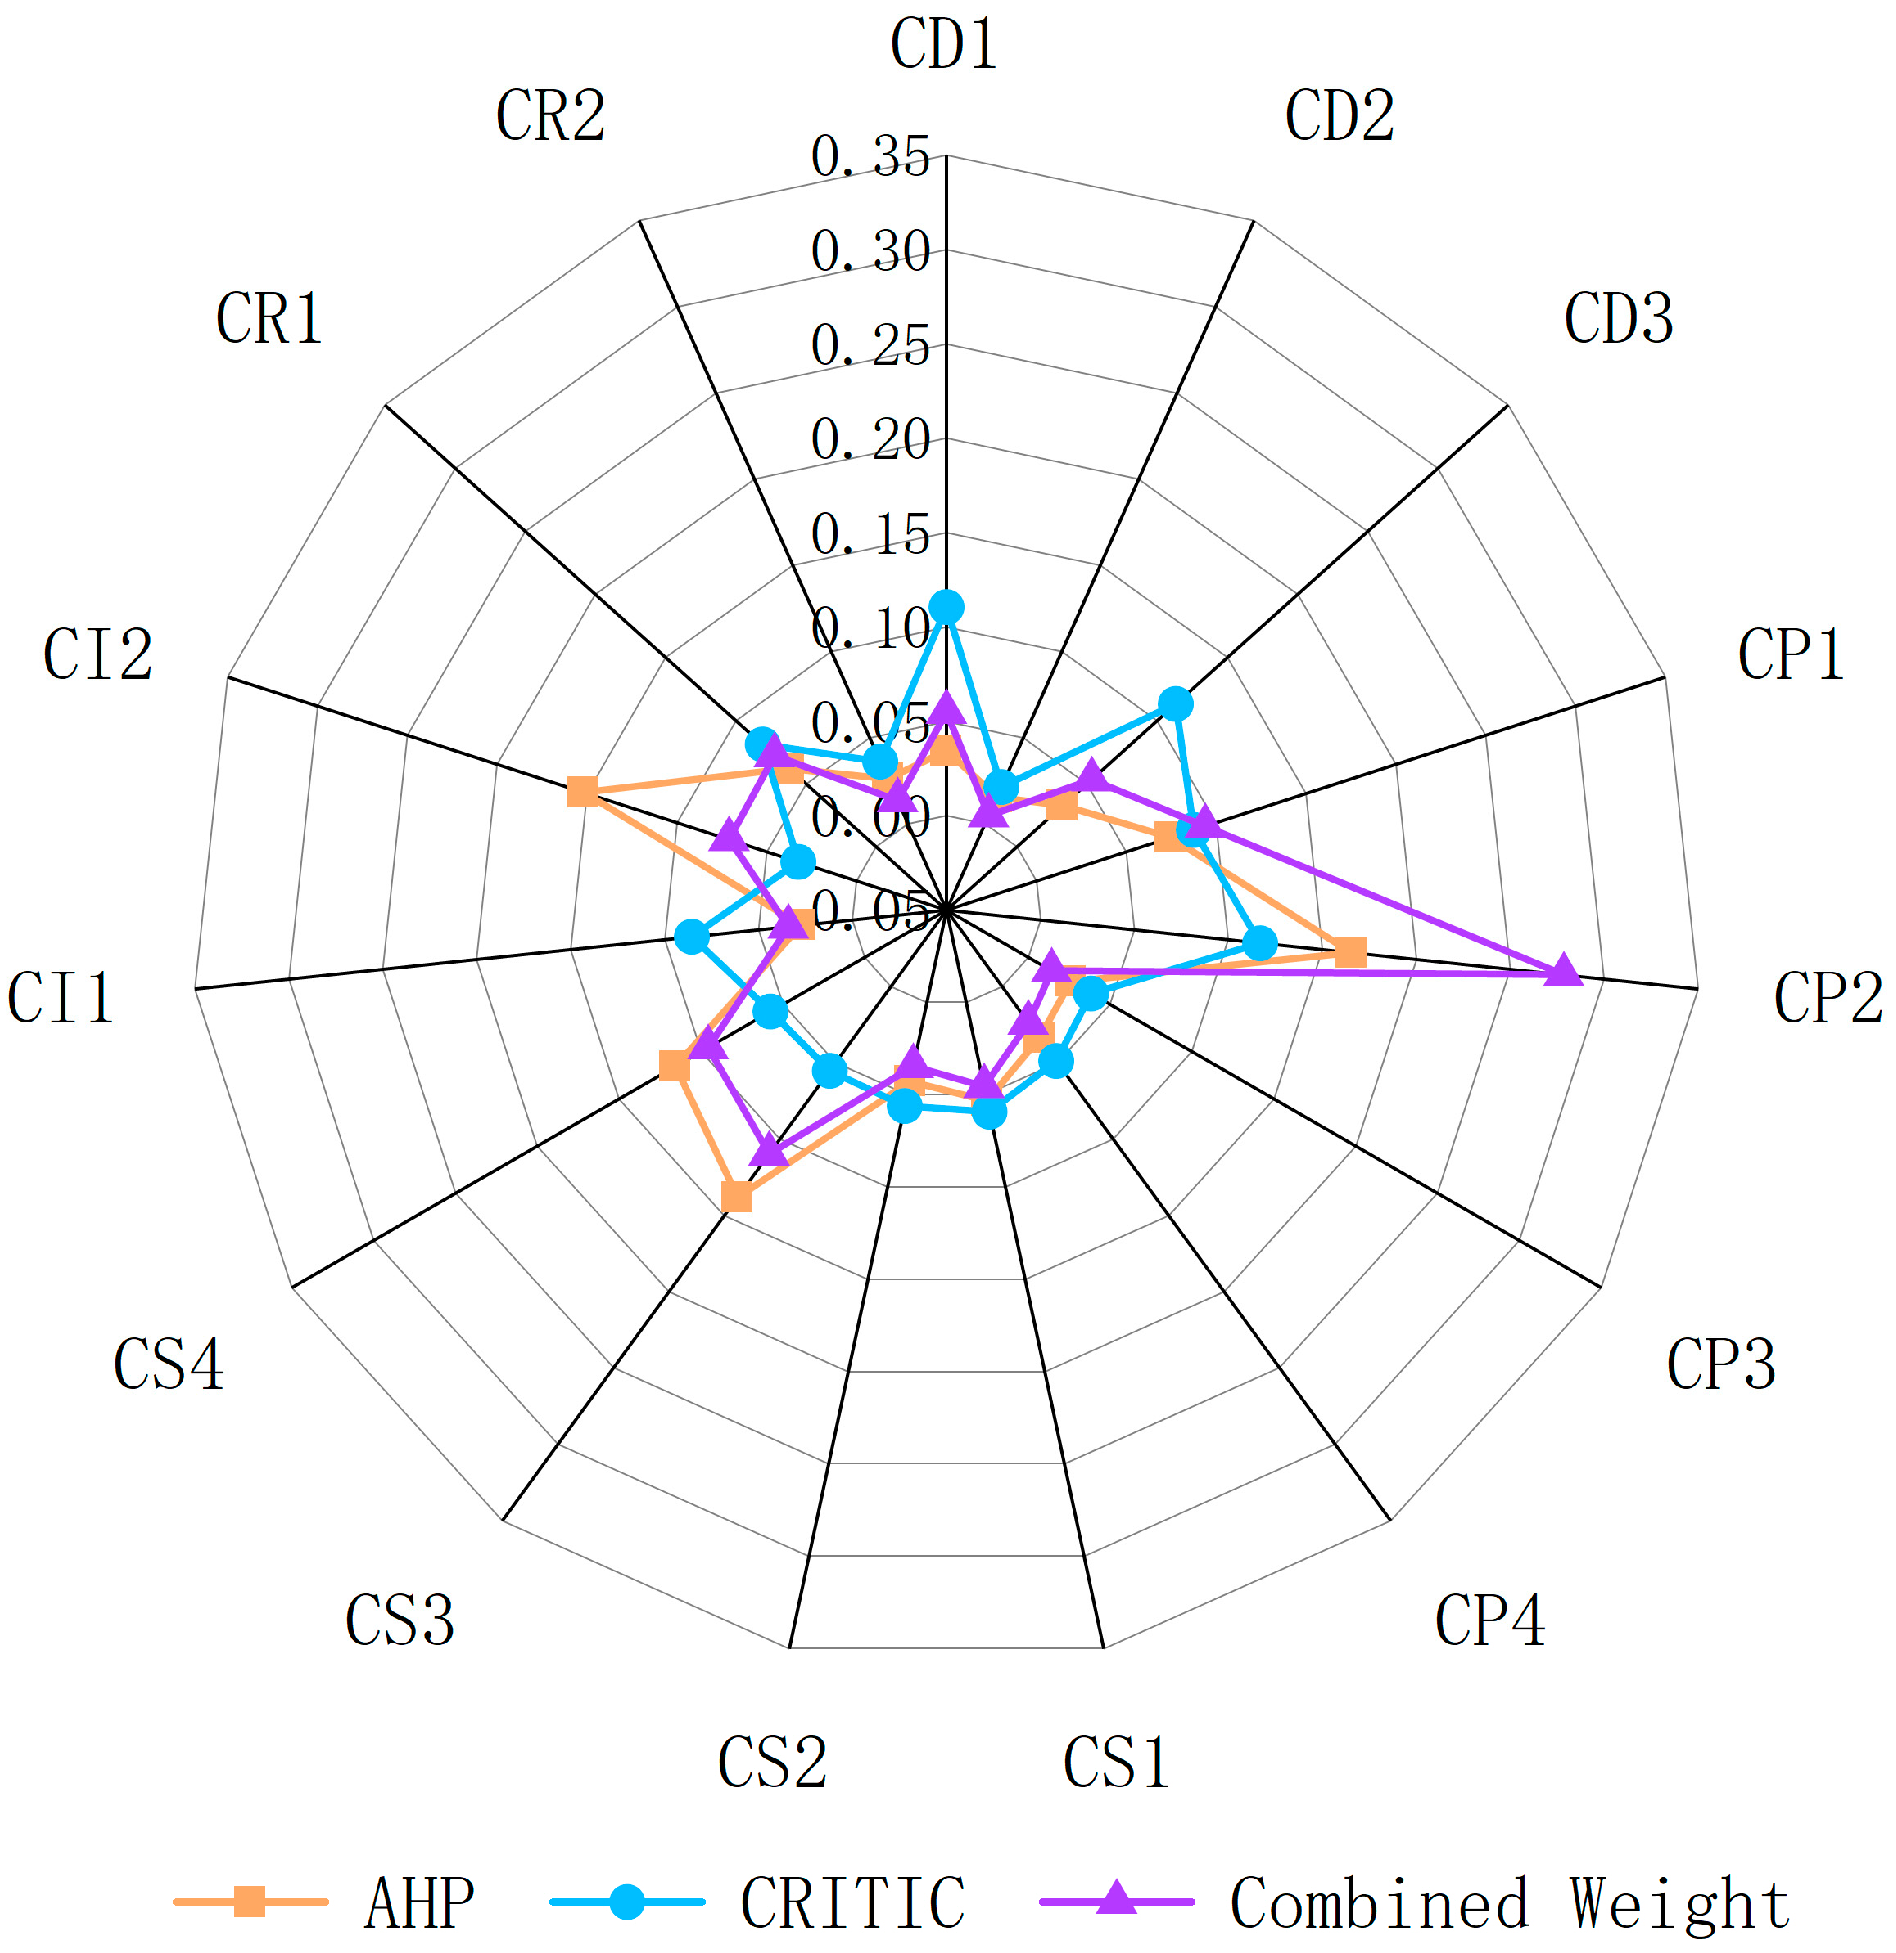
3.1. Subsystems and Weights of Evaluation Indicators
3.2. Analysis of the Comprehensive Health Index (CHI) for Each Subsystem
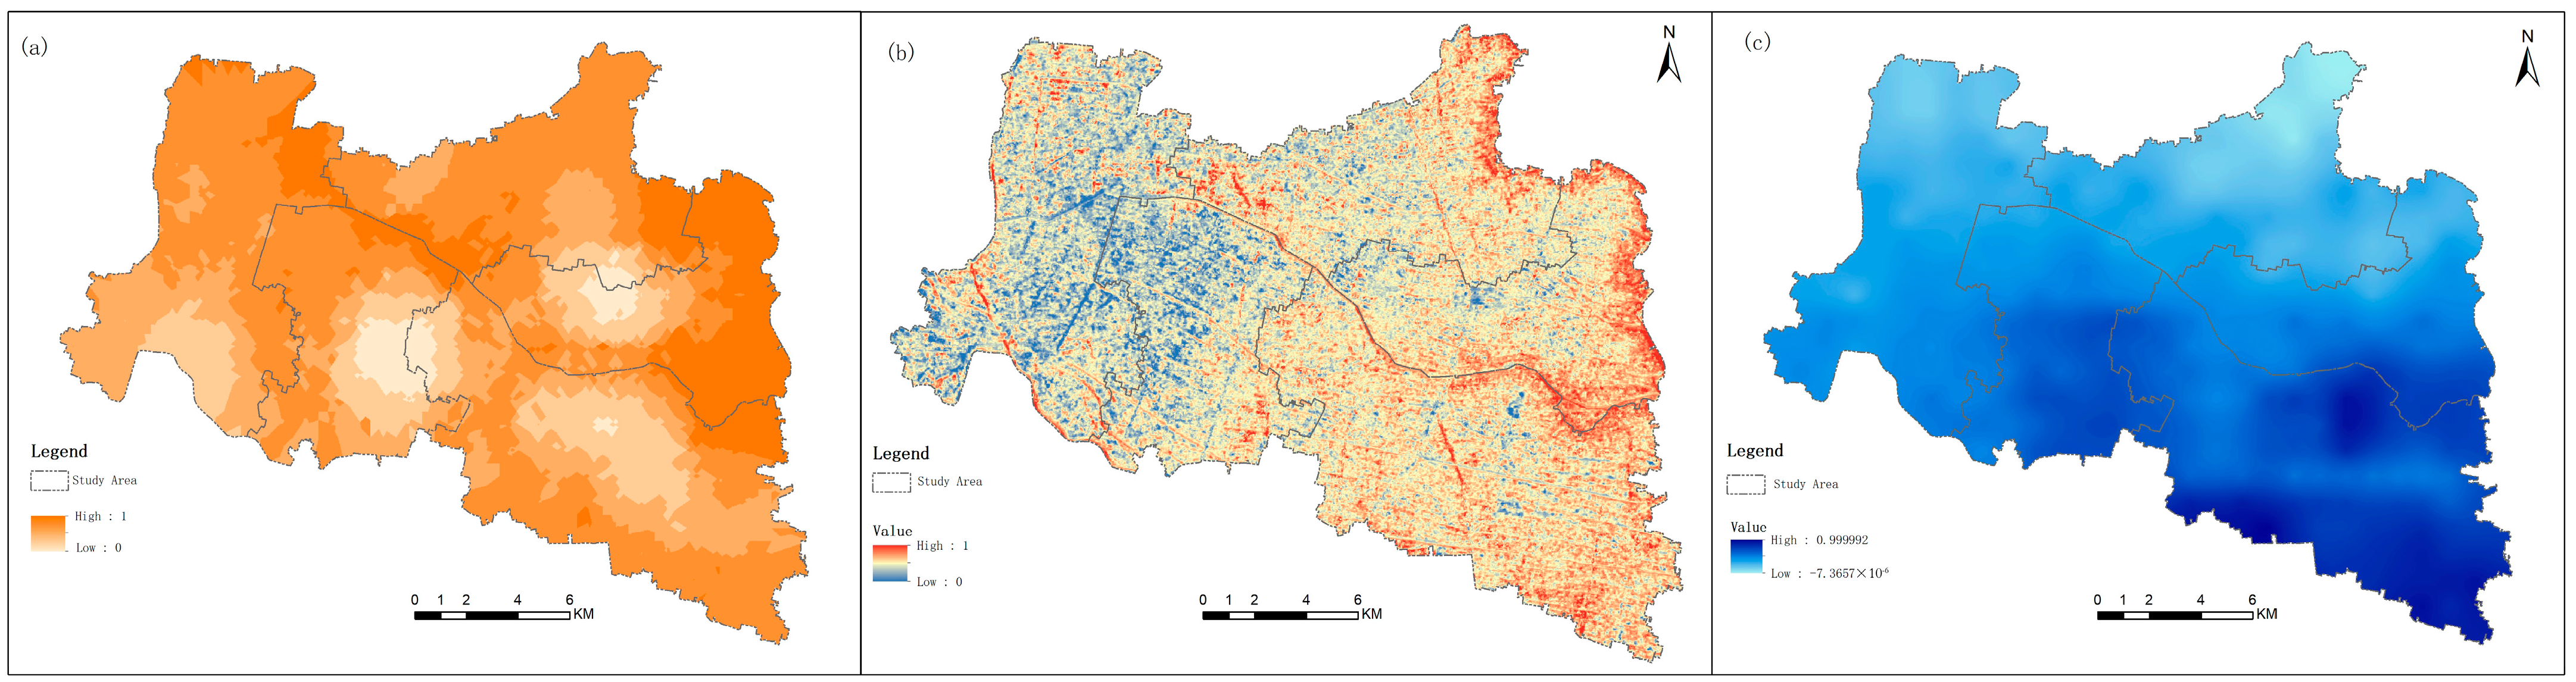
3.2.1. Driving Forces
3.2.2. Pressure
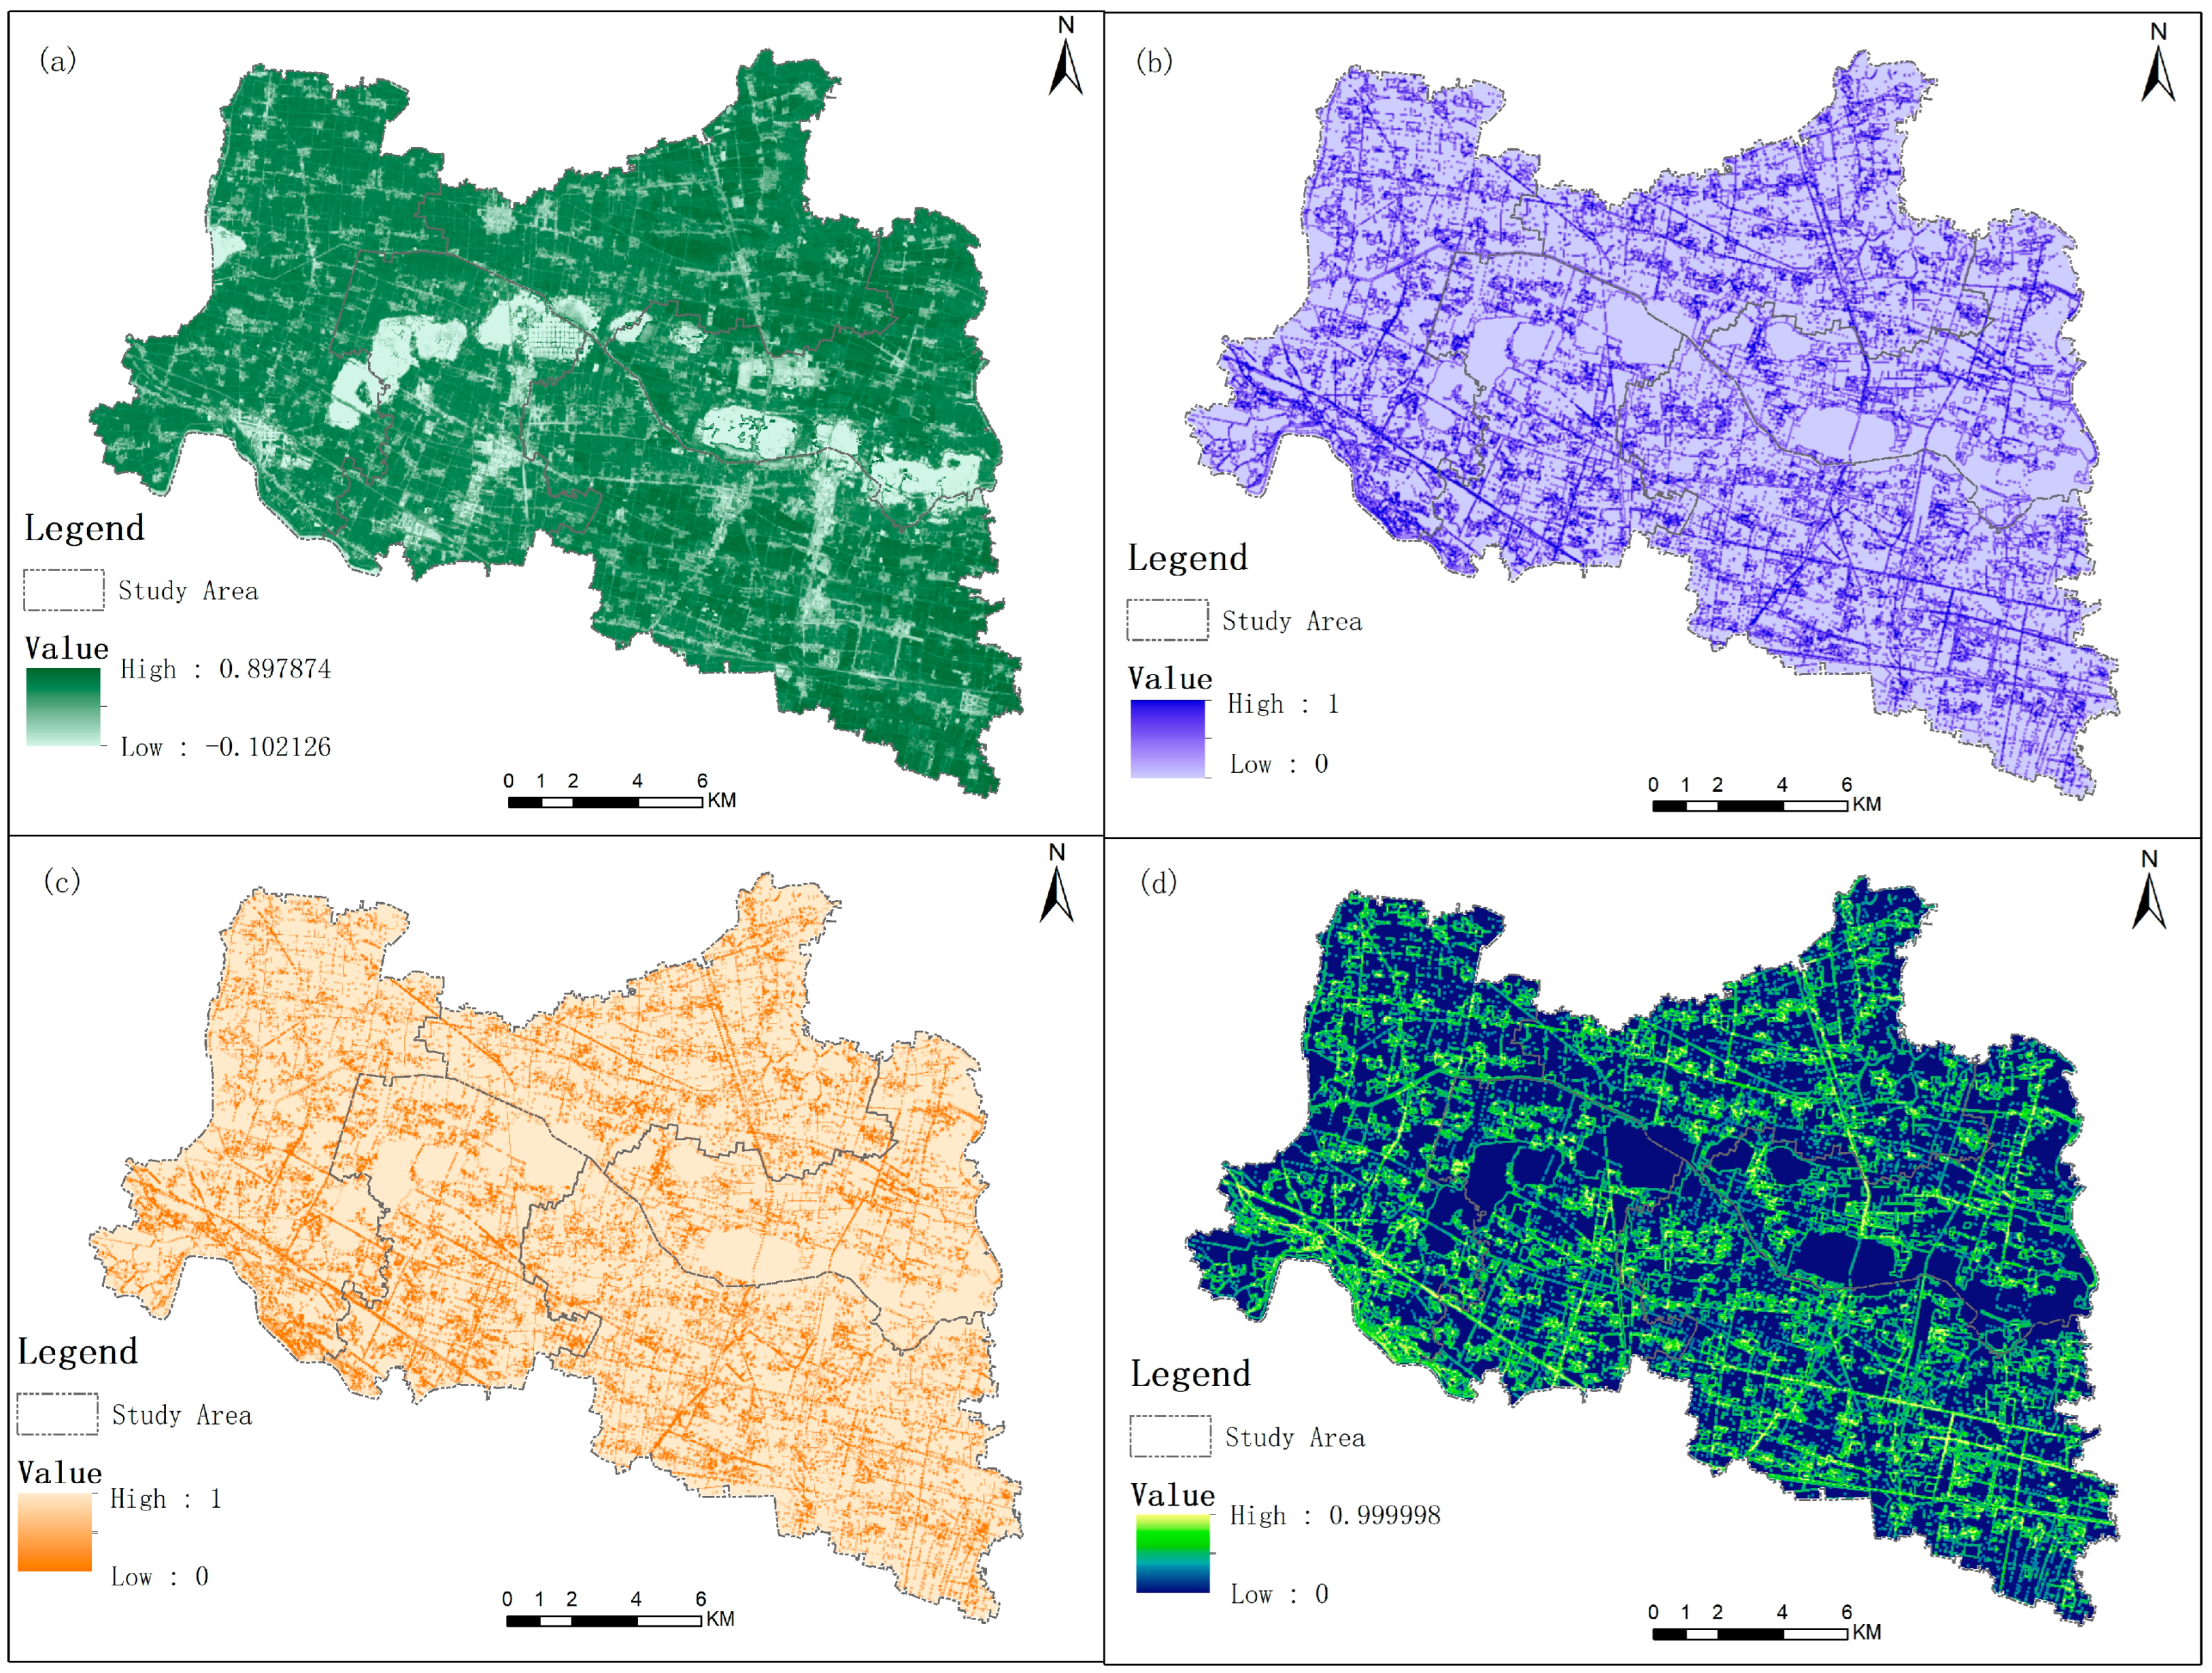
3.2.3. State
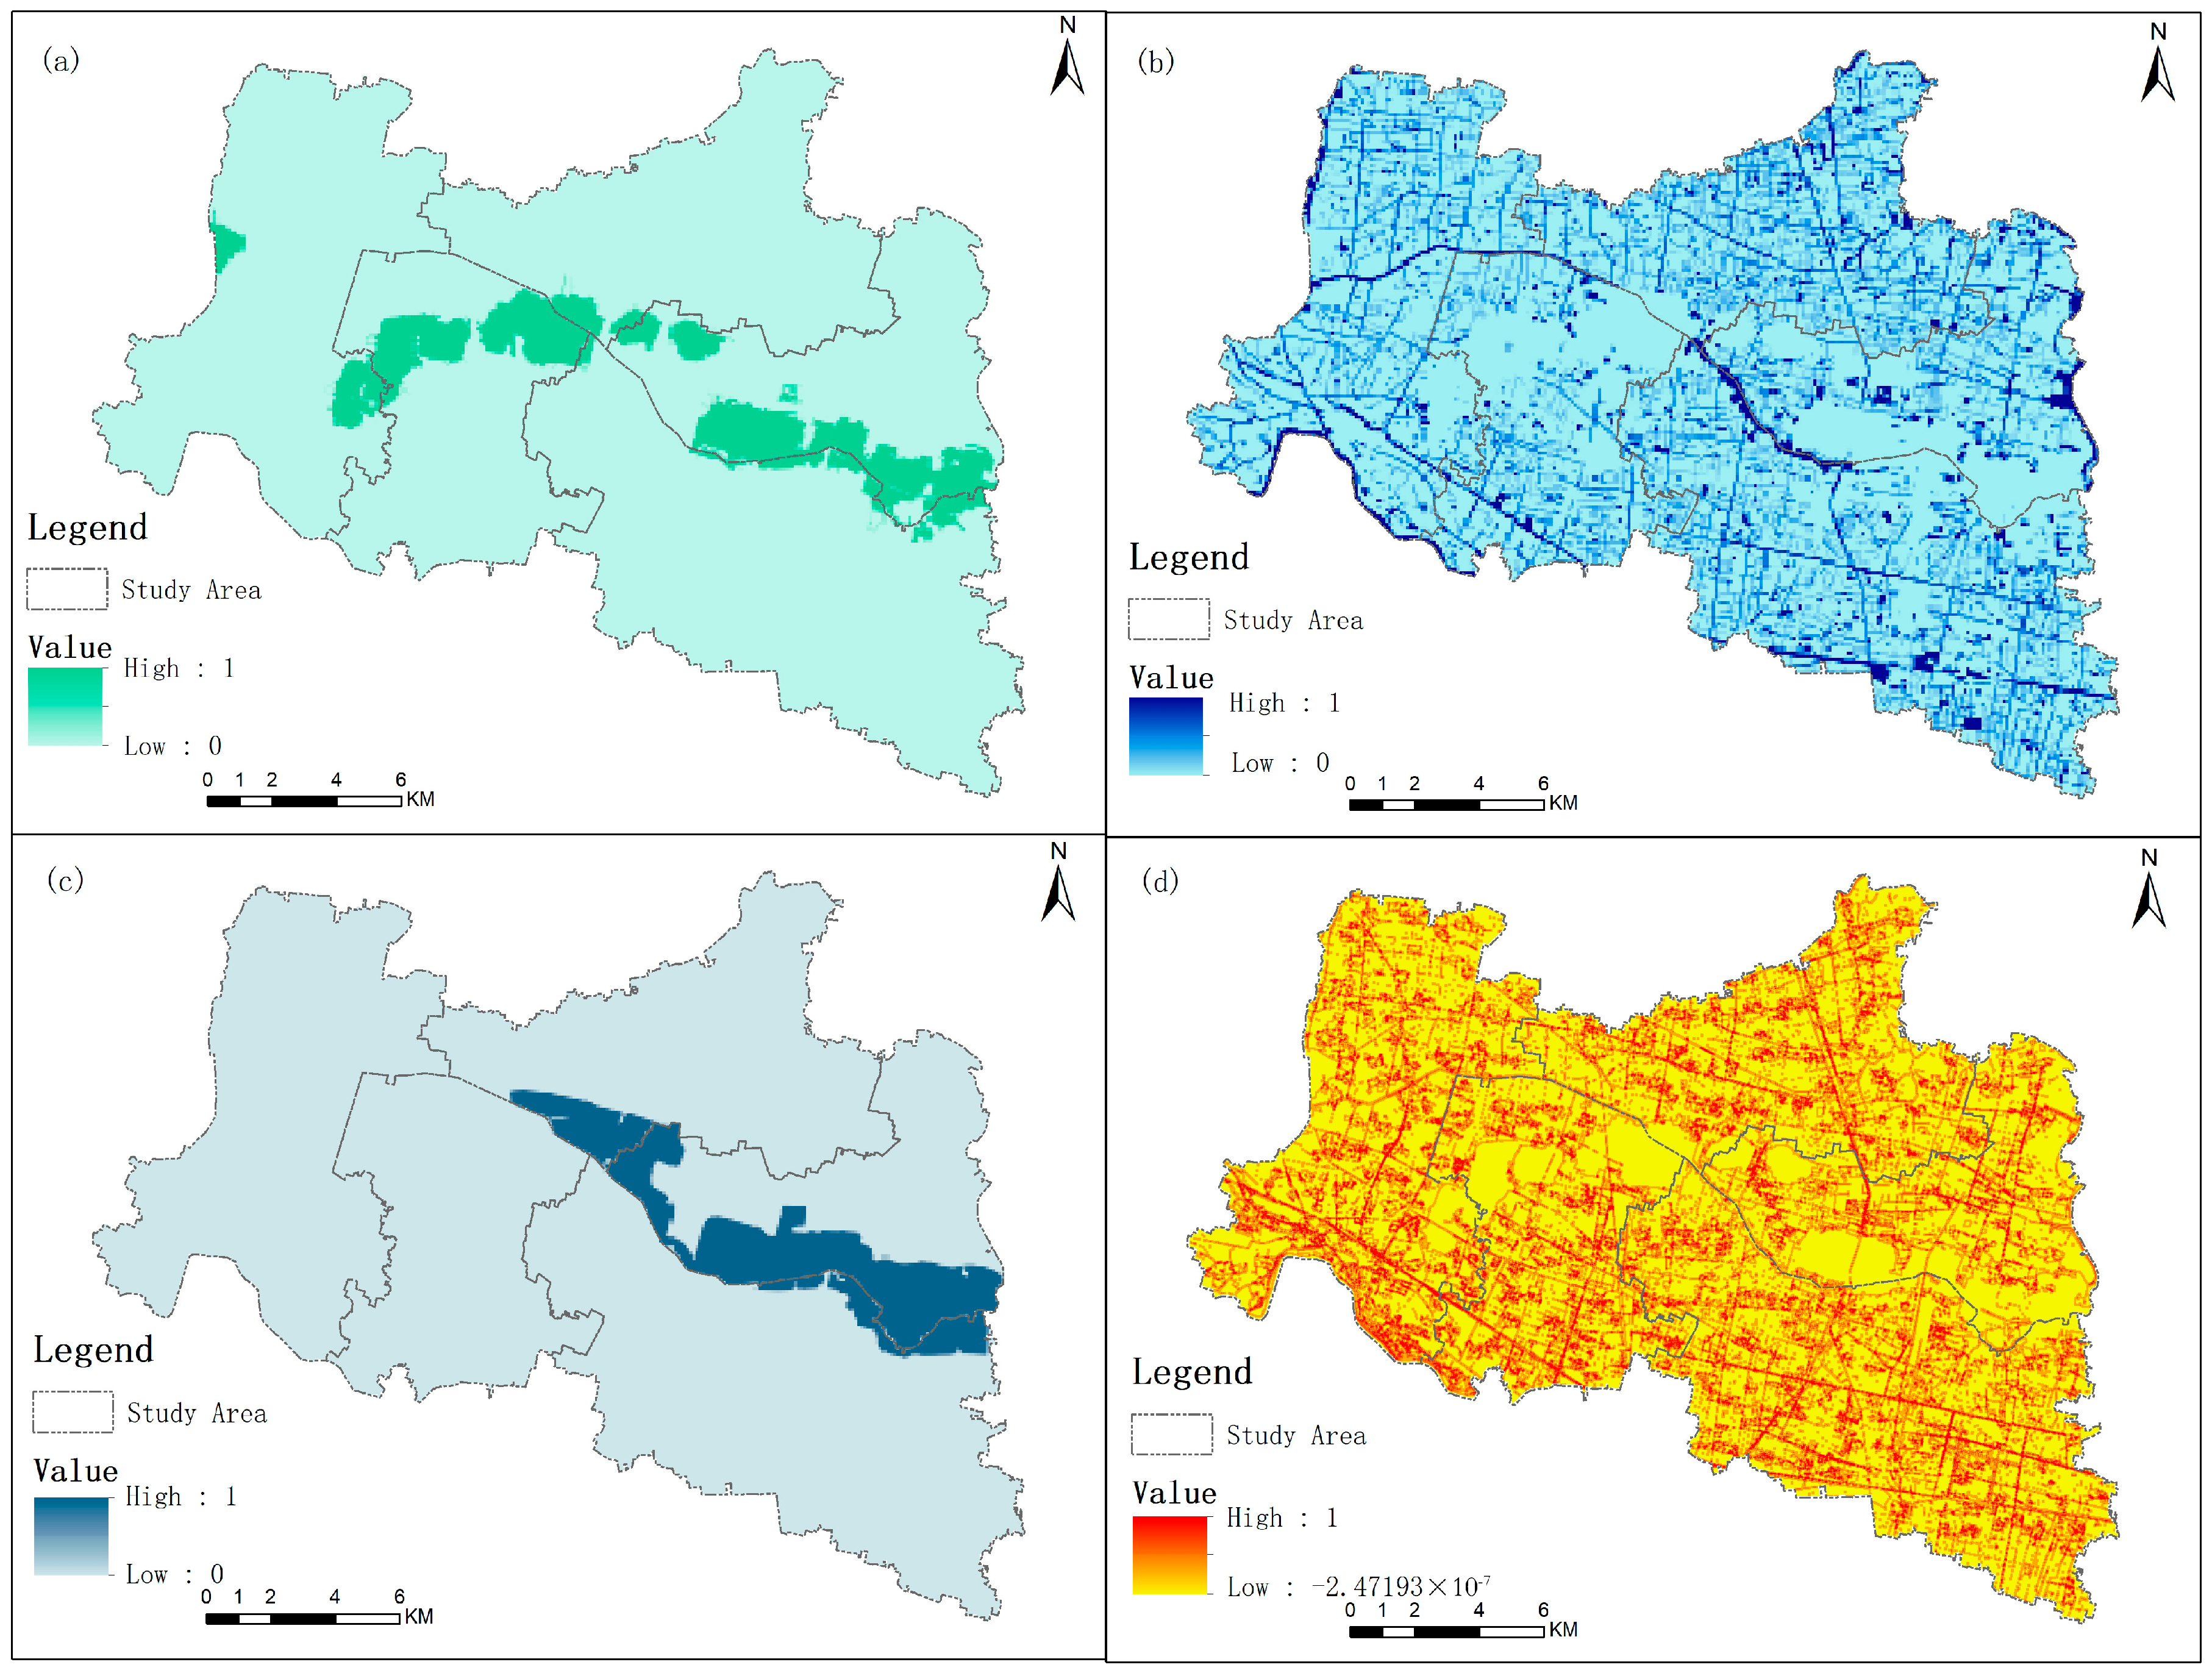
3.2.4. Impact and Response
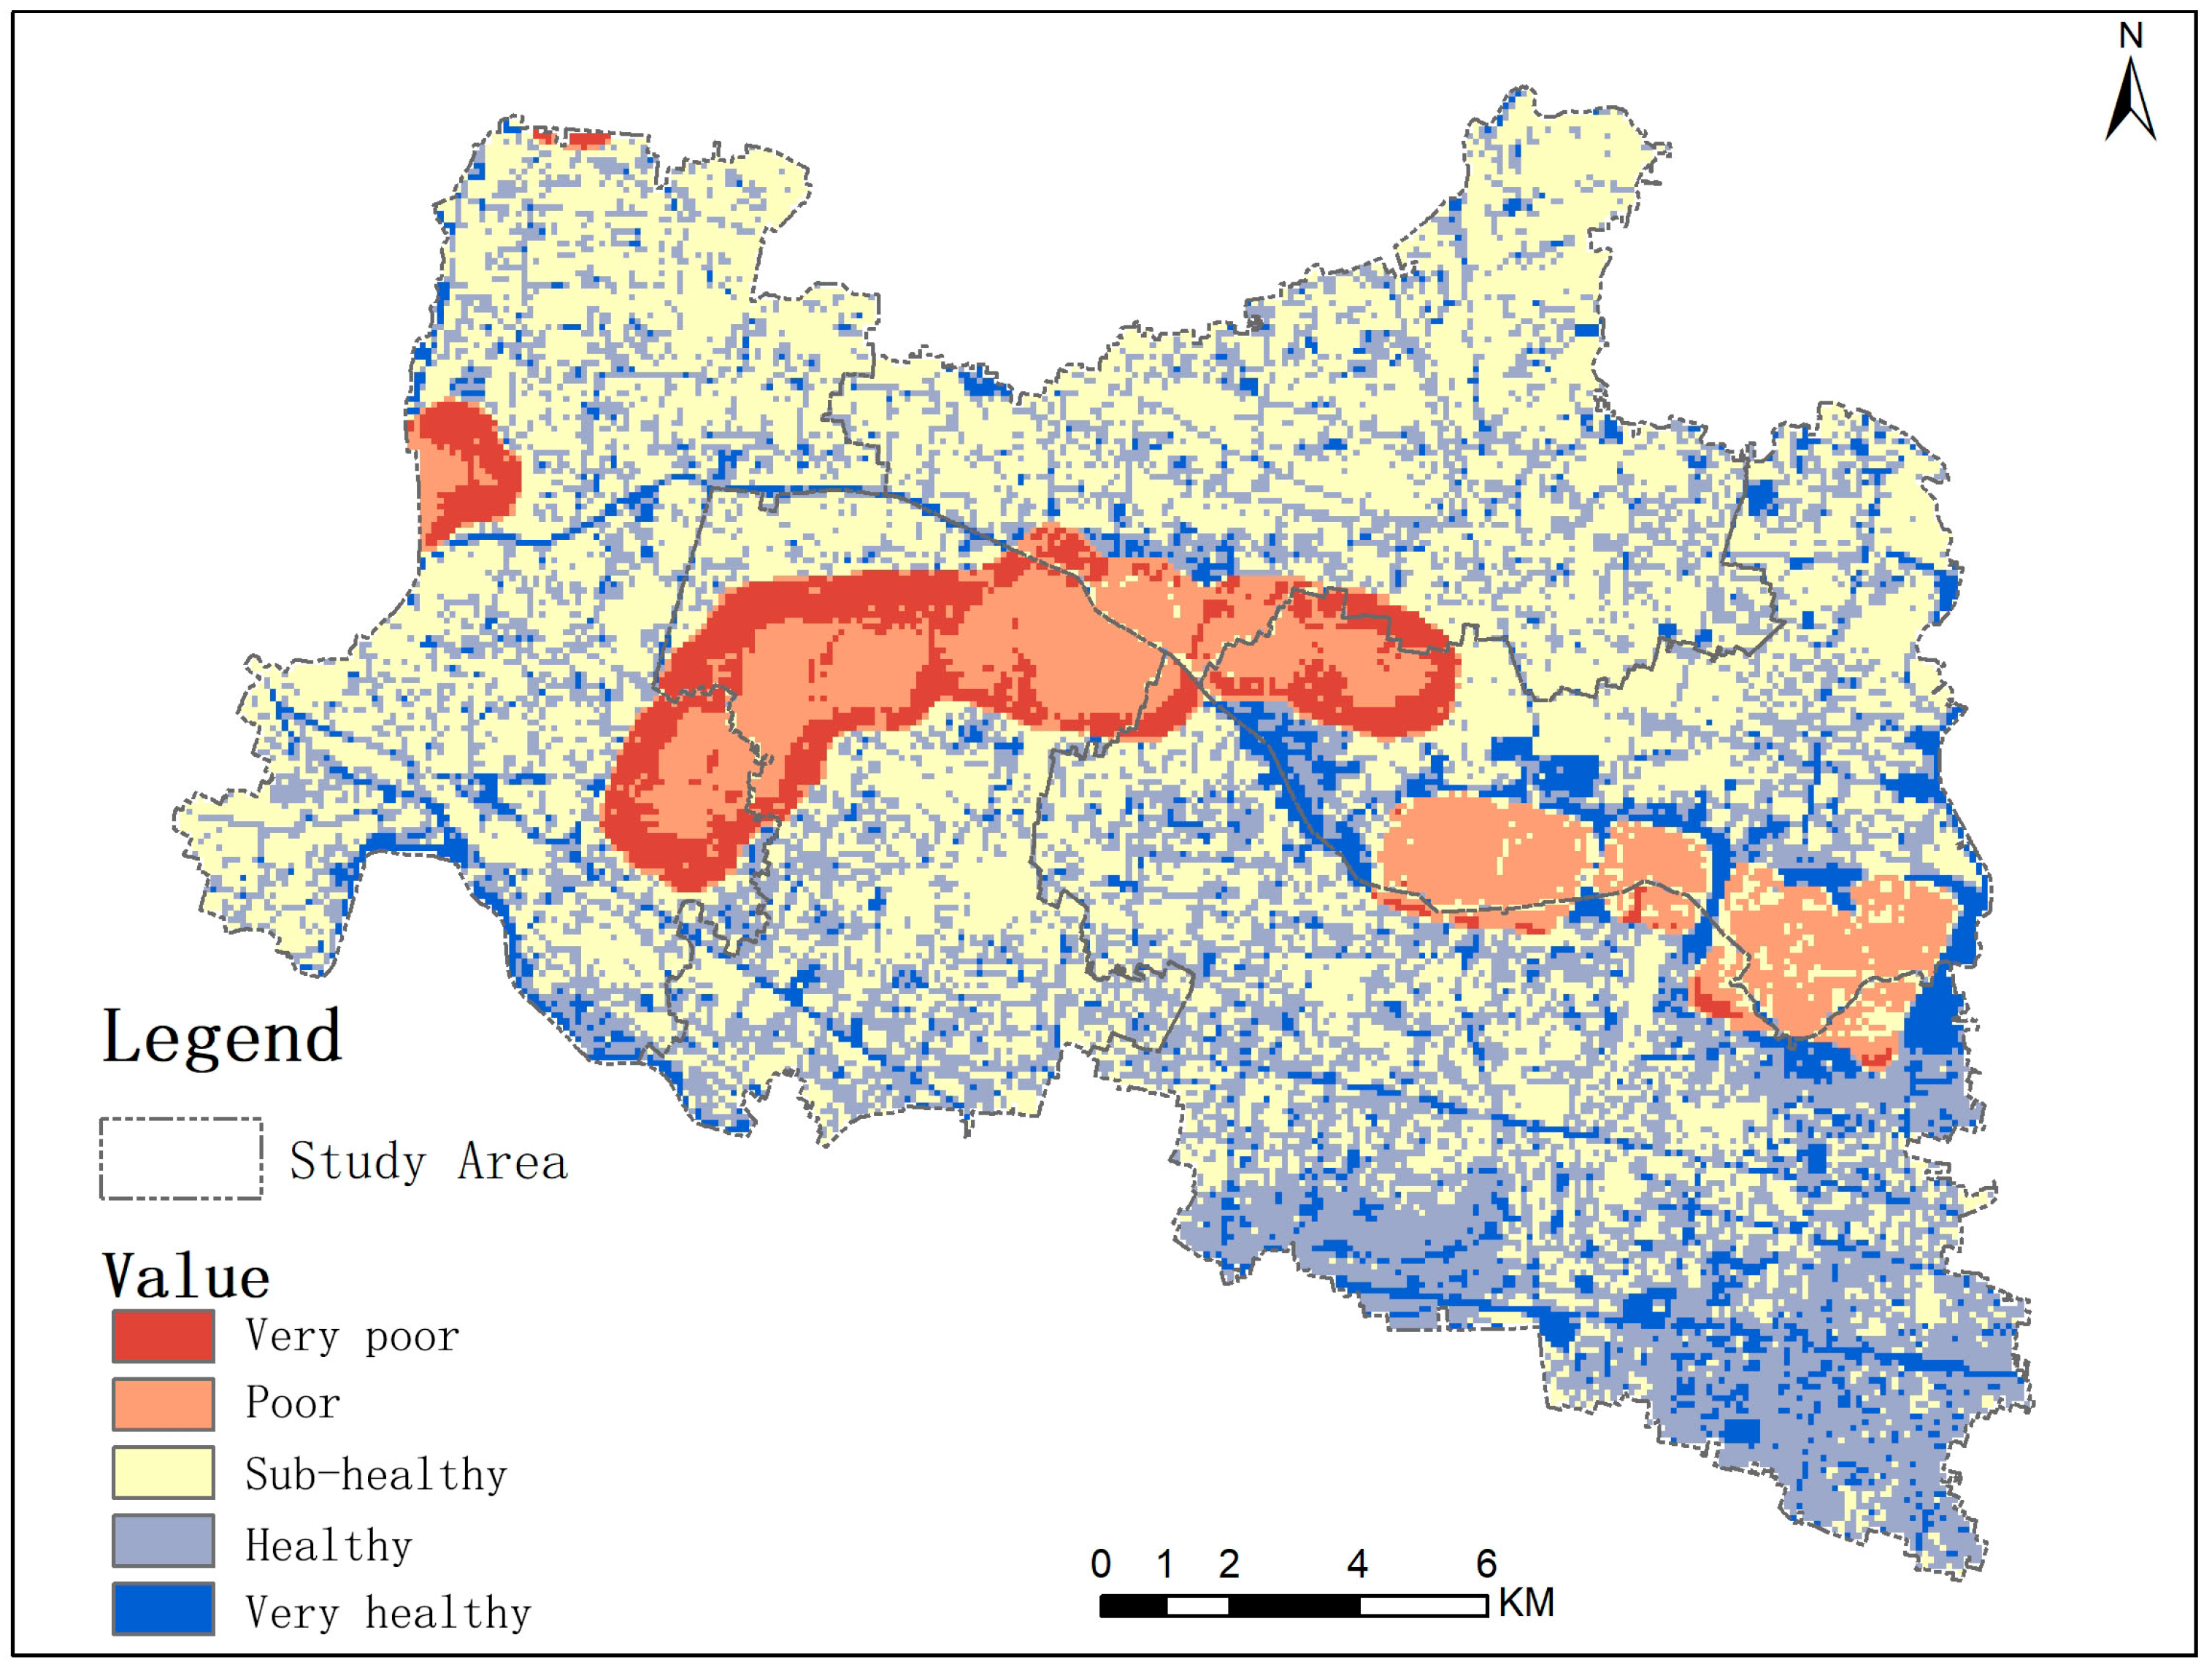
3.3. Comprehensive Health Index (CHI) of Subsidence Wetland
4. Discussion
4.1. Subsidence Wetland Ecological Health Assessment and Indicators
4.2. Planning Strategies of Coal Mining Subsidence Wetlands Based on CHI
4.3. Limitations and Future Directions
5. Conclusions
- 1.
- The weights of different indicators and subsystems on wetland ecological health vary. The Pressure and State subsystems have greater impact weights than other subsystems. Key factors affecting wetland ecological health include the regional development index (Cp1), mining subsidence disturbance intensity (Cp2), Aggregation Index (Cs3), Shannon Diversity Index (Cs4), and wetland conservation rate (Cr1).
- 2.
- Analysis of the health status of each subsystem reveals that the scores for “State”, “Impact”, and “Response” are relatively low. In addition, taking into account the spatial distribution of wetland ecosystem health and regional characteristics, strategies for the ecological restoration of coal mining subsidence wetlands have been suggested.
- 3.
- The CHI of coal mining subsidence wetlands is 0.517, indicating a sub-healthy status. Wetlands in sub-healthy, poor, and very poor conditions account for 58.20% of the total wetland area. This is mainly due to the fact that the wetlands in the study region continue to be impacted by ongoing mining operations, and the coal mining subsidence wetlands have yet to reach a state of stabilization. Strengthening ecosystem protection, systematic restoration, and comprehensive management in the region should be considered.
Author Contributions
Funding
Data Availability Statement
Acknowledgments
Conflicts of Interest
References
- Worlanyo, A.S.; Jiangfeng, L. Evaluating the Environmental and Economic Impact of Mining for Post-Mined Land Restoration and Land-Use: A Review. J. Environ. Manage. 2021, 279, 111623. [Google Scholar] [CrossRef] [PubMed]
- Xiao, W.; Zheng, W.; Zhao, Y.; Chen, J.; Hu, Z. Examining the Relationship between Coal Mining Subsidence and Crop Failure in Plains with a High Underground Water Table. J. Soils Sediments 2021, 21, 2908–2921. [Google Scholar] [CrossRef]
- Xu, J.; Zhao, H.; Yin, P.; Wu, L.; Li, G. Landscape Ecological Quality Assessment and Its Dynamic Change in Coal Mining Area: A Case Study of Peixian. Environ. Earth Sci. 2019, 78, 708. [Google Scholar] [CrossRef]
- Xu, T.; Weng, B.; Yan, D.; Wang, K.; Li, X.; Bi, W.; Li, M.; Cheng, X.; Liu, Y. Wetlands of International Importance: Status, Threats, and Future Protection. Int. J. Environ. Res. Public Health 2019, 16, 1818. [Google Scholar] [CrossRef]
- Blanchette, M.L.; Lund, M.A. Pit Lakes Are a Global Legacy of Mining: An Integrated Approach to Achieving Sustainable Ecosystems and Value for Communities. Curr. Opin. Environ. Sustain. 2016, 23, 28–34. [Google Scholar] [CrossRef]
- Lechner, A.M.; Baumgartl, T.; Matthew, P.; Glenn, V. The Impact of Underground Longwall Mining on Prime Agricultural Land: A Review and Research Agenda. Land Degrad. Dev. 2016, 27, 1650–1663. [Google Scholar] [CrossRef]
- Zhang, M.; Yuan, X.; Guan, D.; Liu, H.; Sun, K.; Zhang, G.; Wang, K.; Zhou, L.; Wang, F.; Sun, J. An Ecological Scenario Prediction Model for Newly Created Wetlands Caused by Coal Mine Subsidence in the Yanzhou, China. Environ. Geochem. Health 2020, 42, 1991–2005. [Google Scholar] [CrossRef]
- Feng, S.; Hou, W.; Chang, J. Changing Coal Mining Brownfields into Green Infrastructure Based on Ecological Potential Assessment in Xuzhou, Eastern China. Sustainability 2019, 11, 2252. [Google Scholar] [CrossRef]
- Darrah, S.E.; Shennan-Farpón, Y.; Loh, J.; Davidson, N.C.; Finlayson, C.M.; Gardner, R.C.; Walpole, M.J. Improvements to the Wetland Extent Trends (WET) Index as a Tool for Monitoring Natural and Human-Made Wetlands. Ecol. Indic. 2019, 99, 294–298. [Google Scholar] [CrossRef]
- Xiong, Y.; Mo, S.; Wu, H.; Qu, X.; Liu, Y.; Zhou, L. Influence of Human Activities and Climate Change on Wetland Landscape Pattern—A Review. Sci. Total Environ. 2023, 879, 163112. [Google Scholar] [CrossRef]
- Carrara, N.; Settell, K.; Andrews, B.; Buckalew, D.W.; Znosko, W.A. Expanding the Indicator Bacteria Concept: A Novel Approach to Assess Ecosystem Risk in Impaired Waters. J. Water Resour. Prot. 2015, 7, 938–955. [Google Scholar] [CrossRef]
- Howe, R.W.; Niemi, G.J.; Bracey, A.M.; Brady, V.; Elliott, L.; Fiorino, G.E.; Gaul, W.; Gehring, T.M.; Gnass Giese, E.E.; Lawrence, G.; et al. An Index of Biotic Condition (IBC) Using Birds as Indicators of Coastal Wetland Quality in North America’s Laurentian Great Lakes. Ecol. Indic. 2023, 156, 111174. [Google Scholar] [CrossRef]
- Rummell, A.J.; Borland, H.P.; Leon, J.X.; Henderson, C.J.; Gilby, B.L.; Ortodossi, N.L.; Mosman, J.D.; Gorissen, B.; Olds, A.D. Fish and Crustaceans Provide Early Indicators of Success in Wetland Restoration. Restor. Ecol. 2023, 31, e13952. [Google Scholar] [CrossRef]
- Duan, T.; Li, Y. A Multiscale Analysis of the Spatially Heterogeneous Relationships between Non-Point Source Pollution–Related Processes and Their Main Drivers in Chaohu Lake Watershed, China. Environ. Sci. Pollut. Res. 2023, 30, 86940–86956. [Google Scholar] [CrossRef]
- Kumar, R.; Horwitz, P.; Max Finlayson, C. 19—Wetlands as Social–Ecological Systems: Bridging Nature and Society. In Ramsar Wetlands; Gell, P.A., Davidson, N.C., Finlayson, C.M., Eds.; Elsevier: Amsterdam, The Netherlands, 2023; pp. 525–553. ISBN 978-0-12-817803-4. [Google Scholar]
- Malekmohammadi, B.; Jahanishakib, F. Vulnerability Assessment of Wetland Landscape Ecosystem Services Using Driver-Pressure-State-Impact-Response (DPSIR) Model. Ecol. Indic. 2017, 82, 293–303. [Google Scholar] [CrossRef]
- Hou, M.; Li, L.; Yu, H.; Jin, R.; Zhu, W. Ecological Security Evaluation of Wetlands in Changbai Mountain Area Based on DPSIRM Model. Ecol. Indic. 2024, 160, 111773. [Google Scholar] [CrossRef]
- Mohibul, S.; Sarif, M.N.; Parveen, N.; Khanam, N.; Siddiqui, M.A.; Naqvi, H.R.; Nasrin, T.; Siddiqui, L. Wetland Health Assessment Using DPSI Framework: A Case Study in Kolkata Metropolitan Area. Environ. Sci. Pollut. Res. 2023, 30, 107158–107178. [Google Scholar] [CrossRef]
- Li, Y.; Qin, L.; Wang, Y.; Liu, H.; Zhang, M.; Hao, H. Ecosystem Health Assessment of the Largest Lake Wetland in the Yellow River Basin Using an Improved Vigor-Organization-Resilience-Services Model. Ecol. Indic. 2024, 166, 112539. [Google Scholar] [CrossRef]
- Liu, L.; Lin, B.; Fang, Q.; Jiang, X. Effectiveness Assessment of China’s Coastal Wetland Ecological Restoration: A Meta-Analysis. Sci. Total Environ. 2024, 934, 173336. [Google Scholar] [CrossRef]
- Fang, X.-S.; Liu, S.; Chen, W.-Z.; Wu, R.-Z. An Effective Method for Wetland Park Health Assessment: A Case Study of the Guangdong Xinhui National Wetland Park in the Pearl River Delta, China. Wetlands 2021, 41, 44. [Google Scholar] [CrossRef]
- Hou, H.; Ding, Z.; Zhang, S.; Chen, Z.; Wang, X.; Sun, A.; An, S.; Xiong, J. Targeting the Influences of Under-Lake Coal Mining Based on the Value of Wetland Ecosystem Services: What and How? Land 2022, 11, 2166. [Google Scholar] [CrossRef]
- Wang, L.; Wang, L.; Yin, P.; Cui, H.; Liang, L.; Wang, Z. Value Assessment of Artificial Wetland Derived from Mining Subsided Lake: A Case Study of Jiuli Lake Wetland in Xuzhou. Sustainability 2017, 9, 1860. [Google Scholar] [CrossRef]
- Mosaffaie, J.; Salehpour Jam, A.; Tabatabaei, M.R.; Kousari, M.R. Trend Assessment of the Watershed Health Based on DPSIR Framework. Land Use Policy 2021, 100, 104911. [Google Scholar] [CrossRef]
- Wei, X.; Wang, J.; Wu, S.; Xin, X.; Wang, Z.; Liu, W. Comprehensive Evaluation Model for Water Environment Carrying Capacity Based on VPOSRM Framework: A Case Study in Wuhan, China. Sustain. Cities Soc. 2019, 50, 101640. [Google Scholar] [CrossRef]
- Yao, S.; Li, Y.; Quan, X.; Xu, J. Applying the Driver-Pressure-State-Impact-Response Model to Ecological Restoration: A Case Study of Comprehensive Zoning and Benefit Assessment in Zhejiang Province, China. Glob. Ecol. Conserv. 2024, 55, e03222. [Google Scholar] [CrossRef]
- Hotaiba, A.M.; Salem, B.B.; Halmy, M.W.A. Assessment of Wetland Ecosystem’s Health Using Remote Sensing—Case Study: Burullus Wetland—Ramsar Site. Estuaries Coasts 2024, 47, 201–215. [Google Scholar] [CrossRef]
- Jia, H.; Pan, D.; Zhang, W. Health Assessment of Wetland Ecosystems in the Heilongjiang River Basin, China. Wetlands 2015, 35, 1185–1200. [Google Scholar] [CrossRef]
- Hou, M.; Liu, H.; Zhang, H.; Wang, C.; Tan, Q. Influences of topographic features on the distribution and evolution of landscape in the coastal wetland of Yancheng. Acta Ecol. Sin. 2013, 33, 3765–3773. [Google Scholar] [CrossRef]
- Yang, M.; Gong, J.; Zhao, Y.; Wang, H.; Zhao, C.; Yang, Q.; Yin, Y.; Wang, Y.; Tian, B. Landscape Pattern Evolution Processes of Wetlands and Their Driving Factors in the Xiong’an New Area of China. Int. J. Environ. Res. Public. Health 2021, 18, 4403. [Google Scholar] [CrossRef]
- Huang, X.; Wu, Z.; Zhang, Q.; Cao, Z. How to Measure Wetland Destruction and Risk: Wetland Damage Index. Ecol. Indic. 2022, 141, 109126. [Google Scholar] [CrossRef]
- Zhou, S.; Chang, J.; Luo, P.; Kang, Y.; Li, S. Landscape Dynamics and Human Disturbance Processes in Wetlands in a Mining City: A Case Study in Huaibei, China. Environ. Monit. Assess. 2023, 195, 192. [Google Scholar] [CrossRef] [PubMed]
- Zhu, Y.; Gu, C.; Li, X.; Zhou, T.; Feng, Y. Evaluation of wetland ecological security in Wujiang District of Suzhou based on DPSIRM model. J. Zhejiang AF Univ. 2022, 39, 1114–1123. [Google Scholar]
- Li, Y.; Zhang, R. Water Ecosystem Resilience Evaluation and Blue-Green Enhancement Strategy in Tianjin from the Perspective of Social-Ecological Resilience. In International Conference on Urban Climate, Sustainability and Urban Design; He, B.-J., Prasad, D., Yan, L., Cheshmehzangi, A., Pignatta, G., Eds.; Lecture Notes in Civil Engineering; Springer Nature Singapore: Singapore, 2025; Volume 559, pp. 884–902. ISBN 978-981-97-8400-4. [Google Scholar]
- Lin, W.; Cen, J.; Xu, D.; Du, S.; Gao, J. Wetland Landscape Pattern Changes over a Period of Rapid Development (1985–2015) in the ZhouShan Islands of Zhejiang Province, China. Estuar. Coast. Shelf Sci. 2018, 213, 148–159. [Google Scholar] [CrossRef]
- Wu, A.; Li, J.; Zhang, D.; Chen, M.; Fan, M.; Yang, B.; Yu, J.; Gao, Y.; Li, L.; Xie, Z. Dynamics Analysis of Spatial Distribution and Landscape Pattern of Wetlands in the Weihe River Basin from 1980 to 2020. Sustainability 2025, 17, 544. [Google Scholar] [CrossRef]
- Zhou, K. Wetland Landscape Pattern Evolution and Prediction in the Yellow River Delta. Appl. Water Sci. 2022, 12, 190. [Google Scholar] [CrossRef]
- Xu, H.; Zhou, L.; Cheng, Q. Study on ecosystem health evaluation and risk assessment for Linghekou wetlands based on a PSR model. Acta Ecol. Sin. 2017, 37, 8264–8274. [Google Scholar]
- Zhao, C.; Pan, T.; Dou, T.; Liu, J.; Liu, C.; Ge, Y.; Zhang, Y.; Yu, X.; Mitrovic, S.; Lim, R. Making Global River Ecosystem Health Assessments Objective, Quantitative and Comparable. Sci. Total Environ. 2019, 667, 500–510. [Google Scholar] [CrossRef]
- Saaty, T.L.; Peniwati, K.; Shang, J.S. The Analytic Hierarchy Process and Human Resource Allocation: Half the Story. Math. Comput. Model. 2007, 46, 1041–1053. [Google Scholar] [CrossRef]
- Diakoulaki, D.; Mavrotas, G.; Papayannakis, L. Determining Objective Weights in Multiple Criteria Problems: The Critic Method. Comput. Oper. Res. 1995, 22, 763–770. [Google Scholar] [CrossRef]
- Wang, C.; Wang, L.; Gu, T.; Yin, J.; Hao, E. CRITIC-TOPSIS-Based Evaluation of Smart Community Safety: A Case Study of Shenzhen, China. Buildings 2023, 13, 476. [Google Scholar] [CrossRef]
- Li, J.; Zou, Y.; Li, J.; Si, S. Urban Spatial, Engineering and Management Resilience Capacity Enhancement from a Flood Safety Perspective. Water-Energy Nexus 2024, 7, 213–226. [Google Scholar] [CrossRef]
- Xu, Y.; Liu, R.; Xue, C.; Xia, Z. Ecological Sensitivity Evaluation and Explanatory Power Analysis of the Giant Panda National Park in China. Ecol. Indic. 2023, 146, 109792. [Google Scholar] [CrossRef]
- Li, L.; Li, G.; Cui, L.; He, L.; Chen, Y. Method for Modelling Ecological Competition Based on Pareto Optimality: A Case Study of Coastal Wetlands in Jiangsu Province, China. Ecol. Indic. 2021, 129, 107946. [Google Scholar] [CrossRef]
- Yan, Y.; Wang, N.; Cao, Y. Evaluation of Ecological Restoration Effects and Diagnosis of Obstacle Factors in Coastal Zones: A Case Study of Qinhuangdao City. Mar. Econ. Manag. 2024, 7, 1–17. [Google Scholar] [CrossRef]
- Sun, T.; Lin, W.; Chen, G.; Guo, P.; Zeng, Y. Wetland Ecosystem Health Assessment through Integrating Remote Sensing and Inventory Data with an Assessment Model for the Hangzhou Bay, China. Sci. Total Environ. 2016, 566–567, 627–640. [Google Scholar] [CrossRef]
- Liu, W.; Guo, Z.; Jiang, B.; Lu, F.; Wang, H.; Wang, D.; Zhang, M.; Cui, L. Improving Wetland Ecosystem Health in China. Ecol. Indic. 2020, 113, 106184. [Google Scholar] [CrossRef]
- Yang, Z.; Bai, J.; Zhang, W. Mapping and Assessment of Wetland Conditions by Using Remote Sensing Images and POI Data. Ecol. Indic. 2021, 127, 107485. [Google Scholar] [CrossRef]
- Zhang, Y.; Yan, J.; Cheng, X. Advances in impact of climate change and human activities on wetlands on the Tibetan Plateau. Acta Ecol. Sin. 2023, 43, 2180–2193. [Google Scholar]
- Wu, C.; Chen, W. Indicator System Construction and Health Assessment of Wetland Ecosystem——Taking Hongze Lake Wetland, China as an Example. Ecol. Indic. 2020, 112, 106164. [Google Scholar] [CrossRef]
- Gao, Z.; Li, C.; Zou, S.; Xie, X.; Wang, Y.; Shen, N.; Zhang, X.; Li, M. Riverine Wetland Dynamics and Health Assessment: A Case Study in the Urban Agglomerations along the Yellow River in China’s Ningxia Hui Autonomous Region. Ecol. Indic. 2024, 162, 111965. [Google Scholar] [CrossRef]
- de Mello, K.; Luiz, O.; Garcia, E.A.; Richards, A.E. Topic Modelling of the Wetland Condition Assessment Literature Reveals Trends, Key Gaps, and Opportunities for Combining Different Assessment Techniques. Ecol. Indic. 2025, 171, 113141. [Google Scholar] [CrossRef]
- Das, U.; Behera, B. Geospatial Assessment of Ecological Vulnerability of Fragile Eastern Duars Forest Integrating GIS-Based AHP, CRITIC and AHP-TOPSIS Models. Geomat. Nat. Hazards Risk 2024, 15, 2330529. [Google Scholar] [CrossRef]
- He, T.; Xiao, W.; Zhao, Y.; Chen, W.; Deng, X.; Zhang, J. Continues Monitoring of Subsidence Water in Mining Area from the Eastern Plain in China from 1986 to 2018 Using Landsat Imagery and Google Earth Engine. J. Clean. Prod. 2021, 279, 123610. [Google Scholar] [CrossRef]
- Van Asselen, S.; Verburg, P.H.; Vermaat, J.E.; Janse, J.H. Drivers of Wetland Conversion: A Global Meta-Analysis. PLoS ONE 2013, 8, e81292. [Google Scholar] [CrossRef] [PubMed]
- Wang, C.; Ma, L.; Zhang, Y.; Chen, N.; Wang, W. Spatiotemporal Dynamics of Wetlands and Their Driving Factors Based on PLS-SEM: A Case Study in Wuhan. Sci. Total Environ. 2022, 806, 151310. [Google Scholar] [CrossRef]
- Zhang, J.; Fu, M.; Hassani, F.P.; Zeng, H.; Geng, Y.; Bai, Z. Land Use-Based Landscape Planning and Restoration in Mine Closure Areas. Environ. Manage. 2011, 47, 739–750. [Google Scholar] [CrossRef]
- Sun, R.; Zhu, X.; Zhang, P.; Liang, M.; Zhang, X.; Ning, Z.; Peng, X.; Liu, H.; Yang, X.; Huang, W.; et al. Study on temporal and spatial evolution characteristics of water accumulation in coal mining subsidence area with high groundwater level:taking Anhui Province Mining Area as an example. Coal Sci. Technol. 2022, 50, 215–224. [Google Scholar] [CrossRef]
- Yang, Y.; Zhang, Y.; Su, X.; Hou, H.; Zhang, S. The Spatial Distribution and Expansion of Subsided Wetlands Induced by Underground Coal Mining in Eastern China. Environ. Earth Sci. 2021, 80, 112. [Google Scholar] [CrossRef]
- Cun, D.; Deng, S.; Li, X.; Yang, F.; Chang, J.; Duan, P.; Duan, C. High Acidity Notably Influences Acid Mine Drainage Treatment Performance in Constructed Wetlands Packed with Composite Organic Substrates by Affecting Both Abiotic and Biotic Routes. Chem. Eng. J. 2024, 496, 153836. [Google Scholar] [CrossRef]
- Pat-Espadas, A.M.; Loredo Portales, R.; Amabilis-Sosa, L.E.; Gómez, G.; Vidal, G. Review of Constructed Wetlands for Acid Mine Drainage Treatment. Water 2018, 10, 1685. [Google Scholar] [CrossRef]
- Chen, Y.; Chang, J.; Li, Z.; Ming, L.; Li, C. Influence of Land Use Change on Habitat Quality: A Case Study of Coal Mining Subsidence Areas. Environ. Monit. Assess. 2024, 196, 535. [Google Scholar] [CrossRef] [PubMed]
- Zhu, X.; Li, J.; Cheng, H.; Zheng, L.; Huang, W.; Yan, Y.; Liu, H.; Yang, X. Assessing the Impacts of Ecological Governance on Carbon Storage in an Urban Coal Mining Subsidence Area. Ecol. Inform. 2022, 72, 101901. [Google Scholar] [CrossRef]
- Li, J.; Pei, Y.; Zhao, S.; Xiao, R.; Sang, X.; Zhang, C. A Review of Remote Sensing for Environmental Monitoring in China. Remote Sens. 2020, 12, 1130. [Google Scholar] [CrossRef]
- Zhang, X.; Chen, X.; Zhou, Y.; Chen, Y.; Long, L.; Hu, P. Prediction of the Temporal and Spatial Evolution of Subsidence Waters in the Huainan Mining Area Based on the CA–Markov Model. Environ. Dev. Sustain. 2024. [Google Scholar] [CrossRef]
- Cong, Z.; Yang, S.; Zhu, B.; Wang, Y.; Liu, J. Identification of Key Ecological Restoration Areas Based on Ecological Security Patterns and Territorial Spatial Ecological Restoration Zoning: A Case Study of the Middle and Lower Reaches of the Yellow River in China. J. Nat. Conserv. 2025, 84, 126793. [Google Scholar] [CrossRef]


| Type | Data | Resolution | Time | Source |
|---|---|---|---|---|
| Land use | Land use | 30 m | 2023 | China Center for Geographic Information and Research (https://www.resdc.cn/, accessed on 19 September 2024) |
| Wetland category | LANDSAT-8 (OLI/TIRS) | 30 m | 2023 | United States Geological Survey (USGS) (https://earthexplorer.usgs.gov/, accessed on 19 September 2024) |
| Environmental | Precipitation | 1 km | 2023 | National Tibetan Plateau Data Center (https://data.tpdc.ac.cn/home, accessed on 17 March 2025) |
| Digital Elevation Model (DEM) | 30 m | 2023 | Geospatial Data Cloud (http://www.gscloud.cn/, accessed on 19 September 2024) | |
| Normalized Difference Vegetation Index (NDVI) | 30 m | 2023 | China Center for Geographic Information and Research (https://www.resdc.cn/, accessed on 19 September 2024) | |
| Socio-economics | Population | 1 km | 2023 | LandScan (https://landscan.ornl.gov/, accessed on 17 March 2025) |
| Road | 1:3000 | 2023 | Open Street Map (https://www.openstreetmap.org/, accessed on 19 September 2024) | |
| Wetland Conservation Area | 1:3000 | 2019 | Master Plan for Anhui Digou National Wetland Park (2019–2023) | |
| Planning | Subsidence areas | 1:3000 | 2023 | Planning documents |
| Target Layer | Criterion Layer | Indicator Layer | Meaning | |
|---|---|---|---|---|
| Ecosystem health (A) | Driving Forces (B1) | Cd1 | Population density | The driving effect of population size on wetland ecosystem health, calculated as population per unit area (persons∙hm−2). |
| Cd2 | Elevation | The occurrence of severe surface subsidence and changes in surface landscape. | ||
| Cd3 | Annual average precipitation | Regional precipitation, reflected by annual precipitation. | ||
| Pressures (B2) | Cp1 | Regional development index | The degree of human land use and development pressure on wetlands, indicated by the proportion of urban and agricultural land within the total land area. | |
| Cp2 | Mining subsidence disturbance intensity | The pressure of mining subsidence on wetland space, calculated as the ratio of subsidence area to township area. | ||
| Cp3 | Road density | The pressure of transportation on wetland environments, calculated by the road network length (km)/area of the region (km2). | ||
| Cp4 | Industrial disturbance | Industrial and mining land use on the sustainable development of wetland space, indicated by the distance between mining land and wetlands. | ||
| State (B3) | Cs1 | Normalized Difference Vegetation Index (NDVI) | The vegetation cover status of the study area. | |
| Cs2 | Landscape Shape Index (LSI) | The complexity of patch shapes; higher values suggest greater landscape heterogeneity. | ||
| Cs3 | Aggregation Index (AI) | The connectivity between landscape patches; higher values indicate greater landscape connectivity. | ||
| Cs4 | Shannon Diversity Index (SHDI) | The diversity of wetland landscapes; higher values indicate greater landscape diversity. | ||
| Impact (B4) | Ci1 | Mining subsidence wetland rate | The proportion of the mining subsidence wetland area within the study region. | |
| Ci2 | Hydrological regulation Index | The flood storage and water supply functions of wetland ecosystems, calculated as the sum of pond and ditch areas divided by the total study area. | ||
| Responses (B5) | Cr1 | Wetland conservation rate | The level of wetland protection, determined by the ratio of conserved areas to the total study area. | |
| Cr2 | Patch Density (PD) | The degree of landscape fragmentation; higher values suggest lower wetland health. | ||
| Level | CHI Value | System Characteristics |
|---|---|---|
| Very healthy | 0.60–0.83 | The wetland ecosystem remains in a favorable natural condition, exhibiting strong vitality and a well-organized structure. External disturbances are minimal, resulting in a highly stable and sustainable system. |
| Healthy | 0.55–0.60 | The wetland maintains relatively good ecological integrity, with both its structural components and functional processes largely preserved. Its spatial pattern remains coherent, supporting a stable and enduring ecosystem. |
| Sub-healthy | 0.45–0.55 | The wetland ecosystem has been impacted, leading to noticeable structural alterations primarily due to human interference. The system has become highly sensitive to further disturbances. |
| Poor | 0.33–0.45 | There is evident degradation within the wetland ecosystem, with signs of deterioration and the partial loss of ecological functions. Efforts to protect and conserve the area are proving insufficient. |
| Very poor | 0.20–0.33 | The wetland ecosystem has suffered severe damage, resulting in a critically degraded structure. Extensive fragmentation of wetland patches presents major challenges for effective ecological restoration. |
| Criterion Layer | Weight | Indicator Layer | Combined Weight | Property |
|---|---|---|---|---|
| Driving Forces (B1) | 0.113 | Cd1 | 0.055 | Negative |
| Cd2 | 0.005 | Negative | ||
| Cd3 | 0.053 | Positive | ||
| Pressures (B2) | 0.410 | Cp1 | 0.094 | Negative |
| Cp2 | 0.278 | Negative | ||
| Cp3 | 0.014 | Negative | ||
| Cp4 | 0.024 | Negative | ||
| State (B3) | 0.286 | Cs1 | 0.045 | Positive |
| Cs2 | 0.035 | Positive | ||
| Cs3 | 0.110 | Positive | ||
| Cs4 | 0.096 | Positive | ||
| Impact (B4) | 0.105 | Ci1 | 0.034 | Positive |
| Ci2 | 0.071 | Positive | ||
| Responses (B5) | 0.086 | Cr1 | 0.072 | Positive |
| Cr2 | 0.014 | Negative |
Disclaimer/Publisher’s Note: The statements, opinions and data contained in all publications are solely those of the individual author(s) and contributor(s) and not of MDPI and/or the editor(s). MDPI and/or the editor(s) disclaim responsibility for any injury to people or property resulting from any ideas, methods, instructions or products referred to in the content. |
© 2025 by the authors. Licensee MDPI, Basel, Switzerland. This article is an open access article distributed under the terms and conditions of the Creative Commons Attribution (CC BY) license (https://creativecommons.org/licenses/by/4.0/).
Share and Cite
Li, C.; Chang, J.; Zhou, S.; Feng, S. Ecosystem Health Assessment of Coal Mining Subsidence Wetlands Using the DPSIR Model: A Case Study in Yingshang County, China. Land 2025, 14, 810. https://doi.org/10.3390/land14040810
Li C, Chang J, Zhou S, Feng S. Ecosystem Health Assessment of Coal Mining Subsidence Wetlands Using the DPSIR Model: A Case Study in Yingshang County, China. Land. 2025; 14(4):810. https://doi.org/10.3390/land14040810
Chicago/Turabian StyleLi, Cankun, Jiang Chang, Shiyuan Zhou, and Shanshan Feng. 2025. "Ecosystem Health Assessment of Coal Mining Subsidence Wetlands Using the DPSIR Model: A Case Study in Yingshang County, China" Land 14, no. 4: 810. https://doi.org/10.3390/land14040810
APA StyleLi, C., Chang, J., Zhou, S., & Feng, S. (2025). Ecosystem Health Assessment of Coal Mining Subsidence Wetlands Using the DPSIR Model: A Case Study in Yingshang County, China. Land, 14(4), 810. https://doi.org/10.3390/land14040810